Embed Size (px)
Citation preview
Prepared by
Institutional Research and Reporting
November, 2012
INTERNATIONAL STUDENT REPORT
FALL 2012

PART I
International Students Enrollment Summary, Fall 2012
PART II
International Students OU And The U.S., Fall 2011
PART III
International Students 10-Year And 20-Year Trends
PART IV
International Persons Credit Enrollment And CESL
Fall 2011 And 2012
Table of Contents

PART I
FALL 2012
ENROLLMENT SUMMARY
INTERNATIONAL STUDENTS

Non-College Fresh. Soph. Junior Senior Degree Master's Doctoral Prof. Total
Academic Affairs 0 1 2 1 0 0 0 0 4
Architecture 8 7 6 12 0 13 0 0 46
Arts & Sciences 13 28 26 42 0 55 170 0 320
Atmospheric & Geographic Sciences 2 3 1 3 0 7 19 0 34
Price Business 70 39 30 90 0 33 11 0 273
CCE\Aviation 1 0 0 1 0 0 0 0 2
Mewbourne Earth & Energy 31 23 32 63 0 85 38 0 269
Jeannine Rainbolt Education 1 2 2 2 0 19 11 0 36
Engineering 45 44 25 51 0 114 142 0 418
Weitzenhoffer Family Fine Arts 2 3 0 7 0 8 10 0 30
Graduate College 0 0 0 0 0 4 5 0 9
International Studies 1 0 4 6 0 2 0 0 13
Gaylord Journalism & Mass Communication 8 3 0 3 0 8 5 0 27
Law 0 0 0 0 0 7 0 3 10
University College-Undecided/Pre-Health 6 7 9 6 0 0 0 0 28
Non-Degree 0 0 0 0 201 0 0 0 201
Total International Students 185 152 127 273 201 354 411 3 1,680
Notes: 1) Students with double majors or in multiple degree programs are counted in each major and college.
2) Levels may not add to total because students who are undergraduate and graduate, masters and doctoral, or graduate and
professional are counted in each degree level.
Institutional Research and Reporting 10/12/12 IR\Students\Reports\International\Fall 2012\Intl Rpt Pt1 FA12
University of Oklahoma
Norman On-Campus Programs
Table 1
International Student Enrollment
By College
Fall Semester, 2012

Non-College Fresh. Soph. Junior Senior Degree Master's Doctoral Prof. Total
Academic Affairs
Czech Republic 0 0 1 0 0 0 0 0 1
Romania 0 0 1 0 0 0 0 0 1
Spain 0 1 0 0 0 0 0 0 1
Thailand 0 0 0 1 0 0 0 0 1
Total - Academic Affairs 0 1 2 1 0 0 0 0 4
Architecture
Brazil 0 0 1 0 0 0 0 0 1
Canada 0 0 0 1 0 0 0 0 1
China 3 5 1 5 0 9 0 0 23
Colombia 0 0 0 0 0 1 0 0 1
France 0 0 0 1 0 0 0 0 1
Hong Kong 0 0 0 1 0 0 0 0 1
India 0 0 0 0 0 1 0 0 1
Indonesia 0 0 0 1 0 0 0 0 1
Iran 0 0 0 0 0 1 0 0 1
Kuwait 2 0 0 0 0 0 0 0 2
Malaysia 0 0 1 0 0 0 0 0 1
Mexico 0 1 0 1 0 0 0 0 2
Moldova 0 0 0 1 0 0 0 0 1
Nigeria 1 1 0 0 0 0 0 0 2
Saudi Arabia 0 0 1 0 0 0 0 0 1
South Korea 1 0 1 1 0 1 0 0 4
Vietnam 0 0 1 0 0 0 0 0 1
Zambia 1 0 0 0 0 0 0 0 1
Total - Architecture 8 7 6 12 0 13 0 0 46
Arts & Sciences
Albania 0 0 0 1 0 0 0 0 1
Argentina 0 0 0 0 0 0 1 0 1
Australia 0 0 0 2 0 0 0 0 2
Bahamas, The 0 0 0 1 0 0 0 0 1
Bangladesh 0 0 0 1 0 1 2 0 3
Belize 0 0 0 1 0 0 0 0 1
Bolivia 0 0 0 1 0 0 0 0 1
Botswana 1 0 0 0 0 0 0 0 1
Brazil 0 1 0 0 0 1 0 0 2
Cameroon 0 1 1 2 0 0 1 0 5
Canada 2 1 3 2 0 3 0 0 11
China 3 6 4 6 0 20 86 0 119
Colombia 0 0 0 0 0 0 3 0 3
Cote D Ivoire 0 0 0 0 0 0 1 0 1
Croatia 0 0 0 0 0 0 1 0 1
Denmark 0 0 0 0 0 0 1 0 1
Ecuador 0 0 1 0 0 0 0 0 1
Egypt 0 0 0 0 0 0 1 0 1
El Salvador 0 0 0 1 0 0 0 0 1
Finland 0 0 0 0 0 0 1 0 1
University of Oklahoma
Norman On-Campus Programs
Table 2
International Student Enrollment
By Country, Student Classification and College
Fall Semester, 2012
Non-College Fresh. Soph. Junior Senior Degree Master's Doctoral Prof. Total
University of Oklahoma
Norman On-Campus Programs
Table 2
International Student Enrollment
By Country, Student Classification and College
Fall Semester, 2012
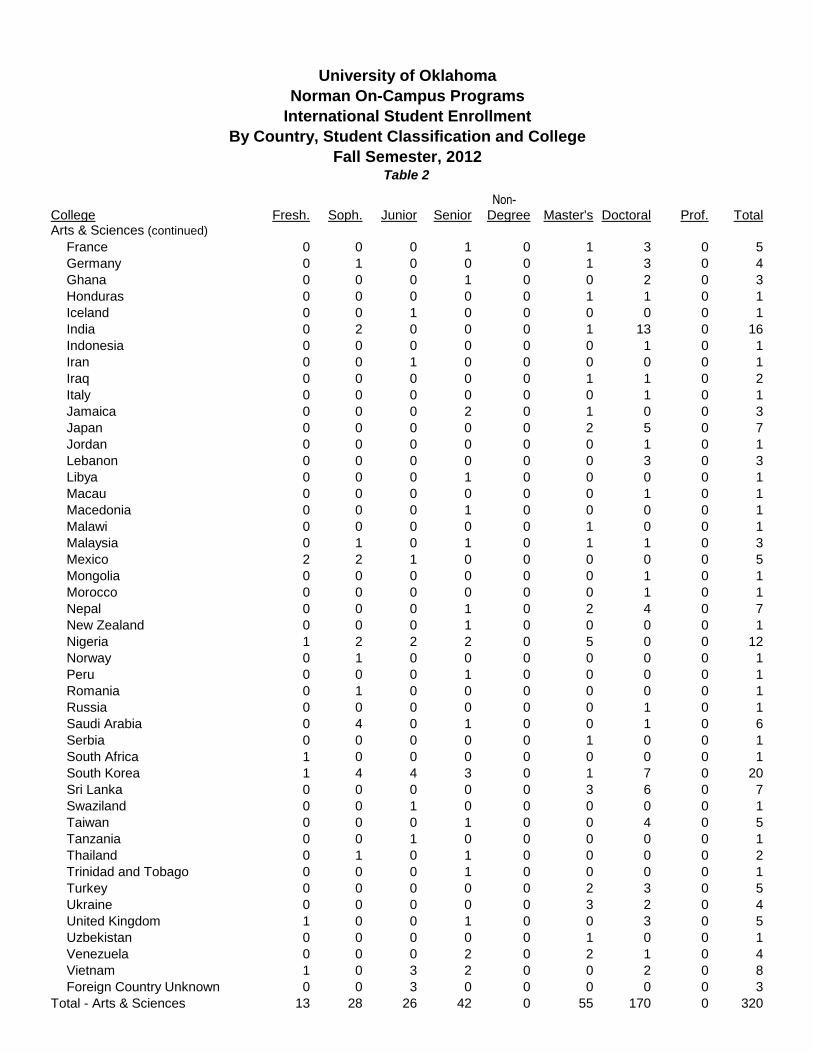
Arts & Sciences (continued)
France 0 0 0 1 0 1 3 0 5
Germany 0 1 0 0 0 1 3 0 4
Ghana 0 0 0 1 0 0 2 0 3
Honduras 0 0 0 0 0 1 1 0 1
Iceland 0 0 1 0 0 0 0 0 1
India 0 2 0 0 0 1 13 0 16
Indonesia 0 0 0 0 0 0 1 0 1
Iran 0 0 1 0 0 0 0 0 1
Iraq 0 0 0 0 0 1 1 0 2
Italy 0 0 0 0 0 0 1 0 1
Jamaica 0 0 0 2 0 1 0 0 3
Japan 0 0 0 0 0 2 5 0 7
Jordan 0 0 0 0 0 0 1 0 1
Lebanon 0 0 0 0 0 0 3 0 3
Libya 0 0 0 1 0 0 0 0 1
Macau 0 0 0 0 0 0 1 0 1
Macedonia 0 0 0 1 0 0 0 0 1
Malawi 0 0 0 0 0 1 0 0 1
Malaysia 0 1 0 1 0 1 1 0 3
Mexico 2 2 1 0 0 0 0 0 5
Mongolia 0 0 0 0 0 0 1 0 1
Morocco 0 0 0 0 0 0 1 0 1
Nepal 0 0 0 1 0 2 4 0 7
New Zealand 0 0 0 1 0 0 0 0 1
Nigeria 1 2 2 2 0 5 0 0 12
Norway 0 1 0 0 0 0 0 0 1
Peru 0 0 0 1 0 0 0 0 1
Romania 0 1 0 0 0 0 0 0 1
Russia 0 0 0 0 0 0 1 0 1
Saudi Arabia 0 4 0 1 0 0 1 0 6
Serbia 0 0 0 0 0 1 0 0 1
South Africa 1 0 0 0 0 0 0 0 1
South Korea 1 4 4 3 0 1 7 0 20
Sri Lanka 0 0 0 0 0 3 6 0 7
Swaziland 0 0 1 0 0 0 0 0 1
Taiwan 0 0 0 1 0 0 4 0 5
Tanzania 0 0 1 0 0 0 0 0 1
Thailand 0 1 0 1 0 0 0 0 2
Trinidad and Tobago 0 0 0 1 0 0 0 0 1
Turkey 0 0 0 0 0 2 3 0 5
Ukraine 0 0 0 0 0 3 2 0 4
United Kingdom 1 0 0 1 0 0 3 0 5
Uzbekistan 0 0 0 0 0 1 0 0 1
Venezuela 0 0 0 2 0 2 1 0 4
Vietnam 1 0 3 2 0 0 2 0 8
Foreign Country Unknown 0 0 3 0 0 0 0 0 3
Total - Arts & Sciences 13 28 26 42 0 55 170 0 320

Non-College Fresh. Soph. Junior Senior Degree Master's Doctoral Prof. Total
University of Oklahoma
Norman On-Campus Programs
Table 2
International Student Enrollment
By Country, Student Classification and College
Fall Semester, 2012
Atmospheric & Geographic Sciences
Bulgaria 0 0 0 0 0 1 0 0 1
Canada 0 0 0 0 0 1 0 0 1
China 0 0 0 0 0 0 6 0 6
Croatia 1 0 0 0 0 0 0 0 1
Germany 1 0 0 0 0 0 1 0 2
Ireland 0 0 0 1 0 0 0 0 1
Kuwait 0 0 0 0 0 1 1 0 1
Latvia 0 1 0 0 0 0 0 0 1
Morocco 0 1 0 0 0 0 0 0 1
Nepal 0 0 0 0 0 0 1 0 1
Niger 0 0 0 0 0 1 1 0 2
Nigeria 0 0 0 0 0 0 2 0 2
Norway 0 1 0 0 0 0 0 0 1
Philippines 0 0 0 0 0 0 1 0 1
Serbia 0 0 0 0 0 0 1 0 1
South Korea 0 0 1 2 0 1 0 0 4
Taiwan 0 0 0 0 0 0 2 0 2
United Kingdom 0 0 0 0 0 2 2 0 4
Vietnam 0 0 0 0 0 0 1 0 1
Total - A&GS 2 3 1 3 0 7 19 0 34
Price Business
Australia 1 0 0 0 0 0 0 0 1
Bangladesh 0 0 0 0 0 1 0 0 1
Belgium 0 0 0 1 0 0 0 0 1
Bolivia 0 0 0 3 0 2 0 0 5
Bosnia and Herzegovina 1 0 0 0 0 0 0 0 1
Brazil 0 1 0 0 0 0 0 0 1
Bulgaria 0 0 0 0 0 2 0 0 2
Burma 0 0 0 1 0 0 0 0 1
Canada 1 2 1 2 0 0 0 0 6
China 45 27 11 57 0 11 9 0 160
Gabon 0 0 0 2 0 0 0 0 2
Georgia 0 0 0 0 0 1 0 0 1
Germany 1 1 0 0 0 0 0 0 2
Ghana 0 0 1 1 0 0 0 0 2
Hong Kong 0 0 0 2 0 0 0 0 2
India 0 0 1 0 0 4 0 0 5
Indonesia 0 0 2 0 0 1 0 0 3
Jordan 0 0 1 0 0 0 0 0 1
Kazakhstan 0 0 0 0 0 1 0 0 1
Kenya 0 0 0 0 0 1 0 0 1
Lebanon 0 0 0 0 0 1 0 0 1
Lesotho 1 0 0 0 0 0 0 0 1
Malaysia 0 0 0 1 0 1 0 0 2
Mali 0 0 1 0 0 0 0 0 1
Mexico 2 1 0 1 0 1 0 0 5
Non-College Fresh. Soph. Junior Senior Degree Master's Doctoral Prof. Total
University of Oklahoma
Norman On-Campus Programs
Table 2
International Student Enrollment
By Country, Student Classification and College
Fall Semester, 2012
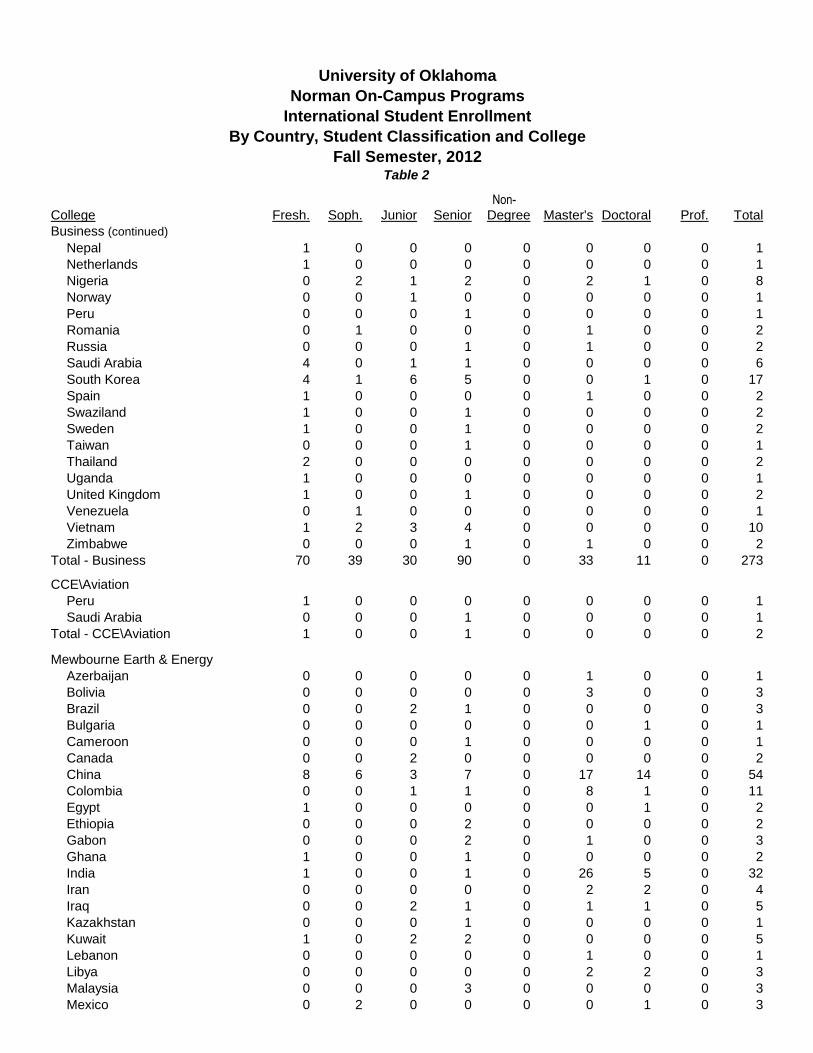
Business (continued)
Nepal 1 0 0 0 0 0 0 0 1
Netherlands 1 0 0 0 0 0 0 0 1
Nigeria 0 2 1 2 0 2 1 0 8
Norway 0 0 1 0 0 0 0 0 1
Peru 0 0 0 1 0 0 0 0 1
Romania 0 1 0 0 0 1 0 0 2
Russia 0 0 0 1 0 1 0 0 2
Saudi Arabia 4 0 1 1 0 0 0 0 6
South Korea 4 1 6 5 0 0 1 0 17
Spain 1 0 0 0 0 1 0 0 2
Swaziland 1 0 0 1 0 0 0 0 2
Sweden 1 0 0 1 0 0 0 0 2
Taiwan 0 0 0 1 0 0 0 0 1
Thailand 2 0 0 0 0 0 0 0 2
Uganda 1 0 0 0 0 0 0 0 1
United Kingdom 1 0 0 1 0 0 0 0 2
Venezuela 0 1 0 0 0 0 0 0 1
Vietnam 1 2 3 4 0 0 0 0 10
Zimbabwe 0 0 0 1 0 1 0 0 2
Total - Business 70 39 30 90 0 33 11 0 273
CCE\Aviation
Peru 1 0 0 0 0 0 0 0 1
Saudi Arabia 0 0 0 1 0 0 0 0 1
Total - CCE\Aviation 1 0 0 1 0 0 0 0 2
Mewbourne Earth & Energy
Azerbaijan 0 0 0 0 0 1 0 0 1
Bolivia 0 0 0 0 0 3 0 0 3
Brazil 0 0 2 1 0 0 0 0 3
Bulgaria 0 0 0 0 0 0 1 0 1
Cameroon 0 0 0 1 0 0 0 0 1
Canada 0 0 2 0 0 0 0 0 2
China 8 6 3 7 0 17 14 0 54
Colombia 0 0 1 1 0 8 1 0 11
Egypt 1 0 0 0 0 0 1 0 2
Ethiopia 0 0 0 2 0 0 0 0 2
Gabon 0 0 0 2 0 1 0 0 3
Ghana 1 0 0 1 0 0 0 0 2
India 1 0 0 1 0 26 5 0 32
Iran 0 0 0 0 0 2 2 0 4
Iraq 0 0 2 1 0 1 1 0 5
Kazakhstan 0 0 0 1 0 0 0 0 1
Kuwait 1 0 2 2 0 0 0 0 5
Lebanon 0 0 0 0 0 1 0 0 1
Libya 0 0 0 0 0 2 2 0 3
Malaysia 0 0 0 3 0 0 0 0 3
Mexico 0 2 0 0 0 0 1 0 3

Non-College Fresh. Soph. Junior Senior Degree Master's Doctoral Prof. Total
University of Oklahoma
Norman On-Campus Programs
Table 2
International Student Enrollment
By Country, Student Classification and College
Fall Semester, 2012
E&E (continued)
Morocco 0 0 0 0 0 1 0 0 1
Nepal 0 0 0 4 0 0 1 0 5
Niger 0 0 0 0 0 0 1 0 1
Nigeria 4 0 1 6 0 9 3 0 23
Pakistan 0 1 0 0 0 0 0 0 1
Peru 0 0 0 0 0 1 0 0 1
Saudi Arabia 10 10 13 17 0 1 0 0 51
South Korea 1 2 0 1 0 1 0 0 5
Spain 0 0 0 0 0 1 0 0 1
Sri Lanka 0 0 0 1 0 0 0 0 1
Swaziland 1 0 0 0 0 0 0 0 1
Turkey 1 0 0 0 0 4 0 0 5
Ukraine 1 0 0 0 0 0 0 0 1
Venezuela 0 0 0 1 0 4 4 0 9
Vietnam 1 2 6 10 0 1 1 0 21
Total - Earth & Energy 31 23 32 63 0 85 38 0 269
Jeannine Rainbolt Education
Azerbaijan 0 0 0 0 0 1 0 0 1
Bahamas, The 1 0 0 0 0 0 0 0 1
China 0 1 0 1 0 11 2 0 15
Colombia 0 0 0 0 0 1 0 0 1
France 0 0 0 0 0 0 1 0 1
Grenada 0 0 0 1 0 0 0 0 1
Indonesia 0 0 0 0 0 0 1 0 1
Iran 0 0 0 0 0 1 0 0 1
Japan 0 0 0 0 0 2 1 0 2
Malawi 0 0 0 0 0 0 1 0 1
Malaysia 0 1 0 0 0 0 1 0 2
Mexico 0 0 1 0 0 0 0 0 1
New Zealand 0 0 0 0 0 1 0 0 1
Qatar 0 0 0 0 0 0 1 0 1
South Korea 0 0 1 0 0 1 1 0 3
Taiwan 0 0 0 0 0 1 1 0 2
United Kingdom 0 0 0 0 0 0 1 0 1
Total - Education 1 2 2 2 0 19 11 0 36
Engineering
Angola 0 0 0 1 0 0 0 0 1
Argentina 0 0 0 0 0 0 1 0 1
Bangladesh 0 0 0 0 0 6 10 0 16
Bolivia 0 2 0 0 0 3 0 0 5
Bosnia and Herzegovina 3 2 0 0 0 0 0 0 5
Brazil 0 0 1 3 0 0 0 0 4
Cameroon 1 1 0 2 0 0 0 0 4
Canada 0 2 1 0 0 0 0 0 3
Chad 0 1 0 1 0 0 0 0 2
China 8 13 3 3 0 19 47 0 92
Non-College Fresh. Soph. Junior Senior Degree Master's Doctoral Prof. Total
University of Oklahoma
Norman On-Campus Programs
Table 2
International Student Enrollment
By Country, Student Classification and College
Fall Semester, 2012
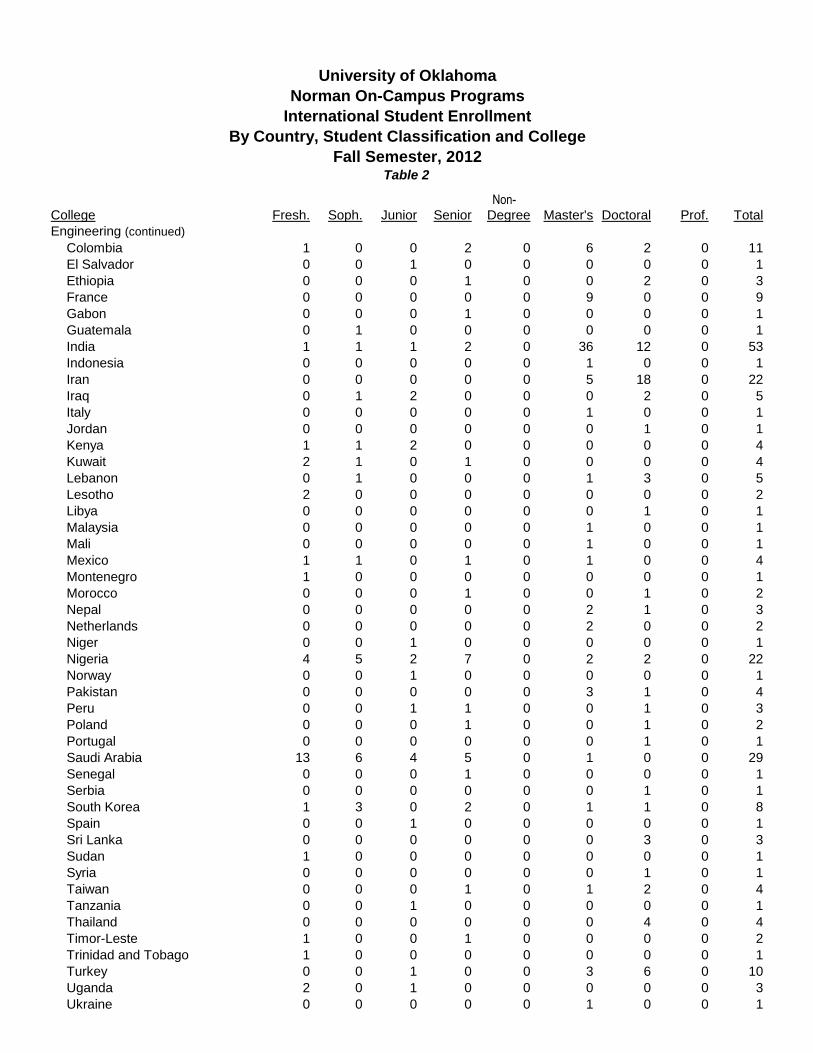
Engineering (continued)
Colombia 1 0 0 2 0 6 2 0 11
El Salvador 0 0 1 0 0 0 0 0 1
Ethiopia 0 0 0 1 0 0 2 0 3
France 0 0 0 0 0 9 0 0 9
Gabon 0 0 0 1 0 0 0 0 1
Guatemala 0 1 0 0 0 0 0 0 1
India 1 1 1 2 0 36 12 0 53
Indonesia 0 0 0 0 0 1 0 0 1
Iran 0 0 0 0 0 5 18 0 22
Iraq 0 1 2 0 0 0 2 0 5
Italy 0 0 0 0 0 1 0 0 1
Jordan 0 0 0 0 0 0 1 0 1
Kenya 1 1 2 0 0 0 0 0 4
Kuwait 2 1 0 1 0 0 0 0 4
Lebanon 0 1 0 0 0 1 3 0 5
Lesotho 2 0 0 0 0 0 0 0 2
Libya 0 0 0 0 0 0 1 0 1
Malaysia 0 0 0 0 0 1 0 0 1
Mali 0 0 0 0 0 1 0 0 1
Mexico 1 1 0 1 0 1 0 0 4
Montenegro 1 0 0 0 0 0 0 0 1
Morocco 0 0 0 1 0 0 1 0 2
Nepal 0 0 0 0 0 2 1 0 3
Netherlands 0 0 0 0 0 2 0 0 2
Niger 0 0 1 0 0 0 0 0 1
Nigeria 4 5 2 7 0 2 2 0 22
Norway 0 0 1 0 0 0 0 0 1
Pakistan 0 0 0 0 0 3 1 0 4
Peru 0 0 1 1 0 0 1 0 3
Poland 0 0 0 1 0 0 1 0 2
Portugal 0 0 0 0 0 0 1 0 1
Saudi Arabia 13 6 4 5 0 1 0 0 29
Senegal 0 0 0 1 0 0 0 0 1
Serbia 0 0 0 0 0 0 1 0 1
South Korea 1 3 0 2 0 1 1 0 8
Spain 0 0 1 0 0 0 0 0 1
Sri Lanka 0 0 0 0 0 0 3 0 3
Sudan 1 0 0 0 0 0 0 0 1
Syria 0 0 0 0 0 0 1 0 1
Taiwan 0 0 0 1 0 1 2 0 4
Tanzania 0 0 1 0 0 0 0 0 1
Thailand 0 0 0 0 0 0 4 0 4
Timor-Leste 1 0 0 1 0 0 0 0 2
Trinidad and Tobago 1 0 0 0 0 0 0 0 1
Turkey 0 0 1 0 0 3 6 0 10
Uganda 2 0 1 0 0 0 0 0 3
Ukraine 0 0 0 0 0 1 0 0 1

Non-College Fresh. Soph. Junior Senior Degree Master's Doctoral Prof. Total
University of Oklahoma
Norman On-Campus Programs
Table 2
International Student Enrollment
By Country, Student Classification and College
Fall Semester, 2012
Engineering (continued)
United Kingdom 0 1 0 0 0 0 0 0 1
Venezuela 0 0 0 2 0 3 3 0 8
Vietnam 0 1 1 8 0 5 14 0 28
West Bank 0 0 0 2 0 0 0 0 2
Zambia 0 0 0 1 0 0 0 0 1
Zimbabwe 1 0 0 0 0 0 0 0 1
Total - Engineering 45 44 25 51 0 114 142 0 418
Weitzenhoffer Family Fine Arts
Bahamas, The 0 1 0 0 0 0 0 0 1
Brazil 0 0 0 0 0 0 1 0 1
Bulgaria 0 0 0 0 0 0 1 0 1
Canada 1 0 0 0 0 0 0 0 1
China 1 0 0 3 0 3 0 0 7
France 0 0 0 0 0 0 1 0 1
Greece 0 0 0 0 0 1 0 0 1
India 0 0 0 1 0 0 0 0 1
Japan 0 0 0 0 0 1 1 0 2
Malaysia 0 0 0 0 0 1 0 0 1
Mexico 0 0 0 0 0 0 1 0 1
Russia 0 0 0 0 0 0 2 0 2
Sierra Leone 0 1 0 0 0 0 0 0 1
Singapore 0 0 0 0 0 1 0 0 1
South Korea 0 1 0 2 0 0 3 0 6
Taiwan 0 0 0 0 0 1 0 0 1
Trinidad and Tobago 0 0 0 1 0 0 0 0 1
Total - Fine Arts 2 3 0 7 0 8 10 0 30
Graduate College
China 0 0 0 0 0 4 4 0 8
South Korea 0 0 0 0 0 0 1 0 1
Total - Graduate College 0 0 0 0 0 4 5 0 9
International Studies
Brazil 0 0 1 0 0 0 0 0 1
Cambodia 0 0 0 1 0 0 0 0 1
China 0 0 0 1 0 0 0 0 1
Colombia 0 0 1 1 0 0 0 0 2
Croatia 1 0 0 0 0 0 0 0 1
France 0 0 0 1 0 1 0 0 2
Japan 0 0 0 0 0 1 0 0 1
Swaziland 0 0 1 0 0 0 0 0 1
Thailand 0 0 0 1 0 0 0 0 1
Trinidad and Tobago 0 0 1 0 0 0 0 0 1
Venezuela 0 0 0 1 0 0 0 0 1
Total - International Studies 1 0 4 6 0 2 0 0 13

Non-College Fresh. Soph. Junior Senior Degree Master's Doctoral Prof. Total
University of Oklahoma
Norman On-Campus Programs
Table 2
International Student Enrollment
By Country, Student Classification and College
Fall Semester, 2012
Gaylord Journalism & Mass Comm.
Afghanistan 0 0 0 0 0 1 0 0 1
Bangladesh 0 0 0 0 0 0 1 0 1
Canada 0 1 0 0 0 0 0 0 1
China 4 0 0 1 0 3 0 0 8
Jordan 0 0 0 0 0 0 1 0 1
Mexico 1 1 0 0 0 0 0 0 2
Nepal 0 0 0 0 0 1 0 0 1
New Zealand 0 0 0 1 0 0 0 0 1
Nigeria 1 0 0 0 0 1 0 0 2
Norway 0 0 0 1 0 0 0 0 1
Romania 0 0 0 0 0 1 0 0 1
Russia 0 0 0 0 0 0 1 0 1
South Korea 0 0 0 0 0 0 2 0 2
Swaziland 2 0 0 0 0 0 0 0 2
Venezuela 0 1 0 0 0 0 0 0 1
Vietnam 0 0 0 0 0 1 0 0 1
Total - Journalism & Mass Comm. 8 3 0 3 0 8 5 0 27
Law
Brazil 0 0 0 0 0 2 0 0 2
Canada 0 0 0 0 0 0 0 2 2
China 0 0 0 0 0 3 0 1 4
South Korea 0 0 0 0 0 1 0 0 1
Uganda 0 0 0 0 0 1 0 0 1
Total - Law 0 0 0 0 0 7 0 3 10
University College-Undecided/Pre-Health
Bangladesh 1 0 0 1 0 0 0 0 2
Cameroon 0 0 1 0 0 0 0 0 1
Canada 0 2 2 0 0 0 0 0 4
China 0 0 1 2 0 0 0 0 3
Colombia 0 0 1 0 0 0 0 0 1
India 0 1 0 0 0 0 0 0 1
Japan 0 0 0 1 0 0 0 0 1
Mexico 2 0 0 0 0 0 0 0 2
Nepal 0 0 1 1 0 0 0 0 2
Nigeria 0 1 0 0 0 0 0 0 1
Saudi Arabia 0 1 0 0 0 0 0 0 1
South Korea 3 2 2 0 0 0 0 0 7
Taiwan 0 0 0 1 0 0 0 0 1
Vietnam 0 0 1 0 0 0 0 0 1
Total - Univ. Coll.-Und./Pre-Health 6 7 9 6 0 0 0 0 28
Non-Degree Seeking
Reciprocal Exchange/Study Abroad
Australia 0 0 0 0 2 0 0 0 2
Austria 0 0 0 0 2 0 0 0 2
Belgium 0 0 0 0 1 0 0 0 1
Non-College Fresh. Soph. Junior Senior Degree Master's Doctoral Prof. Total
University of Oklahoma
Norman On-Campus Programs
Table 2
International Student Enrollment
By Country, Student Classification and College
Fall Semester, 2012
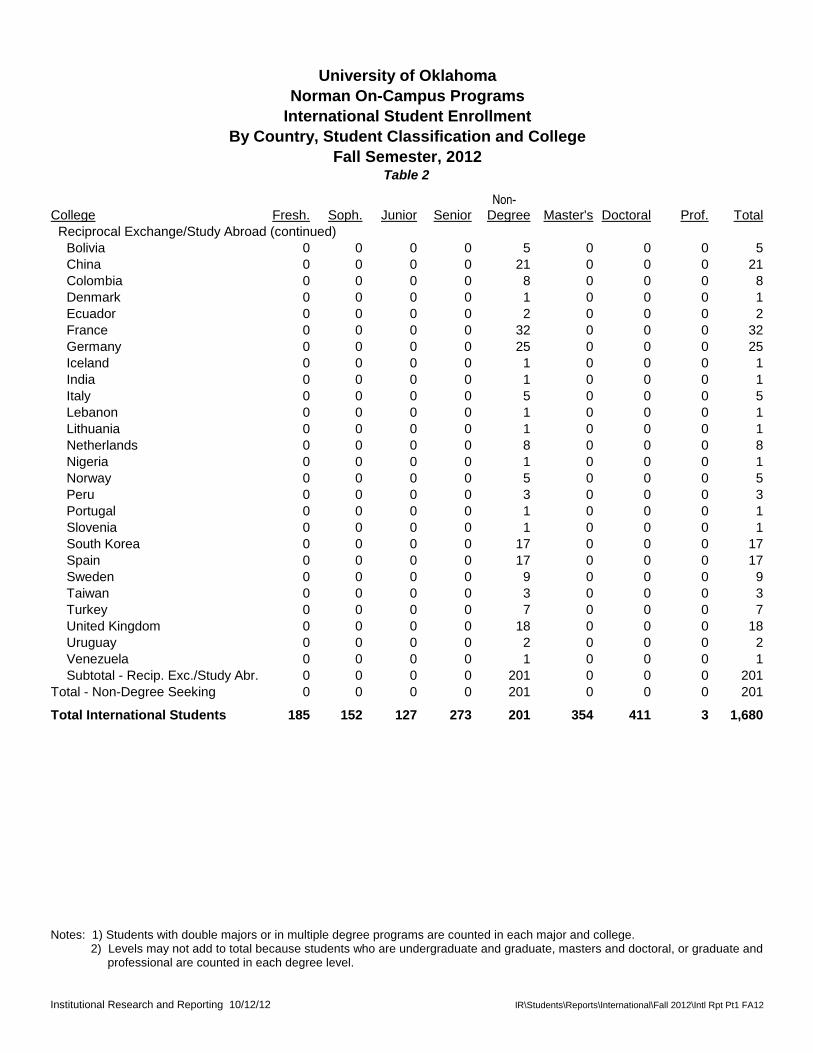
Reciprocal Exchange/Study Abroad (continued)
Bolivia 0 0 0 0 5 0 0 0 5
China 0 0 0 0 21 0 0 0 21
Colombia 0 0 0 0 8 0 0 0 8
Denmark 0 0 0 0 1 0 0 0 1
Ecuador 0 0 0 0 2 0 0 0 2
France 0 0 0 0 32 0 0 0 32
Germany 0 0 0 0 25 0 0 0 25
Iceland 0 0 0 0 1 0 0 0 1
India 0 0 0 0 1 0 0 0 1
Italy 0 0 0 0 5 0 0 0 5
Lebanon 0 0 0 0 1 0 0 0 1
Lithuania 0 0 0 0 1 0 0 0 1
Netherlands 0 0 0 0 8 0 0 0 8
Nigeria 0 0 0 0 1 0 0 0 1
Norway 0 0 0 0 5 0 0 0 5
Peru 0 0 0 0 3 0 0 0 3
Portugal 0 0 0 0 1 0 0 0 1
Slovenia 0 0 0 0 1 0 0 0 1
South Korea 0 0 0 0 17 0 0 0 17
Spain 0 0 0 0 17 0 0 0 17
Sweden 0 0 0 0 9 0 0 0 9
Taiwan 0 0 0 0 3 0 0 0 3
Turkey 0 0 0 0 7 0 0 0 7
United Kingdom 0 0 0 0 18 0 0 0 18
Uruguay 0 0 0 0 2 0 0 0 2
Venezuela 0 0 0 0 1 0 0 0 1
Subtotal - Recip. Exc./Study Abr. 0 0 0 0 201 0 0 0 201
Total - Non-Degree Seeking 0 0 0 0 201 0 0 0 201
Total International Students 185 152 127 273 201 354 411 3 1,680
Notes: 1) Students with double majors or in multiple degree programs are counted in each major and college. 2) Levels may not add to total because students who are undergraduate and graduate, masters and doctoral, or graduate and professional are counted in each degree level.
Institutional Research and Reporting 10/12/12 IR\Students\Reports\International\Fall 2012\Intl Rpt Pt1 FA12
Non-Region Fresh. Soph. Junior Senior Degree Master's Doctoral Prof. Total
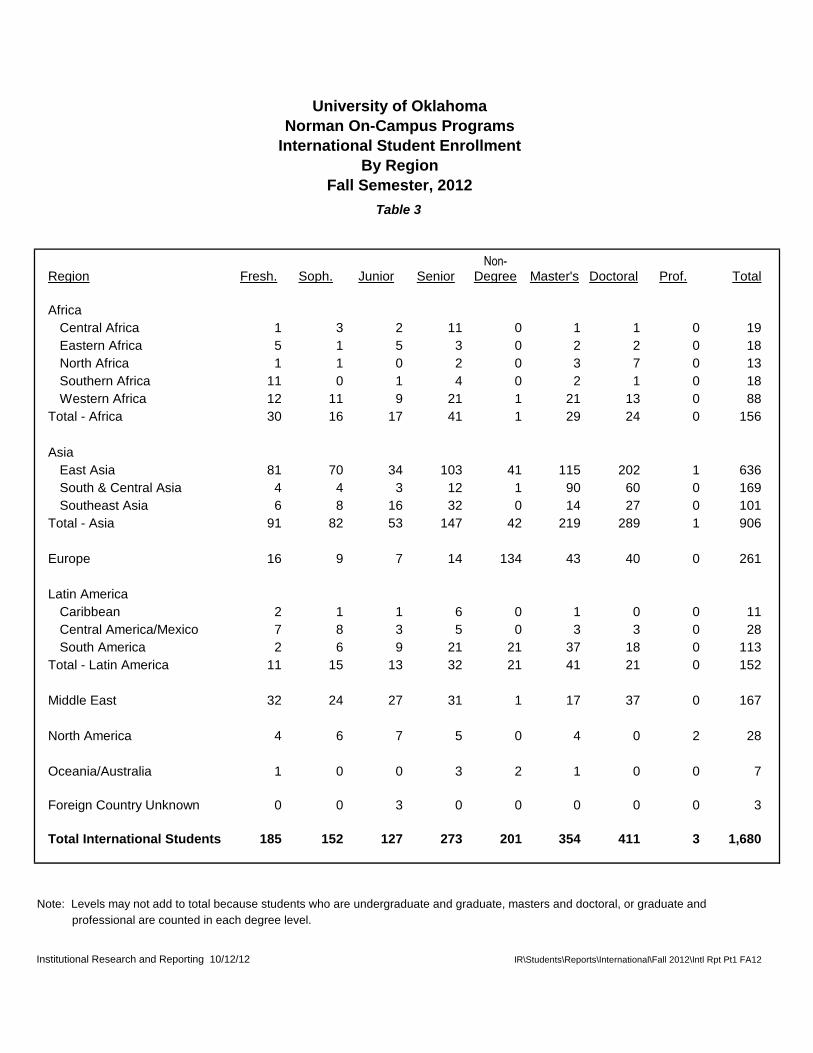
Africa
Central Africa 1 3 2 11 0 1 1 0 19
Eastern Africa 5 1 5 3 0 2 2 0 18
North Africa 1 1 0 2 0 3 7 0 13
Southern Africa 11 0 1 4 0 2 1 0 18
Western Africa 12 11 9 21 1 21 13 0 88
Total - Africa 30 16 17 41 1 29 24 0 156
Asia
East Asia 81 70 34 103 41 115 202 1 636
South & Central Asia 4 4 3 12 1 90 60 0 169
Southeast Asia 6 8 16 32 0 14 27 0 101
Total - Asia 91 82 53 147 42 219 289 1 906
Europe 16 9 7 14 134 43 40 0 261
Latin America
Caribbean 2 1 1 6 0 1 0 0 11
Central America/Mexico 7 8 3 5 0 3 3 0 28
South America 2 6 9 21 21 37 18 0 113
Total - Latin America 11 15 13 32 21 41 21 0 152
Middle East 32 24 27 31 1 17 37 0 167
North America 4 6 7 5 0 4 0 2 28
Oceania/Australia 1 0 0 3 2 1 0 0 7
Foreign Country Unknown 0 0 3 0 0 0 0 0 3
Total International Students 185 152 127 273 201 354 411 3 1,680
Note: Levels may not add to total because students who are undergraduate and graduate, masters and doctoral, or graduate and
professional are counted in each degree level.
Institutional Research and Reporting 10/12/12 IR\Students\Reports\International\Fall 2012\Intl Rpt Pt1 FA12
University of Oklahoma
Norman On-Campus Programs
Table 3
International Student Enrollment
By Region
Fall Semester, 2012

Non-Region Fresh. Soph. Junior Senior Degree Master's Doctoral Prof. Total
Central Africa
Cameroon 1 2 2 5 0 0 1 0 11
Chad 0 1 0 1 0 0 0 0 2
Gabon 0 0 0 5 0 1 0 0 6
Total - Central Africa 1 3 2 11 0 1 1 0 19
Eastern Africa
Ethiopia 0 0 0 3 0 0 2 0 5
Kenya 1 1 2 0 0 1 0 0 5
Sudan 1 0 0 0 0 0 0 0 1
Tanzania 0 0 2 0 0 0 0 0 2
Uganda 3 0 1 0 0 1 0 0 5
Total - Eastern Africa 5 1 5 3 0 2 2 0 18
North Africa
Egypt 1 0 0 0 0 0 2 0 3
Libya 0 0 0 1 0 2 3 0 5
Morocco 0 1 0 1 0 1 2 0 5
Total - North Africa 1 1 0 2 0 3 7 0 13
Southern Africa
Angola 0 0 0 1 0 0 0 0 1
Botswana 1 0 0 0 0 0 0 0 1
Lesotho 3 0 0 0 0 0 0 0 3
Malawi 0 0 0 0 0 1 1 0 1
South Africa 1 0 0 0 0 0 0 0 1
Swaziland 4 0 1 1 0 0 0 0 6
Zambia 1 0 0 1 0 0 0 0 2
Zimbabwe 1 0 0 1 0 1 0 0 3
Total - Southern Africa 11 0 1 4 0 2 1 0 18
Western Africa
Cote D Ivoire 0 0 0 0 0 0 1 0 1
Ghana 1 0 1 3 0 0 2 0 7
Mali 0 0 1 0 0 1 0 0 2
Niger 0 0 1 0 0 1 2 0 4
Nigeria 11 10 6 17 1 19 8 0 72
Senegal 0 0 0 1 0 0 0 0 1
Sierra Leone 0 1 0 0 0 0 0 0 1
Total - Western Africa 12 11 9 21 1 21 13 0 88
East Asia
China 70 57 22 82 21 99 168 1 510
Hong Kong 0 0 0 3 0 0 0 0 3
Japan 0 0 0 1 0 6 7 0 13
Macau 0 0 0 0 0 0 1 0 1
Mongolia 0 0 0 0 0 0 1 0 1
South Korea 11 13 12 14 17 7 16 0 90
Taiwan 0 0 0 3 3 3 9 0 18
Total - East Asia 81 70 34 103 41 115 202 1 636
University of Oklahoma
Norman On-Campus Programs
Table 4
International Student Enrollment
By Country, Student Classification and Region
Fall Semester, 2012

Non-Region Fresh. Soph. Junior Senior Degree Master's Doctoral Prof. Total
University of Oklahoma
Norman On-Campus Programs
Table 4
International Student Enrollment
By Country, Student Classification and Region
Fall Semester, 2012
South & Central Asia
Afghanistan 0 0 0 0 0 1 0 0 1
Bangladesh 1 0 0 1 0 8 13 0 22
India 2 3 2 4 1 68 30 0 109
Kazakhstan 0 0 0 1 0 1 0 0 2
Nepal 1 0 1 5 0 5 7 0 18
Pakistan 0 1 0 0 0 3 1 0 5
Sri Lanka 0 0 0 1 0 3 9 0 11
Uzbekistan 0 0 0 0 0 1 0 0 1
Total - South & Central Asia 4 4 3 12 1 90 60 0 169
Southeast Asia
Burma 0 0 0 1 0 0 0 0 1
Cambodia 0 0 0 1 0 0 0 0 1
Indonesia 0 0 2 1 0 2 2 0 7
Malaysia 0 2 1 5 0 4 2 0 13
Philippines 0 0 0 0 0 0 1 0 1
Singapore 0 0 0 0 0 1 0 0 1
Thailand 2 1 0 2 0 0 4 0 9
Timor-Leste 1 0 0 1 0 0 0 0 2
Vietnam 3 5 13 21 0 7 18 0 66
Total - Southeast Asia 6 8 16 32 0 14 27 0 101
Europe
Albania 0 0 0 1 0 0 0 0 1
Austria 0 0 0 0 2 0 0 0 2
Azerbaijan 0 0 0 0 0 2 0 0 2
Belgium 0 0 0 1 1 0 0 0 2
Bosnia And Herzegovina 4 2 0 0 0 0 0 0 6
Bulgaria 0 0 0 0 0 3 2 0 5
Czech Republic 0 0 1 0 0 0 0 0 1
Croatia 2 0 0 0 0 0 1 0 3
Denmark 0 0 0 0 1 0 1 0 2
Finland 0 0 0 0 0 0 1 0 1
France 0 0 0 3 32 11 5 0 51
Georgia 0 0 0 0 0 1 0 0 1
Germany 2 2 0 0 25 1 4 0 33
Greece 0 0 0 0 0 1 0 0 1
Iceland 0 0 1 0 1 0 0 0 2
Ireland 0 0 0 1 0 0 0 0 1
Italy 0 0 0 0 5 1 1 0 7
Latvia 0 1 0 0 0 0 0 0 1
Lithuania 0 0 0 0 1 0 0 0 1
Macedonia 0 0 0 1 0 0 0 0 1
Moldova 0 0 0 1 0 0 0 0 1
Montenegro 1 0 0 0 0 0 0 0 1
Netherlands 1 0 0 0 8 2 0 0 11
Norway 0 1 2 1 5 0 0 0 9
Poland 0 0 0 1 0 0 1 0 2

Non-Region Fresh. Soph. Junior Senior Degree Master's Doctoral Prof. Total
University of Oklahoma
Norman On-Campus Programs
Table 4
International Student Enrollment
By Country, Student Classification and Region
Fall Semester, 2012
Europe (continued)
Portugal 0 0 0 0 1 0 1 0 2
Romania 0 1 1 0 0 2 0 0 4
Russia 0 0 0 1 0 1 4 0 6
Serbia 0 0 0 0 0 1 2 0 3
Slovenia 0 0 0 0 1 0 0 0 1
Spain 1 1 1 0 17 2 0 0 22
Sweden 1 0 0 1 9 0 0 0 11
Turkey 1 0 1 0 7 9 9 0 27
Ukraine 1 0 0 0 0 4 2 0 6
United Kingdom 2 1 0 2 18 2 6 0 31
Total - Europe 16 9 7 14 134 43 40 0 261
Caribbean
Bahamas, The 1 1 0 1 0 0 0 0 3
Grenada 0 0 0 1 0 0 0 0 1
Jamaica 0 0 0 2 0 1 0 0 3
Trinidad and Tobago 1 0 1 2 0 0 0 0 4
Total - Caribbean 2 1 1 6 0 1 0 0 11
Central America/Mexico
Belize 0 0 0 1 0 0 0 0 1
El Salvador 0 0 1 1 0 0 0 0 2
Guatemala 0 1 0 0 0 0 0 0 1
Honduras 0 0 0 0 0 1 1 0 1
Mexico 7 7 2 3 0 2 2 0 23
Total - Central America/Mexico 7 8 3 5 0 3 3 0 28
South America
Argentina 0 0 0 0 0 0 2 0 2
Bolivia 0 2 0 4 5 8 0 0 19
Brazil 0 2 5 4 0 3 1 0 15
Colombia 1 0 2 4 8 16 6 0 37
Ecuador 0 0 1 0 2 0 0 0 3
Peru 1 0 1 3 3 1 1 0 10
Uruguay 0 0 0 0 2 0 0 0 2
Venezuela 0 2 0 6 1 9 8 0 25
Total - South America 2 6 9 21 21 37 18 0 113
Middle East
Iran 0 0 1 0 0 9 20 0 29
Iraq 0 1 4 1 0 2 4 0 12
Jordan 0 0 1 0 0 0 3 0 4
Kuwait 5 1 2 3 0 1 1 0 12
Lebanon 0 1 0 0 1 3 6 0 11
Qatar 0 0 0 0 0 0 1 0 1
Saudi Arabia 27 21 19 25 0 2 1 0 95
Syria 0 0 0 0 0 0 1 0 1
West Bank 0 0 0 2 0 0 0 0 2
Total - Middle East 32 24 27 31 1 17 37 0 167

Non-Region Fresh. Soph. Junior Senior Degree Master's Doctoral Prof. Total
University of Oklahoma
Norman On-Campus Programs
Table 4
International Student Enrollment
By Country, Student Classification and Region
Fall Semester, 2012
North America
Canada 4 6 7 5 0 4 0 2 28
Total - North America 4 6 7 5 0 4 0 2 28
Oceania/Australia
Australia 1 0 0 2 2 0 0 0 5
New Zealand 0 0 0 1 0 1 0 0 2
Total - Oceania/Australia 1 0 0 3 2 1 0 0 7
Foreign Country Unknown 0 0 3 0 0 0 0 0 3
Total International Students 185 152 127 273 201 354 411 3 1,680
Note: Levels may not add to total because students who are undergraduate and graduate, masters and doctoral, or graduate and
professional are counted in each degree level.
Institutional Research and Reporting 10/12/12 IR\Students\Reports\International\Fall 2012\Intl Rpt Pt1 FA12

Non-
Country Fresh. Soph. Junior Senior Degree Master's Doctoral Prof. TotalAfghanistan 0 0 0 0 0 1 0 0 1
Albania 0 0 0 1 0 0 0 0 1
Angola 0 0 0 1 0 0 0 0 1
Argentina 0 0 0 0 0 0 2 0 2
Australia 1 0 0 2 2 0 0 0 5
Austria 0 0 0 0 2 0 0 0 2
Azerbaijan 0 0 0 0 0 2 0 0 2
Bahamas, The 1 1 0 1 0 0 0 0 3
Bangladesh 1 0 0 1 0 8 13 0 22
Belgium 0 0 0 1 1 0 0 0 2
Belize 0 0 0 1 0 0 0 0 1
Bolivia 0 2 0 4 5 8 0 0 19
Bosnia and Herzegovina 4 2 0 0 0 0 0 0 6
Botswana 1 0 0 0 0 0 0 0 1
Brazil 0 2 5 4 0 3 1 0 15
Bulgaria 0 0 0 0 0 3 2 0 5
Burma 0 0 0 1 0 0 0 0 1
Cambodia 0 0 0 1 0 0 0 0 1
Cameroon 1 2 2 5 0 0 1 0 11
Canada 4 6 7 5 0 4 0 2 28
Chad 0 1 0 1 0 0 0 0 2
China 70 57 22 82 21 99 168 1 510
Colombia 1 0 2 4 8 16 6 0 37
Cote D Ivoire 0 0 0 0 0 0 1 0 1
Croatia 2 0 0 0 0 0 1 0 3
Czech Republic 0 0 1 0 0 0 0 0 1
Denmark 0 0 0 0 1 0 1 0 2
Ecuador 0 0 1 0 2 0 0 0 3
Egypt 1 0 0 0 0 0 2 0 3
El Salvador 0 0 1 1 0 0 0 0 2
Ethiopia 0 0 0 3 0 0 2 0 5
Finland 0 0 0 0 0 0 1 0 1
France 0 0 0 3 32 11 5 0 51
Gabon 0 0 0 5 0 1 0 0 6
Georgia 0 0 0 0 0 1 0 0 1
Germany 2 2 0 0 25 1 4 0 33
Ghana 1 0 1 3 0 0 2 0 7
Greece 0 0 0 0 0 1 0 0 1
Grenada 0 0 0 1 0 0 0 0 1
Guatemala 0 1 0 0 0 0 0 0 1
Honduras 0 0 0 0 0 1 1 0 1
Hong Kong 0 0 0 3 0 0 0 0 3
Iceland 0 0 1 0 1 0 0 0 2
India 2 3 2 4 1 68 30 0 109
Indonesia 0 0 2 1 0 2 2 0 7
Iran 0 0 1 0 0 9 20 0 29
Iraq 0 1 4 1 0 2 4 0 12
Ireland 0 0 0 1 0 0 0 0 1
Italy 0 0 0 0 5 1 1 0 7
Jamaica 0 0 0 2 0 1 0 0 3
Japan 0 0 0 1 0 6 7 0 13
Jordan 0 0 1 0 0 0 3 0 4
Kazakhstan 0 0 0 1 0 1 0 0 2
Kenya 1 1 2 0 0 1 0 0 5
Kuwait 5 1 2 3 0 1 1 0 12
Latvia 0 1 0 0 0 0 0 0 1
University of Oklahoma
Norman On-Campus Programs
Table 5
International Student Enrollment
By Country and Student Classification
Fall Semester, 2012
Non-
Country Fresh. Soph. Junior Senior Degree Master's Doctoral Prof. Total
University of Oklahoma
Norman On-Campus Programs
Table 5
International Student Enrollment
By Country and Student Classification
Fall Semester, 2012
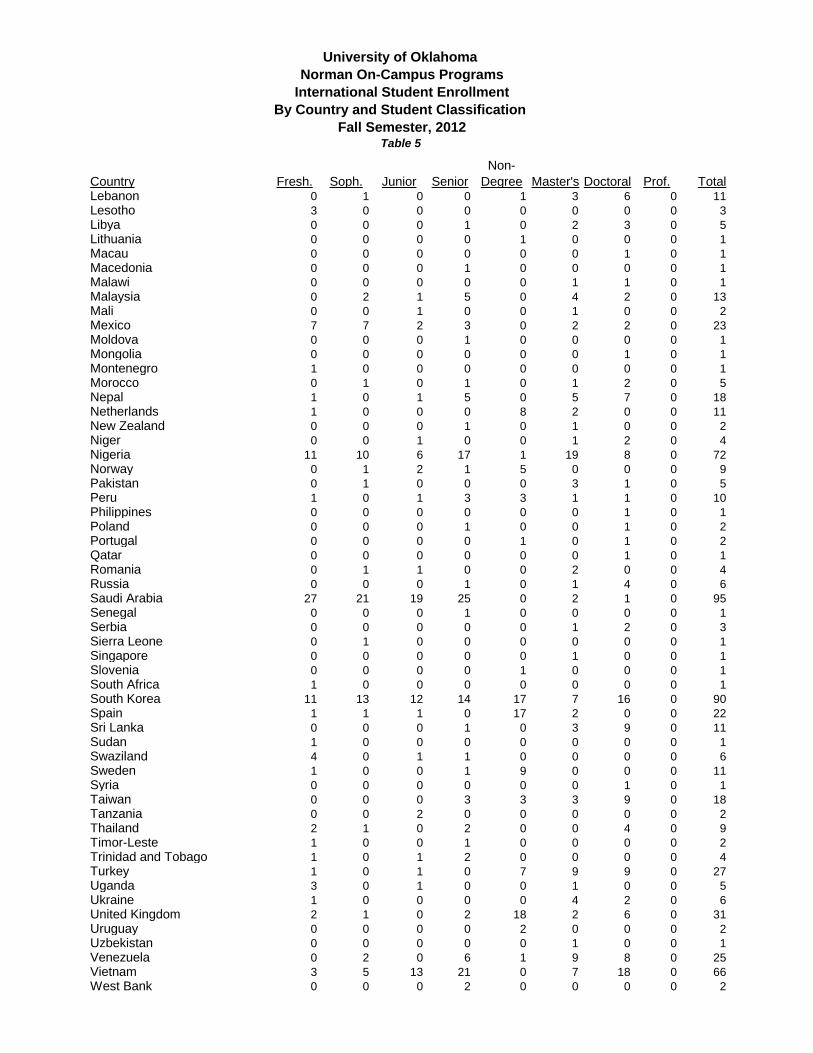
Lebanon 0 1 0 0 1 3 6 0 11
Lesotho 3 0 0 0 0 0 0 0 3
Libya 0 0 0 1 0 2 3 0 5
Lithuania 0 0 0 0 1 0 0 0 1
Macau 0 0 0 0 0 0 1 0 1
Macedonia 0 0 0 1 0 0 0 0 1
Malawi 0 0 0 0 0 1 1 0 1
Malaysia 0 2 1 5 0 4 2 0 13
Mali 0 0 1 0 0 1 0 0 2
Mexico 7 7 2 3 0 2 2 0 23
Moldova 0 0 0 1 0 0 0 0 1
Mongolia 0 0 0 0 0 0 1 0 1
Montenegro 1 0 0 0 0 0 0 0 1
Morocco 0 1 0 1 0 1 2 0 5
Nepal 1 0 1 5 0 5 7 0 18
Netherlands 1 0 0 0 8 2 0 0 11
New Zealand 0 0 0 1 0 1 0 0 2
Niger 0 0 1 0 0 1 2 0 4
Nigeria 11 10 6 17 1 19 8 0 72
Norway 0 1 2 1 5 0 0 0 9
Pakistan 0 1 0 0 0 3 1 0 5
Peru 1 0 1 3 3 1 1 0 10
Philippines 0 0 0 0 0 0 1 0 1
Poland 0 0 0 1 0 0 1 0 2
Portugal 0 0 0 0 1 0 1 0 2
Qatar 0 0 0 0 0 0 1 0 1
Romania 0 1 1 0 0 2 0 0 4
Russia 0 0 0 1 0 1 4 0 6
Saudi Arabia 27 21 19 25 0 2 1 0 95
Senegal 0 0 0 1 0 0 0 0 1
Serbia 0 0 0 0 0 1 2 0 3
Sierra Leone 0 1 0 0 0 0 0 0 1
Singapore 0 0 0 0 0 1 0 0 1
Slovenia 0 0 0 0 1 0 0 0 1
South Africa 1 0 0 0 0 0 0 0 1
South Korea 11 13 12 14 17 7 16 0 90
Spain 1 1 1 0 17 2 0 0 22
Sri Lanka 0 0 0 1 0 3 9 0 11
Sudan 1 0 0 0 0 0 0 0 1
Swaziland 4 0 1 1 0 0 0 0 6
Sweden 1 0 0 1 9 0 0 0 11
Syria 0 0 0 0 0 0 1 0 1
Taiwan 0 0 0 3 3 3 9 0 18
Tanzania 0 0 2 0 0 0 0 0 2
Thailand 2 1 0 2 0 0 4 0 9
Timor-Leste 1 0 0 1 0 0 0 0 2
Trinidad and Tobago 1 0 1 2 0 0 0 0 4
Turkey 1 0 1 0 7 9 9 0 27
Uganda 3 0 1 0 0 1 0 0 5
Ukraine 1 0 0 0 0 4 2 0 6
United Kingdom 2 1 0 2 18 2 6 0 31
Uruguay 0 0 0 0 2 0 0 0 2
Uzbekistan 0 0 0 0 0 1 0 0 1
Venezuela 0 2 0 6 1 9 8 0 25
Vietnam 3 5 13 21 0 7 18 0 66
West Bank 0 0 0 2 0 0 0 0 2

Non-
Country Fresh. Soph. Junior Senior Degree Master's Doctoral Prof. Total
University of Oklahoma
Norman On-Campus Programs
Table 5
International Student Enrollment
By Country and Student Classification
Fall Semester, 2012
Zambia 1 0 0 1 0 0 0 0 2
Zimbabwe 1 0 0 1 0 1 0 0 3
Foreign Country Unknown 0 0 3 0 0 0 0 0 3
Grand Total 185 152 127 273 201 354 411 3 1,680
Institutional Research and Reporting 10/12/12 IR\Students\Reports\International\Fall 2012\Intl Rpt Pt1 FA12

2008-12 Fall 12 as
College 2008 2009 2010 2011 2012 Average % of Avg.
Academic Affairs 2 2 10 12 4 6 67%
Architecture 10 12 14 16 33 17 194%
Arts & Sciences 74 73 95 93 109 89 123%
Atmospheric & Geographic Sciences 2 3 5 10 9 6 155%
Price Business 78 82 97 158 229 129 178%
CCE\Aviation 3 1 1 0 2 1 143%
Mewbourne Earth & Energy 98 120 134 146 149 129 115%
Jeannine Rainbolt Education 0 4 4 8 7 5 152%
Engineering 84 98 102 126 165 115 143%
Weitzenhoffer Family Fine Arts 7 6 7 10 12 8 143%
International Studies 8 6 9 13 11 9 117%
Gaylord Journalism & Mass Communication 8 6 5 9 14 8 167%
University College-Undecided/Pre-Health 10 12 22 35 28 21 131%
Degree-Seeking Undergraduate Totals 384 425 486 602 737 527 140%
Non-Degree Seeking 235 224 195 171 200 205 98%
2008-12 Fall 12 as
College 2008 2009 2010 2011 2012 Average % of Avg.
Architecture 25 28 16 18 13 20 65%
Arts & Sciences 245 247 253 237 211 239 88%
Atmospheric & Geographic Sciences 27 26 25 24 25 25 98%
Price Business 57 58 55 45 44 52 85%
Mewbourne Earth & Energy 107 126 153 128 120 127 95%
Jeannine Rainbolt Education 33 27 26 29 29 29 101%
Engineering 246 271 292 287 253 270 94%
Weitzenhoffer Family Fine Arts 24 25 21 27 18 23 78%
Graduate College 8 6 1 5 9 6 155%
International Studies 0 0 2 3 2 1 143%
Gaylord Journalism & Mass Communication 10 8 8 9 13 10 135%
Law 3 4 4 6 10 5 185%
Degree-Seeking Graduate/Prof. Totals 785 826 853 813 742 804 92%
Non-Degree Seeking 25 27 33 55 1 28 4%
Notes: 1) Beginning with Fall 2010 students with double majors or in multiple degree programs are counted in each major and college.
2) Starting in Fall 2012 all incoming exchange students are classified as undergraduates.
Institutional Research and Reporting 10/12/12 IR\Students\Reports\International\Fall 2012\Intl Rpt Pt1 FA12
Undergraduate
Graduate/Professional
University of Oklahoma
Norman On-Campus Programs
International Student Enrollment
By College and Level
Fall Semesters 2008 - 2012Table 6

INTERNATIONAL STUDENTS
PART II
OU AND THE U.S.
FALL 2010 AND 2011

Sourc
e:
Open D
oors
2011-1
2,
Institu
te o
f In
tern
atio
nal E
ducatio
n a
nd O
RD
enro
llment
file
s.
Institu
tio
nal R
esearc
h a
nd R
eport
ing
11/1
3/1
2IR
\Stu
dents
\Report
s\I
nte
rnatio
nal\F
all
12\I
ntl R
pt
Pt2
FA
12 B
y R
egio
n P
revF
all
Inte
rna
tio
na
l S
tud
en
t E
nro
llme
nt
by R
egio
n -
- O
U a
nd
th
e U
.S.
Fall
20
11
Afr
ica
5%
Asia
64%
Euro
pe
11%
Latin A
m.
8%
Mid
dle
E
ast
4%
Nort
h A
m.
4%
O
ceania
1%
U.S
.
Afr
ica
10%
Asia
53%
Euro
pe
16%
Latin A
m
9%
Mid
dle
E
ast
9%
Nort
h A
m
1%
O
ceania
0%
OU

--
----
----
----
----
----
----
----
United S
tate
s -
----
----
----
----
----
----
----
- -
----
----
----
----
----
----
----
----
- O
U -
----
----
----
----
----
----
----
----
----
-
Perc
ent C
hange
Perc
ent C
hange
Regio
nN
um
ber
% o
f In
t'lN
um
ber
% o
f In
t'l
2010-2
011
Num
ber
% o
f In
t'lN
um
ber
% o
f In
t'l2010-2
011
Afr
ica
Centr
al A
fric
a2,8
31
0.4
%2,7
78
0.4
%-1
.9%
19
1.0
%20
1.2
%5.3
%
Easte
rn A
fric
a8,8
63
1.2
%7,8
27
1.0
%-1
1.7
%16
0.9
%15
0.9
%-6
.3%
Nort
h A
fric
a5,4
20
0.7
%5,4
56
0.7
%0.7
%21
1.2
%19
1.2
%-9
.5%
South
ern
Afr
ica
5,3
30
0.7
%5,1
96
0.7
%-2
.5%
20
1.5
%14
0.9
%-3
0.0
%
Weste
rn A
fric
a14,4
46
2.0
%14,2
45
1.9
%-1
.4%
98
5.9
%93
5.7
%-5
.1%
Afr
ica, U
nspecifie
d0
0.0
%0
0.0
%-
00.0
%0
0.0
%-
Tota
l -
Afr
ica
36,8
90
5.1
%35,5
02
4.6
%-3
.8%
174
10.4
%161
9.8
%-7
.5%
Asia East A
sia
286,9
25
39.7
%319,5
15
41.8
%11.4
%414
26.1
%548
33.4
%32.4
%
South
& C
entr
al A
sia
128,8
45
17.8
%124,3
92
16.3
%-3
.5%
220
14.7
%211
12.9
%-4
.1%
South
east A
sia
46,0
20
6.4
%46,0
63
6.0
%0.1
%125
8.9
%118
7.2
%-5
.6%
Asia
, U
nspecifie
d0
0.0
%0
0.0
%-
00.0
%0
0.0
%-
Tota
l -
Asia
461,7
90
63.8
%489,9
70
64.1
%6.1
%759
49.7
%877
53.4
%15.5
%
Euro
pe
84,2
96
11.7
%85,4
23
11.2
%1.3
%272
17.8
%266
16.2
%-2
.2%
Latin A
merica
Caribbean
11,6
44
1.6
%10,9
87
1.4
%-5
.6%
11
0.9
%11
0.7
%0.0
%
Centr
al A
merica/M
exic
o20,3
61
2.8
%20,4
32
2.7
%0.3
%24
1.8
%29
1.8
%20.8
%
South
Am
erica
32,1
64
4.4
%32,6
02
4.3
%1.4
%157
10.2
%111
6.8
%-2
9.3
%
Latin A
merica, U
nspecifie
d0
0.0
%0
0.0
%-
00.0
%0
0.0
%-
Tota
l -
Latin A
merica
64,1
69
8.9
%64,0
21
8.4
%-0
.2%
192
12.8
%151
9.2
%-2
1.4
%
Mid
dle
East
42,5
43
5.9
%56,6
64
7.4
%33.2
%141
7.9
%153
9.3
%8.5
%
Nort
h A
merica
27,9
41
3.9
%27,2
10
3.6
%-2
.6%
17
0.7
%19
1.2
%11.8
%
Oceania
5,6
10
0.8
%5,6
97
0.7
%1.6
%6
0.3
%7
0.4
%16.7
%
Unknow
n/S
tate
less
10
0.0
%8
0.0
%-2
0.0
%6
0.4
%7
0.4
%16.7
%
Tota
l723,2
49
100.0
%764,4
95
100.0
%5.7
%1,5
67
100.0
%1,6
41
100.0
%4.7
%
* F
all
20
10
nu
mb
ers
ha
ve
ch
an
ge
d f
rom
th
e p
revio
us y
ea
r's r
ep
ort
du
e t
o c
ha
ng
es m
ad
e b
y O
pe
n D
oo
rs in
th
eir
No
ve
mb
er
20
12
re
lea
se
of
da
ta.
Sourc
e:
Open D
oors
2011-1
2,
Institu
te o
f In
tern
atio
nal E
ducatio
n a
nd O
RD
enro
llment
file
s.
Institu
tio
nal R
esearc
h a
nd R
eport
ing
11/1
3/1
2IR
\Stu
dents
\Report
s\I
nte
rnatio
nal\F
all
12\I
ntl R
pt
Pt2
FA
12 B
y R
egio
n P
revF
all
Univ
ers
ity o
f O
kla
hom
a, N
orm
an O
n-C
am
pus
Fall
20
10
an
d 2
01
1
Inte
rna
tio
na
l S
tud
en
t E
nro
llme
nt
by R
egio
n -
- O
U a
nd
th
e U
.S.
----
- F
all
2010*
----
---
---
Fall
2011 -
----
----
- F
all
2011 -
----
----
- F
all
2010*
----
-

Te
n L
ea
din
g C
ou
ntr
ies o
f O
rigin
--
OU
an
d t
he
U.S
.
Fall
20
11
Univ
ers
ity o
f O
kla
hom
a, N
orm
an C
am
pus
----
----
-United S
tate
s -
----
----
----
---
----
----
----
----
----
OU
---
----
----
----
----
--
Rank
Pla
ce o
f O
rigin
Count
Pla
ce o
f O
rigin
Count
1C
hin
a194,0
29
Chin
a411
2In
dia
100,2
70
India
138
3S
outh
Kore
a72,2
95
South
Kore
a91
4S
audi A
rabia
34,1
39
Saudi A
rabia
89
5C
anada
26,8
21
Nig
eria
73
6T
aiw
an
23,2
50
Fra
nce
70
7Japan
19,9
66
Vie
tnam
70
8V
ietn
am
15,5
72
Colo
mbia
39
9M
exic
o13,8
93
Venezuela
31
10
Turk
ey
11,9
73
Turk
ey
30
Sourc
e:
Open D
oors
, 2011-2
012,
Institu
te o
f In
tern
atio
nal E
ducatio
n a
nd F
all
2011 O
RD
enro
llment
file
.
Institu
tio
nal R
esearc
h a
nd R
eport
ing
11/1
3/1
2IR
\Stu
dents
\Report
s\I
nte
rnatio
nal\F
all
2012\I
ntl R
pt
Pt2
FA
12 T
op10 P
revF
all
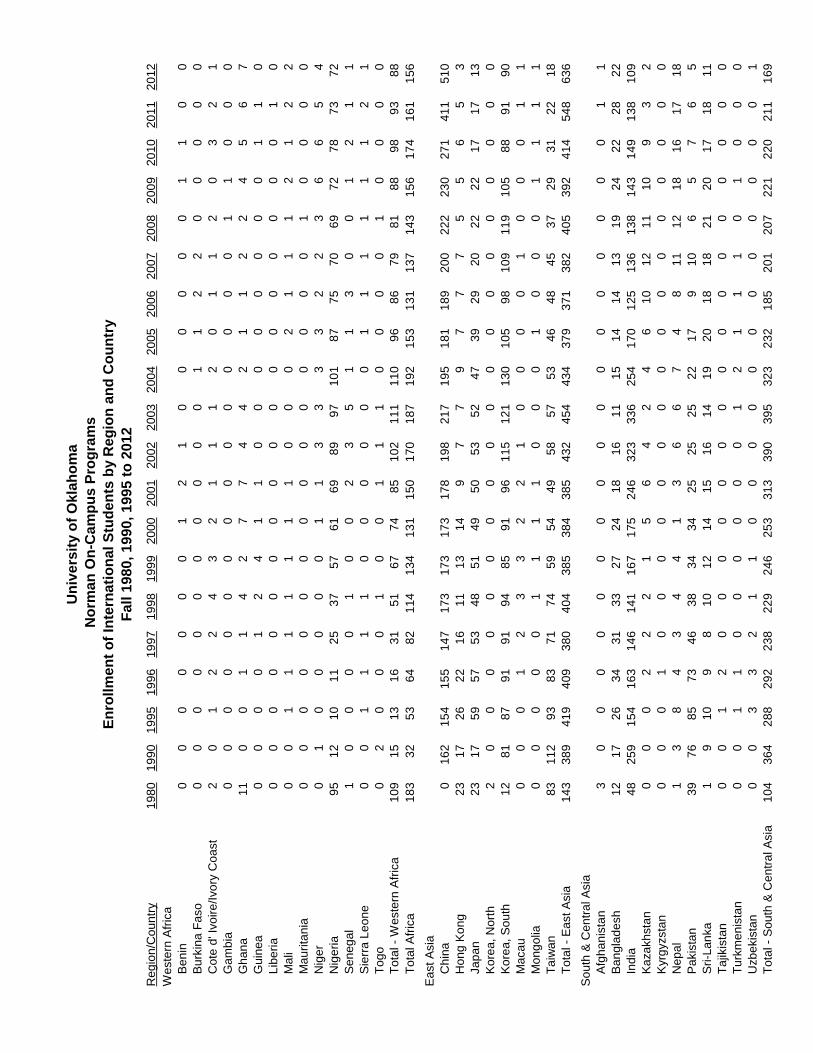
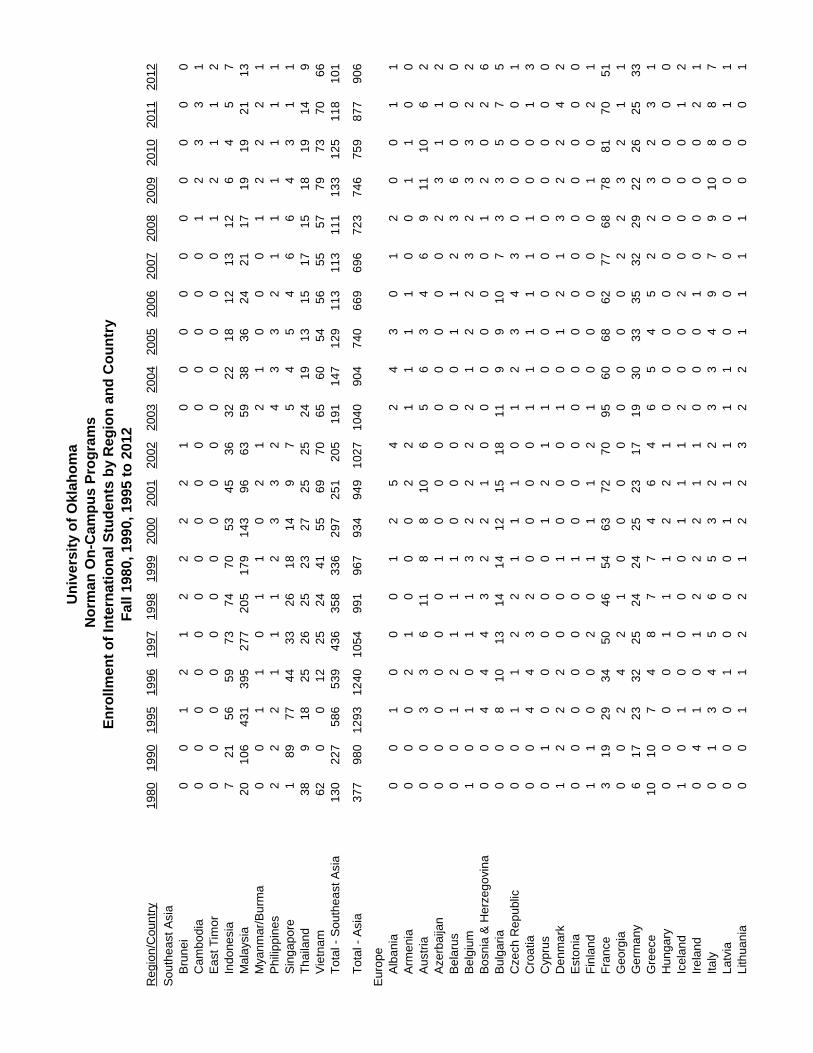
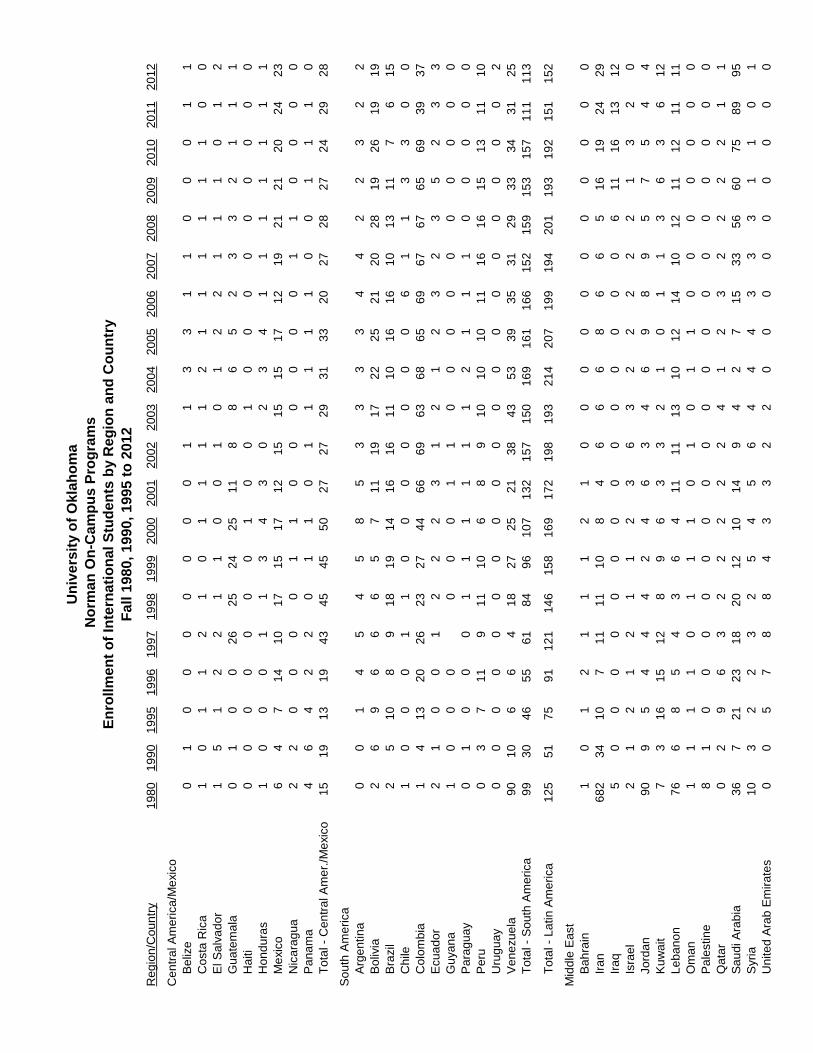
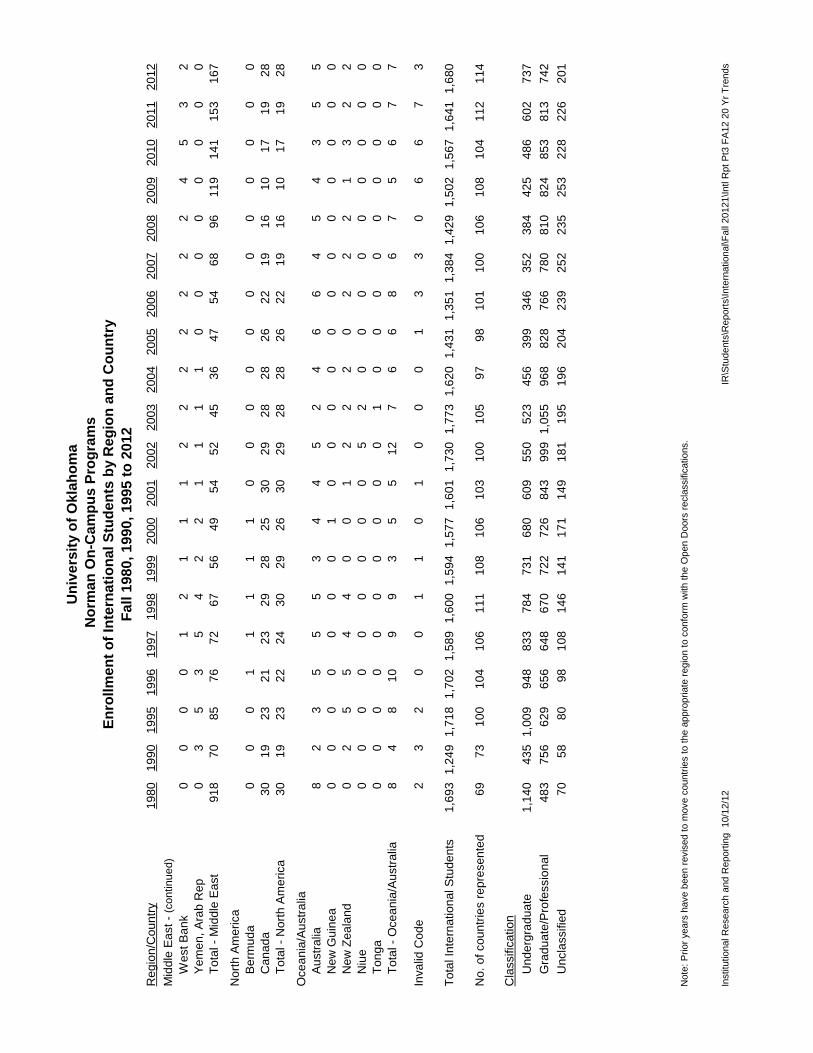
10-YEAR TRENDS
20-YEAR TRENDS
PART III
INTERNATIONAL STUDENTS

Un
ive
rsit
y o
f O
kla
ho
ma
No
rman
On
-Cam
pu
s P
rog
ram
s
En
rollm
en
t o
f In
tern
ati
on
al S
tud
en
ts b
y R
eg
ion
an
d C
ou
ntr
y
Fa
ll 1
980
, 1
99
0,
19
95
to
20
12
Reg
ion
/Co
un
try
19
80
19
90
19
95
19
96
19
97
19
98
19
99
20
00
20
01
20
02
20
03
20
04
20
05
20
06
20
07
20
08
20
09
20
10
20
11
20
12
Cen
tra
l A
fric
a
Cam
ero
on
11
47
91
71
81
11
31
01
11
81
31
01
11
17
10
14
11
Cen
tra
l A
fric
an
Re
p0
00
00
00
00
00
00
00
10
00
0
Cha
d0
00
10
00
00
00
01
12
24
21
2
Con
go
00
11
01
10
00
11
00
10
01
10
Con
go
, D
em
. R
ep
. o
f/(Z
air
e)
00
22
10
10
00
00
00
00
00
00
Ga
bo
n0
01
23
23
21
10
00
22
44
64
6
To
tal -
Cen
tra
l A
fric
a1
18
13
13
20
23
13
14
11
12
19
14
13
16
18
15
19
20
19
Ea
ste
rn A
fric
a
Bu
run
di
00
00
00
00
01
10
00
01
10
00
Eri
tre
a0
00
01
01
00
00
00
00
00
00
0
Eth
iop
ia7
22
33
22
22
34
54
10
24
44
5
Ke
nya
32
81
31
42
02
52
62
83
43
32
81
49
57
78
75
Rw
an
da
00
00
00
00
00
00
00
00
01
10
Se
ych
elle
s0
01
00
00
00
00
00
00
00
00
0
So
ma
lia0
10
00
00
00
00
00
00
00
00
0
Su
da
n2
03
33
21
11
00
00
00
00
00
1
Ta
nza
nia
20
22
43
33
20
00
00
00
13
32
Uga
nd
a0
13
23
42
21
00
00
00
00
00
5
To
tal -
Ea
ste
rn A
fric
a1
46
19
23
28
31
34
34
34
38
38
33
18
10
51
01
31
61
51
8
Nort
h A
fric
a
Alg
eri
a2
01
10
00
00
00
11
00
00
10
0
Eg
yp
t1
25
43
33
32
45
75
55
22
44
43
Lib
ya
44
00
00
00
00
00
00
01
29
10
95
Mo
rocco
03
22
43
27
10
11
11
12
99
14
84
55
5
Tu
nis
ia0
11
00
00
01
00
01
11
11
11
0
To
tal -
Nort
h A
fric
a5
89
86
76
59
15
16
18
18
16
15
18
13
18
21
19
13
So
uth
ern
Afr
ica
An
go
la0
00
00
00
00
00
21
11
41
41
41
37
1
Bo
tsw
an
a0
00
10
00
00
00
00
00
00
01
1
Le
so
tho
00
00
00
00
00
00
00
00
00
03
Ma
law
i0
00
00
00
00
00
00
00
22
22
1
Ma
uri
tiu
s0
00
00
00
00
00
00
00
01
00
0
Mo
za
mb
iqu
e0
00
00
00
00
00
11
00
00
00
0
So
uth
Afr
ica
00
55
35
41
21
25
21
11
11
01
Sw
azila
nd
00
00
00
00
00
00
00
00
01
26
Za
mb
ia0
10
00
01
00
23
13
33
33
21
2
Zim
ba
bw
e/(
Rh
od
esia
)1
00
00
10
00
03
32
21
11
11
3
To
tal -
So
uth
ern
Afr
ica
11
56
36
51
23
81
29
71
92
12
22
01
41
8
Un
ive
rsit
y o
f O
kla
ho
ma
No
rman
On
-Cam
pu
s P
rog
ram
s
En
rollm
en
t o
f In
tern
ati
on
al S
tud
en
ts b
y R
eg
ion
an
d C
ou
ntr
y
Fa
ll 1
980
, 1
99
0,
19
95
to
20
12
Reg
ion
/Co
un
try
19
80
19
90
19
95
19
96
19
97
19
98
19
99
20
00
20
01
20
02
20
03
20
04
20
05
20
06
20
07
20
08
20
09
20
10
20
11
20
12
We
ste
rn A
fric
a
Be
nin
00
00
00
01
21
00
00
00
11
00
Bu
rkin
a F
aso
00
00
00
00
00
01
12
20
00
00
Cote
d' I
vo
ire
/Ivo
ry C
oa
st
20
12
24
32
11
12
01
12
03
21
Ga
mb
ia0
00
00
00
00
00
00
00
11
00
0
Gh
an
a1
10
01
14
27
74
42
11
22
45
67
Gu
ine
a0
00
01
24
11
00
00
00
00
11
0
Lib
eri
a0
00
00
00
00
00
00
00
00
01
0
Ma
li0
01
11
11
11
00
02
11
12
12
2
Ma
uri
tan
ia0
00
00
00
00
00
00
00
10
00
0
Nig
er
01
00
00
01
13
33
32
23
66
54
Nig
eri
a9
51
21
01
12
53
75
76
16
98
99
71
01
87
75
70
69
72
78
73
72
Se
ne
ga
l1
00
00
10
02
35
11
30
01
21
1
Sie
rra
Le
on
e0
01
11
10
00
00
01
11
11
12
1
To
go
02
00
01
00
11
10
00
01
00
00
To
tal -
We
ste
rn A
fric
a1
09
15
13
16
31
51
67
74
85
10
21
11
11
09
68
67
98
18
89
89
38
8
To
tal A
fric
a1
83
32
53
64
82
11
41
34
13
11
50
17
01
87
19
21
53
13
11
37
14
31
56
17
41
61
15
6
Ea
st
Asia
Chin
a0
16
21
54
15
51
47
17
31
73
17
31
78
19
82
17
19
51
81
18
92
00
22
22
30
27
14
11
51
0
Hon
g K
on
g2
31
72
62
21
61
11
31
49
77
97
77
55
65
3
Ja
pa
n2
31
75
95
75
34
85
14
95
05
35
24
73
92
92
02
22
21
71
71
3
Ko
rea
, N
ort
h2
00
00
00
00
00
00
00
00
00
0
Ko
rea
, S
ou
th1
28
18
79
19
19
48
59
19
61
15
12
11
30
10
59
81
09
11
91
05
88
91
90
Ma
ca
u0
00
12
33
22
10
00
01
00
01
1
Mo
ng
olia
00
00
01
11
10
00
10
00
11
11
Ta
iwa
n8
31
12
93
83
71
74
59
54
49
58
57
53
46
48
45
37
29
31
22
18
To
tal -
Ea
st
Asia
14
33
89
41
94
09
38
04
04
38
53
84
38
54
32
45
44
34
37
93
71
38
24
05
39
24
14
54
86
36
So
uth
& C
en
tra
l A
sia
Afg
ha
nis
tan
30
00
00
00
00
00
00
00
00
11
Ba
ng
lad
esh
12
17
26
34
31
33
27
24
18
16
11
15
14
14
13
19
24
22
28
22
Ind
ia4
82
59
15
41
63
14
61
41
16
71
75
24
63
23
33
62
54
17
01
25
13
61
38
14
31
49
13
81
09
Ka
za
kh
sta
n0
00
22
21
56
42
46
10
12
11
10
93
2
Kyrg
yzsta
n0
00
10
00
00
00
00
00
00
00
0
Nep
al
13
84
34
41
36
67
48
11
12
18
16
17
18
Pa
kis
tan
39
76
85
73
46
38
34
34
25
25
25
22
17
91
06
57
65
Sri
-La
nka
19
10
98
10
12
14
15
16
14
19
20
18
18
21
20
17
18
11
Ta
jikis
tan
00
12
00
00
00
00
00
00
00
00
Tu
rkm
en
ista
n0
01
10
00
00
01
21
11
01
00
0
Uzb
ekis
tan
00
33
21
10
00
00
00
00
00
01
To
tal -
So
uth
& C
en
tra
l A
sia
10
43
64
28
82
92
23
82
29
24
62
53
31
33
90
39
53
23
23
21
85
20
12
07
22
12
20
21
11
69
Un
ive
rsit
y o
f O
kla
ho
ma
No
rman
On
-Cam
pu
s P
rog
ram
s
En
rollm
en
t o
f In
tern
ati
on
al S
tud
en
ts b
y R
eg
ion
an
d C
ou
ntr
y
Fa
ll 1
980
, 1
99
0,
19
95
to
20
12
Reg
ion
/Co
un
try
19
80
19
90
19
95
19
96
19
97
19
98
19
99
20
00
20
01
20
02
20
03
20
04
20
05
20
06
20
07
20
08
20
09
20
10
20
11
20
12
So
uth
ea
st
Asia
Bru
ne
i0
01
21
22
22
10
00
00
00
00
0
Cam
bo
dia
00
00
00
00
00
00
00
01
23
31
Ea
st
Tim
or
00
00
00
00
00
00
00
01
21
12
Ind
on
esia
72
15
65
97
37
47
05
34
53
63
22
21
81
21
31
26
45
7
Ma
laysia
20
10
64
31
39
52
77
20
51
79
14
39
66
35
93
83
62
42
11
71
91
92
11
3
Mya
nm
ar/
Bu
rma
00
11
01
10
21
21
00
01
22
21
Ph
ilip
pin
es
22
21
11
23
32
43
32
11
11
11
Sin
ga
po
re1
89
77
44
33
26
18
14
97
54
54
66
43
11
Th
aila
nd
38
91
82
52
62
52
32
72
52
52
41
91
31
51
71
51
81
91
49
Vie
tna
m6
20
01
22
52
44
15
56
97
06
56
05
45
65
55
77
97
37
06
6
To
tal -
So
uth
ea
st
Asia
13
02
27
58
65
39
43
63
58
33
62
97
25
12
05
19
11
47
12
91
13
11
31
11
13
31
25
11
81
01
To
tal -
Asia
37
79
80
12
93
12
40
10
54
99
19
67
93
49
49
10
27
10
40
90
47
40
66
96
96
72
37
46
75
98
77
90
6
Eu
rop
e
Alb
an
ia0
01
00
01
25
42
43
01
20
01
1
Arm
en
ia0
00
21
00
02
21
11
10
01
10
0
Au
str
ia0
03
36
11
88
10
65
63
46
91
11
06
2
Aze
rba
ijan
00
00
00
10
00
00
00
02
31
12
Be
laru
s0
01
21
11
00
00
01
12
36
00
0
Be
lgiu
m1
01
01
13
22
22
12
23
23
32
2
Bo
sn
ia &
Herz
eg
ovin
a0
04
44
32
21
00
00
00
12
02
6
Bu
lga
ria
00
81
01
31
41
41
21
51
81
19
91
07
33
57
5
Cze
ch
Re
pu
blic
00
11
22
11
10
12
34
30
00
01
Cro
atia
00
44
32
00
00
11
11
11
00
13
Cyp
rus
01
00
00
01
21
10
00
00
00
00
Den
ma
rk1
22
20
01
00
01
01
21
32
24
2
Esto
nia
00
00
00
10
00
00
00
00
00
00
Fin
lan
d1
10
02
01
11
21
00
00
01
02
1
Fra
nce
31
92
93
45
04
65
46
37
27
09
56
06
86
27
76
87
88
17
05
1
Ge
org
ia0
02
42
10
00
00
00
02
23
21
1
Ge
rma
ny
61
72
33
22
52
42
42
52
31
71
93
03
33
53
22
92
22
62
53
3
Gre
ece
10
10
74
87
74
64
65
45
22
32
31
Hun
ga
ry0
00
01
11
22
10
00
00
00
00
0
Ice
lan
d1
01
00
00
11
12
00
20
00
01
2
Ire
lan
d0
41
01
22
21
10
00
10
00
02
1
Ita
ly0
13
45
65
32
23
34
97
91
08
87
La
tvia
00
01
00
01
11
11
00
00
00
11
Lith
ua
nia
00
11
22
12
23
22
11
11
00
01

Un
ive
rsit
y o
f O
kla
ho
ma
No
rman
On
-Cam
pu
s P
rog
ram
s
En
rollm
en
t o
f In
tern
ati
on
al S
tud
en
ts b
y R
eg
ion
an
d C
ou
ntr
y
Fa
ll 1
980
, 1
99
0,
19
95
to
20
12
Reg
ion
/Co
un
try
19
80
19
90
19
95
19
96
19
97
19
98
19
99
20
00
20
01
20
02
20
03
20
04
20
05
20
06
20
07
20
08
20
09
20
10
20
11
20
12
Eu
rop
e (
con
tinu
ed
)
Lu
xe
mb
ou
rg1
00
00
00
00
00
00
10
00
00
0
Ma
ce
do
nia
00
00
01
21
23
32
00
00
11
21
Ma
lta
00
00
00
00
00
00
00
00
10
00
Mo
ldo
va
00
02
11
11
00
00
00
00
01
11
Mo
na
co
00
11
11
11
00
00
00
00
00
00
Mo
nte
ne
gro
00
00
00
00
00
00
00
00
00
11
Neth
erl
an
ds
01
44
53
02
21
31
85
71
15
95
11
Norw
ay
53
54
54
22
21
44
35
01
67
79
Po
lan
d0
13
12
12
44
11
01
21
23
23
2
Po
rtu
ga
l0
33
33
22
30
01
02
11
22
21
2
Rom
an
ia2
02
66
79
79
88
87
56
78
10
74
Russia
00
11
11
99
91
11
21
31
31
21
01
71
39
81
11
16
Se
rbia
00
66
81
01
09
55
42
02
33
33
23
Slo
va
kia
00
00
23
22
22
10
22
11
10
00
Slo
ve
nia
00
00
11
11
00
10
00
00
00
01
Sp
ain
15
11
11
10
26
22
29
16
19
21
27
14
11
13
15
13
12
16
22
Sw
ed
en
07
15
13
21
16
15
20
13
14
99
81
15
58
11
81
1
Sw
itze
rla
nd
10
11
12
00
11
21
11
11
00
10
Tu
rke
y6
19
11
89
81
21
09
91
41
92
22
42
02
53
13
02
7
Ukra
ine
00
46
77
84
37
91
08
55
44
77
6
Unite
d K
ing
do
m1
19
12
11
10
16
24
22
10
23
29
23
33
35
36
25
31
24
27
31
Va
tica
n C
ity
00
00
00
00
00
10
00
00
00
00
Yu
go
sla
via
05
00
00
00
00
02
10
00
00
00
To
tal -
Eu
rop
e5
09
01
79
19
92
27
24
22
46
26
32
40
24
22
73
24
02
51
26
52
61
24
32
67
27
22
66
26
1
Cari
bb
ea
n
An
gu
illa
00
00
00
00
00
00
00
20
00
00
Ba
ha
ma
s,
Th
e0
16
54
43
43
31
12
12
21
12
3
Caym
an
Isla
nd
00
11
11
00
00
00
00
00
00
00
Cub
a1
01
11
10
00
01
00
00
00
00
0
Dom
inic
a
00
00
00
00
01
10
11
11
00
00
Dom
inic
an
Re
pu
blic
10
00
00
00
00
00
00
00
00
00
Gre
na
da
00
00
01
10
00
00
00
00
11
11
Ja
ma
ica
20
71
01
11
01
38
10
10
97
78
77
75
43
Neth
erl
an
ds A
ntilil
es
00
00
00
00
00
04
00
00
10
00
St.
Lu
cia
00
00
00
00
00
21
11
21
00
00
Tri
nid
ad
an
d T
ob
ag
o7
11
00
00
00
00
12
21
33
44
4
To
tal -
Cari
bb
ea
n1
12
16
17
17
17
17
12
13
14
14
14
13
13
15
14
13
11
11
11
Un
ive
rsit
y o
f O
kla
ho
ma
No
rman
On
-Cam
pu
s P
rog
ram
s
En
rollm
en
t o
f In
tern
ati
on
al S
tud
en
ts b
y R
eg
ion
an
d C
ou
ntr
y
Fa
ll 1
980
, 1
99
0,
19
95
to
20
12
Reg
ion
/Co
un
try
19
80
19
90
19
95
19
96
19
97
19
98
19
99
20
00
20
01
20
02
20
03
20
04
20
05
20
06
20
07
20
08
20
09
20
10
20
11
20
12
Cen
tra
l A
me
rica
/Me
xic
o
Be
lize
01
00
00
00
01
13
31
10
00
11
Costa
Ric
a1
01
12
10
11
11
21
11
11
10
0
El S
alv
ad
or
15
12
21
10
01
01
22
11
10
12
Gu
ate
ma
la0
10
02
62
52
42
51
18
86
52
33
21
11
Haiti
00
00
00
01
00
10
00
00
00
00
Hon
du
ras
10
00
11
34
30
23
41
11
11
11
Me
xic
o6
47
14
10
17
15
17
12
15
15
15
17
12
19
21
21
20
24
23
Nic
ara
gu
a2
20
00
01
10
00
00
01
10
00
0
Pa
na
ma
46
42
20
11
01
11
11
00
11
10
To
tal -
Cen
tra
l A
me
r./M
exic
o1
51
91
31
94
34
54
55
02
72
72
93
13
32
02
72
82
72
42
92
8
So
uth
Am
eri
ca
Arg
en
tin
a0
01
45
45
85
33
33
44
22
32
2
Bo
livia
26
96
66
57
11
19
17
22
25
21
20
28
19
26
19
19
Bra
zil
25
10
89
18
19
14
16
16
11
10
16
16
10
13
11
76
15
Chile
10
00
11
00
00
00
06
11
33
00
Colo
mb
ia1
41
32
02
62
32
74
46
66
96
36
86
56
96
76
76
56
93
93
7
Ecu
ad
or
21
00
12
22
31
21
23
23
52
33
Gu
ya
na
10
00
00
01
10
00
00
00
00
0
Pa
rag
ua
y0
10
00
11
11
11
21
11
00
00
0
Pe
ru0
37
11
91
11
06
89
10
10
10
11
16
16
15
13
11
10
Uru
gu
ay
00
00
00
00
00
00
00
00
00
02
Ve
ne
zu
ela
90
10
66
41
82
72
52
13
84
35
33
93
53
12
93
33
43
12
5
To
tal -
So
uth
Am
eri
ca
99
30
46
55
61
84
96
10
71
32
15
71
50
16
91
61
16
61
52
15
91
53
15
71
11
11
3
To
tal -
La
tin
Am
eri
ca
12
55
17
59
11
21
14
61
58
16
91
72
19
81
93
21
42
07
19
91
94
20
11
93
19
21
51
15
2
Mid
dle
Ea
st
Ba
hra
in1
01
21
11
21
00
00
00
00
00
0
Ira
n6
82
34
10
71
11
11
08
46
66
86
65
16
19
24
29
Ira
q5
00
00
00
00
00
00
00
61
11
61
31
2
Isra
el
21
21
21
12
36
32
22
22
13
20
Jo
rda
n9
09
54
44
24
63
46
98
95
75
44
Ku
wa
it7
31
61
51
28
96
33
21
01
13
63
61
2
Le
ba
no
n7
66
85
43
64
11
11
13
10
12
14
10
12
11
12
11
11
Om
an
11
11
01
11
01
01
10
00
00
00
Pa
lestin
e8
10
00
00
00
00
00
00
00
00
0
Qa
tar
02
96
32
22
22
41
23
22
22
11
Sa
ud
i A
rab
ia3
67
21
23
18
20
12
10
14
94
27
15
33
56
60
75
89
95
Syri
a1
03
22
32
54
56
44
43
33
11
01
Unite
d A
rab
Em
ira
tes
00
57
88
43
32
20
00
00
00
00
Un
ive
rsit
y o
f O
kla
ho
ma
No
rman
On
-Cam
pu
s P
rog
ram
s
En
rollm
en
t o
f In
tern
ati
on
al S
tud
en
ts b
y R
eg
ion
an
d C
ou
ntr
y
Fa
ll 1
980
, 1
99
0,
19
95
to
20
12
Reg
ion
/Co
un
try
19
80
19
90
19
95
19
96
19
97
19
98
19
99
20
00
20
01
20
02
20
03
20
04
20
05
20
06
20
07
20
08
20
09
20
10
20
11
20
12
Mid
dle
Ea
st
- (c
on
tinu
ed
)
We
st
Ba
nk
00
00
12
11
12
22
22
22
45
32
Ye
me
n,
Ara
b R
ep
03
53
54
22
11
11
00
00
00
00
To
tal -
Mid
dle
Ea
st
91
87
08
57
67
26
75
64
95
45
24
53
64
75
46
89
61
19
14
11
53
16
7
Nort
h A
me
rica
Be
rmu
da
00
01
11
11
00
00
00
00
00
00
Can
ad
a3
01
92
32
12
32
92
82
53
02
92
82
82
62
21
91
61
01
71
92
8
To
tal -
Nort
h A
me
rica
30
19
23
22
24
30
29
26
30
29
28
28
26
22
19
16
10
17
19
28
Oce
an
ia/A
ustr
alia
Au
str
alia
82
35
55
34
45
24
66
45
43
55
New
Guin
ea
00
00
00
01
00
00
00
00
00
00
New
Ze
ala
nd
02
55
44
00
12
22
02
22
13
22
Niu
e0
00
00
00
00
52
00
00
00
00
0
To
ng
a0
00
00
00
00
01
00
00
00
00
0
To
tal -
Oce
an
ia/A
ustr
alia
84
81
09
93
55
12
76
68
67
56
77
Inva
lid C
od
e2
32
00
11
01
00
01
33
06
67
3
To
tal In
tern
atio
na
l S
tud
en
ts1
,69
31
,24
91
,71
81
,70
21
,58
91
,60
01
,59
41
,57
71
,60
11
,73
01
,77
31
,62
01
,43
11
,35
11
,38
41
,42
91
,50
21
,56
71
,64
11
,68
0
No.
of
co
un
trie
s r
ep
rese
nte
d6
97
31
00
10
41
06
11
11
08
10
61
03
10
01
05
97
98
10
11
00
10
61
08
10
41
12
11
4
Cla
ssific
atio
n
Und
erg
rad
ua
te1
,14
04
35
1,0
09
94
88
33
78
47
31
68
06
09
55
05
23
45
63
99
34
63
52
38
44
25
48
66
02
73
7
Gra
du
ate
/Pro
fessio
na
l4
83
75
66
29
65
66
48
67
07
22
72
68
43
99
91
,05
59
68
82
87
66
78
08
10
82
48
53
81
37
42
Uncla
ssifie
d7
05
88
09
81
08
14
61
41
17
11
49
18
11
95
19
62
04
23
92
52
23
52
53
22
82
26
20
1
Note
: P
rior
years
have b
een r
evis
ed t
o m
ove c
ountr
ies t
o t
he a
ppro
priate
regio
n t
o c
onfo
rm w
ith t
he O
pen D
oors
recla
ssific
ations.
Institu
tional R
esearc
h a
nd R
eport
ing
10/1
2/1
2IR
\Stu
dents
\Report
s\Inte
rnational\F
all
20121\Intl R
pt
Pt3
FA
12 2
0 Y
r T
rends

Un
ivers
ity o
f O
kla
ho
ma
No
rman
On
-Cam
pu
s P
rog
ram
s
En
rollm
en
t o
f In
tern
ati
on
al
Stu
den
ts b
y R
eg
ion
Fall
198
0,
199
0,
199
5 t
o 2
01
2
Re
gio
n1980
1990
1995
1996
1997
1998
1999
2000
2001
2002
2003
2004
2005
2006
2007
2008
2009
2010
2011
2012
Afr
ica
Ce
ntr
al A
fric
a1
18
13
13
20
23
13
14
11
12
19
14
13
16
18
15
19
20
19
Easte
rn A
fric
a14
619
23
28
31
34
34
34
38
38
33
18
10
510
13
16
15
18
No
rth
Afr
ica
58
98
67
65
915
16
18
18
16
15
18
13
18
21
19
13
South
ern
Afr
ica
11
56
36
51
23
812
97
19
21
22
20
14
18
Weste
rn A
fric
a109
15
13
16
31
51
67
74
85
102
111
110
96
86
79
81
88
98
93
88
Tota
l -
Afr
ica
183
32
53
64
82
114
134
131
150
170
187
192
153
131
137
143
156
174
161
156
Asia E
ast A
sia
143
389
419
409
380
404
385
384
385
432
454
434
379
371
382
405
392
414
548
636
South
& C
entr
al A
sia
104
364
288
292
238
229
246
253
313
390
395
323
232
185
201
207
221
220
211
169
South
east A
sia
130
227
586
539
436
358
336
297
251
205
191
147
129
113
113
111
133
125
118
101
Tota
l -
Asia
377
980
1,2
93
1,2
40
1,0
54
991
967
934
949
1,0
27
1,0
40
904
740
669
696
723
746
759
877
906
Euro
pe
50
90
179
199
227
242
246
263
240
242
273
240
251
265
261
243
267
272
266
261
Latin A
merica
Ca
rib
be
an
11
216
17
17
17
17
12
13
14
14
14
13
13
15
14
13
11
11
11
Ce
ntr
al A
me
rica
/Me
xic
o15
19
13
19
43
45
45
50
27
27
29
31
33
20
27
28
27
24
29
28
South
Am
erica
99
30
46
55
61
84
96
107
132
157
150
169
161
166
152
159
153
157
111
113
Tota
l -
Latin A
merica
125
51
75
91
121
146
158
169
172
198
193
214
207
199
194
201
193
192
151
152
Mid
dle
East
918
70
85
76
72
67
56
49
54
52
45
36
47
54
68
96
119
141
153
167
No
rth
Am
erica
30
19
23
22
24
30
29
26
30
29
28
28
26
22
19
16
10
17
19
28
Oceania
/Austr
alia
84
810
99
35
512
76
68
67
56
77
Invalid
Code
23
20
01
10
10
00
13
30
66
73
Tota
l In
tern
ational S
tudents
1,6
93
1,2
49
1,7
18
1,7
02
1,5
89
1,6
00
1,5
94
1,5
77
1,6
01
1,7
30
1,7
73
1,6
20
1,4
31
1,3
51
1,3
84
1,4
29
1,5
02
1,5
67
1,6
41
1,6
80
No. of
countr
ies r
epre
sente
d69
73
100
104
106
111
108
106
103
100
105
97
98
101
100
106
108
104
112
114
Cla
ssific
ation
Un
de
rgra
du
ate
1,1
40
435
1,0
09
948
833
784
731
680
609
550
523
456
399
346
352
384
425
486
602
737
Gra
duate
483
756
629
656
648
670
722
726
843
999
1,0
55
968
828
766
780
810
824
853
813
742
Un
cla
ssifie
d70
58
80
98
108
146
141
171
149
181
195
196
204
239
252
235
253
228
226
201
Note
: P
rior
years
have b
een r
evis
ed to m
ove c
ountr
ies to the a
ppro
priate
regio
n to c
onfo
rm w
ith the O
pen D
oors
recla
ssific
ations.
Institu
tional R
esearc
h a
nd R
eport
ing 10/1
2/1
2IR
\Stu
dents
\Report
s\Inte
rnational\F
all
20121\Intl R
pt P
t3 F
A12 2
0 Y
r T
rends

Institu
tional R
esearc
h a
nd R
eport
ing 10/1
2/1
2IR
\Stu
dents
\Report
s\Inte
rnational\F
all
20121\Intl R
pt P
t3 F
A12 2
0 Y
r T
rends
0%
10%
20%
30%
40%
50%
60%
70%
80%
90%
100%
200
22
00
32
00
42
00
52
00
62
00
72
00
82
00
92
01
02
01
12
01
2
Percent of Int'l Students
Inte
rna
tion
al S
tud
en
t E
nro
llme
nt by R
eg
ion
Fa
ll 20
02
- 2
01
2
Afr
ica
Ea
st A
sia
So
uth
& C
entr
al A
sia
So
uth
ea
st A
sia
Eu
rope
La
tin
Am
erica
Mid
dle
Ea
st
Nort
h A
me
rica
Oce
an
ia/O
the
r
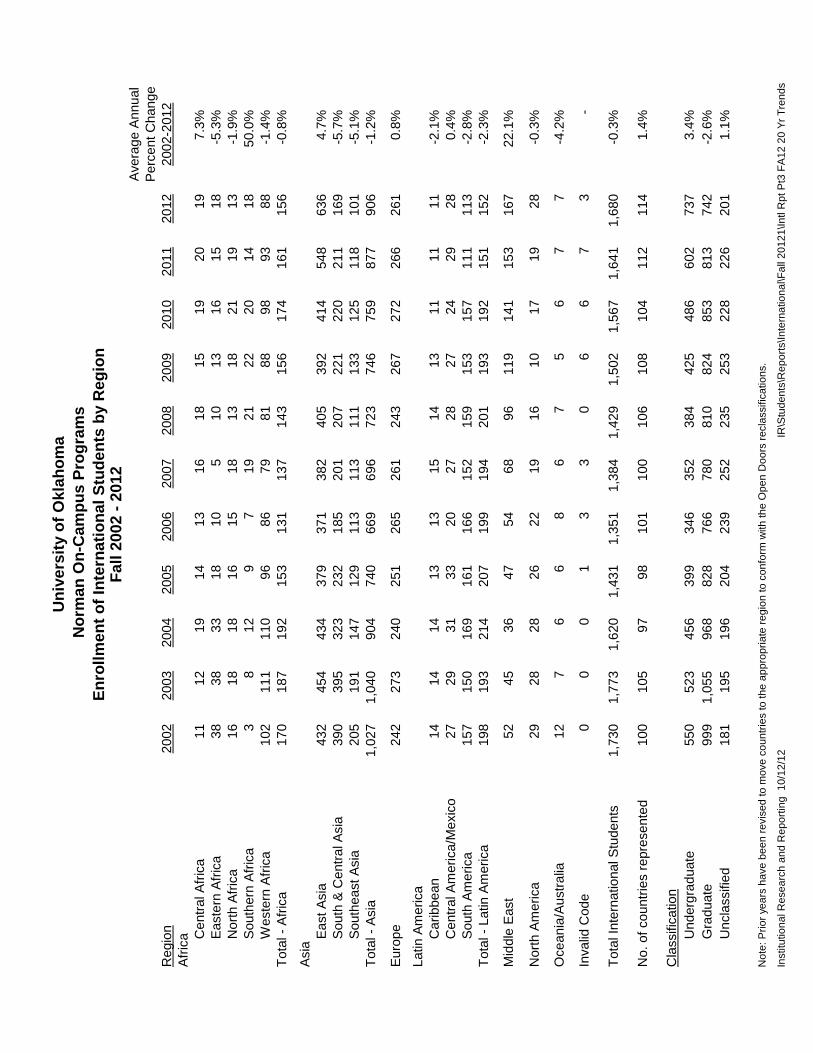
Un
ive
rsit
y o
f O
kla
ho
ma
No
rma
n O
n-C
am
pu
s P
rog
ram
s
En
roll
me
nt
of
Inte
rna
tio
na
l S
tud
en
ts b
y R
eg
ion
Fa
ll 2
00
2 -
20
12
Avera
ge A
nnual
Perc
ent C
hange
Regio
n2002
2003
2004
2005
2006
2007
2008
2009
2010
2011
2012
2002-2
012
Afr
ica C
entr
al A
fric
a11
12
19
14
13
16
18
15
19
20
19
7.3
%
Easte
rn A
fric
a38
38
33
18
10
510
13
16
15
18
-5.3
%
Nort
h A
fric
a16
18
18
16
15
18
13
18
21
19
13
-1.9
%
South
ern
Afr
ica
38
12
97
19
21
22
20
14
18
50.0
%
Weste
rn A
fric
a102
111
110
96
86
79
81
88
98
93
88
-1.4
%
Tota
l -
Afr
ica
170
187
192
153
131
137
143
156
174
161
156
-0.8
%
Asia
East A
sia
432
454
434
379
371
382
405
392
414
548
636
4.7
%
South
& C
entr
al A
sia
390
395
323
232
185
201
207
221
220
211
169
-5.7
%
South
east A
sia
205
191
147
129
113
113
111
133
125
118
101
-5.1
%
Tota
l -
Asia
1,0
27
1,0
40
904
740
669
696
723
746
759
877
906
-1.2
%
Euro
pe
242
273
240
251
265
261
243
267
272
266
261
0.8
%
Latin A
merica
Caribbean
14
14
14
13
13
15
14
13
11
11
11
-2.1
%
Centr
al A
merica/M
exic
o27
29
31
33
20
27
28
27
24
29
28
0.4
%
South
Am
erica
157
150
169
161
166
152
159
153
157
111
113
-2.8
%
Tota
l -
Latin A
merica
198
193
214
207
199
194
201
193
192
151
152
-2.3
%
Mid
dle
East
52
45
36
47
54
68
96
119
141
153
167
22.1
%
Nort
h A
merica
29
28
28
26
22
19
16
10
17
19
28
-0.3
%
Oceania
/Austr
alia
12
76
68
67
56
77
-4.2
%
Invalid
Code
00
01
33
06
67
3-
Tota
l In
tern
ational S
tudents
1,7
30
1,7
73
1,6
20
1,4
31
1,3
51
1,3
84
1,4
29
1,5
02
1,5
67
1,6
41
1,6
80
-0.3
%
No. of
countr
ies r
epre
sente
d100
105
97
98
101
100
106
108
104
112
114
1.4
%
Cla
ssific
ation
Underg
raduate
550
523
456
399
346
352
384
425
486
602
737
3.4
%
Gra
duate
999
1,0
55
968
828
766
780
810
824
853
813
742
-2.6
%
Uncla
ssifie
d181
195
196
204
239
252
235
253
228
226
201
1.1
%
No
te: P
rio
r ye
ars
ha
ve
be
en
re
vis
ed
to
mo
ve
co
un
trie
s to
th
e a
pp
rop
ria
te r
eg
ion
to
co
nfo
rm w
ith
th
e O
pe
n D
oo
rs r
ecla
ssific
atio
ns.
Institu
tio
na
l R
ese
arc
h a
nd
Re
po
rtin
g 1
0/1
2/1
2IR
\Stu
de
nts
\Re
po
rts\In
tern
atio
na
l\F
all
20
12
1\In
tl R
pt P
t3 F
A1
2 2
0 Y
r T
ren
ds

Un
ive
rsit
y o
f O
kla
ho
ma
No
rma
n O
n-C
am
pu
s P
rog
ram
s
Perc
enta
ge
Poin
t C
hange
Regio
n2002
2003
2004
2005
2006
2007
2008
2009
2010
2011
2012
2002-2
012
Afr
ica
Centr
al A
fric
a0.6
%0.7
%1.2
%1.0
%1.0
%1.2
%1.3
%1.0
%1.2
%1.2
%1.2
%0.6
Easte
rn A
fric
a2.2
%2.1
%2.0
%1.3
%0.7
%0.4
%0.7
%0.9
%1.0
%1.0
%0.9
%-1
.3
Nort
h A
fric
a0.9
%1.0
%1.1
%1.1
%1.1
%1.3
%0.9
%1.2
%1.3
%1.3
%1.2
%0.2
South
ern
Afr
ica
0.2
%0.5
%0.7
%0.6
%0.5
%1.4
%1.5
%1.5
%1.3
%1.3
%0.9
%0.7
Weste
rn A
fric
a5.9
%6.3
%6.8
%6.7
%6.4
%5.7
%5.7
%5.9
%6.3
%6.3
%5.7
%-0
.2
Tota
l A
fric
a9.8
%10.5
%11.9
%10.7
%9.7
%9.9
%10.0
%10.4
%11.1
%11.1
%9.8
%0.0
Asia E
ast A
sia
25.0
%25.6
%26.8
%26.5
%27.5
%27.6
%28.3
%26.1
%26.4
%26.4
%33.4
%8.4
South
& C
entr
al A
sia
22.5
%22.3
%19.9
%16.2
%13.7
%14.5
%14.5
%14.7
%14.0
%14.0
%12.9
%-9
.7
South
east A
sia
11.8
%10.8
%9.1
%9.0
%8.4
%8.2
%7.8
%8.9
%8.0
%8.0
%7.2
%-4
.7
Tota
l -
Asia
59.4
%58.7
%55.8
%51.7
%49.5
%50.3
%50.6
%49.7
%48.4
%48.4
%53.4
%-5
.9
Euro
pe
14.0
%15.4
%14.8
%17.5
%19.6
%18.9
%17.0
%17.8
%17.4
%17.4
%16.2
%2.2
Latin A
merica
Caribbean
0.8
%0.8
%0.9
%0.9
%1.0
%1.1
%1.0
%0.9
%0.7
%0.7
%0.7
%-0
.1
Centr
al A
merica/M
exic
o1.6
%1.6
%1.9
%2.3
%1.5
%2.0
%2.0
%1.8
%1.5
%1.5
%1.8
%0.2
South
Am
erica
9.1
%8.5
%10.4
%11.3
%12.3
%11.0
%11.1
%10.2
%10.0
%10.0
%6.8
%-2
.3
Tota
l -
Latin A
merica
11.4
%10.9
%13.2
%14.5
%14.7
%14.0
%14.1
%12.8
%12.3
%12.3
%9.2
%-2
.2
Mid
dle
East
3.0
%2.5
%2.2
%3.3
%4.0
%4.9
%6.7
%7.9
%9.0
%9.0
%9.3
%6.3
Nort
h A
merica
1.7
%1.6
%1.7
%1.8
%1.6
%1.4
%1.1
%0.7
%1.1
%1.1
%1.2
%-0
.5
Oceania
/Austr
alia
0.7
%0.4
%0.4
%0.4
%0.6
%0.4
%0.5
%0.3
%0.4
%0.4
%0.4
%-0
.3
Invalid
Code
0.0
%0.0
%0.0
%0.1
%0.2
%0.2
%0.0
%0.4
%0.4
%0.4
%0.4
%0.4
Tota
l In
tern
ational S
tudents
1,7
73
1,6
20
1,4
31
1,3
51
1,3
84
1,4
29
1,5
02
1,5
67
1,6
41
1,6
41
1,6
80
-- --
No. of
countr
ies r
epre
sente
d105
97
98
101
100
106
108
104
112
112
114
--
Cla
ssific
ation
Underg
raduate
31.8
%29.5
%28.1
%27.9
%25.6
%25.4
%26.9
%28.3
%31.0
%31.0
%36.7
%4.9
Gra
duate
57.7
%59.5
%59.8
%57.9
%56.7
%56.4
%56.7
%54.9
%54.4
%54.4
%49.5
%-8
.2
Uncla
ssifie
d10.5
%11.0
%12.1
%14.3
%17.7
%18.2
%16.4
%16.8
%14.6
%14.6
%13.8
%3.3
No
te: P
rio
r ye
ars
ha
ve
be
en
re
vis
ed
to
mo
ve
co
un
trie
s to
th
e a
pp
rop
ria
te r
eg
ion
to
co
nfo
rm w
ith
th
e O
pe
n D
oo
rs r
ecla
ssific
atio
ns.
Institu
tio
na
l R
ese
arc
h a
nd
Re
po
rtin
g 1
0/1
2/1
2IR
\Stu
de
nts
\Re
po
rts\In
tern
atio
na
l\F
all
20
12
1\In
tl R
pt P
t3 F
A1
2 2
0 Y
r T
ren
ds
En
roll
me
nt
of
Inte
rna
tio
na
l S
tud
en
ts b
y R
eg
ion
Fa
ll 2
00
2 -
20
12

CREDIT ENROLLMENT AND CESL
FALL 2011 AND 2012
INTERNATIONAL PERSONS
PART IV
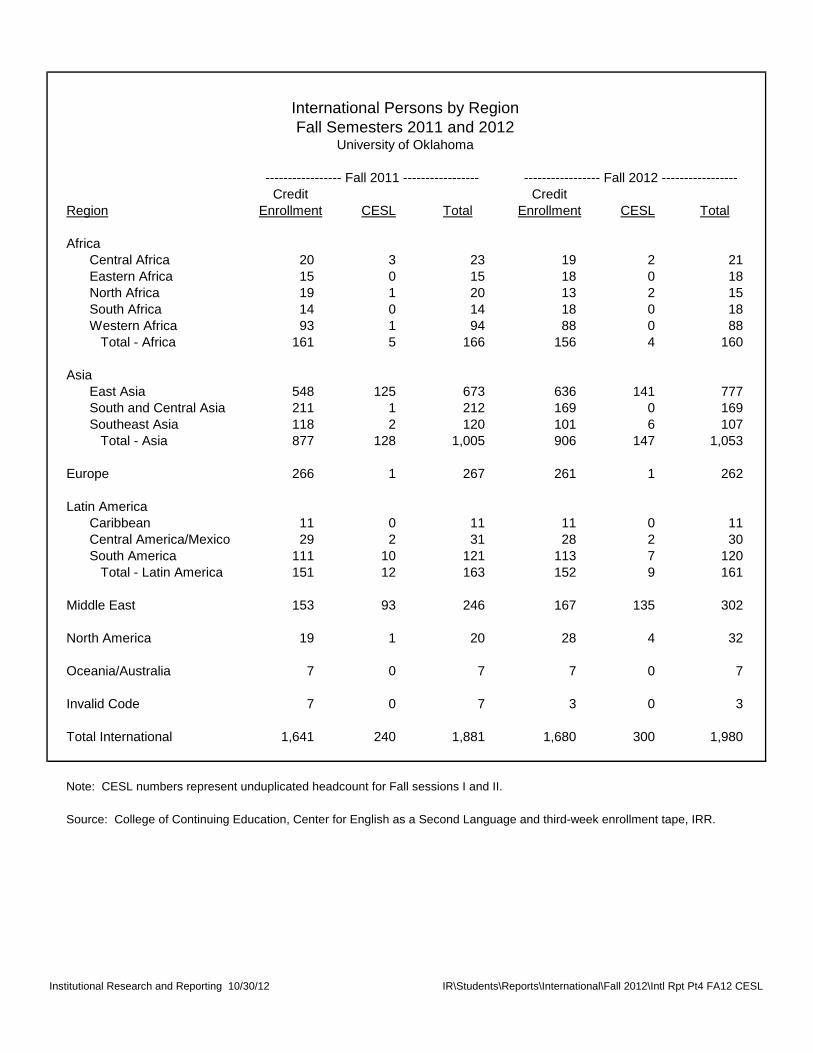
----------------- Fall 2011 ----------------- ----------------- Fall 2012 -----------------
Credit Credit
Region Enrollment CESL Total Enrollment CESL Total
Africa
Central Africa 20 3 23 19 2 21
Eastern Africa 15 0 15 18 0 18
North Africa 19 1 20 13 2 15
South Africa 14 0 14 18 0 18
Western Africa 93 1 94 88 0 88
Total - Africa 161 5 166 156 4 160
Asia
East Asia 548 125 673 636 141 777
South and Central Asia 211 1 212 169 0 169
Southeast Asia 118 2 120 101 6 107
Total - Asia 877 128 1,005 906 147 1,053
Europe 266 1 267 261 1 262
Latin America
Caribbean 11 0 11 11 0 11
Central America/Mexico 29 2 31 28 2 30
South America 111 10 121 113 7 120
Total - Latin America 151 12 163 152 9 161
Middle East 153 93 246 167 135 302
North America 19 1 20 28 4 32
Oceania/Australia 7 0 7 7 0 7
Invalid Code 7 0 7 3 0 3
Total International 1,641 240 1,881 1,680 300 1,980
Note: CESL numbers represent unduplicated headcount for Fall sessions I and II.
Source: College of Continuing Education, Center for English as a Second Language and third-week enrollment tape, IRR.
Institutional Research and Reporting 10/30/12 IR\Students\Reports\International\Fall 2012\Intl Rpt Pt4 FA12 CESL
University of Oklahoma
International Persons by Region
Fall Semesters 2011 and 2012
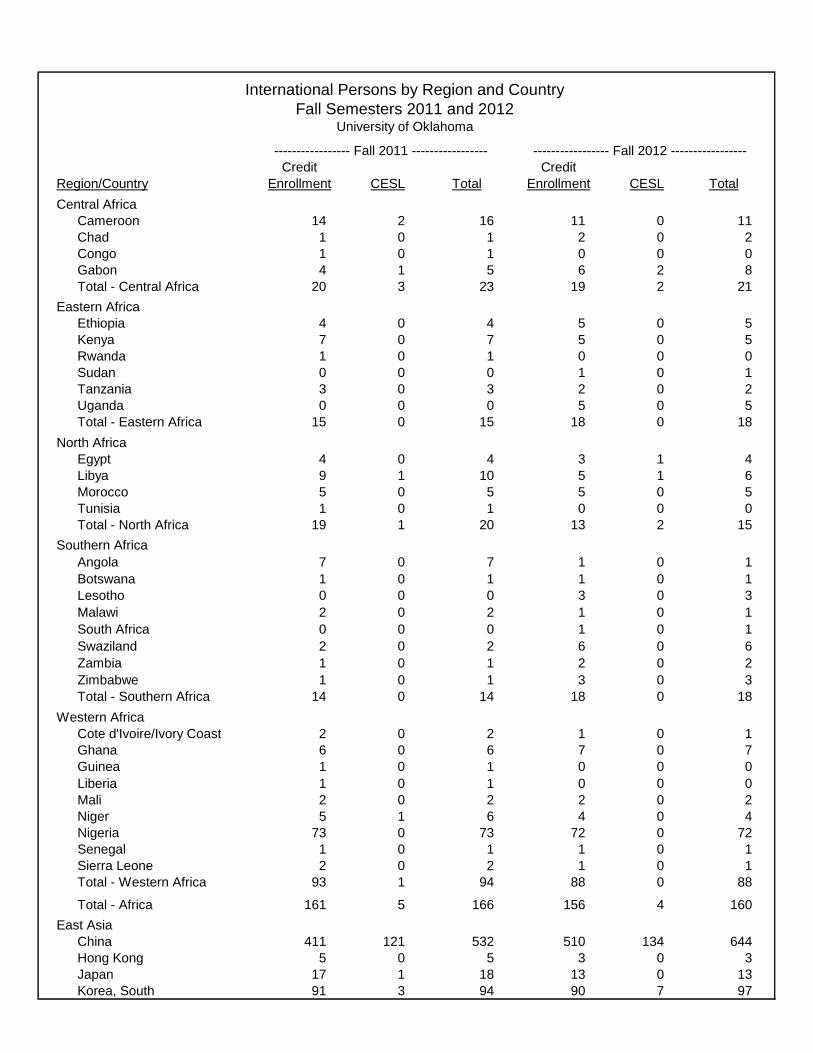
----------------- Fall 2011 ----------------- ----------------- Fall 2012 -----------------
Credit Credit
Region/Country Enrollment CESL Total Enrollment CESL Total
Central Africa
Cameroon 14 2 16 11 0 11
Chad 1 0 1 2 0 2
Congo 1 0 1 0 0 0
Gabon 4 1 5 6 2 8
Total - Central Africa 20 3 23 19 2 21
Eastern Africa
Ethiopia 4 0 4 5 0 5
Kenya 7 0 7 5 0 5
Rwanda 1 0 1 0 0 0
Sudan 0 0 0 1 0 1
Tanzania 3 0 3 2 0 2
Uganda 0 0 0 5 0 5
Total - Eastern Africa 15 0 15 18 0 18
North Africa
Egypt 4 0 4 3 1 4
Libya 9 1 10 5 1 6
Morocco 5 0 5 5 0 5
Tunisia 1 0 1 0 0 0
Total - North Africa 19 1 20 13 2 15
Southern Africa
Angola 7 0 7 1 0 1
Botswana 1 0 1 1 0 1
Lesotho 0 0 0 3 0 3
Malawi 2 0 2 1 0 1
South Africa 0 0 0 1 0 1
Swaziland 2 0 2 6 0 6
Zambia 1 0 1 2 0 2
Zimbabwe 1 0 1 3 0 3
Total - Southern Africa 14 0 14 18 0 18
Western Africa
Cote d'Ivoire/Ivory Coast 2 0 2 1 0 1
Ghana 6 0 6 7 0 7
Guinea 1 0 1 0 0 0
Liberia 1 0 1 0 0 0
Mali 2 0 2 2 0 2
Niger 5 1 6 4 0 4
Nigeria 73 0 73 72 0 72
Senegal 1 0 1 1 0 1
Sierra Leone 2 0 2 1 0 1
Total - Western Africa 93 1 94 88 0 88
Total - Africa 161 5 166 156 4 160
East Asia
China 411 121 532 510 134 644
Hong Kong 5 0 5 3 0 3
Japan 17 1 18 13 0 13
Korea, South 91 3 94 90 7 97
University of Oklahoma
International Persons by Region and Country
Fall Semesters 2011 and 2012
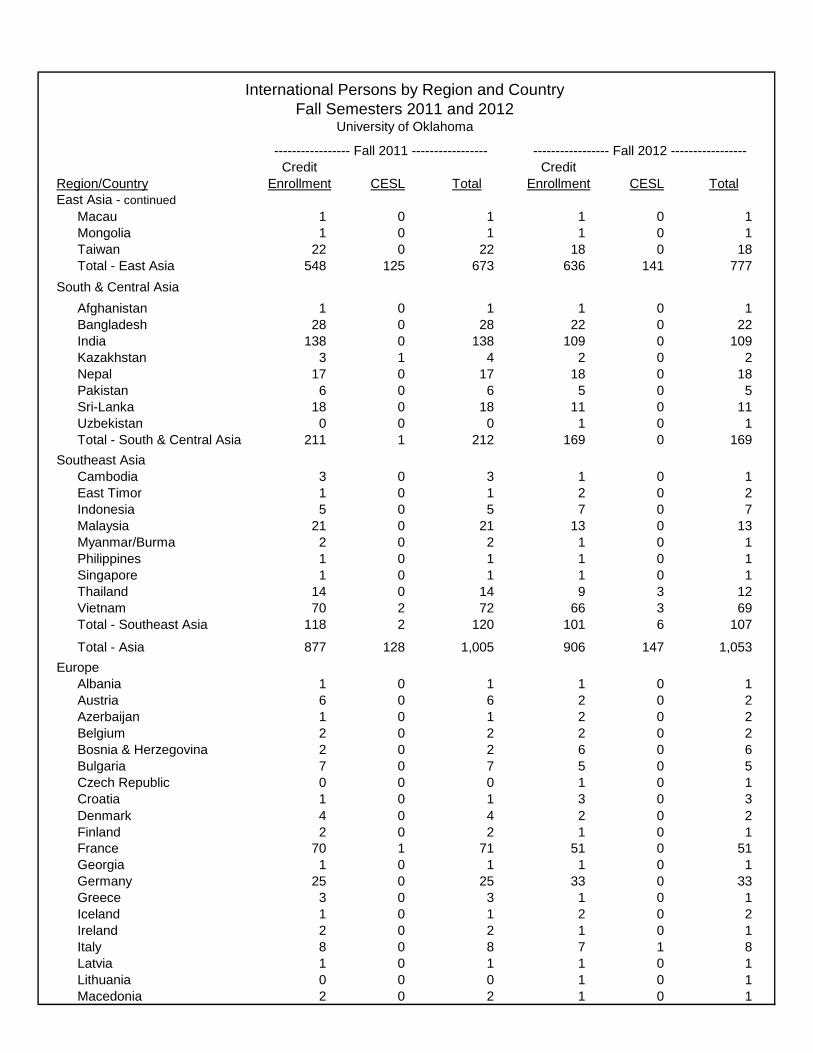
----------------- Fall 2011 ----------------- ----------------- Fall 2012 -----------------
Credit Credit
Region/Country Enrollment CESL Total Enrollment CESL Total
University of Oklahoma
International Persons by Region and Country
Fall Semesters 2011 and 2012
East Asia - continued
Macau 1 0 1 1 0 1
Mongolia 1 0 1 1 0 1
Taiwan 22 0 22 18 0 18
Total - East Asia 548 125 673 636 141 777
South & Central Asia
Afghanistan 1 0 1 1 0 1
Bangladesh 28 0 28 22 0 22
India 138 0 138 109 0 109
Kazakhstan 3 1 4 2 0 2
Nepal 17 0 17 18 0 18
Pakistan 6 0 6 5 0 5
Sri-Lanka 18 0 18 11 0 11
Uzbekistan 0 0 0 1 0 1
Total - South & Central Asia 211 1 212 169 0 169
Southeast Asia
Cambodia 3 0 3 1 0 1
East Timor 1 0 1 2 0 2
Indonesia 5 0 5 7 0 7
Malaysia 21 0 21 13 0 13
Myanmar/Burma 2 0 2 1 0 1
Philippines 1 0 1 1 0 1
Singapore 1 0 1 1 0 1
Thailand 14 0 14 9 3 12
Vietnam 70 2 72 66 3 69
Total - Southeast Asia 118 2 120 101 6 107
Total - Asia 877 128 1,005 906 147 1,053
Europe
Albania 1 0 1 1 0 1
Austria 6 0 6 2 0 2
Azerbaijan 1 0 1 2 0 2
Belgium 2 0 2 2 0 2
Bosnia & Herzegovina 2 0 2 6 0 6
Bulgaria 7 0 7 5 0 5
Czech Republic 0 0 0 1 0 1
Croatia 1 0 1 3 0 3
Denmark 4 0 4 2 0 2
Finland 2 0 2 1 0 1
France 70 1 71 51 0 51
Georgia 1 0 1 1 0 1
Germany 25 0 25 33 0 33
Greece 3 0 3 1 0 1
Iceland 1 0 1 2 0 2
Ireland 2 0 2 1 0 1
Italy 8 0 8 7 1 8
Latvia 1 0 1 1 0 1
Lithuania 0 0 0 1 0 1
Macedonia 2 0 2 1 0 1

----------------- Fall 2011 ----------------- ----------------- Fall 2012 -----------------
Credit Credit
Region/Country Enrollment CESL Total Enrollment CESL Total
University of Oklahoma
International Persons by Region and Country
Fall Semesters 2011 and 2012
Europe - continued
Moldova 1 0 1 1 0 1
Montenegro 1 0 1 1 0 1
Netherlands 5 0 5 11 0 11
Norway 7 0 7 9 0 9
Poland 3 0 3 2 0 2
Portugal 1 0 1 2 0 2
Romania 7 0 7 4 0 4
Russia 11 0 11 6 0 6
Serbia 2 0 2 3 0 3
Slovenia 0 0 0 1 0 1
Spain 16 0 16 22 0 22
Sweden 8 0 8 11 0 11
Switzerland 1 0 1 0 0 0
Turkey 30 0 30 27 0 27
Ukraine 7 0 7 6 0 6
United Kingdom 27 0 27 31 0 31
Total - Europe 266 1 267 261 1 262
Caribbean
Bahamas 2 0 2 3 0 3
Grenada 1 0 1 1 0 1
Jamaica 4 0 4 3 0 3
Trinidad and Tobago 4 0 4 4 0 4
Total - Caribbean 11 0 11 11 0 11
Central America/Mexico
Belize 1 0 1 1 0 1
El Salvador 1 0 1 2 0 2
Guatemala 1 0 1 1 1 2
Haiti 0 1 1 0 0 0
Honduras 1 0 1 1 0 1
Mexico 24 1 25 23 1 24
Panama 1 0 1 0 0 0
Total - Central America/Mexico 29 2 31 28 2 30
South America
Argentina 2 0 2 2 0 2
Bolivia 19 0 19 19 1 20
Brazil 6 1 7 15 1 16
Colombia 39 5 44 37 3 40
Ecuador 3 0 3 3 0 3
Peru 11 0 11 10 1 11
Uruguay 0 0 0 2 0 2
Venezuela 31 4 35 25 1 26
Total - South America 111 10 121 113 7 120
Total - Latin America 151 12 163 152 9 161

----------------- Fall 2011 ----------------- ----------------- Fall 2012 -----------------
Credit Credit
Region/Country Enrollment CESL Total Enrollment CESL Total
University of Oklahoma
International Persons by Region and Country
Fall Semesters 2011 and 2012
Middle East
Iran 24 2 26 29 0 29
Iraq 13 0 13 12 1 13
Israel 2 0 2 0 0 0
Jordan 4 0 4 4 0 4
Kuwait 6 7 13 12 7 19
Lebanon 11 0 11 11 0 11
Oman 0 1 1 0 0 0
Qatar 1 0 1 1 10 11
Saudi Arabia 89 83 172 95 117 212
Syria 0 0 0 1 0 1
West Bank 3 0 3 2 0 2
Total - Middle East 153 93 246 167 135 302
North America
Canada 19 0 19 28 0 28
United States 0 1 1 0 4 4
Total - North America 19 1 20 28 4 32
Oceania/Australia
Australia 5 0 5 5 0 5
New Zealand 2 0 2 2 0 2
Total - Oceania/Australia 7 0 7 7 0 7
Invalid Code 7 0 7 3 0 3
Total International 1,641 240 1,881 1,680 300 1,980
Number of countries represented 112 20 115 114 21 115
Note: CESL numbers represent unduplicated headcount for Fall sessions I and II.
Source: College of Continuing Education, Center for English as a Second Language and ORD enrollment file, IRR.
Institutional Research and Reporting 10/30/12 IR\Students\Reports\International\Fall 2012\Intl Rpt Pt4 FA12 CESL