Embed Size (px)
Citation preview
1
International Solid Waste Association

2
3
The International Solid Waste Association (ISWA) is a global, independent and non-profit making association, working in the public interest to promote and develop sustainable waste management.
ISWA has members in more than 60 countries and is the only worldwide association promoting sustainable, comprehensive and professional waste management
ISWA’s objective is the worldwide exchange of information and experience on all aspects of waste management. The association pro-motes the adoption of acceptable systems of professional waste management through technological development and improve-ment of practices for the protection of hu-man life, health and the environment as well as the conservation of materials and energy resources.
ISWA’s vision is an Earth where no waste exists. Waste should be reused and reduced to a minimum, then collected, recycled and treated properly. Residual matter should be disposed of in a safely engineered way, ensuring a clean and healthy environment. All people on Earth should have the right to enjoy an environment with clean air, earth, seas and soils. To be able to achieve this, we need to work together.
International Solid Waste Association
4
We take recycling for granted. After all, everybody ‘knows’ about it, and most like-ly, opportunity given, ‘recycles’: meaning, invests the time and effort to sort out and clean the material, placing it in the suitable recycling bin. However, whoever works in the waste and resources management sector knows well that this is just the be-ginning of a long journey for the recyclable material: a series of actions are necessary to convert this sorted item into what is called a ‘secondary’ raw material, suita-ble to replace virgin material in a product manufacturing process. One could argue that such a replacement is the ultimate moment of a ‘circular’ economy: the clos-ing of the loop, the rejuvenating of a used technically engineered material such as a polymer or paper into the ‘same’ matter state. Whereas there is more to a circular economy than just the technical cycle of recycling, it still occupies the very core of it: the bare minimum if it is to be ‘circular’, to which other peripheral actions should be organised around.
Here, we revisit the evidence regarding the feasibility of recycling, with a view to what are the bottlenecks of more and bet-ter recycling, and with reference to key aspects of sustainability of resource man-agement: technical aspects, markets and environmental performance. We focus on two key engineered materials: one repre-sentative of the plastics family (polypropyl-ene - PP) of fossil non-renewable origin, and one renewable biogenic category of materials: paper & board.
ExecutivesummaryExecutive summary
There are fundamental underlying simi-larities (for example, both are used most in packaging short-lived applications; and scrap is traded globally) along with striking contrasts (for example level of collection for recycling) in the two cases considered: with collection for recycling rates at over 70% in Europe and around 50% of new paper/board manufactured utilising re-covered material, paper/board recycling is a prominent success story. However, such figures do not consider quantity and quality of fibre: the very backbone of the paper/board material, and just a fraction of its mass. In contrast, PP despite ac-counting for around one quarter of the world’s plastics production, paradoxical-ly or not, currently enjoys very low level of recycling. Estimates of how low is ex-actly this level are not available, and this demonstrates once again the lack of relia-ble and widely available information, which impedes resource recovery from waste. UNComtrade collects international trade data for other major recycled polymers (e.g. PET, HDPE), but not for PP.
The reasons behind this lag for PP recy-cling –and the knowledge about it– can be sought in: extreme variability in material qualities, including complex/composite materials, types of items and sectors – all these reflecting the innovation for func-tionality and the remarkable adaptability of the basic polymer; inadequate collection infrastructure and use of commingled sys-tems, which impede collected feedstock separability, as for rigid packaging PP; lack
of suitable technologies to effectively sep-arate the necessary quality of recycled PP: e.g. separation from similar density PE, food grade fraction, black coloured frac-tion identification by NIR systems; capital investment cost for advanced sensor-based sorting; absence of globally accepted / well established quality standards; insufficient reprocessing capacity in Europe; unclear technical capabilities and fate in major im-port destinations, such as China; compe-tition from domestic collection in tradi-tional export destinations; low quality of export standards (traded usually as part of mixed plastics); financially unsustainable advanced recovery technologies (feed-stock recycling via thermal processing de-composition); non-transparent markets, including pricing; series of major challenges related to trading in a globalised secondary material value chain, including asymmetry of information; direct completion with vir-gin materials on the price, and dependence on oil prices. Addressing such issues could enable a substantially increased level of meaningful recycling for PP.
A critically important contribution of the waste management and reprocessing in-dustries lies in keeping the environment clean while closing the loop. In many cases, legacy issues have to be addressed during the recycling process, such as in the pres-ence of certain brominated flame retard-ant additives in plastics that proved car-cinogenic, or compounds associated with inks in paper, such as bisphenol-A (BFA): it is very important to de-pollute the ma-
5
terial flows and close the loop while pre-venting dispersion of polluting substances. Such de-pollution function, results in some inevitable losses and sets another limit to what can be sustainably recycled. Notwith-standing this, there is insufficient under-standing of the environmental and wider sustainability performance of the closing of the loop. Whereas some life cycle as-sessment research studies indicate limits to environmentally meaningful recycling, requiring, for example, high level of virgin material substitution, there are no studies for PP, covering the entire reprocessing cycle, the multiple sources and additives, and its export from OECD countries and final closing of the cycle in conditions of environmental protection and manufactur-ing that may be sub-optimal. Much more comprehensive sustainability assessment is required, including multiple aspects of re-source recovery, to substantiate the per-ceived benefits and address the questions currently raised.
Innovation for high quality sustainable recycling at suitable level of cascade is needed. Indeed, a major finding is that the (perpetual) closed-loop model (recycle in same use and for multiple cycles) may not be feasible in many occasions, because of small but sufficient deterioration of funda-mental material properties during its use, collection for recycling and reprocessing: e.g. length of fibres is shortened for paper/board in each reprocessing cycle. As a re-sult, virgin raw material still needs to be added at some percentage while recover-
ing the used paper/board; and a ‘cascade’ model, by use in less quality demanding ap-plications, is by far more realistic prospect, before an eventual recovery in energy from waste. Newsprint is an intermediate example: whereas one can make news-print paper from 100% recovered paper, possibly a lot of used paper of much higher quality will end up as recovered for news-print quality while closing the loop. Food contact packaging PP cannot at present be recycled back to the same use because the legislative standards require very high material purity and there is no automated way to identify it – manual separation is also still necessary as a final stage quality improvement in sorting used paper grades sorting.
Another limit to the closed-loop model stems from the losses that inevitably occur during the multiple stages of closing the cycle: starting with ability to collect suffi-cient quantities, and continuing with the rejection of unsuitable material (damaged, contaminated) and the limited separa-tion efficiencies of the sorting equipment. There is no concrete evidence about the level of such losses. Similarly, there is no sufficient understanding on the additional resources (virgin material, energy, water, chemical additives) that is required to close the loop per mass unit of secondary PP and paper/board.
Sustainable closing of the engineered ma-terial loops remains technically challeng-ing. The potential for recyclability and its
sustainability depend primarily on: the ma-terial properties; the processing engineer-ing technologies available to perform the closing of the loop; and the societal need and technical quality requirements for the intended use of the secondary raw mate-rial. Continued technological innovation on material properties, processing and standardisation is needed to enable the demand for high quality recycled materi-als. To this, recyclability has to be aligned as far as practicable with innovation in new materials/ additives: on the contrary, some of the newly emerged barriers to paper/board recycling are due to innovations in flexographic newspaper printing and/or digital printing which necessitate novel ap-proaches in reprocessing.
Ultimately, closing the loop depends on market conditions, resulting in major challenges for the sustainability of circu-lar economy. Recycled materials are in direct competition with the equivalent primary (i.e. virgin) raw materials –an un-derexplored aspect, where plain field is re-quired- and when exported from OECD, they are traded in globalised value chains. Understanding and addressing such mar-ket challenges, and underpinning solutions with environmentally conscious techno-logical innovation, could make the differ-ence in sustainable resource management and should, therefore, be prioritised.
6
Lead author: Dr Costas VelisLecturer in Resource Efficiency SystemsUniversity of LeedsUnited Kingdom
Co-authors:Dr Maria CoronadoMr David Lerpiniereof University of Leeds
Prepared by the ISWA task force on resource management
Dr Costas Velis, MSc, DIC, PhD, MCIWM, MInstP, is an internationally renowned ex-pert in waste and resources management, with a vision of a sustainable circular econ-omy of clean material flows. With leading expertise in global waste systems, he has served in esteemed international com-mittees addressing relevant challenges of worldwide scale, including the UNEP Global Waste Management Outlook, and the ISWA Globalisation and Waste Management Task Force. He chairs the Waste Atlas Scientific Committee.
An academic, as a Lecturer in Resource Efficiency Systems at School of Civil Engi-neering, University of Leeds, UK, he leads a research team and directs a waste char-acterisation laboratory. Costas has over 10 years of work and research experience in innovation for resources management (Chartered Waste Manager by CIWM) and he offers to his profession as Associate Ed-itor of the academic journals Waste Man-agement & Research, and Critical Reviews in Environmental Science and Technology, and as Vice Chair of the ISWA European Group.
Costas is honoured with many internation-al awards for his research papers, including the prestigious Institution of Civil Engineers Terford Premium Award in 2014.
7
Introduction Background and scopeStructure of report
PolypropyleneProperties and usesWaste polypropylene generation, recycling and outletsClosing the PP material loop: technologies and processing International market reviewBarriers and opportunities to sustainable PP recycling
Paper & boardProperties and usesPaper & board waste generation, recycling and outletsClosing the fibre material loop: technologies and pro-cessingInternational market reviewBarriers and opportunities to sustainable paper & board recycling
References
08
0808
10
1011
13
1418
26
262730
3236
41
Table of contents
8
This study was undertaken on behalf of the International Solid Waste Associa-tion’s Task Force on Resource Manage-ment. It comprises a review of the value and potential to enhance the level of re-covery of two key materials: polypropyl-ene and paper & board. The overall ob-jective of the study is to support ISWA’s work assessing the potential role that the waste management sector can play in achieving greater resource efficiency and moving towards a circular economy.
The study is based entirely on review of secondary data and has involved an ex-tensive review of publicly available liter-ature and data sources. Please note that no primary data has been collected dur-ing the source of this work. There are fundamental underlying simi-larities (for example, both are used most in packaging short-lived applications; and scrap is traded globally) along with striking contrasts (for example level of collection for recycling) in the two cases considered.
This report comprises two main sec-tions: Section 1 focuses on polypropylene and Section 2 focuses on paper & board. Each of these sections considers the fol-lowing main issues for these two material streams:
1. Properties and uses: an overview of the material’s key characteristics and main applications.
2. Waste generation and recycling: an overview of the estimated quantities of secondary materials generated, processed and consumed.
3. Recycling processes and technolo-gies: A review of recycling processes and technologies including a discussion of the key issues in terms of technical, financial, and environmental themes.
4. International market review: A re-view of the material’s markets, market values and market trends.
5. Barriers and opportunities: a discus-sion of the key findings of the review, in-cluding a consideration of the key barriers associated with maximising the recycling of the material.
The final section of the report presents a detailed reference list.
IntroductionBackground and scope
Structure ofreport
9
10
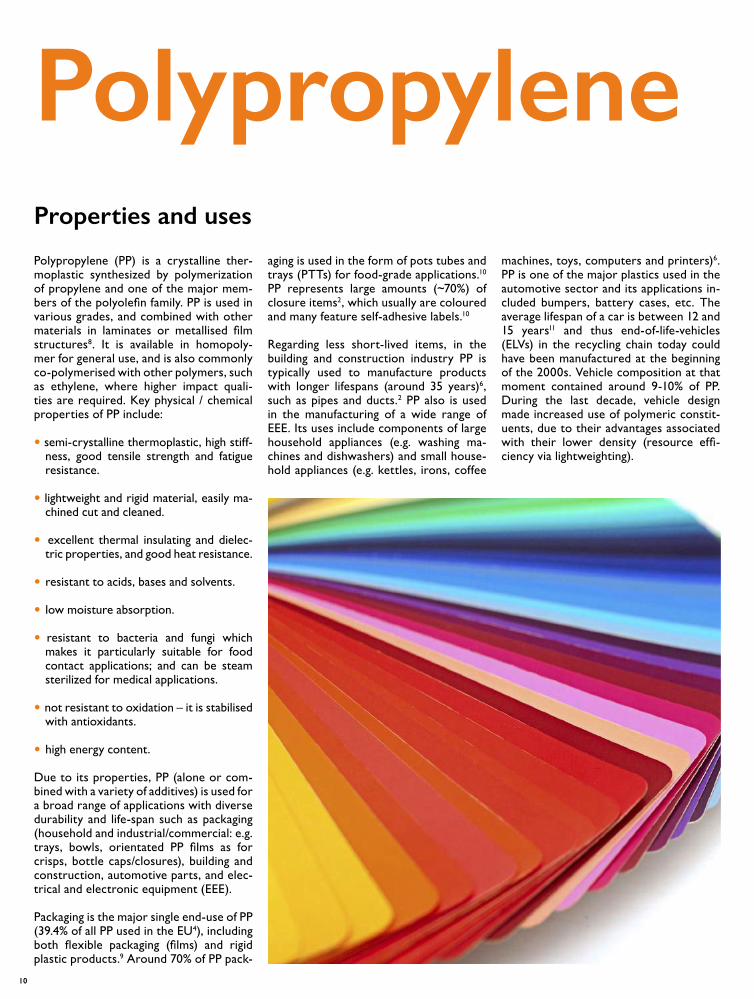
Polypropylene (PP) is a crystalline ther-moplastic synthesized by polymerization of propylene and one of the major mem-bers of the polyolefin family. PP is used in various grades, and combined with other materials in laminates or metallised film structures8. It is available in homopoly-mer for general use, and is also commonly co-polymerised with other polymers, such as ethylene, where higher impact quali-ties are required. Key physical / chemical properties of PP include:
• semi-crystalline thermoplastic, high stiff-ness, good tensile strength and fatigue resistance.
• lightweight and rigid material, easily ma-chined cut and cleaned.
• excellent thermal insulating and dielec-tric properties, and good heat resistance.
• resistant to acids, bases and solvents.
• low moisture absorption.
• resistant to bacteria and fungi which makes it particularly suitable for food contact applications; and can be steam sterilized for medical applications.
• not resistant to oxidation – it is stabilised with antioxidants.
• high energy content.
Due to its properties, PP (alone or com-bined with a variety of additives) is used for a broad range of applications with diverse durability and life-span such as packaging (household and industrial/commercial: e.g. trays, bowls, orientated PP films as for crisps, bottle caps/closures), building and construction, automotive parts, and elec-trical and electronic equipment (EEE).
Packaging is the major single end-use of PP (39.4% of all PP used in the EU4), including both flexible packaging (films) and rigid plastic products.9 Around 70% of PP pack-
PolypropyleneProperties and uses
aging is used in the form of pots tubes and trays (PTTs) for food-grade applications.10
PP represents large amounts (~70%) of closure items2, which usually are coloured and many feature self-adhesive labels.10
Regarding less short-lived items, in the building and construction industry PP is typically used to manufacture products with longer lifespans (around 35 years)6, such as pipes and ducts.2 PP also is used in the manufacturing of a wide range of EEE. Its uses include components of large household appliances (e.g. washing ma-chines and dishwashers) and small house-hold appliances (e.g. kettles, irons, coffee
machines, toys, computers and printers)6. PP is one of the major plastics used in the automotive sector and its applications in-cluded bumpers, battery cases, etc. The average lifespan of a car is between 12 and 15 years11 and thus end-of-life-vehicles (ELVs) in the recycling chain today could have been manufactured at the beginning of the 2000s. Vehicle composition at that moment contained around 9-10% of PP. During the last decade, vehicle design made increased use of polymeric constit-uents, due to their advantages associated with their lower density (resource effi-ciency via lightweighting).
11
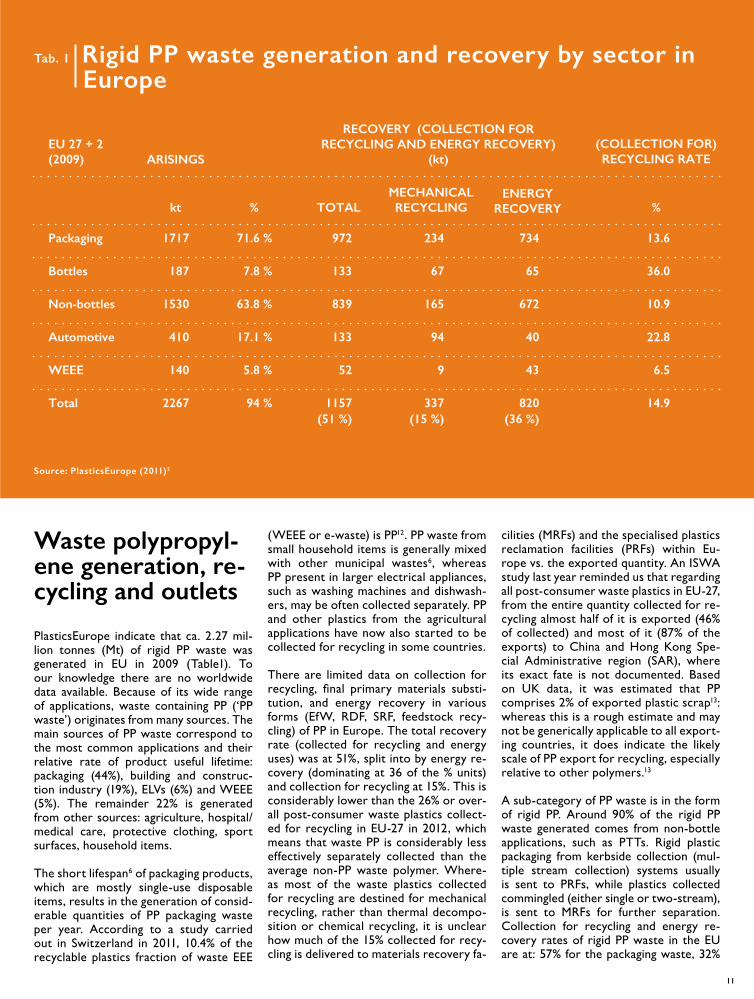
PlasticsEurope indicate that ca. 2.27 mil-lion tonnes (Mt) of rigid PP waste was generated in EU in 2009 (Table1). To our knowledge there are no worldwide data available. Because of its wide range of applications, waste containing PP (‘PP waste’) originates from many sources. The main sources of PP waste correspond to the most common applications and their relative rate of product useful lifetime: packaging (44%), building and construc-tion industry (19%), ELVs (6%) and WEEE (5%). The remainder 22% is generated from other sources: agriculture, hospital/medical care, protective clothing, sport surfaces, household items.
The short lifespan6 of packaging products, which are mostly single-use disposable items, results in the generation of consid-erable quantities of PP packaging waste per year. According to a study carried out in Switzerland in 2011, 10.4% of the recyclable plastics fraction of waste EEE
Waste polypropyl-ene generation, re-cycling and outlets
(WEEE or e-waste) is PP12. PP waste from small household items is generally mixed with other municipal wastes6, whereas PP present in larger electrical appliances, such as washing machines and dishwash-ers, may be often collected separately. PP and other plastics from the agricultural applications have now also started to be collected for recycling in some countries. There are limited data on collection for recycling, final primary materials substi-tution, and energy recovery in various forms (EfW, RDF, SRF, feedstock recy-cling) of PP in Europe. The total recovery rate (collected for recycling and energy uses) was at 51%, split into by energy re-covery (dominating at 36 of the % units) and collection for recycling at 15%. This is considerably lower than the 26% or over-all post-consumer waste plastics collect-ed for recycling in EU-27 in 2012, which means that waste PP is considerably less effectively separately collected than the average non-PP waste polymer. Where-as most of the waste plastics collected for recycling are destined for mechanical recycling, rather than thermal decompo-sition or chemical recycling, it is unclear how much of the 15% collected for recy-cling is delivered to materials recovery fa-
cilities (MRFs) and the specialised plastics reclamation facilities (PRFs) within Eu-rope vs. the exported quantity. An ISWA study last year reminded us that regarding all post-consumer waste plastics in EU-27, from the entire quantity collected for re-cycling almost half of it is exported (46% of collected) and most of it (87% of the exports) to China and Hong Kong Spe-cial Administrative region (SAR), where its exact fate is not documented. Based on UK data, it was estimated that PP comprises 2% of exported plastic scrap13: whereas this is a rough estimate and may not be generically applicable to all export-ing countries, it does indicate the likely scale of PP export for recycling, especially relative to other polymers.13
A sub-category of PP waste is in the form of rigid PP. Around 90% of the rigid PP waste generated comes from non-bottle applications, such as PTTs. Rigid plastic packaging from kerbside collection (mul-tiple stream collection) systems usually is sent to PRFs, while plastics collected commingled (either single or two-stream), is sent to MRFs for further separation. Collection for recycling and energy re-covery rates of rigid PP waste in the EU are at: 57% for the packaging waste, 32%
Tab. 1 Rigid PP waste generation and recovery by sector in Europe
Source: PlasticsEurope (2011)5
12
for the automotive industry and 37% for the WEEE. A large amount (70%) of the total rigid PP recovered from the auto-motive sector in the EU is mechanical recycled, while 83% and 76% of the total rigid PP recovered from WEEE and pack-aging respectively go to energy recovery. Germany had in 2011 the highest collec-tion for recycling rate of rigid PP (~33%), which was around 3 times more than the rate achieved at other EU countries, which were below 13%.5 Germany has been col-lecting packaging plastics in the ‘yellow bin’ along with rest packaging for many years and is now moving to a new system (‘yel-low bin plus’), which aspires to increase the collection rate by collecting all plastics. In addition to packaging items, this recy-cling bin also can accept non-packaging everyday items made of plastics and metals such as toys, pans and plastic buckets. Bat-tery cases and bumpers from the automo-tive industry also play a non-negligible role in rigid PP recycling chain in Germany.5
There are some established and evolving markets for recycled PP (rPP), including automotive applications, construction and building products, food packaging and other households articles (bins, buckets, boxes, crates and cradles). Despite the existence of these markets, the overall rates of waste PP collected for recycling are very low com-pared to other major polymers such as PET and HDPE, because PP is used in various grades and combined with other materials in laminate or metallised film structures making identification and separation diffi-cult.6 The different sources, types, grades, qualities and shapes in PP products often make also the mechanical recycling a com-plex endeavour.
Vehicle applications have become a high-end market for rPP. PP allows potentially easier recovery and reuse of components when a vehicle’s lifetime is over. Car interior components with up to 60% of rPP, sourced from the automotive industry is currently commercialized – a case of closing the loop. The construction industry also represents an important potential market opportunity for large quantities of rPP.14 Pipes, wire and cable covering, and wood-plastic compos-ites (WPCs) are uses for recycled polyolefin in general. rPP has been successfully used to manufacture WPCs and plastic boxes.13
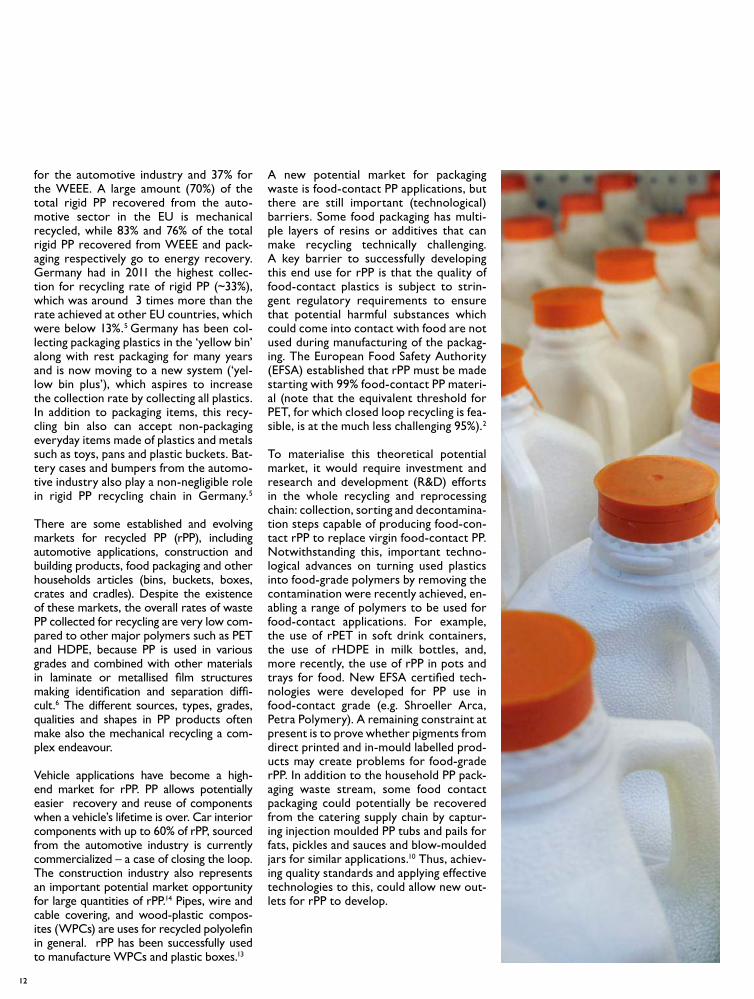
A new potential market for packaging waste is food-contact PP applications, but there are still important (technological) barriers. Some food packaging has multi-ple layers of resins or additives that can make recycling technically challenging. A key barrier to successfully developing this end use for rPP is that the quality of food-contact plastics is subject to strin-gent regulatory requirements to ensure that potential harmful substances which could come into contact with food are not used during manufacturing of the packag-ing. The European Food Safety Authority (EFSA) established that rPP must be made starting with 99% food-contact PP materi-al (note that the equivalent threshold for PET, for which closed loop recycling is fea-sible, is at the much less challenging 95%).2
To materialise this theoretical potential market, it would require investment and research and development (R&D) efforts in the whole recycling and reprocessing chain: collection, sorting and decontamina-tion steps capable of producing food-con-tact rPP to replace virgin food-contact PP. Notwithstanding this, important techno-logical advances on turning used plastics into food-grade polymers by removing the contamination were recently achieved, en-abling a range of polymers to be used for food-contact applications. For example, the use of rPET in soft drink containers, the use of rHDPE in milk bottles, and, more recently, the use of rPP in pots and trays for food. New EFSA certified tech-nologies were developed for PP use in food-contact grade (e.g. Shroeller Arca, Petra Polymery). A remaining constraint at present is to prove whether pigments from direct printed and in-mould labelled prod-ucts may create problems for food-grade rPP. In addition to the household PP pack-aging waste stream, some food contact packaging could potentially be recovered from the catering supply chain by captur-ing injection moulded PP tubs and pails for fats, pickles and sauces and blow-moulded jars for similar applications.10 Thus, achiev-ing quality standards and applying effective technologies to this, could allow new out-lets for rPP to develop.
13
Mechanical recyclingMechanical recycling (no chemical trans-formation involved) is a well-established and widely applied technology for produc-ing rPP. Typically and simplifying, waste PP is separated at source and collected along with other plastics or together with other dry recyclables (single stream or commin-gled collection). The collected material is processed in PRFs and MRFs where PP is sorted from other polymers by the use of a variety of separation technologies. Finally, the material is transported to reproces-sors, where waste PP is re-melted and ex-truded to form flakes or pellets2 of rPP.
Feedstock recycling. Feedstock recycling by means of pyrolysis or gasification (ther-mal processing) can be more suitable than mechanical recycling for contaminated and very heterogeneous mixes of wastes (e.g. automotive and electronic shredder residues) containing PP mixed with other polymers. If applied appropriately, it can provide a valuable and efficient use of the energy and materials value embodied in waste plastics. However, such solutions are not yet at applied commercially: one limiting factor is that large economies of scale are needed for investing in such types of processing. It also relates to the amount of waste plastics collected for re-cycling, which are still insufficient. Much greater levels of plastics polymer collec-tion would be needed to provide the se-cure feedstock at the appropriate scale for feedstock recycling to become viable. Feedstock, so called, ‘recycling’ of non-re-cyclable PP and other polymers can be also performed by their use as raw ma-terial in blast furnaces. PP cannot be de-graded by the simple addition of chemicals (through alcoholysis, hydrolysis, glycolysis and methanolysis) to their initial mono-mers due to the random scission of the C-C bounds15, so chemical recycling is not an option.
There exist many competitive routes to resource recovery for PP as a fuel, via direct combustion energy from waste (EfW) as part of mixed residual waste, or via the simple sorting for the preparation of a refuse-derived fuel (RDF) send also to EfW plants; or through the much more sophisticated quality assured solid recov-ered fuel (SRF)16 suitable for recovery in
Closing the PP material loop: technologies and processing
cement kilns, power plants and other high energy demand industries, customarily re-placing coal. Processing solutions to liquid fuels also emerge.17
Technical challengesHence, mechanical recycling is the most viable and established route for closing the materials loop for PP today. However, there are important technical challenges which impede the effective closing of the loop for PP. A key disadvantage of mechan-ical recycling of polymers is that it can only be performed on a pure polymer. Sepa-ration technologies are needed to sort complex mixtures of plastic wastes into single polymer outputs and at the same time remove (adhesive) contaminants and unwanted items (contraries). The majori-ty of separation technologies for polymer types are based on density separation (air classification, cyclones, hydro-cyclones, centrifuges, float-sink) and/or spectropho-tometric properties (Near-infrared (NIR), mid-infrared (MIR), Raman spectroscopy, X-Ray Fluorescence spectroscopy, X-Ray detection, laser sorting). The major poly-mers currently separated for reprocessing in MRFs are PET and HDPE.
Because the technology to separate PP and PE already exists in the market, in the last few years an increasing number of MRFs have started to sort a wider range of polymers from packaging waste, including PP received in the form of PTTs. Density-based sorting technologies can separate polyolefin polymers (PP, PE) from other denser resins (PS, PVC, PET, PS). However, they are neither capable of sorting polymers with similar density (PP, PE) nor polymers containing physi-cal additives (i.e. PP with fibres used in construction and automotive industries) that may change the density of the sin-gle resin. This problem is solved by using sensor-based separation (NIR) able to distinguish between most of the polymer types, PP and PE included. Despite the capital investment cost, in Europe, the use of NIR sorting equipment to sepa-rate plastic polymers in MFRs is already widespread. However, the investment required to purchase NIR sorting units for different polymers is high and most of the small material recovery facilities can-not afford it. Separation is further com-
plicated by increased use of multi-layer packaging.
Whereas these technologies are able to successfully sort the major polymer groups18, they are not capable of identify-ing carbon-black polymers, which results in a significant reclaim loss for PP materi-als.19 A potential solution for sorting black PP, currently tested at pilot scale, is the use of a baffled oscillation reactor using water for the separation. This method, stemming from mixing pharmaceutical liq-uids, can split the lighter fraction into two plastic types, PP and PE, while the heavier fraction sinks, giving a third output mate-rial. Another solution explored is the use of alternative colourants to increase the efficiency of NIR separation technologies. Such colourants would need to be suffi-ciently stable for repeated reprocessing through conventional processes. Howev-er, many of these alternative colourants do not currently match carbon-black for tint strength or price.18
Another disadvantage of the currently commercially available technology is its inability to distinguish between non-food and food contact PP. Keeping in mind that around 60-70% of the PP used in packag-ing applications is food contact this makes it difficult to close the material loop for food grade PP back into same specifica-tion applications. This serves as a barrier to provide the material needed for de-veloping new markets for recycled food contact packaging. An alternative solution to NIR can be the use of MIR technolo-gy, which is able to detect carbon black plastics; however, this technology is still in commercial development due to technical and processing limitations.20, 21 In addition, NIR technology finds it hard to distinguish between different grades of the same pol-ymer.
14
PP Production and ConsumptionThe global PP market is the second larg-est volume polymer business in the world today, making up 25% of entire polymer demand22, according to IHS. Assuming a global production of plastics in the region of 299 Mt in 2013, this would be equal to around 75 Mt of PP produced globally per year. Production of PP has gradually shift-ed from areas where historically demand was high (e.g. Europe) to areas where feedstock costs are low (e.g. Middle East and Asia).23 The shift is evident also in con-sumption: China accounted for the 28% of global PP consumption in 2013.24 Regard-ing sectors, ‘other’ applications accounted for 41% of the end-use in 2013, followed by packaging (32%), EEE (14%) and equip-ment and facilities (13%), based on data from AMI, according to EcoSphere.17
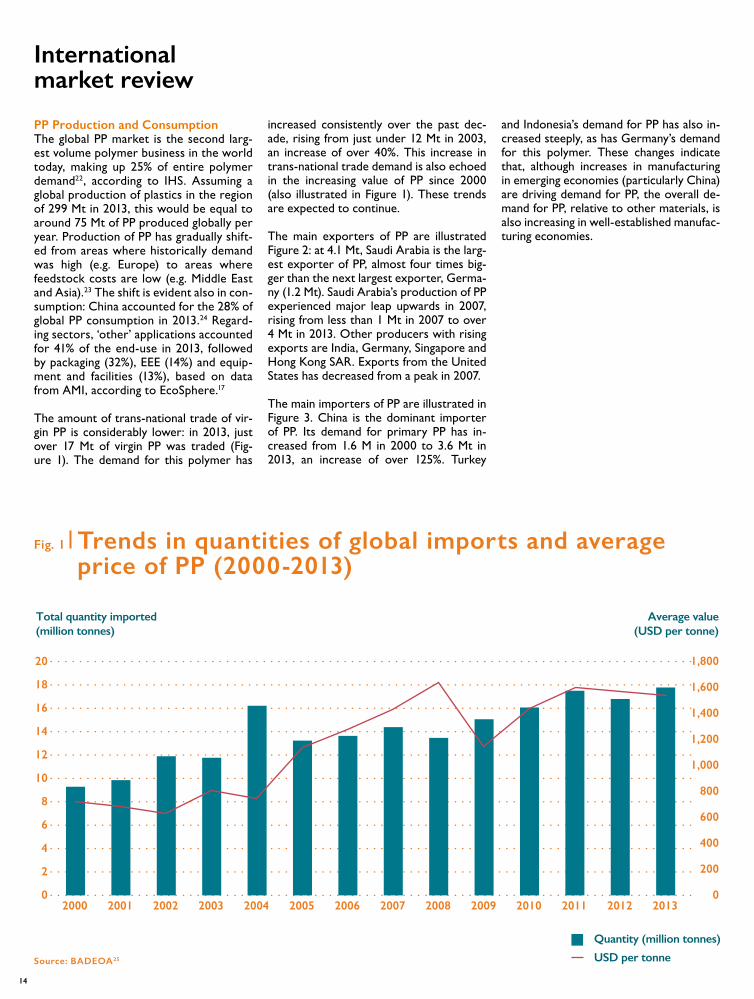
The amount of trans-national trade of vir-gin PP is considerably lower: in 2013, just over 17 Mt of virgin PP was traded (Fig-ure 1). The demand for this polymer has
International market review
increased consistently over the past dec-ade, rising from just under 12 Mt in 2003, an increase of over 40%. This increase in trans-national trade demand is also echoed in the increasing value of PP since 2000 (also illustrated in Figure 1). These trends are expected to continue.
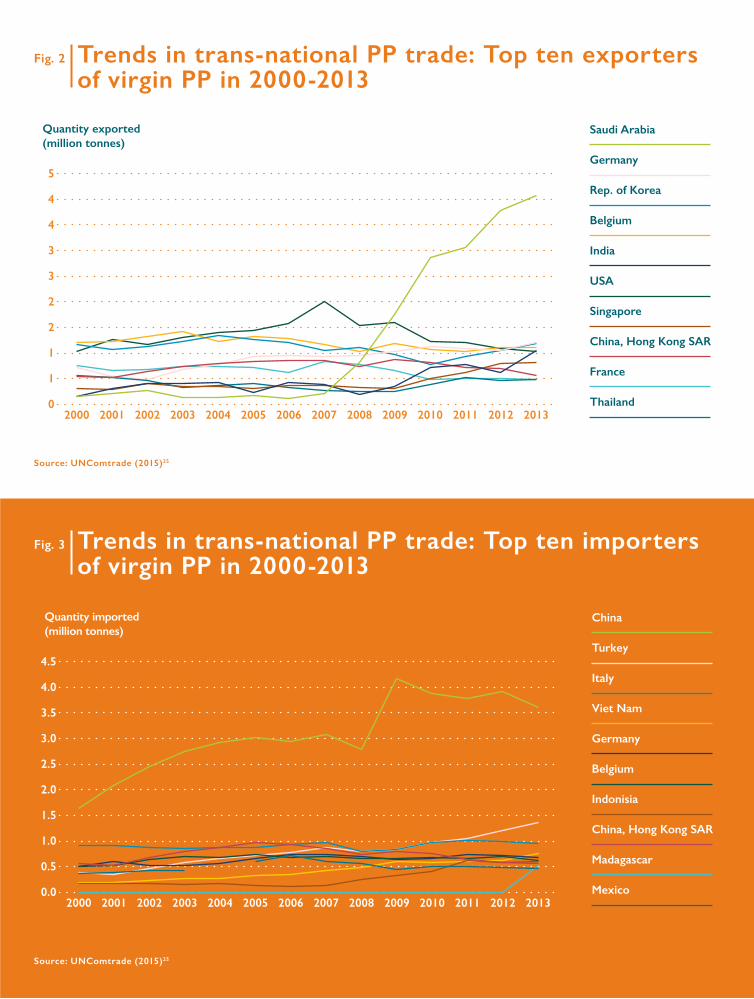
The main exporters of PP are illustrated Figure 2: at 4.1 Mt, Saudi Arabia is the larg-est exporter of PP, almost four times big-ger than the next largest exporter, Germa-ny (1.2 Mt). Saudi Arabia’s production of PP experienced major leap upwards in 2007, rising from less than 1 Mt in 2007 to over 4 Mt in 2013. Other producers with rising exports are India, Germany, Singapore and Hong Kong SAR. Exports from the United States has decreased from a peak in 2007.
The main importers of PP are illustrated in Figure 3. China is the dominant importer of PP. Its demand for primary PP has in-creased from 1.6 M in 2000 to 3.6 Mt in 2013, an increase of over 125%. Turkey
and Indonesia’s demand for PP has also in-creased steeply, as has Germany’s demand for this polymer. These changes indicate that, although increases in manufacturing in emerging economies (particularly China) are driving demand for PP, the overall de-mand for PP, relative to other materials, is also increasing in well-established manufac-turing economies.
Fig. 1 Trends in quantities of global imports and average price of PP (2000-2013)
Source: BADEOA25
15
Fig. 3 Trends in trans-national PP trade: Top ten importers of virgin PP in 2000-2013
Fig. 2 Trends in trans-national PP trade: Top ten exporters of virgin PP in 2000-2013
Source: UNComtrade (2015)25
Source: UNComtrade (2015)25
16
Market realities and trends in recy-cled PP
There is very little data on the levels and prices of trade in PP scrap. Due to difficul-ties associated with the separation of this material from other polymers, the majority of recycled PP is thought to be traded as a component of mixed recycled plastics. Giv-en that China and Hong Kong SAR domi-nated until recently the global imports of plastic scrap26 most of this material could have been exported to China, where it is assumed to be either separated for recy-cling or disposed of with rejected materi-als. According to Zhang, waste PP import-ed in China mainly comes in the form of mixed plastics and is used to manufacture hangers, pipes, trays, and batteries.27
China is the dominant destination for recy-cled plastics and its demand for scrap plas-tics has consistently grown over the past 10-20 years. Demand for recycled plastics in China is expected to have grown to 29 Mt by 2015, 65% higher than 2009 figures. If we generalise from the UK situation and assume that PP comprises 2% of mixed waste plastics imported into China, then this would suggest a total of just 75,000 tonnes (t) of PP scrap exported to China in 2013. However, this is highly speculative.
Despite the relatively low level of export of rPP to China, there is thought to be considerable demand in China for recy-cled PP for use in packaging applications such as fertiliser and cement bags.13 This demand is likely to grow in-line with the overall growth in plastics demand in Chi-na. Commentary in the literature also suggests that the Indian plastics conver-sion sector is growing rapidly and so is also likely to become a strong market for recovered plastic polymers of good quali-ty, including PP.
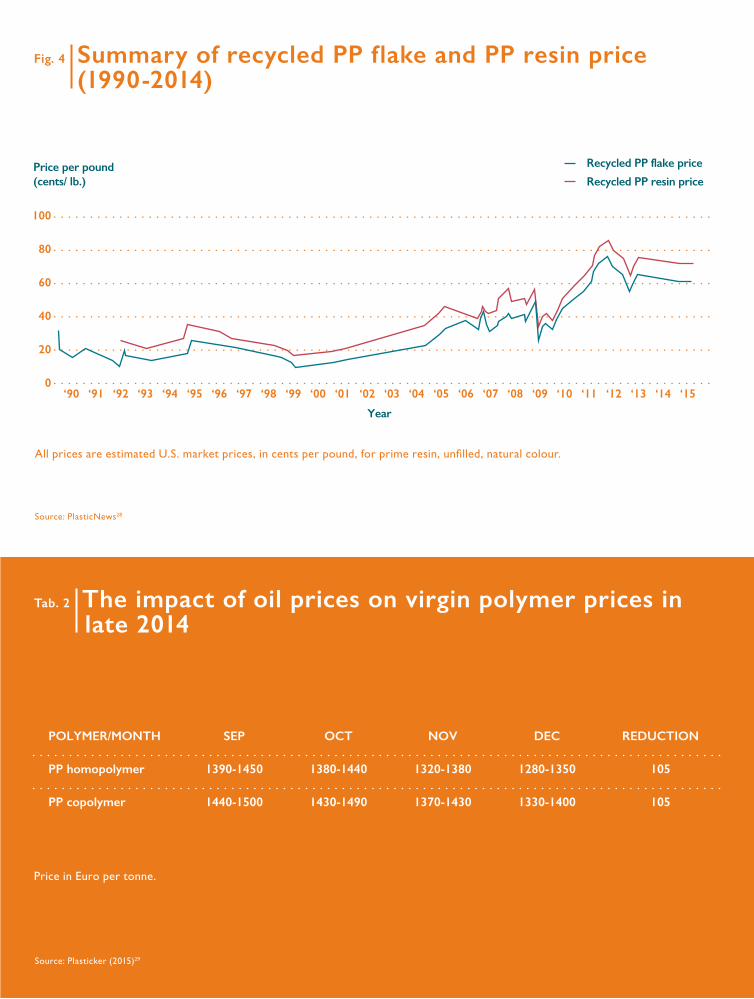
This increase in demand is echoed in the increasing value of PP since 2000. The fig-ures below (Figure 4) illustrate the change in recycled PP resin and flake prices in the United States since 1990.
The very limited extent of separate PP re-cycling and recovery goes some way to explain the lack of data on rPP prices and market trends, at least in sources available in the public domain. For instance, the UN Comtrade database collates data on the overall levels of traded plastic scrap and the quantities and values of PE, PS and PVC, but not for PP. Other sources in the waste sector media (for example: Letsrecycle and Materi-als Recycling Weekly in the UK) present only information for the most commonly trad-ed polymers (LDPE, HDPE and PET). If the markets for secondary materials, including rPP are to be improved, it would require an effective flow of information, including clear pricing. At present, information on markets and the mechanisms for the effective trade of waste plastics is poor. To facilitate this pro-cess, the collection, analysis and provision of good quality data on markets is important. The waste management sector has a role to play in establishing, maintaining the systems necessary to collect the data necessary to allow markets to function properly.
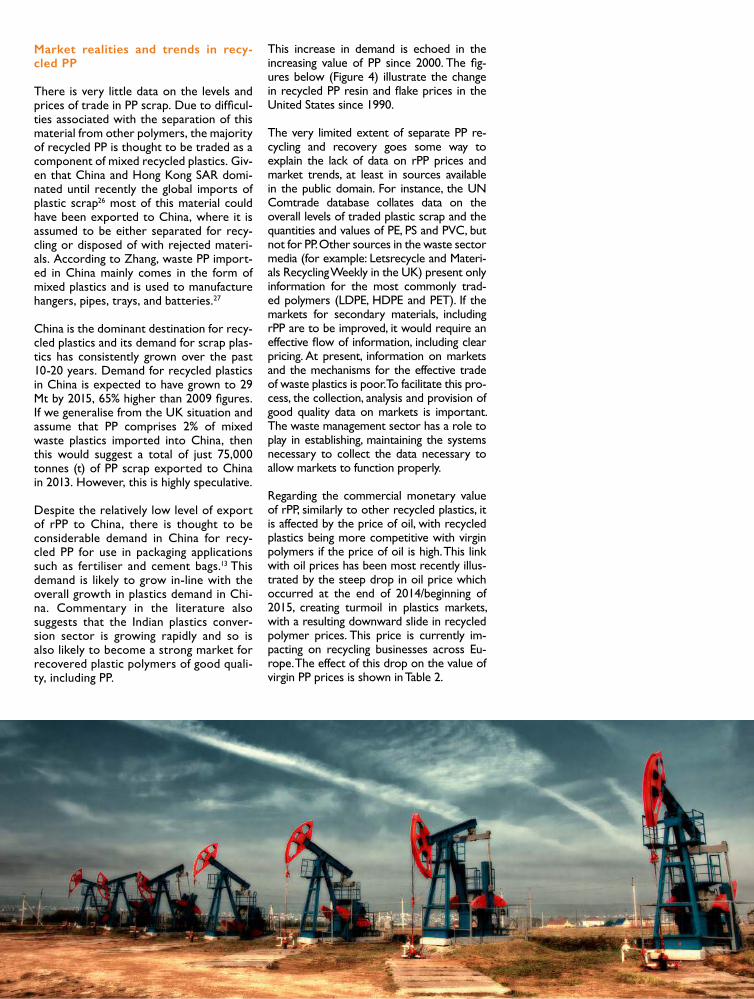
Regarding the commercial monetary value of rPP, similarly to other recycled plastics, it is affected by the price of oil, with recycled plastics being more competitive with virgin polymers if the price of oil is high. This link with oil prices has been most recently illus-trated by the steep drop in oil price which occurred at the end of 2014/beginning of 2015, creating turmoil in plastics markets, with a resulting downward slide in recycled polymer prices. This price is currently im-pacting on recycling businesses across Eu-rope. The effect of this drop on the value of virgin PP prices is shown in Table 2.
17
Fig. 4 Summary of recycled PP flake and PP resin price (1990-2014)
Tab. 2 The impact of oil prices on virgin polymer prices in late 2014
Price in Euro per tonne.
Source: PlasticNews28
Source: Plasticker (2015)29
All prices are estimated U.S. market prices, in cents per pound, for prime resin, unfilled, natural colour.
18
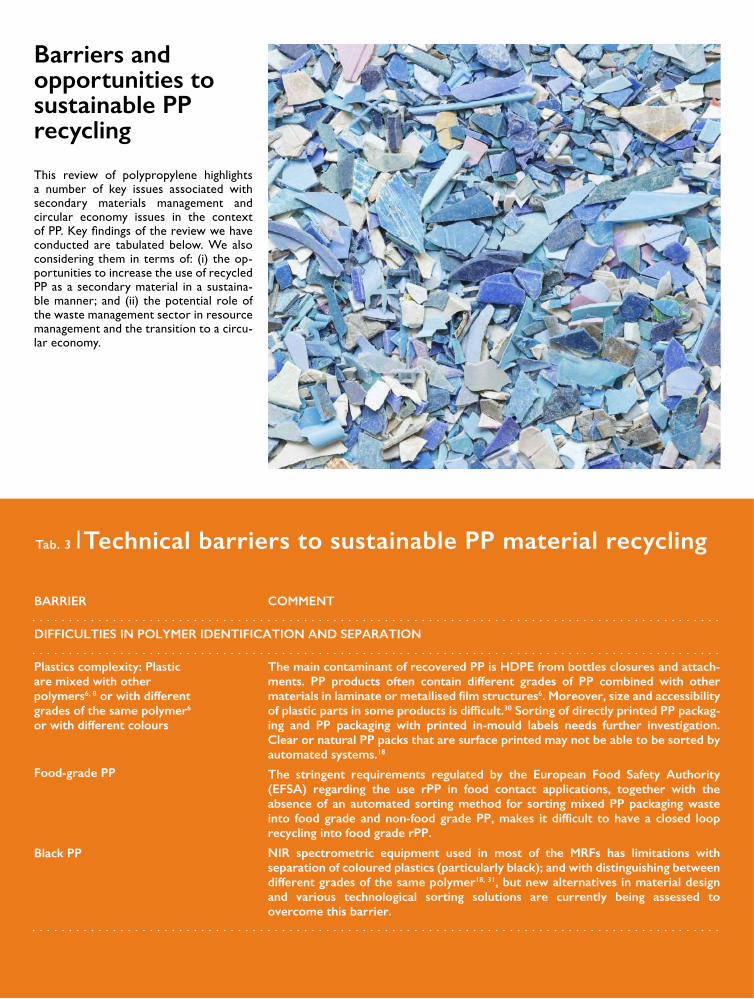
This review of polypropylene highlights a number of key issues associated with secondary materials management and circular economy issues in the context of PP. Key findings of the review we have conducted are tabulated below. We also considering them in terms of: (i) the op-portunities to increase the use of recycled PP as a secondary material in a sustaina-ble manner; and (ii) the potential role of the waste management sector in resource management and the transition to a circu-lar economy.
Barriers and opportunities to sustainable PP recycling
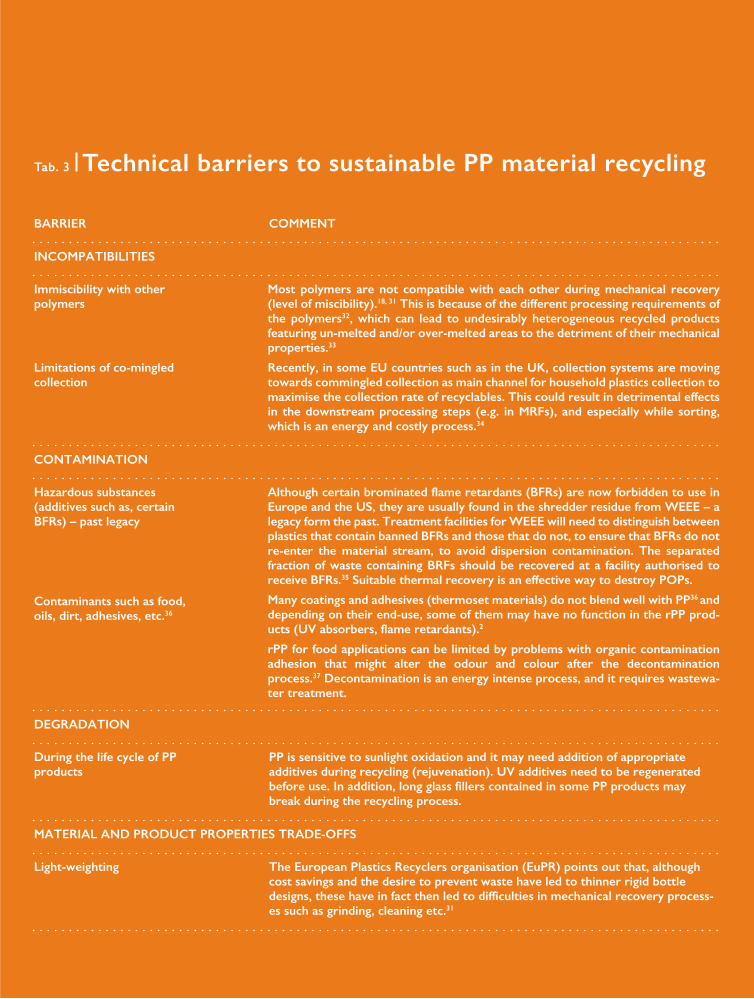
Tab. 3 Technical barriers to sustainable PP material recycling
19
Tab. 3 Technical barriers to sustainable PP material recycling
20
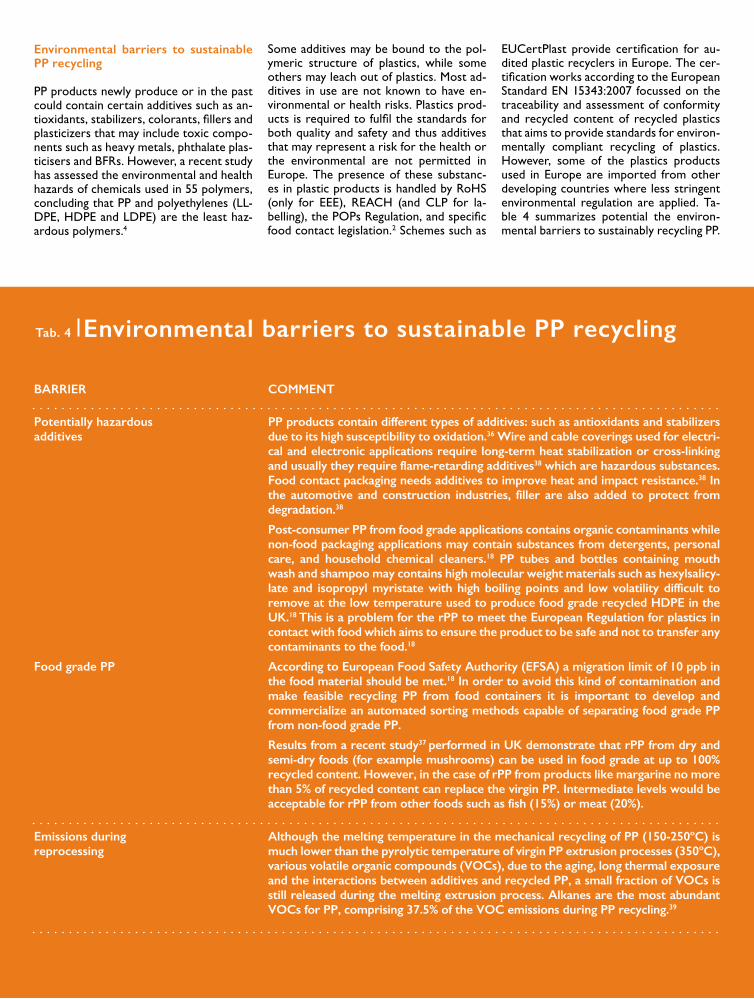
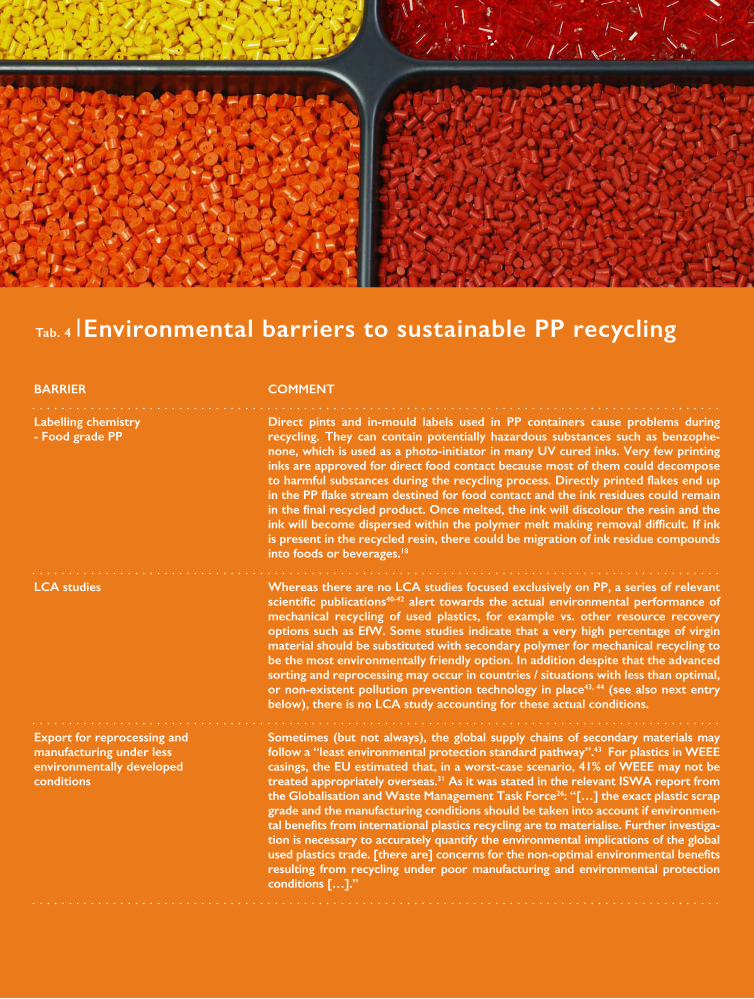
Environmental barriers to sustainable PP recycling
PP products newly produce or in the past could contain certain additives such as an-tioxidants, stabilizers, colorants, fillers and plasticizers that may include toxic compo-nents such as heavy metals, phthalate plas-ticisers and BFRs. However, a recent study has assessed the environmental and health hazards of chemicals used in 55 polymers, concluding that PP and polyethylenes (LL-DPE, HDPE and LDPE) are the least haz-ardous polymers.4
Some additives may be bound to the pol-ymeric structure of plastics, while some others may leach out of plastics. Most ad-ditives in use are not known to have en-vironmental or health risks. Plastics prod-ucts is required to fulfil the standards for both quality and safety and thus additives that may represent a risk for the health or the environmental are not permitted in Europe. The presence of these substanc-es in plastic products is handled by RoHS (only for EEE), REACH (and CLP for la-belling), the POPs Regulation, and specific food contact legislation.2 Schemes such as
Tab. 4 Environmental barriers to sustainable PP recycling
EUCertPlast provide certification for au-dited plastic recyclers in Europe. The cer-tification works according to the European Standard EN 15343:2007 focussed on the traceability and assessment of conformity and recycled content of recycled plastics that aims to provide standards for environ-mentally compliant recycling of plastics. However, some of the plastics products used in Europe are imported from other developing countries where less stringent environmental regulation are applied. Ta-ble 4 summarizes potential the environ-mental barriers to sustainably recycling PP.
21
Tab. 4 Environmental barriers to sustainable PP recycling
22
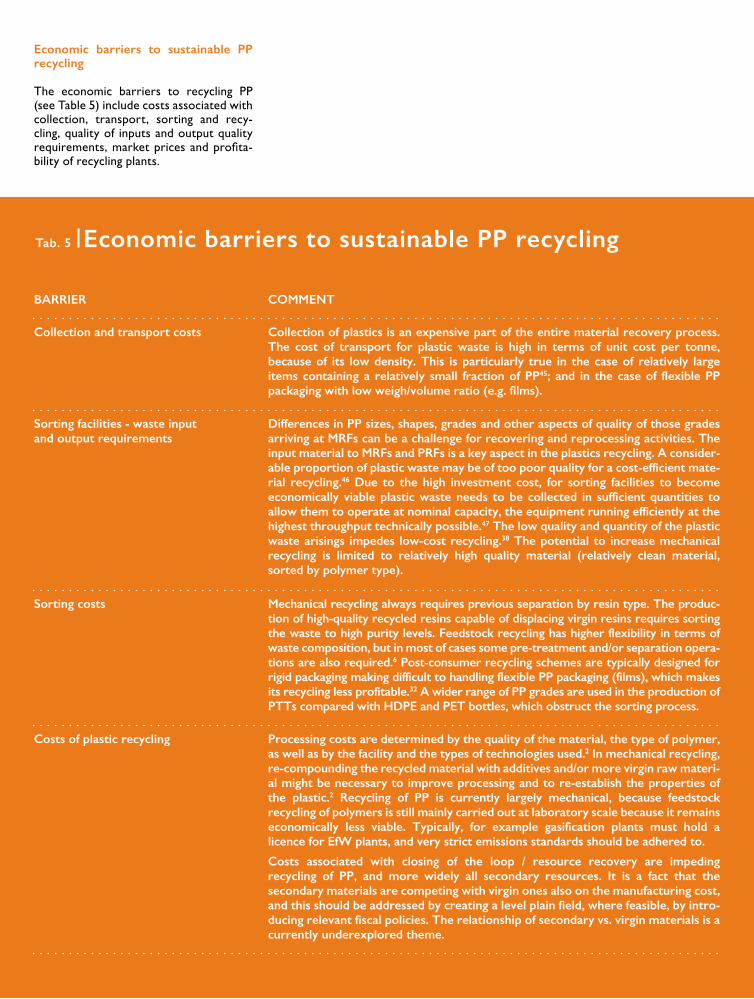
Economic barriers to sustainable PP recycling
The economic barriers to recycling PP (see Table 5) include costs associated with collection, transport, sorting and recy-cling, quality of inputs and output quality requirements, market prices and profita-bility of recycling plants.
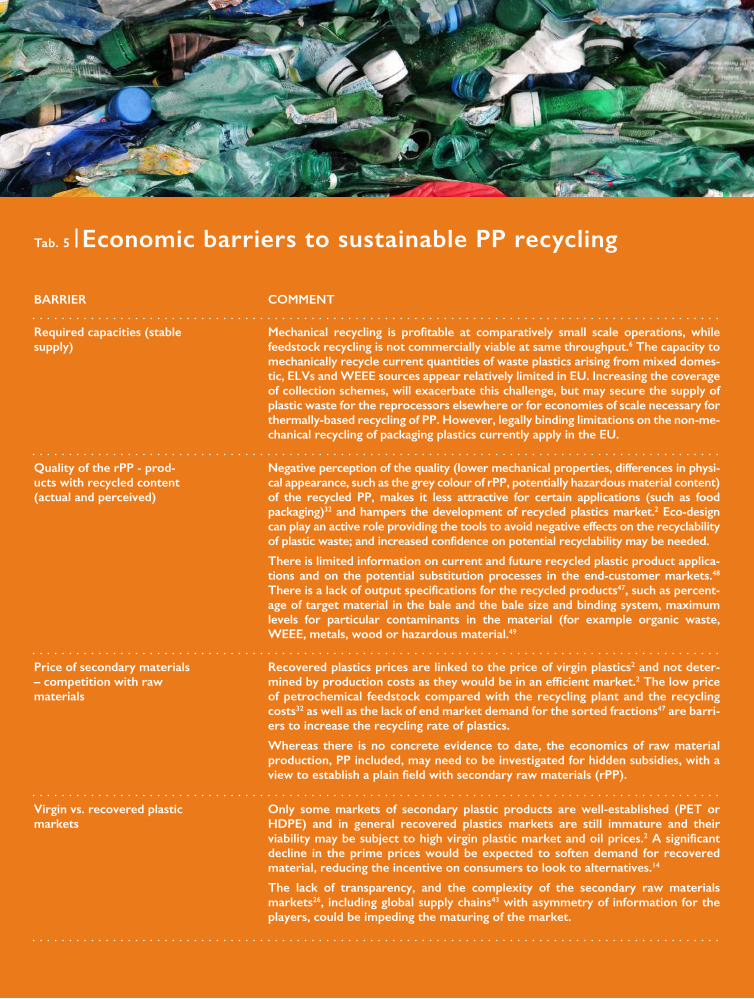
Tab. 5 Economic barriers to sustainable PP recycling
23
Tab. 5 Economic barriers to sustainable PP recycling
24
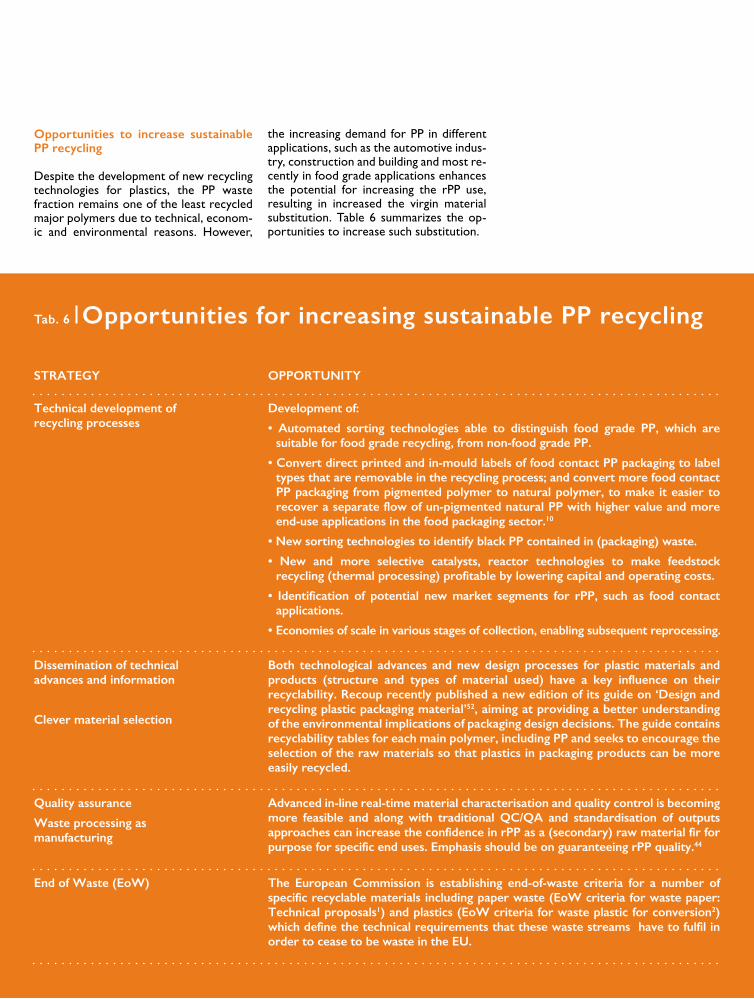
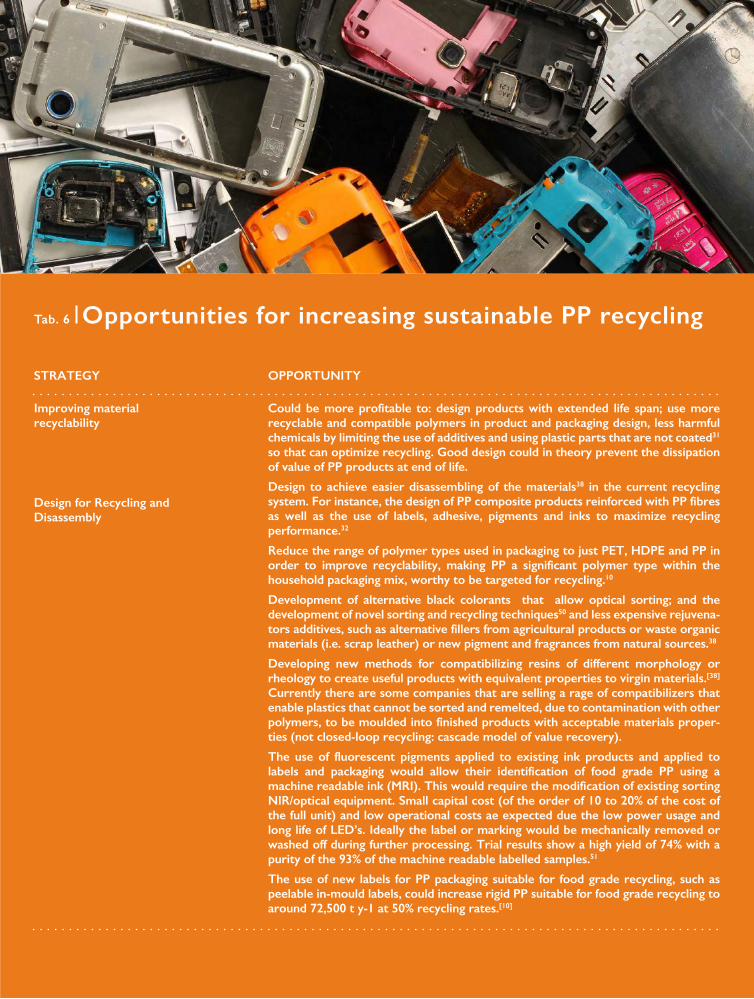
Tab. 6 Opportunities for increasing sustainable PP recycling
Opportunities to increase sustainable PP recycling
Despite the development of new recycling technologies for plastics, the PP waste fraction remains one of the least recycled major polymers due to technical, econom-ic and environmental reasons. However,
the increasing demand for PP in different applications, such as the automotive indus-try, construction and building and most re-cently in food grade applications enhances the potential for increasing the rPP use, resulting in increased the virgin material substitution. Table 6 summarizes the op-portunities to increase such substitution.
25
Tab. 6 Opportunities for increasing sustainable PP recycling
26
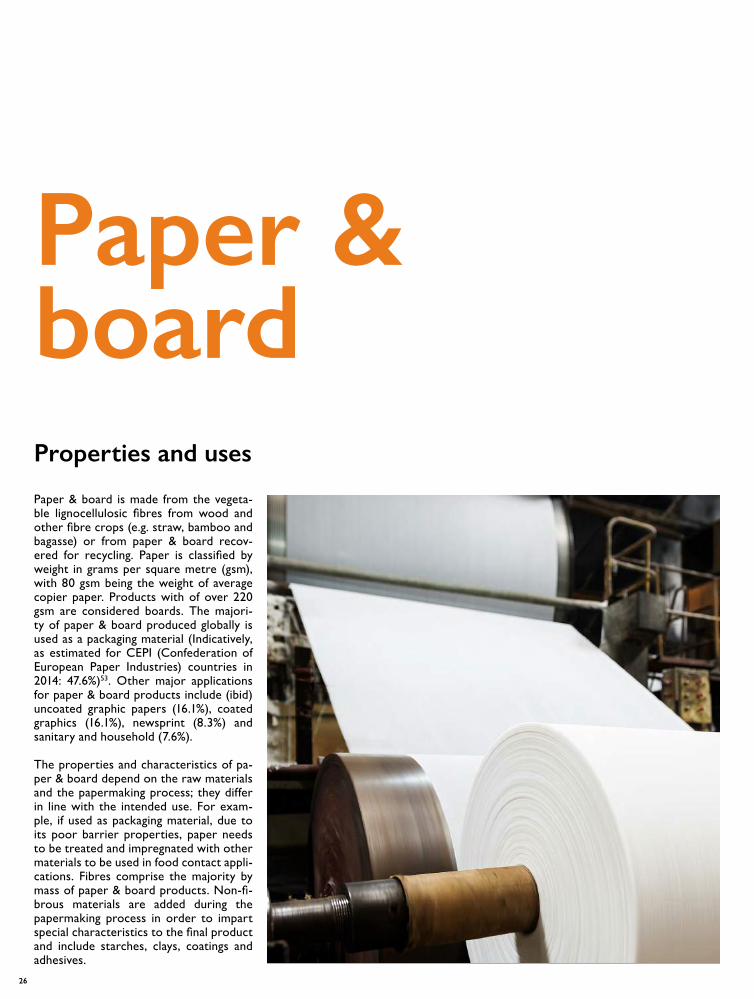
Paper & board is made from the vegeta-ble lignocellulosic fibres from wood and other fibre crops (e.g. straw, bamboo and bagasse) or from paper & board recov-ered for recycling. Paper is classified by weight in grams per square metre (gsm), with 80 gsm being the weight of average copier paper. Products with of over 220 gsm are considered boards. The majori-ty of paper & board produced globally is used as a packaging material (Indicatively, as estimated for CEPI (Confederation of European Paper Industries) countries in 2014: 47.6%)53. Other major applications for paper & board products include (ibid) uncoated graphic papers (16.1%), coated graphics (16.1%), newsprint (8.3%) and sanitary and household (7.6%).
The properties and characteristics of pa-per & board depend on the raw materials and the papermaking process; they differ in line with the intended use. For exam-ple, if used as packaging material, due to its poor barrier properties, paper needs to be treated and impregnated with other materials to be used in food contact appli-cations. Fibres comprise the majority by mass of paper & board products. Non-fi-brous materials are added during the papermaking process in order to impart special characteristics to the final product and include starches, clays, coatings and adhesives.
Paper & boardProperties and uses
27
Paper is a relatively easy material to re-cycle, with well-established closed-loop and/or cascade cycles. Recycled fibres are a key part of the material supply for the manufacturing of new paper & board products. According to European Recov-ered Paper Council (ERPC), over 60 Mt of waste paper and card are collected for recycling in Europe.3 Collection for recy-cling in Europe has reached the level of 72%, according to CEPI, the highest of all continents, resulting in around ‘54% of the paper industry’s raw material to comes from recovered paper & board’54 (the CEPI and ERPC estimates may not cover the same European countries/years). However, the ‘recovered’ paper collection rates do not accurately reflect the actual situation re-garding fibre recycling, because in most cases the paper & board that is collected and delivered to a paper mill and loaded into a pulper does not include only fibre,
Paper & board waste generation, recycling and outlets
but also several other substances such as minerals, starch, additives, inks, coating materials, non-paper components etc. Of-ficial collection and utilisation rates do not exactly describe fibre resource recovery.
According to ERPC, approximately 70% of paper & board from waste packaging was collected for recycled in 2014, which was the highest collection for recycling rate of all packaging materials.3 In Europe, 50% of the paper & board waste was collected from commercial and industrial sources, 10% from offices and the remaining 40% is collected from households, either in sep-arate or commingled collection systems together with other recyclates.3
Standards and good manufacturing prac-tices have been set up by the paper in-dustry to improve the recycling3: (i) the European Declaration on Paper Recy-cling which promotes the increase in the recycling rate; (ii) the Confederation of European Paper Industries guidelines for recovered paper, (iii) the European list of standard grades of paper & board for recycling (EN 643), which lists different grades of recovered paper and sets limits on contamination, (iv) the Recovered Pa-per Identification System and the Council
of Europe Resolution on paper & board materials and articles intended to come into contact with foodstuffs.
Recently (February 2014) in Europe, the categorisation of types and qualities of the so-called ‘recovered’ paper (or more accurately ‘paper & board for recycling’) were harmonised, being classified into 57 grades according to the revised European list of standard grades of paper & board for recycling EN 643. The standard divides recovered paper into five groups: ordinary grades, medium grades, high grades, craft grades and special grades. Each of these groups has further subgroups that specify the recovered paper grade at a detailed level. The EN 643 also defines and sets tolerance levels such as unusable ma-terials, non-paper components, paper & board detrimental to production and moisture content.
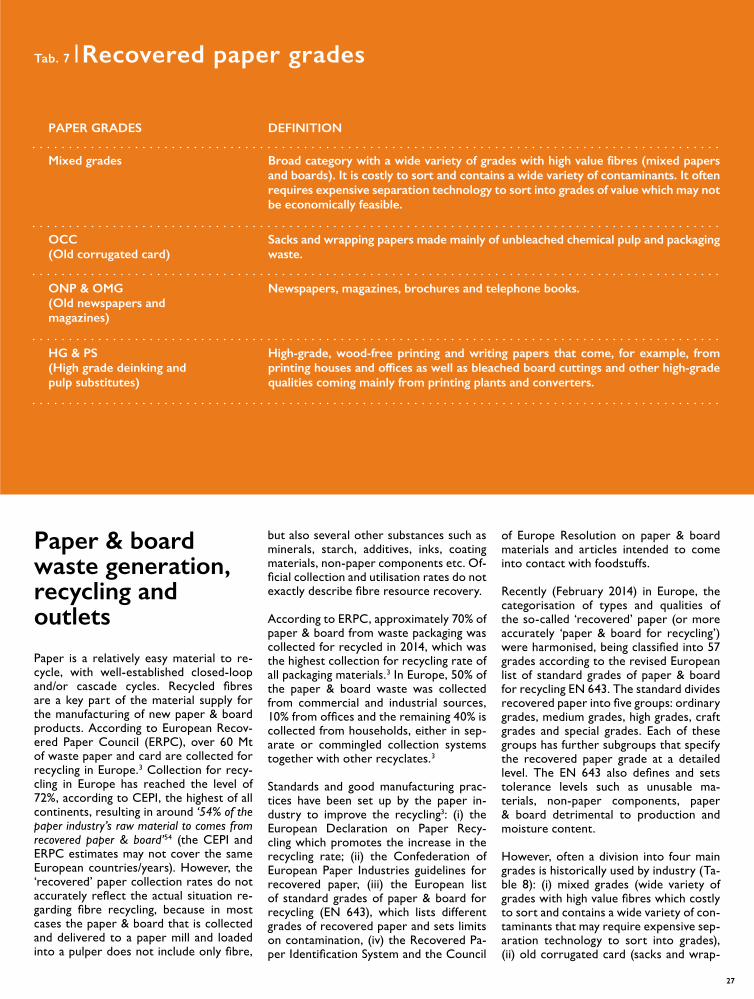
However, often a division into four main grades is historically used by industry (Ta-ble 8): (i) mixed grades (wide variety of grades with high value fibres which costly to sort and contains a wide variety of con-taminants that may require expensive sep-aration technology to sort into grades), (ii) old corrugated card (sacks and wrap-
Tab. 7 Recovered paper grades
28
ping papers made mainly of unbleached chemical pulp and packaging waste), (iii) old newspapers and magazines and (iv) high grade deinking and pulp substitutes (from printing houses and offices as well as bleached board cuttings and other high-grade qualities coming mainly from print-ing plants and converters).
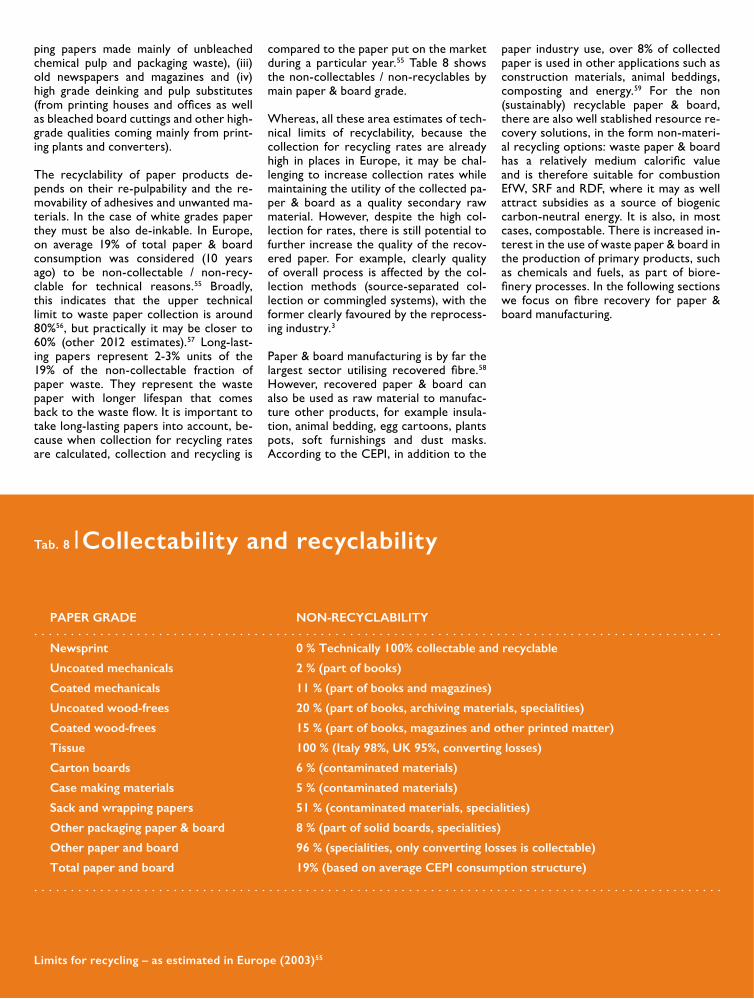
The recyclability of paper products de-pends on their re-pulpability and the re-movability of adhesives and unwanted ma-terials. In the case of white grades paper they must be also de-inkable. In Europe, on average 19% of total paper & board consumption was considered (10 years ago) to be non-collectable / non-recy-clable for technical reasons.55 Broadly, this indicates that the upper technical limit to waste paper collection is around 80%56, but practically it may be closer to 60% (other 2012 estimates).57 Long-last-ing papers represent 2-3% units of the 19% of the non-collectable fraction of paper waste. They represent the waste paper with longer lifespan that comes back to the waste flow. It is important to take long-lasting papers into account, be-cause when collection for recycling rates are calculated, collection and recycling is
compared to the paper put on the market during a particular year.55 Table 8 shows the non-collectables / non-recyclables by main paper & board grade.
Whereas, all these area estimates of tech-nical limits of recyclability, because the collection for recycling rates are already high in places in Europe, it may be chal-lenging to increase collection rates while maintaining the utility of the collected pa-per & board as a quality secondary raw material. However, despite the high col-lection for rates, there is still potential to further increase the quality of the recov-ered paper. For example, clearly quality of overall process is affected by the col-lection methods (source-separated col-lection or commingled systems), with the former clearly favoured by the reprocess-ing industry.3
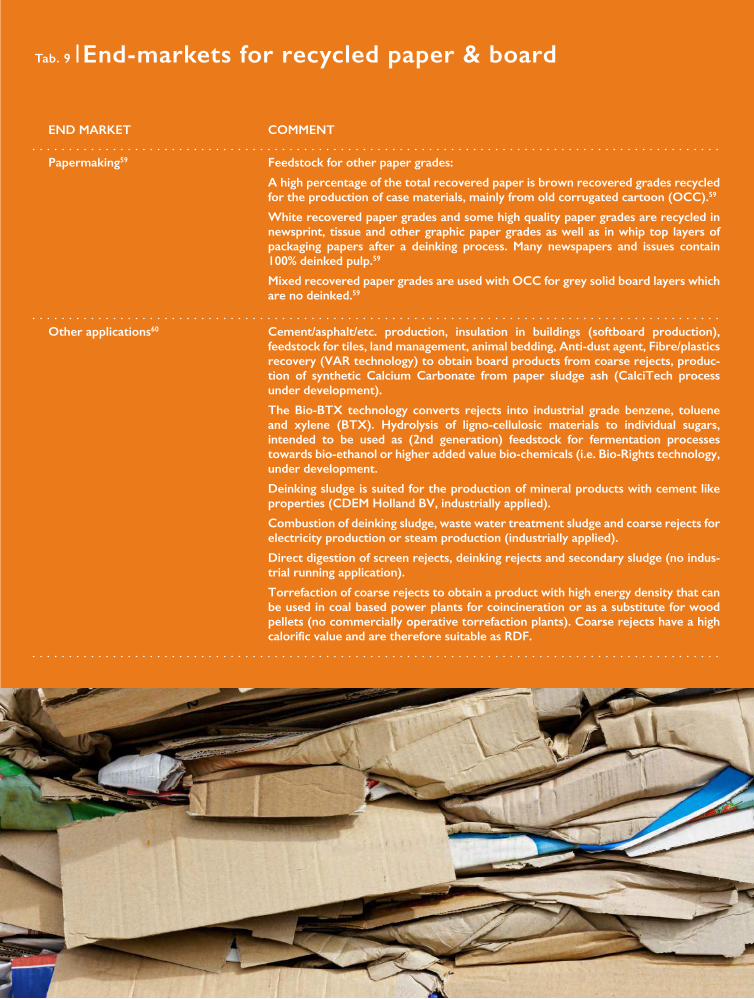
Paper & board manufacturing is by far the largest sector utilising recovered fibre.58 However, recovered paper & board can also be used as raw material to manufac-ture other products, for example insula-tion, animal bedding, egg cartoons, plants pots, soft furnishings and dust masks. According to the CEPI, in addition to the
paper industry use, over 8% of collected paper is used in other applications such as construction materials, animal beddings, composting and energy.59 For the non (sustainably) recyclable paper & board, there are also well stablished resource re-covery solutions, in the form non-materi-al recycling options: waste paper & board has a relatively medium calorific value and is therefore suitable for combustion EfW, SRF and RDF, where it may as well attract subsidies as a source of biogenic carbon-neutral energy. It is also, in most cases, compostable. There is increased in-terest in the use of waste paper & board in the production of primary products, such as chemicals and fuels, as part of biore-finery processes. In the following sections we focus on fibre recovery for paper & board manufacturing.
Tab. 8 Collectability and recyclability
Limits for recycling – as estimated in Europe (2003)55
29
Tab. 9 End-markets for recycled paper & board
30
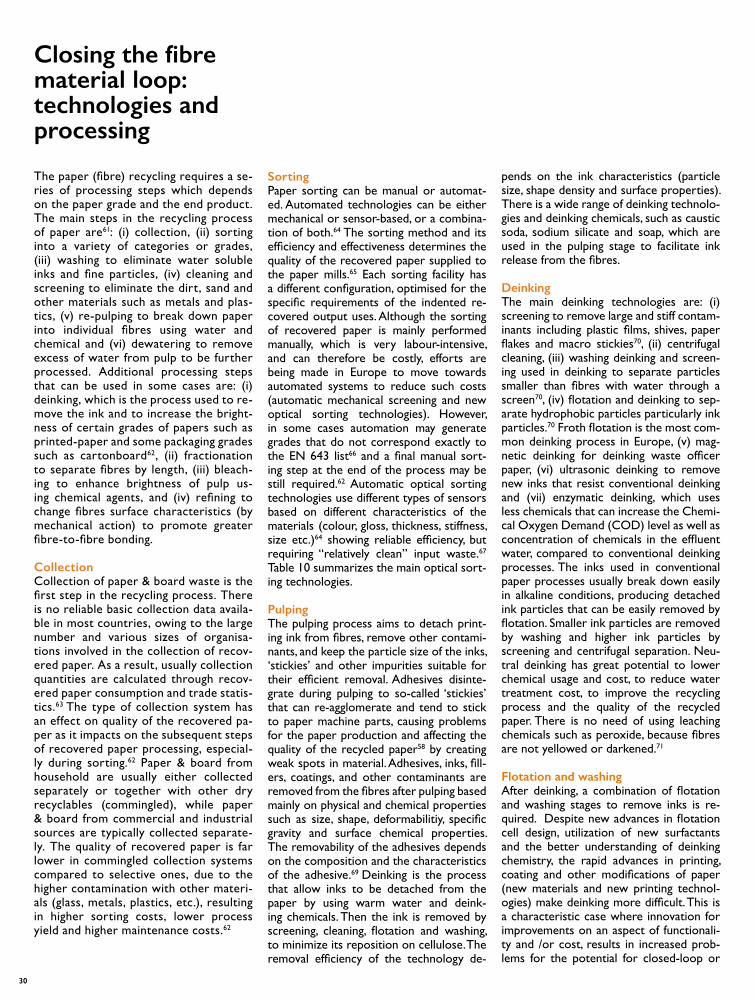
The paper (fibre) recycling requires a se-ries of processing steps which depends on the paper grade and the end product. The main steps in the recycling process of paper are61: (i) collection, (ii) sorting into a variety of categories or grades, (iii) washing to eliminate water soluble inks and fine particles, (iv) cleaning and screening to eliminate the dirt, sand and other materials such as metals and plas-tics, (v) re-pulping to break down paper into individual fibres using water and chemical and (vi) dewatering to remove excess of water from pulp to be further processed. Additional processing steps that can be used in some cases are: (i) deinking, which is the process used to re-move the ink and to increase the bright-ness of certain grades of papers such as printed-paper and some packaging grades such as cartonboard62, (ii) fractionation to separate fibres by length, (iii) bleach-ing to enhance brightness of pulp us-ing chemical agents, and (iv) refining to change fibres surface characteristics (by mechanical action) to promote greater fibre-to-fibre bonding.
CollectionCollection of paper & board waste is the first step in the recycling process. There is no reliable basic collection data availa-ble in most countries, owing to the large number and various sizes of organisa-tions involved in the collection of recov-ered paper. As a result, usually collection quantities are calculated through recov-ered paper consumption and trade statis-tics.63 The type of collection system has an effect on quality of the recovered pa-per as it impacts on the subsequent steps of recovered paper processing, especial-ly during sorting.62 Paper & board from household are usually either collected separately or together with other dry recyclables (commingled), while paper & board from commercial and industrial sources are typically collected separate-ly. The quality of recovered paper is far lower in commingled collection systems compared to selective ones, due to the higher contamination with other materi-als (glass, metals, plastics, etc.), resulting in higher sorting costs, lower process yield and higher maintenance costs.62
Closing the fibre material loop: technologies and processing
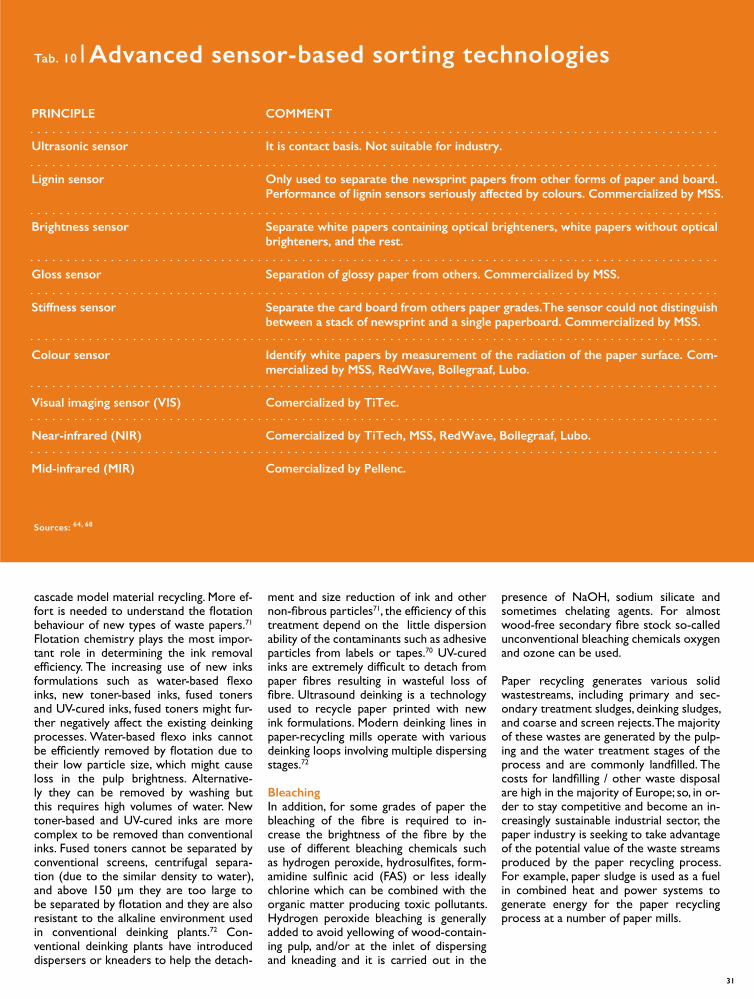
SortingPaper sorting can be manual or automat-ed. Automated technologies can be either mechanical or sensor-based, or a combina-tion of both.64 The sorting method and its efficiency and effectiveness determines the quality of the recovered paper supplied to the paper mills.65 Each sorting facility has a different configuration, optimised for the specific requirements of the indented re-covered output uses. Although the sorting of recovered paper is mainly performed manually, which is very labour-intensive, and can therefore be costly, efforts are being made in Europe to move towards automated systems to reduce such costs (automatic mechanical screening and new optical sorting technologies). However, in some cases automation may generate grades that do not correspond exactly to the EN 643 list66 and a final manual sort-ing step at the end of the process may be still required.62 Automatic optical sorting technologies use different types of sensors based on different characteristics of the materials (colour, gloss, thickness, stiffness, size etc.)64 showing reliable efficiency, but requiring “relatively clean” input waste.67 Table 10 summarizes the main optical sort-ing technologies.
PulpingThe pulping process aims to detach print-ing ink from fibres, remove other contami-nants, and keep the particle size of the inks, ‘stickies’ and other impurities suitable for their efficient removal. Adhesives disinte-grate during pulping to so-called ‘stickies’ that can re-agglomerate and tend to stick to paper machine parts, causing problems for the paper production and affecting the quality of the recycled paper58 by creating weak spots in material. Adhesives, inks, fill-ers, coatings, and other contaminants are removed from the fibres after pulping based mainly on physical and chemical properties such as size, shape, deformabilitiy, specific gravity and surface chemical properties. The removability of the adhesives depends on the composition and the characteristics of the adhesive.69 Deinking is the process that allow inks to be detached from the paper by using warm water and deink-ing chemicals. Then the ink is removed by screening, cleaning, flotation and washing, to minimize its reposition on cellulose. The removal efficiency of the technology de-
pends on the ink characteristics (particle size, shape density and surface properties). There is a wide range of deinking technolo-gies and deinking chemicals, such as caustic soda, sodium silicate and soap, which are used in the pulping stage to facilitate ink release from the fibres.
DeinkingThe main deinking technologies are: (i) screening to remove large and stiff contam-inants including plastic films, shives, paper flakes and macro stickies70, (ii) centrifugal cleaning, (iii) washing deinking and screen-ing used in deinking to separate particles smaller than fibres with water through a screen70, (iv) flotation and deinking to sep-arate hydrophobic particles particularly ink particles.70 Froth flotation is the most com-mon deinking process in Europe, (v) mag-netic deinking for deinking waste officer paper, (vi) ultrasonic deinking to remove new inks that resist conventional deinking and (vii) enzymatic deinking, which uses less chemicals that can increase the Chemi-cal Oxygen Demand (COD) level as well as concentration of chemicals in the effluent water, compared to conventional deinking processes. The inks used in conventional paper processes usually break down easily in alkaline conditions, producing detached ink particles that can be easily removed by flotation. Smaller ink particles are removed by washing and higher ink particles by screening and centrifugal separation. Neu-tral deinking has great potential to lower chemical usage and cost, to reduce water treatment cost, to improve the recycling process and the quality of the recycled paper. There is no need of using leaching chemicals such as peroxide, because fibres are not yellowed or darkened.71
Flotation and washingAfter deinking, a combination of flotation and washing stages to remove inks is re-quired. Despite new advances in flotation cell design, utilization of new surfactants and the better understanding of deinking chemistry, the rapid advances in printing, coating and other modifications of paper (new materials and new printing technol-ogies) make deinking more difficult. This is a characteristic case where innovation for improvements on an aspect of functionali-ty and /or cost, results in increased prob-lems for the potential for closed-loop or
31
cascade model material recycling. More ef-fort is needed to understand the flotation behaviour of new types of waste papers.71 Flotation chemistry plays the most impor-tant role in determining the ink removal efficiency. The increasing use of new inks formulations such as water-based flexo inks, new toner-based inks, fused toners and UV-cured inks, fused toners might fur-ther negatively affect the existing deinking processes. Water-based flexo inks cannot be efficiently removed by flotation due to their low particle size, which might cause loss in the pulp brightness. Alternative-ly they can be removed by washing but this requires high volumes of water. New toner-based and UV-cured inks are more complex to be removed than conventional inks. Fused toners cannot be separated by conventional screens, centrifugal separa-tion (due to the similar density to water), and above 150 µm they are too large to be separated by flotation and they are also resistant to the alkaline environment used in conventional deinking plants.72 Con-ventional deinking plants have introduced dispersers or kneaders to help the detach-
ment and size reduction of ink and other non-fibrous particles71, the efficiency of this treatment depend on the little dispersion ability of the contaminants such as adhesive particles from labels or tapes.70 UV-cured inks are extremely difficult to detach from paper fibres resulting in wasteful loss of fibre. Ultrasound deinking is a technology used to recycle paper printed with new ink formulations. Modern deinking lines in paper-recycling mills operate with various deinking loops involving multiple dispersing stages.72
BleachingIn addition, for some grades of paper the bleaching of the fibre is required to in-crease the brightness of the fibre by the use of different bleaching chemicals such as hydrogen peroxide, hydrosulfites, form-amidine sulfinic acid (FAS) or less ideally chlorine which can be combined with the organic matter producing toxic pollutants. Hydrogen peroxide bleaching is generally added to avoid yellowing of wood-contain-ing pulp, and/or at the inlet of dispersing and kneading and it is carried out in the
presence of NaOH, sodium silicate and sometimes chelating agents. For almost wood-free secondary fibre stock so-called unconventional bleaching chemicals oxygen and ozone can be used.
Paper recycling generates various solid wastestreams, including primary and sec-ondary treatment sludges, deinking sludges, and coarse and screen rejects. The majority of these wastes are generated by the pulp-ing and the water treatment stages of the process and are commonly landfilled. The costs for landfilling / other waste disposal are high in the majority of Europe; so, in or-der to stay competitive and become an in-creasingly sustainable industrial sector, the paper industry is seeking to take advantage of the potential value of the waste streams produced by the paper recycling process. For example, paper sludge is used as a fuel in combined heat and power systems to generate energy for the paper recycling process at a number of paper mills.
Tab. 10 Advanced sensor-based sorting technologies
Sources: 64, 68
32
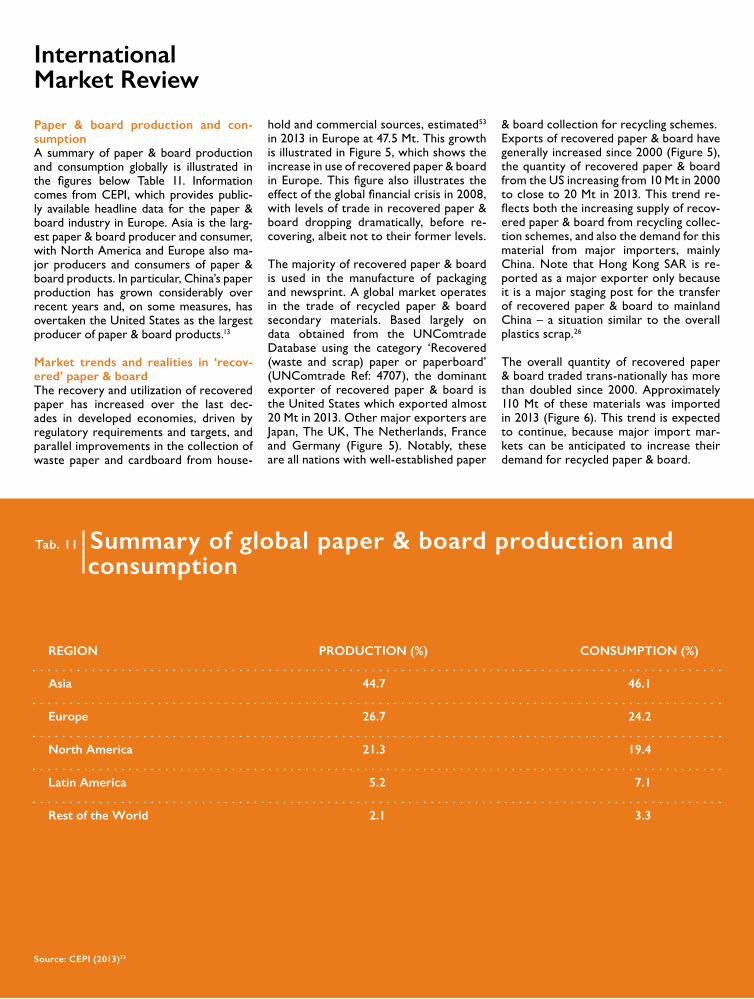
Tab. 11 Summary of global paper & board production and consumption
Paper & board production and con-sumptionA summary of paper & board production and consumption globally is illustrated in the figures below Table 11. Information comes from CEPI, which provides public-ly available headline data for the paper & board industry in Europe. Asia is the larg-est paper & board producer and consumer, with North America and Europe also ma-jor producers and consumers of paper & board products. In particular, China’s paper production has grown considerably over recent years and, on some measures, has overtaken the United States as the largest producer of paper & board products.13
Market trends and realities in ‘recov-ered’ paper & boardThe recovery and utilization of recovered paper has increased over the last dec-ades in developed economies, driven by regulatory requirements and targets, and parallel improvements in the collection of waste paper and cardboard from house-
International Market Review
Source: CEPI (2013)73
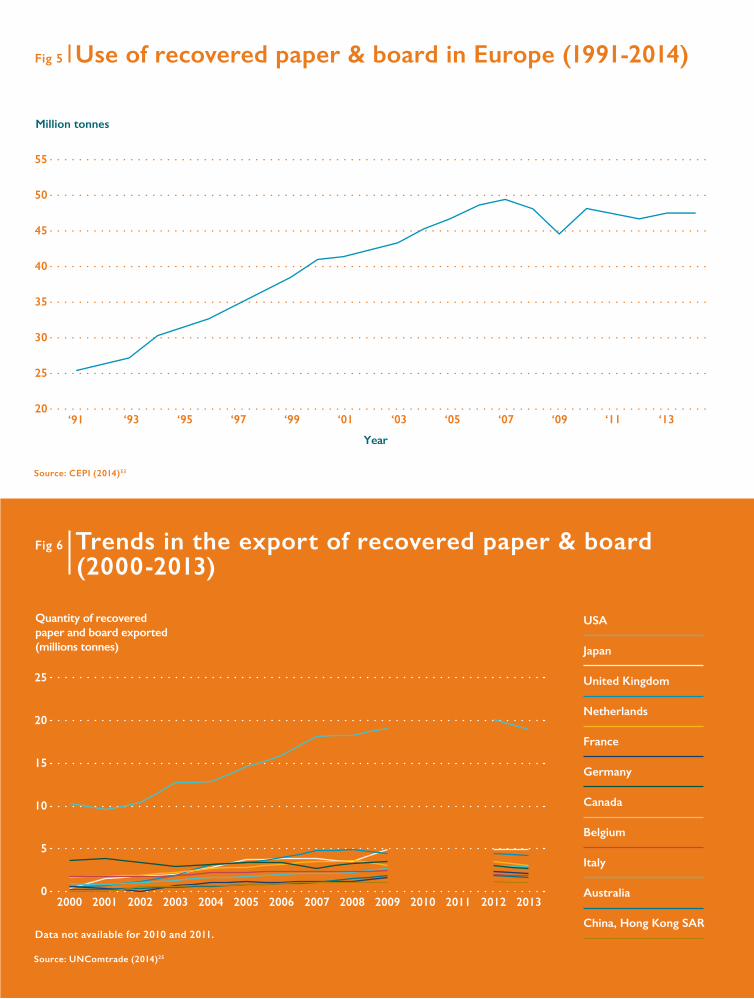
hold and commercial sources, estimated53 in 2013 in Europe at 47.5 Mt. This growth is illustrated in Figure 5, which shows the increase in use of recovered paper & board in Europe. This figure also illustrates the effect of the global financial crisis in 2008, with levels of trade in recovered paper & board dropping dramatically, before re-covering, albeit not to their former levels.
The majority of recovered paper & board is used in the manufacture of packaging and newsprint. A global market operates in the trade of recycled paper & board secondary materials. Based largely on data obtained from the UNComtrade Database using the category ‘Recovered (waste and scrap) paper or paperboard’ (UNComtrade Ref: 4707), the dominant exporter of recovered paper & board is the United States which exported almost 20 Mt in 2013. Other major exporters are Japan, The UK, The Netherlands, France and Germany (Figure 5). Notably, these are all nations with well-established paper
& board collection for recycling schemes. Exports of recovered paper & board have generally increased since 2000 (Figure 5), the quantity of recovered paper & board from the US increasing from 10 Mt in 2000 to close to 20 Mt in 2013. This trend re-flects both the increasing supply of recov-ered paper & board from recycling collec-tion schemes, and also the demand for this material from major importers, mainly China. Note that Hong Kong SAR is re-ported as a major exporter only because it is a major staging post for the transfer of recovered paper & board to mainland China – a situation similar to the overall plastics scrap.26
The overall quantity of recovered paper & board traded trans-nationally has more than doubled since 2000. Approximately 110 Mt of these materials was imported in 2013 (Figure 6). This trend is expected to continue, because major import mar-kets can be anticipated to increase their demand for recycled paper & board.
33
Fig 5 Use of recovered paper & board in Europe (1991-2014)
Fig 6 Trends in the export of recovered paper & board (2000-2013)
Source: UNComtrade (2014)25
Source: CEPI (2014)53
Data not available for 2010 and 2011.
34
Fig. 7 Trends in quantities of imports and average price of paper & board (2000-2013)
Fig. 8 Recovered paper prices Europe (2008-09)
Source: CEPI (2014)73
Source: FOEX (2015)74
Data not available for 2010 and 2011.
35
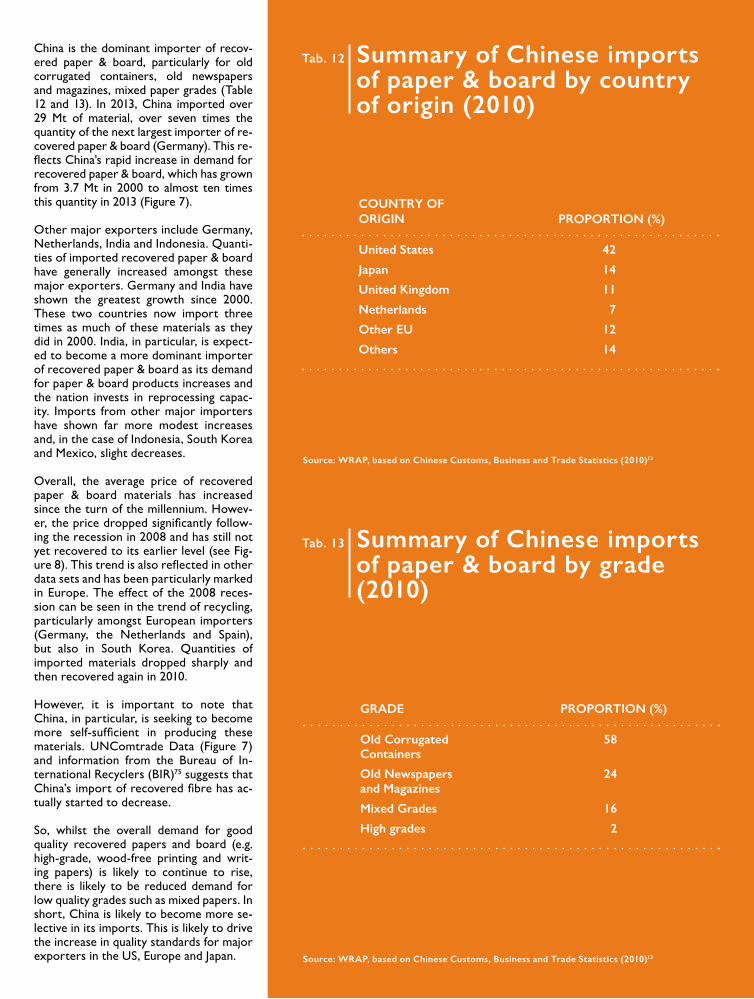
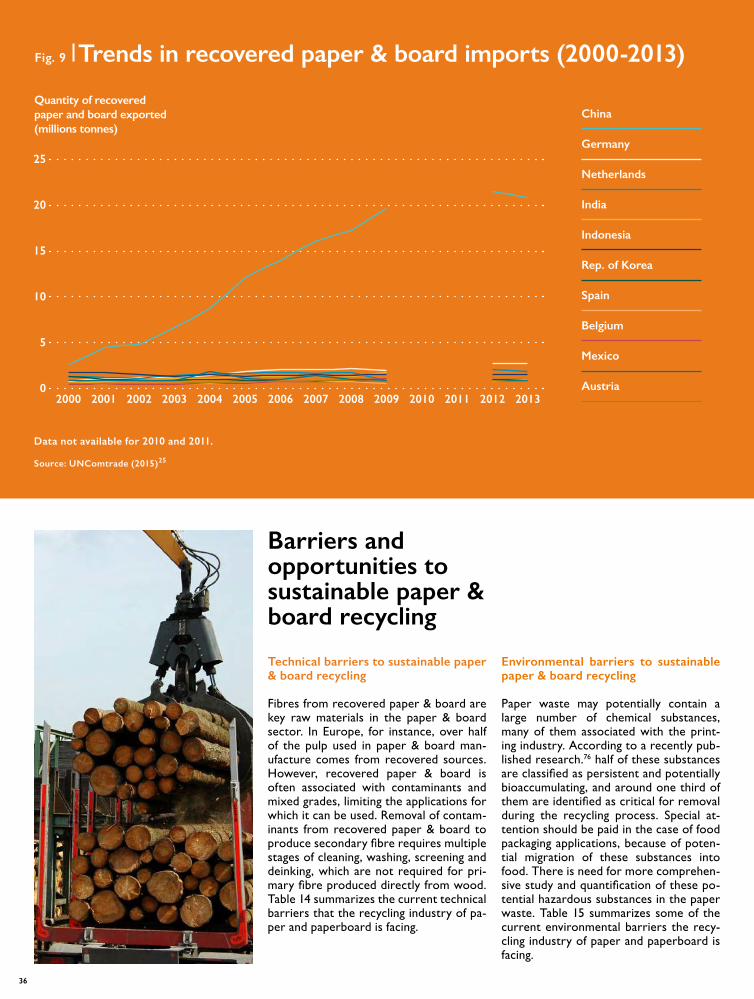
China is the dominant importer of recov-ered paper & board, particularly for old corrugated containers, old newspapers and magazines, mixed paper grades (Table 12 and 13). In 2013, China imported over 29 Mt of material, over seven times the quantity of the next largest importer of re-covered paper & board (Germany). This re-flects China’s rapid increase in demand for recovered paper & board, which has grown from 3.7 Mt in 2000 to almost ten times this quantity in 2013 (Figure 7).
Other major exporters include Germany, Netherlands, India and Indonesia. Quanti-ties of imported recovered paper & board have generally increased amongst these major exporters. Germany and India have shown the greatest growth since 2000. These two countries now import three times as much of these materials as they did in 2000. India, in particular, is expect-ed to become a more dominant importer of recovered paper & board as its demand for paper & board products increases and the nation invests in reprocessing capac-ity. Imports from other major importers have shown far more modest increases and, in the case of Indonesia, South Korea and Mexico, slight decreases.
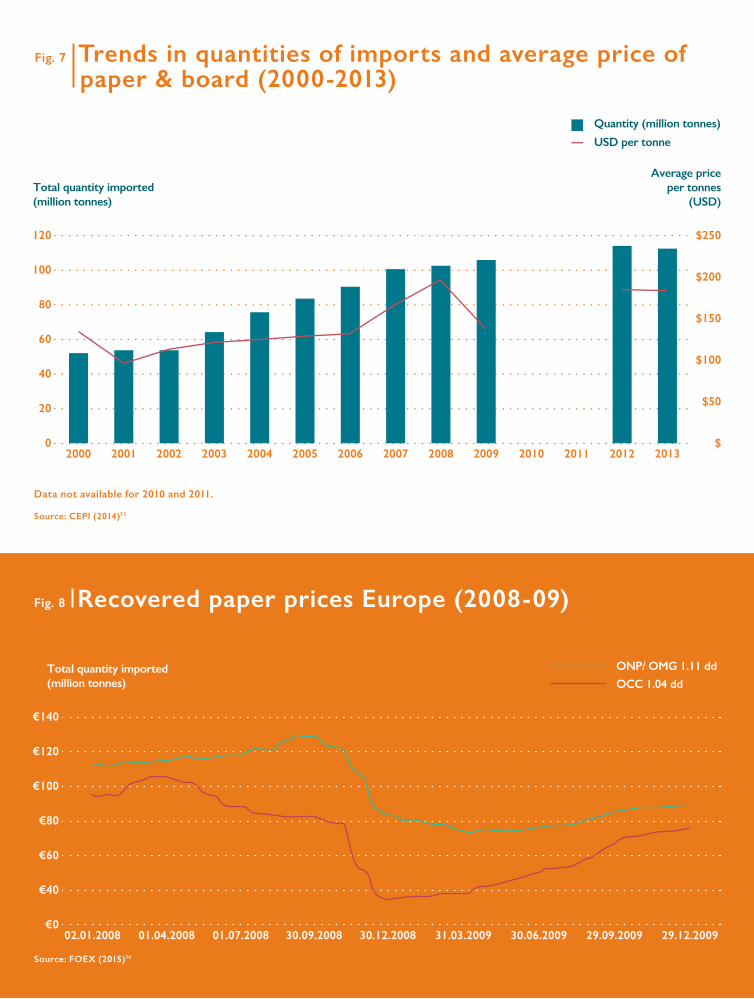
Overall, the average price of recovered paper & board materials has increased since the turn of the millennium. Howev-er, the price dropped significantly follow-ing the recession in 2008 and has still not yet recovered to its earlier level (see Fig-ure 8). This trend is also reflected in other data sets and has been particularly marked in Europe. The effect of the 2008 reces-sion can be seen in the trend of recycling, particularly amongst European importers (Germany, the Netherlands and Spain), but also in South Korea. Quantities of imported materials dropped sharply and then recovered again in 2010.
However, it is important to note that China, in particular, is seeking to become more self-sufficient in producing these materials. UNComtrade Data (Figure 7) and information from the Bureau of In-ternational Recyclers (BIR)75 suggests that China’s import of recovered fibre has ac-tually started to decrease.
So, whilst the overall demand for good quality recovered papers and board (e.g. high-grade, wood-free printing and writ-ing papers) is likely to continue to rise, there is likely to be reduced demand for low quality grades such as mixed papers. In short, China is likely to become more se-lective in its imports. This is likely to drive the increase in quality standards for major exporters in the US, Europe and Japan.
Source: WRAP, based on Chinese Customs, Business and Trade Statistics (2010)13
Source: WRAP, based on Chinese Customs, Business and Trade Statistics (2010)13
Tab. 12 Summary of Chinese imports of paper & board by country of origin (2010)
Tab. 13 Summary of Chinese imports of paper & board by grade (2010)
36
Fig. 9 Trends in recovered paper & board imports (2000-2013)
Source: UNComtrade (2015)25
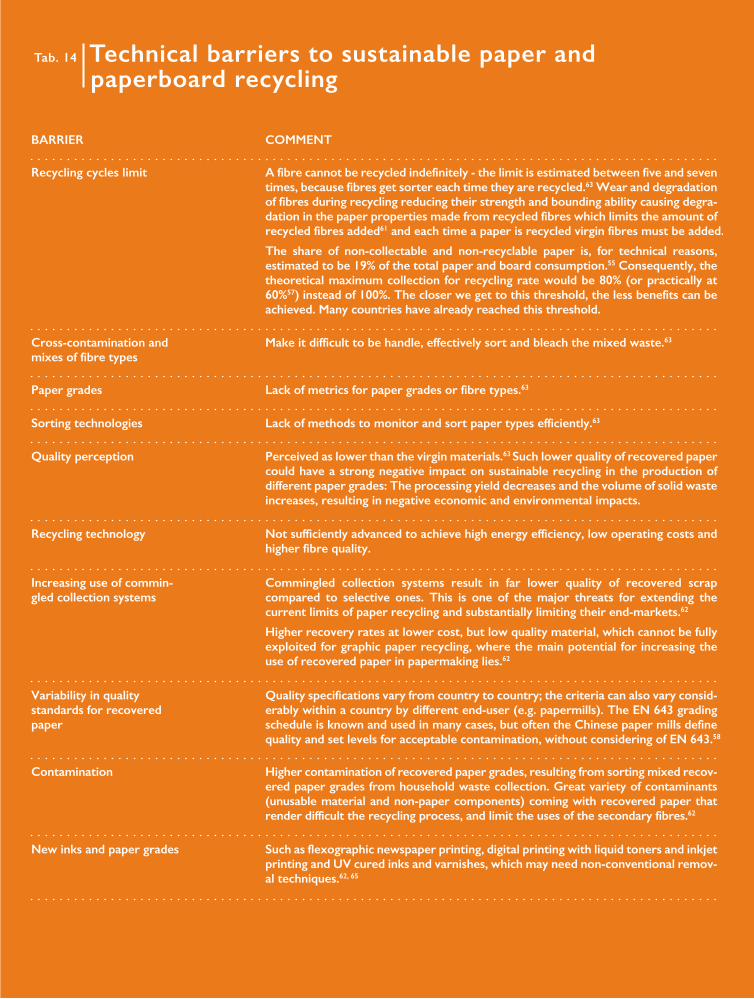
Technical barriers to sustainable paper & board recycling
Fibres from recovered paper & board are key raw materials in the paper & board sector. In Europe, for instance, over half of the pulp used in paper & board man-ufacture comes from recovered sources. However, recovered paper & board is often associated with contaminants and mixed grades, limiting the applications for which it can be used. Removal of contam-inants from recovered paper & board to produce secondary fibre requires multiple stages of cleaning, washing, screening and deinking, which are not required for pri-mary fibre produced directly from wood. Table 14 summarizes the current technical barriers that the recycling industry of pa-per and paperboard is facing.
Barriers and opportunities to sustainable paper & board recycling
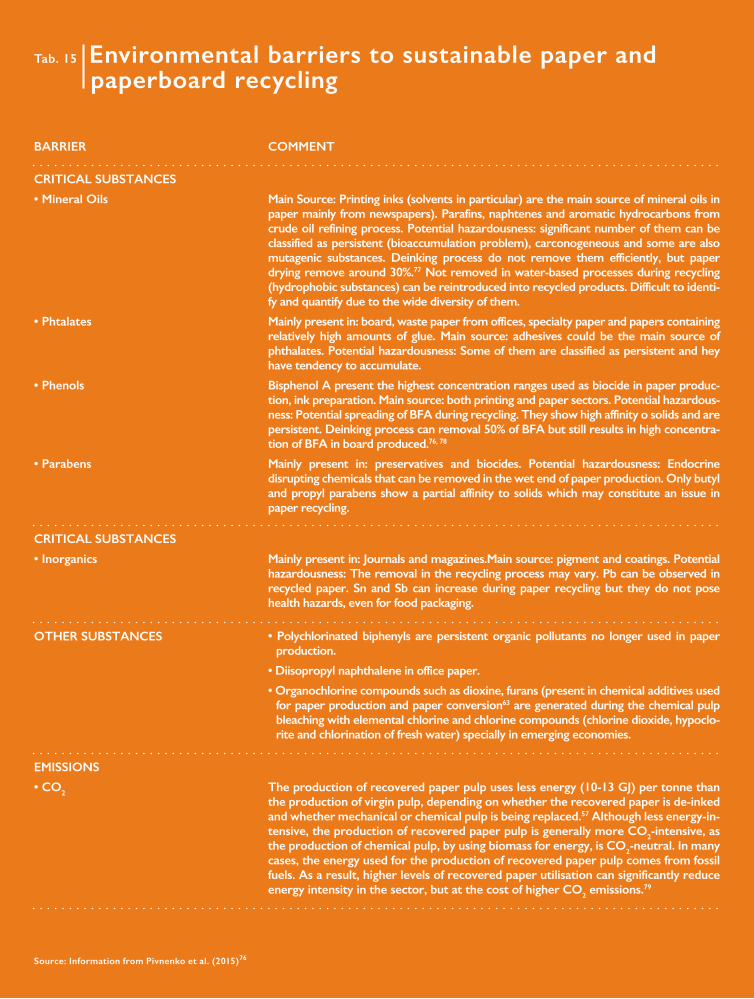
Environmental barriers to sustainable paper & board recycling
Paper waste may potentially contain a large number of chemical substances, many of them associated with the print-ing industry. According to a recently pub-lished research.76 half of these substances are classified as persistent and potentially bioaccumulating, and around one third of them are identified as critical for removal during the recycling process. Special at-tention should be paid in the case of food packaging applications, because of poten-tial migration of these substances into food. There is need for more comprehen-sive study and quantification of these po-tential hazardous substances in the paper waste. Table 15 summarizes some of the current environmental barriers the recy-cling industry of paper and paperboard is facing.
Data not available for 2010 and 2011.
37
Tab. 14 Technical barriers to sustainable paper and paperboard recycling
38
Tab. 15 Environmental barriers to sustainable paper and paperboard recycling
Source: Information from Pivnenko et al. (2015)76
39
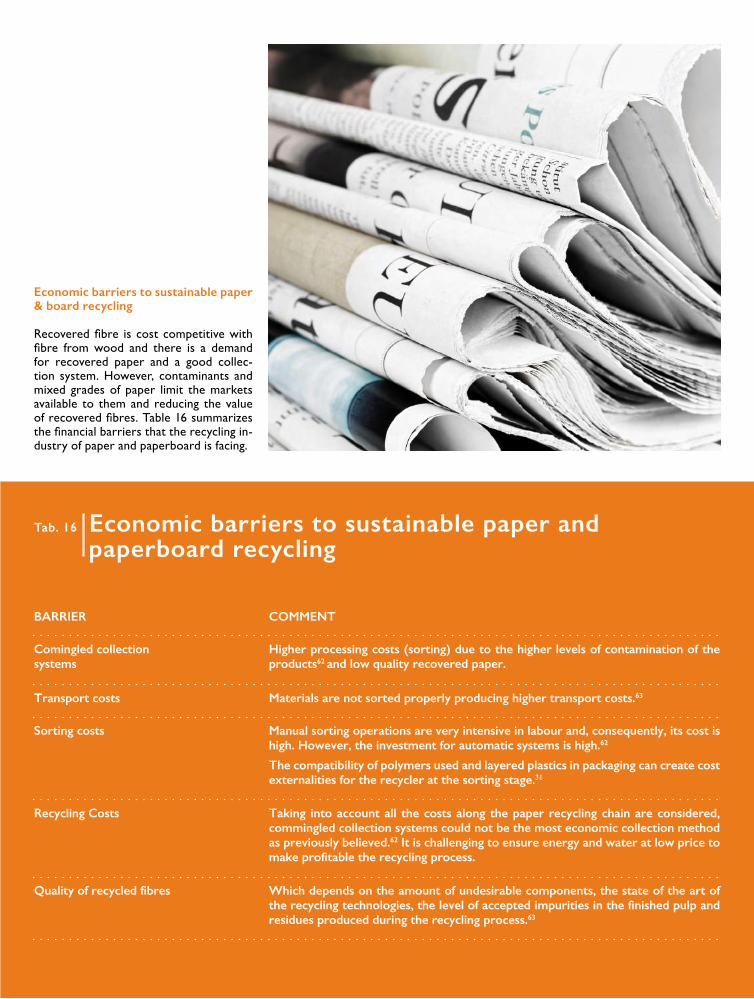
Economic barriers to sustainable paper & board recycling
Recovered fibre is cost competitive with fibre from wood and there is a demand for recovered paper and a good collec-tion system. However, contaminants and mixed grades of paper limit the markets available to them and reducing the value of recovered fibres. Table 16 summarizes the financial barriers that the recycling in-dustry of paper and paperboard is facing.
Tab. 16 Economic barriers to sustainable paper and paperboard recycling
40
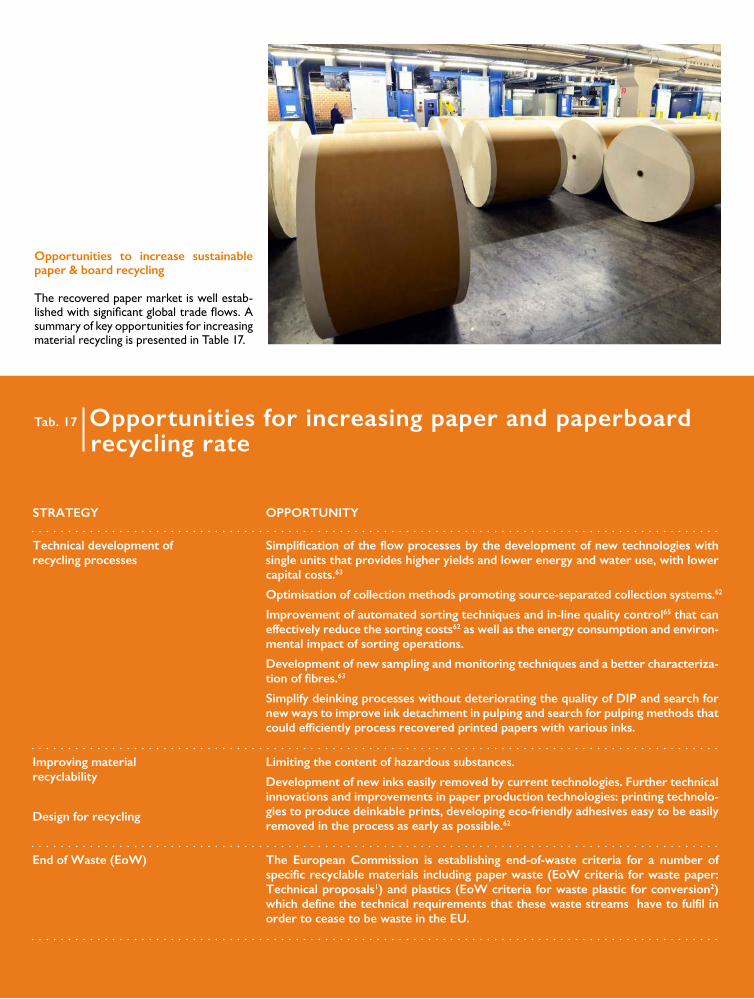
Opportunities to increase sustainable paper & board recycling
The recovered paper market is well estab-lished with significant global trade flows. A summary of key opportunities for increasing material recycling is presented in Table 17.
Tab. 17 Opportunities for increasing paper and paperboard recycling rate
41
References1. Villanueva, A.; Peter, E. End-of-waste criteria for waste paper: Technical proposals; 2011.
2. Villanueva, A.; Peter, E. End-of-waste criteria for waste plastic for conversion; 2014.
3. ERPC Recycling Facts; European Recov-ered Paper Council 2015.
4. PlasticsEurope Plastics the Facts 2014/2015: An analysis of European plastics production, demand and waste data; 2014.
5. PlasticsEurope The recycling and recovery of polyolefins waste in Europe; 2011.
6. Delgado, C.; Barruetabeña, L.; Salas, O. As-sessment of the environmental advantages and draw backs of emerging polymers recov-ery processes; European Commission: 2007.
7. Hestin, M.; Faninger, T.; Milios, L. Increased EU plastics recycling targets: Environmen-tal, economic and social impact assessment; Deloitte: 2015.
8. EU Final draft report: End-of-waste criteria for waste plastic for conversion; JCR Europe-an Commision 2013.
9. WasteWatch; Recoup Plastics in the UK economy- a guide to polymer use and the opportunities for recycling; 2003.
10. Burke, H.; Freegard, K.; Morrish, L.; Mor-ton, R. UK market composition data of poly-propylene packaging; Axion Consulting: 2012.
11. Kanari, N.; Pineau, J. L.; Shallari, S. End-of-Life Vehicle Recycling in the European Union; 2003.
12. Stenvall, E.; Tostar, S.; Boldizar, A.; Foreman, M. WEEE Plastics Composition; Chalmers University: Göteborg, 2011.
13. WRAP The Chinese markets for recov-ered paper and plastics – an update; 2011.
14. Freegard, K.; Tan, G.; Morton, R. UK Plas-tics Waste – A review of supplies for recy-cling, global market demand, future trends and associated risks; Waste and Resources Action Programme: 2006.
15. Achilias, D. S.; Andriotis, L.; Koutsidis, I. A.; Louka, D. C. A.; Nianias, N. P.; Siafaka, P.; Tsagkalias, I.; Tsintzou, G., Recent Advances in the Chemical Recycling of Polymers (PP, PS, LDPE, HDPE, PVC, PC, Nylon, PMMA). In Material Recycling - Trends and Perspec-tives, Achilias, D. S., Ed. InTech: 2012; pp 1-64.
16. Velis, C. A.; Longhurst, P. J.; Drew, G. H.; Smith, R.; Pollard, S. J. T., Production and quality assurance of solid recovered fu-els using mechanical-biological treatment (MBT) of waste: A comprehensive assess-ment. Crit. Rev. Environ. Sci. Technol. 2010, 40, (12), 979-1105.
17. EcoSphere A European plastics market and trend study: life cycle analyses from vir-gin material until post-consumer waste sce-narios; December 2014, 2014; p 33.
18. Dvorak, R.; Kosior, E.; Moody, L. Devel-opment of a Food-Grade Recycling Process for Post-Consumer Polypropylene; Nextek Limited.: 2011.
19. Dvorak, R.; R., E.; Kosior, E. Commercial scale mixed plastics recycling; Nextek Ltd: 2009.
20. Serranti, S.; Luciani, V.; Bonifazi, G.; Hu, B.; Rem, P. C., An innovative recycling process to obtain pure polyethylene and polypropylene from household waste. Waste Management 2015, 35, 12-20.
21. Di Maio, F. Magnetic Sorting and Ultra-sound Sensor Technologies for Production of High Purity Secondary Polyolefins from Waste; Delft University of Technology: 2014.
22. IHS, World Anaysis - Polypropylene. 2015. https://www.ihs.com/products/world-pet-ro-chemical-analysis-propylene.html
23. Moolji, S., Petrochemical Scenario Across Continents: What is Happening in the World of Polypropylene? 2015.
24. Ma, P. China Polyolefin Industry Outlook: Polyethylene & Polypropylene; CNCIC Con-sulting: 2013.
25. UNComtrade, 2015.
26. Velis, C. A. Global recycling markets - plastic waste: A story for one player – China. Report prepared by FUELogy and formatted by D-waste on behalf of Inter-national Solid Waste Association - Globali-sation and Waste Management Task Force; International Solid Waste Association (ISWA): Vienna, Austria, September 2014, 2014; p 66.
27. Zhang, B., A Research on Recycled Plastics’ Environmental Economy Value. In ChinaReplas 2012 (Spring), : Shanghai, 2012.
28. PlasticsNews Historical Resin Pricing - Recycling Plastics - PP - Industrial Flake h t tp : / /www.p l a s t i c snews . com/res -in/recycled-plast ics/h istor ica l -pr ic-ing?grade=1340801|Vol2
29. Plasticker, Market Report Plastics - Jan-uary 2015. 2015.
30. EU Plastic waste in the Environment; European Commission: 2011.
31. DEFRA Recyclates: Quality, Markets, Content and Barriers . Summary Analysis of Research to Date – WR1211; Depart-ment for Environment, Food and Rural Af-fairs: 2011.
32. Hopewell, J.; Dvorak, R.; Kosior, E., Plas-tics recycling: challenges and opportunities. Philos Trans R Soc Lond B Biol Sci. 2009, 364, (1526), 2115–2126.
33. Al-Salem, S. M.; Lettieri, P.; Baeyens, J., Recycling and recovery routes of plastic solid waste (PSW): A review. Waste Man-agement 2009, 29, (10), 2625-2643.
34. Pressley, P. N.; Levis, J. W.; Damgaard, A.; Barlaz, M. A.; DeCarolis, J. F., Analysis of ma-terial recovery facilities for use in life-cycle assessment. Waste Management 2015, 35, 307-317.
35. DEFRA Guidance on Best Availa-ble Treatment Recovery and Recycling Techniques (BATRRT) and treatment of Waste Electrical and Electronic Equipment (WEEE); Department for Environment, Food and Rural Affairs: 2006.
42
36. Merrington, A., Applied Plastics Engineer-ing Handbook: Processing and Materials. El-servier: United States of America, 2011.
37. Curry, D.; Hilder, R.; Morrish, L.; Morton, R.; Myles, N.; Newman, C. Scoping study into food grade polypropylene recycling Axion Consulting: 2010.
38. Tolinski, M., Additives for Polyolefins. El-servier: 2009.
39. He, Z.; Li, G.; Chen, J.; Huang, Y.; An, T.; C., Z., Pollution characteristics and health risk assessment of volatile organic compounds emitted from different plastic solid waste recycling workshops. Env. International 2015, 77, 85-94.
40. Lazarevic, D.; Aoustin, E.; Buclet, N.; Brandt, N., Plastic waste management in the context of a European recycling society: Comparing results and uncertainties in a life cycle perspective. Resources, Conservation and Recycling 2010, 55, (2), 246-259.
41. Astrup, T.; Fruergaard, T.; Christensen, T. H., Recycling of plastic: Accounting of green-house gases and global warming contribu-tions. Waste Management & Research 2009, 27, (8), 763-772.
42. Rajendran, S.; Hodzic, A.; Scelsi, L.; Hayes, S.; Soutis, C.; AlMa’adeed, M.; Kahraman, R., Plastics recycling: Insights into life cycle im-pact assessment methods. Plastics, Rubber and Composites 2013, 42, (1), 1-10.
43. Velis, C. A., Circular economy and glob-al secondary material supply chains. Waste Management & Research 2015, 33, (5), 389-391.
44. Velis, C. A.; Brunner, P. H., Recycling and resource efficiency: It is time for a change from quantity to quality. Waste Management & Research 2013, 31, (6), 539-540.
45. Kutz, M., Applied Plastics Engineering Handbook. Elservier: 2011.
46. PlasticsEurope, Plastics - the Facts 2011 An analysis of European plastics production, demand and recovery for 2010. In Plas-ticsEurope: 2011.
47. Foster, S. Domestic mixed plastics waste management options; Recoup: 2008.
48. Consultic Chemicals, plastics and the en-vironment; Consultic: 2015.
49. WRAP Collection and Sorting of House-hold Rigid Plastic Packaging; Waste and Re-sources Action Programme: 2012.
50. Dvorak, R.; E., K.; Moody, L. Development of NIR Detectable Black Plastic Packaging Nextek Limited: 2011.
51. Kosior, E.; Davies, K.; Kay, M.; Mitchell, J.; Ahmad, R.; Silver, J. Optimising the use of ma-chine readable inks for food packaging sort-ing; NEXTEK Limited: 2014.
52. East, P. Plastic packaging: Recyclability by design; Recoup 2015.
53. CEPI, Preliminary Statistics. 2014.
54. CEPI Recycling. http://www.cepi.org/top-ics/recycling (15 June 2015),
55. CEPI Summary of the study on non-col-lectable and non-recyclable paper products; Confederation of European Paper Industries: 2003.
56. CEPI Guidelines for Responsible Sourcing and Supply of Recovered Paper; Confedera-tion European Paper Industry: 2006.
57. IEA Tracking clean energy progres; Inter-national Energy Agency 2012.
58. Pöyry Management Consulting An As-sessment of the Recovered Paper Supply Chain in Ireland; 2011.
59. Höke, U.; Sa., S., Recycled fibres and deinking. 2010; Vol. 7.
60. Marsidi, M.; Westenbroek, A.; Ring-man-Beck, J. Maximum value from paper for recycling: Towards a multi-product paper mill; Kenniscentrum Papier en Karton (KCPK), Confederation of European Paper Industries (CEPI),: Brussels 2011.
61. Letcher, M.; Vallero, D., Waste: A Hand-book for Management. 2011.
62. Blanco, A.; Miranda, R.; Monte, M. C., Extending the limits of paper recycling: im-provements along the paper value chain. For-est Systems 2013, 22, (3), 471-483.
63. Bajpai, P., Recycling and deinking of recov-ered paper. First edition ed.; Elsevier: Oxford, 2014; p 55-83.
64. Rahman, M. O.; Hannan, M. A.; Scavino, E.; Hussain, A.; Basri, H., An Efficient Paper Grade Identification Method for Automatic Recyclable Waste Paper Sorting. European Journal of Scientific Research 2009, 25, (1), 96-103.
65. Bobu, E.; Iosip, A.; Ciolacu, F., Potential benefits of recovered paper sorting by ad-vanced technology. Cellulose Chemistry and Technology 2010, 44, 461-471.
66. Wagner J; Franke T; Schabel S, Automatic sorting of recovered paper: technical solu-tions and their limitations. Prog Pap Recycl 2006, 16, 13-23.
67. Remade Scotland, C. E. C. a. G. C. U. Initial Business Case for Utilisation of Automated Optical Paper Sorting Technology; 2005.
68. Rahman, M. O.; Hussain, A.; Basri, H., A critical review on waste paper sorting tech-niques. International Journal of Environmen-tal Science and Technology 2013, 11, (2), 551-564.
69. ERPC Assessment of printed product recyclability; European Recovered Paper Council: 2011.
70. Stawicki, B.; Read, B. COST Action E48: The future of paper recycling in Europe: Op-portunities and limitations; Bury (Greater Manchester), 2010; p 210.
71. Jiang, C.; Ma, J., Deinking of waste paper: flotation. In Encyclopedia of Separation Sci-ence, Wilson, I. D., Ed. Academic Press: Ox-ford, 2000; pp 2537-2544.
72. Kemppainen, K. Towards simplified Deinking systems- A study of the effects of ageing, Pre-wetting and alternative pulp-ing Strategy on ink behaviour in pulping. http://herkules.oulu.fi/isbn9789526203812/isbn9789526203812.pdf
73. CEPI, Key statistics European Pulp and Paper Industry. 2013.
74. FOEX, PIX Recovered Paper Indexes Eu-rope. 2015.
75. BIR Annual Report 2014; Bureau of Inter-national Recycling: 2015.
76. Pivnenko, K.; Eriksson, E.; Astrup, T. F., Waste paper for recycling: Overview and identification of potentially critical substanc-es. Waste Management 2015, doi:10.1016/j.wasman.2015.02.028..
77. Biedermann, M.; Uematsu, Y.; Grob, K., Mineral oil contents in paper and board recycled to paperboard for food packaging. Packag. Technol. Sci., 2011, 24, 61–73.
78. BMEL Ausmaß der Migration unerwün-schter Stoffe aus Verpackungsmaterialien aus Altpapier in Lebensmitteln; German Federal Ministry of Food, Agriculture and Consumer Protection: 2012.
79. IEA Energy technology transitions for industry; International Energy Agency: 2009.
43
Acknowledgments
Reference Group and Contributors: We would like to express our gratitude towards the Reference Group of the Task Force on Resource Management who were continuously consulted and who provided inputs and guidance to the Re-ports. The Members of the Reference Group were: Elisa Tonda (UNEP DTIE), Heijo Scharf (Avfalzorg), Jean-Paul Leglise (ISWA), John Skinner (SWANA), Liaz-zat Rabbiosi (UNEP DTIE), Patrick Dor-vil (EIB), Peter Börkey (OECD), Sarah Sanders Hewett (ERM), Tore Hulgaard (Rambøll). Furthermore, we would like to thank the ISWA Board Members and the Scientific and Technical Committee Members for their contributions to the Task Force outputs through suggestions, written and in person comments and participation at the Task Force related sessions and workshops organized in Sep-tember 2014 in Sao Paulo (ISWA World Congress 2014), and in June 2015 in Par-is (Task Force on Resource Management workshop). Finally, we would like to thank the various experts and consultees who advanced the report quality through their valuable insights.
For this particular report, we are also grateful for insightful comments to: Plas-ticsEurope, WRAP, Resources Associa-tion, Mr Innes Deans, Dr Eleni Lacovidou and the wider CVORR Research project team of University of Leeds.
Layout and Design: Ana Loureiro and Deslink Design
Photographs and graphics: Photographs and graphics were provided and developed by Deslink Design using existing graphics with the permission of the credited authors.
44
Auerspergstrasse 15, Top 411080 VIENNA — AUSTRIATelephone +43 (1) 253 6001 Fax +43 (1) 253 6001 99www.iswa.org [email protected] Copyright © ISWA September 2015, all rights reserved
Members of the ISWA task force on resource management
Björn AppelqvistChairCity of Copenhagen, Denmark
Ana LoureiroEGF, Portugal
Andreas BartlVienna University of Technology, Austria
Bettina KamukRambøll, Denmark
Costas VelisUniversity of Leeds, UK
Gary CrawfordVeolia, France
Jane Gilbert Carbon Clarity, UK
Martin BrocklehurstThe Chartered Institution of Wastes Management, UK
Kata TiszaISWA General Secretariat
Prepared by the ISWA Task Force on Resource Management with the support from:
NERC, ESRC and DEFRA funded project: Complex Value Optimisation for Resource Recovery - CVORR
International Solid Waste Association