Embed Size (px)
Citation preview

International Solar Alliance & Lines of Credit

International Solar Alliance
&Lines of Credit
International Solar Alliance
Solar in Africa: Opportunity
Lines of Credit & Exim Bank’s Role

INTERNATIONAL SOLAR ALLIANCE
15%23.5%
US$ 1785/Watt US$ 1.30/Watt US$ 0.70/Watt
Co
st, S
ize
, Eff
icie
ncy
co
nti
nu
es
to im
pro
ve
Solar Panels convert 4.5% of available
energy to electricity
230 Watts
Solar Panel Size213’’ by 130”
1953
Solar Panels now convert about 15% of
available energy to electricity
Solar Panel Size64’’ by 39”
2012
230 Watts
Solar Panels now convert about 23.5% of
available energy to electricity
230 Watts
2016 - & Beyond
Solar Panel Size41’’ by 25”
Technology is Established and Improving Investments in solar has consistentlybeen the highest since last 5 years.
Global solar investments haveincreased from US$ 11.9 bn to US$161bn in 2015.
One-fourth of this has gone to small-scale distributed solar sytems.
Falling costs and innovative financingmechanisms are putting small-scaledistributed solar within reach of morepeople, in both developed andemerging economies.
ISA members may seek to tap thisopportunity

The installed solar capacity in Africa increasedfrom 23.8 MW in 2000 to 1918.8 MW in 2015 –an increase of more than 80 times.
While the penetration of CSP has gainedmomentum in Africa since 2010, the primarycontribution has been made by solar PV.
Africa has exceptional solar resource that canbe harnessed for electricity generation and forthermal applications.
The desert regions of North Africa and someparts of Southern and East Africa enjoyparticularly long sunny days with a highintensity of irradiation.
SOLAR IN AFRICA: OPPORTUNITY … (1)
Solar energy can be utilised at various scales, from household and community levels to industrial and
national scale operations

A EXIM Bank Study on the International Solar Alliance, shows:
▪ 40 of the 50 ISA member countries in Africa have less than 66% of the electricity, thereby
reflecting chronic electricity deficit.
▪ The problem is most acute in East Africa, where only 23% of Kenyans; 18% of Rwandans; and 15.3%
of Tanzanians have access to electricity supply.
▪ On the other hand, while access to electricity in countries like Botswana is at 53%, energy
production primarily comes from coal and oil, which remains a cause of concern from the
sustainability angle.
▪ Further, the situation in countries like South Sudan, Chad, Burundi, Liberia, and Malawi leaves
much to be desired with the share of population having access to electricity being in single digits.
The EXIM Bank Study had also explored few models of possible financing of solar projects.
The International Energy Agency (IEA) estimates that about 585 million people in Sub-Saharan Africa
lack access to electricity, with the electrification rate as low as 14.2% in rural areas
SOLAR IN AFRICA: AN OPPORTUNITY … (2)

Ministry of External Affairs have approved
earmarking 15-20% of the US$ 10 billion LOC
for undertaking solar related projects (in
Africa).
Exim Bank with the support of the
Government of India, has in the past
extended LOCs for financing Solar Projects
in some African countries aggregating to
US$ 41.08 million where projects have been
completed, and another project of US$
34.54 million in Niger is under execution.
CIS 3%
Asia 51%
LAC 3%
Africa 42%
Oceania1%
LINES OF CREDIT & ISA … (1)
209 LOCs59 countriesUS$ 15.69 bn
(as on end-March 2017)
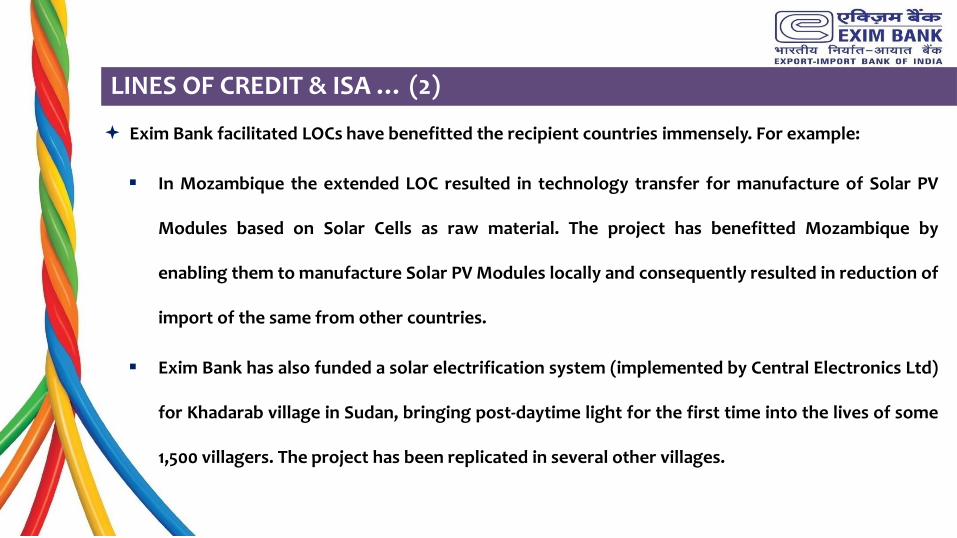
Exim Bank facilitated LOCs have benefitted the recipient countries immensely. For example:
▪ In Mozambique the extended LOC resulted in technology transfer for manufacture of Solar PV
Modules based on Solar Cells as raw material. The project has benefitted Mozambique by
enabling them to manufacture Solar PV Modules locally and consequently resulted in reduction of
import of the same from other countries.
▪ Exim Bank has also funded a solar electrification system (implemented by Central Electronics Ltd)
for Khadarab village in Sudan, bringing post-daytime light for the first time into the lives of some
1,500 villagers. The project has been replicated in several other villages.
LINES OF CREDIT & ISA … (2)

A EXIM Bank Study on the International Solar Alliance, shows:
▪ 40 of the 50 ISA member countries in Africa have less than 66% of the electricity, thereby
reflecting chronic electricity deficit.
▪ The problem is most acute in East Africa, where only 23% of Kenyans; 18% of Rwandans; and 15.3%
of Tanzanians have access to electricity supply.
▪ On the other hand, while access to electricity in countries like Botswana is at 53%, energy
production primarily comes from coal and oil, which remains a cause of concern from the
sustainability angle.
▪ Further, the situation in countries like South Sudan, Chad, Burundi, Liberia, and Malawi leaves
much to be desired with the share of population having access to electricity being in single digits.
The International Energy Agency (IEA) estimates that about 585 million people in Sub-Saharan Africa
lack access to electricity, with the electrification rate as low as 14.2% in rural areas
LINES OF CREDIT

LOC PROCESS: INITIATION OF THE GOI-LOC PROPOSAL

SIGNING OF AN LOC AGREEMENT

CONTRACT COVERAGE

DISBURSEMENTS & REPAYMENTS

Vetting / evaluation of DPR & Tender documents
Call for Expression of Interest (EOI) from Consultants / EPC contractors.
Screening of EOI
Empanelment of Consultants / EPC contractors.
Pre-qualification exercise
Vetting of draft contracts
Monitoring of projects along with MEA and Indian Mission
Appointment of a Lender’s Engineer for independent monitoring of projects
Evaluation of completed projects of value USD 50 million or more
ROLE OF EXIM BANK IN THE LOC PROCESS

COUNTRY Access to Electricity SOLAR PV (MW)
LOC Category 1:
Rate of Interest:1.5%; Maturity: 25 years; Moratorium: 5 years; Grant Element*: 37.48%
Ghana 64.06 2
Sao Tome & Principle 60.46 na
Senegal 56.50 8
Cote d'ivoire 55.80 na
Gambia 34.53 na
Mali 25.60 6
Kenya 23.00 24
Mozambique 20.20 7
Uganda 18.16 20
Rwanda 18.00 8.8
Tanzania 15.30 11
Niger 14.40 6
Sierra Leone 14.20 na
Burkina Faso 13.10 7
Liberia 9.80 na
Malawi 9.80 1
Burundi 6.50 2.2
Chad 6.40 na
LOC Categorywise: Access to Electricity & Installed Solar PV in ISA Member Countries of Africa
*Grant element calculated as per IMF prescribed formulaSource: Data derived from World Bank; IRENA; DEA-MoF, GOI; Exim Bank

LOC Categorywise: Access to Electricity & Installed Solar PV in ISA Member Countries of Africa
Country Access to Electricity Solar PV (MW) Country Access to Electricity Solar PV (MW)
LOC Category 2: Rate of Interest:1.75%; Maturity: 20 years; Moratorium: 5 years; Grant Element*: 31.37%
Egypt 100 25 Zambia 22.06 2
Seychelles 100 0.1 Mauritania 21.76 18
Cape Verde 70.56 na Congo DR 16.4 na
Comoros 69.3 na Madagascar 15.4 5
Guinea-Bissau 60.61 na South Sudan 5.06 0.2
Nigeria 55.6 17 Algeria 100 273.6
Cameroon 53.7 1.5 Angola 37 na
Djibouti 53.26 0.3 Botswana 53.24 1.7
Congo 41.6 na CAR 10.8 0.3
Zimbabwe 40.46 4.4 Equatorial Guinea 66 na
Benin 38.4 1.3 Gabon 89.3 na
Eritrea 36.08 na Guinea 26.2 na
Somalia 32.71 na Libya 100 5
Sudan 32.56 na Mauritius 100 18.2
Togo 31.46 0.6 Namibia 47.26 20.5
Ethiopia 26.56 na South Africa 85.4 1361*Grant element calculated as per IMF prescribed formulaSource: Data derived from World Bank; IRENA; DEA-MoF, GOI; Exim Bank

Partner in India’s
Globalization
www.eximbankindia.in

Trends in Installed Solar Capacity in ISA members in Africa (in MW)
2006 2007 2008 2009 2010 2011 2012 2013 2014 2015 2006 2007 2008 2009 2010 2011 2012 2013 2014 2015
Total 57.8 66.1 76.2 84.7 119.4 180.6 222 354.4 1181.6 1918.8
South Africa 15.6 16.9 18.2 19.6 23.2 67.4 72.2 147.2 922 1361 Mali 1 1.3 1.5 1.6 1.8 2.2 4.1 6 6 6
Algeria 1.9 1.9 1.9 1.9 1.9 1.9 1.9 1.9 3 273.6 Libya 1.7 2.2 2.7 3.2 3.7 4.2 4.8 5 5 5
Egypt 0.6 0.7 0.9 1.3 14.9 15 15 15 15 25 Madagascar 0.3 0.4 0.8 1.1 1.8 2.5 3.4 3.4 3.4 5
Kenya 8.8 8.9 9 9 11.3 13.6 16 20 22 24 Zimbabwe 0.8 1 1 1.1 1.8 2.2 2.8 3.9 4.4 4.4
Namibia 1.9 2.4 3 3.6 4.2 7.4 10.7 13.4 16 20.5 Burundi 0.2 0.3 0.4 0.4 0.6 0.8 1.2 2.2 2.2 2.2
Uganda 5.4 7.7 11.7 14.2 14.9 16.2 17.3 18.5 20 20 Zambia 1 1.1 1.2 1.2 1.2 1.4 1.4 1.6 2 2
Mauritius 1.4 2.5 18.2 18.2 Ghana 2 2 2
Mauritania 15 15 18 Botswana 1.7 1.7 1.7 1.7
Morocco 10.8 11.9 12.8 13.4 13.5 14 15 16 17 17.8 Cameroon 0.1 0.2 0.2 0.5 1 1.1 1.5 1.5 1.5 1.5
Nigeria 15.2 15.4 15.6 17 Benin 0.3 0.3 0.3 0.3 0.3 0.5 0.5 1 1.3 1.3
Tunisia 1 1.1 1.2 1.4 2 2.7 3.6 4.8 15 15 Malawi 0.1 0.1 0.1 0.2 0.4 0.4 0.9 0.9 0.9
Tanzania 2.1 2.5 3 3.5 4 4.5 5 8 11 14 Togo 0.1 0.1 0.1 0.1 0.2 0.4 0.5 0.6 0.6 0.6
Mayotte 13.1 13.1 13.1 Somalia 0.6 0.6
Cabo Verde 7.5 7.5 8 9 9 10 Congo 0.1 0.1 0.2 0.2 0.5
Rwanda 0.3 0.3 0.3 0.3 0.3 0.3 0.3 8.8 8.8 CAR 0.1 0.1 0.1 0.1 0.1 0.2 0.3 0.3 0.3 0.3
Senegal 1.8 2 2.3 2.6 3.3 4.8 5.9 7 8 8 Djibouti 0.3 0.3 0.3 0.3
Burkina Faso 1.2 1.6 2.3 3 3.6 5.8 5.8 6.3 7 7 South Sudan 0.2 0.2 0.2 0.2
Mozambique 0.5 1.5 4.9 7 7 Lesotho 0.2 0.2 0.2
Niger 1.1 1.1 1.2 1.2 2.1 3 4 5 6 6 Seychelles 0.1 0.1 0.1

POSSIBLE MODELS OF FINANCING SOLAR
Model 1 Model 2

POSSIBLE MODELS OF FINANCING SOLAR
Model 3 Model 4

POSSIBLE MODELS OF FINANCING SOLAR
Model 5 Model 6