Embed Size (px)
Citation preview
International Small Cap Growth Fund Portfolio Review December 2019
Simon Fennell, Partner Andy G. Flynn, CFA, Partner Portfolio Managers
9407071
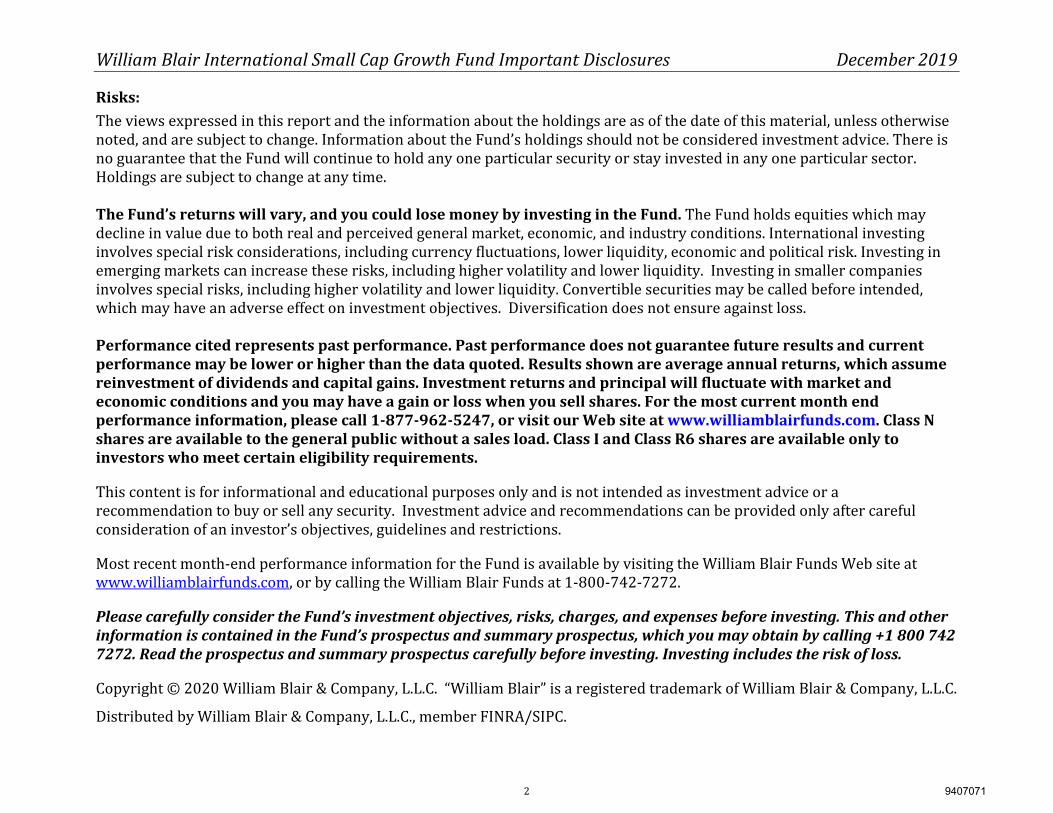
William Blair International Small Cap Growth Fund Important Disclosures December 2019
Risks: The views expressed in this report and the information about the holdings are as of the date of this material, unless otherwise noted, and are subject to change. Information about the Fund’s holdings should not be considered investment advice. There is no guarantee that the Fund will continue to hold any one particular security or stay invested in any one particular sector. Holdings are subject to change at any time. The Fund’s returns will vary, and you could lose money by investing in the Fund. The Fund holds equities which may decline in value due to both real and perceived general market, economic, and industry conditions. International investing involves special risk considerations, including currency fluctuations, lower liquidity, economic and political risk. Investing in emerging markets can increase these risks, including higher volatility and lower liquidity. Investing in smaller companies involves special risks, including higher volatility and lower liquidity. Convertible securities may be called before intended, which may have an adverse effect on investment objectives. Diversification does not ensure against loss. Performance cited represents past performance. Past performance does not guarantee future results and current performance may be lower or higher than the data quoted. Results shown are average annual returns, which assume reinvestment of dividends and capital gains. Investment returns and principal will fluctuate with market and economic conditions and you may have a gain or loss when you sell shares. For the most current month end performance information, please call 1‐877‐962‐5247, or visit our Web site at www.williamblairfunds.com. Class N shares are available to the general public without a sales load. Class I and Class R6 shares are available only to investors who meet certain eligibility requirements. This content is for informational and educational purposes only and is not intended as investment advice or a recommendation to buy or sell any security. Investment advice and recommendations can be provided only after careful consideration of an investor’s objectives, guidelines and restrictions. Most recent month-end performance information for the Fund is available by visiting the William Blair Funds Web site at www.williamblairfunds.com, or by calling the William Blair Funds at 1-800-742-7272. Please carefully consider the Fund’s investment objectives, risks, charges, and expenses before investing. This and other information is contained in the Fund’s prospectus and summary prospectus, which you may obtain by calling +1 800 742 7272. Read the prospectus and summary prospectus carefully before investing. Investing includes the risk of loss. Copyright © 2020 William Blair & Company, L.L.C. “William Blair” is a registered trademark of William Blair & Company, L.L.C. Distributed by William Blair & Company, L.L.C., member FINRA/SIPC.
2 9407071
William Blair International Small Cap Growth Fund Summary & Outlook December 2019
Market Review Despite ongoing concerns around geopolitical tensions and signals of decelerating global growth, global equities delivered robust returns in 2019 as the MSCI ACWI IMI advanced 26.35%; the best calendar year return over the past decade. After a difficult end to 2018, equity markets around the world rebounded strongly in 2019 as investor sentiment was bolstered by a more dovish tone out of major central banks and improved, albeit volatile, trade negotiations between the U.S. and China. The market rally in the first four months of the year came to a halt in May as tariff negotiations quickly soured between the U.S. and China. Global equities traded flat from May through September despite a handful of volatile swings in the market as geopolitical developments dominated economic headlines, coupled with ongoing concerns surrounding a continued slowdown in global growth. Equity markets advanced 9.05% in the fourth quarter as growth concerns moderated and progress towards a potential trade deal helped alleviate volatility. U.S. equities outperformed major market regions for the second consecutive year, advancing 30.39% (as measured by the MSCI USA IMI). The continued trend of U.S. equity dominance was mostly attributable to strength within the Information Technology sector, which gained 48.30%, bolstered by mega-cap companies such as Apple (+86.16%) and Microsoft (+55.26%). Apple and the technology hardware industry benefited from excitement surrounding the applications of fifth generation (5G) wireless technology, coupled with a de-escalation in tariffs on certain Apple products which bolstered investor sentiment.
European and U.K. equities advanced 24.44% in 2019 despite a significant slowdown in industrial production in Germany and political uncertainty for most of the year surrounding the terms of Brexit. Within Germany, manufacturing growth declined meaningfully and purchasing manager surveys continued to point to deceleration in the pace of industrial orders growth. The European Central Bank remained supportive by announcing quantitative easing measures by cutting its bank deposit rate to -0.5%— the lowest on record. After nearly four years of political uncertainty, a landslide victory for the Conservative Party in the U.K. solidified the country’s departure from the European Union. The decisive victory drove British Sterling strength and equity performance in the fourth quarter (the MSCI UK IMI advanced 11.38% in US dollar terms, 3.61% in local terms). Returns across emerging markets were mixed for calendar year 2019, with notable strength in Russia (+50.13%), Taiwan (+35.18%) and Brazil (+29.27%) offset by significant weakness in countries like Argentina (-18.04%) and Chile (-17.36%). Robust returns in Russian equities were mostly attributable to the rebound in crude oil prices and increased investor confidence after the U.S. government lifted sanctions on a number of financial companies early in the year. Outperformance in Taiwan was primarily due to the cyclical recovery of the semiconductor industry and stronger earnings expectations heading into 2020. In contrast, currency headwinds weighed on Argentina and Chile in 2019 due to political volatility within each country. From a global sector perspective, Information Technology outperformed by a wide margin in 2019. Other growth-oriented sectors such as Consumer Discretionary and 3 9407071
William Blair International Small Cap Growth Fund Summary & Outlook December 2019
Industrials also outperformed. Conversely, defensive sectors such as Energy, Materials and Utilities lagged. Performance Fourth quarter outperformance of the International Small Cap Growth Fund (Class N) versus the MSCI ACWI ex-U.S. Small Cap Index was driven by favorable stock selection across most sectors, most notably within Industrials. Strength within the Industrials sector was supported by UK-based Diploma PLC, a globally diverse distributor of essential technical products across a range of industries. Diploma’s product portfolio is focused on aftermarket, services, and replacement demand. Spending on Diploma’s products is typically funded from operating cash flows rather than capital expenditures, contributing to revenue stability despite cyclical end markets. The company’s close customer relationships, strong market position, and replacement-driven demand have resulted in high and stable cash flow generation. We believe the combination of organic growth and value-accretive M&A should continue to produce double-digit earnings growth going forward. Sweden-based Indutrade also bolstered fourth quarter performance. Indutrade is a leader in the Northern European market for industrial component distribution. The company is differentiated by its high proportion of proprietary products (38% of sales), a range of product offerings from high-quality suppliers, and a technically-savvy sales team, all of which help to reinforce close relationships with customers. Partially offsetting these positive effects were stock selection in the Information Technology and Financials sectors. Within the Information Technology sector, Japanese IT Services provider Nihon Unisys underperformed during the quarter despite solid quarterly
earnings results which reaffirmed our investment thesis. Traditionally, Nihon Unisys was predominantly a mainframe integration and services provider, but this business has wound down to 2% of revenues from 25% over the past decade. The company’s push into standardized products is timely, as Japanese businesses are finally looking to move their technology into the new era, driven by cloud computing and better connectivity speeds. Within the Financials sector, UK-based specialty insurer Beazley underperformed during the quarter. The company’s earnings results were reassuring after investor skittishness following an earnings disappointment from a competitor firm. Despite investor concerns, Beazley’s catastrophe losses were within expectations and investment returns benefitted from falling bond yields. Management reported that they continued to experience double-digit premium growth across the business as a whole, with particular strength in cybersecurity—where Beazley is unique among insurers in having a dedicated business unit that assists policyholders at every stage of incident investigation and breach response. Positioning During the fourth quarter Consumer Discretionary exposure was reduced through multiple position reductions and the liquidations of Crompton Greaves Consumer Electricals (weaker fundamentals) and Li Ning (market cap guidelines). Financials exposure was also reduced to an underweight position during the period, driven by position trims. These reductions were offset primarily by increases to Industrials and Information Technology. Within Industrials, IMCD, Belimo Holding and Voltronic Power Technology were new purchases during the period, while the Information Technology sector weighting increase was driven by additions to existing
4 9407071
William Blair International Small Cap Growth Fund Summary & Outlook December 2019
software and semiconductor-related holdings. From a geographic perspective, notable adjustments were an increase to Europe ex-U.K., offset by a reduction to Japan. Outlook Throughout 2019 we commented at length about the market’s conflicting signals and indecisiveness with respect to the outlook for economic growth and corporate performance. Were we headed toward a major global recession, or was the uncertainty around U.S. and China trade relations causing an artificial slowdown in corporate activity? Beginning in early 2019, our analysis indicated the market was overly pessimistic about the growth outlook, and thus we increased our positioning to more economically-sensitive areas of the market across all of our strategies throughout the year. This included areas such as semiconductors, capital goods and factory automation equipment. Some of our favorite stocks in these industries were not merely pricing in a slowdown, but a recession not seen since the global financial crisis of 2008. We remained resolute in our positioning and that in turn created good balance in our portfolios, helping to drive positive performance across our investment platform. In recent months there has been mounting evidence that a recession will in fact be avoided, including the bottoming of manufacturing and industrial activity, and accelerating sequential semiconductor sales. Further bolstering the outlook have been positive sentiment developments related to the likely conclusion of a Phase 1 U.S.-China trade deal, in addition to coordinated central bank money supply expansion.
We expect the economy to continue on this pace of positive, albeit restrained, growth—supporting a continuation of our current positioning at least through the early part of 2020. As expectations of more economic stability take hold, safe havens or crowded (and expensive) defensive trades will likely give way to more attractively valued cyclical industries and companies, as well as broader market participation. We started to see this play out during the fourth quarter, where valuation as a factor was the dominant force driving investment returns, reversing course from the previous nine months. The accelerating economic backdrop also bodes well for global emerging market (GEM) performance. The GEMs stock markets lagged developed markets (DMs) in 2019, but we believe this is likely to reverse in 2020. A number of developments suggest a more favorable outcome for GEMs: improving industrial activity in key markets like China and Brazil, collapsing corporate profit growth differentials between the major DMs and GEMs, and the global cyclical recovery. The trade deal and tariff clarity should act as additional catalysts. We believe Brazil will continue to be an attractive market driven by pro-growth government reforms. Private consumption will be the main driver for growth as we continue to see the benefits of a downward trajectory in benchmark interest rates—making car loans, mortgages and other consumer goods far more accessible. While economic recovery remains timid and uneven, we expect consumer activity and credit expansion to drive earnings growth. We also expect dramatically lower rates to continue to drive a rotation of domestic portfolios out of fixed income and into equities. 5 9407071
William Blair International Small Cap Growth Fund Summary & Outlook December 2019
From a sector perspective, technology remains an obvious focus for us. The demand picture appears unassailable given the convergence of tech with seemingly everything: consumer models, healthcare, finance, autos and other industrial applications. Technology as a source of corporate innovation and an enabler of superior execution are related themes that we expect will persist. As we have previously written, 5G telecommunications are likely to accelerate a pace of change that could be more transformational than 4G mobility was. While we do have concerns about mounting regulatory pressures, especially in consumer-facing internet models, the growth and return profiles of many of our leading technology holdings are only becoming more resolute, and we do not believe that valuations of these companies are inconsistent with that expected corporate performance. In many cases these advantages are found not just within the technology sector itself, but thoughtful strategic data and technology integration increasingly are the source of differentiated competitive advantages for many of our holdings across multiple industries. To that end, we have been increasing our research staffing to the tech sector, including newer associate analysts, in order to broaden and strengthen our resident expertise. This will increasingly be the foundation for our ability to analyze companies in the future “tech of everything” world. New Initiatives In December we broadened our Leaders franchise with the launch of our Global Leaders Concentrated strategy—representing our highest conviction global portfolio of 25-40 stocks diversified across market cap, region, industry and corporate lifecycle. We are excited to offer this new
strategy to clients seeking a more concentrated approach, leveraging our expertise in identifying leading companies that demonstrate consistent value creation and competitive dominance. It has been nearly one year since the launch of our ESG-focused Global Leaders strategy in Europe, which has evolved to emphasize best-in-class sustainability leaders identified by our investment team. Sustainability leaders are companies that we believe demonstrate consistent value creation and stand out for their management of natural resources, human capital and stakeholder relationships. The development of our ESG industry materiality framework and rating system has enabled a more holistic evaluation of corporate sustainability risks and opportunities that we believe will benefit all of our strategies. Spotlight on Recent Research Late in the fourth quarter we sent a broad team delegation to India. While always an attractive growth market with an abundance of interesting companies, the Indian economy has underperformed its potential for the last several years. However, our current research is indicating that India is actually closer to fulfilling its economic growth potential. Are we at a potential inflection point? Governmental reforms combined with massive advances in digital infrastructure have laid the foundation for sustained growth as India transitions to a more formalized economy. While this growth trajectory will be volatile and non-linear, we see ample evidence to support a constructive view. We will be writing about this more comprehensively in the coming weeks and months.
6 9407071
Market Performance December 2019
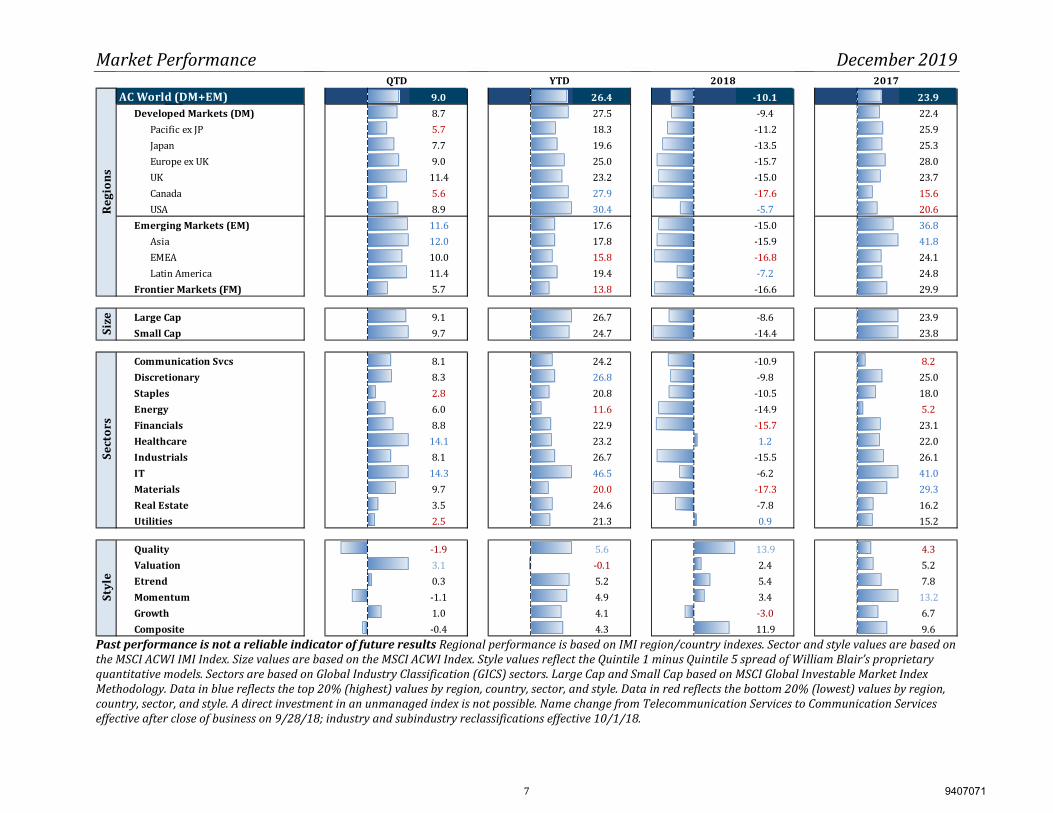
AC World (DM+EM) 9.0 26.4 -10.1 23.9Developed Markets (DM) 8.7 27.5 -9.4 22.4Pacific ex JP 5.7 18.3 -11.2 25.9Japan 7.7 19.6 -13.5 25.3Europe ex UK 9.0 25.0 -15.7 28.0UK 11.4 23.2 -15.0 23.7Canada 5.6 27.9 -17.6 15.6USA 8.9 30.4 -5.7 20.6Emerging Markets (EM) 11.6 17.6 -15.0 36.8Asia 12.0 17.8 -15.9 41.8EMEA 10.0 15.8 -16.8 24.1Latin America 11.4 19.4 -7.2 24.8Frontier Markets (FM) 5.7 13.8 -16.6 29.9Large Cap 9.1 26.7 -8.6 23.9Small Cap 9.7 24.7 -14.4 23.8Communication Svcs 8.1 24.2 -10.9 8.2Discretionary 8.3 26.8 -9.8 25.0Staples 2.8 20.8 -10.5 18.0Energy 6.0 11.6 -14.9 5.2Financials 8.8 22.9 -15.7 23.1Healthcare 14.1 23.2 1.2 22.0Industrials 8.1 26.7 -15.5 26.1IT 14.3 46.5 -6.2 41.0Materials 9.7 20.0 -17.3 29.3Real Estate 3.5 24.6 -7.8 16.2Utilities 2.5 21.3 0.9 15.2Quality -1.9 5.6 13.9 4.3Valuation 3.1 -0.1 2.4 5.2Etrend 0.3 5.2 5.4 7.8Momentum -1.1 4.9 3.4 13.2Growth 1.0 4.1 -3.0 6.7Composite -0.4 4.3 11.9 9.6
QTD YTD 2018 2017
Regi
ons
Styl
eSi
zeSe
ctor
s
Past performance is not a reliable indicator of future results Regional performance is based on IMI region/country indexes. Sector and style values are based on the MSCI ACWI IMI Index. Size values are based on the MSCI ACWI Index. Style values reflect the Quintile 1 minus Quintile 5 spread of William Blair’s proprietary quantitative models. Sectors are based on Global Industry Classification (GICS) sectors. Large Cap and Small Cap based on MSCI Global Investable Market Index Methodology. Data in blue reflects the top 20% (highest) values by region, country, sector, and style. Data in red reflects the bottom 20% (lowest) values by region, country, sector, and style. A direct investment in an unmanaged index is not possible. Name change from Telecommunication Services to Communication Services effective after close of business on 9/28/18; industry and subindustry reclassifications effective 10/1/18.
7 9407071
William Blair International Small Cap Growth Fund Performance December 2019
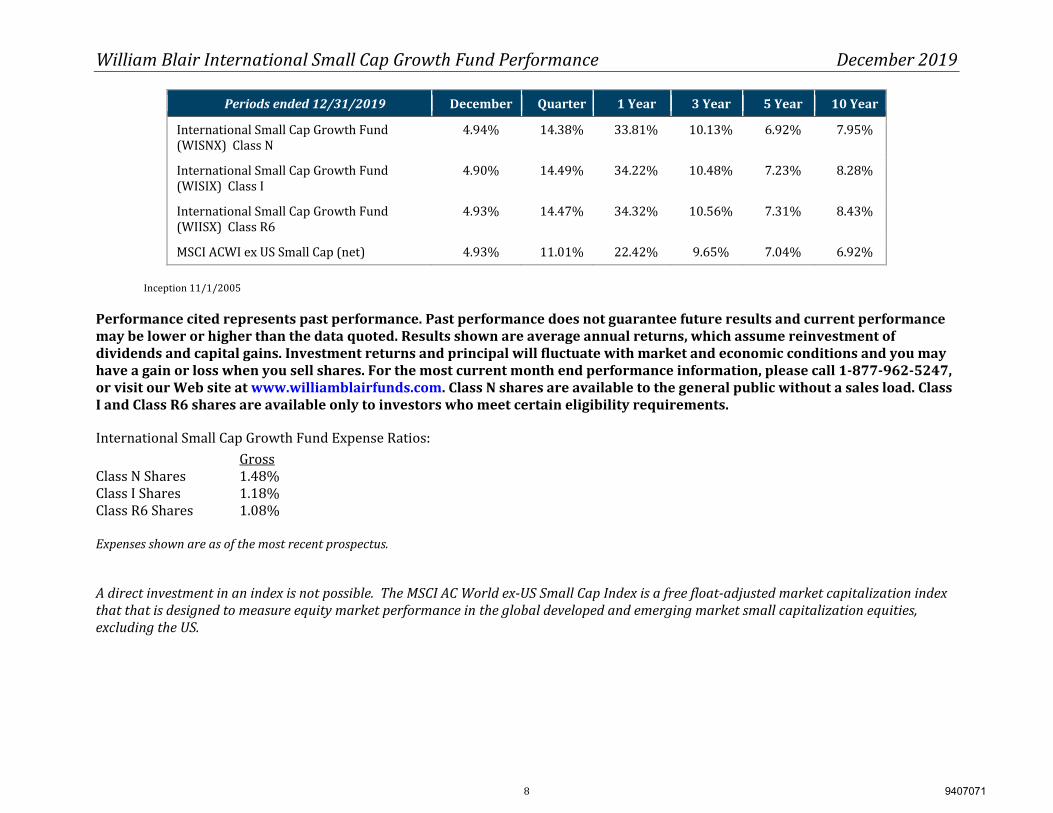
Periods ended 12/31/2019 December Quarter 1 Year 3 Year 5 Year 10 Year International Small Cap Growth Fund (WISNX) Class N 4.94% 14.38% 33.81% 10.13% 6.92% 7.95% International Small Cap Growth Fund (WISIX) Class I 4.90% 14.49% 34.22% 10.48% 7.23% 8.28% International Small Cap Growth Fund (WIISX) Class R6 4.93% 14.47% 34.32% 10.56% 7.31% 8.43% MSCI ACWI ex US Small Cap (net) 4.93% 11.01% 22.42% 9.65% 7.04% 6.92%
Inception 11/1/2005
Performance cited represents past performance. Past performance does not guarantee future results and current performance may be lower or higher than the data quoted. Results shown are average annual returns, which assume reinvestment of dividends and capital gains. Investment returns and principal will fluctuate with market and economic conditions and you may have a gain or loss when you sell shares. For the most current month end performance information, please call 1-877-962-5247, or visit our Web site at www.williamblairfunds.com. Class N shares are available to the general public without a sales load. Class I and Class R6 shares are available only to investors who meet certain eligibility requirements. International Small Cap Growth Fund Expense Ratios: Gross Class N Shares 1.48% Class I Shares 1.18% Class R6 Shares 1.08% Expenses shown are as of the most recent prospectus. A direct investment in an index is not possible. The MSCI AC World ex-US Small Cap Index is a free float-adjusted market capitalization index that that is designed to measure equity market performance in the global developed and emerging market small capitalization equities, excluding the US.
8 9407071
William Blair International Small Cap Growth Fund Performance Analysis (by sector) December 2019
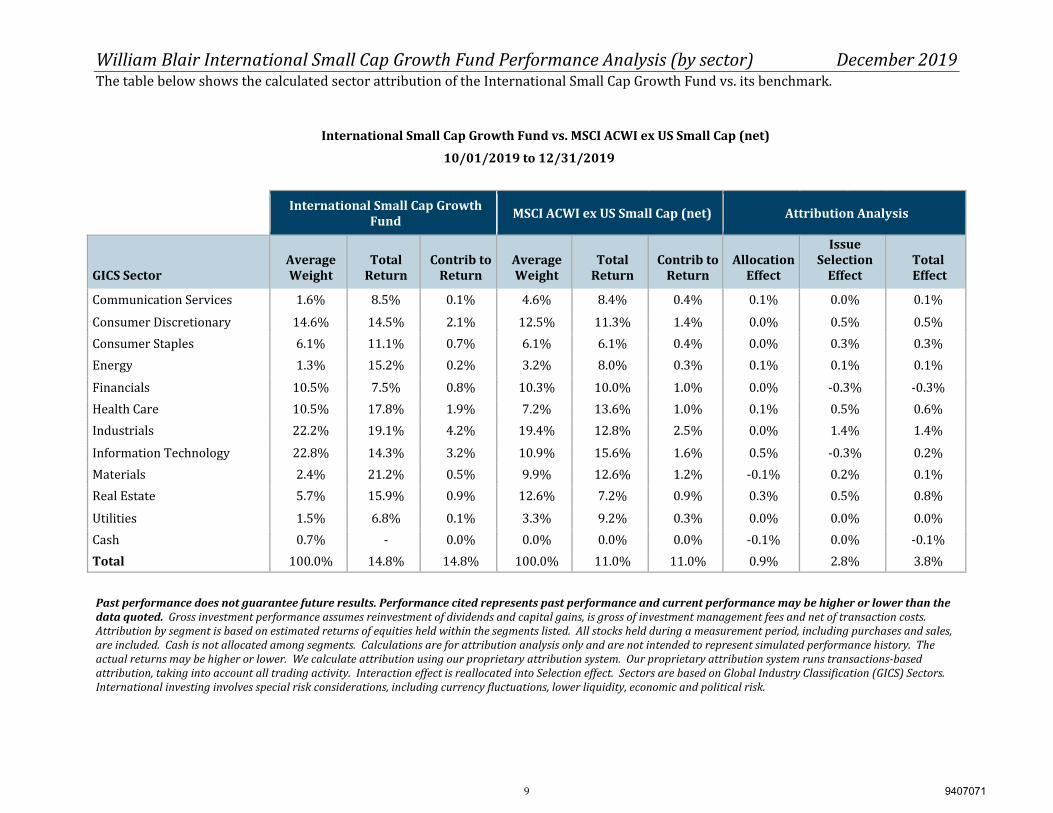
The table below shows the calculated sector attribution of the International Small Cap Growth Fund vs. its benchmark.
International Small Cap Growth Fund vs. MSCI ACWI ex US Small Cap (net)
10/01/2019 to 12/31/2019 International Small Cap Growth Fund MSCI ACWI ex US Small Cap (net) Attribution Analysis
GICS Sector
Average Weight
Total
Return
Contrib to
Return
Average Weight
Total
Return
Contrib to
Return
Allocation
Effect
Issue Selection
Effect
Total Effect Communication Services 1.6% 8.5% 0.1% 4.6% 8.4% 0.4% 0.1% 0.0% 0.1% Consumer Discretionary 14.6% 14.5% 2.1% 12.5% 11.3% 1.4% 0.0% 0.5% 0.5% Consumer Staples 6.1% 11.1% 0.7% 6.1% 6.1% 0.4% 0.0% 0.3% 0.3% Energy 1.3% 15.2% 0.2% 3.2% 8.0% 0.3% 0.1% 0.1% 0.1% Financials 10.5% 7.5% 0.8% 10.3% 10.0% 1.0% 0.0% -0.3% -0.3% Health Care 10.5% 17.8% 1.9% 7.2% 13.6% 1.0% 0.1% 0.5% 0.6% Industrials 22.2% 19.1% 4.2% 19.4% 12.8% 2.5% 0.0% 1.4% 1.4% Information Technology 22.8% 14.3% 3.2% 10.9% 15.6% 1.6% 0.5% -0.3% 0.2% Materials 2.4% 21.2% 0.5% 9.9% 12.6% 1.2% -0.1% 0.2% 0.1% Real Estate 5.7% 15.9% 0.9% 12.6% 7.2% 0.9% 0.3% 0.5% 0.8% Utilities 1.5% 6.8% 0.1% 3.3% 9.2% 0.3% 0.0% 0.0% 0.0% Cash 0.7% - 0.0% 0.0% 0.0% 0.0% -0.1% 0.0% -0.1%
Total 100.0% 14.8% 14.8% 100.0% 11.0% 11.0% 0.9% 2.8% 3.8% Past performance does not guarantee future results. Performance cited represents past performance and current performance may be higher or lower than the data quoted. Gross investment performance assumes reinvestment of dividends and capital gains, is gross of investment management fees and net of transaction costs. Attribution by segment is based on estimated returns of equities held within the segments listed. All stocks held during a measurement period, including purchases and sales, are included. Cash is not allocated among segments. Calculations are for attribution analysis only and are not intended to represent simulated performance history. The actual returns may be higher or lower. We calculate attribution using our proprietary attribution system. Our proprietary attribution system runs transactions-based attribution, taking into account all trading activity. Interaction effect is reallocated into Selection effect. Sectors are based on Global Industry Classification (GICS) Sectors. International investing involves special risk considerations, including currency fluctuations, lower liquidity, economic and political risk.
9 9407071
William Blair International Small Cap Growth Fund Performance Analysis (by region) December 2019
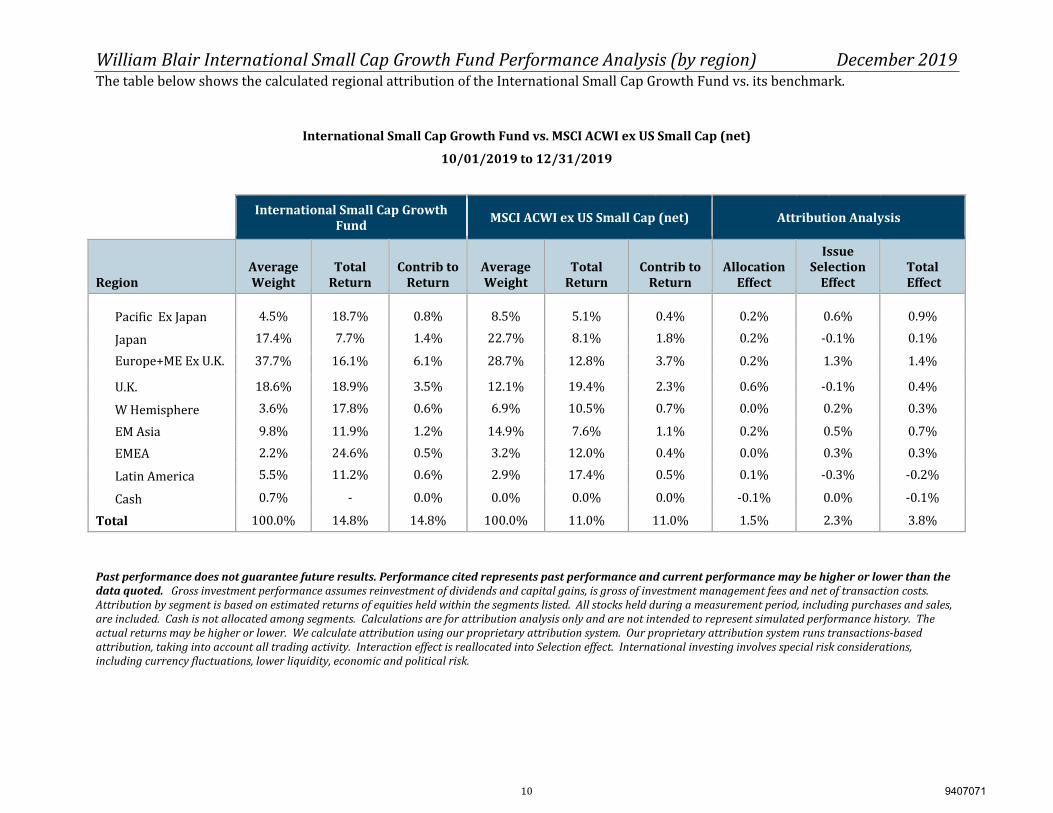
The table below shows the calculated regional attribution of the International Small Cap Growth Fund vs. its benchmark.
International Small Cap Growth Fund vs. MSCI ACWI ex US Small Cap (net)
10/01/2019 to 12/31/2019 International Small Cap Growth Fund MSCI ACWI ex US Small Cap (net) Attribution Analysis
Region
Average Weight
Total
Return
Contrib to
Return
Average Weight
Total
Return
Contrib to
Return
Allocation
Effect
Issue Selection
Effect
Total Effect Pacific Ex Japan 4.5% 18.7% 0.8% 8.5% 5.1% 0.4% 0.2% 0.6% 0.9% Japan 17.4% 7.7% 1.4% 22.7% 8.1% 1.8% 0.2% -0.1% 0.1% Europe+ME Ex U.K. 37.7% 16.1% 6.1% 28.7% 12.8% 3.7% 0.2% 1.3% 1.4% U.K. 18.6% 18.9% 3.5% 12.1% 19.4% 2.3% 0.6% -0.1% 0.4% W Hemisphere 3.6% 17.8% 0.6% 6.9% 10.5% 0.7% 0.0% 0.2% 0.3% EM Asia 9.8% 11.9% 1.2% 14.9% 7.6% 1.1% 0.2% 0.5% 0.7% EMEA 2.2% 24.6% 0.5% 3.2% 12.0% 0.4% 0.0% 0.3% 0.3% Latin America 5.5% 11.2% 0.6% 2.9% 17.4% 0.5% 0.1% -0.3% -0.2% Cash 0.7% - 0.0% 0.0% 0.0% 0.0% -0.1% 0.0% -0.1%
Total 100.0% 14.8% 14.8% 100.0% 11.0% 11.0% 1.5% 2.3% 3.8% Past performance does not guarantee future results. Performance cited represents past performance and current performance may be higher or lower than the data quoted. Gross investment performance assumes reinvestment of dividends and capital gains, is gross of investment management fees and net of transaction costs. Attribution by segment is based on estimated returns of equities held within the segments listed. All stocks held during a measurement period, including purchases and sales, are included. Cash is not allocated among segments. Calculations are for attribution analysis only and are not intended to represent simulated performance history. The actual returns may be higher or lower. We calculate attribution using our proprietary attribution system. Our proprietary attribution system runs transactions-based attribution, taking into account all trading activity. Interaction effect is reallocated into Selection effect. International investing involves special risk considerations, including currency fluctuations, lower liquidity, economic and political risk.
10 9407071
William Blair International Small Cap Growth Fund Top Contributors/Detractors December 2019
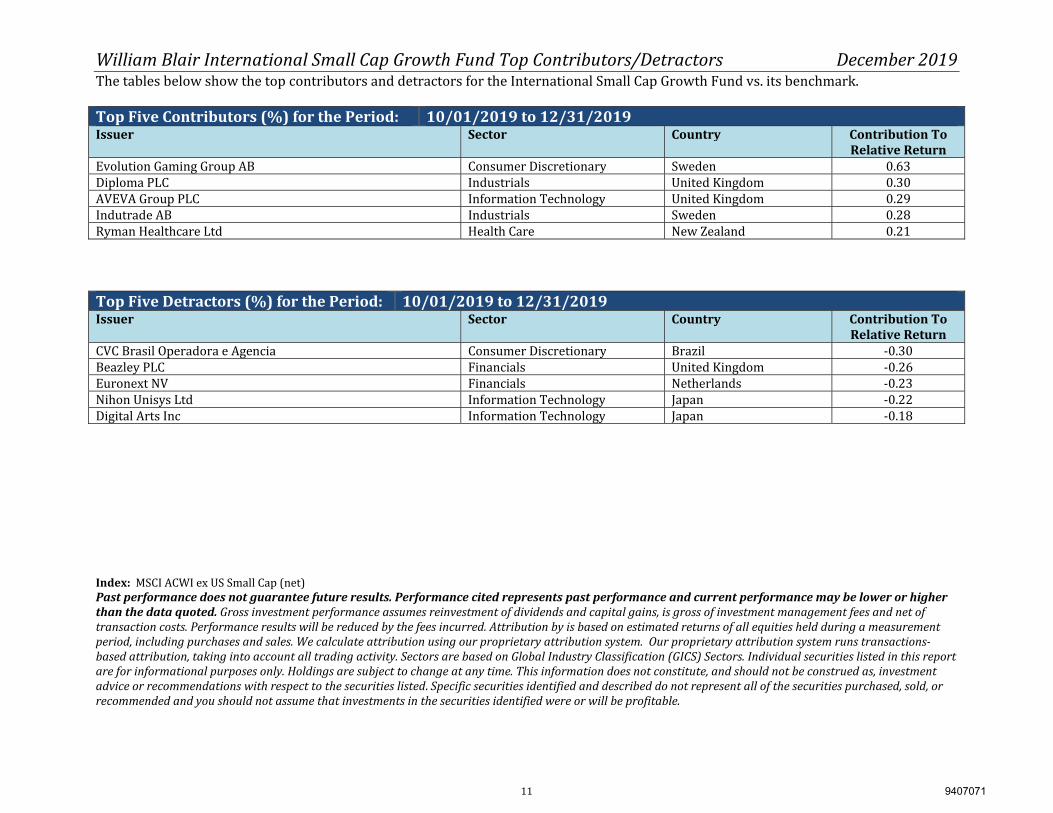
The tables below show the top contributors and detractors for the International Small Cap Growth Fund vs. its benchmark. Top Five Contributors (%) for the Period: 10/01/2019 to 12/31/2019 Issuer Sector Country Contribution To
Relative Return Evolution Gaming Group AB Consumer Discretionary Sweden 0.63 Diploma PLC Industrials United Kingdom 0.30 AVEVA Group PLC Information Technology United Kingdom 0.29 Indutrade AB Industrials Sweden 0.28 Ryman Healthcare Ltd Health Care New Zealand 0.21 Top Five Detractors (%) for the Period: 10/01/2019 to 12/31/2019 Issuer Sector Country Contribution To
Relative Return CVC Brasil Operadora e Agencia Consumer Discretionary Brazil -0.30 Beazley PLC Financials United Kingdom -0.26 Euronext NV Financials Netherlands -0.23 Nihon Unisys Ltd Information Technology Japan -0.22 Digital Arts Inc Information Technology Japan -0.18 Index: MSCI ACWI ex US Small Cap (net) Past performance does not guarantee future results. Performance cited represents past performance and current performance may be lower or higher than the data quoted. Gross investment performance assumes reinvestment of dividends and capital gains, is gross of investment management fees and net of transaction costs. Performance results will be reduced by the fees incurred. Attribution by is based on estimated returns of all equities held during a measurement period, including purchases and sales. We calculate attribution using our proprietary attribution system. Our proprietary attribution system runs transactions-based attribution, taking into account all trading activity. Sectors are based on Global Industry Classification (GICS) Sectors. Individual securities listed in this report are for informational purposes only. Holdings are subject to change at any time. This information does not constitute, and should not be construed as, investment advice or recommendations with respect to the securities listed. Specific securities identified and described do not represent all of the securities purchased, sold, or recommended and you should not assume that investments in the securities identified were or will be profitable.
11 9407071
William Blair International Small Cap Growth Fund Positioning December 2019
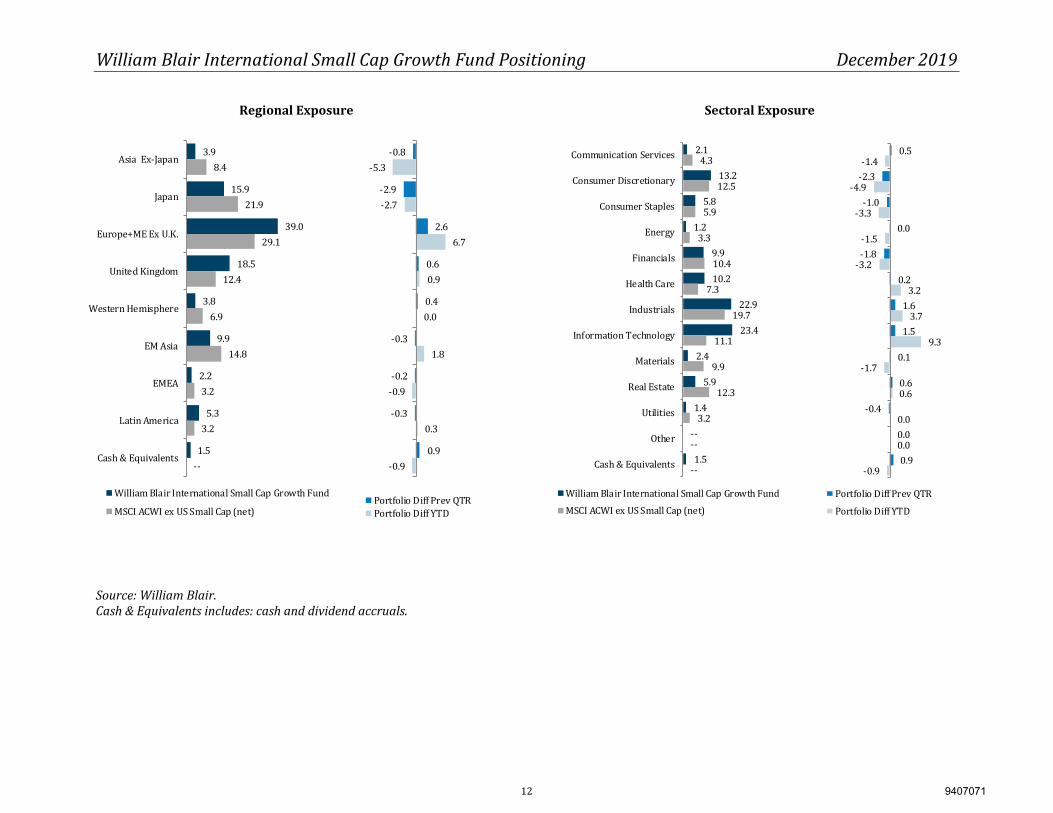
Regional Exposure Sectoral Exposure
3.915.9
39.018.5
3.89.9
2.25.3
1.5
8.421.9
29.112.4
6.914.8
3.23.2
--
Asia Ex-JapanJapan
Europe+ME Ex U.K.United Kingdom
Western HemisphereEM Asia
EMEALatin America
Cash & EquivalentsWilliam Blair International Small Cap Growth FundMSCI ACWI ex US Small Cap (net)
-0.8-2.9
2.60.60.4
-0.3-0.2-0.3
0.9
-5.3-2.7
6.70.9
0.01.8
-0.90.3
-0.9Portfolio Diff Prev QTRPortfolio Diff YTD
2.1 13.25.81.2 9.910.2 22.923.42.45.91.4--1.5
4.3 12.55.93.3 10.47.3 19.711.19.912.33.2----
Communication ServicesConsumer DiscretionaryConsumer StaplesEnergyFinancialsHealth CareIndustrialsInformation TechnologyMaterialsReal EstateUtilitiesOtherCash & EquivalentsWilliam Blair International Small Cap Growth FundMSCI ACWI ex US Small Cap (net)
0.5-2.3-1.0 0.0-1.8 0.21.61.50.10.6-0.4 0.00.9
-1.4-4.9-3.3-1.5-3.2 3.23.7 9.3-1.7 0.60.00.0-0.9Portfolio Diff Prev QTRPortfolio Diff YTD Source: William Blair. Cash & Equivalents includes: cash and dividend accruals.
12 9407071
William Blair International Small Cap Growth Fund Top Holdings by Market Cap December 2019
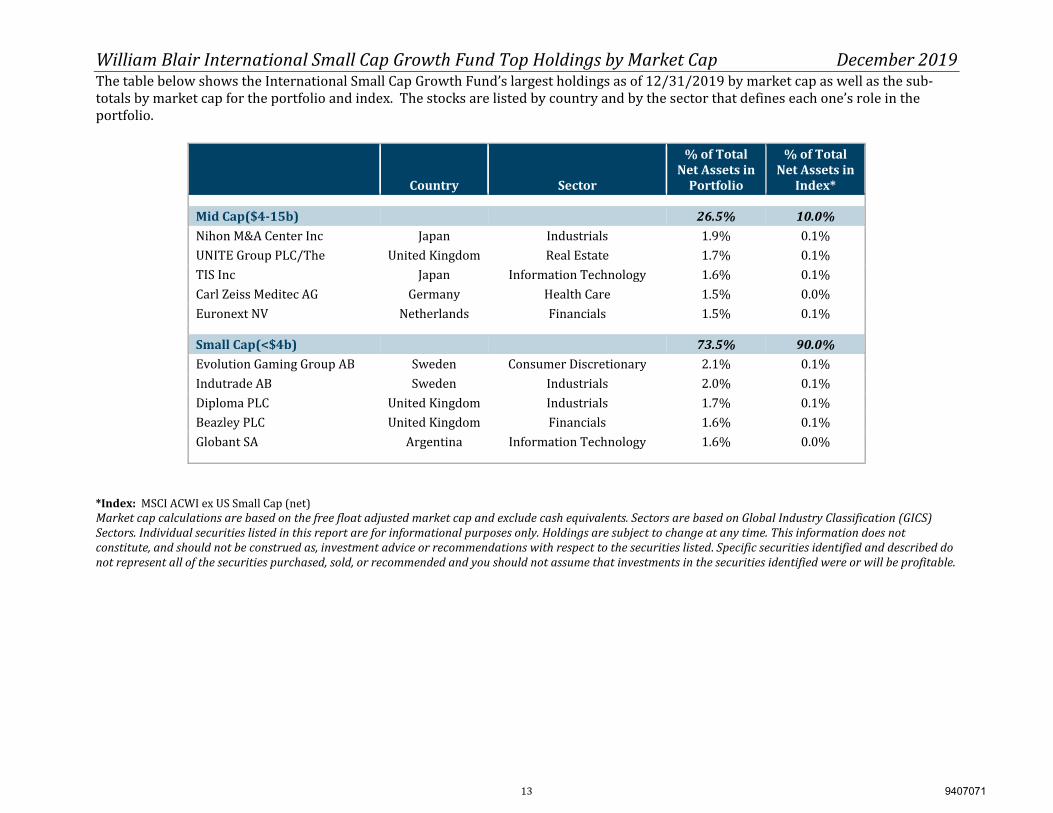
The table below shows the International Small Cap Growth Fund’s largest holdings as of 12/31/2019 by market cap as well as the sub-totals by market cap for the portfolio and index. The stocks are listed by country and by the sector that defines each one’s role in the portfolio. Country Sector
% of Total Net Assets in
Portfolio
% of Total Net Assets in
Index*
Mid Cap($4-15b) 26.5% 10.0% Nihon M&A Center Inc Japan Industrials 1.9% 0.1% UNITE Group PLC/The United Kingdom Real Estate 1.7% 0.1% TIS Inc Japan Information Technology 1.6% 0.1% Carl Zeiss Meditec AG Germany Health Care 1.5% 0.0% Euronext NV Netherlands Financials 1.5% 0.1% Small Cap(<$4b) 73.5% 90.0% Evolution Gaming Group AB Sweden Consumer Discretionary 2.1% 0.1% Indutrade AB Sweden Industrials 2.0% 0.1% Diploma PLC United Kingdom Industrials 1.7% 0.1% Beazley PLC United Kingdom Financials 1.6% 0.1% Globant SA Argentina Information Technology 1.6% 0.0%
*Index: MSCI ACWI ex US Small Cap (net) Market cap calculations are based on the free float adjusted market cap and exclude cash equivalents. Sectors are based on Global Industry Classification (GICS) Sectors. Individual securities listed in this report are for informational purposes only. Holdings are subject to change at any time. This information does not constitute, and should not be construed as, investment advice or recommendations with respect to the securities listed. Specific securities identified and described do not represent all of the securities purchased, sold, or recommended and you should not assume that investments in the securities identified were or will be profitable.
13 9407071
William Blair International Small Cap Growth Fund Top Portfolio Changes December 2019
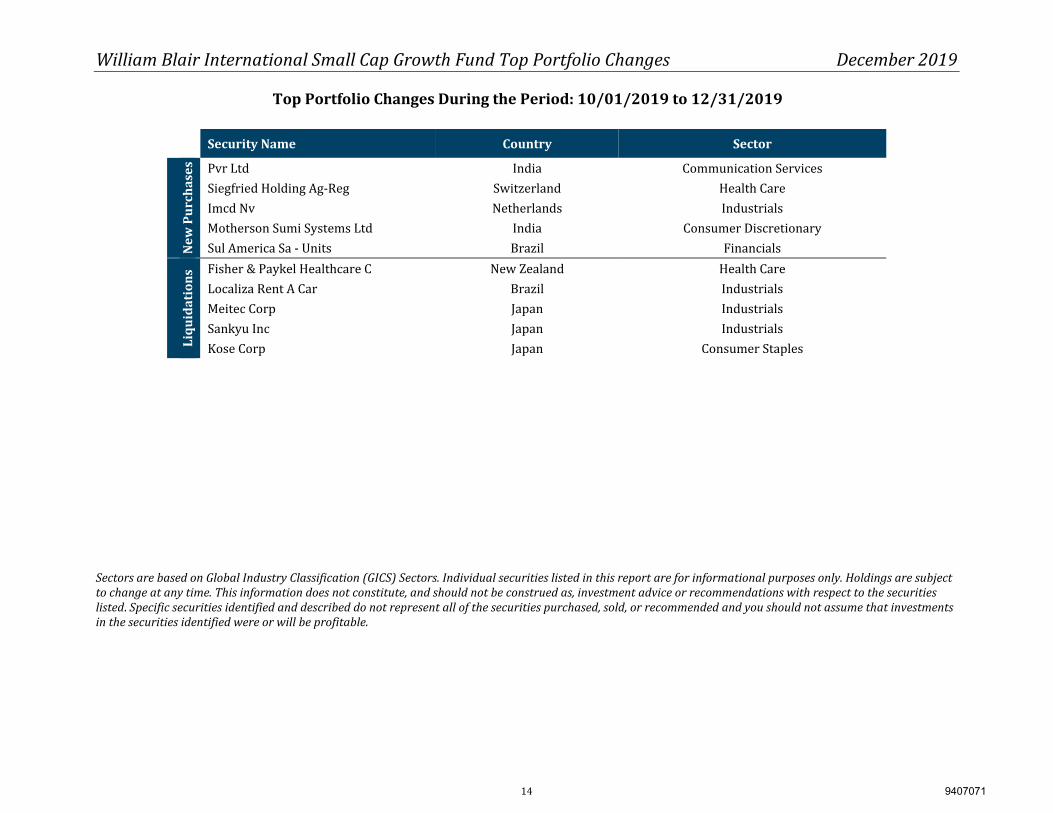
Top Portfolio Changes During the Period: 10/01/2019 to 12/31/2019
Security Name Country Sector
New
Pur
chas
es Pvr Ltd India Communication Services Siegfried Holding Ag-Reg Switzerland Health Care Imcd Nv Netherlands Industrials Motherson Sumi Systems Ltd India Consumer Discretionary Sul America Sa - Units Brazil Financials
Liqu
idat
ions
Fisher & Paykel Healthcare C New Zealand Health Care Localiza Rent A Car Brazil Industrials Meitec Corp Japan Industrials Sankyu Inc Japan Industrials Kose Corp Japan Consumer Staples Sectors are based on Global Industry Classification (GICS) Sectors. Individual securities listed in this report are for informational purposes only. Holdings are subject to change at any time. This information does not constitute, and should not be construed as, investment advice or recommendations with respect to the securities listed. Specific securities identified and described do not represent all of the securities purchased, sold, or recommended and you should not assume that investments in the securities identified were or will be profitable.
14 9407071
William Blair International Small Cap Growth Fund Characteristics December 2019
International Small Cap Growth Fund
MSCI ACWI ex US Small Cap (net) Difference
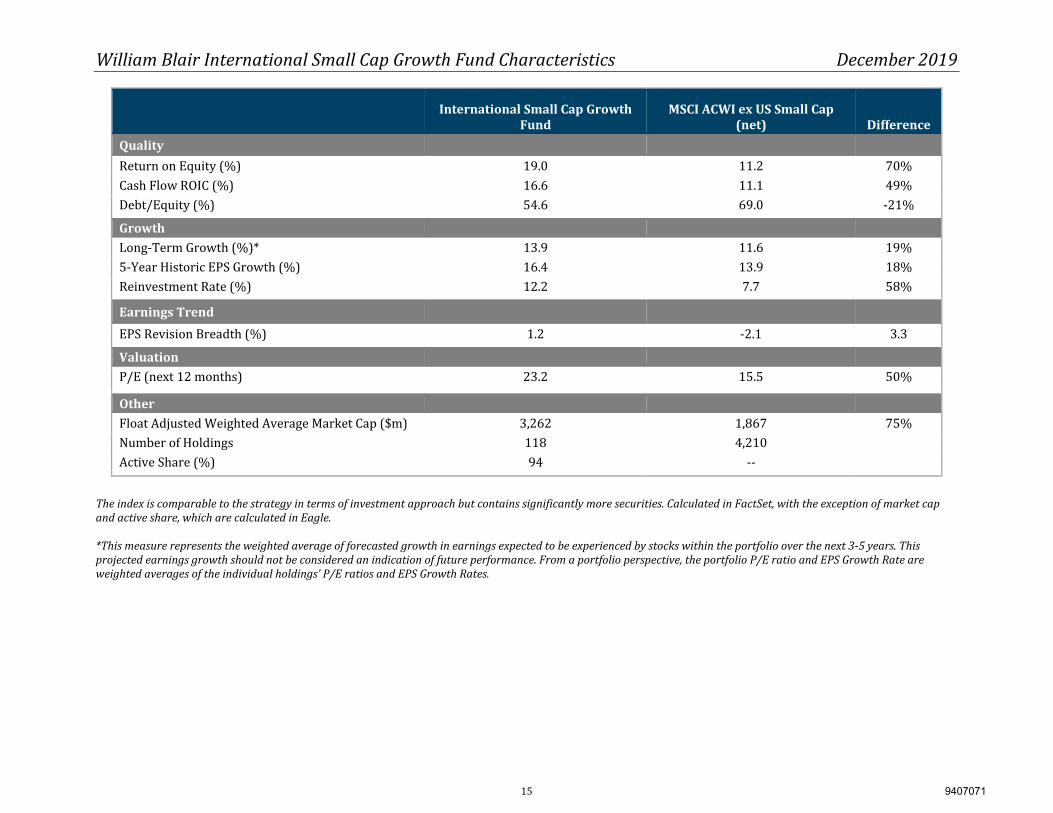
Quality Return on Equity (%) 19.0 11.2 70% Cash Flow ROIC (%) 16.6 11.1 49% Debt/Equity (%) 54.6 69.0 -21% Growth Long-Term Growth (%)* 13.9 11.6 19% 5-Year Historic EPS Growth (%) 16.4 13.9 18% Reinvestment Rate (%) 12.2 7.7 58% Earnings Trend EPS Revision Breadth (%) 1.2 -2.1 3.3 Valuation P/E (next 12 months) 23.2 15.5 50% Other Float Adjusted Weighted Average Market Cap ($m) 3,262 1,867 75% Number of Holdings 118 4,210 Active Share (%) 94 --
The index is comparable to the strategy in terms of investment approach but contains significantly more securities. Calculated in FactSet, with the exception of market cap and active share, which are calculated in Eagle. *This measure represents the weighted average of forecasted growth in earnings expected to be experienced by stocks within the portfolio over the next 3-5 years. This projected earnings growth should not be considered an indication of future performance. From a portfolio perspective, the portfolio P/E ratio and EPS Growth Rate are weighted averages of the individual holdings’ P/E ratios and EPS Growth Rates.
15 9407071
William Blair International Small Cap Growth Fund Holdings December 2019
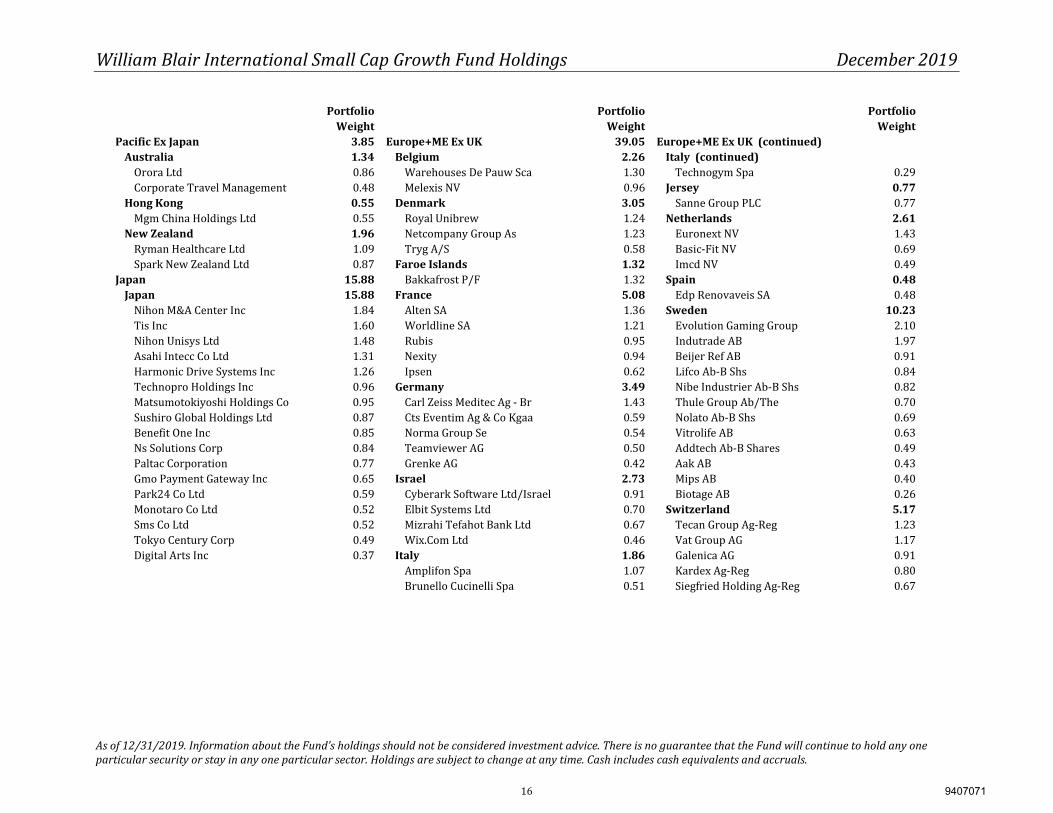
As of 12/31/2019. Information about the Fund’s holdings should not be considered investment advice. There is no guarantee that the Fund will continue to hold any one particular security or stay in any one particular sector. Holdings are subject to change at any time. Cash includes cash equivalents and accruals.
Portfolio Portfolio Portfolio Weight Weight Weight
Pacific Ex Japan 3.85 Europe+ME Ex UK 39.05 Europe+ME Ex UK (continued) Australia 1.34 Belgium 2.26 Italy (continued) Orora Ltd 0.86 Warehouses De Pauw Sca 1.30 Technogym Spa 0.29 Corporate Travel Management 0.48 Melexis NV 0.96 Jersey 0.77 Hong Kong 0.55 Denmark 3.05 Sanne Group PLC 0.77 Mgm China Holdings Ltd 0.55 Royal Unibrew 1.24 Netherlands 2.61 New Zealand 1.96 Netcompany Group As 1.23 Euronext NV 1.43 Ryman Healthcare Ltd 1.09 Tryg A/S 0.58 Basic-Fit NV 0.69 Spark New Zealand Ltd 0.87 Faroe Islands 1.32 Imcd NV 0.49
Japan 15.88 Bakkafrost P/F 1.32 Spain 0.48 Japan 15.88 France 5.08 Edp Renovaveis SA 0.48 Nihon M&A Center Inc 1.84 Alten SA 1.36 Sweden 10.23 Tis Inc 1.60 Worldline SA 1.21 Evolution Gaming Group 2.10 Nihon Unisys Ltd 1.48 Rubis 0.95 Indutrade AB 1.97 Asahi Intecc Co Ltd 1.31 Nexity 0.94 Beijer Ref AB 0.91 Harmonic Drive Systems Inc 1.26 Ipsen 0.62 Lifco Ab-B Shs 0.84 Technopro Holdings Inc 0.96 Germany 3.49 Nibe Industrier Ab-B Shs 0.82 Matsumotokiyoshi Holdings Co 0.95 Carl Zeiss Meditec Ag - Br 1.43 Thule Group Ab/The 0.70 Sushiro Global Holdings Ltd 0.87 Cts Eventim Ag & Co Kgaa 0.59 Nolato Ab-B Shs 0.69 Benefit One Inc 0.85 Norma Group Se 0.54 Vitrolife AB 0.63 Ns Solutions Corp 0.84 Teamviewer AG 0.50 Addtech Ab-B Shares 0.49 Paltac Corporation 0.77 Grenke AG 0.42 Aak AB 0.43 Gmo Payment Gateway Inc 0.65 Israel 2.73 Mips AB 0.40 Park24 Co Ltd 0.59 Cyberark Software Ltd/Israel 0.91 Biotage AB 0.26 Monotaro Co Ltd 0.52 Elbit Systems Ltd 0.70 Switzerland 5.17 Sms Co Ltd 0.52 Mizrahi Tefahot Bank Ltd 0.67 Tecan Group Ag-Reg 1.23 Tokyo Century Corp 0.49 Wix.Com Ltd 0.46 Vat Group AG 1.17 Digital Arts Inc 0.37 Italy 1.86 Galenica AG 0.91 Amplifon Spa 1.07 Kardex Ag-Reg 0.80 Brunello Cucinelli Spa 0.51 Siegfried Holding Ag-Reg 0.67
16 9407071
William Blair International Small Cap Growth Fund Holdings December 2019
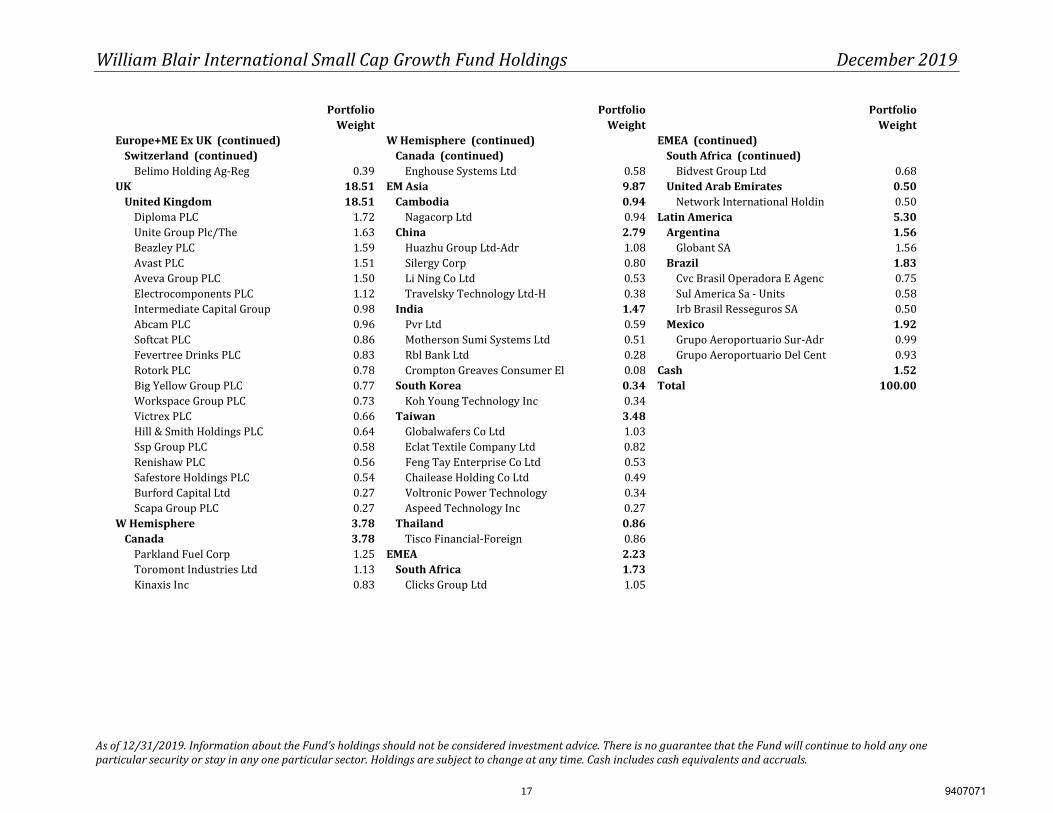
As of 12/31/2019. Information about the Fund’s holdings should not be considered investment advice. There is no guarantee that the Fund will continue to hold any one particular security or stay in any one particular sector. Holdings are subject to change at any time. Cash includes cash equivalents and accruals.
Portfolio Portfolio Portfolio Weight Weight Weight Europe+ME Ex UK (continued) W Hemisphere (continued) EMEA (continued)
Switzerland (continued) Canada (continued) South Africa (continued) Belimo Holding Ag-Reg 0.39 Enghouse Systems Ltd 0.58 Bidvest Group Ltd 0.68 UK 18.51 EM Asia 9.87 United Arab Emirates 0.50
United Kingdom 18.51 Cambodia 0.94 Network International Holdin 0.50 Diploma PLC 1.72 Nagacorp Ltd 0.94 Latin America 5.30 Unite Group Plc/The 1.63 China 2.79 Argentina 1.56 Beazley PLC 1.59 Huazhu Group Ltd-Adr 1.08 Globant SA 1.56 Avast PLC 1.51 Silergy Corp 0.80 Brazil 1.83 Aveva Group PLC 1.50 Li Ning Co Ltd 0.53 Cvc Brasil Operadora E Agenc 0.75 Electrocomponents PLC 1.12 Travelsky Technology Ltd-H 0.38 Sul America Sa - Units 0.58 Intermediate Capital Group 0.98 India 1.47 Irb Brasil Resseguros SA 0.50 Abcam PLC 0.96 Pvr Ltd 0.59 Mexico 1.92 Softcat PLC 0.86 Motherson Sumi Systems Ltd 0.51 Grupo Aeroportuario Sur-Adr 0.99 Fevertree Drinks PLC 0.83 Rbl Bank Ltd 0.28 Grupo Aeroportuario Del Cent 0.93 Rotork PLC 0.78 Crompton Greaves Consumer El 0.08 Cash 1.52 Big Yellow Group PLC 0.77 South Korea 0.34 Total 100.00 Workspace Group PLC 0.73 Koh Young Technology Inc 0.34 Victrex PLC 0.66 Taiwan 3.48 Hill & Smith Holdings PLC 0.64 Globalwafers Co Ltd 1.03 Ssp Group PLC 0.58 Eclat Textile Company Ltd 0.82 Renishaw PLC 0.56 Feng Tay Enterprise Co Ltd 0.53 Safestore Holdings PLC 0.54 Chailease Holding Co Ltd 0.49 Burford Capital Ltd 0.27 Voltronic Power Technology 0.34 Scapa Group PLC 0.27 Aspeed Technology Inc 0.27 W Hemisphere 3.78 Thailand 0.86
Canada 3.78 Tisco Financial-Foreign 0.86 Parkland Fuel Corp 1.25 EMEA 2.23 Toromont Industries Ltd 1.13 South Africa 1.73 Kinaxis Inc 0.83 Clicks Group Ltd 1.05
17 9407071
Glossary - Terms
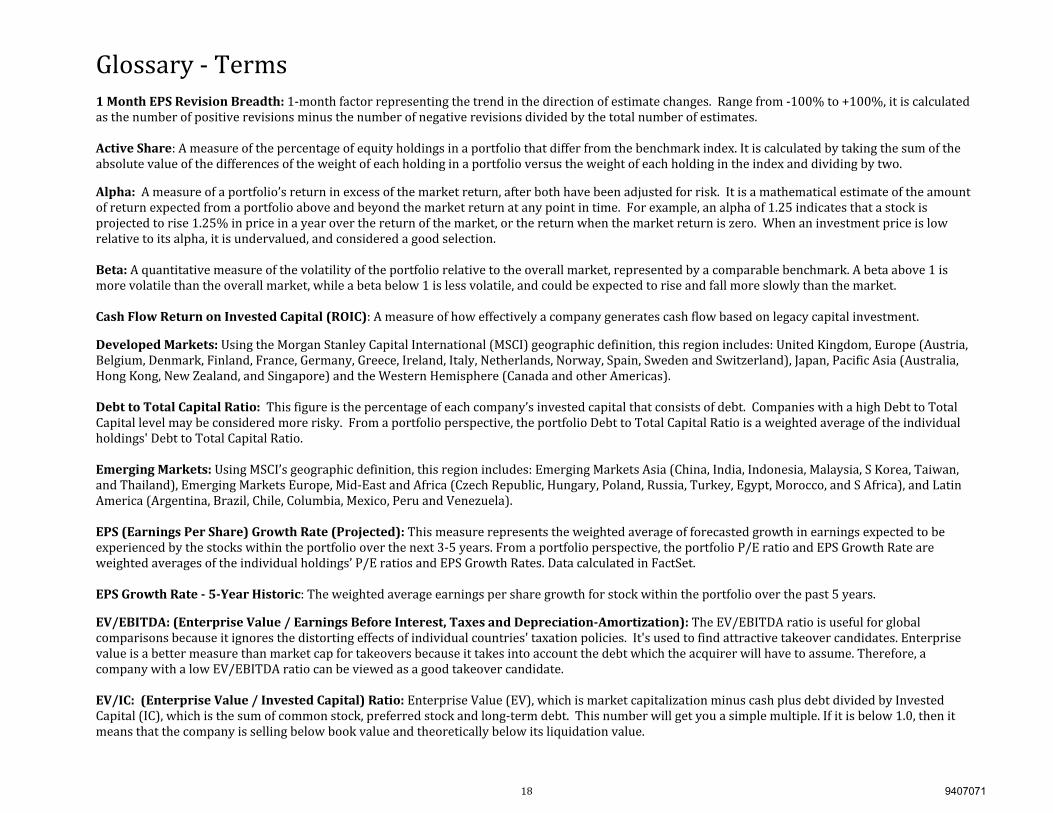
1 Month EPS Revision Breadth: 1-month factor representing the trend in the direction of estimate changes. Range from -100% to +100%, it is calculated as the number of positive revisions minus the number of negative revisions divided by the total number of estimates. Active Share: A measure of the percentage of equity holdings in a portfolio that differ from the benchmark index. It is calculated by taking the sum of the absolute value of the differences of the weight of each holding in a portfolio versus the weight of each holding in the index and dividing by two. Alpha: A measure of a portfolio’s return in excess of the market return, after both have been adjusted for risk. It is a mathematical estimate of the amount of return expected from a portfolio above and beyond the market return at any point in time. For example, an alpha of 1.25 indicates that a stock is projected to rise 1.25% in price in a year over the return of the market, or the return when the market return is zero. When an investment price is low relative to its alpha, it is undervalued, and considered a good selection. Beta: A quantitative measure of the volatility of the portfolio relative to the overall market, represented by a comparable benchmark. A beta above 1 is more volatile than the overall market, while a beta below 1 is less volatile, and could be expected to rise and fall more slowly than the market. Cash Flow Return on Invested Capital (ROIC): A measure of how effectively a company generates cash flow based on legacy capital investment. Developed Markets: Using the Morgan Stanley Capital International (MSCI) geographic definition, this region includes: United Kingdom, Europe (Austria, Belgium, Denmark, Finland, France, Germany, Greece, Ireland, Italy, Netherlands, Norway, Spain, Sweden and Switzerland), Japan, Pacific Asia (Australia, Hong Kong, New Zealand, and Singapore) and the Western Hemisphere (Canada and other Americas). Debt to Total Capital Ratio: This figure is the percentage of each company’s invested capital that consists of debt. Companies with a high Debt to Total Capital level may be considered more risky. From a portfolio perspective, the portfolio Debt to Total Capital Ratio is a weighted average of the individual holdings' Debt to Total Capital Ratio. Emerging Markets: Using MSCI’s geographic definition, this region includes: Emerging Markets Asia (China, India, Indonesia, Malaysia, S Korea, Taiwan, and Thailand), Emerging Markets Europe, Mid-East and Africa (Czech Republic, Hungary, Poland, Russia, Turkey, Egypt, Morocco, and S Africa), and Latin America (Argentina, Brazil, Chile, Columbia, Mexico, Peru and Venezuela). EPS (Earnings Per Share) Growth Rate (Projected): This measure represents the weighted average of forecasted growth in earnings expected to be experienced by the stocks within the portfolio over the next 3-5 years. From a portfolio perspective, the portfolio P/E ratio and EPS Growth Rate are weighted averages of the individual holdings’ P/E ratios and EPS Growth Rates. Data calculated in FactSet. EPS Growth Rate - 5-Year Historic: The weighted average earnings per share growth for stock within the portfolio over the past 5 years. EV/EBITDA: (Enterprise Value / Earnings Before Interest, Taxes and Depreciation-Amortization): The EV/EBITDA ratio is useful for global comparisons because it ignores the distorting effects of individual countries' taxation policies. It's used to find attractive takeover candidates. Enterprise value is a better measure than market cap for takeovers because it takes into account the debt which the acquirer will have to assume. Therefore, a company with a low EV/EBITDA ratio can be viewed as a good takeover candidate. EV/IC: (Enterprise Value / Invested Capital) Ratio: Enterprise Value (EV), which is market capitalization minus cash plus debt divided by Invested Capital (IC), which is the sum of common stock, preferred stock and long-term debt. This number will get you a simple multiple. If it is below 1.0, then it means that the company is selling below book value and theoretically below its liquidation value.
18 9407071
Glossary - Terms
Information Coefficient: A measure of the correlation between expected and actual returns. Information Ratio: A measure of risk-adjusted return. The annualized excess return of the portfolio relative to a respective benchmark, divided by the annualized tracking error relative to that same benchmark. The higher the measure, the higher the risk-adjusted return. PBV: (Price/Book Value) Ratio: The PBV Ratio measures the value of a company's common stock relative to its shareholder's equity. A price-to-book multiple above one means that the price of the company's common stock is higher than its common shareholder's equity. A price-to-book multiple below one means that the price of the company's common stock are less than its break-up value, and the shares may be undervalued. PCF: (Price/CashFlow): Some analysts favor the price/cash flow over the price-earnings (PE) ratio as a measure of a company’s value. Cash flow is a measure of a company's financial health. It equals cash receipts minus cash payments over a given period of time. P/E: (Price/Earnings) Ratio: This is the most common measure of how expensive a stock is. Simply, it is the cost an investor in a given stock must pay per dollar of current annual earnings. A high P/E generally indicates that the market is paying more to obtain the stock because it has confidence in the company’s ability to increase its earnings. Conversely, a low P/E often indicates that the market has less confidence that the company’s earnings will increase rapidly or steadily, and therefore will not pay as much for its stock. R-squared: A measurement of how closely the portfolio’s performance correlates with the performance of its benchmark, such as the MSC AC World Free ex US Index. In other words, it is a measurement of what portion of a portfolio’s performance can be explained by the performance of the overall market or index. Ranges from 0 to 1, where 0 indicates no correlation and 1 indicates perfect correlation. Risk (Standard Deviation): A measure of the portfolio’s risk. A higher standard deviation represents a greater dispersion of returns, and thus a greater amount of risk. The annualized standard deviation is calculated using monthly returns. Sharpe-Ratio: A risk-adjusted measure calculated using standard deviation and excess return (Portfolio return – Risk Free Rate) to determine reward per unit of risk. The higher the Sharpe ratio, the better the portfolio’s historic risk-adjusted performance. Tracking Error: Tracking Error measures the extent to which a portfolio tracks its benchmark. The tracking error of an index portfolio should be lower than that of an active portfolio. The tracking error will always be greater than zero if the portfolio is anything other than a replication of the benchmark. Trailing 1-Year Turnover: This figure reflects the portfolio’s trading activity by calculating the amount of the portfolio’s holdings bought or sold over the prior year, expressed as a percentage of the portfolio’s average market value. Turnover figures may be related to the amount of trading costs experienced by the portfolio. Weighted Average Market Capitalization: Market capitalization refers to the total market value of each company's outstanding shares. The Weighted Average Market Capitalization for a portfolio is calculated as the average market capitalization of the stocks within the portfolio, weighted by the amount of each stock owned. Weighted Median Market Capitalization: This calculation represents the median market capitalization of the stocks in the portfolio, weighted by the amount of each stock owned.
19 9407071