Embed Size (px)
Citation preview

www.ciifen.org
Diana Espinoza Ramirez
International Research Center on “El Niño” CIIFEN
GIS Technology for Making Decision in Agrometeorology: Early Warning Systems in Andean Region and its impacts in the agriculture development

CIIFEN is a Nonprofit International Organization established in January 10th 2003, as result of a process inside United Nations Office. Its International Directory is compound by Spain Government, Ecuador Government, The United Nations Office for Disaster Risk Reduction (UNISDR) and the World Meteorological Organization (WMO) as observatory.
2
MISION Promote and develop actions to consolidate the scientific-political interactions and the strength of hidroclimatic and oceanic services to contribute to risk management and adaptation

3

SENAMHI PERÚ
IDEAM COLOMBIA
DMC CHILE
INAMEH VENEZUELA
SENAMHI BOLIVIA
PRODUCTS
SERVICES
LOCAL SCALE

5 http://crc-osa.ciifen.org/
WMO RCC are excellence centers
dedicated to the creation of
climatic regional products,
including long term forecast in
support of climatic activities at
regional and national levels,
contributing to strength the
capacity of WMO members of a
region to share better climatic
services to national users.
WMO RCC have a regional scope
and do not replace or duplicate
national responsibilities
WMO Regional Climate Center for Western SouthAmerica
RCC

6
CIIFEN
ACMAD
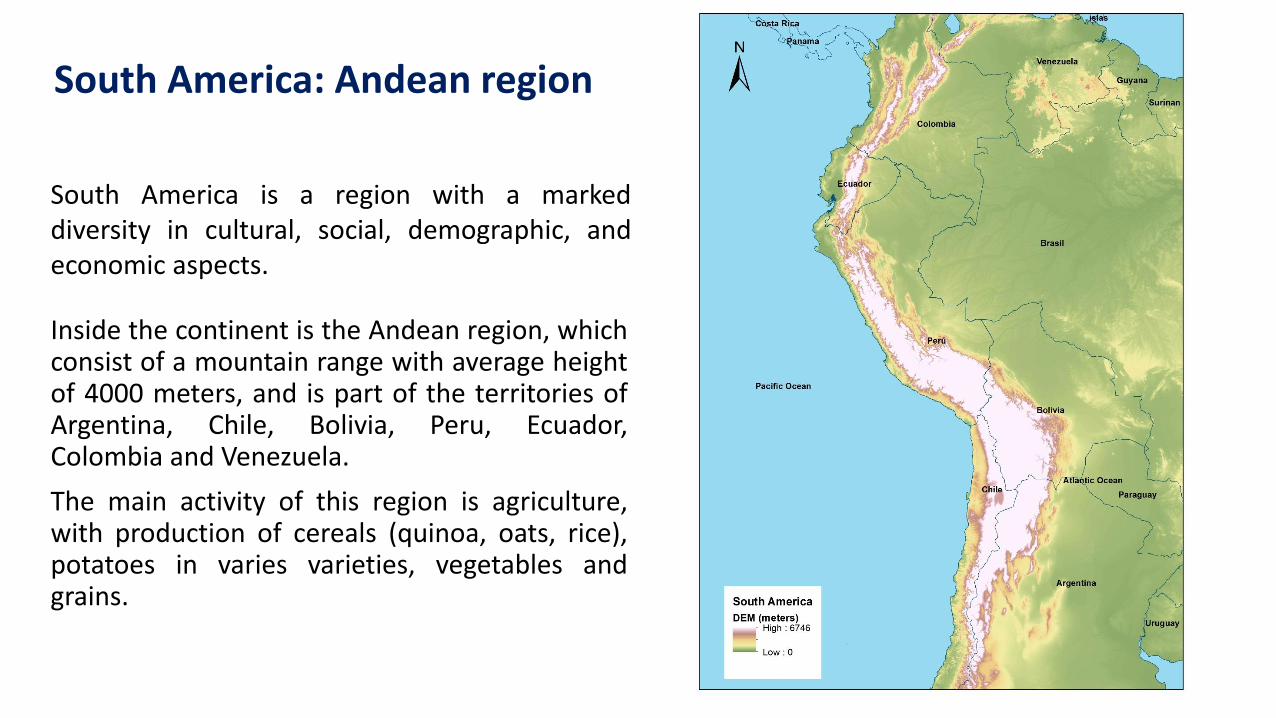
South America: Andean region
Inside the continent is the Andean region, which consist of a mountain range with average height of 4000 meters, and is part of the territories of Argentina, Chile, Bolivia, Peru, Ecuador, Colombia and Venezuela.
The main activity of this region is agriculture, with production of cereals (quinoa, oats, rice), potatoes in varies varieties, vegetables and grains.
South America is a region with a marked diversity in cultural, social, demographic, and economic aspects.

The region is threatened by climatic extremes that causes losses in
agricultural production. The most common climatic extremes are
sudden decreases in temperature, extreme precipitation that causes
floods and droughts, this events are increase due to El Niño event.
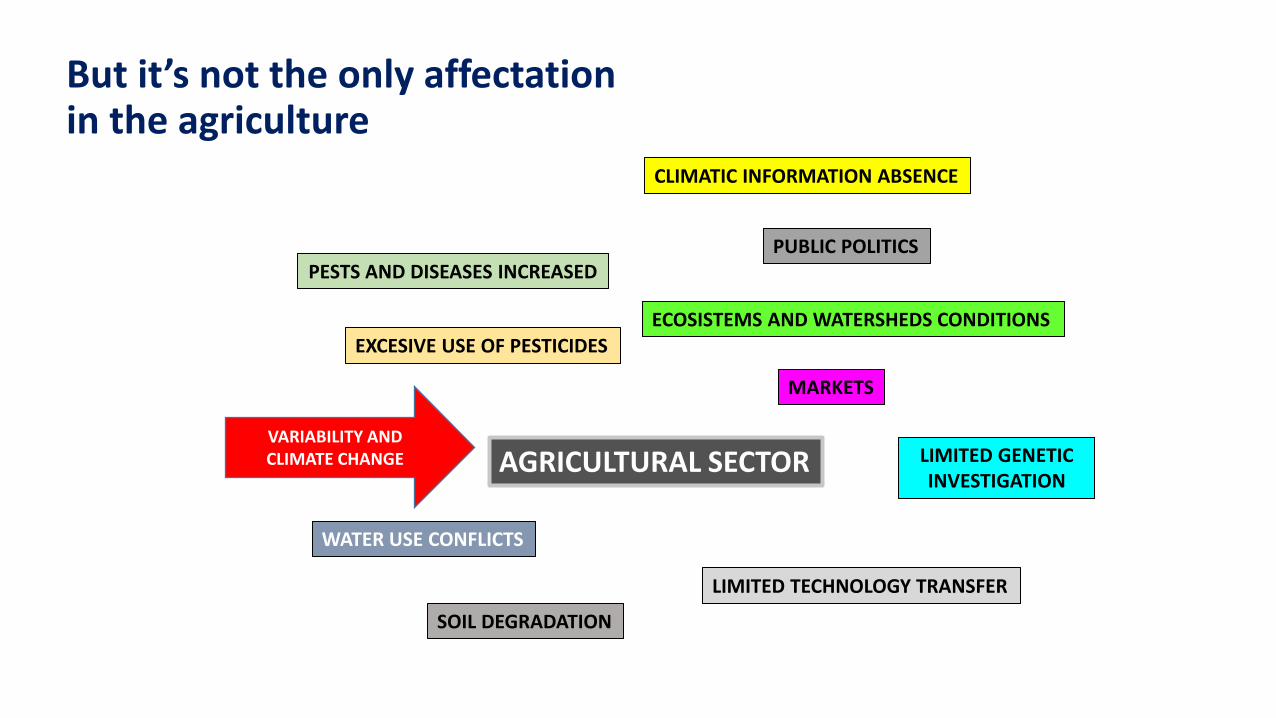
AGRICULTURAL SECTOR
PUBLIC POLITICS
MARKETS
LIMITED GENETIC INVESTIGATION
WATER USE CONFLICTS
LIMITED TECHNOLOGY TRANSFER
EXCESIVE USE OF PESTICIDES
PESTS AND DISEASES INCREASED
SOIL DEGRADATION
CLIMATIC INFORMATION ABSENCE
ECOSISTEMS AND WATERSHEDS CONDITIONS
VARIABILITY AND CLIMATE CHANGE
But it’s not the only affectation in the agriculture
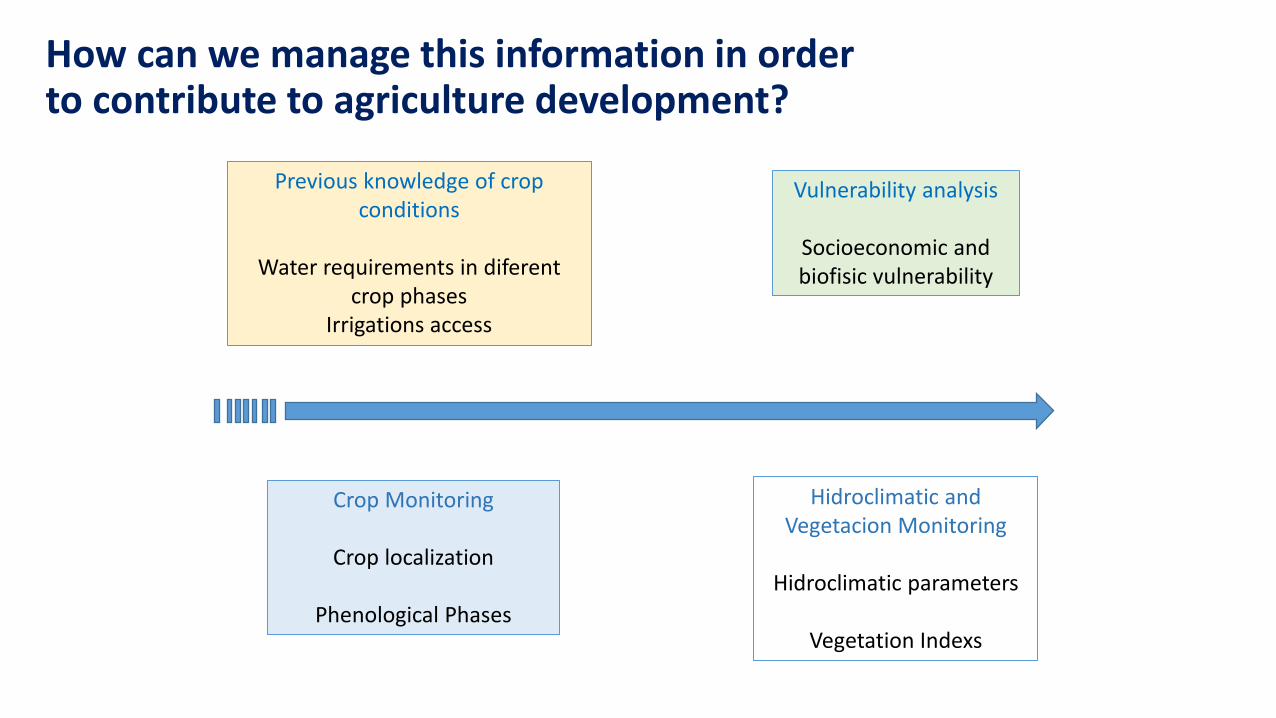
How can we manage this information in order to contribute to agriculture development?
Vulnerability analysis
Socioeconomic and biofisic vulnerability
Hidroclimatic and Vegetacion Monitoring
Hidroclimatic parameters
Vegetation Indexs
Crop Monitoring
Crop localization
Phenological Phases
Previous knowledge of crop conditions
Water requirements in diferent
crop phases Irrigations access

Vulnerability analysis and Agriculture risk
Vulnerability analysis focused on crops considerer the characteristic on crops that make increase its vulnerability or in the same conditions help the crops to cape and adapt. To estimate the vulnerability this characteristics were considered in a GIS model, using shape layers and mathematic expressions.
Vulnerability
Agricultural suitability
Erosion
Water stress
Access to water for irrigations
Recorded Precipitation
deficit Infiltration
Temperature
Climatic classification
Soil Saturation

Meteorological Stations
Rclimdex Modelling
Drought Trend
Frost Trend
Climatic trends Indexs
Climate Threats Maps
Vulnerability
Droughts
Frost
Vulnerability Maps
Agriculture Risk Map
Agiculture Risk Estimation in the Andean Region of Ecuador: Droughts, Frost and other Climate Change Impacts Metodology

Vulne agr(frost) = AgSuit + ClimaClass + SoilSat + Eros + AccWatIrr + Temp
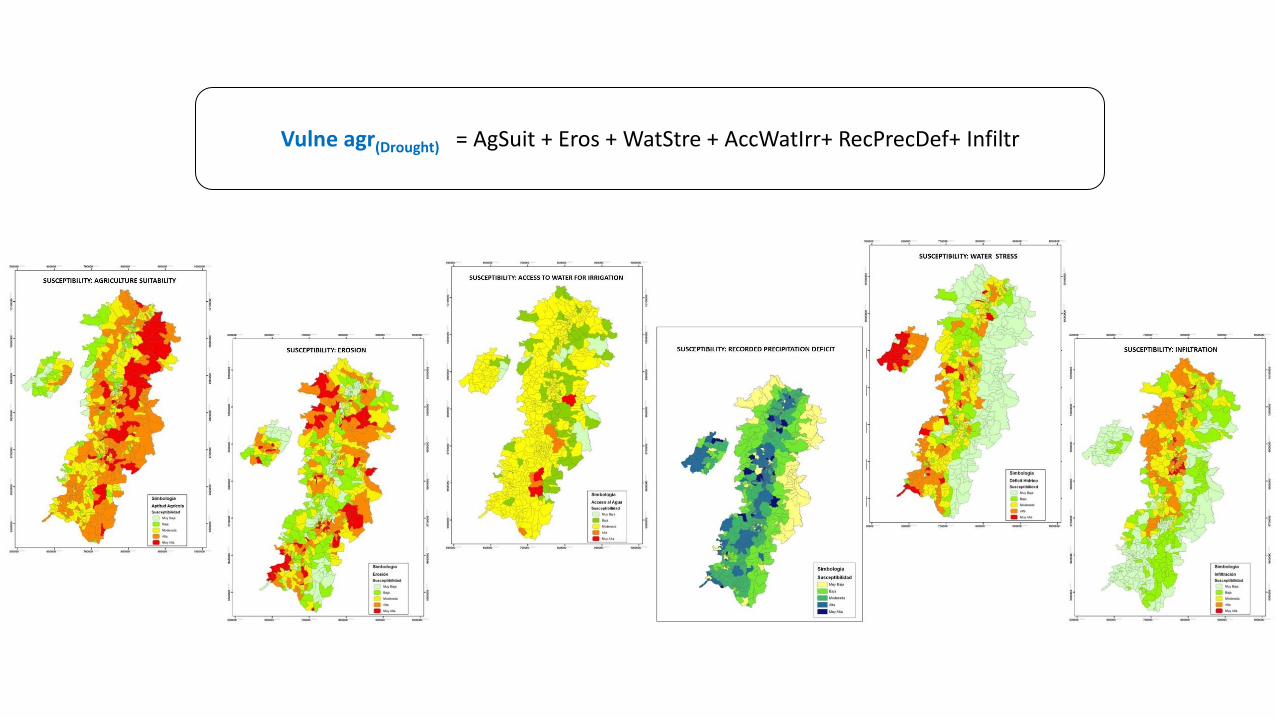
Vulne agr(Drought) = AgSuit + Eros + WatStre + AccWatIrr+ RecPrecDef+ Infiltr

Vulnerability Maps

Agriculture Risk Maps

Vulnerability analysis, crop information and climatic, agroclimatic and meteorological monitoring can be included in a cartographic platform for stakeholders and policy makers.
This platform is part of an Early Warning System in the Jubones basin (Andean Region – Ecuador) in which the technical personnel elaborate bulletins based on the meteorological, hydrological and vulnerability information. (FORECCSA Project)
The objective of this system is provide information to local farmers in the region, so they would be able to protect their crops against a flooding, frost, or drought in long term and contribute to the food security in the region.
Link: http://sat-foreccsa.ciifen.org
Early Warning Systems and climatic information
Platform
Climatic, Agroclimatic and meterological monitoring
Vulnerability and risk maps
Qualified personnel analyze information
Committe decide to emit food security bulletin
Local farmers and communities receive
information
Communities develop actions in the territory


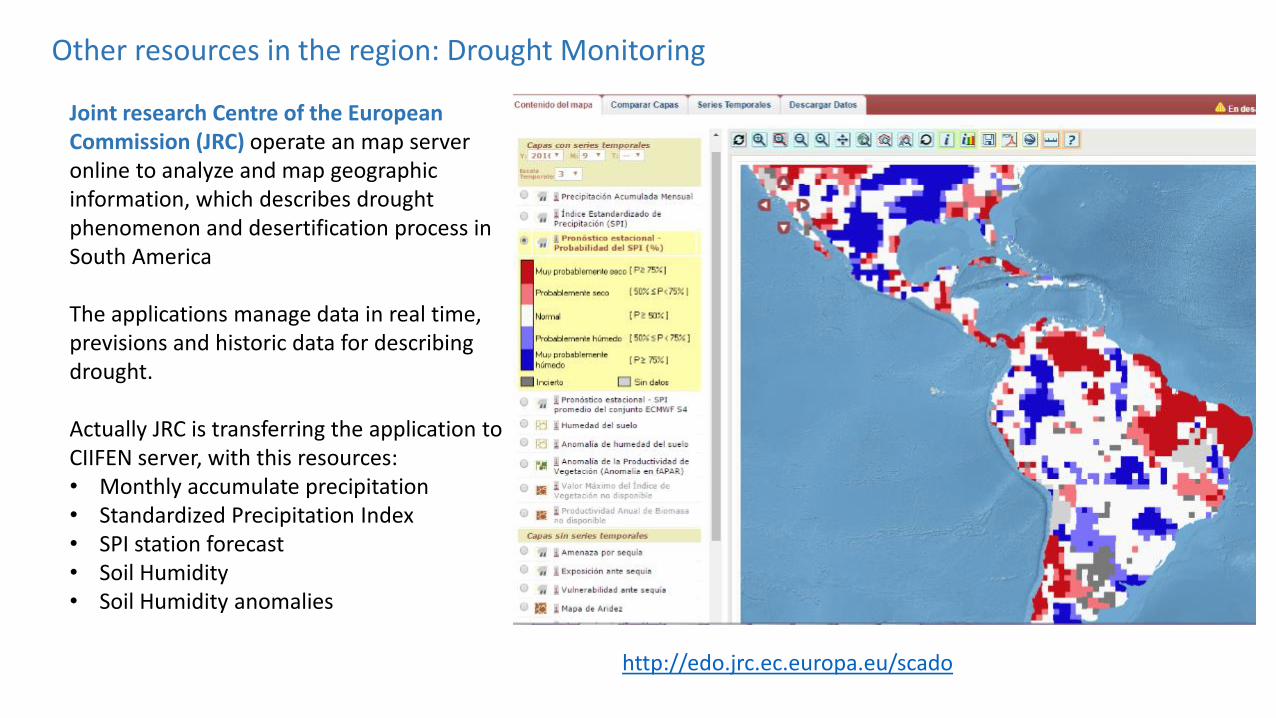
Joint research Centre of the European Commission (JRC) operate an map server online to analyze and map geographic information, which describes drought phenomenon and desertification process in South America The applications manage data in real time, previsions and historic data for describing drought. Actually JRC is transferring the application to CIIFEN server, with this resources: • Monthly accumulate precipitation • Standardized Precipitation Index • SPI station forecast • Soil Humidity • Soil Humidity anomalies http://edo.jrc.ec.europa.eu/scado
Other resources in the region: Drought Monitoring

CIIFEN and FAO are preparing an agreement for monitoring Drought using the Agriculture Stress Index (ASI). This index uses satellite data for detecting agriculture zona with high probability of suffer hydric stress worldwide. ASIS produce a map each 10 days, and shows hot-spots worldwide where exist water stress during a crop period. The main idea of the application is simulate the analysis of a remote sensing professional would do and simplify the result using maps for final users. ASIS database contains 30 years of hot-spots since 1984. FAO developed a regional version for drought monitoring in countries scale. This version needs to be calibrated with local agriculture statistics. For enhance the correlations between ASIS and agriculture performance, the land use maps for each region are needed. This version is useful in drought risk reduction and local planning.
http://www.fao.org/giews/earthobservation/asis

Meteorological Stations are spread over the
territory and contain discontinuous series.
Estimated precipitations show mistakes on their estimations and exist deviations in different
regions
(Dinku et al. 2007, Lim and Ho 2000)
Actually in the region it s not available a crop map
that allows algorithms applications related to its phenological phases and
hydric requirements
Limitations on the spatial crop distribution
determinations, in order to elaborate a mask for crop
monitoring. (Land use maps with low resolution)
Crop Monitoring: Limitations in the region
CROP MONITORING
LIMITATIONS AND
AGRICULTURE
MANAGEMENT
www.ciifen.org
International Research Center on “El Niño” CIIFEN
¡ Muchas gracias !
Thanks for your attention!!