Embed Size (px)
Citation preview
International R&D Spillovers and Institutions
David T. Coe, Elhanan Helpman, and
Alexander W. Hoffmaister
WP/08/104

© 2008 International Monetary Fund WP/08/104 IMF Working Paper Asia and Pacific and European Departments
International R&D Spillovers and Institutions
Prepared by David T. Coe, Elhanan Helpman, and Alexander W. Hoffmaister1
Authorized for distribution by David T. Coe
April 2008
Abstract
This Working Paper should not be reported as representing the views of the IMF. The views expressed in this Working Paper are those of the author(s) and do not necessarily represent those of the IMF or IMF policy. Working Papers describe research in progress by the author(s) and are published to elicit comments and to further debate.
The empirical analysis in “International R&D Spillovers” (Coe and Helpman, 1995) is first revisited by applying modern panel cointegration estimation techniques to an expanded data set that we have constructed for the purpose of this study. The new estimates confirm the key results reported in Coe and Helpman about the impact of domestic and foreign R&D capital stocks on TFP. In addition, we show that domestic and foreign R&D capital stocks have measurable impacts on TFP even after controlling for the impact of human capital. Furthermore, we extend the analysis to include institutional variables, such as legal origin and patent protection, in order to allow for parameter heterogeneity based on a country’s institutional characteristics. The results suggest that institutional differences are important determinants of total factor productivity and that they impact the degree of R&D spillovers. JEL Classification Numbers: O31; O40; O43 Keywords: Productivity; R&D; Spillovers; Institutions Authors’ E-Mail Addresses: [email protected], [email protected], and
1 We thank James Stock and Dale Jorgenson for helpful discussions. We also thank Kazim Kazimov, who worked extensively on the data base, as well as Song-Yi Kim and Fritz Pierre-Louis for expert research assistance. Much of the work on this paper was done when David Coe was on sabbatical from the IMF in 2007 visiting the Economics Department at Harvard during March and April and the OECD during June and July; he thanks both for their hospitality. The views expressed in this paper are those of the authors and do not represent the views of the International Monetary Fund or any other institution.
2
Contents Page I. Introduction ......................................................................................................................4 II. Data ..................................................................................................................................8 III. Econometric Preliminaries .............................................................................................11 IV. “International R&D Spillovers” Revisited.....................................................................13 V. Institutions and International R&D Spillovers...............................................................18 VI. Conclusions ....................................................................................................................25 Figures 1. Total Factor Productivity .................................................................................................9 2. Domestic R&D Capital Stocks.........................................................................................9 3. Foreign R&D Capital Stocks Using Bilateral Import Weights ......................................10 4. Import Share in GDP......................................................................................................10 5. Human Capital................................................................................................................10 6. Patent Protection ............................................................................................................22 Tables 1. Summary Statistics ...........................................................................................................8 2. Panel Unit Root Tests.....................................................................................................11 3. Panel Cointegration Tests...............................................................................................12 4. Specification in Coe and Helpman (1995) with Expanded Sample ...............................15 5. Dynamic OLS Within and Mean Group Estimates with Human Capital ......................17 6. Alternative Definitions of Foreign R&D Capital ...........................................................18 7. Institutional Variables ....................................................................................................20 8. Ease of Doing Business..................................................................................................21 9. Quality of Tertiary Education Systems ..........................................................................22 10. Patent Protection ............................................................................................................23 11. Legal Origins and Patent Protection...............................................................................24 Appendixes A. Alternative Specification................................................................................................26 B. Data Sources and Definitions.........................................................................................29 Appendix Tables A1. Alternative Definitions of Foreign R&D Capital: Alternative Specification.................26 A2. Ease of Doing Business: Alternative Specification........................................................27
3
A3. Quality of Tertiary Education Systems: Alternative Specification................................27 A4. Patent Protection: Alternative Specification ..................................................................28 A5. Legal Origins and Patent Protection: Alternative Specification ....................................28 A6. Alternative Definitions of Foreign R&D Capital ...........................................................31 References................................................................................................................................32
4
I. INTRODUCTION
The importance of international R&D spillovers has long been recognized, although estimates of their empirical significance at the macroeconomic level were often elusive. The search for R&D spillovers across countries received a boost in the 1990s with the development of new growth models by Romer (1990), Grossman and Helpman (1991), and Aghion and Howitt (1992), and by the application of the ideas from these models together with new empirical techniques to expanded data sets by Coe and Helpman (1995) and Coe, Helpman, and Hoffmaister (1997). The then-new endogenous growth models focused on commercially-oriented innovation efforts by profit-seeking firms as a major engine of technological progress and productivity growth, in contrast to the exogenous treatment of technological progress in neoclassical theory.2 In “International R&D Spillovers,” Coe and Helpman (1995) (hereafter CH) presented new estimates of R&D spillovers. Whereas many earlier studies of R&D spillovers had been based on sectoral or industry data for single countries,3 CH used pooled macroeconomic data for 21 OECD countries plus Israel over the 1971–90 time period. They estimated equations explaining a country’s total factor productivity (TFP) as a function of the domestic R&D capital stock and a measure of the foreign R&D capital stock, where all the measures of R&D capital were constructed from the business sectors’ R&D activities. While equations relating output or TFP to the domestic R&D capital stock had been estimated previously, the extension to include an explicit measure of the foreign R&D capital stock was new. In another innovation, CH focused their estimation on long-run relationships, taking advantage of the attractive econometric properties of cointegrated equations. This was one of the early empirical studies to estimate panel cointegrating equations, despite the fact that, at that time, “the econometrics of pooled cointegration [were] not yet fully worked out” (CH, 1995, p. 870). “International R&D Spillovers” inspired a large number of empirical studies, which can be grouped into three broad categories: studies addressing the appropriate definition of the foreign R&D capital stock, studies proposing additional determinants of TFP, and studies proposing alternative econometric techniques. Keller (2004) reviews a large part of this literature. To place the current paper in context, however, we briefly discuss some of the empirical studies based on panel estimates at the aggregate level. For each of the 22 countries in their sample, CH defined a foreign R&D capital stock as the weighted average of the country’s 21 trading partners’ domestic R&D capital stocks, using bilateral import shares as weights. Subsequent papers proposed a number of alternative 2 See the discussion in Helpman (2004) and Ha and Howitt (2007).
3 For example, the studies reviewed by Griliches (1992) are for agriculture or industry.
5
definitions of the foreign R&D capital stock, based on different methods for aggregating trading partners’ domestic R&D capital stocks into a foreign R&D capital stock. The main differences between these methods is in the weights applied to foreign R&D capital stocks. These include equal weights (Keller, 1998),4 weights based on bilateral export shares (Funk, 2001), weights based on the fraction of trading partners’ output exported to the recipient country (Lichtenberg and van Pottelsberghe de la Potterie, 1998), weights based on inward and outward FDI flows (van Pottelsberghe de la Potterie and Lichtenberg, 2001) and stocks (Zhu and Jeon, 2007), weights based on the bilateral technological proximity between countries (Park, 1995; Guellec and van Pottelsberghe de la Potterie, 2004), weights based on indirect trade (Lumenga-Neso et al., 2005), and weights based on information technology (Zhu and Jeon, 2007). Keller (1998) and Coe and Hoffmaister (1999) demonstrated that a measure of foreign R&D capital defined as a simple average of trading partners’ domestic R&D capital stocks performed about the same as the definition using bilateral import weights. Lichtenberg and van Pottelsberghe de la Potterie (1998) argued that CH’s weighting scheme is subject to an aggregation bias, in that a merger between countries would always increase the stock of foreign R&D capital, and showed that a measure based on the fraction of bilateral trading partners’ output exported to the recipient country yielded somewhat better results than the measure used in CH.5 Funk (2001) presented results, using newly developed panel estimation techniques, showing that a definition of foreign R&D capital based on bilateral export shares performed better than CH’s definition, suggesting the importance of R&D spillovers emanating from exporters’ customers. More recently, Lee (2006) has shown, based on a different data set and modern panel cointegration techniques, that a definition of foreign R&D capital based on inward FDI or bilateral technological proximity do a better jobs than other definitions. A number of other studies have focused on various explanatory variables in addition to the domestic and foreign R&D capital stocks. Determinants of TFP that have been shown to be
4 Keller (1998) proported to show that a foreign R&D capital stock defined with “random” weights, which he noted were similar to equal weights, explained TFP developments as well or better than CH’s bilateral import weights. Coe and Hoffmaister (1999) demonstrated analytically in the case of two trading partners and numerically for n trading partners that Keller’s weights are essentially simple averages with a random error. Coe and Hoffmaister (1999) also showed that when three alternative sets of random weights are used to construct foreign R&D capital stocks, the estimated spillover elasticities are extremely small and the estimated equations explain less of the variation in TFP than if CH’s original definition based on bilateral import shares, as would be expected if truly random weights were used.
5 Lichtenberg and van Pottelsberghe de la Potterie (1998) also correctly pointed out that CH’s indexation of the R&D capital stocks was problematic in CH’s specification where the foreign R&D capital stock was interacted with the import share. Coe and Hoffmaister (1999) showed that correcting this has little effect on the estimated coefficients.
6
significant, cointegrated, or to improve explanatory power, include human capital (Engelbrecht, 1997; Khan and Luintel, 2006), the import share (Coe and Hoffmaister, 1999; Edmond, 2001), productivity catch-up (Engelbrecht, 1997), measures of government funded R&D and the business cycle (Guellec and van Pottelsberghe de la Potterie, 2004), and infrastructure and stocks of inward and outward FDI (Khan and Luintel, 2006). With advances in the econometrics of panel cointegration, a number of studies applied new techniques that were not available at the time of CH’s research. Kao et al. (1999), for example, re-examined the econometric foundations of CH’s results using newly developed techniques.6 Although a number of Kao et al.’s (1999) estimates generally confirmed the results in CH, their dynamic OLS estimates, which they considered to be superior to the other estimation techniques, indicated that the estimated coefficients on the foreign R&D capital stock were insignificant. A number of other studies based on panel cointegration techniques found that TFP was cointegrated with domestic and foreign R&D capital, although the latter was often defined in one of the alternative ways discussed above (Lichtenberg and van Pottelsberghe de la Potterie, 1998; Edmond, 2001; Funk, 2001; Guellec and van Pottelsberghe de la Potterie, 2004; and Lee, 2006).
Panel cointegration techniques are particularly well suited for the study of the impact of R&D capital on total factor productivity for a number of reasons. One is the focus on the long-run relationships, which would be obscured if, for example, the equations were estimated on first differences rather than on the levels of variables. A second is the increased power that comes from exploiting commonalities across countries, given the limited number of time-series observations. A third, important reason is that, under cointegration, parameter estimates are super consistent, and hence are robust to problems such as omitted variables, simultaneity, and endogeneity.7 Thus, using panel cointegration techniques to estimate the long-run effect of domestic and foreign R&D capital on TFP overcomes the endogeneity problem, thereby avoiding the difficult task of finding valid instruments for R&D capital, which would be necessary if the focus was on the short-run relationship.
Estimating R&D spillovers on a pooled dataset highlighted the issue of heterogeneity in parameter estimates. CH incorporated some heterogeneity in their pooled estimates by estimating separate elasticities of TFP with respect to domestic R&D capital for the G7 and for the smaller countries and by including fixed effects (i.e., country-specific constants). In addition, heterogeneity in the effect of foreign R&D on TFP was introduced by interacting the foreign R&D capital stock with the import share. In contrast to pooled estimates, which generally assume homogeneity of parameter estimates, group mean estimates average single
6 See also Harris and Sollis (2003, chapter 7).
7 Pedroni and Urbain (2008) provide a summary of the recent panel cointegration literature. See also Stock (1987) and Stock and Watson (1993).
7
country (i.e., time-series) estimates, thereby allowing for full heterogeneity. Edmond (2001) applied group mean estimates to the CH data set and found that TFP was cointegrated with domestic and foreign R&D capital if the latter was defined as a simple sum of trading partners’ R&D capital stocks, but not if it was defined with bilateral import shares as in CH. Luintel and Khan (2004), based on a different sample, conclude that pooling was not valid, although they did find cointegration between TFP and domestic and foreign R&D capital. Khan and Luintel (2006), on the other hand, addressed heterogeneity in their pooled estimates by interacting both domestic and foreign R&D capital stocks with a variety of other determinants of productivity.
The purposes of this paper are twofold. The first is to revisit the empirical analysis in CH using a data set updated to 2004 and expanded to 24 countries, and applying panel cointegration estimation techniques not available in the early 1990s. We find that the estimates based on the new data set and using modern econometric techniques give broadly similar results as those reported in CH. There is, moreover, robust evidence of cointegration between total factor productivity, domestic R&D capital, foreign R&D capital based on a number of definitions, and a measure of human capital. Measures of foreign R&D capital incorporating information about bilateral imports, such as those used by CH and Lichtenberg and van Pottelsberghe de la Potterie (1998), perform better than a measure based on equal weights. These results are obtained using either dynamic OLS on the pooled data or using dynamic OLS group mean estimates. The second aim of the paper is to expand the empirical analysis to examine the impact of institutional factors that are now viewed as important determinants of economic growth. In particular, we study the impact of these institutions on the degree of R&D spillovers and the contribution of domestic R&D capital to TFP, thereby allowing for heterogeneity in parameter estimates. The paper thus contributes to the broader growth literature emphasizing the importance of institutions for economic growth.8 We find evidence that countries where the ease of doing business and the quality of tertiary education systems are relatively high tend to benefit more from their own R&D efforts, from international R&D spillovers, and from human capital formation. We also find that strong patent protection is associated with higher levels of total factor productivity, higher returns to domestic R&D, and larger international R&D spillovers. Finally, we find evidence that the origins of a country’s legal system also has an influence on the extent to which it benefits from its own and foreign R&D. The next two sections summarize the key features of our data and present a brief overview of the econometric techniques of panel cointegration. Section IV revisits the empirical analysis
8 The literature on institutions and economic growth is very large; see Helpman (2004, chapter 7) for an overview.
8
in CH and addresses some of the issues raised in the subsequent literature. Section V presents evidence on the importance of institutions for the effectiveness of domestic R&D and the extent of international R&D spillovers. Section VI concludes.
II. DATA
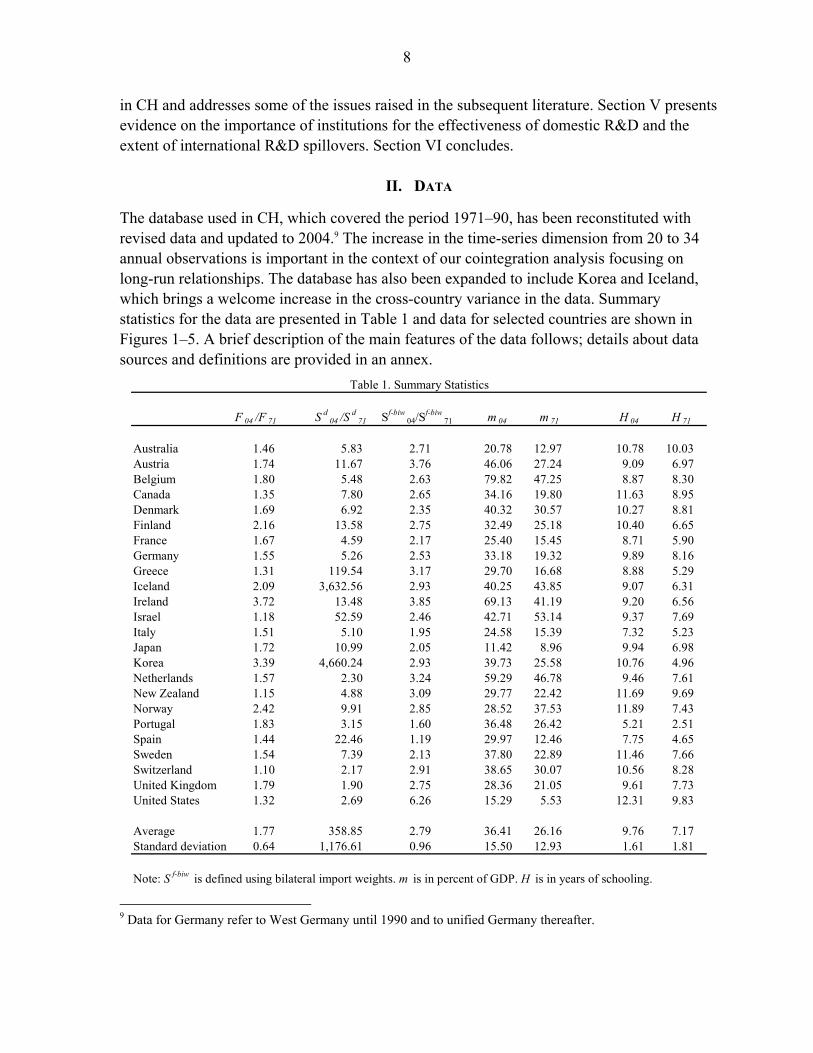
The database used in CH, which covered the period 1971–90, has been reconstituted with revised data and updated to 2004.9 The increase in the time-series dimension from 20 to 34 annual observations is important in the context of our cointegration analysis focusing on long-run relationships. The database has also been expanded to include Korea and Iceland, which brings a welcome increase in the cross-country variance in the data. Summary statistics for the data are presented in Table 1 and data for selected countries are shown in Figures 1–5. A brief description of the main features of the data follows; details about data sources and definitions are provided in an annex.
F 04 /F 71 S d04 /S d
71 Sf-biw04/S
f-biw71 m 04 m 71 H 04 H 71
Australia 1.46 5.83 2.71 20.78 12.97 10.78 10.03 Austria 1.74 11.67 3.76 46.06 27.24 9.09 6.97 Belgium 1.80 5.48 2.63 79.82 47.25 8.87 8.30 Canada 1.35 7.80 2.65 34.16 19.80 11.63 8.95 Denmark 1.69 6.92 2.35 40.32 30.57 10.27 8.81 Finland 2.16 13.58 2.75 32.49 25.18 10.40 6.65 France 1.67 4.59 2.17 25.40 15.45 8.71 5.90 Germany 1.55 5.26 2.53 33.18 19.32 9.89 8.16 Greece 1.31 119.54 3.17 29.70 16.68 8.88 5.29 Iceland 2.09 3,632.56 2.93 40.25 43.85 9.07 6.31 Ireland 3.72 13.48 3.85 69.13 41.19 9.20 6.56 Israel 1.18 52.59 2.46 42.71 53.14 9.37 7.69 Italy 1.51 5.10 1.95 24.58 15.39 7.32 5.23 Japan 1.72 10.99 2.05 11.42 8.96 9.94 6.98 Korea 3.39 4,660.24 2.93 39.73 25.58 10.76 4.96 Netherlands 1.57 2.30 3.24 59.29 46.78 9.46 7.61 New Zealand 1.15 4.88 3.09 29.77 22.42 11.69 9.69 Norway 2.42 9.91 2.85 28.52 37.53 11.89 7.43 Portugal 1.83 3.15 1.60 36.48 26.42 5.21 2.51 Spain 1.44 22.46 1.19 29.97 12.46 7.75 4.65 Sweden 1.54 7.39 2.13 37.80 22.89 11.46 7.66 Switzerland 1.10 2.17 2.91 38.65 30.07 10.56 8.28 United Kingdom 1.79 1.90 2.75 28.36 21.05 9.61 7.73 United States 1.32 2.69 6.26 15.29 5.53 12.31 9.83
Average 1.77 358.85 2.79 36.41 26.16 9.76 7.17 Standard deviation 0.64 1,176.61 0.96 15.50 12.93 1.61 1.81
Note: S f-biw is defined using bilateral import weights. m is in percent of GDP. H is in years of schooling.
Table 1. Summary Statistics
9 Data for Germany refer to West Germany until 1990 and to unified Germany thereafter.
9
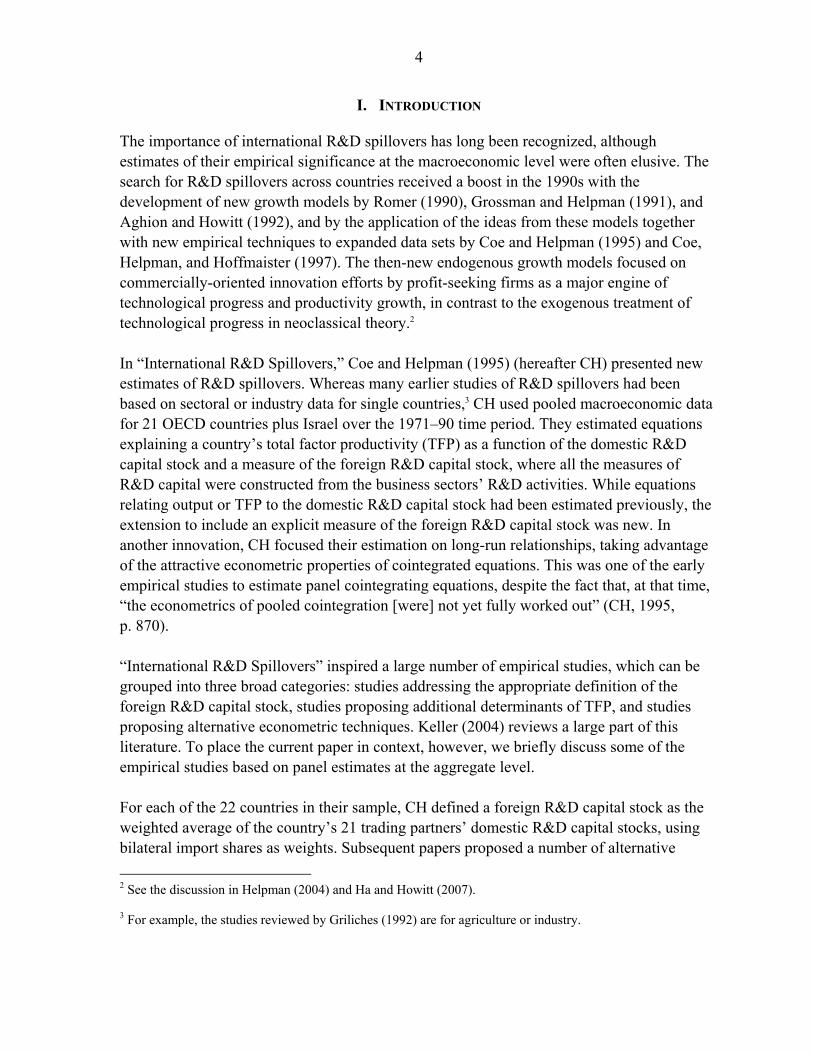
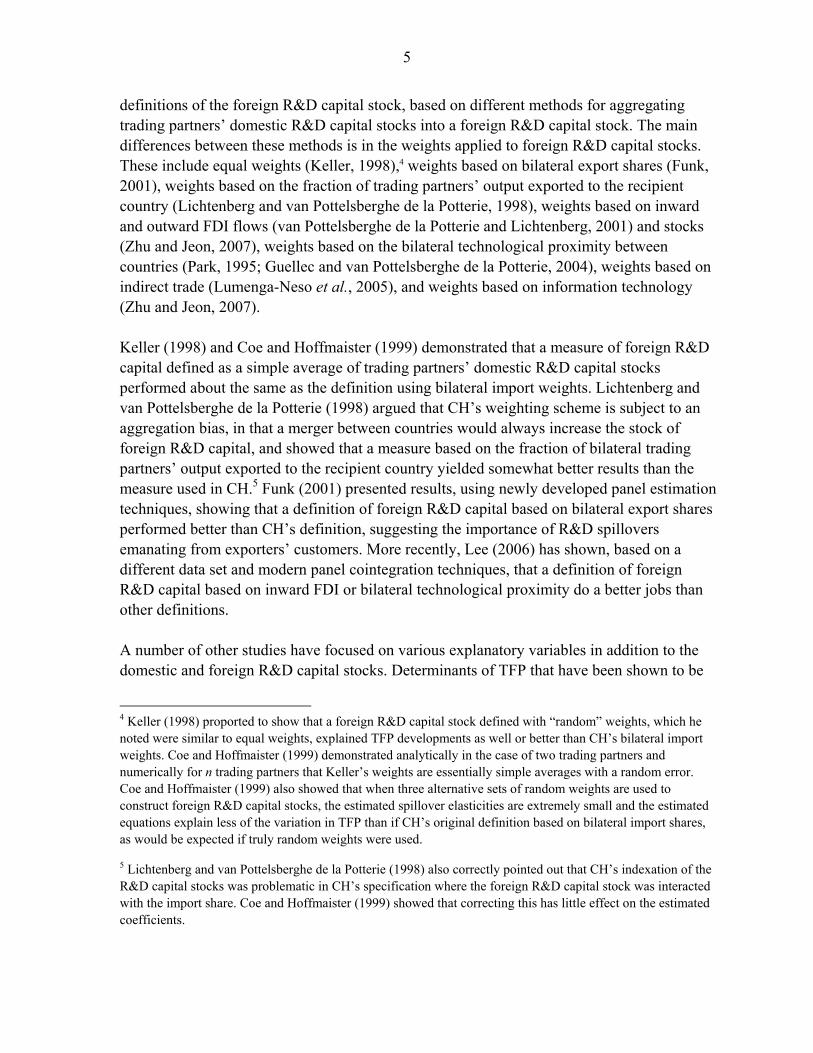
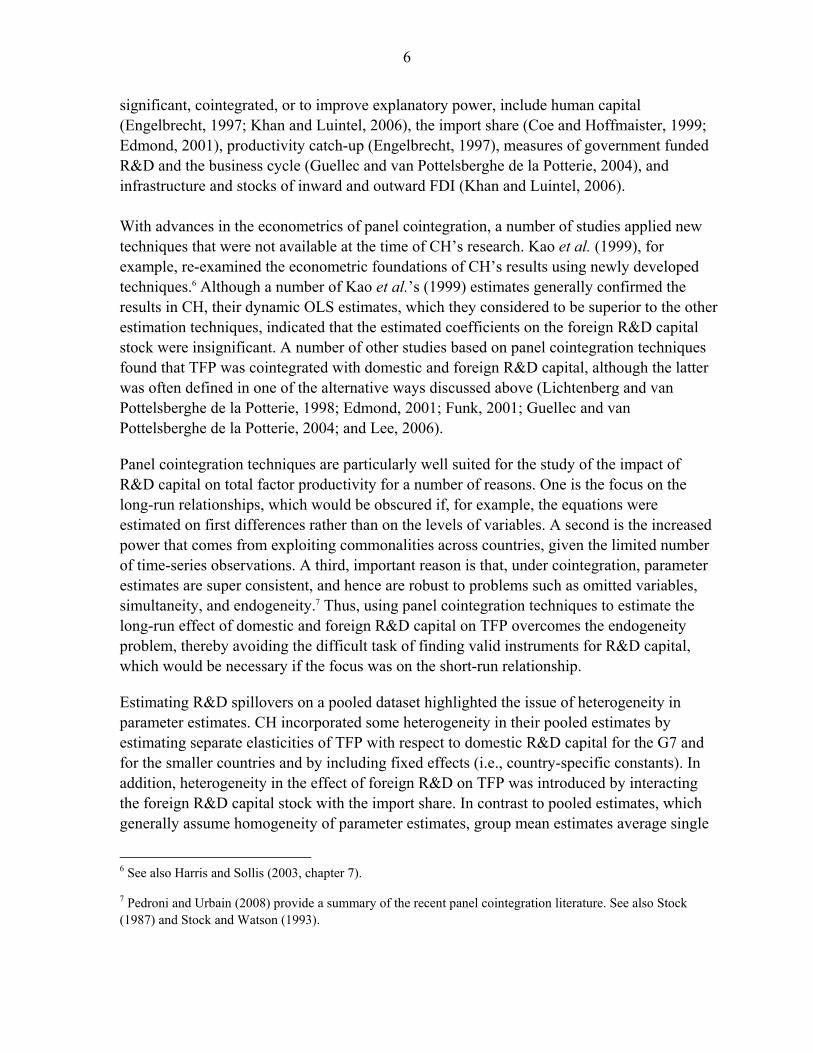
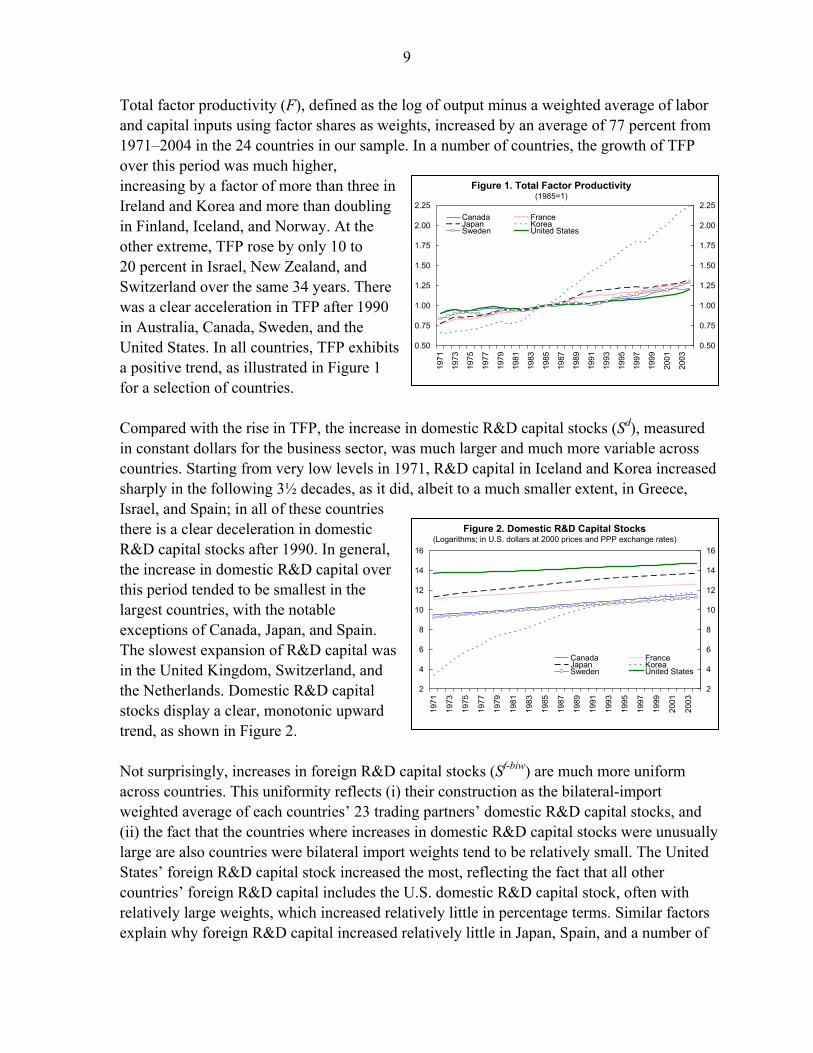
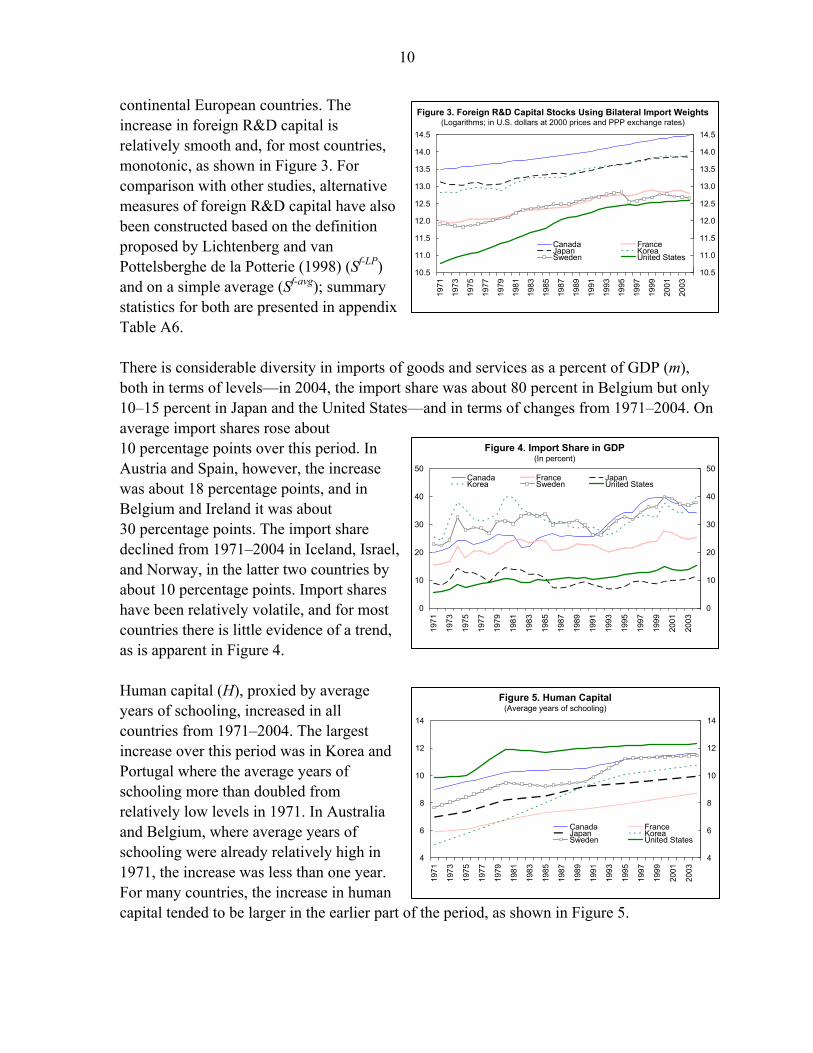
Total factor productivity (F), defined as the log of output minus a weighted average of labor and capital inputs using factor shares as weights, increased by an average of 77 percent from 1971–2004 in the 24 countries in our sample. In a number of countries, the growth of TFP over this period was much higher, increasing by a factor of more than three in Ireland and Korea and more than doubling in Finland, Iceland, and Norway. At the other extreme, TFP rose by only 10 to 20 percent in Israel, New Zealand, and Switzerland over the same 34 years. There was a clear acceleration in TFP after 1990 in Australia, Canada, Sweden, and the United States. In all countries, TFP exhibits a positive trend, as illustrated in Figure 1 for a selection of countries. Compared with the rise in TFP, the increase in domestic R&D capital stocks (Sd), measured in constant dollars for the business sector, was much larger and much more variable across countries. Starting from very low levels in 1971, R&D capital in Iceland and Korea increased sharply in the following 3½ decades, as it did, albeit to a much smaller extent, in Greece, Israel, and Spain; in all of these countries there is a clear deceleration in domestic R&D capital stocks after 1990. In general, the increase in domestic R&D capital over this period tended to be smallest in the largest countries, with the notable exceptions of Canada, Japan, and Spain. The slowest expansion of R&D capital was in the United Kingdom, Switzerland, and the Netherlands. Domestic R&D capital stocks display a clear, monotonic upward trend, as shown in Figure 2. Not surprisingly, increases in foreign R&D capital stocks (Sf-biw) are much more uniform across countries. This uniformity reflects (i) their construction as the bilateral-import weighted average of each countries’ 23 trading partners’ domestic R&D capital stocks, and (ii) the fact that the countries where increases in domestic R&D capital stocks were unusually large are also countries were bilateral import weights tend to be relatively small. The United States’ foreign R&D capital stock increased the most, reflecting the fact that all other countries’ foreign R&D capital includes the U.S. domestic R&D capital stock, often with relatively large weights, which increased relatively little in percentage terms. Similar factors explain why foreign R&D capital increased relatively little in Japan, Spain, and a number of
0.50
0.75
1.00
1.25
1.50
1.75
2.00
2.25
1971
1973
1975
1977
1979
1981
1983
1985
1987
1989
1991
1993
1995
1997
1999
2001
2003
0.50
0.75
1.00
1.25
1.50
1.75
2.00
2.25Canada FranceJapan KoreaSweden United States
Figure 1. Total Factor Productivity (1985=1)
2
4
6
8
10
12
14
16
1971
1973
1975
1977
1979
1981
1983
1985
1987
1989
1991
1993
1995
1997
1999
2001
2003
2
4
6
8
10
12
14
16
Canada FranceJapan KoreaSweden United States
Figure 2. Domestic R&D Capital Stocks(Logarithms; in U.S. dollars at 2000 prices and PPP exchange rates)
10
continental European countries. The increase in foreign R&D capital is relatively smooth and, for most countries, monotonic, as shown in Figure 3. For comparison with other studies, alternative measures of foreign R&D capital have also been constructed based on the definition proposed by Lichtenberg and van Pottelsberghe de la Potterie (1998) (Sf-LP) and on a simple average (Sf-avg); summary statistics for both are presented in appendix Table A6. There is considerable diversity in imports of goods and services as a percent of GDP (m), both in terms of levels—in 2004, the import share was about 80 percent in Belgium but only 10–15 percent in Japan and the United States—and in terms of changes from 1971–2004. On average import shares rose about 10 percentage points over this period. In Austria and Spain, however, the increase was about 18 percentage points, and in Belgium and Ireland it was about 30 percentage points. The import share declined from 1971–2004 in Iceland, Israel, and Norway, in the latter two countries by about 10 percentage points. Import shares have been relatively volatile, and for most countries there is little evidence of a trend, as is apparent in Figure 4. Human capital (H), proxied by average years of schooling, increased in all countries from 1971–2004. The largest increase over this period was in Korea and Portugal where the average years of schooling more than doubled from relatively low levels in 1971. In Australia and Belgium, where average years of schooling were already relatively high in 1971, the increase was less than one year. For many countries, the increase in human capital tended to be larger in the earlier part of the period, as shown in Figure 5.
10.5
11.0
11.5
12.0
12.5
13.0
13.5
14.0
14.5
1971
1973
1975
1977
1979
1981
1983
1985
1987
1989
1991
1993
1995
1997
1999
2001
2003
10.5
11.0
11.5
12.0
12.5
13.0
13.5
14.0
14.5
Canada FranceJapan KoreaSweden United States
Figure 3. Foreign R&D Capital Stocks Using Bilateral Import Weights(Logarithms; in U.S. dollars at 2000 prices and PPP exchange rates)
0
10
20
30
40
50
1971
1973
1975
1977
1979
1981
1983
1985
1987
1989
1991
1993
1995
1997
1999
2001
2003
0
10
20
30
40
50Canada France JapanKorea Sweden United States
Figure 4. Import Share in GDP(In percent)
4
6
8
10
12
14
1971
1973
1975
1977
1979
1981
1983
1985
1987
1989
1991
1993
1995
1997
1999
2001
2003
4
6
8
10
12
14
Canada FranceJapan KoreaSweden United States
Figure 5. Human Capital(Average years of schooling)
11
III. ECONOMETRIC PRELIMINARIES
Panel cointegration techniques have become increasingly popular for a number of reasons. As with time series cointegration, estimates from a cointegrated panel are robust to a variety of problems that often plague empirical work, including endogeneity, omitted variables, and measurement error (Banerjee, 1999; Phillips and Moon, 2000; and Baltagi and Kao, 2000). Moreover, panel cointegration techniques can be implemented with shorter data spans than their time series counterparts and statistical inference is simplified because limiting distributions are standard normal.10 Before estimating the long-run cointegrating relationships, the relevant variables are pre-tested for unit roots and cointegration. We use so-called second-generation panel unit root tests, which are analogous to time-series augmented Dickey-Fuller tests. These tests allow for heterogeneous dynamics and include tests proposed by Levin, Lin, and Chu (2002, LLC) and Im, Pesaran, and Shin (2003, IPS). The null hypothesis for both of these tests is a unit root for each country i, but the tests differ in their assumption regarding the coefficient on the lagged level of the dependent variable (which is in first difference form), ρi, and the alternative hypothesis. The LLC test is a pooled panel (within-dimension) test that treats ρi as common across countries under both the null and alternative hypotheses. In contrast, the IPS test is a group mean (between-dimension) test that treats ρi as heterogeneous among countries under both the null and alternative hypotheses. In both cases the test is one-sided. The LLC and IPS panel unit test results are presented in Table 2. The unit root tests are done for the three alternative definitions of foreign R&D capital and for a measure of patent protection (PP), which is one of the institutional variables discussed in Section V. With the exception of the import share (m) all variables, including the import share interacted with the alternative measures of the foreign R&D capital stocks, have a unit root, i.e., all are nonstationary.
10 This paper refers to panel cointegration as a stable long-run relation between the dependent variable and the independent variables in countries in a panel. This concept is distinct from cross-member cointegration whereby the dependent variable in one country is cointegrated with the dependent variable of another country in the panel (Evans, 1998).
LLC IPS
logF 3.99 4.85
logS d 5.87 7.17
logS f-biw 2.73 2.57logS f-LP 2.01 2.51logS f-avg 3.53 4.75
m -1.94 ** -1.36
m ·logS f-biw 0.39 -0.72m ·logS f-LP 1.16 0.47m ·logS f-avg 0.73 -0.24
logH 2.19 2.14
logPP 0.76 0.68
Notes: Columns LLC and IPS report the Levin-Lin-Chu (2002) and Im-Pesaran-Shim (2003) unit root tests. Significance levels at the 10, 5, and 1 percent levels for the one-tailed tests are indicated by *, **, and ***. The null hypothesis of a unit root is rejected if the test statistic is significant.
Table 2. Panel Unit Root Tests(1971-2004, 24 countries)
12
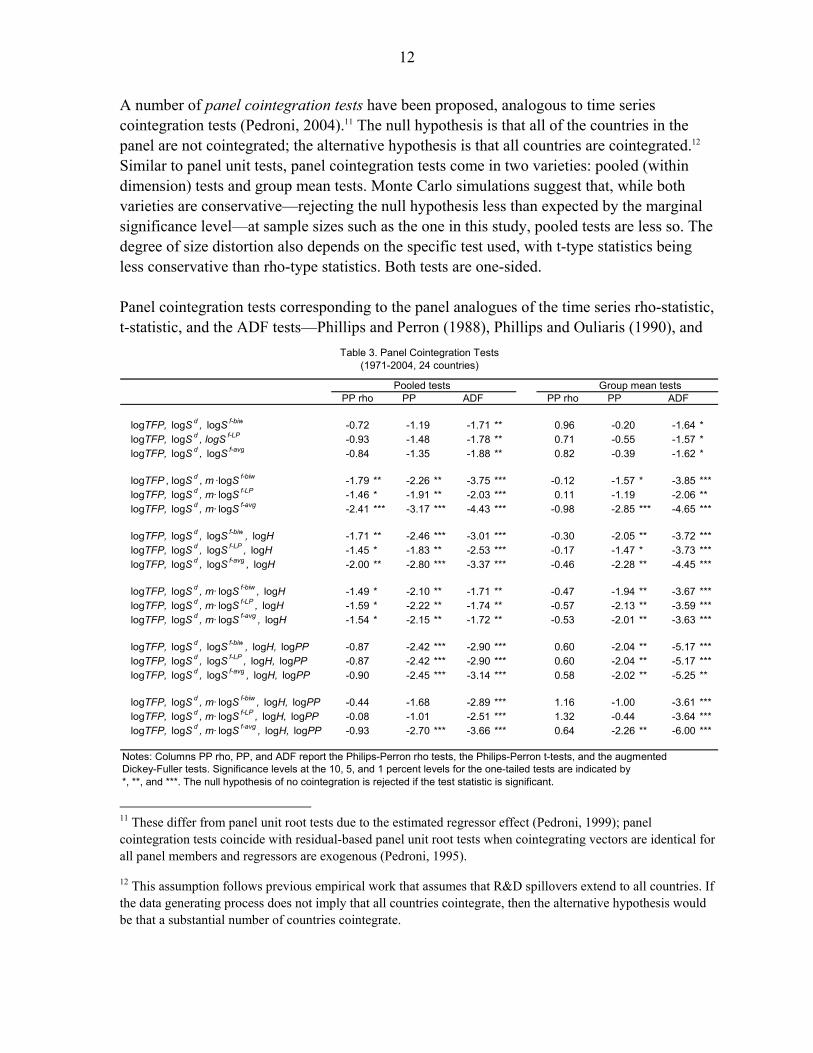
A number of panel cointegration tests have been proposed, analogous to time series cointegration tests (Pedroni, 2004).11 The null hypothesis is that all of the countries in the panel are not cointegrated; the alternative hypothesis is that all countries are cointegrated.12 Similar to panel unit tests, panel cointegration tests come in two varieties: pooled (within dimension) tests and group mean tests. Monte Carlo simulations suggest that, while both varieties are conservative—rejecting the null hypothesis less than expected by the marginal significance level—at sample sizes such as the one in this study, pooled tests are less so. The degree of size distortion also depends on the specific test used, with t-type statistics being less conservative than rho-type statistics. Both tests are one-sided. Panel cointegration tests corresponding to the panel analogues of the time series rho-statistic, t-statistic, and the ADF tests—Phillips and Perron (1988), Phillips and Ouliaris (1990), and
Pooled tests Group mean testsPP rho PP ADF PP rho PP ADF
logTFP, logS d , logS f-biw -0.72 -1.19 -1.71 ** 0.96 -0.20 -1.64 *logTFP, logS d , logS f-LP -0.93 -1.48 -1.78 ** 0.71 -0.55 -1.57 *logTFP, logS d , logS f-avg -0.84 -1.35 -1.88 ** 0.82 -0.39 -1.62 *
logTFP , logS d , m ·logS f-biw -1.79 ** -2.26 ** -3.75 *** -0.12 -1.57 * -3.85 ***logTFP, logS d , m· logS f-LP -1.46 * -1.91 ** -2.03 *** 0.11 -1.19 -2.06 **logTFP, logS d , m· logS f-avg -2.41 *** -3.17 *** -4.43 *** -0.98 -2.85 *** -4.65 ***
logTFP, logS d , logS f-biw , logH -1.71 ** -2.46 *** -3.01 *** -0.30 -2.05 ** -3.72 ***logTFP, logS d , logS f-LP , logH -1.45 * -1.83 ** -2.53 *** -0.17 -1.47 * -3.73 ***logTFP, logS d , logS f-avg , logH -2.00 ** -2.80 *** -3.37 *** -0.46 -2.28 ** -4.45 ***
logTFP, logS d , m· logS f-biw , logH -1.49 * -2.10 ** -1.71 ** -0.47 -1.94 ** -3.67 ***logTFP, logS d , m· logS f-LP , logH -1.59 * -2.22 ** -1.74 ** -0.57 -2.13 ** -3.59 ***logTFP, logS d , m· logS f-avg , logH -1.54 * -2.15 ** -1.72 ** -0.53 -2.01 ** -3.63 ***
logTFP, logS d , logS f-biw , logH, logPP -0.87 -2.42 *** -2.90 *** 0.60 -2.04 ** -5.17 ***logTFP, logS d , logS f-LP , logH, logPP -0.87 -2.42 *** -2.90 *** 0.60 -2.04 ** -5.17 ***logTFP, logS d , logS f-avg , logH, logPP -0.90 -2.45 *** -3.14 *** 0.58 -2.02 ** -5.25 **
logTFP, logS d , m· logS f-biw , logH, logPP -0.44 -1.68 -2.89 *** 1.16 -1.00 -3.61 ***logTFP, logS d , m· logS f-LP , logH, logPP -0.08 -1.01 -2.51 *** 1.32 -0.44 -3.64 ***logTFP, logS d , m· logS f-avg , logH, logPP -0.93 -2.70 *** -3.66 *** 0.64 -2.26 ** -6.00 ***
Dickey-Fuller tests. Significance levels at the 10, 5, and 1 percent levels for the one-tailed tests are indicated by *, **, and ***. The null hypothesis of no cointegration is rejected if the test statistic is significant.
Notes: Columns PP rho, PP, and ADF report the Philips-Perron rho tests, the Philips-Perron t-tests, and the augmented
Table 3. Panel Cointegration Tests(1971-2004, 24 countries)
11 These differ from panel unit root tests due to the estimated regressor effect (Pedroni, 1999); panel cointegration tests coincide with residual-based panel unit root tests when cointegrating vectors are identical for all panel members and regressors are exogenous (Pedroni, 1995).
12 This assumption follows previous empirical work that assumes that R&D spillovers extend to all countries. If the data generating process does not imply that all countries cointegrate, then the alternative hypothesis would be that a substantial number of countries cointegrate.
13
Dickey and Fuller (1979)—are reported in Table 3. In the first two sets of panel unit root tests, pooled PP-rho tests reject the null hypothesis when the various measures of logSf are interacted with m but not when logSf is included alone. When logH is added, however, the interaction with m is not required for cointegration. The same holds for the last two sets of tests when the variables are extended to also include logPP. Regardless of the number of variables included in the tests, evidence of cointegration is found for both pooled and group mean tests. Taken together, cointegration typically requires including the interaction of m and logSf, and thus these models form the basis for the empirical results reported below.13 These results also suggest stable long-run relations can be estimated using either pooled or group mean estimation techniques. In the following sections, we use pooled and group mean dynamic OLS (Kao and Chiang, 2000; Pedroni, 2001) to estimate long-run relationships. These single-equation methods extend to panel data the time-series dynamic OLS (DOLS) estimates proposed by Stock and Watson (1993).14 Panel DOLS is fully parametric in their treatment of endogeneity and autocorrelation and, just as their time-series analogues, are asymptotically equivalent to full information maximum likelihood estimators. In pooled samples, Kao and Chiang (2000) found that panel DOLS have less size distortion than fully modified OLS for panels proposed by Pedroni (2000).
IV. “INTERNATIONAL R&D SPILLOVERS” REVISITED
Grossman and Helpman (1991) provide theoretical underpinnings for the empirical specifications used below with the aid of two canonic models of endogenous growth: the love of variety approach due to Romer (1990) and the quality ladders approach due to Grossman and Helpman (1991) and Aghion and Howitt (1992). In the love of variety approach an expansion of the range of available inputs raises total factor productivity, and investment in the development of new inputs raises the stock of knowledge, which reduces future R&D costs. As a result, there are spillovers from current R&D to future R&D activities. In an international context these spillovers cross national boarders, implying that R&D of one country impacts not only the future R&D costs of domestic firms, but also the future R&D costs of foreign firms. The extent to which foreign firms benefit from these spillovers may depend on the economic relations between the countries, such as the volume of their bilateral trade or the characteristics of the traded products. 13 As a robustness check, estimates without the interaction are reported in the appendix.
14 Single-equation methods assume that the model can be expressed in triangular form so that normalizing the cointegration vector identifies the vector of interest. General vector error correction models (VECMs) with multiple equations are typically not feasible with panel data given the large number of parameters. Although restricted VECMs are feasible (Groen and Kleibergen, 2003), they are not used as often as the single-equation methods used here.
14
In the quality ladders approach an improvement in the quality of an input raises its productivity by a fixed proportional factor, which defines a rung size in the quality ladder. As a result, today’s improvement of a product enables future innovators to begin their own improvements from a higher quality level, and therefore contributes a larger absolute addition to the quality of the input at comparable costs. Consequently there are R&D spillovers. Naturally, these spillovers apply to all innovators who build on the quality of the available products, domestic and foreign alike. The degree to which foreign innovators can improve on a domestic product may depend, however, on the bilateral economic relations between the countries, as in the case of expanding variety. Grossman and Helpman (1994) discuss the application of these ideas to the construction of knowledge stocks, and argue that empirically observed investment rates in R&D can generate observed levels of total productivity growth in the United States. These insights guided the empirical specification in Coe and Helpman (1995), which we also adopt below. Coe and Helpman (1995) estimated three specifications. The simplest is,
logFi = αi0
+ αidlogSi
d + αiflogSi
f + εi , (1) where i is a country index, F is total factor productivity, Sd is the real domestic R&D capital stock, Sf is the real foreign R&D capital stock, and ε is a well-defined error; time subscripts have been omitted. A second specification allows the impact of domestic R&D to differ between the largest seven economies and the others, logFi = αi
0 + αi
dlogSid + αi
dG7G7·logSid + αi
flogSif + εi , (2)
where G7 is a dummy variable equal to one for the G7 countries and zero otherwise. The third specification allows the impact of foreign R&D to vary with the level of imports by interacting the import share with the foreign R&D capital stock,
logFi = αi0
+ αidlogSi
d + αidG7G7·logSi
d + αifm mi·logSi
f + εi , (3) where m is the share of imports in GDP. Table 4 presents panel estimates of the three specifications.15 The columns labeled CH report the OLS estimation results reported in CH based on pooled data for 1971–90 for 22 countries
15 As noted, the data for Germany are for West Germany until 1990 and for unified Germany thereafter. Excluding Germany makes virtually no difference compared with the reported estimation results, which include Germany.
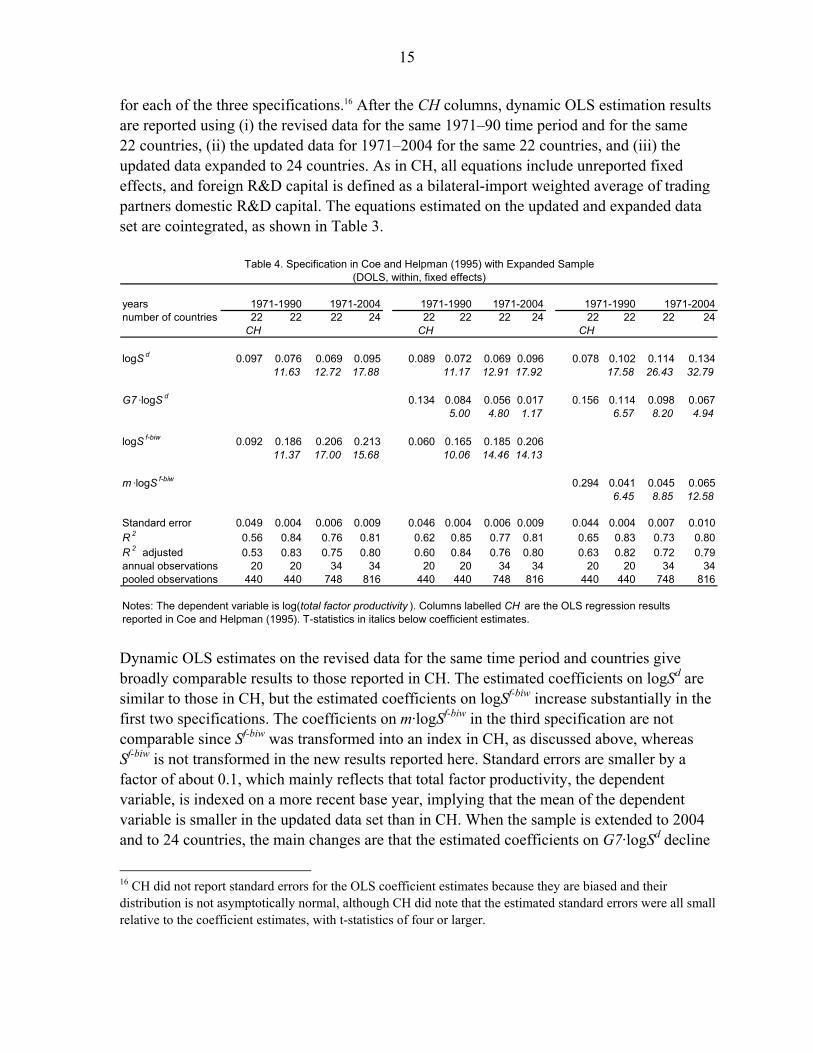
15
for each of the three specifications.16 After the CH columns, dynamic OLS estimation results are reported using (i) the revised data for the same 1971–90 time period and for the same 22 countries, (ii) the updated data for 1971–2004 for the same 22 countries, and (iii) the updated data expanded to 24 countries. As in CH, all equations include unreported fixed effects, and foreign R&D capital is defined as a bilateral-import weighted average of trading partners domestic R&D capital. The equations estimated on the updated and expanded data set are cointegrated, as shown in Table 3.
yearsnumber of countries 22 22 22 24 22 22 22 24 22 22 22 24
CH CH CH
logS d 0.097 0.076 0.069 0.095 0.089 0.072 0.069 0.096 0.078 0.102 0.114 0.13411.63 12.72 17.88 11.17 12.91 17.92 17.58 26.43 32.79
G7 ·logS d 0.134 0.084 0.056 0.017 0.156 0.114 0.098 0.0675.00 4.80 1.17 6.57 8.20 4.94
logS f-biw 0.092 0.186 0.206 0.213 0.060 0.165 0.185 0.20611.37 17.00 15.68 10.06 14.46 14.13
m ·logS f-biw 0.294 0.041 0.045 0.0656.45 8.85 12.58
Standard error 0.049 0.004 0.006 0.009 0.046 0.004 0.006 0.009 0.044 0.004 0.007 0.010R 2 0.56 0.84 0.76 0.81 0.62 0.85 0.77 0.81 0.65 0.83 0.73 0.80R 2 adjusted 0.53 0.83 0.75 0.80 0.60 0.84 0.76 0.80 0.63 0.82 0.72 0.79annual observations 20 20 34 34 20 20 34 34 20 20 34 34pooled observations 440 440 748 816 440 440 748 816 440 440 748 816
reported in Coe and Helpman (1995). T-statistics in italics below coefficient estimates.
Table 4. Specification in Coe and Helpman (1995) with Expanded Sample(DOLS, within, fixed effects)
1971-2004 1971-2004 1971-2004
Notes: The dependent variable is log(total factor productivity ). Columns labelled CH are the OLS regression results
1971-1990 1971-1990 1971-1990
Dynamic OLS estimates on the revised data for the same time period and countries give broadly comparable results to those reported in CH. The estimated coefficients on logSd are similar to those in CH, but the estimated coefficients on logSf-biw increase substantially in the first two specifications. The coefficients on m·logSf-biw in the third specification are not comparable since Sf-biw was transformed into an index in CH, as discussed above, whereas Sf-biw is not transformed in the new results reported here. Standard errors are smaller by a factor of about 0.1, which mainly reflects that total factor productivity, the dependent variable, is indexed on a more recent base year, implying that the mean of the dependent variable is smaller in the updated data set than in CH. When the sample is extended to 2004 and to 24 countries, the main changes are that the estimated coefficients on G7·logSd decline
16 CH did not report standard errors for the OLS coefficient estimates because they are biased and their distribution is not asymptotically normal, although CH did note that the estimated standard errors were all small relative to the coefficient estimates, with t-statistics of four or larger.
16
sharply, becoming insignificant in the second specification when the sample is extended to 24 countries; the elasticities of TFP with respect to foreign R&D capital increase; and the elasticity with respect to domestic R&D capital tends to fall in the G7 countries but increase in the non-G7 countries. These estimates confirm the key empirical results from CH. Econometric techniques not available in the early 1990s indicate that there is robust evidence that total factor productivity, domestic R&D capital, and foreign R&D capital are cointegrated, and that both measures of R&D capital are significant determinants of TFP. Broadly consistent results are obtained from a revised data set for the same time period and countries used by CH and for the updated and expanded dataset. The specifications in CH focus on domestic and foreign R&D capital as the key long-run determinants of TFP, consistent with the theoretical model. Another important determinant of productivity is human capital (Engelbrecht, 1997). Including a measure of human capital becomes more important as the time period is lengthened, since for most economically advanced countries measures of human capital tend to change slowly, and as countries such as Korea, which have invested heavily in human capital formation since the early 1970s, are included in the analysis.17 This is confirmed by regressions on the updated and expanded dataset, which indicate that human capital is cointegrated with TFP and domestic and foreign R&D capital, and that human capital is a significant determinant of TFP under a variety of specifications. From a broader perspective, other theoretical models would suggest a number of additional determinants of TFP, as emphasized by Khan and Luintel (2006), although lack of data availability precluded the inclusion of many potential candidates in this study.18 Table 5 presents estimates including the logarithm of human capital (H) as an additional explanatory variable, and compares dynamic OLS within estimates, i.e., DOLS estimates on the pooled data, with DOLS mean group estimates. As noted, the estimated coefficients on human capital are highly significant in all specifications and with both estimation techniques. The DOLS within estimates include regressions comparable to the three specifications reported in Table 4. Including logH reduces the size of the estimated coefficients on logSf-biw, but not on m·logSf-biw, and makes the estimated coefficients on G7·logSd insignificant; all other estimated coefficients remain highly significant.19 17 Coe et al. (1997) include human capital in their analysis of R&D spillovers from developed countries in the north to developing countries in the south.
18 We did include measures of publicly financed R&D, distance to frontier, and a variety of other variables, but did not find that these were significant or robust determinants of total factor productivity in our data set. 19 Experiments entering logH interacted with either logSd, logSf-biw, or m·logSf-biw did not yield results that were correctly signed and significant across a variety of specifications.
17
within mge within mge within within
logS d 0.098 0.144 0.066 0.195 0.062 0.0956.13 30.13 3.15 23.49 3.14 6.20
G7 ·logS d -0.019 0.012-1.23 0.63
logS f-biw 0.035 0.018 0.1213.14 9.47 5.05
m ·logS f-biw 0.116 0.018 0.0425.11 1.91 3.27
logH 0.725 0.523 0.747 0.513 0.756 0.6958.33 6.16 9.88 7.28 9.83 7.81
Standard error 0.092 0.018 0.089 0.019 0.088 0.091R 2 0.76 0.94 0.78 0.94 0.78 0.77R 2 adjusted 0.76 0.93 0.77 0.93 0.78 0.77
Notes: The dependent variable is log(total factor productivity ). T-statistics in italics below coefficient estimates. Within estimates include fixed effects.
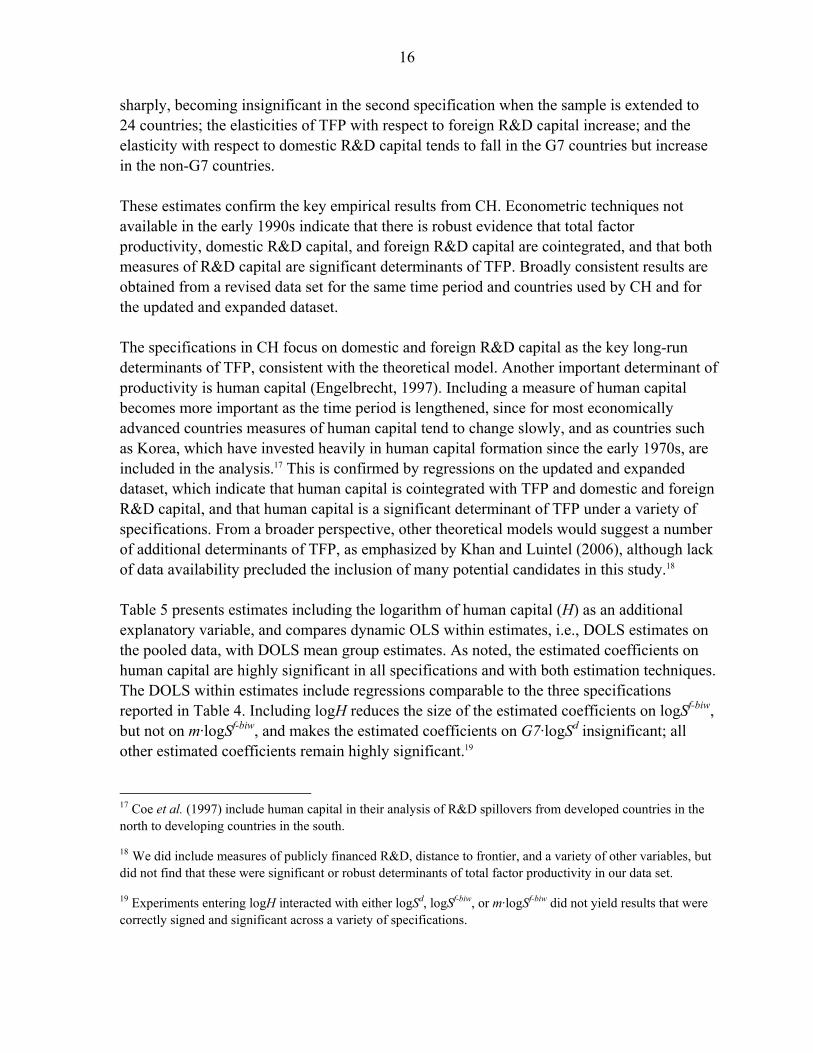
Table 5. Dynamic OLS Within and Mean Group Estimates with Human Capital(1971-2004, 24 countries)
The mean group estimates, which are based on DOLS time-series estimates for each country, are broadly similar to the DOLS within estimates, with all of the estimated coefficients remaining correctly signed and significant. The main differences are that, compared with the “within” estimates, in the mean group estimates the estimated coefficients on logSd are larger while the coefficients on logSf-biw and on m·logSf-biw are smaller, and the measures of goodness of fit are better. Of course, the MGE results are averages of the estimated equations for the individual countries, each of which are only based on 34 annual observations, and some of the estimated coefficients in these country-specific equations are incorrectly signed or insignificant, or both. Foreign R&D capital in the results presented thus far is defined as a bilateral import share weighted average of the domestic R&D capital stocks of trading partners (Sf-biw), as in CH. Table 6 presents estimation results using two alternative definitions: bilateral imports as the fraction of trading partners’ output multiplied by trading partners’ domestic R&D capital (Sf-LP), as proposed by Lichtenberg and van Pottelsberghe de la Potterie (1998), and a simple average of trading partners’ domestic R&D capital (Sf-avg). To keep the presentation concise, results are only presented for the specification with the import share interacted with foreign R&D capital; estimation results for the specification with foreign R&D capital not interacted with import shares are presented in appendix Table A1.
18
Table 6. Alternative Definitions of Foreign R&D Capital(DOLS, within, fixed effects, 1971-2004, 24 countries)
logS d 0.098 0.095 0.098 0.098 0.087 0.0906.13 6.04 6.10 6.15 5.61 5.67
m ·logS f-biw 0.035 0.226 -0.0253.14 2.20 -0.63
m ·logS f-LP 0.052 0.194 0.0983.33 2.62 1.76
m ·logS f-avg 0.037 -0.205 -0.1042.97 -1.81 -1.76
logH 0.725 0.708 0.718 0.765 0.685 0.6768.33 8.08 8.13 8.83 7.78 7.84
Standard error 0.092 0.091 0.092 0.092 0.090 0.090R 2 0.76 0.76 0.76 0.76 0.77 0.77R 2 adjusted 0.76 0.76 0.76 0.76 0.77 0.77
Notes: The dependent variable is log(total factor productivity ). T-statisticsin italics below coefficient estimates.
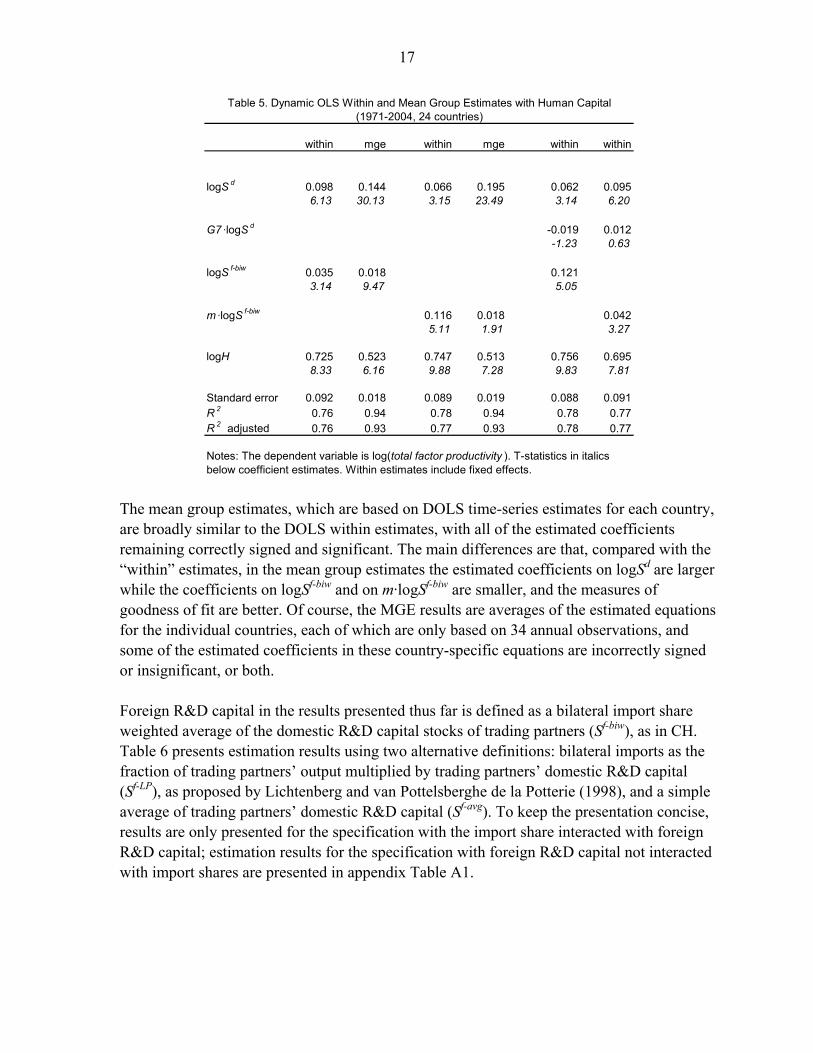
Regression estimates using either of the three definitions are very similar, as shown in the first three columns of Table 6. When m·logSf-biw or m·logSf-LP is included in the same regression with m·logSf-avg, the estimated coefficients on the former remain significant while the coefficients on the latter become negative and insignificant. While this mainly reflects multi-colinearity, it also suggests that the definition of foreign R&D capital based on either bilateral import shares or the definition proposed by Lichtenberg and van Pottelsberghe de la Potterie (1998), which is also based on bilateral imports, perform somewhat better than the definition based on a simple average. When m·logSf-biw and m·logSf-LP are included in the same regression, the estimated coefficients become negative or insignificant. However, in the alternative specification without the interaction with the import share, the estimated coefficient on logSf-biw remains significant whereas the coefficient on logSf-LP is insignificant, as shown in the final regression in Table A1. Our interpretation of these results is that foreign R&D capital defined with bilateral-import weights (Sf-biw) performs somewhat better than the definition proposed by Lichtenberg and van Pottelsberghe de la Potterie (1998) (Sf-LP), both of which perform much better than a simple average. In the next section, we only report results with foreign R&D capital defined with bilateral-import weights; results based on the LP measure are broadly similar.
V. INSTITUTIONS AND INTERNATIONAL R&D SPILLOVERS
Institutions are increasingly viewed as key determinants of total factor productivity and, hence, of economic growth. In this section we test if the estimated parameters on domestic and foreign R&D capital and on human capital vary among countries according to various
19
proxies for institutions. Thus we seek to account for heterogeneity based country-specific institutions rather than by estimating country-specific parameters based on limited time-series observations. We focus on four institutions that have been emphasized in the literature:20 • The ease of doing business, which is an average ranking of countries according to the
ease of doing the following ten actions: starting a business, dealing with licenses, employing workers, registering property, getting credit, protecting investors, paying taxes, trading across borders, enforcing contracts, and closing a business (World Bank, 2007).
• The quality of tertiary education, which is a composite measure of the extent to which tertiary institutions have: freedom to manage resources, including the selection of students, autonomy to decide on the sources and structure of funding, and staff personnel policies; freedom in setting objectives, including deciding on course content; and are accountable, including various types of evaluation (Oliveira Martins et al., 2007).21
• The strength of intellectual property rights, as measured by an index of patent protection (Park and Lippoldt, 2005).
• The origins of legal systems in either French, German, Scandinavian, or English law (La Porta et al., 1999; La Porta et al., 2008).
Each of these institutional variables could potentially affect the degree to which domestic and foreign R&D capital affects total factor productivity. In the quality ladders approach, for example, a given R&D effort could result in larger quality improvements in countries where the quality of tertiary education is relatively high since these countries may produce more productive researchers than other countries. Similarly countries where the ease of doing business is relatively high or intellectual property rights are well protected may encourage more entrepreneurial R&D that results in larger quality improvements for a given R&D effort. Different legal systems may also affect the type or productivity of R&D.
20 We also tested for the importance of various other institutions, such as measures of financial development, labor market institutions, governance, and ease of trading across borders, but did not find significant differences in the estimated coefficients.
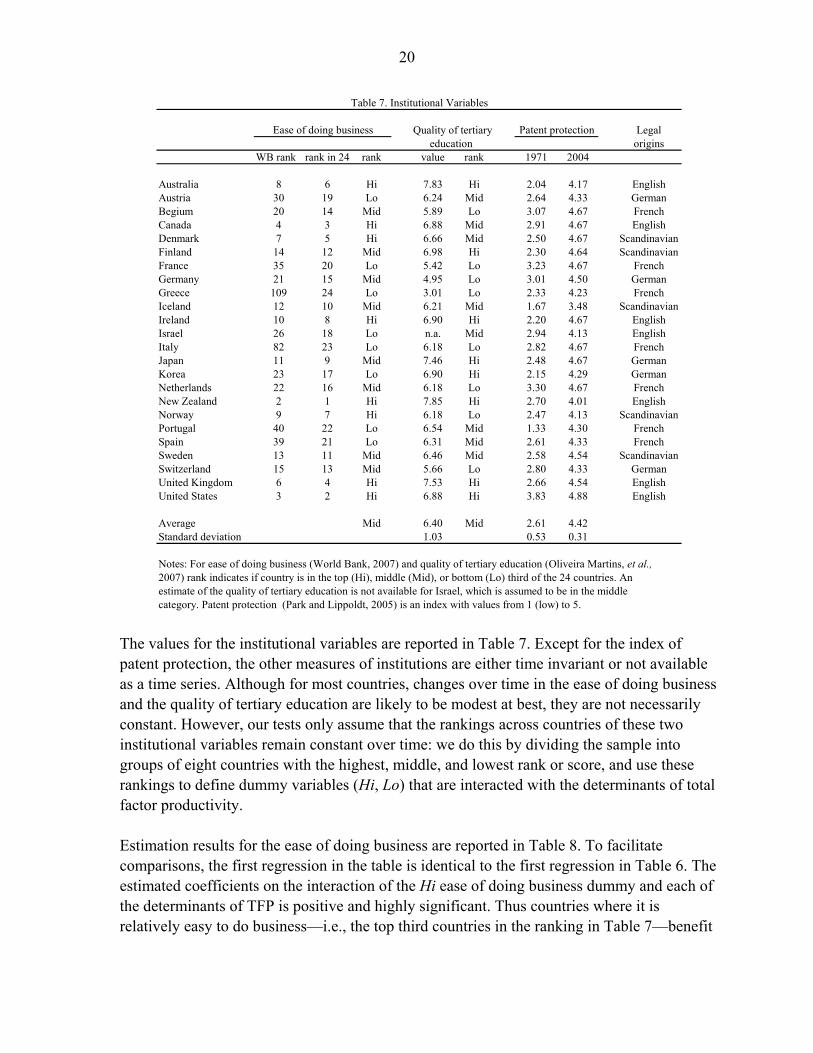
21 Values for Belgium, Canada, and the United States are population-weighted averages of the, respectively, linguistic, provincial, and state groups reported in Oliveira Martins et al. (2007). An estimate of the quality of tertiary education is not available for Israel, which is assumed to be in the middle group in Table 7.
20
Quality of tertiary Legal education origins
WB rank rank in 24 rank value rank 1971 2004
Australia 8 6 Hi 7.83 Hi 2.04 4.17 EnglishAustria 30 19 Lo 6.24 Mid 2.64 4.33 GermanBegium 20 14 Mid 5.89 Lo 3.07 4.67 FrenchCanada 4 3 Hi 6.88 Mid 2.91 4.67 EnglishDenmark 7 5 Hi 6.66 Mid 2.50 4.67 ScandinavianFinland 14 12 Mid 6.98 Hi 2.30 4.64 ScandinavianFrance 35 20 Lo 5.42 Lo 3.23 4.67 FrenchGermany 21 15 Mid 4.95 Lo 3.01 4.50 GermanGreece 109 24 Lo 3.01 Lo 2.33 4.23 FrenchIceland 12 10 Mid 6.21 Mid 1.67 3.48 ScandinavianIreland 10 8 Hi 6.90 Hi 2.20 4.67 EnglishIsrael 26 18 Lo n.a. Mid 2.94 4.13 EnglishItaly 82 23 Lo 6.18 Lo 2.82 4.67 FrenchJapan 11 9 Mid 7.46 Hi 2.48 4.67 GermanKorea 23 17 Lo 6.90 Hi 2.15 4.29 GermanNetherlands 22 16 Mid 6.18 Lo 3.30 4.67 FrenchNew Zealand 2 1 Hi 7.85 Hi 2.70 4.01 EnglishNorway 9 7 Hi 6.18 Lo 2.47 4.13 ScandinavianPortugal 40 22 Lo 6.54 Mid 1.33 4.30 FrenchSpain 39 21 Lo 6.31 Mid 2.61 4.33 FrenchSweden 13 11 Mid 6.46 Mid 2.58 4.54 ScandinavianSwitzerland 15 13 Mid 5.66 Lo 2.80 4.33 GermanUnited Kingdom 6 4 Hi 7.53 Hi 2.66 4.54 EnglishUnited States 3 2 Hi 6.88 Hi 3.83 4.88 English
Average Mid 6.40 Mid 2.61 4.42Standard deviation 1.03 0.53 0.31
Notes: For ease of doing business (World Bank, 2007) and quality of tertiary education (Oliveira Martins, et al.,2007) rank indicates if country is in the top (Hi), middle (Mid), or bottom (Lo) third of the 24 countries. Anestimate of the quality of tertiary education is not available for Israel, which is assumed to be in the middlecategory. Patent protection (Park and Lippoldt, 2005) is an index with values from 1 (low) to 5.
Table 7. Institutional Variables
Ease of doing business Patent protection
The values for the institutional variables are reported in Table 7. Except for the index of patent protection, the other measures of institutions are either time invariant or not available as a time series. Although for most countries, changes over time in the ease of doing business and the quality of tertiary education are likely to be modest at best, they are not necessarily constant. However, our tests only assume that the rankings across countries of these two institutional variables remain constant over time: we do this by dividing the sample into groups of eight countries with the highest, middle, and lowest rank or score, and use these rankings to define dummy variables (Hi, Lo) that are interacted with the determinants of total factor productivity. Estimation results for the ease of doing business are reported in Table 8. To facilitate comparisons, the first regression in the table is identical to the first regression in Table 6. The estimated coefficients on the interaction of the Hi ease of doing business dummy and each of the determinants of TFP is positive and highly significant. Thus countries where it is relatively easy to do business—i.e., the top third countries in the ranking in Table 7—benefit
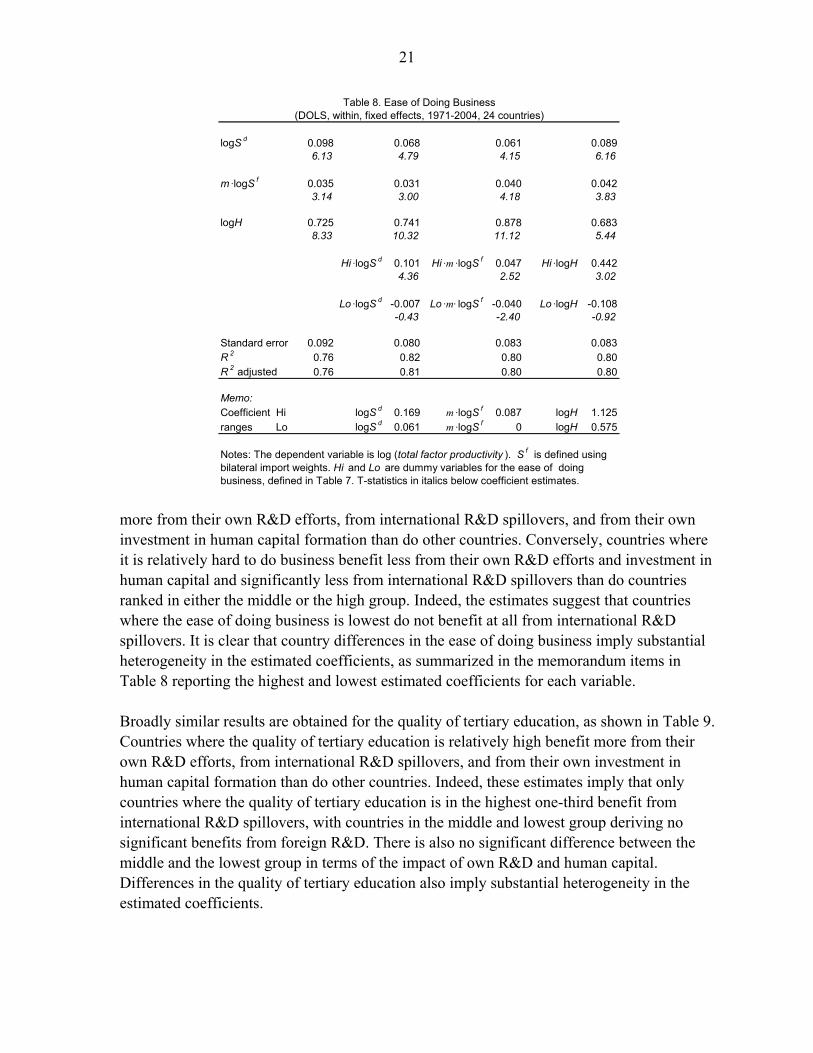
21
logS d 0.098 0.068 0.061 0.0896.13 4.79 4.15 6.16
m ·logS f 0.035 0.031 0.040 0.0423.14 3.00 4.18 3.83
logH 0.725 0.741 0.878 0.6838.33 10.32 11.12 5.44
Hi ·logS d 0.101 Hi ·m ·logS f 0.047 Hi ·logH 0.4424.36 2.52 3.02
Lo ·logS d -0.007 Lo ·m· logS f -0.040 Lo ·logH -0.108-0.43 -2.40 -0.92
Standard error 0.092 0.080 0.083 0.083R 2 0.76 0.82 0.80 0.80R 2 adjusted 0.76 0.81 0.80 0.80
Memo:Coefficient Hi logS d 0.169 m ·logS f 0.087 logH 1.125ranges Lo logS d 0.061 m ·logS f 0 logH 0.575
Notes: The dependent variable is log (total factor productivity ). S f is defined usingbilateral import weights. Hi and Lo are dummy variables for the ease of doingbusiness, defined in Table 7. T-statistics in italics below coefficient estimates.
Table 8. Ease of Doing Business(DOLS, within, fixed effects, 1971-2004, 24 countries)
more from their own R&D efforts, from international R&D spillovers, and from their own investment in human capital formation than do other countries. Conversely, countries where it is relatively hard to do business benefit less from their own R&D efforts and investment in human capital and significantly less from international R&D spillovers than do countries ranked in either the middle or the high group. Indeed, the estimates suggest that countries where the ease of doing business is lowest do not benefit at all from international R&D spillovers. It is clear that country differences in the ease of doing business imply substantial heterogeneity in the estimated coefficients, as summarized in the memorandum items in Table 8 reporting the highest and lowest estimated coefficients for each variable. Broadly similar results are obtained for the quality of tertiary education, as shown in Table 9. Countries where the quality of tertiary education is relatively high benefit more from their own R&D efforts, from international R&D spillovers, and from their own investment in human capital formation than do other countries. Indeed, these estimates imply that only countries where the quality of tertiary education is in the highest one-third benefit from international R&D spillovers, with countries in the middle and lowest group deriving no significant benefits from foreign R&D. There is also no significant difference between the middle and the lowest group in terms of the impact of own R&D and human capital. Differences in the quality of tertiary education also imply substantial heterogeneity in the estimated coefficients.
22
logS d 0.098 0.067 0.072 0.0826.13 6.25 5.54 6.95
m ·logS f 0.035 0.036 0.012 0.0403.14 3.47 1.14 4.10
logH 0.725 0.698 0.813 0.4888.33 7.94 11.37 5.29
Hi ·logS d 0.102 Hi ·m ·logS f 0.101 Hi ·logH 0.9397.84 6.95 9.33
Lo ·logS d -0.013 Lo ·m ·logS f 0.012 Lo ·logH 0.201-0.53 0.75 1.66
Standard error 0.092 0.088 0.082 0.087R 2 0.76 0.78 0.81 0.79R 2 adjusted 0.76 0.78 0.81 0.78
Memo:Coefficient Hi logS d 0.169 m ·logS f 0.113 logH 1.427ranges Lo logS d 0.054 m ·logS f 0.012 logH 0.488
Notes: The dependent variable is log(total factor productivity ). S f is defined using bilateral import weights. Hi and Lo are dummy variables for the quality of tertiaryeducation, defined in Table 7. T- statistics in italics below coefficient estimates.
Table 9. Quality of Tertiary Education Systems(DOLS, within, fixed effects, 1971-2004, 24 countries)
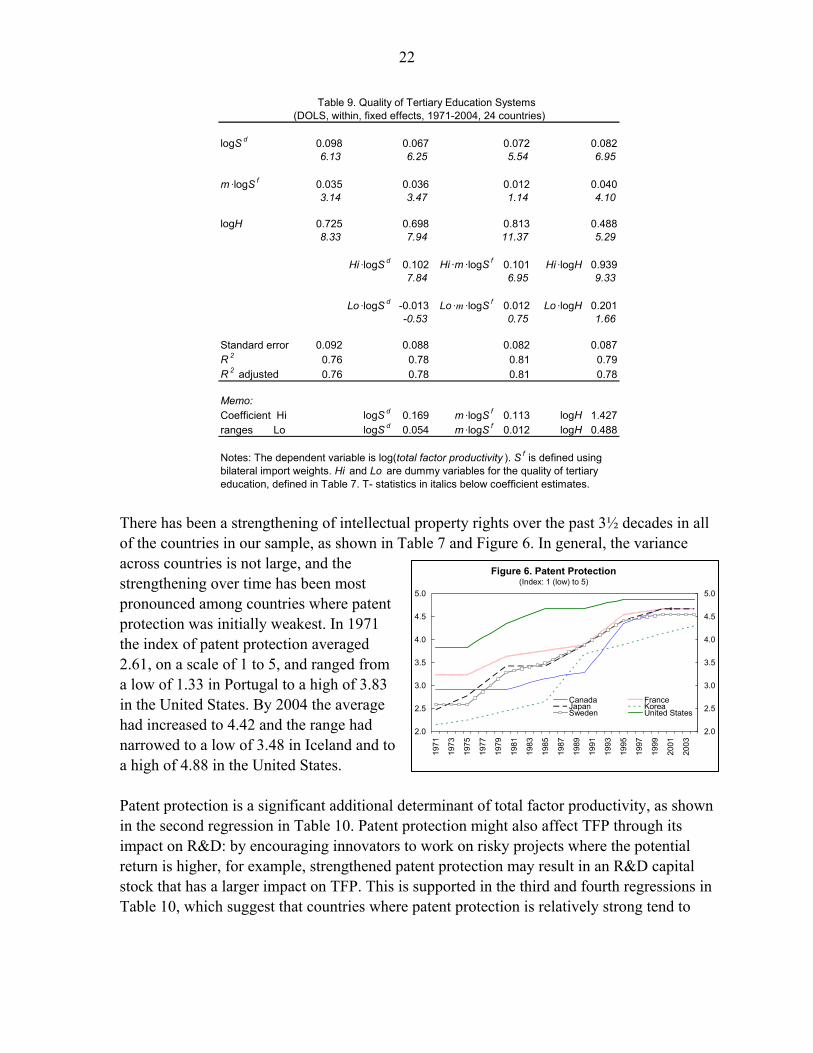
There has been a strengthening of intellectual property rights over the past 3½ decades in all of the countries in our sample, as shown in Table 7 and Figure 6. In general, the variance across countries is not large, and the strengthening over time has been most pronounced among countries where patent protection was initially weakest. In 1971 the index of patent protection averaged 2.61, on a scale of 1 to 5, and ranged from a low of 1.33 in Portugal to a high of 3.83 in the United States. By 2004 the average had increased to 4.42 and the range had narrowed to a low of 3.48 in Iceland and to a high of 4.88 in the United States. Patent protection is a significant additional determinant of total factor productivity, as shown in the second regression in Table 10. Patent protection might also affect TFP through its impact on R&D: by encouraging innovators to work on risky projects where the potential return is higher, for example, strengthened patent protection may result in an R&D capital stock that has a larger impact on TFP. This is supported in the third and fourth regressions in Table 10, which suggest that countries where patent protection is relatively strong tend to
2.0
2.5
3.0
3.5
4.0
4.5
5.0
1971
1973
1975
1977
1979
1981
1983
1985
1987
1989
1991
1993
1995
1997
1999
2001
2003
2.0
2.5
3.0
3.5
4.0
4.5
5.0
Canada FranceJapan KoreaSweden United States
Figure 6. Patent Protection(Index: 1 (low) to 5)
23
benefit more from a given level of domestic and, to a lesser extent, foreign R&D capital compared with countries where patent protection is relatively weak.22 Given that the differences in patent protection across countries is not large, and that patent protection has strengthened and converged, the heterogeneity of the estimated coefficients implied by the last three equations in Table 10 is not large and decreases over time. In the fourth equation, for example, the range of the lowest and highest estimated coefficients on m·logSf is about 0.03-0.05 in 1971 and 0.05-0.06 in 2004.
logS d 0.098 0.056 0.043 0.057 0.0426.13 4.86 4.04 5.84 3.66
m ·logS f 0.035 0.031 0.026 0.022 0.0273.14 4.19 3.25 2.66 3.31
logH 0.725 0.452 0.413 0.402 0.4158.33 7.48 7.55 7.20 7.51
logPP 0.2516.52
PP ·logS d 0.008 0.0098.86 2.48
PP ·m ·logS f 0.008 -0.0018.63 -0.23
Standard error 0.092 0.083 0.081 0.081 0.081R 2 0.76 0.80 0.81 0.81 0.81R 2 adjusted 0.76 0.80 0.81 0.81 0.81
Notes: The dependent variable is log(total factor productivity ). S f is defined using bilateral import weights. T-statistics in italics below coefficient estimates.
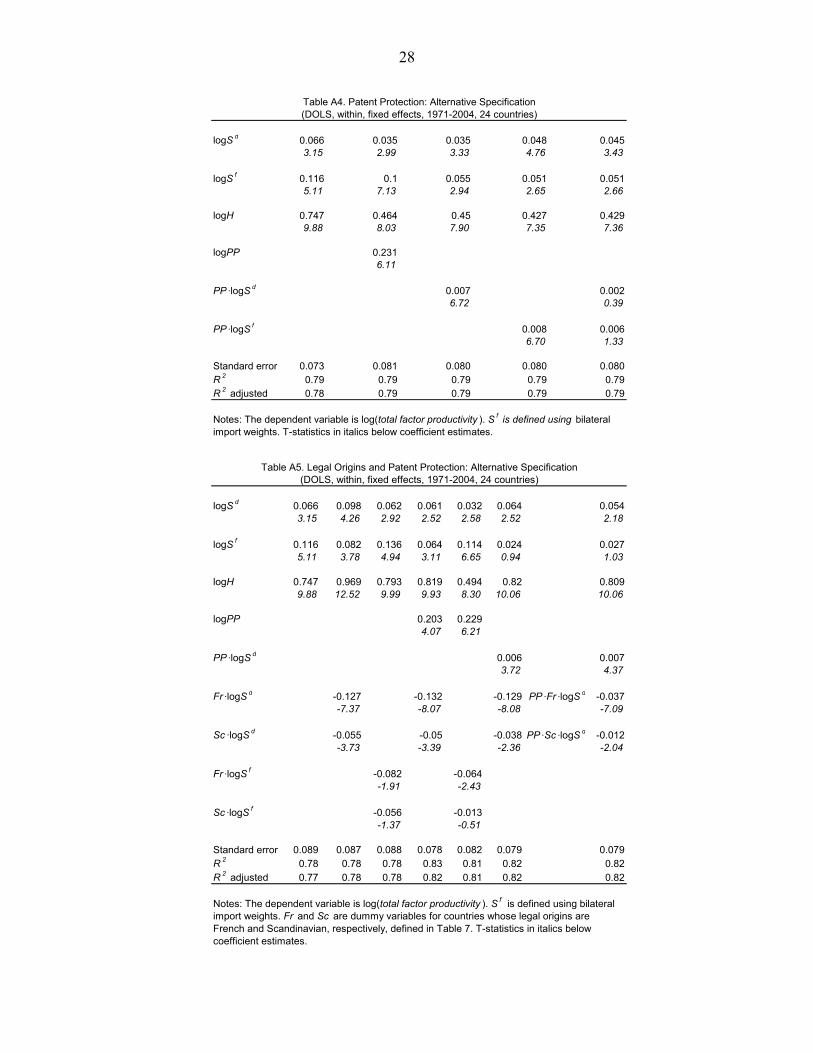
Table 10. Patent Protection(DOLS, within, fixed effects, 1971-2004, 24 countries)
Countries with different legal systems may offer different degrees of investor protection, including patent protection, which could be reflected in the estimated coefficients on R&D capital. To test for this, dummy variables for countries whose legal systems originate in French (Fr), German, and Scandinavian (Sc) law (cf. Table 7) were interacted with the domestic and foreign R&D capital stocks.23 The estimated coefficients for countries with legal systems based on German law were not significantly different from those based on English law. The results reported in Table 11 suggest that countries with French- and Scandinavian-based legal systems benefit less from a given level of domestic R&D capital than other countries. This result comes through strongly in the basic specification as well as in specifications where patent protection enters separately or interacted with the domestic
22 If patent protection is included in the same regression with either or both of the capital stocks interacted with patent protection, it was either insignificant or incorrectly signed.
23 We found no evidence that the estimated coefficients on foreign R&D capital were different for trading partners with the same legal origin than for trading partners with different legal origins.
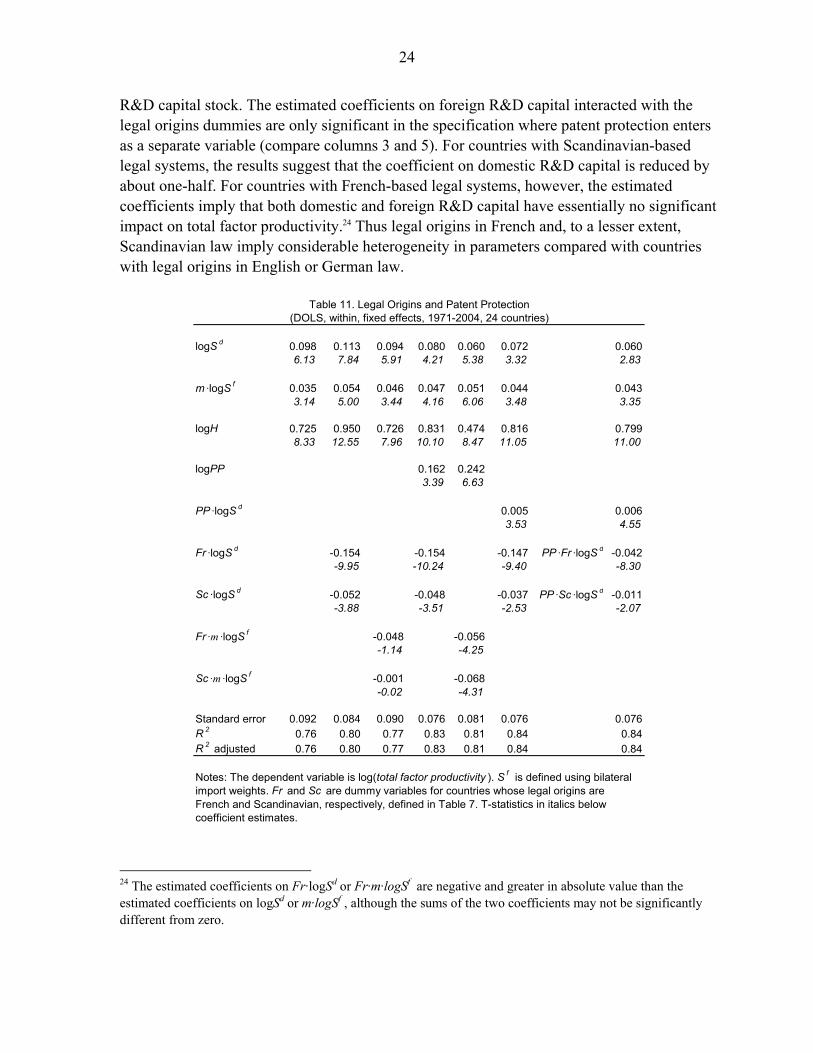
24
R&D capital stock. The estimated coefficients on foreign R&D capital interacted with the legal origins dummies are only significant in the specification where patent protection enters as a separate variable (compare columns 3 and 5). For countries with Scandinavian-based legal systems, the results suggest that the coefficient on domestic R&D capital is reduced by about one-half. For countries with French-based legal systems, however, the estimated coefficients imply that both domestic and foreign R&D capital have essentially no significant impact on total factor productivity.24 Thus legal origins in French and, to a lesser extent, Scandinavian law imply considerable heterogeneity in parameters compared with countries with legal origins in English or German law.
logS d 0.098 0.113 0.094 0.080 0.060 0.072 0.0606.13 7.84 5.91 4.21 5.38 3.32 2.83
m ·logS f 0.035 0.054 0.046 0.047 0.051 0.044 0.0433.14 5.00 3.44 4.16 6.06 3.48 3.35
logH 0.725 0.950 0.726 0.831 0.474 0.816 0.7998.33 12.55 7.96 10.10 8.47 11.05 11.00
logPP 0.162 0.2423.39 6.63
PP ·logS d 0.005 0.0063.53 4.55
Fr ·logS d -0.154 -0.154 -0.147 PP ·Fr ·logS d -0.042-9.95 -10.24 -9.40 -8.30
Sc ·logS d -0.052 -0.048 -0.037 PP ·Sc ·logS d -0.011-3.88 -3.51 -2.53 -2.07
Fr ·m ·logS f -0.048 -0.056-1.14 -4.25
Sc ·m ·logS f -0.001 -0.068-0.02 -4.31
Standard error 0.092 0.084 0.090 0.076 0.081 0.076 0.076R 2 0.76 0.80 0.77 0.83 0.81 0.84 0.84R 2 adjusted 0.76 0.80 0.77 0.83 0.81 0.84 0.84
Notes: The dependent variable is log(total factor productivity ). S f is defined using bilateral import weights. Fr and Sc are dummy variables for countries whose legal origins are French and Scandinavian, respectively, defined in Table 7. T-statistics in italics belowcoefficient estimates.
Table 11. Legal Origins and Patent Protection(DOLS, within, fixed effects, 1971-2004, 24 countries)
24 The estimated coefficients on Fr·logSd or Fr·m·logSf are negative and greater in absolute value than the estimated coefficients on logSd or m·logSf , although the sums of the two coefficients may not be significantly different from zero.
25
VI. CONCLUSIONS
The key results reported in Coe and Helpman (1995) are, in general, confirmed by estimation on an updated and expanded database using modern panel cointegration techniques not available in the early 1990s. There is robust evidence that total factor productivity, domestic R&D capital, and foreign R&D capital are cointegrated, and that both measures of R&D capital are significant determinants of TFP. Although not included in CH’s analysis, there is strong evidence that human capital is also cointegrated and is an additional significant determinant of TFP, as emphasized by Engelbrecht (1997). Including human capital does, however, change the result in CH that the estimated coefficient on the domestic R&D capital stock is significantly higher in the G7 countries than in other countries. Regressions using the definition of foreign R&D capital based on either bilateral import shares, as in CH, or the definition proposed by Lichtenberg and van Pottelsberghe de la Potterie (1998), which is also based on bilateral imports, perform equally well, and better than the definition based on a simple average.
When the equations are estimated individually for each country, the DOLS mean group estimates give broadly similar results to the DOLS estimates on the pooled data, although the estimated coefficients on foreign R&D capital decline substantially while those on domestic R&D capital rise somewhat. These two estimation techniques are based on extreme assumptions about parameter heterogeneity: the pooled estimates assume homogeneity, except for fixed effects, whereas the mean group estimates allow complete heterogeneity, albeit based on limited time-series observations. We address the issue of parameter heterogeneity by extending the empirical analysis in Coe and Helpman (1995) to examine institutional sources of heterogeneity. We find evidence that countries where the ease of doing business and the quality of tertiary education systems are relatively high tend to benefit more from their own R&D efforts, from international R&D spillovers, and from human capital formation. We also find that strong patent protection is associated with higher levels of total factor productivity, higher returns to domestic R&D, and larger international R&D spillovers. Finally, we find evidence that countries whose legal systems are based on French and, to a lesser extent, Scandinavian law benefit less from their own and foreign R&D capital than countries whose legal origins are based on English or German law. These results on the importance of institutions are consistent with the broader growth literature emphasizing the importance of institutions for economic growth and suggest specific channels through which institutions may affect TFP and growth. A fruitful area for future research would be to extend the analysis in Coe, Helpman, and Hoffmaister (1997) to examine the role of institutions in explaining why some developing countries benefit more than others from international R&D spillovers from advanced countries.
26
APPENDIX A: ALTERNATIVE SPECIFICATION
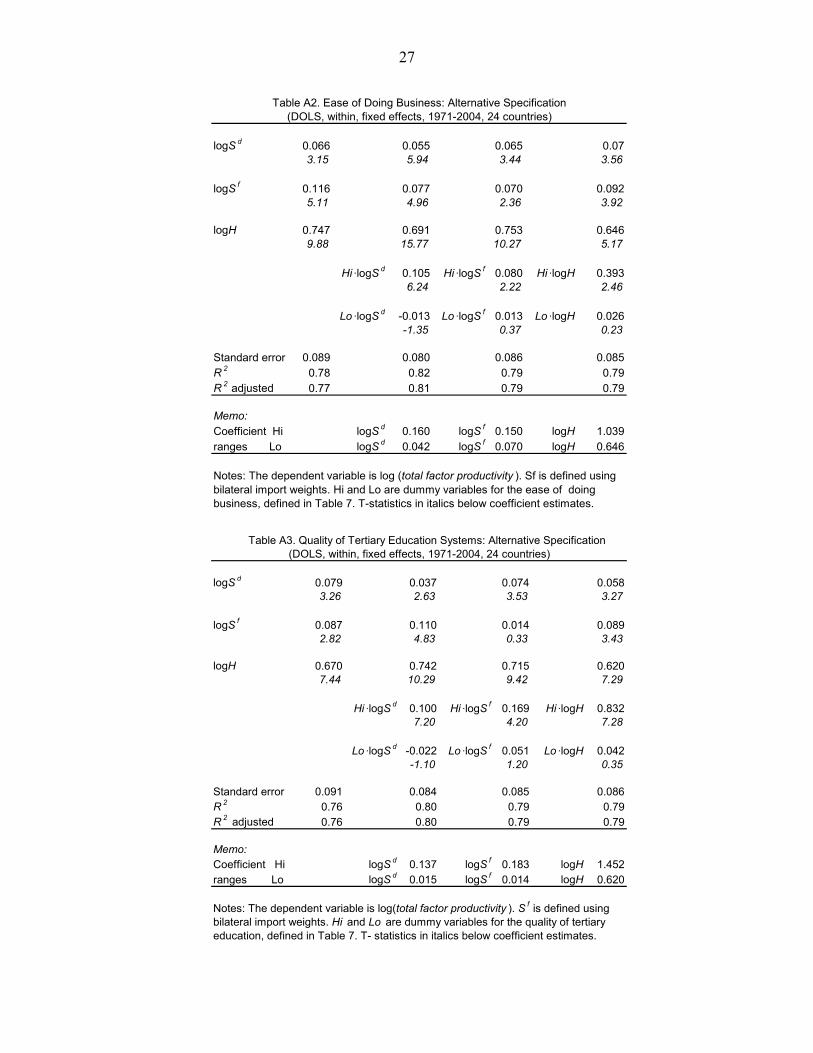
Regression results comparable to those presented in Table 6 and Tables 8–11 but based on an alternative specification where foreign R&D capital (logSf ) is not interacted with the import share (m)—i.e., based on equation (2) rather than equation (3), but without the G7 dummy interacted with logSd —are presented in Tables A1–A5. In general, the results are similar to those discussed in the main text, although there are some noteworthy differences: • In the alternative specification, foreign R&D capital defined with bilateral import
shares (Sf-biw) dominates foreign R&D capital defined as proposed by Lichtenberg and van Pottelsberghe de la Potterie (1998) (Sf-LP) when both are entered in the same equation, whereas both were insignificant in the specification reported in the text (cf. the fourth equations in Tables 6 and A1).
• The evidence of a significantly lower coefficient on foreign R&D capital in countries where the ease of doing business is lowest is absent in the alternative specification (cf. the third equations in Tables 8 and A2).
• In the alternative specification, there is evidence of a significantly lower coefficient on foreign R&D capital in countries whose legal origins are French (cf. the third equations in Tables 11 and A5) and Scandinavian (cf. the fifth equations in Tables 11 and A5).
(DOLS, within, fixed effects, 1971-2004, 24 countries)
logS d 0.066 0.083 0.079 0.074 0.078 0.0613.15 4.01 3.26 3.25 3.39 2.99
logS f-biw 0.116 0.184 0.0965.11 3.81 3.61
logS f-LP 0.082 0.074 0.0353.72 2.25 1.37
logS f-avg 0.087 -0.109 0.0162.82 -1.74 0.36
logH 0.747 0.627 0.670 0.870 0.615 0.6809.88 6.89 7.44 8.99 6.70 8.22
Standard error 0.089 0.093 0.091 0.091 0.091 0.088R 2 0.78 0.75 0.76 0.76 0.76 0.78R 2 adjusted 0.77 0.75 0.76 0.76 0.76 0.78
Notes: The dependent variable is log(total factor productivity). T-statistics in italics below coefficient estimates.
Table A1. Alternative Definitions of Foreign R&D Capital:Alternative Specification
27
logS d 0.066 0.055 0.065 0.073.15 5.94 3.44 3.56
logS f 0.116 0.077 0.070 0.0925.11 4.96 2.36 3.92
logH 0.747 0.691 0.753 0.6469.88 15.77 10.27 5.17
Hi ·logS d 0.105 Hi ·logS f 0.080 Hi ·logH 0.3936.24 2.22 2.46
Lo ·logS d -0.013 Lo ·logS f 0.013 Lo ·logH 0.026-1.35 0.37 0.23
Standard error 0.089 0.080 0.086 0.085R 2 0.78 0.82 0.79 0.79R 2 adjusted 0.77 0.81 0.79 0.79
Memo:Coefficient Hi logS d 0.160 logS f 0.150 logH 1.039ranges Lo logS d 0.042 logS f 0.070 logH 0.646
Notes: The dependent variable is log (total factor productivity ). Sf is defined usingbilateral import weights. Hi and Lo are dummy variables for the ease of doingbusiness, defined in Table 7. T-statistics in italics below coefficient estimates.
Table A2. Ease of Doing Business: Alternative Specification(DOLS, within, fixed effects, 1971-2004, 24 countries)
logS d 0.079 0.037 0.074 0.0583.26 2.63 3.53 3.27
logS f 0.087 0.110 0.014 0.0892.82 4.83 0.33 3.43
logH 0.670 0.742 0.715 0.6207.44 10.29 9.42 7.29
Hi ·logS d 0.100 Hi ·logS f 0.169 Hi ·logH 0.8327.20 4.20 7.28
Lo ·logS d -0.022 Lo ·logS f 0.051 Lo ·logH 0.042-1.10 1.20 0.35
Standard error 0.091 0.084 0.085 0.086R 2 0.76 0.80 0.79 0.79R 2 adjusted 0.76 0.80 0.79 0.79
Memo:Coefficient Hi logS d 0.137 logS f 0.183 logH 1.452ranges Lo logS d 0.015 logS f 0.014 logH 0.620
Notes: The dependent variable is log(total factor productivity ). S f is defined using bilateral import weights. Hi and Lo are dummy variables for the quality of tertiaryeducation, defined in Table 7. T- statistics in italics below coefficient estimates.
Table A3. Quality of Tertiary Education Systems: Alternative Specification(DOLS, within, fixed effects, 1971-2004, 24 countries)
28
logS d 0.066 0.035 0.035 0.048 0.0453.15 2.99 3.33 4.76 3.43
logS f 0.116 0.1 0.055 0.051 0.0515.11 7.13 2.94 2.65 2.66
logH 0.747 0.464 0.45 0.427 0.4299.88 8.03 7.90 7.35 7.36
logPP 0.2316.11
PP ·logS d 0.007 0.0026.72 0.39
PP ·logS f 0.008 0.0066.70 1.33
Standard error 0.073 0.081 0.080 0.080 0.080R 2 0.79 0.79 0.79 0.79 0.79R 2 adjusted 0.78 0.79 0.79 0.79 0.79
Notes: The dependent variable is log(total factor productivity ). S f is defined using bilateralimport weights. T-statistics in italics below coefficient estimates.
Table A4. Patent Protection: Alternative Specification(DOLS, within, fixed effects, 1971-2004, 24 countries)
logS d 0.066 0.098 0.062 0.061 0.032 0.064 0.0543.15 4.26 2.92 2.52 2.58 2.52 2.18
logS f 0.116 0.082 0.136 0.064 0.114 0.024 0.0275.11 3.78 4.94 3.11 6.65 0.94 1.03
logH 0.747 0.969 0.793 0.819 0.494 0.82 0.8099.88 12.52 9.99 9.93 8.30 10.06 10.06
logPP 0.203 0.2294.07 6.21
PP ·logS d 0.006 0.0073.72 4.37
Fr ·logS d -0.127 -0.132 -0.129 PP ·Fr ·logS d -0.037-7.37 -8.07 -8.08 -7.09
Sc ·logS d -0.055 -0.05 -0.038 PP ·Sc ·logS d -0.012-3.73 -3.39 -2.36 -2.04
Fr ·logS f -0.082 -0.064-1.91 -2.43
Sc ·logS f -0.056 -0.013-1.37 -0.51
Standard error 0.089 0.087 0.088 0.078 0.082 0.079 0.079R 2 0.78 0.78 0.78 0.83 0.81 0.82 0.82R 2 adjusted 0.77 0.78 0.78 0.82 0.81 0.82 0.82
Notes: The dependent variable is log(total factor productivity ). S f is defined using bilateral import weights. Fr and Sc are dummy variables for countries whose legal origins are French and Scandinavian, respectively, defined in Table 7. T-statistics in italics belowcoefficient estimates.
Table A5. Legal Origins and Patent Protection: Alternative Specification(DOLS, within, fixed effects, 1971-2004, 24 countries)
29
APPENDIX B: DATA SOURCES AND DEFINITIONS The database is similar to CH but updated to 2004 and expanded to include Korea and Iceland and estimates of human capital and a number of institutional variables. As noted in the text, data for Germany refer to West Germany from 1964–1990 and to unified Germany thereafter. Total factor productivity (F) in the business sector is defined as, F = Y / ( Kβ·L(1-β) ) , where Y is real value added in the business sector, K is capital stock, L is labor input (defined as business sector employment times average annual hours worked), β is the average labor share, and all variables are indices with 2000=1. All data are from the OECD’s analytical database or the OECD Economic Outlook database except for Israel where the data were provided by Ms. Soli Peleg of the Central Bureau of Statistics. For Belgium, Finland, France, Germany, Ireland, Italy, Japan, Netherlands, New Zealand, Portugal, Sweden, and the United States, the OECD only has capital stock estimates for the total economy; for the other countries, including Israel, the capital stock is for the business sector. For some countries missing data for business sector output or employment were filled in using the growth rate of the corresponding economy wide variable; missing data for the capital stock were filled in by assuming a constant scrapping rate and the perpetual inventory model; missing data for hours worked were filled in by assuming it remained constant at the last observation. Data for business sector R&D expenditure (R&D) for most countries are from the OECD Directorate of Science Technology, and Industry, published in Main Science and Technology Indicators. For Korea, R&D data are from the Ministry of Science and Technology. For Israel, R&D data are from the Central Bureau of Statistics supplemented by estimates from 1970/71 to 1985/86 from Ms. Soli Peleg of the CBS. Most countries do not have data for all years from 1970–2004, either because the data do not start until after 1970 or because there are gaps in the data, which were only collected every other year or even more sporadically. The OECD also publishes data on R&D expenditure for total industry (R&DI) in the STAN database, and for some countries these data are available for more years than the data for the business sector (R&D). For these countries the correlation between R&D and R&DI is very high (0.99 except for Australia where it is 0.72). The ratios of R&D/R&DI, which are relatively stable and close to 1, were interpolated and used to estimate missing values of R&D for those observations where only R&DI data were available. An analogous procedure was used for Austria, for which there are many more observations for total R&D expenditure than for R&D in the business sector.
30
Business sector R&D expenditure in constant 2000 dollars valued at purchasing power parities (R&DV) were obtained by dividing R&D by GDP deflators (2000=1) to convert from nominal to real,25 and by multiplying by the 2000 purchasing power parity exchange rate in U.S. dollars per local currency. Missing observations for R&DV were estimated using the predicted values from OLS regressions of logR&DV on logGDPBV and logIBV, where GDPBV is real value-added in the business sector and IBV is real non-residential private investment (for a few countries it was necessary to use aggregate GDP and total investment). If significant, a time trend (T) and T 2 were also included. The change in the predicted values from these regressions, which typically had R 2s of 0.95-0.99, were used to fill in the remaining missing observations for R&DV. R&D capital stocks in the business sector (Sd), defined as beginning of year, were calculated using the perpetual inventory procedure, Sd
t = (1-δ)Sdt-1 + R&DVt-1 ,
where the depreciation rate, δ, is assumed to be 0.05.26 The benchmarks are calculated as, Sd
1970 = R&DV1970/ (δ + g) , where g is the annual average logarithmic growth rate from 1970–1985, i.e., g = log(R&DV1985/R&DV1970) / 15. To take advantage of the availability of data on R&DV from the early 1960s for the G7 countries, the benchmarks for G7 countries are calculated for 1962, g is calculated from 1963–1985, and the capital stocks are calculated from 1963. For the other countries the benchmarks are calculated for 1970 and the capital stocks from 1971. A number of alternative measures of foreign R&D capital were defined for each of the 24 countries, each of which is based on the domestic R&D capital stocks of the countries’ 23 trade partners. Following CH, the bilateral-import-share-weighted foreign R&D capital stock for country i is defined as,
Sf-biwi = ∑ j≠ i wij Sd
j ,
where wij = Mij / ∑ j≠ i Mij , ∑ j≠ i wij = 1, and Mij is country i’s imports of goods and services from country j. Bilateral imports, which are on a c.i.f. basis, are from the IMF Direction of
25 The lack of consistent data for wages prevented deflating nominal R&D expenditure by an average of PGDP and an index of wages, as was done in Coe and Helpman (1995).
26 CH and other studies have found that empirical results are not sensitive to the assumed value for the depreciation rate.
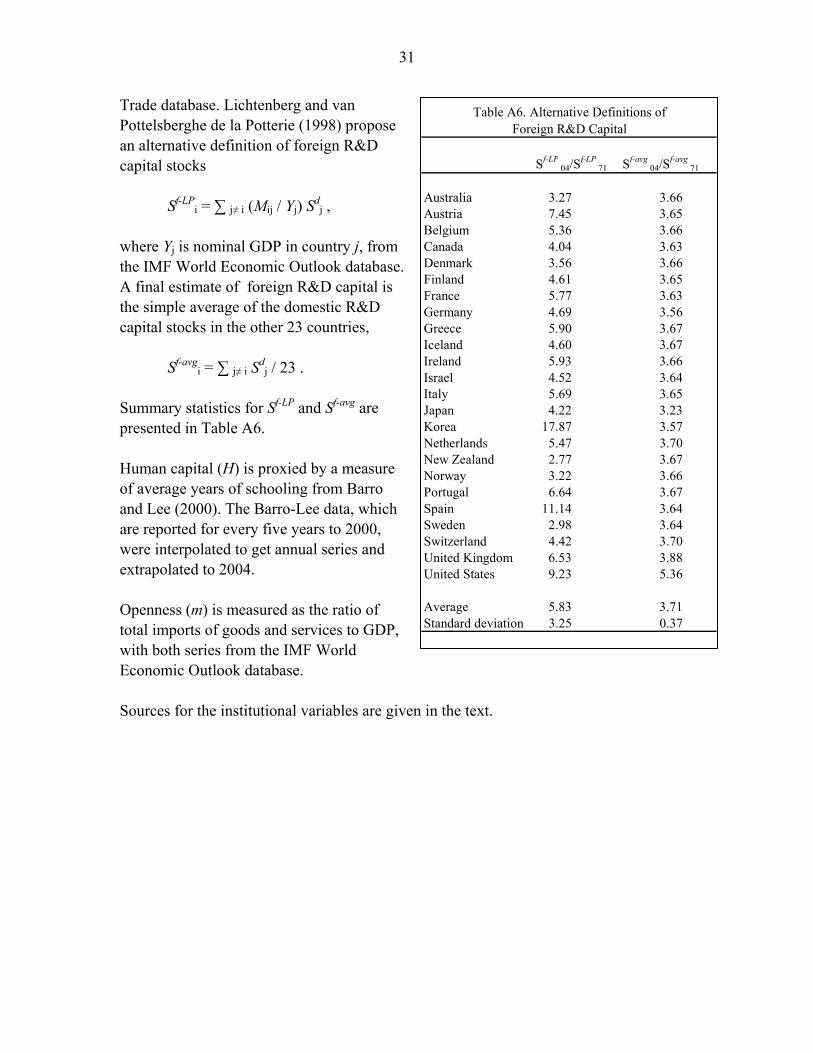
31
Trade database. Lichtenberg and van Pottelsberghe de la Potterie (1998) propose an alternative definition of foreign R&D capital stocks
Sf-LPi = ∑ j≠ i (Mij / Yj) Sd
j ,
where Yj is nominal GDP in country j, from the IMF World Economic Outlook database. A final estimate of foreign R&D capital is the simple average of the domestic R&D capital stocks in the other 23 countries,
Sf-avgi = ∑ j≠ i Sd
j / 23 . Summary statistics for Sf-LP and Sf-avg are presented in Table A6. Human capital (H) is proxied by a measure of average years of schooling from Barro and Lee (2000). The Barro-Lee data, which are reported for every five years to 2000, were interpolated to get annual series and extrapolated to 2004. Openness (m) is measured as the ratio of total imports of goods and services to GDP, with both series from the IMF World Economic Outlook database. Sources for the institutional variables are given in the text.
Sf-LP04/S
f-LP71 Sf-avg
04/Sf-avg
71
Australia 3.27 3.66 Austria 7.45 3.65 Belgium 5.36 3.66 Canada 4.04 3.63 Denmark 3.56 3.66 Finland 4.61 3.65 France 5.77 3.63 Germany 4.69 3.56 Greece 5.90 3.67 Iceland 4.60 3.67 Ireland 5.93 3.66 Israel 4.52 3.64 Italy 5.69 3.65 Japan 4.22 3.23 Korea 17.87 3.57 Netherlands 5.47 3.70 New Zealand 2.77 3.67 Norway 3.22 3.66 Portugal 6.64 3.67 Spain 11.14 3.64 Sweden 2.98 3.64 Switzerland 4.42 3.70 United Kingdom 6.53 3.88 United States 9.23 5.36
Average 5.83 3.71 Standard deviation 3.25 0.37
Table A6. Alternative Definitions of Foreign R&D Capital
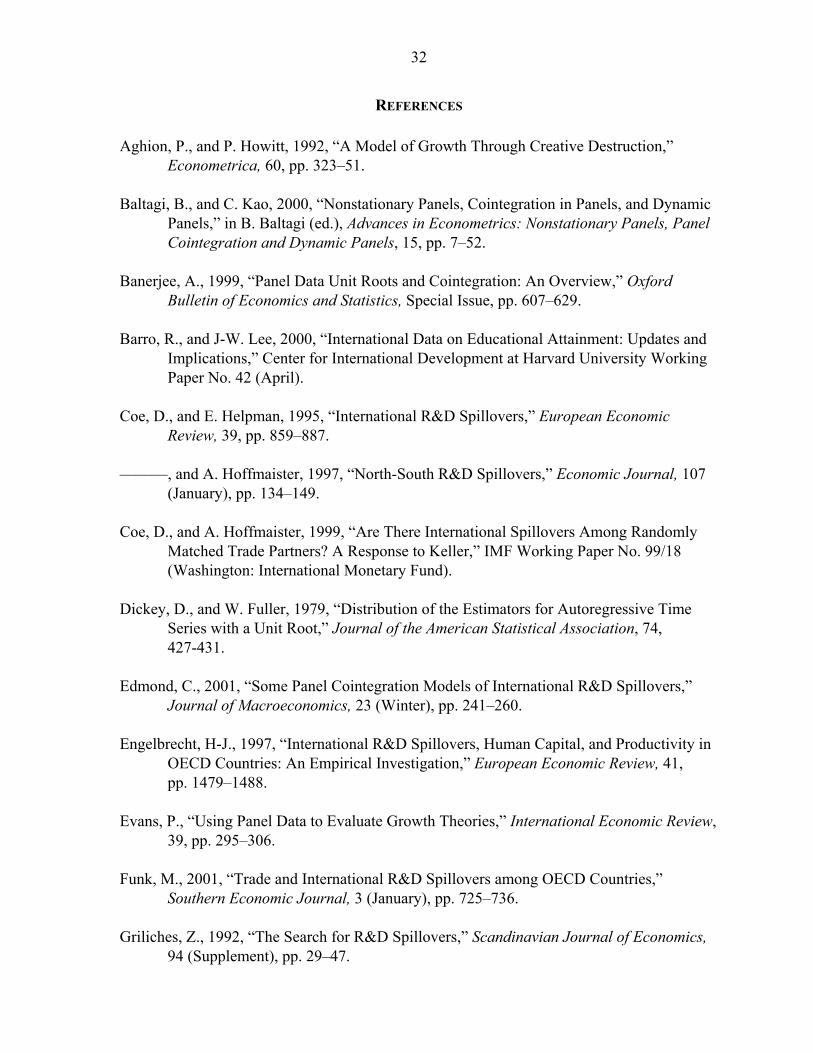
32
REFERENCES Aghion, P., and P. Howitt, 1992, “A Model of Growth Through Creative Destruction,”
Econometrica, 60, pp. 323–51. Baltagi, B., and C. Kao, 2000, “Nonstationary Panels, Cointegration in Panels, and Dynamic
Panels,” in B. Baltagi (ed.), Advances in Econometrics: Nonstationary Panels, Panel Cointegration and Dynamic Panels, 15, pp. 7–52.
Banerjee, A., 1999, “Panel Data Unit Roots and Cointegration: An Overview,” Oxford
Bulletin of Economics and Statistics, Special Issue, pp. 607–629. Barro, R., and J-W. Lee, 2000, “International Data on Educational Attainment: Updates and
Implications,” Center for International Development at Harvard University Working Paper No. 42 (April).
Coe, D., and E. Helpman, 1995, “International R&D Spillovers,” European Economic
Review, 39, pp. 859–887. ———, and A. Hoffmaister, 1997, “North-South R&D Spillovers,” Economic Journal, 107
(January), pp. 134–149. Coe, D., and A. Hoffmaister, 1999, “Are There International Spillovers Among Randomly
Matched Trade Partners? A Response to Keller,” IMF Working Paper No. 99/18 (Washington: International Monetary Fund).
Dickey, D., and W. Fuller, 1979, “Distribution of the Estimators for Autoregressive Time
Series with a Unit Root,” Journal of the American Statistical Association, 74, 427-431.
Edmond, C., 2001, “Some Panel Cointegration Models of International R&D Spillovers,”
Journal of Macroeconomics, 23 (Winter), pp. 241–260. Engelbrecht, H-J., 1997, “International R&D Spillovers, Human Capital, and Productivity in
OECD Countries: An Empirical Investigation,” European Economic Review, 41, pp. 1479–1488.
Evans, P., “Using Panel Data to Evaluate Growth Theories,” International Economic Review,
39, pp. 295–306. Funk, M., 2001, “Trade and International R&D Spillovers among OECD Countries,”
Southern Economic Journal, 3 (January), pp. 725–736. Griliches, Z., 1992, “The Search for R&D Spillovers,” Scandinavian Journal of Economics,
94 (Supplement), pp. 29–47.
33
Groen J., and F. Kleibergen, 2003, “Liklihood-Based Cointegration Analysis in Panels of Vector Error Correction Models,” Journal of Business and Economic Statistics, 21, pp. 295–318.
Grossman, G., and E. Helpman, 1994, “Endogenous Innovation in the Theory of Growth,”
Journal of Economic Perspectives, 8, pp. 23–44. ———, 1991, Innovation and Growth in the Global Economy, MIT Press (Cambridge, MA). Guellec, D., and B. van Pottelsberghe de la Potterie, 2004, “From R&D to Productivity
Growth: Do the Institutional Settings and the Source of Funds of R&D Matter?” Oxford Bulletin of Economics and Statistics, 66, pp. 353–378.
Ha, J., and P. Howitt, 2007, “Accounting for Trends in Productivity and R&D: A
Schumpeterian Critique of Semi-Endogenous Growth Theory,” Journal of Money, Credit and Banking, 39 (June), pp. 733–774.
Harris, R., and R. Sollis, 2003, Applied Time Series Modelling and Forecasting (Wiley
Press). Helpman, E., 2004, The Mystery of Economic Growth (Cambridge, MA: Balknap for
Harvard University Press). ———, 1997, “R&D and Productivity: The International Connection,” NBER Working
Paper 6101 (July). Im, K., H. Pesaran, and Y. Shin, 2003, “Testing for unit roots in heterogeneous panels,”
Journal of Econometrics, 115, pp. 53–74. Kao, C., M-H. Chiang, and B. Chen, 1999, “International R&D Spillovers: An Application of
Estimation and Inference in Panel Cointegration,” Oxford Bulletin of Economics and Statistics, Special Issue, pp. 691–709.
Kao, C., and M-H. Chiang, 2000, “On the Estimation and Inference of a Cointegrated
Regression in Panel Data, in B. Baltagi (ed.), Advances in Econometrics: Nonstationary Panels, Panel Cointegration and Dynamic Panels, 15, pp.179–222.
Keller, W., 2004, “International Technology Diffusion,” Journal of Economic Literature,
September, pp. 752–782. ———, 1998, “Are International R&D Spillovers Trade-Related? Analyzing Spillovers
Among Randomly Matched Trade Partners,” European Economic Review, 42, pp. 1469–1481.
34
Khan, M., and K. Luintel, 2006, “Sources of Knowledge and Productivity: How Robust is the Relationship?” OECD DSTI Working Paper No. DSTI/DOC(2006)6.
La Porta, R., F. Lopez-de-Silanes, A. Shleifer, and R. Vishny, 1999, “The Quality of
Government,” The Journal of Law, Economics, & Organization, 15, pp. 222–279. La Porta, R., F. Lopez-de-Silanes, and A. Shleifer, 2008 (forthcoming), “The Economic
Consequences of Legal Origins,” Journal of Economic Literature. Lee, G., 2006, “The Effectiveness of International Knowledge Spillover Channels,”
European Economic Review, 50, pp. 2075–2088. Levin, A., C. Lin, and C. Chu, 2002, “Unit root tests in panel data: Asymptotic and finite-
sample properties,” Journal of Econometrics, 108, pp. 1–24. Lichtenberg, F., and B. van Pottelsberghe de la Potterie, 1998, “International R&D
Spillovers: A Comment,” European Economic Review, 42, pp. 1483–1491. Luintel, K., and M. Khan, 2004, “Are International R&D Spillovers Costly for the United
States?” The Review of Economics and Statistics, 86 (November), pp. 896–910. Lumenga-Neso, O., M. Olarreaga, and M. Schiff, “On ‘Indirect’ Trade-Related R&D
Spillovers,” European Economic Review, 49, pp. 1785–1798. Oliveira Martins, J., R. Boarini, H. Strauss, C. de la Maisonneuve, and C. Saadi, 2007, “The
Policy Determinants of Investment in Tertiary Education,” OECD Economics Working Paper (May).
Park, W., 1995, “International R&D Spillovers and OECD Economic Growth,” Economic
Inquiry, 33 (October), pp. 571–591. ———, and D. Lippoldt, 2005, “International Licensing and the Strengthening of Intellectual
Property Rights in Developing Countries During the 1990s,” OECD Economic Studies, No. 40, pp. 7–48.
Pedroni, P., 2004, “Panel Cointegration: Asymptotic and Finite Sample Properties of Pooled
Time Series Tetsts, with an Application to the PPP Hypothesis,” Econometric Theory, 20, pp. 597–625.
———, 2001, “Purchasing Power Parity Tests in Cointegrated Panels,” The Review of
Economics and Statistics, 83, pp. 727–731. ———, 2000, “Fully Modified OLS for Heterogeneous Cointegrated Panels,” in B. Baltagi
(ed.), Advances in Econometrics: Nonstationary Panels, Panel Cointegration and Dynamic Panels, 15.
35
———, 1999, “Critical Values for Cointegration Tests in Heterogeneous Panels with Multiple Regressors, Oxford Bulletin of Economics and Statistics, Special Issue, pp. 653–670.
———, 1995, “Panel Cointegration: Asymptotic and Finite Sample Properties fo Pooled
Time Series Tetsts, with an Application to the PPP Hypothesis,” Indiana University Working Papers in Economics, 95–103.
———, and J-P. Urbain, 2008 (forthcoming), The Econometrics of Nonstationary Panels,
Oxford University Press. Phillips, P., and H. Moon, 2000, “Nonstationary Panel Analysis: An Overview of Some
Recent Developments, Econometric Reviews, 19, pp. 262–286. Phillips, P., and S. Ouliais, 1990, “Asymptotic Properties of Residual Based Test for
Cointegration,” Econometrica, 58, pp. 165–193. Phillips, P., and P. Perron, 1988, “ Testing for a Unit Root in Time Series Regressions,”
Biometrika, 75, pp. 335–345. Romer, P., 1990, “Endogenous Technological Change,” Journal of Political Economy, 98,
pp. S71–S102. Stock, J., 1987, “Asymptotic Properties of Least Squares Estimators of Cointegrating
Vectors, Econometrica, 5 (September), pp. 1035–1056. ———, and M. Watson, 1993. “A Simple Estimator of Cointegrating Vectors in Higher
Order Integrated Systems,” Econometrica, 61, pp. 783–820. van Pottelsberghe de la Potterie, B., and F. Lichtenberg, 2001, “Does Foreign Direct
Investment Transfer Technology Across Borders?” The Review of Economics and Statistics, 83 (August), pp. 490–497.
World Bank, 2007, Doing Business 2008. Zhu, L., and B. Jeon, 2007, “International R&D Spillovers: Trade, FDI, and Information
Technology as Spillover Channels,” Review of International Economics, 15 (5), pp. 955–976.