Embed Size (px)
Citation preview
International Public
Transport Benchmarking:
Learning from others
Ben Condry, Senior Research Associate
RTSC, Imperial College London
University of Sydney, 10th December 2013
CoMET Community of Metros

Key elements of the presentation
Introduction to the RTSC at Imperial College
History of the benchmarking groups and who
participates
Why operators participate
How the process works and examples
Benefits
Example Key Performance Indicators
Conclusions – why the benchmarking
process has become so useful
2
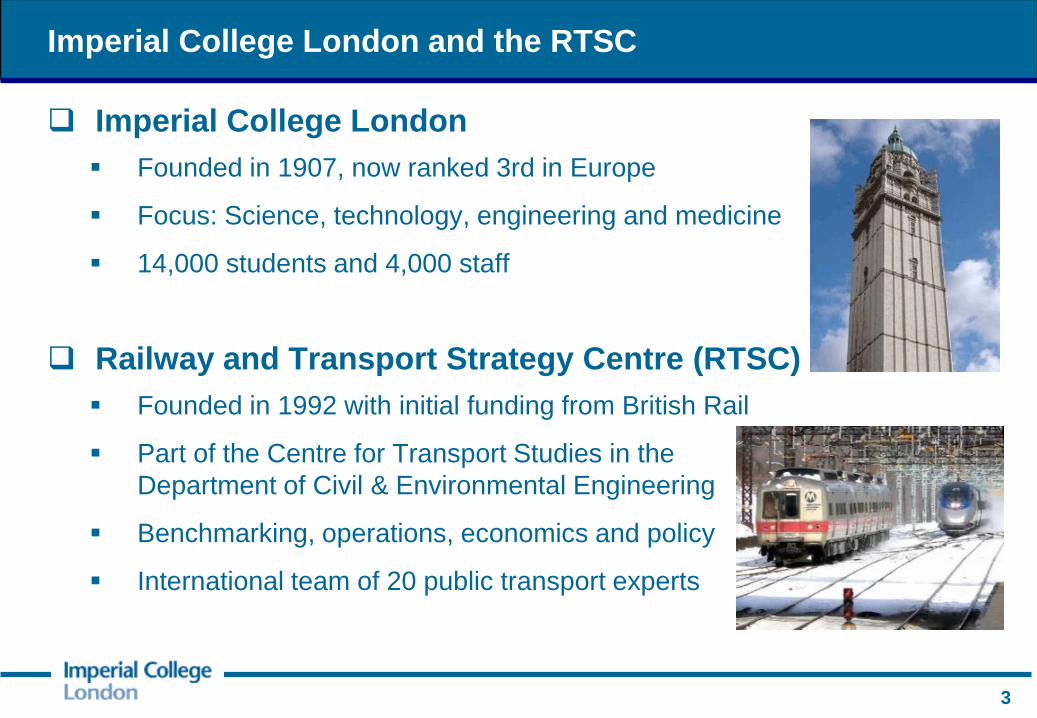
Imperial College London and the RTSC
Imperial College London
Founded in 1907, now ranked 3rd in Europe
Focus: Science, technology, engineering and medicine
14,000 students and 4,000 staff
Railway and Transport Strategy Centre (RTSC)
Founded in 1992 with initial funding from British Rail
Part of the Centre for Transport Studies in the
Department of Civil & Environmental Engineering
Benchmarking, operations, economics and policy
International team of 20 public transport experts
3
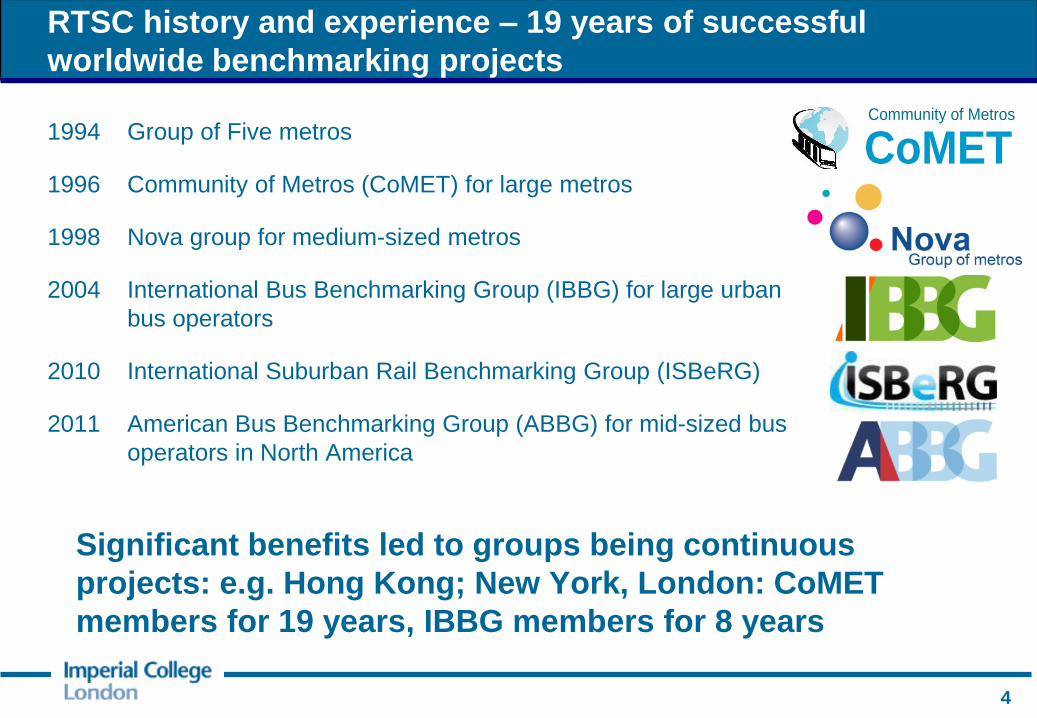
1994 Group of Five metros
1996 Community of Metros (CoMET) for large metros
1998 Nova group for medium-sized metros
2004 International Bus Benchmarking Group (IBBG) for large urban
bus operators
2010 International Suburban Rail Benchmarking Group (ISBeRG)
2011 American Bus Benchmarking Group (ABBG) for mid-sized bus
operators in North America
RTSC history and experience – 19 years of successful
worldwide benchmarking projects
Significant benefits led to groups being continuous
projects: e.g. Hong Kong; New York, London: CoMET
members for 19 years, IBBG members for 8 years
4
CoMET Community of Metros
New York
Montreal
Singapore
Paris
Lisbon
Brussels
Sydney
Trains
Barcelona
London
Underground
Mexico City
Moscow
Shanghai
Hong Kong
Santiago
Naples
Bangkok
Buenos Aires
Delhi
Taipei
Newcastle
Rio de Janeiro Sao Paulo
Madrid
Beijing
Berlin
CoMET metros Nova metros
Guangzhou
Toronto Istanbul
Nanjing
Kuala Lumpur
London DLR
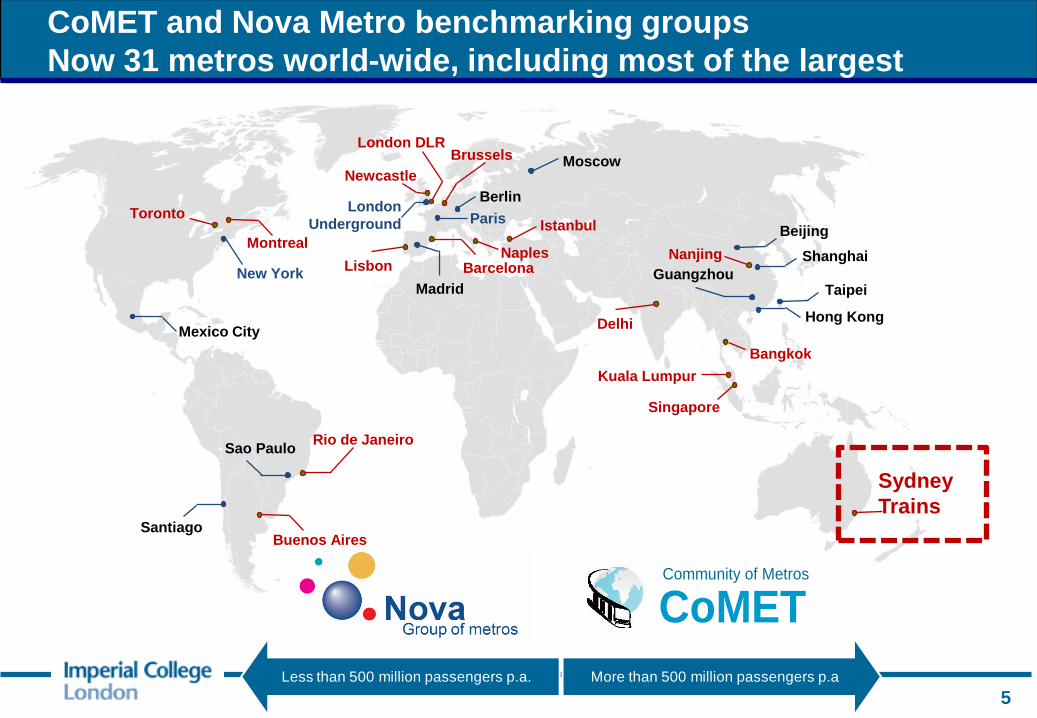
CoMET and Nova Metro benchmarking groups
Now 31 metros world-wide, including most of the largest
Less than 500 million passengers p.a. More than 500 million passengers p.a
CoMET Community of Metros
5
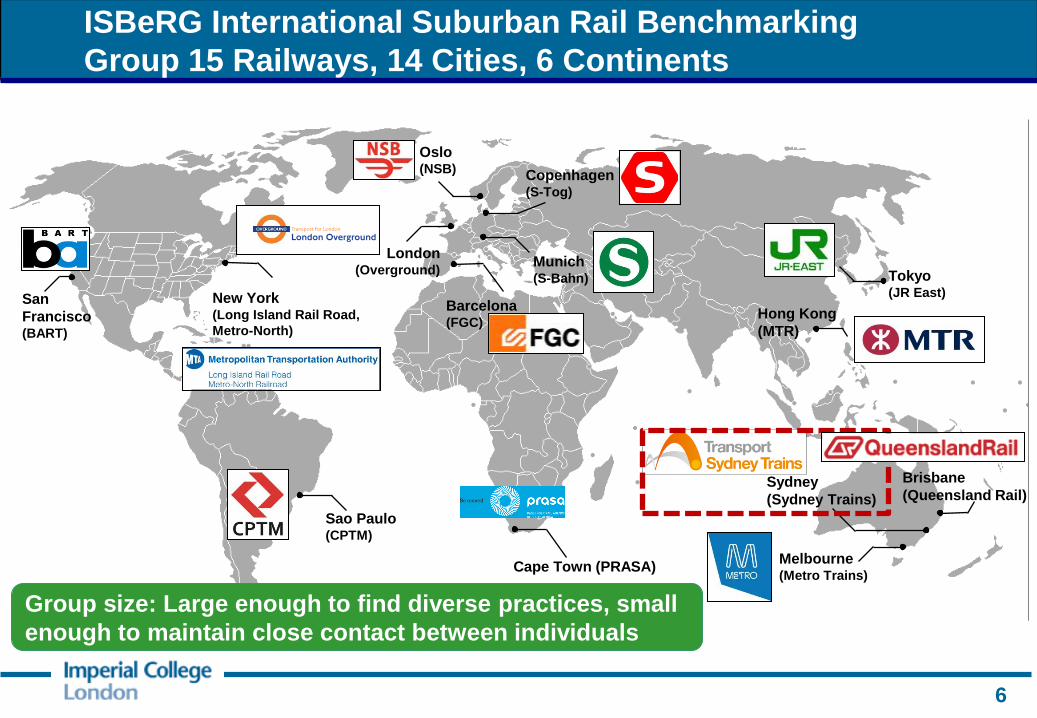
New York (Long Island Rail Road,
Metro-North)
San
Francisco (BART)
Sao Paulo (CPTM)
Melbourne (Metro Trains)
Tokyo (JR East)
Munich (S-Bahn)
Copenhagen (S-Tog)
Oslo (NSB)
London (Overground)
Sydney
(Sydney Trains)
Barcelona (FGC)
ISBeRG International Suburban Rail Benchmarking
Group 15 Railways, 14 Cities, 6 Continents
6
Brisbane
(Queensland Rail)
Hong Kong
(MTR)
Group size: Large enough to find diverse practices, small
enough to maintain close contact between individuals
Cape Town (PRASA)

New York (2)
Vancouver Montreal
Singapore
Paris
Lisbon
Brussels Dublin
Barcelona
London Seattle Istanbul
International Bus Benchmarking Group
12 Member Cities, 13 Operators
7

American Bus Benchmarking Group: 17 Members Across the
US in a Wide Range of Urban and Suburban Environments
C-Tran
(Vancouver)
Lane Transit
(Eugene)
San Joaquin RTD
(Stockton)
The T
(Fort Worth)
RTA
(Dayton)
RGRTA
(Rochester)
RIPTA
(Rhode Island)
DART
(Des Moines)
Capital Metro
(Austin)
PSTA
(St. Petersburg)
UTA
(Salt Lake City)
Omnitrans
(San Bernardino)
GCRTA
(Cleveland)
Spokane Transit
(Spokane)
LYNX
(Orlando)
NFTA
(Buffalo)
Pace
(Chicago)
8
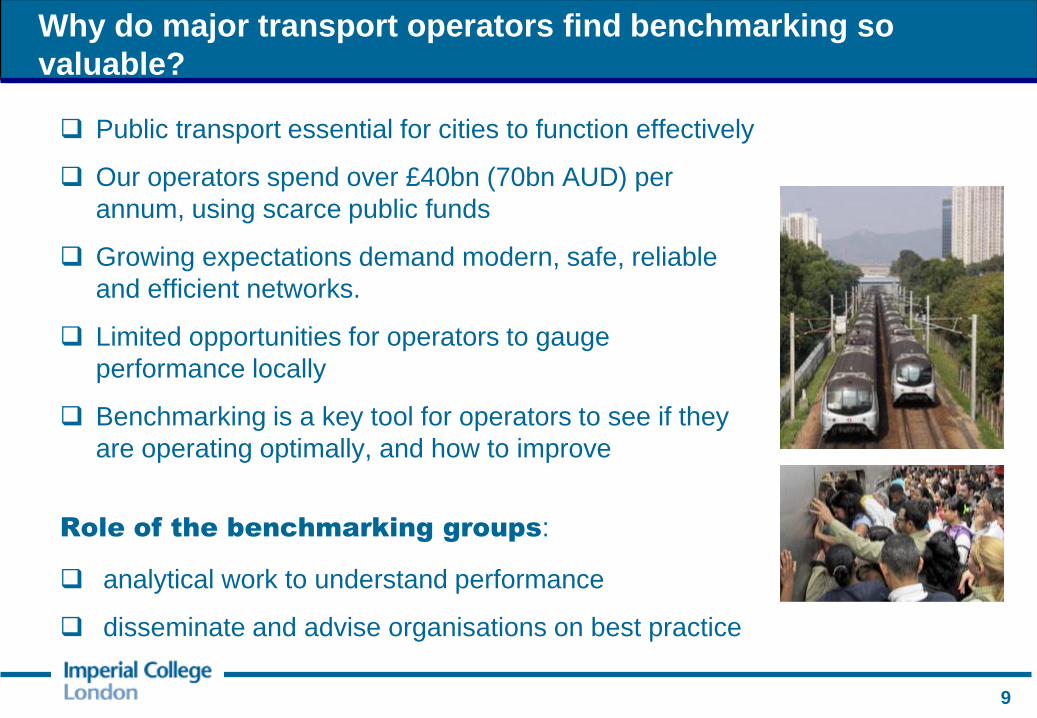
Why do major transport operators find benchmarking so
valuable?
Public transport essential for cities to function effectively
Our operators spend over £40bn (70bn AUD) per
annum, using scarce public funds
Growing expectations demand modern, safe, reliable
and efficient networks.
Limited opportunities for operators to gauge
performance locally
Benchmarking is a key tool for operators to see if they
are operating optimally, and how to improve
Role of the benchmarking groups:
analytical work to understand performance
disseminate and advise organisations on best practice
9

Many common strategic and technical challenges -
Benchmarking has become essential to help address these
Technology can help
address many
challenges:
benchmarking helps
share experience
Top Strategic Challenges for Metros
10

For members, the benchmarking groups are central to
proactive, effective continuous improvement
“The Search for Best Practices that
Lead to Superior Performance”
Set challenging but
achievable
performance targets
Why do others do
things differently?
Can we lean from
them?
Informed
dialogue with
stakeholders
Best practice
transfer and
implementation
Identify high
priority issues
and areas for
improvement
11
What has
worked (or not)
elsewhere?
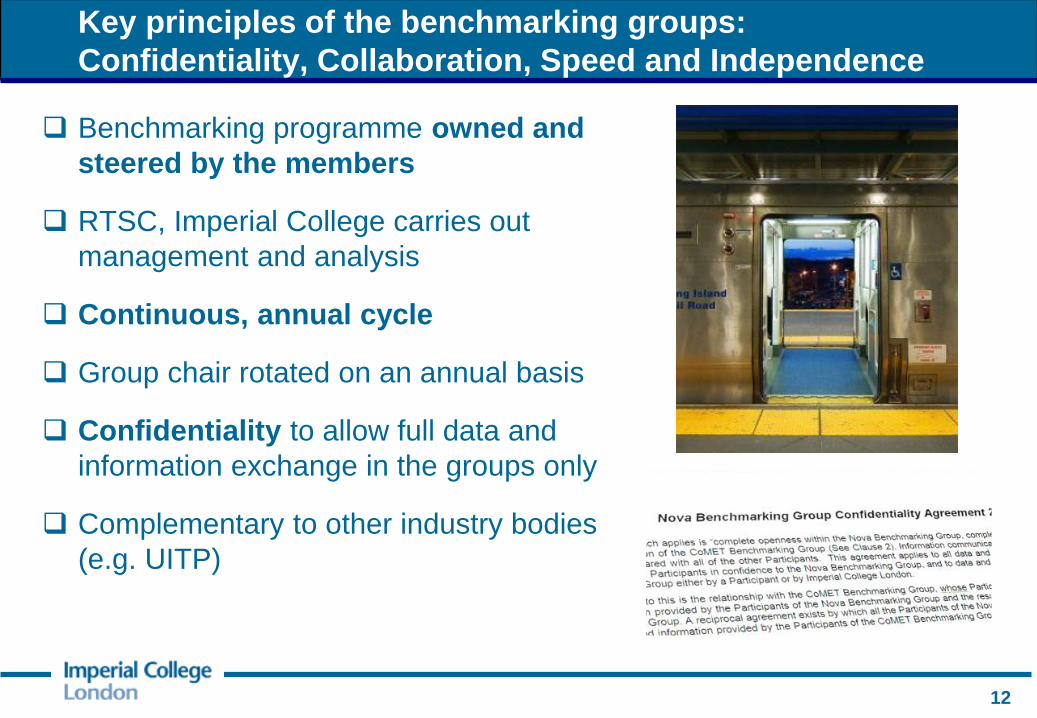
Key principles of the benchmarking groups:
Confidentiality, Collaboration, Speed and Independence
Benchmarking programme owned and
steered by the members
RTSC, Imperial College carries out
management and analysis
Continuous, annual cycle
Group chair rotated on an annual basis
Confidentiality to allow full data and
information exchange in the groups only
Complementary to other industry bodies
(e.g. UITP)
12

Key Performance Indicator system
- to compare performance and show
where to look for best practices
Drill-Down Studies - In-depth
research on topics of common
interest, to identify best practices,
often with Expert Workshops
Website with Online Forum –
Transport peers consult with each
other, providing quick answers
Two Meetings per Year - typically
attended by senior directors
The benchmarking process: a continuous annual cycle
Rolling Stock Reliability
Customer Information
Dwell Time Management
0
10
20
30
40
50
60
70
80
13
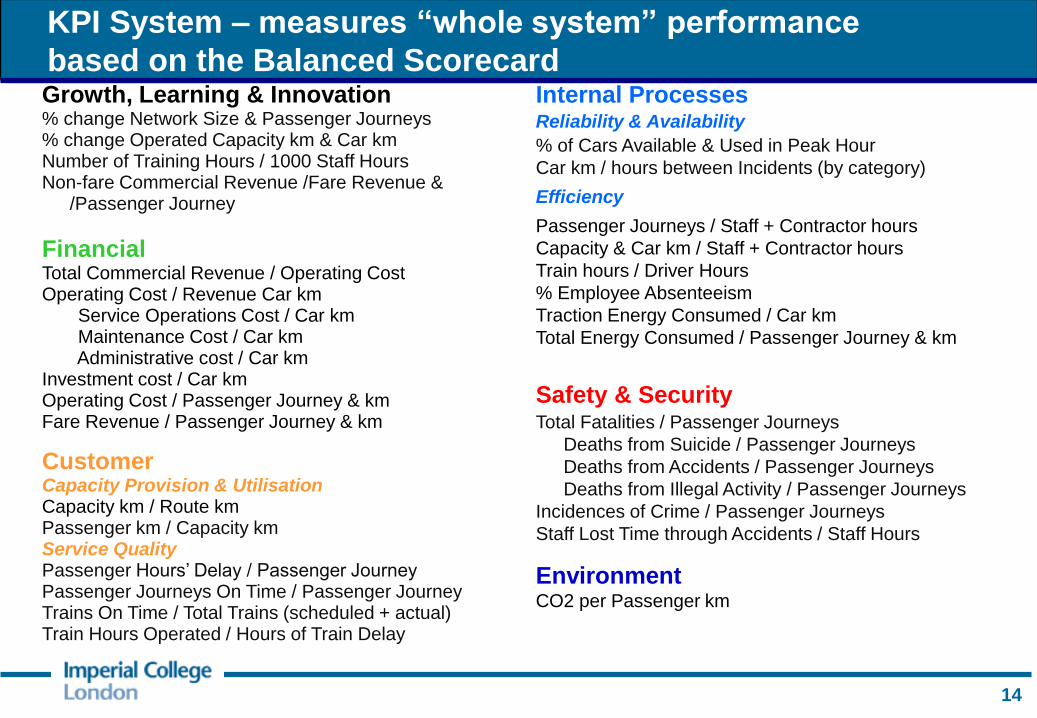
KPI System – measures “whole system” performance
based on the Balanced Scorecard Growth, Learning & Innovation % change Network Size & Passenger Journeys % change Operated Capacity km & Car km Number of Training Hours / 1000 Staff Hours Non-fare Commercial Revenue /Fare Revenue &
/Passenger Journey
Financial Total Commercial Revenue / Operating Cost Operating Cost / Revenue Car km Service Operations Cost / Car km Maintenance Cost / Car km Administrative cost / Car km Investment cost / Car km Operating Cost / Passenger Journey & km Fare Revenue / Passenger Journey & km
Customer Capacity Provision & Utilisation Capacity km / Route km Passenger km / Capacity km Service Quality Passenger Hours’ Delay / Passenger Journey Passenger Journeys On Time / Passenger Journey Trains On Time / Total Trains (scheduled + actual) Train Hours Operated / Hours of Train Delay
Internal Processes Reliability & Availability
% of Cars Available & Used in Peak Hour
Car km / hours between Incidents (by category)
Efficiency
Passenger Journeys / Staff + Contractor hours
Capacity & Car km / Staff + Contractor hours
Train hours / Driver Hours
% Employee Absenteeism
Traction Energy Consumed / Car km
Total Energy Consumed / Passenger Journey & km
Safety & Security Total Fatalities / Passenger Journeys
Deaths from Suicide / Passenger Journeys
Deaths from Accidents / Passenger Journeys
Deaths from Illegal Activity / Passenger Journeys
Incidences of Crime / Passenger Journeys
Staff Lost Time through Accidents / Staff Hours
Environment CO2 per Passenger km
14
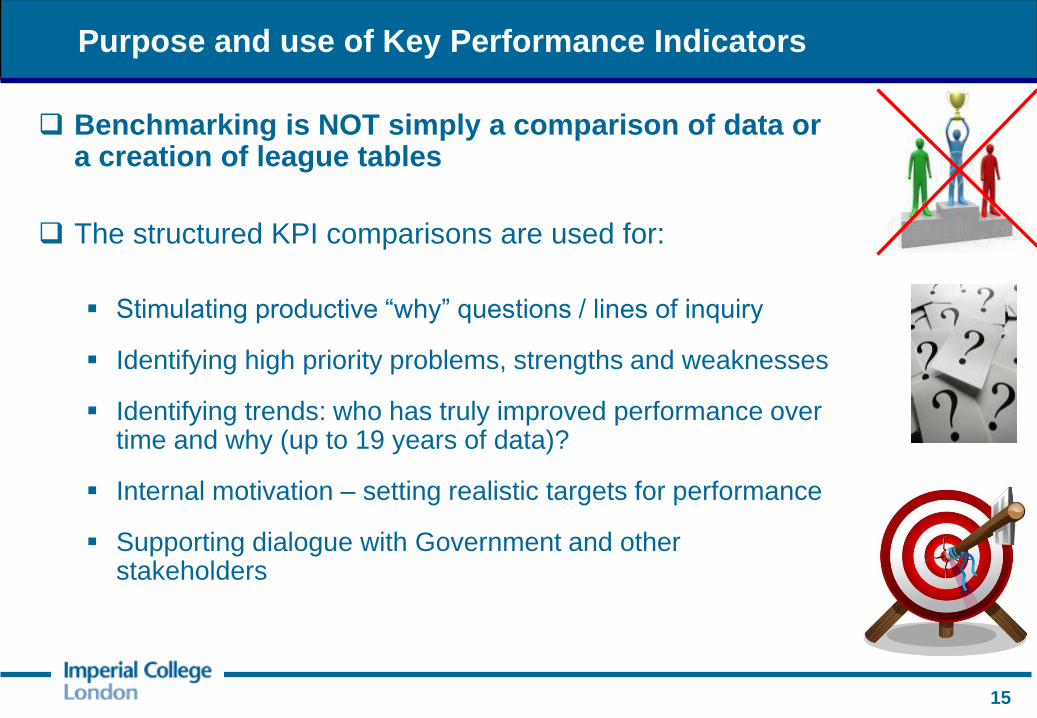
Purpose and use of Key Performance Indicators
Benchmarking is NOT simply a comparison of data or a creation of league tables
The structured KPI comparisons are used for:
Stimulating productive “why” questions / lines of inquiry
Identifying high priority problems, strengths and weaknesses
Identifying trends: who has truly improved performance over time and why (up to 19 years of data)?
Internal motivation – setting realistic targets for performance
Supporting dialogue with Government and other stakeholders
15
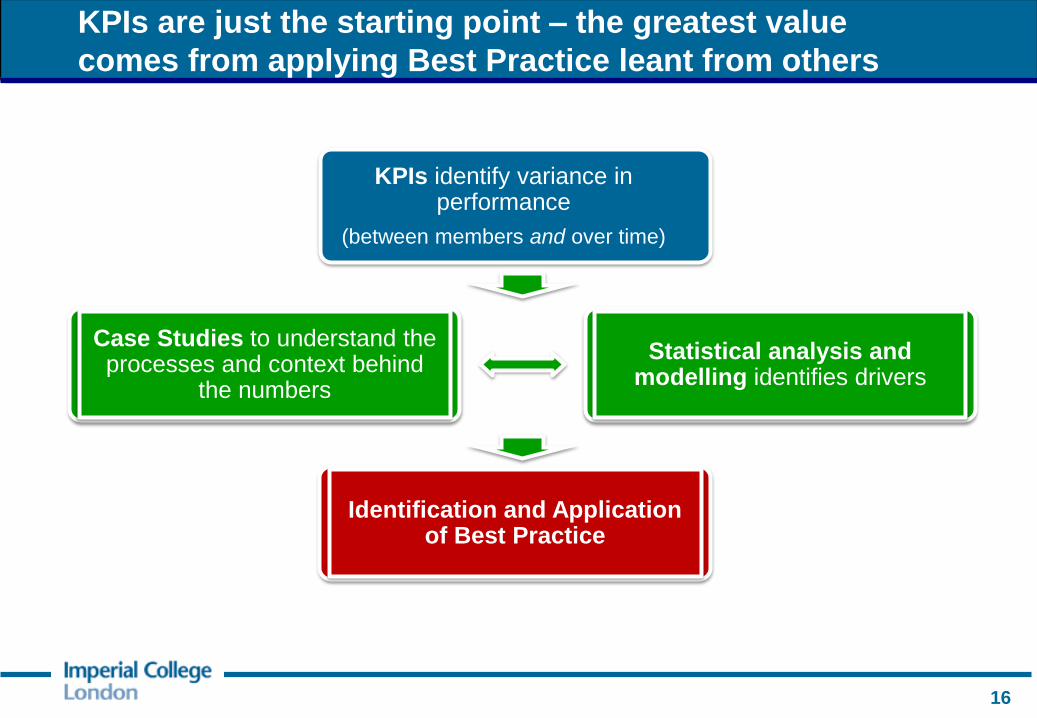
KPIs identify variance in performance
(between members and over time)
Identification and Application of Best Practice
Case Studies to understand the processes and context behind
the numbers
Statistical analysis and modelling identifies drivers
16
KPIs are just the starting point – the greatest value
comes from applying Best Practice leant from others
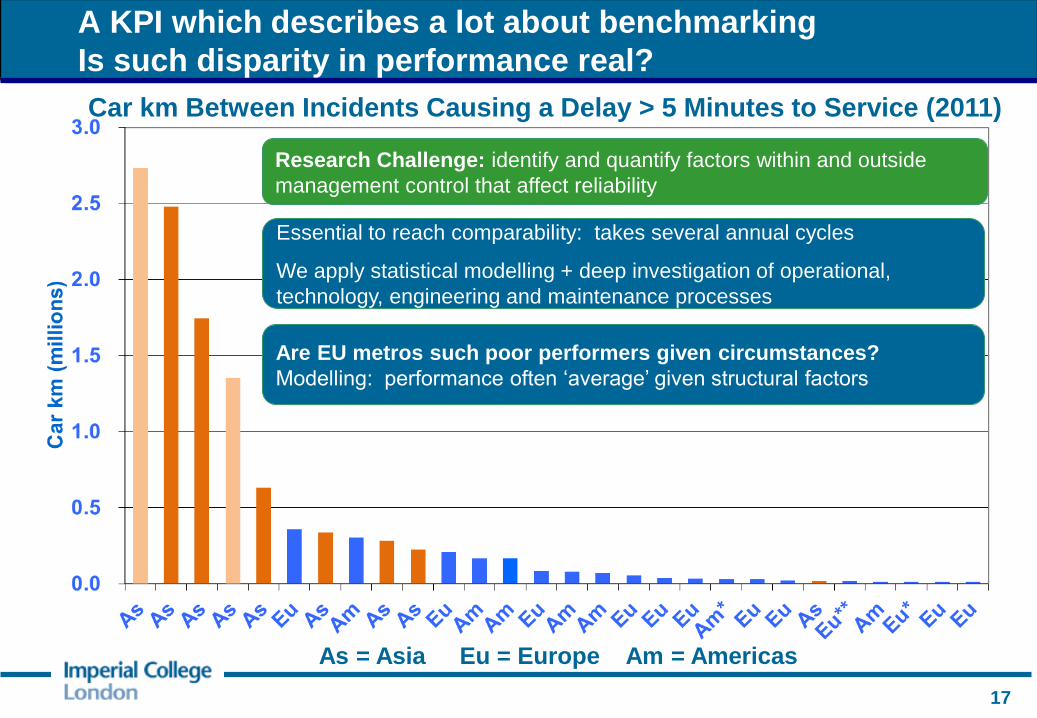
A KPI which describes a lot about benchmarking
Is such disparity in performance real?
Research Challenge: identify and quantify factors within and outside
management control that affect reliability
Car km Between Incidents Causing a Delay > 5 Minutes to Service (2011)
As = Asia Eu = Europe Am = Americas
Essential to reach comparability: takes several annual cycles
We apply statistical modelling + deep investigation of operational,
technology, engineering and maintenance processes
Are EU metros such poor performers given circumstances?
Modelling: performance often ‘average’ given structural factors
17
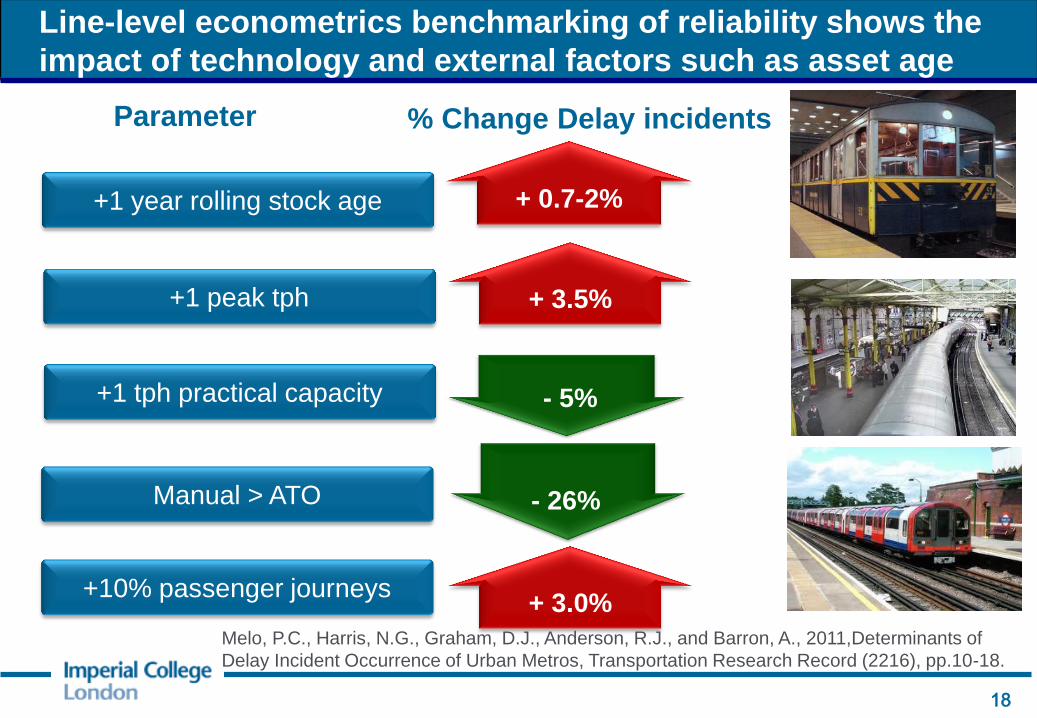
Line-level econometrics benchmarking of reliability shows the
impact of technology and external factors such as asset age
18
+ 0.7-2% +1 year rolling stock age
+ 3.5% +1 peak tph
+1 tph practical capacity - 5%
Manual > ATO - 26%
Parameter % Change Delay incidents
+10% passenger journeys + 3.0%
Melo, P.C., Harris, N.G., Graham, D.J., Anderson, R.J., and Barron, A., 2011,Determinants of
Delay Incident Occurrence of Urban Metros, Transportation Research Record (2216), pp.10-18.

Almost 500 topics now covered
in studies; examples include
•Fares, Funding and Financing
•Non-Fare Revenue
Drill-Down studies conducted annually
by each group
Members select topics of mutual
interest
Reflect key topical issues, and questions
raised by KPIs
Members provide data and
Questionnaires and expert interviews
Imperial College analyses and reports
findings and recommendations
Expert “workshops” to share
experiences directly
19
The numerical benchmarking has to be combined with
“Best Practice Benchmarking” – Drill-Down Studies
•Rolling Stock Reliability
•Asset Renewal Decision Making
Engineering
•Customer Satisfaction
•Passenger Information
Customers
Financial
•Investing in Punctuality
•Driver Productivity
Operations

Benchmarking Benefits:
Improved decision-making by learning from the experience of others
Asian Metro: driver productivity study: 10% saved through
shift reorganization
American Metro: Review of station cleaning processes
following study: 10% productivity gain
South American Metro: $1mp.a. saved on turnstile
maintenance as a result of a Forum question.
American Metro: justified move from 2 car-pairs to through
gangways: several million £, improving capacity by 10%
HK MTR: best practice in policy used to successfully argue
for fare adjustment mechanism
ISBeRG Railway used fleet age information to help make
the case for funding of replacement cars
20
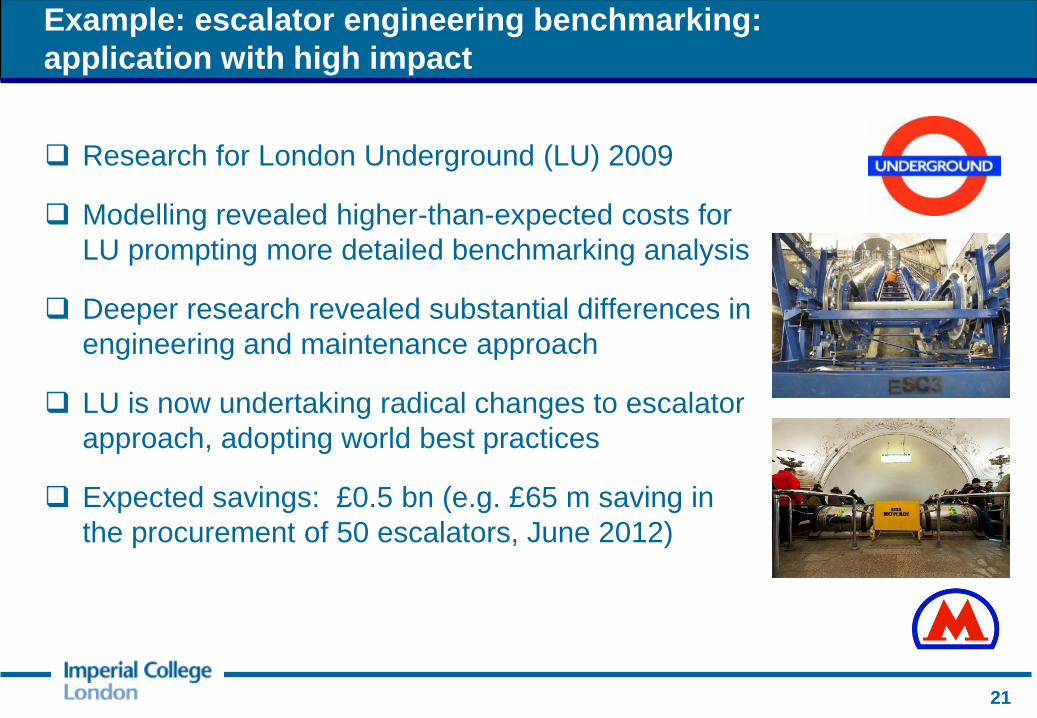
Example: escalator engineering benchmarking:
application with high impact
Research for London Underground (LU) 2009
Modelling revealed higher-than-expected costs for
LU prompting more detailed benchmarking analysis
Deeper research revealed substantial differences in
engineering and maintenance approach
LU is now undertaking radical changes to escalator
approach, adopting world best practices
Expected savings: £0.5 bn (e.g. £65 m saving in
the procurement of 50 escalators, June 2012)
21
Some Benchmarking Examples -
Helping with Key Challenges
22
CoMET Community of Metros

0 . 0
0 . 5
1 . 0
1 . 5
2 . 0
2 . 5
3 . 0
0
100
200
300
400
500
600
Billi
on
Passen
ger
Jo
urn
eys
Netw
ork
Len
gth
(km
)
Network Length (km) Passenger Journeys
Railways/metros have returns to density and not scale
(so we can compare organisations of different sizes)
Network Size and Passenger Journeys p.a. (2011)
CoMET Metros
23
Nova Metros
Nova & CoMET: Part of
the same community
and contribute to each
others’ studies
Compared to metros,
Sydney Trains’ network is
very large
Based on publically available data
0
100
200
300
400
500
600
700
800
Tk SP HK Sy Mb Mu CT LO SF Ch LI MN Bc Br Os
Ro
ute
km
, N
um
be
r o
f S
tati
on
s, M
illio
n P
as
se
ng
ers
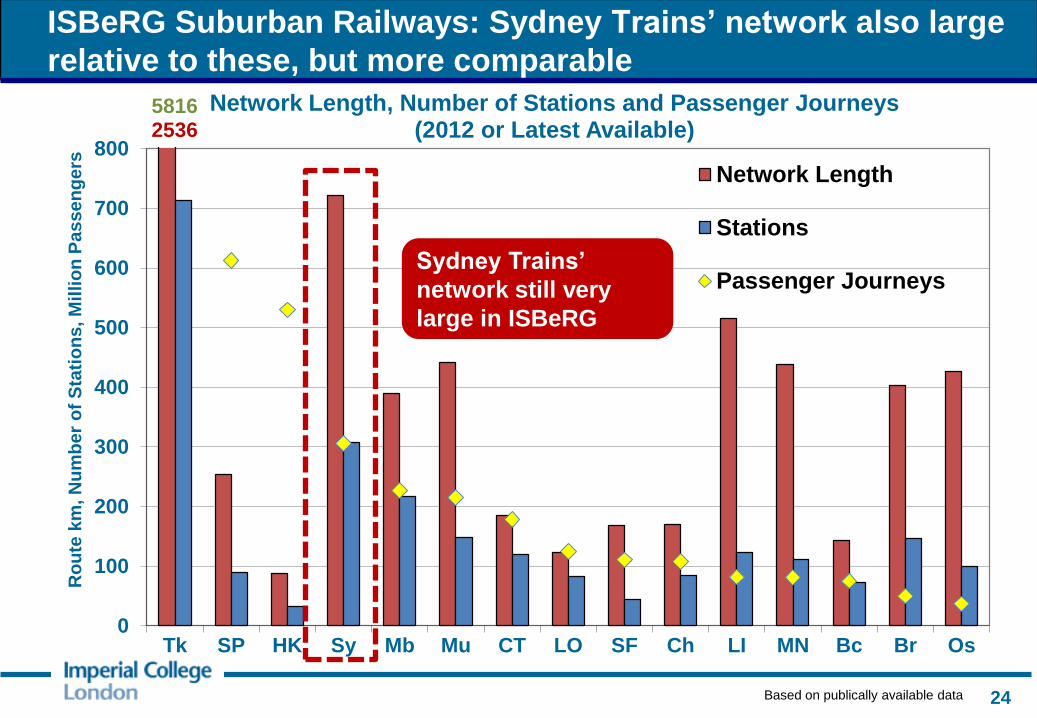
Network Length, Number of Stations and Passenger Journeys (2012 or Latest Available)
Network Length
Stations
Passenger Journeys
58162536
ISBeRG Suburban Railways: Sydney Trains’ network also large
relative to these, but more comparable
24
Sydney Trains’
network still very
large in ISBeRG
Based on publically available data

0
2
4
6
8
10
12
14
16
Passen
ger
Jo
urn
eys p
er
Netw
ork
Len
gth
km
A key structural factor and financial constraint for Australian
Railways: low average passenger density
25
Compared to metros, Sydney is
very low density
(more comparable with Suburban
Rail – see next page)
Based on publically available data
0.0
0.5
1.0
1.5
2.0
2.5
3.0
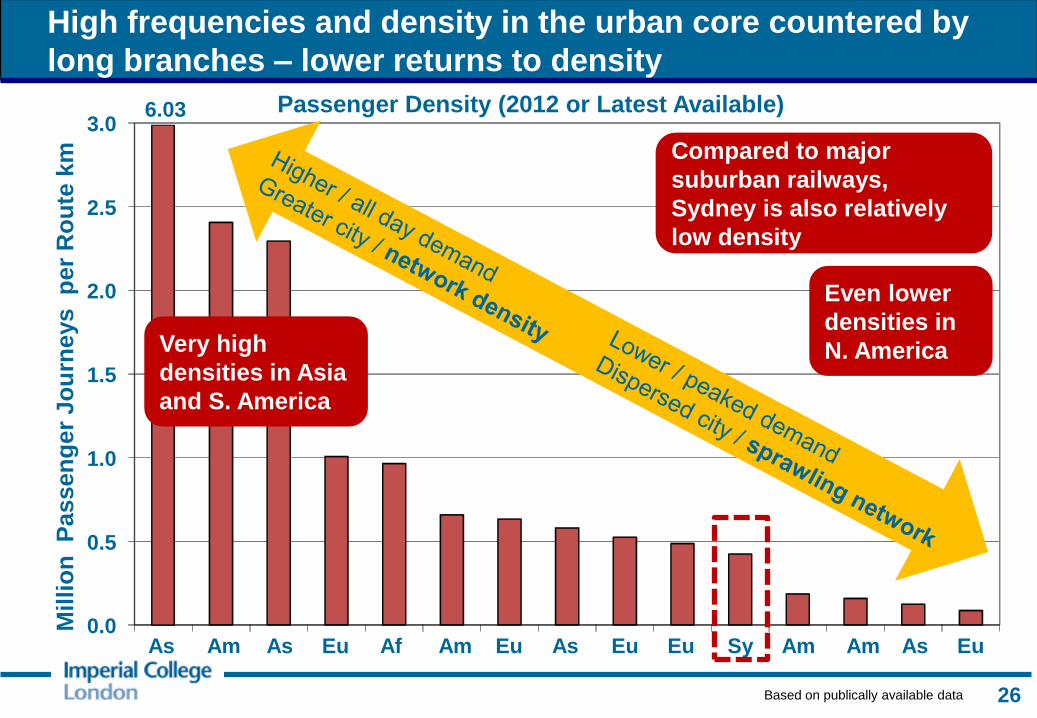
As Am As Eu Af Am Eu As Eu Eu Sy Am Am As Eu
Mil
lio
n P
assen
ger
Jo
urn
eys
per
Ro
ute
km
Passenger Density (2012 or Latest Available) 6.03
High frequencies and density in the urban core countered by
long branches – lower returns to density
26
Compared to major
suburban railways,
Sydney is also relatively
low density
Based on publically available data
Very high
densities in Asia
and S. America
Even lower
densities in
N. America

Empirical Evidence: Average cost per passenger km declines with
density of capacity
27
Metro Railway Returns to Density
Capacity km per Network km
Avera
ge C
ost
per
Pass
en
ger
km
(in
dex:
100 =
Avera
ge
)
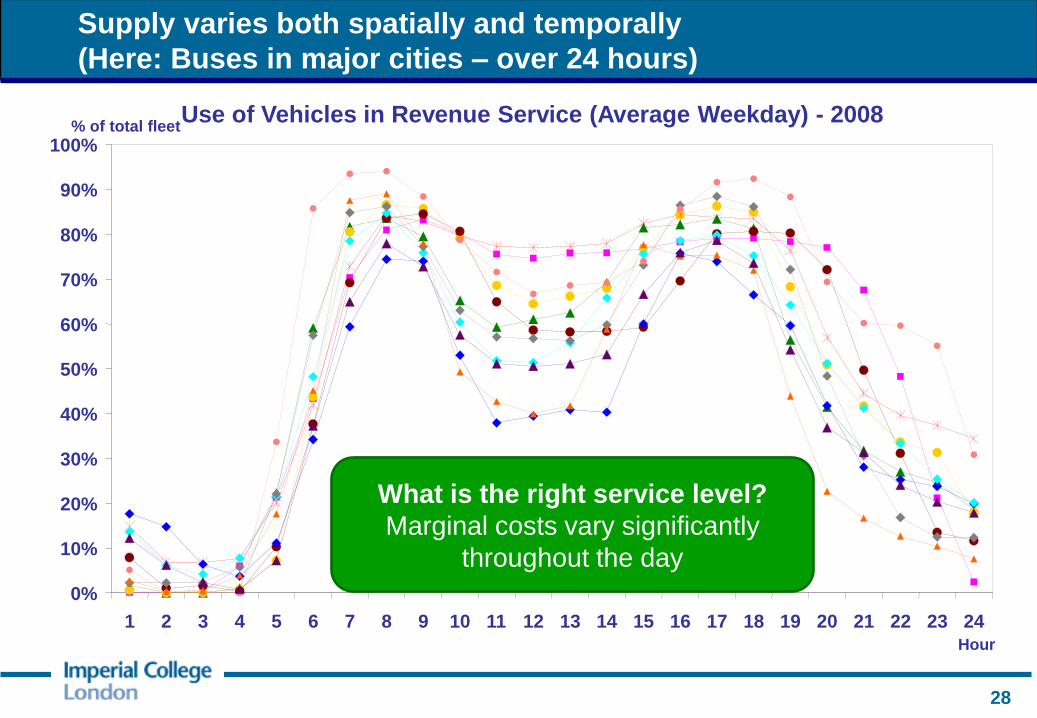
Supply varies both spatially and temporally
(Here: Buses in major cities – over 24 hours)
Use of Vehicles in Revenue Service (Average Weekday) - 2008
0%
10%
20%
30%
40%
50%
60%
70%
80%
90%
100%
1 2 3 4 5 6 7 8 9 10 11 12 13 14 15 16 17 18 19 20 21 22 23 24
Hour
% of total fleet
What is the right service level?
Marginal costs vary significantly
throughout the day
28
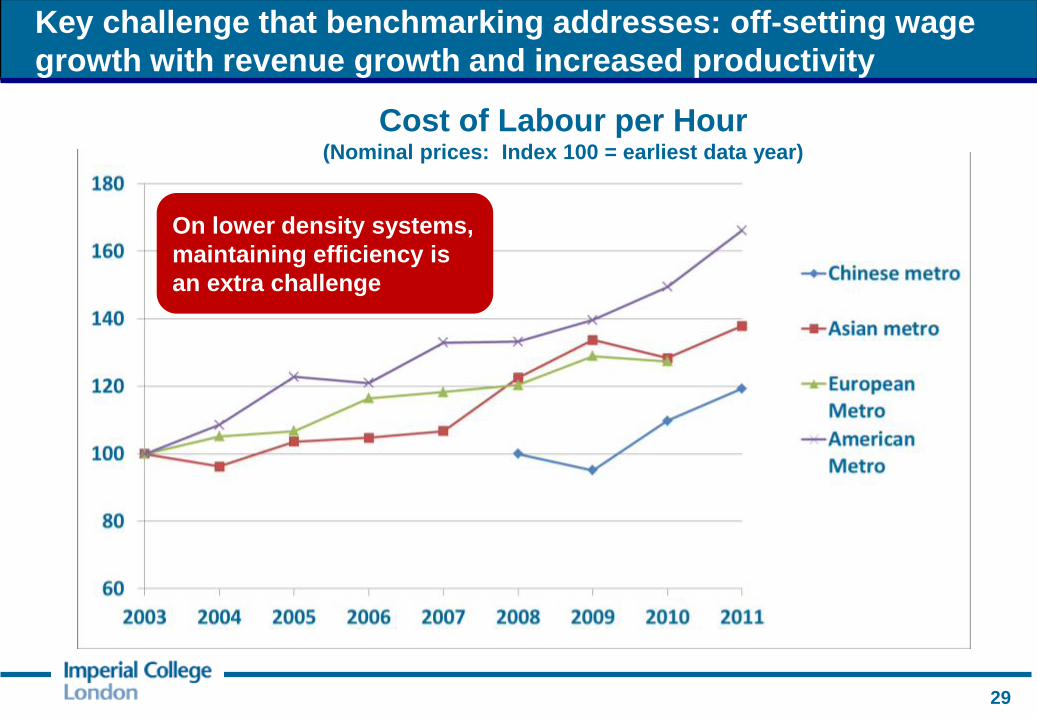
Key challenge that benchmarking addresses: off-setting wage
growth with revenue growth and increased productivity
Cost of Labour per Hour (Nominal prices: Index 100 = earliest data year)
29
On lower density systems,
maintaining efficiency is
an extra challenge
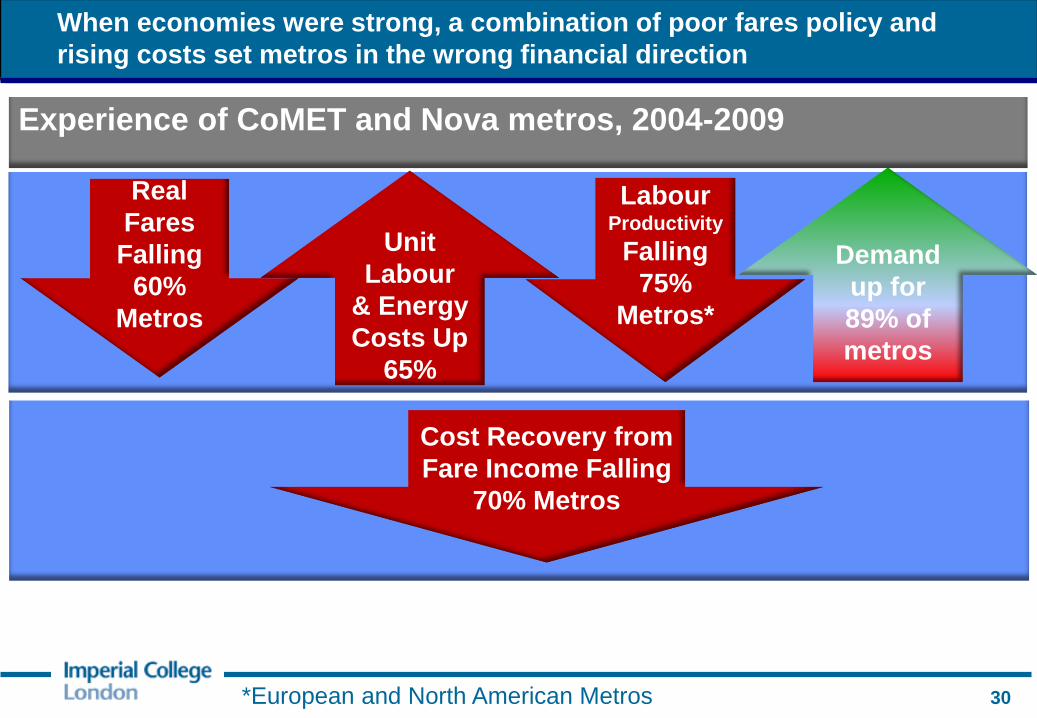
When economies were strong, a combination of poor fares policy and
rising costs set metros in the wrong financial direction
*European and North American Metros
Real
Fares
Falling
60%
Metros
Labour Productivity
Falling
75%
Metros*
Unit
Labour
& Energy
Costs Up
65%
Cost Recovery from
Fare Income Falling
70% Metros
Experience of CoMET and Nova metros, 2004-2009
Demand
up for
89% of
metros
30

A turnaround in fortune since 2009 for many metros, but only temporary,
with fundamentals of energy, labour, fares unchanged
Real Fares
Falling
64% Metros
Experience of CoMET and Nova metros, 2009-2011
Demand up for
81% of metros
Unit Energy
Costs
Falling 60%
metros
Cost Recovery from
Fare Income
Improved
76% Metros
Labour
Productivity
Improved
84% Metros
Unit Labour
Costs
Up
68% metros
31

0.0
0.5
1.0
1.5
2.0
2.5Other Commercial Revenue
Fare Revenue
Commercial Revenue per Operating Cost, 2011
On average, operating costs +40% has been spent on reinvestment
But fares revenue barely covers operating costs (except in Asia)
Observed Metro
Reinvestment Rate
(~40%)
Revenue = operating cost
Key factors: density, fares,
network, efficiency
32
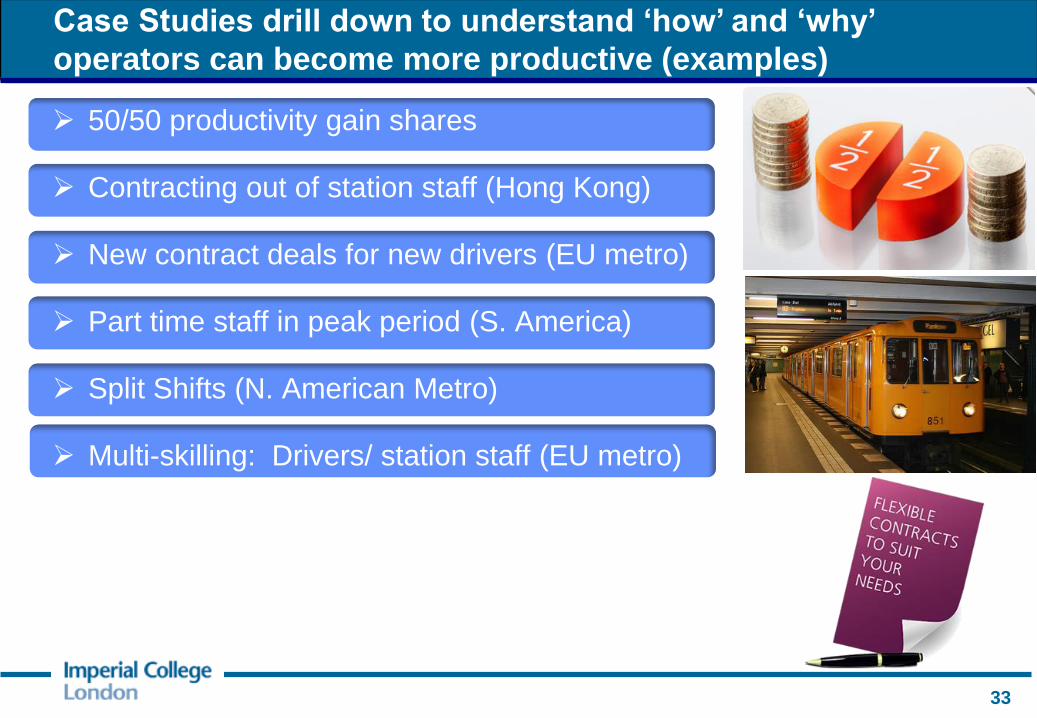
50/50 productivity gain shares
Contracting out of station staff (Hong Kong)
New contract deals for new drivers (EU metro)
Part time staff in peak period (S. America)
Split Shifts (N. American Metro)
Multi-skilling: Drivers/ station staff (EU metro)
Case Studies drill down to understand ‘how’ and ‘why’
operators can become more productive (examples)
33

Unattended Train Operation (UTO) (Paris Line 1 & 14)
Attended driverless train operation (Taipei)
Automatic train turnaround (Madrid)
Ticketing: station staff in more customer facing roles / dispatch
CBTC: Potential for much higher energy efficiency / regeneration
Automatic Train Operation (ATO) – higher reliability, fewer spare drivers
Remote signing on for train drivers (European metro)
CoMET and Nova benchmarking shares experience in use of
technology to improve productivity / effectiveness
34

0 . 0
0 . 2
0 . 4
0 . 6
0 . 8
1 . 0
1 . 2
1 . 4
1 . 6
1 . 8
2 . 0
Ind
ex (
Mean
= 1
)
More
efficient?
Less
efficient?
Car km per Total Staff and Contractor Hours
Factor of 9 variation in staff productivity: What is the right level? What is
achievable? Benchmarking helps transport providers make such choices
Such high level KPIs can mask
efficiencies and inefficiencies in sub-
divisions: disaggregation,
econometric modelling and drill-
down studies are performed
35
Structural Factors: e.g. Density
Quality (customer service etc)

0 . 0
0 . 5
1 . 0
1 . 5
2 . 0
2 . 5
3 . 0
As As As Eu Am Eu Eu Am Eu Am As Am As As Eu As
Billi
on
Passen
ger
Jo
urn
eys
2005 2006 2007 2008 2009 2010 2011
119 %
14 %
6 %
- 2 %
- 4 %
11 % 10 %
94 %
123 %
44 %
259 %
0 %
48 %
132 %
70 %
50 %
Annual Passenger Journeys
Continued world economic growth affects major capital cities such as
London, New York, driving continued rapid passenger growth
Network expansion
driving passenger growth
in Asian metros
% Change
2006 - 2011
Growth continues in
London, Paris, New
York
36

0
50
100
150
200
250
300
350
400
450
500
550
600
650
700
750
Eu As Eu As Am Eu As Am Eu Eu Am Am As As
Annual Passenger Journeys
2007 2008 2009 2010 2011 2012
5816 (2012) 5731 (2011) 5741 (2010) 5767 (2009)
Demand for rail also growing across the world
37
Major growth in London
(network expansion) and Sao
Paulo (service improvements
and economic growth)
2.4%
Average Annual GDP Growth Over Equivalent Time Period
2.4%
2.9%
0.4%
0.6% 0.6% -0.8% -0.8%
0.6%
0.8%
1.5%
0.7%
3.2%
2.0%
An
nu
al
Pa
ss
en
ge
r J
ou
rne
ys
Figures (%): national GDP growth (same period)
UK evidence: +1% GDP typically leads to +1% demand

Conclusions: Benchmarking can be highly effective
Benchmarking has become a key management
tool for operators: at strategic and day-to-day level
Very different demands between ‘regulatory’ and
‘best practice’ benchmarking
The long term, continuous approach with
operator ownership, is key
Benchmarking is not an exact science requiring
qualitative and contextual understanding
Drill-down necessary: statistical and deep
investigation of practices, processes
Our process has continued for 19 years due to the
significant benefits achieved by operators
38
Any questions?
www.imperial.ac.uk/rtsc
39
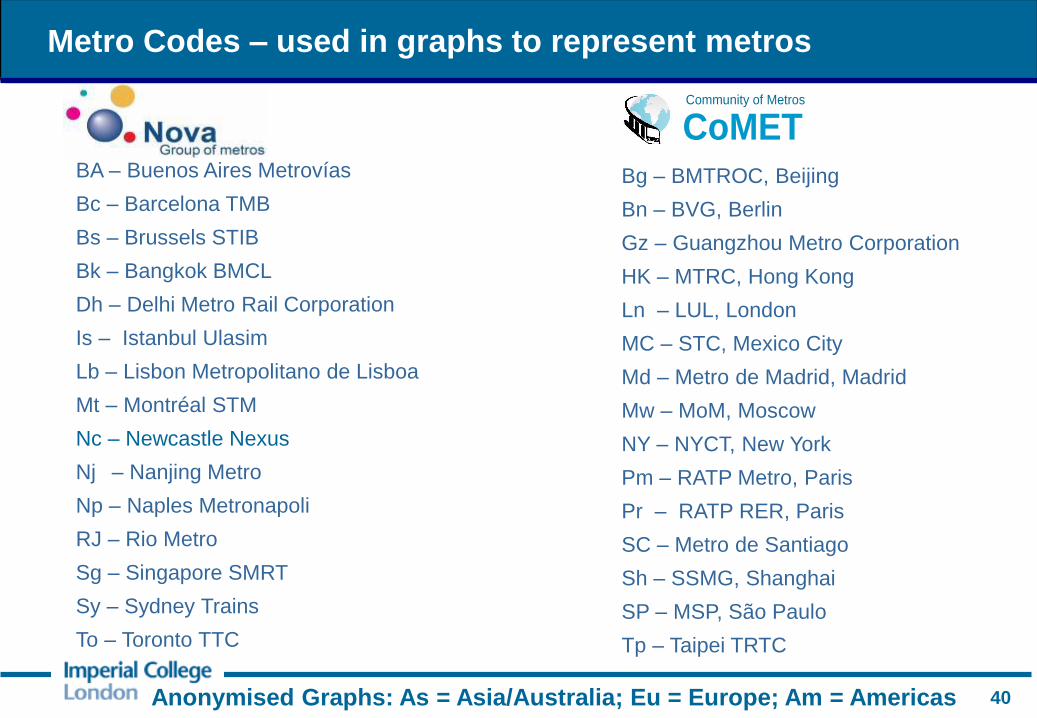
Bg – BMTROC, Beijing
Bn – BVG, Berlin
Gz – Guangzhou Metro Corporation
HK – MTRC, Hong Kong
Ln – LUL, London
MC – STC, Mexico City
Md – Metro de Madrid, Madrid
Mw – MoM, Moscow
NY – NYCT, New York
Pm – RATP Metro, Paris
Pr – RATP RER, Paris
SC – Metro de Santiago
Sh – SSMG, Shanghai
SP – MSP, São Paulo
Tp – Taipei TRTC
BA – Buenos Aires Metrovías
Bc – Barcelona TMB
Bs – Brussels STIB
Bk – Bangkok BMCL
Dh – Delhi Metro Rail Corporation
Is – Istanbul Ulasim
Lb – Lisbon Metropolitano de Lisboa
Mt – Montréal STM
Nc – Newcastle Nexus
Nj – Nanjing Metro
Np – Naples Metronapoli
RJ – Rio Metro
Sg – Singapore SMRT
Sy – Sydney Trains
To – Toronto TTC
CoMET Community of Metros
Metro Codes – used in graphs to represent metros
40 Anonymised Graphs: As = Asia/Australia; Eu = Europe; Am = Americas

ISBeRG Member Railways and Codes
Railway City Code
Ferrocarrils de la Generalitat de Catalunya (FGC) Barcelona Bc
Queensland Rail Brisbane Br
S-Tog, Danish State Railways (DSB) Copenhagen Ch
PRASA – Metrorail, Cape Town Cape Town CT
MTR Hong Kong (East Rail and West Rail only) Hong Kong HK
MTA Long Island Rail Road (LIRR) New York LI
London Overground – London Rail London LO
Metro Trains Melbourne Melbourne Mb
MTA Metro-North Railroad New York MN
S-Bahn Munich, Deutsche Bahn (DB) Regio Munich Mu
Commuter Rail, Norwegian State Railways (NSB) Oslo Os
Bay Area Rapid Transit (BART) San Francisco SF
Sao Paulo Metropolitan Train Company (CPTM) Sao Paulo SP
Sydney Trains Sydney Sy
East Japan Railway Company (JR East) Tokyo Tk
41 Anonymised Graphs: As = Asia/Australia; Eu = Europe; Am = Americas