Embed Size (px)
Citation preview

INTERNATIONAL PUBLIC PARTNERSHIPSAnnual Report and Financial Statements for the year ended 31 December 2013
International Public Partnerships Annual R
eport and Financial Statem
ents 2013

Cover image: Main Street, Royal Childrens Hospital, Melbourne, Australia. For more details refer to page 26.
International Public Partnerships LimitedRegistered number: 45241
Contents
www.internationalpublicpartnerships.com
01 Highlights02 Company Overview02 About the Company03 Key Portfolio Facts as at 31 December 2013 04 Top Ten Investments
05 Chairman’s Letter07 Strategic Report07 Investment Policy and Objectives09 Strategy11 Operating Model 15 Case Study: Investment Characteristics16 2013 Financial and Operating Review16 Key Performance Indicators18 Investor Returns 24 Active Asset Management26 Case Study: Investment Entity – Active Asset Management27 Value-focused portfolio development27 Efficient financial management28 Principal Risks & Mitigation32 Outlook
35 Corporate Governance Report44 Audit and Risk Committee Report46 Board of Directors 48 Directors’ Report49 Directors’ Responsibilities Statement50 Independent Auditor’s Report52 Financial Statements
INTERNATIONAL PUBLIC PARTNERSHIPS Annual Report and Financial Statements 2013 01
Corporate
Governance
Financial S
tatements
Highlights
Strategic
Report
Chairm
an’s Letter
Com
pany O
verview
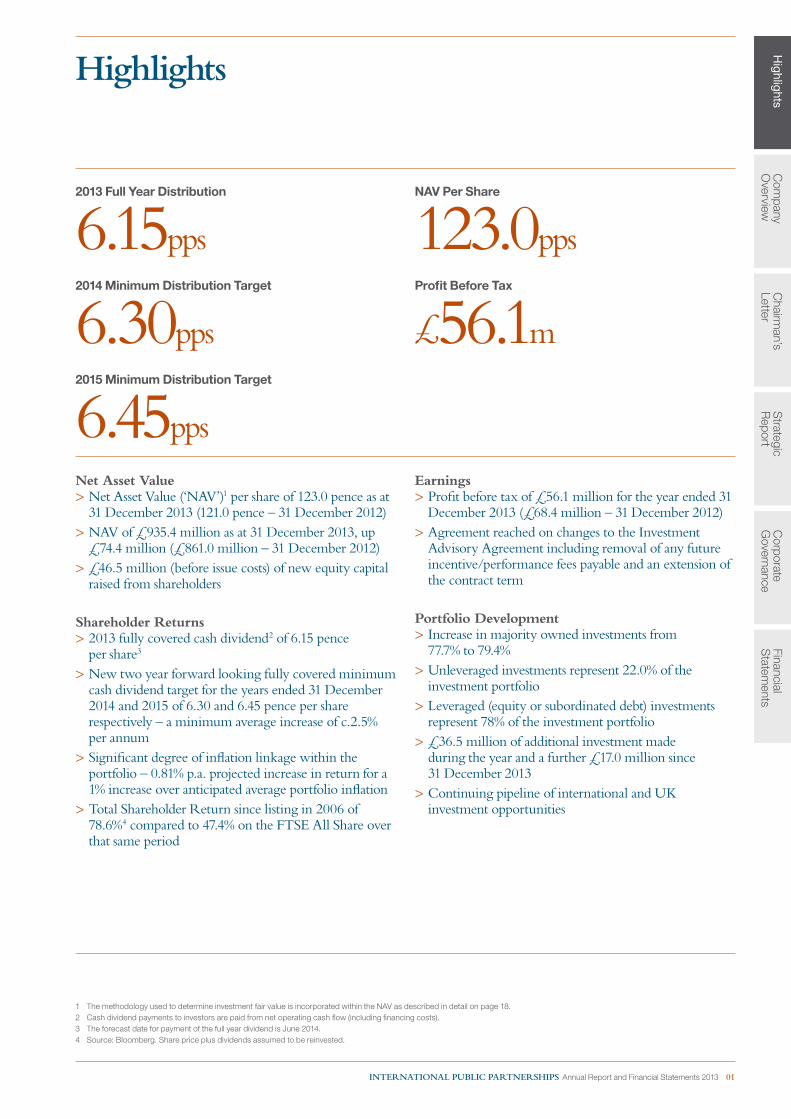
Highlights
2013 Full Year Distribution
6.15pps2014 Minimum Distribution Target
6.30pps2015 Minimum Distribution Target
6.45pps
NAV Per Share
123.0ppsProfit Before Tax
£56.1m
Net Asset Value > Net Asset Value (‘NAV’)1 per share of 123.0 pence as at 31 December 2013 (121.0 pence – 31 December 2012)
> NAV of £935.4 million as at 31 December 2013, up £74.4 million (£861.0 million – 31 December 2012)
> £46.5 million (before issue costs) of new equity capital raised from shareholders
Shareholder Returns > 2013 fully covered cash dividend2 of 6.15 pence per share3
> New two year forward looking fully covered minimum cash dividend target for the years ended 31 December 2014 and 2015 of 6.30 and 6.45 pence per share respectively – a minimum average increase of c.2.5% per annum
> Significant degree of inflation linkage within the portfolio – 0.81% p.a. projected increase in return for a 1% increase over anticipated average portfolio inflation
> Total Shareholder Return since listing in 2006 of 78.6%4 compared to 47.4% on the FTSE All Share over that same period
Earnings > Profit before tax of £56.1 million for the year ended 31 December 2013 (£68.4 million – 31 December 2012)
> Agreement reached on changes to the Investment Advisory Agreement including removal of any future incentive/performance fees payable and an extension of the contract term
Portfolio Development > Increase in majority owned investments from 77.7% to 79.4%
> Unleveraged investments represent 22.0% of the investment portfolio
> Leveraged (equity or subordinated debt) investments represent 78% of the investment portfolio
> £36.5 million of additional investment made during the year and a further £17.0 million since 31 December 2013
> Continuing pipeline of international and UK investment opportunities
1 The methodology used to determine investment fair value is incorporated within the NAV as described in detail on page 18.2 Cash dividend payments to investors are paid from net operating cash flow (including financing costs).3 The forecast date for payment of the full year dividend is June 2014.4 Source: Bloomberg. Share price plus dividends assumed to be reinvested.

02 INTERNATIONAL PUBLIC PARTNERSHIPS Annual Report and Financial Statements 2013
International Public Partnerships Limited (the ‘Company’), in accordance with its Investment Policy, indirectly invests in equity, subordinated/mezzanine debt and senior loans made to entities owning or operating infrastructure concessions, assets or related businesses.
Such investments have included schools, courts houses, health facilities, police stations, and other public sector buildings, rail operations, rolling stock leasing entities and offshore electricity transmission asset owning entities. The Company’s investments are located in the UK, Europe, Australia and Canada.
Whilst the Company is able to invest in fully price regulated infrastructure and other forms of economic infrastructure projects, to date it has primarily invested in entities holding physical infrastructure and associated services procured under Private Public Partnerships (‘PPP’)/Private Finance Initiative (‘PFI’) and similar processes. The Case Study on page 15 provides more detail on these structures.
Key features of International Public Partnerships Limited and its investment portfolio are:
Key Features > Geographically diversified with a portfolio across eight
countries in a variety of sectors > A mix of yielding operational investments and investments
currently in construction with prospects for future capital appreciation
> A significant degree of inflation linkage to investment returns – 0.81% p.a. projected increase in return for a 1% increase over anticipated average inflation across portfolio
> The Investment Advisor has historical success in originating and developing investment opportunities in new sectors with low risks relative to returns
> A high degree of management and control of underlying investments to support sustained performance
> Access to a large pool of pre-emptive and other preferred rights to increase investment in assets that have proven performance within the existing portfolio
> Operational performance and income from underlying investments is predominantly founded on asset availability, not demand, usage or other non-controllable variables
> A significant portion (18%) of the portfolio is investment in secured senior debt (where no other debt ranks in preference to the Company’s investment in the asset)
Shareholder Returns > Strong track record of delivering consistent dividend growth
and capital appreciation > Share liquidity through listing and trading on the London Stock
Exchange > Total shareholder returns to date are in line with the 8% to 9%
p.a. target set at the time of initial public offering in 2006
Governance > Experienced leadership and independent corporate
governance > Long-term alignment of interest with the Investment Advisor
and asset manager
Market Information > FTSE listed since November 2006 with an initial market
capitalisation of £300 million > Member of the FTSE 250 and FTSE All Share indices > £972.9 million market capitalisation as at 31 December 2013
(2012: £893.7 million) > 760.6 million shares in issue as at 31 December 2013 (2012:
711.6 million) > The Company’s shares are eligible for ISA/PEPs and SIPPs
transfers > The Company’s shares are excluded from the Financial
Conduct Authority restrictions which apply to non-mainstream investment products and can therefore be recommended by independent financial advisors to their clients (see page 43 for detail)
Investment Advisor Fees > Competitive fee structure > 1.2% per annum of gross asset value (‘GAV’) of investments
bearing construction risk > For fully operational assets:
• 1.2% p.a. of the GAV (excluding uncommitted cash from capital raisings) up to £750 million
• 1.0% p.a. where GAV (excluding uncommitted cash from capital raisings) is between £750 million and £1.5 billion
• 0.9% p.a. where GAV (excluding uncommitted cash from capital raisings) exceeds £1.5 billion
> 1.5% asset origination fee of the value of new investments to cover acquisition due diligence
> No incentive or performance fees > Further details can be found in the Strategic Report on pages
12 and 13
Company OverviewAbout the Company

INTERNATIONAL PUBLIC PARTNERSHIPS Annual Report and Financial Statements 2013 03
Highlights
Corporate
Governance
Financial S
tatements
Strategic
Report
Com
pany
Overview
Chairm
an’s Letter
Key Portfolio Facts (as at 31 December 2013)
■ Education 28%■ Transport 23%■ Energy 20%■ Health 11%■ Courts 9%■ Police Authority 5%■ Custodial 1%■ Other 3%
Sector Breakdown
■ Construction 7%■ Operational 93%■ Primary Investor3 86%■ Later Stage Investor4 14%
Mode of Acquisition/Asset Status
122 investments in infrastructure projects1 across a variety of sectors
Early stage investor to maximise capital growth opportunities
■ UK 62%■ Belgium 16%■ Australia 11%■ Canada 5%■ Germany 4%■ Ireland 2%
Italy <1% France <1%
Geographic Split
■ 100% 74%■ 50%–100% 5%■ <50% 21%
Project Status
Invested in selected jurisdictions which meet the Company’s risk and return requirements
Preference to hold majority stakes
■ Risk Capital only2 78%■ Company owns Risk Capital and Senior Debt 22%
Investment Type
■ 10–20 years 30%■ 20–30 years 50%■ >30 years 20%
Concession Length
Invested across the capital structure taking into account appropriate risks to returns
Weighted average portfolio life of 24 years
1 Information provided in charts above is based on 31 December 2013 portfolio investment fair value. Unless otherwise stated the Company and its subsidiaries hold investments in equity, subordinated debt and senior loans made to entities owning or operating infrastructure concession, assets or related businesses.
2 ‘Risk Capital’ – includes both project level equity and subordinated debt.3 Primary stage investor – asset developed or originated by the Investment Advisor or predecessor team.4 Later stage investor – asset acquired from another investor in the secondary market.

04 INTERNATIONAL PUBLIC PARTNERSHIPS Annual Report and Financial Statements 2013
A complete listing of the Group’s investments can be found in note 22 of the financial statements and further information about each of these investments is available on the Company’s website.
Significant movements in the Company’s portfolio for the year ended 31 December 2013 can be found on page 27 of the Strategic Report.
Name of Project Location SectorStatus at 31 December 2013
% Holding at 31 December 2013
% Investment Fair Value
31 December 2013
% Investment Fair Value
31 December 2012
Diabolo Rail Link1 Brussels, Belgium Transport Operational 100% risk capital2 15.55% 12.29%
Ormonde Offshore Transmission
Cumbria, England Energy Operational 100% risk capital2 and 100% senior debt
14.90% 14.72%
Royal Children’s Hospital Victoria, Australia Health Phase 1 Operational; Phase 2 Under Construction
100% risk capital2 5.18% 6.49%
BeNEX Rail Various, Germany Transport Operational 49% risk capital2 4.18% 4.31%
Hereford & Worcester Courts
Worcestershire, England Courts Operational 100% risk capital2 and 100% senior debt
4.09% 4.52%
Northampton Schools Northamptonshire, England Education Operational 100% risk capital2 3.91% 3.95%
Alberta Schools Alberta, Canada Education Operational 100% risk capital2 3.45% 2.98%
Strathclyde Police Training Centre
Strathclyde, Scotland Police Authority
Operational 100% risk capital2 and 100% senior debt
2.99% 3.39%
Tower Hamlets Schools London, England Education Operational 100% risk capital2 2.46% 2.34%
Orange Hospital New South Wales, Australia Health Operational 100% risk capital2 2.31% 2.90%
1 Note that the Northern Diabolo Project revenues are dependent on availability but also include an element of linkage to passenger numbers. All other investments receive entirely availability based revenues.
2 Risk capital includes both project level equity and subordinated shareholder debt.
Top Ten Investments

INTERNATIONAL PUBLIC PARTNERSHIPS Annual Report and Financial Statements 2013 05
Com
pany O
verviewH
ighlights C
orporate G
overnanceFinancial S
tatements
Strategic
Report
Chairm
an’s Letter
Chairman’s Letter
Dear Shareholders,This is my first letter to shareholders since taking over the chairmanship of the Company on 1 January 2014. I would like to express my sincere thanks to my predecessor, Keith Dorrian, who has chaired the Company since its inception and has presided over the successful growth and development of the Company from a £300 million company at Initial Public Offering (‘IPO’) in 2006, to its current c.£1 billion market capitalisation today. Keith has been a strong and effective Chairman and he leaves the Company in a very healthy commercial position.
I look forward with confidence to taking on this important role and working alongside my fellow Directors and the Investment Advisor to take the business to its next stage of growth and to continue to deliver consistent long-term value to shareholders.
Dividend GrowthIn its seven year history the Company has gained a reputation for consistent dividend per share growth of at least 2.5% per annum. It is pleasing to note that 2013 was another year of robust performance by the Company underpinned by highly predictable cash flows.
The Board remain focused on the continuing ability of the Company to grow fully covered cash dividends over the next few years and we are confident that this can be achieved. We have therefore published a minimum dividend target of 6.30 pence per share and 6.45 pence per share for 2014 and 2015 respectively, or a minimum average increase of c.2.5% per annum, to give additional guidance to shareholders as to our intentions in the future.
Investment Activity and Capital GrowthThe Company continues to add to its portfolio in a measured way. We are confident that this will continue to improve the quality and resilience of the portfolio to deliver consistent and predictable returns to shareholders. All investments made over the past 15 months have continued to add robustness to the Company’s projected cash flows and improve the Company’s quality of earnings. This will continue to be the case. The Company continues to differentiate itself in its approach to new investments, generally preferring to acquire investments off-market and by exercising pre-emption rights in existing investments, via the
origination expertise of its Investment Advisor, Amber Fund Management Limited (‘Amber’). More recently secondary market auctions for infrastructure assets have typically offered us less attractive returns as competition for these investments has become more widespread.
While we will continue to participate in auctions where we see good value opportunities, we are confident that our preference for sourcing new investments off market will continue to create demonstrably higher value for shareholders in the long term. Secondary MarketDemand for secondary market assets in our asset class continued to be very strong in 2013. We have taken advantage of this since the end of the year by selling minority stakes we held in two educational infrastructure assets. These were stakes where we could see no realistic possibility of increasing our holding to majority ownership or seeing any other long-term strategic value in retaining.
The price at which these assets were sold was well in excess of the price paid on acquisition in 2011 and offered a significant premium to the Company’s target rate of return. It is also indicative of our active approach to the management of the Company’s investments to achieve attractive risk adjusted returns.
While the Company does not expect to trade assets regularly, preferring instead to retain the long-term income generation potential of its holdings, these secondary market pricing levels validate the increased popularity and attractions of the asset class in which the Company is invested.
Operational PerformanceThe operational performance of the Company’s portfolio continues to be very strong. During the year we have focused on delivering our expected returns, managing our public sector customer relationships, enhancing the investments through contract variations requested by our public sector clients and managing the build-out of assets in construction. We consider that control over the operational performance of investments is vital as strong asset-level relationships with public sector clients are a key factor in both protecting our reputation and safeguarding investment performance.

06 INTERNATIONAL PUBLIC PARTNERSHIPS Annual Report and Financial Statements 2013
The Company continues to benefit from our relationship with Amber in this respect, particularly for the majority of investments where Amber is responsible for the detailed day-to-day delivery of management services and relationships with our public sector clients. We believe our approach is an important point of differentiation compared to other investment vehicles in the sector where responsibility for such asset level management activity is often outsourced to construction/facilities management contractor parties. Such parties are generally not investors and hence, without a long-term investors’ view, quality control and alignment of interest, are much harder to maintain. Amendments to Management ArrangementsIn recognition that the Company’s performance had exceeded the Benchmark Return described in the Investment Advisory Agreement (‘IAA’), an incentive fee of £11 million was due to the Investment Advisor during the year – taken at their election as 60% scrip and 40% cash. During the summer, both the Board and Amber recognised that the continued existence of an incentive fee mechanism in the Company’s investment advisory arrangements risked damage to long-term investor value. Following consultation between the Company and a number of its shareholders, the Board took the decision to amend the IAA to remove the performance fee mechanism in its entirety, further reduce management fees as assets are grown, and at the same time strengthen its supervision rights over Amber. As part of these arrangements, which came into effect on 1 July 2013, the term of the investment advisory agreement reverted to that which applied at the time of the Company’s establishment (a ten year fixed term with a five year notice period). More details can be found within the Strategic Report.
These new arrangements were, as a package, very much in the interests of investors and were overwhelmingly supported by investors at the Extraordinary General Meeting held in September 2013. Nevertheless the way in which these changes were communicated could, in hindsight, have been improved. We hope to have learned from that experience in respect of our dealings with investors in future.
Changes to Presentation of Results and ReportFor the year ending 31 December 2013, our financial statements have a new look following the early adoption of new accounting standards which require investment companies to present their financial statements on an investment basis. We believe that this will significantly assist investors by enabling greater consistency between the presentation of the audited financial statements and the key investment metrics used by management and shareholders. The IFRS balance sheet is now consistent with the Company’s published net asset value, and the income statement with net investment returns achieved in the period.
Importantly, these changes have had no impact on overall portfolio valuation. However, there have been minor changes to the macroeconomic assumptions and the way in which the discount rates used to value our portfolio are presented: we have adapted our approach and present both an ‘equity risk capital’ average discount rate and ‘equity risk capital plus senior debt investment’ average discount rate to provide more detail on the composition of the Company’s portfolio and recognise more clearly the reduced risk that senior debt investments offer the Company. More information is provided on page 21 of the Strategic Report.
The Company has also voluntarily chosen to adopt new narrative reporting guidance as incorporated within the UK Companies Act 2006 (Strategic Report and Directors’ Report) Regulations 2013 to provide improved transparency and linkage of various sections of the Annual Report and to reflect the ‘fair, balanced and understandable’ principals of the UK Corporate Governance Code. As a result, we have taken the opportunity to significantly restructure the Annual Report and now incorporate much of the information that was previously presented as the Investment Advisor’s Report in the new, more comprehensive Strategic Report that outlines the Company’s investment strategy, operating model and, current performance (including key performance indicators) together with principal risks and uncertainties.
Corporate GovernanceDuring the year, and in anticipation of Keith Dorrian’s decision not to seek re-election at the next Annual General Meeting, John Stares was appointed as an additional Director to the Board. The Company will benefit from John’s substantial experience as a non-executive director at Terra Firma and prior to that over 30 years business experience including management consulting at Accenture.
The Board greatly values direct feedback from investors and, in addition to the regular investor relations activities undertaken by the Investment Advisor throughout the year, it has actively engaged with investors. During the consultation process around the changes to the Investment Advisory Agreement, noted above, independent members of the Board met with over half of the Company’s shareholders (by value) in locations across the UK. The Board also met with a cross-section of investors and analysts at our Liverpool Library investor day held in April prior to the official opening of this new PFI facility. We are keen to maintain this ongoing dialogue.
OutlookThe outlook for 2014 is promising. We continue to have a high degree of confidence in the performance of the portfolio as well as the Company’s ability to generate increasing dividends in line with published expectations. Despite the increased competition and reduced pipeline of opportunities in some core markets, we continue to have visibility of a number of attractive investment opportunities that, when executed, will be expected to strengthen the Company’s portfolio further. We will therefore continue to be selective in our acquisitions to ensure they bring real benefits to shareholders. Further details are provided within the Outlook section of the Strategic Report.
I thank all shareholders for their support of the Company in 2013 and look forward to continuing to reward them in 2014.
Rupert Dorey 26 March 2014Chairman
Chairman’s Letter continued

INTERNATIONAL PUBLIC PARTNERSHIPS Annual Report and Financial Statements 2013 07
Com
pany O
verviewH
ighlights C
orporate G
overnanceFinancial S
tatements
Chairm
an’s Letter
Strategic
Rep
ort
Investment ObjectivesThe Company seeks to provide shareholders with a predictable, attractive and sustainable investment yield fully supported by net income receipts in addition to the potential for capital appreciation of the Investment Portfolio.
The Company targets a minimum annual dividend (which for 2014 is targeted to be 6.30 pence per Ordinary Share and for 2015 is targeted to be 6.45 pence per Ordinary Share or a minimum increase of c.2.5% p.a.) and seeks to continue to increase this where sustainable to do so.
The Company also targets an internal rate of return (‘IRR’) equal to or greater than 8% p.a. on the Initial Public Offer issue price of 100 pence per Ordinary Share to be achieved over the long term. The Directors seek to achieve this through asset development, future acquisitions, active management and prudent use of gearing. The 2013 Financial and Operating Performance Review section provides further information relating to performance during the year.
Investment PolicyThe Company’s investment policy is to invest directly or indirectly in public or social infrastructure assets (usually via entities which have been granted a concession to operate and manage those assets) and related businesses located in the UK, Australia, Europe, North America and, it is anticipated, in due course, in other parts of the world where the risk profile meets the Company’s risk and return requirements.
The Company intends to continue to acquire operational and construction phase assets and hold them for the long term or life of the asset (or concession), unless there is a strategic rationale for earlier realisation. The Company will seek to enhance the capital value and the income derived from its investments. The full Investment Policy is available on the Company’s website www.internationalpublicpartnerships.com
Investment parametersThe Company intends to acquire further investments within the following parameters:
> investments with characteristics similar to the existing portfolio > investment in other assets or concessions having a public or
social infrastructure character and in respect of which• availability based payments are or will become payable;• a property rental is or will become payable, or• user paid charges (or payments related to amount of use)
are or will become payable > investments in infrastructure assets or concessions
characterised by high barriers to entry and expected to generate an attractive total rate of return over the life of the investment
Portfolio compositionThe Company may make investments in any location or jurisdiction where the investment meets the parameters set out above, although the Company does not currently expect to invest in projects in non-OECD countries.
The Company will, over the long term, seek a spread of investments both geographically and across industry sectors in order to achieve a broad balance of risk in the Company’s portfolio. The actual asset allocation will depend on the maturity of development of the local infrastructure investment market, wider market conditions and the judgment of the Investment Advisor and the Board as to the suitability of the investment from a risk and return perspective. Key Portfolio Facts on page 3 has details of the current composition of the investment portfolio.
Investment restrictionsThe Company’s investment policy restricts it from making any investment of more than 20% of the Company’s total assets in any one investment at that time.
This policy does not however oblige the Company to rebalance its investment portfolio subsequently as a result of a change in the net asset value of any investment or the Company as a whole. However, its purpose is to limit the risk of any one investment to the overall portfolio.
Strategic ReportInvestment Policies & Objectives
Investment Policies and Objectives
Strategy Operating Model
2013 Financial and Operating Review
Principal Risks and Mitigation
Outlook

08 INTERNATIONAL PUBLIC PARTNERSHIPS Annual Report and Financial Statements 2013
The Company is also subject to certain restrictions pursuant to the UKLA Listing Rules, i.e. to invest and manage assets with a view to spreading or otherwise managing investment risk in accordance with the Investment Policy; to not conduct a trading activity which is significant to the Group; to not hold more than 10% of its total assets in other listed closed-ended investment funds. Currently the Company has no investment in any listed closed-ended investment funds.
Managing conflicts of interestIt is expected that further investments will continue to be sourced by the Investment Advisor, Amber Fund Management Limited. It is likely that some of these investments will have been originated and developed by, and in certain cases may be acquired from members of the Amber Infrastructure Group.
The Company has established detailed procedures to deal with conflicts of interest that may arise and manage conduct in respect of any such acquisition. The Company’s Board is required, in accordance with the UKLA Listing Rules, to have a majority of independent members and a Chairman who is independent from the Investment Advisor. The Operating Model section within this Strategic Report sets out the operating model for the Company and the Corporate Governance Report sets out more details on the conflicts management process.
Financial managementThe Company may hold derivative or other financial instruments designed for efficient portfolio management or to hedge interest, inflation or currency risks.
Subject to the strategy approved by the Board the Investment Advisor manages such hedge activities for the purpose of efficient portfolio management to enhance returns from the portfolio. Hedges are not entered into for speculative purposes. Further details on the Company’s use of hedges are provided in the Financial Statements in note 13.
The underlying entities into which the Company invests often are leveraged. Any debt assumed by these vehicles is non-recourse to the Company and variable interest rate debt is swapped to fixed rates at that project’s inception to ensure that the cost of the debt is known over the life of the project concession.
The Company may make prudent use of leverage to enhance returns to investors, to finance the acquisition of investments in the short-term and to satisfy working capital requirements.
Under the Company’s Articles, outstanding borrowings at the Company level, including any financial guarantees to support subscription obligations in relation to investments, are limited to 50% of the Gross Asset Value (‘GAV’) of the Company’s investments and cash balances. The Company has the ability to borrow in aggregate up to 66% of such GAV on a short-term basis (i.e. less than 365 days) if considered appropriate. Currently, the Company’s corporate debt facility, which has recently been increased to £175 million, is fully undrawn (see page 27 for further details).
The Group may borrow in currencies other than Sterling as part of its currency hedging strategy.
Operating cash surpluses and funds pending investment are held in cash, cash equivalents, near cash instruments, money market instruments and money market funds and cash funds.
Changes to investment policyMaterial changes to the investment policy summarised in this section may only be made by ordinary resolution of the Shareholders in accordance with the UK Listing Rules.
Investment Policies and Objectives continued

INTERNATIONAL PUBLIC PARTNERSHIPS Annual Report and Financial Statements 2013 09
Com
pany O
verviewH
ighlights C
orporate G
overnanceFinancial S
tatements
Chairm
an’s Letter
Strategic
Rep
ort
Strategy
The Company’s strategy, which is determined by and reviewed by the Board, can be divided into three different but linked areas of focus. In combination, these areas of focus assist the Company to
manage its investments and finances throughout the investment cycle and, where justified, identify new investment opportunities meeting its investment objectives.
Strategy
1. Active Asset Management 2. Value-focused Portfolio Development 3. Efficient Financial Management
> Focus on delivery of anticipated returns from existing assets
> Maintain high levels of public sector satisfaction and asset performance
> Deliver additional capital value from existing assets through management of construction risk and delivery of operational improvements to meet client requirements
> Through relationships with co-shareholders and pre-emptive rights where applicable increase individual investment holdings to 100% where beneficial
> Make additional acquisitions where possible, ideally off market, at prospective returns that are beneficial in risk/return terms
> Enhance prospects for capital growth by investing as primary investor and/or in construction phase assets where available
> Identify complementary investment sectors within the Company’s investment policy offering better returns with a similar risk profile
> Take advantage of infrastructure opportunities internationally where investments have an appropriate risk profile and contractual structures are reliably enforceable to enhance diversification
> Undertake ongoing review of portfolio composition to ensure suitable blend of risk/return, inflation linkage, yield versus capital characteristics, level of diversification and opportunistic enhancements
> Efficient financial management of cash holdings and debt facilities available for investment and appropriate hedging strategies
1. Active Asset ManagementThe delivery of returns anticipated to be received from the Company’s investments is fundamental to the Company’s performance. The Company takes an active approach to asset management, encouraging the Investment Advisor and its associates to maximise cash flow from its investments in ways that are consistent with delivering high levels of service to the underlying assets’ public sector clients. These relationships and
the Company’s overall approach are described in more detail in the Operating Model section on page 11. The success of the Company’s policy of active asset management can be seen through a combination of the Company’s record in receiving investment cash flows in line with projections and the level of satisfaction that public sector clients have with the facilities which they occupy.
Investment Policies and Objectives
Strategy Operating Model
2013 Financial and Operating Review
Principal Risks and Mitigation
Outlook

10 INTERNATIONAL PUBLIC PARTNERSHIPS Annual Report and Financial Statements 2013
2. Value-focused Portfolio DevelopmentThe second leg of the Company’s strategy is to seek out further attractive investments that can improve the overall quality of projected returns from the Company’s portfolio. To this end the Company works closely with its Investment Advisor to seek out new opportunities which meet the Company’s desired risk and return profile. Historically this has included both ‘primary’ investments where the Company (or its Investment Advisor) have originated a new project and ‘secondary’ investments where an existing investment is acquired from a third party.
The Company does not have a preference as to whether the investments it acquires are characterised as senior debt, subordinated debt or equity (or a combination of any of these). What is relevant to the Company is the risk adjusted return available to it from such investment.
The Company’s preference is to own majority or 100% holdings in its investments, where possible, in order to have full oversight and control over underlying investment performance. The Company’s strategy during the year has therefore been to continue to make incremental investments in existing projects where available and beneficial to the overall risk/return profile of the Company.
The Company has also targeted, and expects to continue to target, overseas markets, principally Australia and Germany, where it has experience from existing investments and client relationships, and where it and its Investment Advisor have operational experience of the effectiveness of contractual structures, to mitigate risks.
In recent times, the level of market competition for assets sold through open auction processes has led the Company to focus its strategy particularly on identifying niche, off-market, secondary
opportunities and continuing to develop its access to primary market transactions. The Company continues to see such opportunities offering attractive returns for the level of risk.
The Company considers that it has sector differentiation and a competitive advantage in being able to take this approach through the strong record of its Investment Advisor (and its associated group) in developing new opportunities and gaining early-mover competitor advantage in relatively new growth sectors such as OFTOs1.
As a consequence, the Directors believe that the Company will continue to be well placed to take advantage of similar off-market and emerging sector opportunities in the future as well as on-market opportunities that may emerge. For further details, refer to the Operating Model section of this Strategic Report.
Portfolio development also includes consideration of realisation of value for investors through divestment, particularly where investments are no longer core or are minority holdings and where the acquisition of further investment is unlikely.
3. Efficient Financial ManagementThe Board seeks to manage returns on operating cash surpluses and efficiently manage cash available for investment through prudent use of a corporate debt facility. The Company also seeks to use foreign exchange derivatives, interest rate swaps and other appropriate hedging strategies to protect investment returns where appropriate to do so, in accordance with the Investment Policy (see Investment Policy section). Currently the Company only has foreign exchange forward contracts in place (excluding hedging arrangements at and underlying investment entity level).
1 Offshore electricity transmission owner licensed entities.
Strategy continued
> Delivery of returns > Public sector client satisfaction > Management of risk
> Build controlling stakes > Off-market preferred opportunities > Optimise risk versus return > Diversification > Inflation linked yield > Capital Growth prospects
> Capital and cash management > Treasure and hedging
1. A
ctive
Asset
Man
agem
ent
3. Ef cient
Financial
M
anagement
2. Value Focused
PortfolioDevelopment

INTERNATIONAL PUBLIC PARTNERSHIPS Annual Report and Financial Statements 2013 11
Com
pany O
verviewH
ighlights C
hairman’s
LetterS
trategic R
eport
Corporate
Governance
Financial S
tatements
Operating Model
Board and Committees
International Public
Partnerships
FacilitiesManagement Contractor
Debt Providers
Construction Contractor
Public SectorClient
Investment Advisor
Asset Manager
Investment Advisor > Portfolio
investment advice > Management of fund
level activity, tax and accounting
> Detailed fund and investment level reporting
Asset Manager > Day to day investment
entity management > Close relationship with
public sector client maintained throughout project life
> Key management interface between client and all service/debt providers to underlying investments
> Skilled and experienced treasury, finance, project management personnel
> Entity level tax, accounting and reporting
Investment fund
Integrated service provision
InvestmentEntities
Investment entities
Board and Committees
> Setting strategy > Independent
investment decision making
> Risk management, governance and oversight
Investment Entity Board representation
> Direction and governance of all underlying investment entities
> Focus on key issues, risks to deliver agreed client outcomes and shareholder value
Key Aspects of the Operating ModelThe diagram above illustrates the Company’s operating model, which is founded upon:
> Strong independent board leadership and governance > A long-term alignment of interest with its Investment Advisor
and other key suppliers > Consistent communication and delivery of strategy throughout
the Group
> A vertically integrated model which gives the Company visibility of and a relationship with its public sector customers
> An experienced Investor Advisor team, expert in all aspects of infrastructure development, investment and management
> A disciplined approach to asset selection and country risk > A focus on acquiring controlling stakes (or minority positions
where strategically beneficial to do so)
Investment Policies and Objectives
Strategy Operating Model
2013 Financial and Operating Review
Principal Risks and Mitigation
Outlook

12 INTERNATIONAL PUBLIC PARTNERSHIPS Annual Report and Financial Statements 2013
Operating Model continued
> For fully operational assets:• 1.2% for the first £750 million of gross asset value of the
portfolio;• 1.0% for that part of the portfolio that exceeds £750 million
in gross asset value but is less than £1.5 billion; and• 0.9% for that part of the portfolio that exceeds £1.5 billion in
gross asset value.
The 1.0% fee bracket above was introduced in June 2012 and the 0.9% fee rate bracket was introduced and approved by shareholders on 28 August 2013 as part of a wider Extraordinary General Meeting (‘EGM’) approving a number of changes to the Investment Advisory Agreement (‘IAA’, as mentioned within the Chairman’s Letter). These changes included the removal of the previously applicable incentive fee and a rebasing of the term of the IAA to that which applied at the time of the Company’s initial flotation in 2006 (a ten-year fixed term with a five-year notice period). The Board consider that given the long-term nature of the Company’s investments and its responsibility for the detailed day-to-day delivery of management services and relationships with public sector clients, it is important that benefits from the continuity of service provided by a long-term advisory partner.
Additional changes approved at the EGM included: > Removal of cash receipts from capital raisings and tap
issuances from the gross asset value used to calculate base fees
> Strengthening certain termination provisions to ensure that, in the event of poor investment performance, the Company has greater flexibility to remove the Investment Advisor
The Investment Advisor is also entitled to receive an asset origination fee of 1.5% of the value of new investments acquired by the Group. It should be noted that, generally, the Investment Advisor bears the risk of abortive transaction origination costs and that this fee has been waived or reduced by agreement on occasions in the past where it has been deemed appropriate to do so for the transaction in question. No other transaction fees may be paid to the Investment Advisor otherwise than at the absolute discretion of the Board. No such fees were paid in 2013 or are anticipated to be paid.
Further information and details of the Board’s process for independent management and review of its relationship between the Investment Advisor and the Company are set out within the Corporate Governance Report.
Relationship with the Investment Advisor and its group
International Public Partnerships LimitedExperienced Independent Board
Amber
> Consistent communications
> Vertically integrated > Alignment of
interest
Originate and Develop Invest Asset
Management
> Experienced team >70 people > Selective and disciplined investment approach > Integrated model
Board and CommitteesThe Board sets the strategy for the Company and makes decisions on changes to the portfolio (including approvals of acquisitions, disposals and valuations). Through committees and the use of external independent advisors it manages risk and governance of the Company. The Board has a majority of independent directors – currently five of the six directors are independent. See the Corporate Governance Report for further details.
Investment AdvisorThe Company’s Investment Advisor is Amber Fund Management Limited (a member of the Amber Infrastructure Group Holdings Limited group of companies).
The contractual arrangements allow for the provision of investment advisory and certain other financial services to the Board. In return, the Investment Advisor receives fees based on the gross asset value and composition of the investment portfolio as well as a contribution to expenses. The annual base fees are calculated at the following rates:
> 1.2% for that part of the portfolio that bears construction risk (i.e. the asset has not fully completed all construction stages including any relevant defects period and achieved certification by the relevant counterparty and senior lender)

INTERNATIONAL PUBLIC PARTNERSHIPS Annual Report and Financial Statements 2013 13
Com
pany O
verviewH
ighlights C
hairman’s
LetterS
trategic R
eport
Corporate
Governance
Financial S
tatements
The Company’s GroupThe Company holds its investments through a number of holding entities including an English law limited partnership of which one of its subsidiaries is the sole limited partner and a company associated with the Investment Advisor is the general partner. Beneath these holding entities the Company’s investments are held in special purpose investment entities so that as far as possible each investment is held in a separate entity to avoid cross collateralisation between investments.
Investment entity asset managementUnderlying investment entities (particularly PPP/PFI entities) do not typically have their own employees, although there are exceptions to this. Instead, normal practice is for such services to be subcontracted at the time of project inception to specialist asset management entities. The role of the asset manager is to manage all interfaces between the investment entity, the client, financiers and supply chain sub-contractors.
Such services are generally provided directly to each investment under asset management contracts specific to that investment entity. Services typically include day to day management, issue resolution, monitoring and reporting for the entity and can cover operational, regulatory, compliance, accounting, tax, company secretarial and other related services specific to each entity. Under typical PFI/PPP structures such services are generally provided for a fixed fee by third party service providers under contracts put in place at the inception of the PFI/PPP project after a period of competition.
The Company’s preference for the majority of its investments is for associates of the Investment Advisor to provide such services to the relevant entity. This ensures that financial and operational aspects are performed in-house by Amber rather than sub- contracted to other third party providers who have less incentive to focus on delivery of desired outcomes. Where the Company does not have control such services are outsourced to other service providers. The contracts and fees payable for such asset management services (whether with third parties or, where Amber provides these services, associates of the Investment Advisor) are generally set in real terms for the life of the project and agreed at the time of documentation of the project with the public sector (which in many cases will be prior to the Company’s investment). These form part of the project costs along with other project service related costs (and are thus outside the Company’s direct control) but the Company’s projected investment returns are calculated after taking account of all such project costs.
A breakdown of typical project costs in the operational stage of an investment appears on page 15. Following the adoption of IFRS 10 (Investment Entity – Consolidation Exemption) all underlying project level costs (and project level revenues) are now excluded from the Group’s financial statements. Instead and consistent with other investment funds, the financial statements present investment returns received from underlying investments (received out of investment entity net cash flows).
Investment originationThe Investment Advisor plays a key role in identifying, developing and originating investment opportunities that meet the Company’s requirements and putting these forward to the Board of Directors for initial consideration and, where appropriate, final approval. These opportunities may lead to the Company investing in such projects and/or acquiring investments from associates of the Investment Advisor. Where investments are acquired from associates of the Investment Advisor, such investment consideration is undertaken in accordance with detailed procedures designed to ensure the fair treatment of the Company and to ensure the valuation is approved independently by a suitably experienced third party valuer. More details are set out in the Corporate Governance Report.
Where associates of the Investment Advisor undertake project origination and development activity (e.g. bidding for new primary projects) they do so at their own risk and bear the risks of lack of success and associated abortive costs (which on large projects can be substantial). The Company does however have a contractual right of first look at such investment opportunities either on financial close or, if originally invested in by an associate of the Investment Advisor, upon disposal of that investment. Following success in project origination and development activity, fees and costs will in the normal course be payable on financial close of the opportunity to a range of service providers (including associates of the Investment Advisor) relating to matters such as reimbursement of bid costs, and in respect of legal, technical, development and financial advisory work. For the avoidance of doubt, such amounts are not paid by the Company but by the project entity formed to carry on that project and any such amounts form part of the overall capital or project costs bid and agreed with the public sector (and are thus outside the Company’s control). The Company’s projected investment return from any prospective investment is calculated after taking account of all such costs.

14 INTERNATIONAL PUBLIC PARTNERSHIPS Annual Report and Financial Statements 2013
Differentiation of Operating ModelThe operational structure of the Company and the investment entities it invests in and through is designed to align the interests of those entities with the Company. The Company’s preferred operational structure and the structure of the Investment Advisor and its associates (acting as investment advisor, operator and asset manager) effectively extends the Board’s oversight to the underlying asset management and finance teams enabling it to be an active rather than a passive investor.
The Investment Advisor and its associates employ more than 70 personnel, the majority to support the Company and its investment entities in the provision of financial and asset management services. This operating model contrasts with those who have tended to employ smaller teams, instead, outsourcing some, or all, such services (often to associates of the construction/facilities management firms providing those services to the investment entities).
The Company believes its operating structure differentiates it within the market and provides it with greater control of the performance of its underlying investments (for example management of lifecycle cost risk or control of contract variations), as the Investment Advisor acts on its behalf, managing the day-to-day issues and interfaces between public sector client and subcontractor supply chain partners. This enables the Company, without additional cost, to:
> De-risk the investment entity through managing the pass-down of risk to subcontractor supply chain
> Oversee service and availability level > Have greater confidence in the deliverability of forecast cash
flow > Enhance returns through hands-on management of
contractual variations and additional service requirements > Align day-to-day operational management, financial
management, tax and accounting, issue resolution and contract management with investment objectives (not just board representation)
> Avoid conflicts of interest between asset and finance management and the subcontractor supply chain
The Company’s operating model is also differentiated through the capability of the Company’s Investment Advisor to originate new primary market transactions which provide the Company with access to off-market opportunities not afforded to other infrastructure investment funds. These opportunities typically take three years or more to gestate and are regularly reviewed between the Company and its Investment Advisor. Under the terms of the Investment Advisory Agreement the Company has a right of ‘first look’ at investments fitting its investment mandate that are being realised by Amber. The access that the Company has had to such ‘primary’ opportunities (alongside the access that the Company has, in common with other funds, to ‘secondary’ opportunities) broadens the Company’s opportunity set for new investments. This allows the Company to benefit from:
> Primary investment opportunities developed with the Company’s long-term strategy and objectives in mind
> A greater ability to structure new projects to meet returns and inflation linkage requirements
> Transactions structured to be low risk based on direct asset management and contract management experience
> Experienced finance, accounting, legal, construction and facilities management expertise familiar with developing new investments and managing them. This leads to the ability to perform due diligence analysis on investments offered for sale in the secondary market based on greater hands-on experience
> Access to senior debt as well as equity and subordinate debt investment opportunities
Operating Model continued

INTERNATIONAL PUBLIC PARTNERSHIPS Annual Report and Financial Statements 2013 15
Com
pany O
verviewH
ighlights C
hairman’s
LetterS
trategic R
eport
Corporate
Governance
Financial S
tatements
Private Public Partnerships/Private Finance InitiativePrivate Public Partnerships (‘PPP’) and projects procured in the UK under the Private Finance Initiative (‘PFI’) regime typically have the following characteristics although individual transactions may exhibit some variations. Offshore transmission assets have similar characteristics but to date have been acquired by the Company with all construction works complete at the time of investment.
> Open competitive process to appoint infrastructure provider > Concession contracts or licence based long-term revenue > Income based on availability of the infrastructure asset and
provision of services to specification with deductions for poor performance/availability
> Income fully or partially linked to inflation > Procured by the public sector as a purchaser of services – the
public sector determines the performance standards it requires (e.g. number and area of classrooms, standard of cleanliness etc) but does not determine how this is achieved
> The public sector passes substantially all the risks associated with cost overruns or construction delay to the Investment Entity, which in turn passes these on to construction/facilities management firms (subject to liability caps); or puts in place suitable insurances to manage its own exposure
> The asset manager is the party responsible for managing the interface between the various parties for the benefit of the investment entity
Case Study – Investment Characteristics
Illustrative PFI/PPP structure
Highly predictable long-term return through shareholder loans and dividends
Contract for operations and maintenance. Typically fixed term plus some five year repricing (pass through to client)
Contractor makes up loss for poor performance
Facilities Management Contractor
Fixed term fixed rate financing (or variable with interest rate swap to fix)
Financing non-recourse to rest of the Group or other investment entities
Debt Providers
Fixed price turn-key construction contract
Damages to Investment Entity for loss of revenue for delay in completion
Construction Contractor
Revenue fixed plus inflation (subject to operations and maintenance re-pricing)
Calculated to cover all costs, financing and investor return
Public Sector Client
Investment Entity
Investor Returns
During construction, equity investment, shareholder loans and senior loans are used to finance construction activity, relevant insurances and entity administration costs. Once the infrastructure asset is available for use, the investment entity receives revenues from the public sector.
During the operational phase, the investment entity makes payments for the provision of operations and maintenance services by facilities management companies and pays insurance premiums.
PPP/PFI entities generally do not have their own employees. Instead a sub-contracted asset manager is normally engaged to provide financial and physical management of the asset and act as the key interface between stakeholders and contracting parties.
The asset manager role is often performed by an associate of the construction company or facilities management company although in projects where the Company invests this role is usually performed by an associate of the Investment Advisor which serves to reduce conflicts of interest and increase alignment between the Company and its Investment Advisor.
Within a PFI/PPP project the breakdown of project costs in the operational stage will vary depending on the nature of the services required (e.g. a school typically being less service intensive than a hospital) but in a typical school PFI project approximately 62% of project revenues are applied to financing (both debt and equity), about 31% to services (building maintenance, cleaning, lifecycle replacements) and approximately 7% to other costs such as insurance etc.
PFI/PPP typical costs
> Revenues are received for asset availability and related performance, calculated to cover costs and investor returns
> Cost risks are largely mitigated through insurance and sub-contract arrangements
> The Asset Manager manages all interfaces for the benefit of the Investment Entity (which does not have its own employees) and its investors
■ Financing 62%■ Facilities Management 31%■ Other costs 7%
Costs breakdown1
1 Illustrative example of UK PFI accommodation investment

16 INTERNATIONAL PUBLIC PARTNERSHIPS Annual Report and Financial Statements 2013
2013 Financial and Operating Review
Key Performance IndicatorsThe Company has identified ten priorities to assist in meeting its Key Objectives. In order to assess annual performance in meeting these objectives the Company will semi-annually review its
performance against the following key performance indicators (‘KPIs’). The KPIs and the relative performance for the 2013 financial year is summarised below and further details of each of these elements are provide in the sections that follow:
Key Objectives Key Performance Indicator 2013 PerformancePage Reference
Investor Returns
Deliver sustainable long-term returns to shareholders
18–24
> Focus on providing shareholders with predictable, and where possible growing dividends
> Maintain and enhance distributions to shareholders
> Achieved targeted fully covered cash dividend of 6.15 pence/share, a 2.5% increase on 2012 dividend
> Obtain significant inflation – linkage in revenues
> Increase or sustain degree to which portfolio revenues are linked to inflation
> Significant degree of inflation linkage within the portfolio – 0.81% p.a. increase in projected return for a 1% increase over anticipated portfolio average inflation (2012: 0.81%p.a.)
> Deliver capital value enhancement where possible
> Total shareholder return > Achieved. The total shareholder return since IPO is 78.6%
> NAV and NAV p/share > NAV of £935.4 million and NAV per share of 123.0 pence/share
Strategic Priorities Key Performance Indicator 2013 PerformancePage Reference
Active Asset Management
1. Focus on delivery of anticipated returns from existing investments
24
> Actively manage investments to ensure that they meet financial and other targets
> Availability for all controlled investments at 98% or above
> Returns from investments in line with expectations
> Achieved
> Met 2013 net revenue generation and dividend goals
2. Maintain high levels of public sector satisfaction and asset performance
> Performance deductions below 3% for all projects
> Achieved 24–25
3. Deliver additional capital value from existing assets through management of construction risk and delivery of operational improvements to meet client requirements
> Number of change requests from existing contracts
> Management of investments in the course of construction projects in line with overall delivery timetable
> Around 700 variation requests representing £9 million of the additional capital investment at the project level
> Continued on time build-out of two construction projects, Royal Children’s Hospital and Gold Coast Light Rail in Australia
> Working through defects rectification period on three projects, Liverpool Library and Moray Schools in the UK and Diabolo Rail project in Belgium in line with expectation
25
Investment Policies and Objectives
Strategy Operating Model
2013 Financial and Operating Review
Principal Risks and Mitigation
Outlook

INTERNATIONAL PUBLIC PARTNERSHIPS Annual Report and Financial Statements 2013 17
Com
pany O
verviewH
ighlights C
hairman’s
LetterS
trategic R
eport
Corporate
Governance
Financial S
tatements
Strategic Priorities Key Performance Indicator 2013 PerformancePage Reference
Value-focused Portfolio Development
4. Through relationships with co-shareholders and pre-emptive rights, where applicable, increase individual investment holdings to 100% where beneficial
> Value enhancing follow-on investments made
> An additional investment in Diabolo Rail project of £28.0 million (100% risk capital owned post transaction)
> An additional investment in Alberta Schools project in Canada of £7.5 million (100% risk capital owned post transaction)
> Further £1.0 million follow-on investment made in a UK schools PPP project procured under the Building Schools for the Future framework
27
5. Make additional acquisitions where they can be acquired on or off market at prospective returns that are beneficial in risk/return terms
> Value of additional investments acquired off-market
> As above. All investments in the year were acquired outside secondary market auction processes
27
6. Enhance prospects for capital growth by investing in construction phase assets where available
> Number of investments in construction > Progressed an offer to acquire a construction phase PPP project, a governmental building in Germany, which was acquired since the year end
27
7. Identify complementary investment sectors within the Company’s investment policy offering better returns with a similar risk profile
> Value of investments in complementary investment sectors
> Continued to progress a preferred bidder opportunities within the offshore transmission sector. The preferred bidder position is expected to be invested in 2014
27
8. Take advantage of infrastructure opportunities internationally where investments have an appropriate risk profile and contractual structures are reliably enforceable to enhance diversification
> Number of new opportunities in international markets
> During the year, additional investment of £35.5 million made in projects in Belgium and Canada
27
9. Undertake continuing review of portfolio composition to ensure suitable blend of risk/return, inflation linkage, yield versus capital characteristics, level of diversification and opportunistic enhancements
> Improvement of risk/return, inflation linkage, return, diversification characteristics
> Realisation of strategically insignificant stakes at prices in excess of carrying value progressed during 2013 and with £18.8 million divestment agreed in early 2014
27
Efficient Financial Management
10. Provide efficient management of cash holdings and debt facilities available for investment and appropriate hedging policies
> Dividends paid to investors covered by operating cash flow
> New investments made from available cash (after payment of dividend) in priority to use of corporate debt
> Competitive cash deposit rates
> Use of appropriate hedging strategies
> Dividends paid to investors 1.3 times covered by net operating cash flow1
> All investments in the period made from available cash funds
> Benchmarked market cash rates and reallocated based on risk/returns profile
> £42.5 million of foreign exchange forward contracts reset during the period
27
1 Cash dividends to shareholders are paid from net operating cash flow (including financing costs) before one off operating costs.
The information required to be included in the Strategic Report relating to environmental and social matters is set out in the CorporateGovernance Report on pages 42 to 43.

18 INTERNATIONAL PUBLIC PARTNERSHIPS Annual Report and Financial Statements 2013
20072006 2008 2009 2010 2011 2012 2013
60
% change
50
40
20
10
0
-10
-20
-30
-40
-50
-60
30
FTSE 250 FTSE All-Share INPP NAV INPP Source: Bloomberg
!
!!!!!!!!
FTSE 250
Share
INPP share price
INPP NAV
Performance against key objectives during the year – Investor Returns
Profits and DistributionsProfit before tax was £56.1 million (2012 restated: £68.4 million) with earnings per share of 7.82 pence (2012 restated: 11.28 pence).
Returns from portfolio investments in the year was £77.2 million (2012 restated: £81.4 million) included fair value movements, dividends and interest. These returns were offset by operating expenses (including finance costs) of £25.3 million (2012 restated: £13.6 million), of which £11.9 million (2012: £2.1 million) was non-recurring. Non-recurring costs included an £11.0 million incentive fee to the Investment Advisor (2012 restated: £nil). 60% of this fee was settled in shares.
These results allowed the Company to deliver the fully-covered dividend of 6.15 pence per share for the year (2012: 6.0 pence per share), an increase of 2.5% over the prior year.
Total Shareholder ReturnThe Company’s Total Shareholder Return (‘TSR’) (share price growth plus reinvested distributions) for investors since the initial public offer of the Company in November 2006 to 31 December 2013 has been 78.6%, compared to a total return on the FTSE All-Share index over the same period of 47.4%1. The Company has exhibited relatively low levels of volatility compared to the market, as evidenced by the graph below which plots the Company’s share price since IPO against the price performance of the major FTSE indices and the Company’s NAV.
INPP Share Price Performance
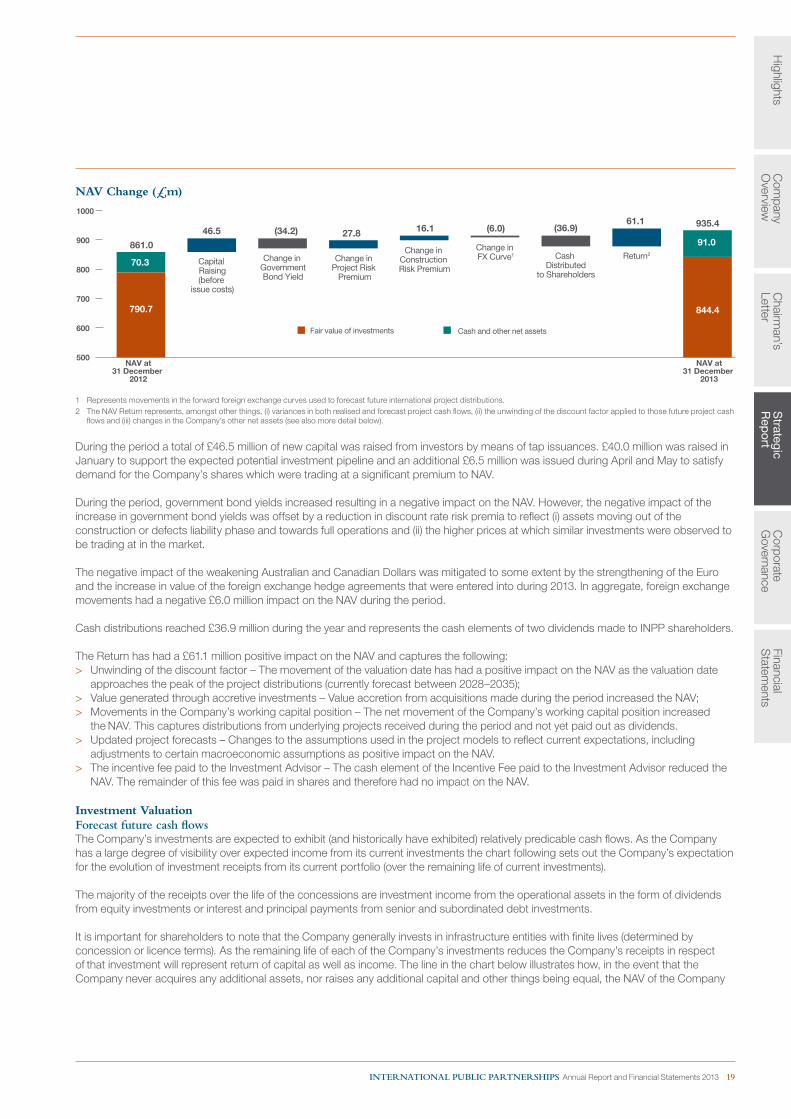
Net Asset ValuationThe Company reported an 8.6% increase in NAV, up to £935.4 million at 31 December 2013 from £861.0 million at 31 December 2012. This represented an increase of 1.7% of NAV per share, increasing to 123.0 pence per share at 31 December 2013 from 121.0 pence per share at 31 December 2012.
The build-up of NAV is derived from a discounted cash flow calculation to determine the fair value of investments plus the value of cash and other net assets held within the Company’s consolidated group.
The key drivers of the change to the NAV between 31 December 2012 and 31 December 2013 are highlighted in the graph overleaf and described in more detail below.
2013 Financial and Operating Review continued
1 Bloomberg – share price appreciation plus income.
INTERNATIONAL PUBLIC PARTNERSHIPS Annual Report and Financial Statements 2013 19
Com
pany O
verviewH
ighlights C
hairman’s
LetterS
trategic R
eport
Corporate
Governance
Financial S
tatements
NAV Change (£m)
Capital Raising(before
issue costs)
Change in Project Risk
Premium
Change in GovernmentBond Yield
1000
900
800
700
600
500
861.0
70.3
790.7
46.5 (34.2) 27.8 16.1 (6.0) (36.9)61.1 935.4
91.0
844.4
NAV at31 December
2012
NAV at31 December
2013
Change in Construction Risk Premium
Change in FX Curve1 Return2Cash
Distributedto Shareholders
Fair value of investments Cash and other net assets
1 Represents movements in the forward foreign exchange curves used to forecast future international project distributions.2 The NAV Return represents, amongst other things, (i) variances in both realised and forecast project cash flows, (ii) the unwinding of the discount factor applied to those future project cash
flows and (iii) changes in the Company’s other net assets (see also more detail below).
During the period a total of £46.5 million of new capital was raised from investors by means of tap issuances. £40.0 million was raised in January to support the expected potential investment pipeline and an additional £6.5 million was issued during April and May to satisfy demand for the Company’s shares which were trading at a significant premium to NAV.
During the period, government bond yields increased resulting in a negative impact on the NAV. However, the negative impact of the increase in government bond yields was offset by a reduction in discount rate risk premia to reflect (i) assets moving out of the construction or defects liability phase and towards full operations and (ii) the higher prices at which similar investments were observed to be trading at in the market.
The negative impact of the weakening Australian and Canadian Dollars was mitigated to some extent by the strengthening of the Euro and the increase in value of the foreign exchange hedge agreements that were entered into during 2013. In aggregate, foreign exchange movements had a negative £6.0 million impact on the NAV during the period.
Cash distributions reached £36.9 million during the year and represents the cash elements of two dividends made to INPP shareholders.
The Return has had a £61.1 million positive impact on the NAV and captures the following: > Unwinding of the discount factor – The movement of the valuation date has had a positive impact on the NAV as the valuation date
approaches the peak of the project distributions (currently forecast between 2028–2035); > Value generated through accretive investments – Value accretion from acquisitions made during the period increased the NAV; > Movements in the Company’s working capital position – The net movement of the Company’s working capital position increased
the NAV. This captures distributions from underlying projects received during the period and not yet paid out as dividends. > Updated project forecasts – Changes to the assumptions used in the project models to reflect current expectations, including
adjustments to certain macroeconomic assumptions as positive impact on the NAV. > The incentive fee paid to the Investment Advisor – The cash element of the Incentive Fee paid to the Investment Advisor reduced the
NAV. The remainder of this fee was paid in shares and therefore had no impact on the NAV. Investment ValuationForecast future cash flowsThe Company’s investments are expected to exhibit (and historically have exhibited) relatively predicable cash flows. As the Company has a large degree of visibility over expected income from its current investments the chart following sets out the Company’s expectation for the evolution of investment receipts from its current portfolio (over the remaining life of current investments).
The majority of the receipts over the life of the concessions are investment income from the operational assets in the form of dividends from equity investments or interest and principal payments from senior and subordinated debt investments.
It is important for shareholders to note that the Company generally invests in infrastructure entities with finite lives (determined by concession or licence terms). As the remaining life of each of the Company’s investments reduces the Company’s receipts in respect of that investment will represent return of capital as well as income. The line in the chart below illustrates how, in the event that the Company never acquires any additional assets, nor raises any additional capital and other things being equal, the NAV of the Company

20 INTERNATIONAL PUBLIC PARTNERSHIPS Annual Report and Financial Statements 2013
2013 forecast income Forecast NAV
INPP Projected Cash Flow Pro�le
0
200
400
600
800
1,000
0
20
40
60
80
100
120
140
2014
2015
2016
2017
2018
2019
2020
2021
2022
2023
2024
2025
2026
2027
2028
2029
2030
2031
2032
2033
2034
2035
2036
2037
2038
2039
2040
2041
2042
2043
2044
2045
2046
2047
NPV £m£m Income Phase Capital Repayment Phase
would reduce to zero over time. It should however equally be recognised that any future acquisitions (or disposals) or changes to the projected cash flows of any investment (or the assumptions upon which they are based) will change this projection from time to time (although it can be expected to retain the same general amortising profile).
Note: There are many factors that may influence the actual achievement of long-term cash flows to the Company. These include both internal as well as external factors and investors should not treat the chart above as being more than an indicative profile and not a projection, estimate or profit forecast. The actual achieved profile will almost certainly be different and may be higher or lower than indicated.
Macroeconomic assumptionsThe Company reviews the macroeconomic assumptions underlying its forecasts on a regular basis and, following a thorough market assessment during the period, certain adjustments have been made to some of the assumptions used to derive the Company’s portfolio valuation. The Company anticipates that the greater detail provided below on key macroeconomic assumptions by jurisdiction should enhance transparency and allow investors to better assess the Company’s performance.
The key assumptions used as the basis for deriving the Company’s portfolio valuation are summarised in the following table and further details are provided in note 13 in the financial statements. Across the portfolio the weighted average inflation assumption as at 31 December 2013 was 2.52% (2012: 2.50%) and the weighted average deposit rate assumption was 3.47% (2012: 3.20%). Refer to the Net Asset Valuation Section above for further details on the impact of these assumptions on the valuation during the period.
Variable Basis 31 December 2013 31 December 2012
Inflation UK (RPI) Australia (CPI)
Europe (CPI)Canada (CPI)
2.75%2.50%2.00%2.00%
2.50% average across the portfolio
Deposit Rates UKAustralia
EuropeCanada
3.50%1 4.50% 3.00% 3.00%
3.20% long-term average future deposit rate across
the portfolio
Foreign exchange GBP/CADGBP/AUDGBP/EUR
1.782.011.16
1.681.741.21
Tax Rate UK Australia
EuropeCanada
20%2 30%
Various (no change)Various (no change)
23%30%
VariousVarious
1 The portfolio valuation assumes UK deposit rates range from 0.5% to 1.0% p.a. to 2017 and 3.5% thereafter.2 The corporation taxation rate will reduce by 2% to 21% from 1 April 2014 with a further reduction to 20% from 1 April 2015.
2013 Financial and Operating Review continued

INTERNATIONAL PUBLIC PARTNERSHIPS Annual Report and Financial Statements 2013 21
Com
pany O
verviewH
ighlights C
hairman’s
LetterS
trategic R
eport
Corporate
Governance
Financial S
tatements
Discount ratesThe discount rate used for valuing each investment is based on the appropriate long-term Government Bond rate and a risk premium. The risk premium takes into account risks and opportunities associated with each project (including location, phase of operation/construction etc).
The majority (82%) of the Company’s portfolio is invested in the ‘risk capital’ (equity and subordinated debt) of the underlying investments. 18% of the portfolio is invested as senior debt where the Company also holds the risk capital. Previously, senior debt was eliminated on consolidation within the Company’s consolidated financial statements. Following the adoption of IFRS 10 – Investment Entity consolidation exemption, such senior interests are recorded at fair value. For consistency with the valuation approach taken in the financial statements, the Company now publishes both a risk capital weighted average discount rate and a new portfolio weighted average discount rate across all investments including senior debt interests. It is important to note that this additional disclosure does not impact the overall NAV of the Company.
The current discount rates used by the Company are given in the table below. These rates need to be considered against the assumptions and projections upon which the Company’s anticipated cash flows are based.
The average blended discount rates need to be interpreted with care. In the Company’s view they are relevant only in the context of the cash flows (and cash flow assumptions) they are applied to in calculating the fair value of investments. Comparison of discount rates between investment portfolios or funds is only meaningful if there is a comparable level of confidence in the quality of forecast cash flows (and assumptions) rates are applied to; the risk and return characteristics of different investment portfolios are understood; and the depth and quality of asset management employed to manage risk and deliver expected returns are identical across the compared portfolios.
Metric31 December
201330 June
201331 December
2012
Movement 31 December
2012–31 December
2013
Weighted Average Government Bond Rate (Nominal) – portfolio basis – risk capital and senior debt 3.46% 3.02% 2.87% 0.59%
Weighted Average Project Premium over Government Bond Rate – risk capital and senior debt (Nominal) 4.26% 4.68% 4.89% (0.63%)
Weighted Average Discount rate – Portfolio basis – risk capital and senior debt 7.72% 7.70% 7.76% (0.04%)
Weighted Average Discount rate – risk capital only1 8.20% 8.19% 8.30% (0.10%)
NAV per share 123.0p 121.5p 121.0p 2.0p1 Risk capital is equity and subordinated debt investments.
The change in the weighted average discount rate in the period is principally due to reductions in the discount rate risk premia to reflect (i) assets moving out of the construction or defects liability phase and towards full operations and (ii) the higher prices at which similar investments were observed to be trading at in the market. The effect of these two adjustments was, to some extent, offset by an increase in the weighted average government bond yield over the period. Government bond ratesIn the table above the Company has provided an analysis of the weighted average government bond rate used in calculating the discount rate. It should be noted that the nominal (i.e. non-inflation linked) bond rate has been used in this calculation. The Company considers, however, that investors may also find a comparison with inflation adjusted government bond rates helpful. This is the case due to the significant level of inflation linkage inherent in the Company’s anticipated cash flows.
The table below details the nominal government bond rates used in certain key jurisdictions where the Company is active. Taken together, on a weighted average basis, these lead to the nominal portfolio bond rate of 3.46% shown above. If real (i.e. inflation adjusted) bonds were to be used instead, the indicative real rates are shown below. On a weighted average basis this would lead to a ‘real’ portfolio rate of 0.53% with the difference between the ‘real’ and ‘nominal’ rates being the implied rate of inflation, which are generally higher than those currently being assumed in the Company’s estimate of NAV. While this information may be useful to investors wishing to approximate comparisons in the projected return of the Company in comparison with that available from government index linked bonds, this should be done with care and any such comparison can only be an estimate due in part to the facts that the linkage of the Company’s cash flows to inflation is imperfect and the Company’s cash flows already assume a core level of inflation as set out in the section headed Macroeconomic assumptions on page 20.

22 INTERNATIONAL PUBLIC PARTNERSHIPS Annual Report and Financial Statements 2013
–9.9 11.6
Impact of Changes in Key Macroeconomic Variables to 31 December 13 Nav of 123.0 per Share
■ – change ■ + change Pence per share
Discount rates +/–1%
In�ation +/–1%
Foreign Exchange +/–10%
Deposit rates +/–1%
Tax rates +/–1%
–7.8 8.6
–3.8 4.7
–1.8 1.8
–0.8 0.9
-15 -12 -9 -6 -3 0 3 6 9 12 15
31 December 2013 31 December 2012 Movement (2012–2013)Country Nominal Real Nominal Real Nominal Real
UK 3.34% 0.01% 2.64% (0.02%) 0.70% 0.03%
Australia 4.48% 1.91% 3.45% 0.93% 1.03% 0.98%
Europe1 3.39% 1.32% 3.31% 1.19% 0.08% 0.13%
Canada 3.03% 0.96% 2.31% 0.13% 0.72% 0.83%
Portfolio weighted average 3.46% 0.53% 2.87% 0.37% 0.59% 0.16%1 Includes Belgium, Germany, Ireland, France and Italy. Note estimates only for Belgium and Ireland as no index lined bonds available.
Portfolio level assumptions underlying NAV calculationThe Company is aware that there are subtle differences in approach to the valuation of portfolios of investments among different infrastructure funds. To clarify the Company’s position in this regard its key cash flow inputs and broad valuation principles include:
> That key macroeconomic variables (outlined in the section above) continue to be applicable > That the contracts under which payments are made to the Company and its subsidiaries remain on track and are not terminated
before their contractual expiry date > That deductions suffered under such contracts are fully passed down to subcontractors > That where possible lifecycle costs are not borne by the Company but are passed down to a third party such as a facilities
management contractor > That cash flows from and to the Company’s subsidiaries and the infrastructure asset owning entities in which it has invested will be
made and are received at the times anticipated > That where assets are in construction they are either completed on time or any costs of delay are borne by the contractors not the
Company > That where the operating costs of the Company or the infrastructure asset owning entities in which it has invested are fixed by
contract such contracts are performed, and where such costs are not fixed, that they remain within projected budgets > That where the Company or the infrastructure asset owning entities in which it has invested owns the residual property value in the
asset that the projected amount for this value is realised > That where assets in which the Company invests are not GBP assets that foreign exchange rates remain consistent with current four
year forward looking projections
Sensitivities for key macroeconomic assumptions and discount ratesThe Company’s NAV is based on the factors outlined above. The Company has also provided sensitivity analysis showing an indication of the impact on NAV per share from changes in macroeconomic assumptions and discount rates, as set out below. Further details can be found in note 13 in the financial statements. This analysis is provided as an indication of the likely impact of these variables on the NAV per share on the basis that they apply uniformly across the portfolio whereas in practice the impact is unlikely to be uniform. These sensitivities should be used only for general guidance and not as accurate predictors of outcomes.
2013 Financial and Operating Review continued

INTERNATIONAL PUBLIC PARTNERSHIPS Annual Report and Financial Statements 2013 23
Com
pany O
verviewH
ighlights C
hairman’s
LetterS
trategic R
eport
Corporate
Governance
Financial S
tatements
Discount ratesThe Company’s approach to determining the discount rate is described in detail above. Assuming all other things are equal, a reduction of 1% to the underlying project discount rates would increase the 31 December 2013 NAV per share by 11.6 pence. Should the underlying project discount rates increase by 1% the NAV per share would decrease by 9.9 pence.
InflationIn an environment where investors are increasingly focused on achieving real rates of return on their investments, inflation protection is an important consideration for the Company. At 31 December 2013 the majority of assets in the portfolio had some degree of inflation linkage and, in aggregate, the weighted average return of the portfolio can be expected to increase by 0.81% for a 1% inflation increase across the portfolio over currently assumed rates.
Where actual inflation is higher or lower than the assumed levels, it can be expected to impact on the Company’s actual future cash flow in a correspondingly positive or negative manner other things being equal. If the underlying project inflation rates were to increase by 1% there would be an 8.6 pence increase to the NAV per share, conversely, if the rates were to decrease by 1% there would be a 7.8 pence decrease to the NAV per share.
Foreign exchange The Company has a geographically diverse portfolio and therefore GBP revenues are subject to foreign exchange rate risk. Should the assumed exchange rates increase by 10% this would lead to a 4.7 pence increase in the NAV per share while a 10% reduction in the exchange rates would result in a 3.8 pence decrease in NAV per share.
Deposit ratesThe long-term weighted average future deposit rate across the portfolio is 3.47% per annum. While operating cash balances tend to be low given the structured nature of the investments, project finance structures typically include reserve accounts to mitigate certain costs and therefore variations to deposit rates may impact the portfolio. All else being equal, a 1% increase in the underlying deposit rates would lead to a 1.8 pence increase in the NAV per share and a 1% decrease in deposit rates would lead to a 1.8 pence reduction in the NAV per share.
Tax ratesThe Company has a geographically diverse portfolio and therefore post-tax investment cash inflows are impacted by tax rates across all relevant jurisdictions. Should the assumed tax rates increase by 1% this would lead to a 0.8 pence decrease in the NAV per share while a 1% reduction in the tax rates would result in a 0.9 pence increase in NAV per share.
Future tax group reliefUnder UK tax group loss relief rules, losses within the UK group companies can be, subject to UK tax law, offset against taxable profits in other UK group companies (including project entities formerly part of the UK group). This group tax loss relief can reduce the overall tax charge across the portfolio and potentially reduce taxable profits substantially below the levels currently modelled by the Company. The Company has taken a conservative approach to the valuation of future tax losses and, to date, has not incorporated these into the NAV. Cash flow movements in the period
Summary of consolidated cash flow
Year to 31 December 2013
£ million
Year to 31 December 2012
£ million
Opening cash balance 65.8 14.1Cash from investments 59.7 62.5Operating costs (recurring) (11.7) (9.4)Net financing costs (0.5) (1.0)
Net cash before one off operating costs 47.5 52.1
One-off operating costs (5.4) (2.1)
Net cash flow from operations 42.1 50.0
Cost of new investments (36.5) (146.6)Proceeds of capital raisings (net of costs) 46.1 196.9Distributions paid (36.9) (30.5)Repayment of borrowings – (18.1)
Net cash at period end 80.6 65.8
The Company’s net cash at 31 December 2013 was £80.6 million (2012: £65.8 million), an increase of £14.8 million.

24 INTERNATIONAL PUBLIC PARTNERSHIPS Annual Report and Financial Statements 2013
Cash inflow from the Company’s investment portfolio was £59.7 million (2012: £62.5 million). In both the current and preceding years, cash generation from the underlying investment portfolio was in line with forecast, with the change in the period reflecting the timing of receipt of distributions from underlying investments.
Ongoing operating costs of £11.7 million (2012: £9.4 million) are categorised in the ‘Ongoing Charges’ table below. One-off operating costs of £5.4 million (2012: £2.1 million) represent new acquisition transaction costs and the cash portion of the incentive fee paid to the Investment Advisor in 2013.
Dividends paid in the period of £36.9 million (2012: £30.5 million) were in respect of the six month periods ended 31 December 2012 and 30 June 2013 respectively.
Ongoing chargesA breakdown of ongoing operating costs paid is provided below. Further details can be found in notes 7 to 9 of the financial statements.
Corporate Expenses
Year to 31 December 2013
£ million
Year to 31 December 2012
£ million1
Management fees (10.6) (8.1)Audit fees (0.1) (0.1)Directors’ fees (0.2) (0.2)Other running costs (0.8) (1.0)
Operating costs (ongoing) (11.7) (9.4)1 The 2012 balance has been restated to reflect the IFRS10 consolidated expenses (previously reported ongoing charges in 2012 were £9.8 million).
The increase in management fees paid to the Investment Advisor is in line with the growth in managed investments and the growth of theCompany’s portfolio.
Ongoing Charges
Year to 31 December 2013
£ million
Year to 31 December 2012
£ million
Annualised Ongoing Charges1 (11.7) (9.4)Average NAV2 905.9 774.7
Ongoing Charges (1.29%) (1.21%)1 The Ongoing Charges ratio was prepared in accordance with the Association of Investment Companies’ (‘AIC’) recommended methodology, noting this excludes non-recurring costs. The
2012 balance has been restated to conform to the IFRS 10 grouping (the previously reported full consolidated ongoing charges in 2012 was £9.8 million).2 Average of published NAVs for the relevant period.
Performance against Strategic Priorities – Active Asset Management
Delivery of Expected Returns from the Existing PortfolioInvestment cash flow from the Company’s portfolio of 122 investments has continued to perform in line with the Company’s forecasts. Ensuring that the Company’s assets are available for use and are performing in accordance with contractual expectations is a critical task for the Company and its service providers.
The Investment Advisor, on behalf of the Company, closely monitors any availability and performance failures at a subcontractor level and works with these service providers to mitigate the risk of deductions. As an example, on the Orange & Associated Health Services PPP, Australia, the performance levels (judged through the scoring system utilised to establish payment deductions) were improved by over 50% in 2013. This was achieved by working with the service provider to identify repeat failures and determine how these could be avoided through different methods of service delivery and also by focusing on accurate and timely reporting of services delivery.
Maintain High Levels of Public Sector Satisfaction and Asset PerformanceThe Company takes an active role in assisting its public sector clients to achieve savings from existing concession arrangements. During the period the Investment Advisor became a signatory to the Code of Conduct for Operational PFI/PPP Contracts developed in the UK by HM Treasury. The Code is voluntary and assists in identifying and delivering efficiencies and savings in operational PFI and PPP contracts.
2013 Financial and Operating Review continued

INTERNATIONAL PUBLIC PARTNERSHIPS Annual Report and Financial Statements 2013 25
Com
pany O
verviewH
ighlights C
hairman’s
LetterS
trategic R
eport
Corporate
Governance
Financial S
tatements
At a project level the Investment Advisor works with the public sector counterparty to ensure the contractual agreed benchmarking of services and insurance are effectively delivered. This approach saw considerable savings delivered to the public sector clients during the year where, for example, insurance savings were achieved on the Derby Schools 2 and Moray Schools projects and in relation to Diabolo Rail project in Belgium. In addition, the Investment Advisor has also been able to assist its public sector clients generate additional income from third party lettings. This was achieved on the Derby and Northampton schools projects in extending the letting of the school facilities for private use outside school hours.
Key milestones were achieved in several of the Company’s projects that were previously under construction: during the period HRH Prince Edward, Earl of Wessex officially opened the Liverpool Central Library; and the Diabolo Rail Project received a European Rail Award recognising its role in reducing congestion within the Belgium rail system. It is a measure of the significance of many of the Company’s facilities to their communities that they have been recognised in this way.
Deliver Additional Capital Value from Existing AssetsDuring 2013 our public sector clients commissioned c.700 variations resulting in over £9 million of additional works at the project level. All variations were overseen by the Investment Advisor as part of the day-to-day asset management activities it undertakes in conjunction with the project facilities manager and the public sector client. Variations ranged in size from a few hundred pounds to over £2 million and demonstrate the value and flexibility of PFI/PPP contracts to respond to the changing requirements of public sector clients.
The day-to-day management of interfaces between the client, investors and construction partners is also of importance in relation to investments in the course of construction. For instance, the Gold Coast Rapid Transit project which, at the beginning of 2013, was some four weeks behind schedule is now due for completion at its original completion date of May 2014. Valuation benefits from successful completion of the construction and defects correction phases of these projects and other construction projects recently completed are expected to continue to be realised in 2014 and 2015 as sustained operational performance is demonstrated. All construction currently within the portfolio is due to be completed by December 2014 with defects periods completed in 2015. Since 31 December 2013 the Company has increased its investments in construction stage projects as set out in the ‘Value-focused Portfolio Development’ section on page 27.
Projects under construction as at 31 December 2013, all of which are currently on schedule for operational commencement are set out in the table below. Post year end, the Company has increased its investment in construction stage investments as detailed in ‘Value-focused portfolio development’ section below.
Asset LocationConstruction Completion
Date
Defects Completion
Year Status
% of Fair Value of
Investment
Royal Children’s Hospital Australia Phase 1 – September 2011
Phase 2 – December 2014
2015 Phase 1 completed
Phase 2 on schedule
5.2%
Gold Coast Rapid Transit Australia May 2014 2015 On schedule 1.1%
Building Schools for the Future portfolio
UK Various. Latest September 2014
2015 On schedule 0.3%1
1 Estimate based on the number of projects within the BSFI portfolio that were still in construction at 31 December 2013.

26 INTERNATIONAL PUBLIC PARTNERSHIPS Annual Report and Financial Statements 2013
Royal Children’s HospitalProject summaryThe A$1 billion Royal Children’s Hospital Project (‘RCH’) is the largest hospital redevelopment to be undertaken by the State of Victoria. The Hospital is home to three main ‘clinical stakeholders’ – Royal Children’s Hospital, Murdoch Children’s Research Institute, and the University of Melbourne – and the client for the project is the Victorian Minister for Health.
An associate of the Company’s Investment Advisor acts as asset manager and together with its project partners (Lend Lease and Spotless), has been involved with the project since its inception in 2002, with the project reaching financial close in November 2007. The project is being delivered in two stages with the first stage, the construction of a new children’s hospital on the site adjacent to the existing hospital, completed early and on budget in November 2011. Stage 2, which includes the demolition of hospital buildings, construction of a hotel and other retail services, is on schedule to be completed on time in December 2014.
The facility, when completed at the end of Stage 2, will be 230,000m2, housing 357 beds, 2,160 underground car park spaces and a complementary commercial precinct all sitting on 4.1ha of maintained land. RCH’s design is in keeping with its park setting – bringing the park into the hospital and the hospital into the park and the interior fit-out is focused on children, being ‘child friendly’ rather than ‘childlike’.
The new hospital’s design is built on ‘green principles’. For example, the facility achieved a 5 Star Green Star rating against the Healthcare Pilot tool and generates less greenhouse gas emissions, is less energy intense, and uses less water. At its peak the project provided work for 2,100 Victorians and remains a city icon for both delivering quality health care services and design in the State.
Key day to day management interfaceIn addition to financing and redeveloping the RCH the project partners provide, maintain and deliver services to the clinical stakeholders so that they can carry out clinical support, research, educational, training and non-clinical support services. The partners also support the retail offering at the facility.
In order to do this the asset manager takes a proactive approach to managing relationships, both with the client as well as other project partners, and has a senior manager (‘SM’) on site at the hospital in a full time capacity.
As many of the clients’ services are provided 24 hours a day every day of the year, the facility needs to be operational on the same basis. Having a team member on site allows the asset manager to be responsive to any issues that emerge as well as remaining on top of day-to-day management activities. In addition, the SM holds regular formal as well as informal meetings with the contractors on the facility, Lend Lease, to ensure that the project’s building works are being successfully delivered. The SM also works in partnership with Spotless who provide the day-to-day facilities management services to the facility to ensure that client
expectations are met and any failures of the contracted service specifications kept to a minimum.
One of the SM’s key roles is to keep the RCH’s lenders abreast of key developments in order that they can understand progress to date for the construction and the level of service delivery ensuring distributions from the project are paid to the Company in line with expectations.
Examples of active asset management on RCHManagement oversight improving project performanceIn cooperation with Spotless and the client, an amendment was agreed to the method of service delivery in relation to lifts within the building. Given RCH’s size and number of lifts, the recommendation was for a lift engineer to be based on site during business hours rather than attend out of hours or respond from a remote location when issues arose. This solution not only resulted in reduced response times to any faults but also generally more consistent levels of service and reduced overall costs, supporting client relations and protection of investor returns.
Service provider managementPlanning was undertaken with Spotless and the client to ensure that the hospital had the necessary back-up system in the event of a State or city wide power blackout. This back-up system has been tested with detailed electrical ‘Blackstart’ power checks being undertaken with the hospital operator to ensure all switches and power priorities function as they are expected to in the event of power failure, improving robustness of service delivery and protecting returns.
Added valueThe delivery of health care services is heavily impacted by emerging technology and the asset manager has demonstrated its capacity to evolve with the needs of the client. RCH required a multi-million dollar medical imaging magnet on rails to move between an operating theatre and cardiac laboratory. The asset manager facilitated the significant additional design and physical works in support of this new clinical tool, pricing for the necessary design, construction, lifecycle and annual maintenance risk, with the client retaining the clinical equipment risk associated with the imaging equipment.
Added extrasBeing a tertiary teaching hospital for children, Amber has promoted, part funded and manages a range of project enhancements.
These enhancements provide entertainment and a distraction for children and their families while in hospital. These include a permanent home for a colony of meerkats cared for by the Melbourne Zoo; a 110,000 litre salt water aquarium with over 500 tropical fish; free access to first run movies in a fully functional cinema; use of games provided by Museum Victoria.
Case Study – Investment Entity – Active Asset management

INTERNATIONAL PUBLIC PARTNERSHIPS Annual Report and Financial Statements 2013 27
Com
pany O
verviewH
ighlights C
hairman’s
LetterS
trategic R
eport
Corporate
Governance
Financial S
tatements
Performance against Strategic Priorities – Value-focused Portfolio Development
The Company made three acquisitions in 2013 for a total consideration of £36.5 million. All of these were either follow-on investments in existing projects within the existing portfolio or opportunities identified through existing shareholder or framework arrangements:
> Alberta Schools project in Canada – the Company acquired the remaining 25% economic interest in the project for £7.5 million. The Company now owns 100% of the risk capital in this project
> Building Schools for the Future PFI project – a £1.0 million investment was made into additional stakes following the initial investment in 2011
> Diabolo Rail project – the remaining 25% economic interest was acquired from a subsidiary of HSH Nordbank for €33.3 million (£28.0 million). The Company now owns 100% of the risk capital in this project
The Company believes that it is reflective of the quality of its portfolio that ‘self-generating’ additional investments such as these are possible. In a market that is increasingly competitive, these transactions illustrate the value for shareholders that may be obtained by investing in off market transactions, such as those developed from the existing portfolio, rather than through competitive external auction processes.
During the period the Company considered a further 46 potential transactions. Of these, the Company was outbid or did not progress 22, highlighting the level of heightened competition for assets and consequential pricing pressure that has continued to be a feature throughout the past year.
In addition, the Company had previously forecast that it would have been able to invest in the Lincolnshire OFTO during the early stages of 2013 but due to vendor related factors outside of the Investment Advisor’s control it is now targeting investment for later this year.
Since the end of the financial year, on 24 January, the Company acquired a 97% equity interest and 100% of the subordinated debt in a PPP project that will deliver the new headquarters of the Federal German Ministry of Education and Research in Berlin (‘BMBF’). The Ministry provides funding for research projects and institutions and sets general educational policy, including providing student loans, in Germany.
The BMBF interests were acquired from an associate of the Investment Advisor for approximately €11.9 million (£9.7 million). The acquisition process was fully managed in accordance with the Company’s policy on dealing with conflicts of interest in such circumstances, as set out within the Corporate Governance Report. This process included the Company obtaining an independent valuation which valued the asset at a price slightly
2013 Financial and Operating Review continued
higher than the price at which it was acquired. This investment underlines the Company’s ability to access a developed pipeline of international investment opportunities other than through a secondary market auction process. The investment is expected to complete construction in July 2014.
Since 31 December 2013 the Company has also entered into a number of UK schools PFI transactions with respect to Building Schools for the Future (‘BSF’) portfolio. Two investments were made in existing BSF projects:
> The acquisition of 60% of Kier Project Investments’ 80% interest in the Kent BSF (UK PFI schools) project for £6.8 million. When all aspects of the transaction are completed later in 2014 the Company will own 58% of the project
> A follow-on investment of £0.5 million in the Wolverhampton BSF (UK PFI schools) project where the Company had the opportunity to invest on a minority basis. The project involves the design, construction, financing and operation of two high schools in the second phase of the Wolverhampton BSF programme delivered using a PFI structure
In addition, the disposal of minority interests in the Hull, Leeds, Newcastle, Rochdale, Sandwell and Leicester BSF projects have been agreed, with £18.8 million to be realised. The divestments were agreed as the Company had determined that it had no realistic scope to increase its holdings in these particular projects to majority controlling holdings and therefore considered that, based on the price offered; a sale would be in the best interests for the Company. The proceeds of sale are substantially in excess of the price paid for the same stakes on acquisition in August 2011, offering a significant premium to the Company and illustrates the strength of the secondary market for these assets.
Performance against Strategic Priorities – Efficient Financial Management
The Company seeks to generate dividends to investors that are paid from operating cash flow. For the year ended 31 December 2013 the cash dividend paid to investors was 1.3 times covered by net operating cash flow and the Company remains confident that it will be able to grow dividends in the future.
Since the end of the financial year, the Company has renewed its corporate debt facility. On 20 January 2014 the term of the facility was extended until December 2016 on broadly the same terms as the existing facility but with an increase in the size of the facility to £175 million (previously £100 million) in light of a growing trend in the size of investment opportunities available.
It remains the Company’s policy not to have long-term corporate level debt and it is anticipated that to the extent that the corporate facility is drawn to fund acquisitions, this would be a short-term arrangement and equity funding, by means of a capital raising, would be sought to repay outstanding debt as soon as practicable. As at the date of this report, the corporate debt facility was undrawn.

28 INTERNATIONAL PUBLIC PARTNERSHIPS Annual Report and Financial Statements 2013
The key risks affecting the Company and the investment portfolio have not materially changed year to year, largely due to the highly contractual and long-term nature of the investments with similar risk profiles. Changes in the macro-economic environment and broader global regulatory and tax environment can impact on fund returns and are a permanent feature of the risk appraisal process.
The Company’s approach to risk management is set out within the Corporate Governance Report.
The following table summarises the Board’s views on the principal risks and uncertainties for the Company and the relevance of these risks to meeting the Company’s objectives. This is not
intended to highlight all the potential risks to the business. There may be other risks that are currently unknown or regarded as less material which could turn out to be material. Any of these could have the potential to impact the performance of the Company, its assets, capital resources and reputation.
A description of broader risk factors relevant to investors is disclosed in the latest Company prospectus available on the Company’s website www.internationalpublicpartnerships.com.
Whilst the Company has applied mitigation processes as highlighted below it is unlikely that the techniques applied will entirely eliminate the risk.
Risks Description Mitigation/Approach
Macro-economic Risks
Inflation Inflation may be higher or lower than expected. Investment cash flows are positively correlated to inflation therefore increases/decreases to inflation would impact positively or negatively on Company cash flows. Negative inflation (deflation) will reduce the Company’s cash flows in absolute terms.
The Company’s portfolio has been developed in anticipation of continued inflation at or above the levels used in the Company’s valuation assumptions. Where inflation is at levels below the assumed levels investment performance may be impaired. The level of inflation linkage across the investments held by the Company varies and is not consistent. Some investments have no inflation linkage and some have a geared exposure to inflation. The overall impact on the portfolio return from a 1% change of inflation is 0.81%; see pages 19 to 20 for details on the assumptions behind this sensitivity. The consequences of higher or lower levels of inflation than that assumed by the Company will not be uniform across its portfolio. The Company is also exposed to the risk of changes to the manner in which inflation is calculated by the relevant authorities.
The Company monitors the effect of inflation on its portfolio through its twice yearly valuation process and reports on this to investors. The Company also provides sensitivities to investors indicating the projected impact on the Company’s NAV of a limited number of alternative inflation scenarios, offering investors an ability to anticipate the likely effects of some inflation scenarios on their investment.
The Company has actively pursued a strategy of increasing the proportion of its portfolio with inflation linkage.
Foreign Exchange Movements
The Company indirectly holds part of its investments in entities in jurisdictions with currencies other than Sterling but borrows corporate level debt, reports its NAV and pays dividends in Sterling. Changes in the rates of foreign currency exchange are outside the control of the Company and may impact positively or negatively on Company cash flows and valuation.
The Company uses forward foreign exchange contracts to mitigate the risk of short-term volatility in foreign exchange on significant investment returns from overseas investments. These may not be fully effective and rely on the strength of the counterparties to those contracts to be enforceable.
The Company monitors the effect of foreign exchange on its portfolio through its twice yearly valuation process and reports this to investors. The Company also provides sensitivities to investors indicating the projected impact on the Company’s NAV of a limited number of alternative foreign exchange scenarios, offering investors an ability to anticipate the likely effects of some foreign exchange scenarios on their investment.
Principal Risks and Mitigation
Investment Policies and Objectives
Strategy Operating Model
2013 Financial and Operating Review
Principal Risks and Mitigation
Outlook

INTERNATIONAL PUBLIC PARTNERSHIPS Annual Report and Financial Statements 2013 29
Com
pany O
verviewH
ighlights C
hairman’s
LetterS
trategic R
eport
Corporate
Governance
Financial S
tatements
Risks Description Mitigation/Approach
Macro-economic Risks continued
Interest Rates Changes in market rates of interest can affect the Company in a variety of different way:
Valuation Discount RateThe Company, in valuing its investments, uses a discounted cash flow methodology. Changes in market rates of interest (particularly government bond rates) will directly impact the discount rate used to value the Company’s future projected cash flows and thus its valuation. Higher rates will have a negative impact on valuation while lower rates will have a positive impact.
In determining the discount rate used to value the Company’s investments the Company generally uses nominal interest rates. Where the Company’s cash investment inflows are linked to inflation, higher interest rates can often be precipitated by higher inflation expectations, and therefore any inflation linkage may partly mitigate the effect of interest rate changes.
Corporate Debt FacilityThe Company has a corporate level debt facility that may be drawn from time to time. Interest is charged on a floating rate basis, so higher than anticipated interest rates will increase the cost of this facility potentially adversely impacting on cash flow and the Company’s valuation.
In the event that the interest rate increases then the Company has the option of repaying that facility at any time with minimal notice, providing sufficient funds are available.
Cash HoldingsThe Company and underlying investment entities typically chose or can be required to hold various cash balances, including contingency reserves for future costs (such as major lifecycle maintenance or debt service reserves). These are generally held on interest bearing accounts and under the contractual terms applicable to certain investments in many cases are projected to be held for the long term.
The Company assumes that it will earn interest on such deposits over the long term. Changes in interest rates may mean that the actual interest receivable by the Company is less than projected. If the Company receives less interest than it projects this will impact cash flows and NAV adversely.
Interest rate risks cannot be fully mitigated against. In respect of deposit interest rates the Company monitors the effect of historical and projected interest rates on its portfolio through its twice yearly valuation process and reports this to investors. The Company also provides sensitivities to investors indicating the projected impact on the Company’s NAV of a limited number of alternative scenarios, offering investors an ability to anticipate the likely effects of some deposit interest rate scenarios on their investment.
Taxation Change in LegislationChanges in tax legislation across the multi-jurisdictions in which the Company has investments can reduce returns impacting on the Company’s cash flow and valuation.
The diversified jurisdictional mix of the Company’s investments may provide some mitigation to tax changes in any one jurisdiction.
Change in Tax RatesMost recently the Company has benefited from reductions in the headline rates of UK corporation tax positively impacting its UK based investments, however there is a risk that this could be reversed if there were a change in government or policy. Such changes may occur in all jurisdictions in which the Company operates.
The current economic environment is putting pressure on tax setting authorities to increase the collection of taxes, in part through targeting legitimate tax planning and seeking to restrict the international transfer of taxable profits. While the Company does not believe that it uses structure that are considered aggressive or out of the ordinary there is a risk that potential legislative changes to target such arrangements could inadvertently have an adverse impact on the Company’s performance.
The Company believes it takes a conservative approach to tax planning. The Board monitor changes in tax legislation and takes advice as appropriate from external, independent, qualified advisors. Whilst the Board and the Company’s Investment Advisor seek to minimise the impact of adverse changes in tax requirements, its ability to do so is naturally limited.
Accounting Accounting changes may have either a positive or adverseeffect on cash flows available for distribution to the Company and therefore the value of the investments. Accounting changes that have the effect of reducing distributable profits in investment entities and holding entities may impact the Company’s cash flows and thus valuation adversely.
A significant portion of the Company’s income is received in theform of shareholder debt interest income i.e. from pre-tax cash flows and therefore not constrained by distributable profits tests.

30 INTERNATIONAL PUBLIC PARTNERSHIPS Annual Report and Financial Statements 2013
Risks Description Mitigation/Approach
Market Risk
Political andRegulatory
The nature of the businesses in which the Company investexpose the Company to potential changes in policy and legal requirements. All investments have a public sector infrastructure service aspect. Some are subject to formal regulatory regimes. All are exposed to political scrutiny and the potential for adverse public sector or political criticism. Moreover all are dependent ultimately on public sector expenditure for most of their revenues. The Company is therefore potentially highly exposed to changes in policy, law or regulations including adverse or punitive changes of law.
The Company’s existing investments benefit from long-term service and asset availability based pricing contracts and the countries in which the Company operates do not tend to have a tradition of penal retrospective legislation. The countries where the Company operates tend to be long-term supporters of PPP frameworks and similar procurements and recognise the risk of deterring future investment in the event that penal or disproportionate steps are taken in respect of existing contractual engagements.
Termination of ContractsIn particular most if not all of the contracts between public sector bodies the Company’s investment entities contain rights for the public sector to voluntarily terminate contracts in certain situations. Whilst the contracts typically provide for compensation in such cases that could be less than required to sustain the Company’s valuation of the investment causing loss of value to the Company. There have been instances of contracts being voluntarily terminated in the UK health sector recently (although not affecting the Company).
The Company maintains strong and positive relationships with its public sector clients where it can. The Company engages with its public sector clients in developing cost saving initiatives and acting as a ‘good partner’ where it can. None of the Company’s investments have been identified, by any government audit or public sector report as being poor value-for-money or not in the public interest.
The Investment Advisor is a signatory to the Code of Conduct for Operational PFI/PPP contracts in the UK. The voluntary code of conduct sets out the basis on which public and private sector partners agree to work together to make savings in operational Public PPP contracts.
Compensation on termination clauses within such contracts serve to partially mitigate the risk of voluntary termination. Furthermore in the current financial climate where voluntary termination leads to a requirement to pay compensation such compensation is likely to represent an unattractive immediate call on the public finances for the public sector.
Change in Law/RegulationChanges of law or regulation may increase costs of operating and maintaining facilities or impose other costs or obligations that indirectly adversely affect the Company’s cash flow from its investments and/or valuation of them.
Some investments maintain a reserve or contingency designed to meet change of law costs and/or have a mechanism to allow some change of law costs (typically building maintenance related) to be passed back to the public sector.
Change in Political PolicyPolitical policy and financing decisions may also impact on the Company’s ability to source new investments at attractive prices or at all.
Current policy trends in the UK and elsewhere continue to support the use of private sector capital to finance public infrastructure.
Change in RegulationsThe Company is subject to changes in regulatory policy that relate to its business and that of its Investment Advisor. The Company is supervised by the Guernsey Financial Services Commission and is required to comply with the UK Listing Rules applicable to ‘Premium’ listings. The Investment Advisor is regulated by the Financial Conduct Authority in the UK in accordance with the Financial Services and Markets Act 2000.
The Company and its Investment Advisor monitor regulatory developments and seek independent professional advice in order to manage compliance with changing regulatory requirements.
Recent Regulatory ChangesRecent regulatory changes have included the transposition of the European Union’s Alternative Investment Fund Managers Directive (‘AIFMD’) into UK and other EU countries national laws which will impact the Company by increasing its regulatory burden.
The Board considers the Company is self-managed (i.e. it is the Alternative Investment Fund Manager (‘AIFM’)). It is therefore subject to a lighter regulatory regime than if it were to appoint an AIFM from within the EU. However it is not possible to entirely mitigate the risk the Company may be deemed or choose to be managed by an EU AIFM in the future.
Principal Risks and Mitigation continued

INTERNATIONAL PUBLIC PARTNERSHIPS Annual Report and Financial Statements 2013 31
Com
pany O
verviewH
ighlights C
hairman’s
LetterS
trategic R
eport
Corporate
Governance
Financial S
tatements
Risks Description Mitigation/Approach
Operational and Valuation Risk
Asset Performance Asset AvailabilityThe Company’s investments’ entitlement to receive income from their public sector clients is generally dependent on the underlying physical assets remaining available for use and continuing to meet certain performance standards. Failure to maintain assets available for use or operating in accordance with predetermined performance standards may entitle the public sector to stop (wholly or partially) paying the income that the Company has projected to receive.
The Board reviews underlying investment performance of each investment quarterly allowing asset performance to be monitored in close to real time.
Historically the Company has seen very high levels of asset performance which suggests a positive trend for the future.
Contractual mechanisms also allow for significant pass-down of unavailability and performance risk to sub-contractors in many cases.
TerminationIn serious cases where the terms of the underlying contract with the public sector are breached due to default or force majeure then that contract can usually be terminated without compensation. Failure to receive the amount of revenue projected or termination of a contract will have a consequent impact on the Company’s cash flow and value.
In the event of significant and continuing unavailability across the Company’s portfolio the Company is able to terminate the Investment Advisory Agreement. This serves to reinforce alignment of interest between the Company and the Investment Advisor.
Counterparty Risk The Company’s investments are dependent on the performance of a series of counterparties to contracts including public sector bodies, construction contractors, facilities management and maintenance contractors, asset and investment managers (including the Investment Advisor), banks and lending institutions and others. Failure by one or more of these counterparties to perform their obligations fully or as anticipated could adversely affect the performance of affected investments. Replacement counterparties where they can be obtained may only be obtained at a greater cost. These risks would negatively impact the Company’s cash flows and valuation.
The Company has a broad range of suppliers and believes that supplier counterparty risk is diversified across its investments. All contracts include the provision of a security package from counterparties to mitigate the impact of supplier failure. In addition, generally payments are made in arrears to service providers giving the Company some protection against failures in performance.
The credit quality of supplier counterparties is reviewed as part of the Company’s due diligence at the time of making its investments.
Most of the services provided to the Company’s investments are reasonably generic and there can be expected to be a pool of potential replacement supplier counterparties in the event that a service counterparty fails albeit not necessarily at the same cost.
Where borrowings exist in respect of the Company’s investments, interest rates are generally fixed through the use of interest swaps. The Company is therefore exposed if the counterparties of these swaps were to default or the swaps otherwise be ineffective.
The credit risk of such swap counterparties is considered at the time of entering these arrangements and regularly reviewed, however there is a risk of credit deterioration which could impact affected investments.
Physical Asset Risk The Company indirectly invests in physical assets used by the public and thus is exposed to possible risks both reputational and legal in the event of damage or destruction to such assets and their users including loss of life, personal injury and property damage. While the assets the Company invests in benefit from insurance policies these may not be effective in all cases.
The Company’s investments benefit from regular risk reviews and external insurance advice which is intended to ensure that those assets continue to benefit from insurance cover that is standard for such assets.
Contract Risk The performance of the Company’s investments is dependent on the complex set of contractual arrangements specific to each investment continuing to operate as intended. The Company is exposed to the risk that such contracts do not operate as intended, are incomplete, contain unanticipated liabilities, are subject to interpretation contrary to the Company’s expectation or otherwise fail to provide the protection or recourse anticipated by the Company.
Such contracts have been entered into usually only after lengthy negotiations and with the benefit of external legal advice. A legal review of contract documentation is undertaken as part of the Company’s due diligence at the time of making new investments.
Financial Forecasts The Company’s projections depend on the use of financial models to calculate future projected investment returns for the Company. These are in turn dependent on the outputs from other financial model forecasts at the underlying investment entity level. There may be errors in any of these financial models including calculation errors, incorrect performance. However there can be no assurance that forecast assumptions, programming, logic or formulaic errors and output errors. Once corrected such errors may lead to a revision in the Company’s projections for its cash flows and thus impact on its valuation.
Financial forecasts are generally subject to model audit by external accountancy firms which is a process designed to identify errors. The comparison of past actual performance of investments against past projected performance also gives confidence in financial models where actual performance has closely matched projected performance. However there can be no assurance that forecast results will be realised.

32 INTERNATIONAL PUBLIC PARTNERSHIPS Annual Report and Financial Statements 2013
Outlook
Current Market Environment and Future Opportunities The Company’s ability to increase the value of its investment portfolio depends significantly on the following market factors:
> The extent of new infrastructure opportunities being procured by public sector bodies (known as the ‘primary market’)
> The number and quality of investments being sold by existing owners (known as the ‘secondary market’)
> The level of competition for primary or secondary opportunities and the impact this has on pricing and level of returns
> The macroeconomic environment (e.g. the impact of inflation, interest rates, and the pricing of risk and return for alternative investments)
Overall the Company continues to have a very positive market outlook. Government support for private sector investment in infrastructure continues to feature as a high public priority. Also, secondary market competition is currently at a very high level, resulting in significant price inflation which augur well for the value of the Company’s existing assets and the market perception of infrastructure being a firmly established class of investment asset.
Slightly less positively, new investment opportunity volumes have remained low in the period, driven by the Company having been very selective over assets and being determined to progress the acquisition of assets that it believes have a clear benefit to the portfolio. Overall however, the Company is confident that its approach will be justified over time and that the Company continues to hold and build a portfolio of the highest quality.
The Company has an international focus and the current market environment in each of the major jurisdictions in which it operates and the potential for future investment within each is outlined in more detail below:
United KingdomIn the UK, investment in infrastructure is a significant policy cornerstone for the government as a way to create jobs and improve the economy. The government has set out a wide ranging National Infrastructure Plan with a particular focus on transport and power.
Its commitment to infrastructure is also demonstrated through the Green Investment Bank established to help finance large-scale offshore wind and energy-from-waste projects; over the last 12 months the UK government has also encouraged new investment into the wider sector (for instance it has marshalled the creation of a new pension industry infrastructure investment fund vehicle); and the UK government is currently procuring the management and creation of a new senior lending fund platform for future school PPP projects.
There also continues to be new primary market opportunities in the offshore transmission sector, where licences are granted for the transmission of electricity from offshore wind farms to the national grid. Such schemes are structured and financed in a
similar way to social infrastructure schemes with a long-term availability income paid for the provision of services and maintaining asset availability; i.e. there is no demand or volumetric risk to such investments. The Company has, to date, been a market leader in investment into this sector. The UK Government estimates a further £8 billion of capital investment requirement in OFTOs by 2020 with the prospect of significantly more in the years thereafter. This is an obvious area for further attention by the Company and its Investment Advisor.
Other UK primary infrastructure is currently concentrated on large scale economic infrastructure such as inter-city rail connections and replacement and renewable energy generation which typically do not exhibit the risk/reward profile the Company seeks. Nevertheless, the Company takes the view that there are plenty of opportunities that do meet its investment criteria and the main challenge for the Company in primary market transactions is to select those opportunities that offer premium returns with less competitive tension. This means that the Company is continually looking at new subsectors of the infrastructure market where transactions are less commoditised.
Pricing in the secondary market has been particularly high over the past year, with significant premiums being paid. While the Company actively reviews many of these opportunities it continues to be wary of overpaying. Over the last 12 months the Company has confined itself to completing secondary market transactions where the Company has pre-emption or other legal rights that allow the Company an advantageous position in acquisition discussions. Such opportunities also allow the Company to increase its percentage ownership of assets.
AustraliaIn Australia, the federal government has focused infrastructure needs through the Infrastructure Australia Authority; sought to encourage greater investment from foreign investment firms and local superannuation funds; and, encouraged private financing through its Infrastructure Partnerships Australia programme. Each state government also has its own long-term infrastructure strategy delivery organisation.
Given the level of commitment and history of project finance, Australia is one of the most developed countries for undertaking PPPs. Currently, Australia’s infrastructure priorities include multi- billion Australian dollar transport projects such as improvements and developments to highways and rail rebuilding and modernisation.
While there now appear to be attractive opportunities in the Australian market, until recently the Australian dollar (‘A$’) had been trading at a substantial premium to Sterling compared to longer-term rates. As a result it was less attractive for the Company to consider investing in that market. However, recently Sterling has appreciated against the A$ thus potentially making Australian investments attractive again and the Company will continue to assess opportunities in this market.
Investment Policies and Objectives
Strategy Operating Model
2013 Financial and Operating Review
Principal Risks and Mitigation
Outlook

INTERNATIONAL PUBLIC PARTNERSHIPS Annual Report and Financial Statements 2013 33
Com
pany O
verviewH
ighlights C
hairman’s
LetterS
trategic R
eport
Corporate
Governance
Financial S
tatements
The Investment Advisor is currently evaluating a number of projects in Queensland and New South Wales in respect of which the Company is optimistic.
Europe – excluding UKNorthern Europe (including Belgium, Holland, Germany and Scandinavia) continues to offer PPP accommodation opportunities which are attractive to the Company. Ireland also now has an active PPP programme where the Company’s Investment Advisor is an active participant. The Company, through the Investment Advisor’s teams based in Munich, Brussels and Dublin, continues to explore opportunities in these markets.
Elsewhere in Europe, austerity measures and fiscal constraint have limited the capacity of governments to fund infrastructure projects, particularly in southern Europe.
Currently, the greatest focus is being applied in Ireland (where a number of bids are under way), Germany (where the Company has acquired an asset after the year end), Belgium (where the Company has an existing investment and further investment opportunities are being reviewed) and Scandinavia (where PPP transactions appear to be gaining more traction).
CanadaPPP in Canada is well established and the Company holds existing investments in the market. The Company’s Investment Advisor remains active in the Canadian market and will seek out opportunities for the Company where it can. The market is however still relatively small and dominated by domestic pension funds making entry into new investment opportunities more difficult. In the short term these seem more likely to be secondary market opportunities for the Company rather than primary investments.
In the longer term however, Canada has been actively implementing PPPs at a provincial level and through the country’s C$33.0 billion Build Canada plan. Some authorities are also considering sale and leasebacks of infrastructure assets which may be of interest to the Company.
Other countriesThe PPP (or P3) market in the United States continues to grow slowly, notwithstanding the additional complexities arising from slightly different procurement processes in the different states. The InfraDeals website at 21 February 2014 listed 96 projects at ‘pre-launch’ stage which is indicative of the opportunity, although the same source recorded only seven projects, of the type the Company might invest in, reaching financial close in the course of 2013. Nevertheless in the medium term the US market does offer potential opportunity and the Investment Advisor continues to maintain an office in San Francisco focused on these prospects.
The New Zealand market is also of interest to the Company currently and the Investment Advisor continues to work on a number of early stage opportunities there. These are currently being resourced from the Investment Advisor’s Australian offices.
The Company keeps a watching brief on opportunities in other international markets but will only consider deals in other markets where it is satisfied that the combination of sovereign credit and rule of law makes such investment comparable with the Company’s existing investments.
Current PipelineOverall, the Company remains very positive about its prospects,both in terms of the performance of its existing investments and the opportunity to add high quality investments to the portfolio during 2014.
Currently, the Investment Advisor has identified around £180 million of likely investment for the Company which is at preferred bidder stage. If this investment is made as anticipated such investment will fully utilise the Company’s currently available funds including its debt facility. In addition to these potential investments the Company and its Investment Advisor have a significantly larger number of transactions which are at an earlier stage of development, under review. Key areas of current activity within the Company and/or its Investment Advisor (or associates) include:
> Continued activities in the area of UK offshore transmission where the Company has one transaction at preferred bidder stage and another in development
> Other UK and European primary investment opportunities (for instance in UK healthcare and Irish schools)
> Acquisition of additional investments in projects where the Company already has an investment. Typically these will arise under pre-emption and similar rights. This was a key area of focus in 2013 which is likely to continue in 2014
> New developments in UK public policy with respect to the financing of PPP projects in the UK
> The growing range of opportunities in Ireland > Further growth in social infrastructure projects in Germany,
Belgium, Australia and New Zealand which conform to the existing risk profile within the Company’s portfolio
> Opportunities arising in the UK health and social care sphere where an active pipeline of small to medium sized opportunities continues to exist
> Appropriately priced proposals from third parties seeking to dispose of projects meeting the Company’s investment criteria which have synergies with the Company’s existing portfolio
Selected specific current opportunities identified by the Investment Advisor are outlined in the table overleaf. Notwithstanding the projects listed below, it should be noted that the Company’s performance is not dependent upon making additional investments in order to deliver its projected returns. Further investment opportunities will be judged by their anticipated contribution to overall portfolio returns.

34 INTERNATIONAL PUBLIC PARTNERSHIPS Annual Report and Financial Statements 2013
Project Location
Estimated Investment/Gross Capital Value1
Expected Concession Length Project Status
OFTOs – Lincolnshire UK £360 million 20 years Consortium including the Company named preferred bidder
OFTOs – West of Duddon Sands
UK £400 million 20 years Consortium including the Company shortlisted
Healthcare projects UK £30 million 25 years Community health project in the UK. Preferred bidder status.
Education Funding Agency – Funding Aggregator
UK £500 million 25 years Consortium including the Company shortlisted on innovative UK PPP funding project
Irish Schools Bundle 4&5 Ireland £100 million+ 25 years Consortium including the Company shortlisted on next round
Various medium-term opportunities
UK, Belgium, Australia, New Zealand
£800 million – £1 billion
25 years The Company has the benefit of short, medium and long-term development opportunities as well as pre-emption opportunities in respect of a number of projects within the existing portfolio
1 Represents opportunities currently under review by Amber Infrastructure Group including current bids, preferred bidder opportunities and estimated value of opportunities to acquire additional investments under pre-emption/first refusal rights. There is no certainty these will translate to investment opportunities for INPP. The value referenced in relation to the European utility and pre-emption opportunities represents the potential investment value which reflect the current unaudited estimate of the total likely acquisition price at the time of investment. In relation to the remaining assets listed as further investments, the figure represents the current unaudited capital value of the relevant project and therefore includes both debt and equity and is not necessarily indicative of the eventual acquisition price for, or the value of, any interest that may be acquired.
Rupert Dorey John Whittle26 March 2014 26 March 2014Chairman Director
Outlook continued

INTERNATIONAL PUBLIC PARTNERSHIPS Annual Report and Financial Statements 2013 35
Com
pany O
verviewH
ighlightsC
hairman’s
LetterS
trategic R
eportC
orporate
Governance
Financial S
tatements
Corporate Governance Report
IntroductionThe Board of Directors is committed to high standards of corporate governance and has put in place a framework for corporate governance which it believes is appropriate for an investment company.
Compliance with Corporate Governance CodesAll companies with a Premium Listing on the London Stock Exchange are required to confirm their compliance with (or explain departures from) the UK Corporate Governance Code (‘UK Code’). This requirement applies regardless of where the company is incorporated.
The Company is a member of the Association of Investment Companies (the ‘AIC’). The UK Code acknowledges that the AIC Corporate Governance Code (‘AIC Code’) can assist externally managed companies in meeting their obligations under the UK Code in areas that are of specific relevance to investment companies.
The Guernsey Financial Services Commission has also confirmed that companies that report against the UK Code or AIC Code are deemed to meet the Guernsey Code of Corporate Governance.
The AIC Code is available from the Association of Investment Companies (www.theaic.co.uk). The UK Code is available from the Financial Reporting Council website (www.frc.co.uk).
The Company has complied throughout the year with all the provisions of the AIC Code and as such also meets the UK Code except to the extent highlighted below. In particular the Company notes the following departures from the code for the reasons as set out below:
1. The role of the Chief Executive and Executive Directors’ remunerationAs an investment company, most of the Company’s day to day responsibilities are delegated to third parties. The Company does not have any executive directors. The UK Code’s two separate principles of setting out the responsibilities of the chief executive and disclosing the remuneration of executive directors (Section 12 – A.2 of the UK Code) are therefore not applicable.
In compliance with the AIC Code, given the size of the Board, it has decided that the full Board (excluding the single Non-Independent Director) should be responsible for remuneration matters rather than appointing a separate remuneration committee.
2. Re-election of all DirectorsThe Board notes the AIC Code and UK Code suggest it would be good practice for all Directors to be offered for re-election at regular intervals subject to continued satisfactory performance. In accordance with the Company’s articles of incorporation, at least one third of the Independent Directors and Mr Frost (as the Non-Independent Director) will retire at each Annual General Meeting (Principle 3 – AIC Code). The Company considers that putting forward all independent directors for re-election more frequently would not be in the best interests of shareholders, given the long-term nature of the Company’s assets that benefit from a consistent approach across years both in terms of management and independent Board supervision.
As such the Company takes the view that the benefits to shareholders arising from the Directors’ long-term knowledge and experience of these underlying assets and their management (including their ongoing ability to review the performance of the Investment Advisor and other advisors) outweighs the benefit of more frequent re-election being applied to all Directors. However, during the current year a number of Directors will seek re-election as set out below.
3. Nomination of candidates to join the BoardThe UK Code recommends a Nomination Committee, consisting of a majority of Independent Non-Executive Directors and chaired by the chairman or an Independent Non-Executive should act to nominate candidates to join the Board (Section 12 – B.2.4 of the UK Code).
The AIC Code recommends the independent directors take the lead in the appointment of new directors (Principle 9 – AIC Code). The Company has followed the AIC Code’s principles. Due to the size of the Board and the fact that all but one of the Directors are Independent Non-Executives, the Company does not consider there is any benefit to be gained from establishing a separate Nomination Committee as recommended by the UK Code.
The table below details all Directors of the Company at the date of this report.
Name Position Independent Date Appointed
Rupert Dorey1 Non-Executive Chairman Yes 2 August 2006Keith Dorrian1 Non-Executive Director (Immediate Past Chairman) Yes 2 August 2006Giles Frost Non-Executive Director No 2 August 2006John Whittle1 Non-Executive Director (Senior Independent Director and Chairman
Audit and Risk Committee)
Yes
6 August 2009Claire Whittet1 Non-Executive Director (Chairman – Management Engagement
Committee)
Yes
10 September 2012John Stares1 Non-Executive Director (Chairman – Risk Sub-Committee) Yes 29 August 20131 All members of the Board are also committee members with the exception of Mr Frost.

36 INTERNATIONAL PUBLIC PARTNERSHIPS Annual Report and Financial Statements 2013
Corporate Governance Report continued
The Board of DirectorsThe Board of Directors currently consists of six Non-Executive Directors, whose biographies, on pages 46 to 47, demonstrate a breadth of investment and business experience.
The Board consists solely of Non-Executive Directors and is chaired by Mr Dorey who is responsible for leadership of the Board and ensuring its effectiveness on all aspects of its role. Mr Dorey met the independence criteria of the AIC Code and UK Code upon appointment and has continued to meet this condition throughout his term of service. Mr Whittle was appointed the Senior Independent Director on 31 December 2013 and is as such an alternative point of contact for shareholders and leads in matters where it is not appropriate for the Chairman to do so.
Mr Frost is not an Independent Director, due to his relationship with the Company’s Investment Advisor. In accordance with the AIC Code all other non-executives are independent of the Company’s Investment Advisor.
Appointments to the Board and Gender DiversityAs noted above, Mr Stares was appointed to the Board in August 2013 following the Board’s search for a suitable Director having canvased its advisors and other market participants for a list of suitable candidates. Given the high calibre of applicants through this process, the Board did not engage a search consultancy.
The Board is committed to maintaining the appropriate balance of skills, gender, knowledge and experience among its members to ensure strong leadership of the Company. When appointing Board members, its priority will always be based on merit, but will be influenced by the strong desire to maintain board diversity, including gender. The Board currently has one female Director, and there has been one female on the Board almost since inception of the Company.
All new Directors receive an induction from the Investment Advisor on joining the Board, and in consultation with the Chairman all Directors are entitled to receive other relevant ongoing training as necessary.
Board Tenure and Re-electionNo member of the Board has served for longer than eight years to date. As such no issue has arisen to be considered by the Board with respect to long tenure. In accordance with the AIC Code, when and if any director shall have been in office (or on re-election would at the end of that term of office) for more than nine years the Company will consider further whether there is a risk that such a director might reasonably be deemed to have lost independence through such long service.
One third of the Directors retire by rotation at every AGM and will therefore be subject to annual re-election by shareholders. Any Directors appointed to the Board since the previous AGM also
retire and stand for re-election. The Chairman and the Independent Directors take the lead in any discussions relating to the appointment or reappointment of Directors taking into account the expertise of the candidates and their independence.
Mr Dorey will retire in 2014 (as a result of the retirement by rotation provisions in the Articles of Incorporation) and Mr Frost will also retire in accordance with the UK Listing Authority Listing Rules and both will stand for re-election. In accordance with its policy Mr Stares, having joined the Board since the last AGM, will also stand for election. Mr Dorrian will retire and not stand for re-election.
Directors do not have service contracts. Directors are appointed under letters of appointment, copies of which are available at the registered office of the Company. The Board considers its composition and succession planning on an ongoing basis.
Board Performance EvaluationAn internal evaluation of the performance of individual Directors and the Chairman was carried out in November 2013. It concluded that the Board is performing satisfactorily and is acquitting its responsibilities well in the eight areas reviewed: Investment matters; Board composition and independence; Relationships and communication; Knowledge and skills; Board processes; Shareholder value; Management; and performance of the Chairman.
In accordance with the UK Code requirements, the Board considers the need for an externally facilitated evaluation of the Board at least every three years. An external valuation will be undertaken during the 2014 financial year, the outcome of which will be reported to investors in subsequent reports.
Directors’ Duties and ResponsibilitiesThe Directors have adopted a set of Reserved Powers, which establish the key purpose of the Board and detail its major duties. These duties cover the following areas of responsibility:
> Statutory obligations and public disclosure > Approval of investment decisions > Strategic matters and financial reporting > Board composition and accountability to shareholders > Risk assessment and management, including reporting,
compliance, monitoring, governance and control > Other matters having material effects on the Company
These Reserved Powers of the Board have been adopted by the Directors to demonstrate clearly the importance with which the Board takes its fiduciary responsibilities and as an ongoing means of measuring and monitoring the effectiveness of its actions.

INTERNATIONAL PUBLIC PARTNERSHIPS Annual Report and Financial Statements 2013 37
Com
pany O
verviewH
ighlightsC
hairman’s
LetterS
trategic R
eportC
orporate
Governance
Financial S
tatements
Board
Audit and Risk Committee Management Engagement Committee
Responsibilities > Statutory obligations and public disclosure > Approval of investment decisions > Strategic matters and financial reporting > Board composition and accountability to shareholders > Risk assessment and management including reporting compliance, monitoring,
governance and control > Other matters having material effects on the Company > Responsible for financial statements
Delegated Responsibilities > Monitor the integrity of financial statements > Review the effectiveness and internal control policies and procedures over
financial reporting > Review the effectiveness of the Company’s risk management framework, in
relation to the investment policy > Review the Company’s financial and accounting policies > Advise the Board on appointment of the external auditors and is responsible for
oversight and remuneration of the external auditor
Delegated Responsibilities > Review on a regular basis the performance of the Investment Advisor and the
Company’s other advisors and major service suppliers to ensure that performance is satisfactory and in accordance with the terms and conditions of the respective appointments
The Board monitors the Company’s share price and NAV and regularly considers ways in which future share price performance may be enhanced. These may include implementing marketing and investor relations activities, appropriate management of share price premium/discount and the relative positioning and performance of the Company to its competitors. The Board is also responsible for safeguarding the assets of the Company and for
taking reasonable steps for the prevention and detection of fraud and other irregularities.
The Board has established two committees consisting of the Independent Non-Executive Directors. The responsibilities of these Committees are described below. Terms of reference for each Committee have been approved by the Board and are available in full on the Company’s website.
Board RemunerationThe Board as a whole considers matters relating to the Directors’ remuneration taking into account benchmark information and based upon the amount of work performed by the Board members. No advice or services were provided by any external persons in respect of its consideration of Directors’ remuneration.
All fees payable to the Directors should reflect the time spent by the Directors on the Company’s affairs and the responsibilities borne by the Directors and be sufficient to attract, retain and motivate Directors of a quality required to run the Company successfully. The Chairman of the Board is paid a higher fee in recognition of additional responsibilities, as is the Chairman of the Audit and Risk Committee. The Board reviews fee rates periodically, taking into account fees paid to directors of comparable companies, although such a review will not necessarily result in any changes to the rates.
There are no long-term incentive schemes provided by the Company and no performance fees, or bonuses paid to Directors. Any changes to Directors remuneration are considered at the Annual General Meeting of the Company.
During the year, serving Directors were paid the following emoluments:
Director
2013 Fees paid
£
2012 Fees paid
£
Keith Dorrian 56,7502 57,0003
Rupert Dorey 46,7502 47,0003
Giles Frost1 32,000 42,0003
John Whittle 36,1252 42,0003
Claire Whittet4 36,1252 9,826John Stares5 3,465 –
1 The emoluments for Mr Frost are paid to his employer Amber Infrastructure Limited, a related company of the Company’s Investment Advisor.
2 As detailed in the 2012 Annual Report, Directors fees increased from 1 January 2013.3 Includes a £10,000 additional fee paid per Director for services undertaken in respect of
the June 2012 capital raising.4 Ms Whittet joined the Board on 10 September 2012.5 Mr Stares joined the Board on 28 August 2013.

38 INTERNATIONAL PUBLIC PARTNERSHIPS Annual Report and Financial Statements 2013
Directors’ InterestsDirectors, who held office at 31 December 2013, had the followinginterests in the shares of the Company:
Director
31 December 2013 Number of
OrdinaryShares1
31 December 2012 Number of
OrdinaryShares1
Keith Dorrian2 51,467 51,467Rupert Dorey3 593,687 593,687Giles Frost 298,745 298,745John Whittle2 38,393 36,626Claire Whittet – –John Stares4 – –1 All shares are beneficially held.2 Holds shares indirectly through a Retirement Annuity Trust Scheme.3 Shares owned by Mr Dorey’s spouse.4 Mr Stares joined the Board on 28 August 2013.
There have been no changes to any of the above holdings between 31 December 2013 and the date of this report.
Mr Frost is also a Director of International Public Partnerships Lux1 Sarl a wholly-owned subsidiary undertakings of the Company, and a director of a number of other companies in which the Company directly or indirectly has an investment, although he does not control or receive remuneration in relation to these entities.
Audit and Risk CommitteeThe Audit and Risk Committee (previously the Audit Committee) is comprised of the full Board with the exception of Mr Frost as the non-independent Director. For the majority of 2013 risk management was performed by the Board and audit oversight delegated to the (then) Audit Committee. In November the Board approved extension of the responsibilities of the Audit Committee to include risk and to establish the Audit and Risk Committee. Mr Whittle is Chairman of the Audit and Risk Committee whereas Mr Stares has undertaken to assume lead responsibility for Risk. As a consequence, the Company Chairman is a member of the Audit and Risk Committee, which the Board believes is appropriate as Mr Dorey brings significant independent expertise in investment trusts and finance for the benefit of that Committee.
The duties of the Audit and Risk Committee in discharging its responsibilities are outlined in the table overleaf. The Audit and Risk Committee is also responsible for monitoring the objectivity and effectiveness of the audit process, with particular regard to terms under which the auditor is appointed to perform non-audit services. In advance of non-audit work being undertaken by the Company’s Auditors, any potential threats to independence are identified and if they cannot be suitably dealt with an alternative audit firm would be engaged.
In respect to its risk management function, the Audit and Risk Committee is also responsible for reviewing the Company’s risk management framework including in connection with the acquisition and disposal of assets, the valuation of assets and ensuring that the risk management function of the Investment Advisor, Administrator and other third party service providers are adequate and to seek assurance of the same.
The Audit and Risk Committee, having reviewed the performance of the Auditor, has recommended to the Board that the Auditor be proposed for reappointment at the Annual General Meeting of the Company.
Management Engagement CommitteeThe Management Engagement Committee is comprised of the full Board, with the exception of Mr Frost, and is chaired by Ms Whittet. The duties of the Management Engagement Committee in discharging its responsibilities are outlined in the table above.
The Management Engagement Committee carries out its review of the Company’s advisors through consideration of a number of objective and subjective criteria and through a review of the terms and conditions of the advisors’ appointments with the aim of evaluating performance, identifying any weaknesses and ensuring value for money for the Company’s shareholders.
The Management Engagement Committee undertook a review of the terms under which the Investment Advisor was engaged and (following receipt of independent external advice) recommended amendments to the Investment Advisory Agreement (‘IAA‘) and associated documentation which included: the removal of the performance fee previously payable to the Investment Advisor; an extension to the terms of the IAA; further reduction in management fee as NAV increases; and strengthening of the termination provisions available to the Board in the event of poor performance. These changes were approved by shareholders at an Extraordinary General Meeting held on 23 September 2013 and came into effect 1 July 2013.
The Management Engagement Committee also formally reviewed the performance of the other key service providers to the Company. During the 2013 review, no material weaknesses were identified. Overall the Committee confirmed its satisfaction with the services and advice received.
Board and Committee Meeting AttendanceThe Board meets at least four times per year and in addition there is regular contact between the Board, the Investment Advisor, the Administrator and Company Secretary. The agenda and supporting papers are distributed in advance of quarterly Board and Committee meetings to allow time for appropriate review and to facilitate full discussion at the meetings.
Corporate Governance Report continued

INTERNATIONAL PUBLIC PARTNERSHIPS Annual Report and Financial Statements 2013 39
Com
pany O
verviewH
ighlightsC
hairman’s
LetterS
trategic R
eportC
orporate
Governance
Financial S
tatements
In accordance with its normal practice the Board continues to hold discussions relating to the future strategy of the Company with the Investment Advisor and regular formal and informal discussions are held on this subject. The Directors confirm that they believe that it is in shareholders’ best interests to continue the appointment of Amber Fund Management Limited (‘AFML’) as the Company’s Investment Advisor.
Making New InvestmentsThe Independent Directors of the Company make investment decisions with respect to new investments after reviewing recommendations made by the Company’s Investment Advisor. The Investment Advisor has a detailed set of procedures and approval processes in relation to the recommendation of new investments to the Board.
It is expected that further investments will be sourced by the Investment Advisor. It is likely that some of these investments will have been originated and developed by, and in certain cases may be acquired from other members of the Investment Advisor’s group. Where that is the case the conflicts management process summarised below is followed.
Managing Conflicts of InterestThe Company has established detailed procedures to deal with conflicts of interest that may arise on investments acquired from the Investment Advisor’s group, and manage conduct in respect of any such acquisitions. As previously mentioned, the Company’s Board has a majority of independent members and a Chairman who is independent of the Investment Advisor. Each Director is required to inform the Board of any potential or actual conflicts of interest prior to Board discussions.
The potential conflicts of interest that may arise include when an Amber entity is an existing investor in the target entity while an associated company, AFML, acts on the ‘buyside’ as Investment Advisor to the Company. The IAA contains procedures with the intention of ensuring that the terms on which the vendors of such assets dispose of their assets are fair and reasonable to the vendors; and on the ‘buyside’ the Company as Investment Advisor must be satisfied as to the appropriateness of the terms for and the price of, the acquisition.
Key features of these procedures include: > The creation of separate committees representing the interests
of the vendors on the one hand (the ‘Sellside Committee’) and the Company on the other (the ‘Buyside Committee’), to ensure arm’s length recommendation and approval processes. The membership of each committee is restricted in such a way as to ensure its independence and to minimise conflicts of interest arising
> A requirement for the Buyside Committee to conduct and report to the Company on an independent due diligence process on the assets proposed to be acquired prior to making an offer
In addition, the Board has established a Committee of any two Independent Directors to consider and approve actions in unexpected eventualities and investment approvals (provided the whole Board is able to review any relevant documentation prior to its consideration by the Committee).
The table below lists Directors’ attendance at Board and Committee meetings during the year, to the date of this report.
DirectorsQuarterly
BoardAd-hoc Board
Audit and Risk
Committee3
Management Engagement Committee
Max no. 4 6 3 4
R Dorey 4 5 3 4K Dorrian 4 6 2 4G Frost1 4 – – –J Whittle 4 5 3 4C Whittet 4 6 3 4J Stares2 2 – 1 11 Mr Frost is not a member of the Audit and Risk Committee or Management Engagement
Committee. Mr Frost does not attend ad-hoc Board Meetings as a Director where recommendations from the Investment Advisor are under consideration.
2 Mr Stares joined the Board on 28 August 2013.3 Responsibility of Audit Committee expanded to incorporate Risk as of 31 December
2013.
Relationship with Administrator and Company SecretaryHeritage International Fund Managers Limited acts as Administrator and Company Secretary and is responsible to the Board under the terms of the Administration Agreement. The Administrator is also responsible for ensuring compliance with the Rules and Regulations of Guernsey Law, London Stock Exchange listing requirements, money laundering regulation and observation of the Reserved Powers of the Board and in this respect the Board receives detailed quarterly reports.
The Directors have access to the advice and services of the Company Secretary who is responsible to the Board for ensuring that Board procedures are followed and that it adheres to applicable legislation, rules and regulations under Guernsey Law, the Guernsey Financial Services Commission and the London Stock Exchange. Individual Directors may, at the expense of the Company, seek independent professional advice on any matter that concerns them in the furtherance of their duties. The Company maintains appropriate Directors’ and Officers’ liability insurance in respect of legal action against its Directors on an ongoing basis and the Company has maintained appropriate cover throughout the period.
Relationship with the Investment AdvisorThe Directors are responsible for the overall management and direction of the affairs of the Company. Under the Investment Advisory Agreement, Amber Fund Management Limited acts as Investment Advisor to the Company to review and monitor investments and advise the Company in relation to strategic management of the investment portfolio. Details of the Investment Advisor’s relationship with the Company are provided within the Strategic Report.

40 INTERNATIONAL PUBLIC PARTNERSHIPS Annual Report and Financial Statements 2013
Risk Reassessment
Risk Assessment
Mitigation Plan
Risk Identification
> A requirement for any offer made for the assets to be supported by advice on the fair market value for the transaction from an independent expert
> The establishment of ‘information barriers’ between the Buyside and Sellside Committees to ensure information that is kept confidential to one or the other side
> The provision of a ‘release letter’ to each employee of the relevant associate of the Investment Advisor who is a member of the Buyside and Sellside Committees. The release letter confirms that the employee shall be treated as not being bound by his/her duties as an employee to the extent that such duties conflict with any actions or decisions which are in the employee’s reasonable opinion necessary for him/her to carry out as a member of the Buyside Committee or Sellside Committee
> Individuals with material direct or indirect economic interests in the relevant assets will not participate in Buyside Committee and Sellside Committee discussions regarding the relevant assets
> A requirement that the financial statements, policies and records of any such asset offered to the Company be compliant with the Company’s accounting policies and procedures
The acquisition of all assets, including those from any associate of the Investment Advisor is considered and approved in advance by the Independent Directors of the Company. In considering any such acquisition, the Independent Directors will, as they deem necessary, review and ask questions of the Buyside Committee of the Investment Advisor and the Group’s other advisors and the acquisition will be approved by the Board on the basis of this advice. The purpose of these procedures is to ensure that the terms upon which any investment is acquired from a member of the Amber group is on an arm’s length basis.
Risk Management and Internal ControlsThe Board is responsible for risk management with oversight provided by the Audit and Risk Committee. The system of risk management and internal control has been designed to manage, rather than eliminate, the risk of failure to meet the business objectives. Regard is given to the materiality of relevant risks and therefore the system of internal control cannot provide absolute assurance against material misstatement or loss.
The Company has in place a detailed risk management framework, with a comprehensive risk register that is reviewed and updated as necessary by the Board and Audit and Risk Committee on a quarterly basis. The Audit and Risk Committee considers the risks facing the Company and controls and other measures in place to mitigate the impact of risks.
There is an ongoing process for identifying, evaluating and managing the significant risks faced by the Company. The process has been in place for the year under review and up to the date of approval of the Annual Report and financial statements.
Risk management processThe Company’s risk management process as overseen by theBoard can be summarised as:
Risk identificationThe Board and Audit and Risk Committee identify risks with input from the Company’s Investment Advisor and Administrator. The Board also receives detailed quarterly asset management reports highlighting performance and potential risk issues on an investment-by-investment basis.
Risk assessmentEach identified risk is weighted in terms of probability of occurrence, potential impact on financial performance and movements in the relative significance of each risk from period to period.
Action plans to mitigate riskWhere new risks are identified or existing risks increase in terms of likelihood or impact, the Audit and Risk Committee assists the Company in developing an action plan to mitigate the risk and put in place enhanced monitoring and reporting.
Reassessment and reporting of riskSuch risks mitigation plans are reassessed by the Audit and RiskCommittee, where applicable with the relevant key service providers and reported to Board on a quarterly basis.
Corporate Governance Report continued

INTERNATIONAL PUBLIC PARTNERSHIPS Annual Report and Financial Statements 2013 41
Com
pany O
verviewH
ighlightsC
hairman’s
LetterS
trategic R
eportC
orporate
Governance
Financial S
tatements
Board and Committees
International Public
Partnerships
FacilitiesManagement Contractor
Debt Providers
Construction Contractor
Public SectorClient
Investment
Asset Manager
Investment fund
Integrated service provision
InvestmentEntities
Underlying Investment Companies
Risk framework and systems of internal controlThe Board recognises the importance of identifying and actively monitoring the financial and non-financial risks facing the business. Whilst responsibility for risk management rests with the Board, the management of risk is embedded as part of the everyday business and culture of the Company and its principal advisors.
All aspects of risk are overseen by the Board with delegation as relevant to the Audit and Risk Committee and Management Engagement Committee.
The Board has considered the need for an internal audit function but because of the internal controls systems in place at the key service providers, and the independent controls process reviews performed it has decided instead to place reliance on those control and assurance processes.
The overall risk governance framework is the responsibility of the Board, overseen by the Audit and Risk Committee with input from the Management Engagement Committee. It is implemented through three risk control levels.
The risk framework is applied holistically across the fund and the underlying investment portfolio through vertically integrated service support as illustrated in the diagram below.
The direct communication between the Company and its Investment Advisor and the entity level asset manager is regarded as a key element in the effective management of risk (and performance) at the underlying investment level. The Company benefits from a strong alignment of risk and management performance approach at the Company and underlying investment levels through the provision of services from a vertically integrated Investment Advisor and investment level Asset Manager.
Relations with ShareholdersThe Board welcomes shareholders’ views and places great importance on communication with shareholders. It has responsibility for communication with the investor base and is directly involved in major communications and announcements.
The Board receives regular reports on the views of shareholders and the Chairman and other Directors are available to meet shareholders as required. During the period, the Board undertook extensive soundings with over 50% of the shareholder base (by value) in relation to the proposed changes to the IAA and, with the assistance of the Investment Advisor held a successful Investor presentation day, ahead of the official opening of the Liverpool Central Library project.
Audit and Risk Management Engagement
Investment Advisor
Ser
vice
pro
vider
’s inte
rnal
contr
ols
Indep
enden
t co
ntr
ols a
nd
pro
cess
rev
iew
s
Ext
ernal
audit
Asset Manager
Company Secretary
Fund Administrator
Legal Advisor
Corporate Broker
Corporate Bankers
Board
Key Service Risk Control Levels

42 INTERNATIONAL PUBLIC PARTNERSHIPS Annual Report and Financial Statements 2013
The Investment Advisor conducts the day-to-day investor relations activities for the Company. It meets with major shareholders on a regular basis and reports to the Board on these meetings. During 2013 the Investment Advisor and the Board held meetings with over 110 individual shareholders. The Board is also informed on a regular basis of all relevant market commentary on the Company by the Investment Advisor, Administrator and the Company’s Broker.
The Annual General Meeting of the Company provides a forum for shareholders to meet and discuss issues with the Directors and with the Investment Advisor of the Company.
To promote a clear understanding of the Company, its objectives and financial results, the Board aims to ensure that information relating to the Company is disclosed in a timely manner. The Company has an investor relations section on its website (www.internationalpublicpartnerships.com) where it makes available all its publicly disclosed documents including Annual Reports and RNS announcements together with additional background information on its assets and corporate practices. Investors can register to receive notification (via email) of RNS announcements the Company issues. The Board encourages investors to utilise this useful online resource.
Any shareholder issues of concern including on corporate governance or strategy can be addressed in writing to the Company at its registered office address (see back cover).
Corporate Social and Environmental Responsibility
IntroductionThe Company is committed to its responsibility to the environment and having a positive role in the local and global community in which it operates. The Company encourages high standards in sustainability through an integrated approach to managing and influencing our indirect environmental and social impacts. The Company recognises the value of active management in delivering quality services, risk management and resource efficiency.
The Company’s most material impacts are indirect, relating to the environmental and social performance of the construction and operation of the buildings and infrastructure which make up its portfolio. Additionally, it recognises the importance of managing its relationship with its Investment Advisor (and associated asset management operations) including the energy and resources used within its operations and their contribution to the local and global community.
The Company’s Investment Advisor focuses on sustainability commitments, both within its operations and through the management of the projects and assets within the Company’s portfolio. The Investment Advisor operates a Sustainability Policy which looks beyond legislative and regulatory requirements to promote best practice and continual improvement in environmental management and social responsibility.
The Investment Advisor is certified to The Planet Mark and is committed to measuring and reducing its carbon footprint and wider sustainability metrics. As a member of the UK Sustainable Investment and Finance Association, it supports best practice in responsible investment.
The Company sees its key sustainability stakeholders as its Investment Advisor and its employees, and the service providers it works with to deliver and manage infrastructure projects. As a result, the Company encourages its partners to report on sustainability performance.
Many investment entities in which the Company holds investments achieve high standards in sustainability, including building certifications such as BREEAM, LEED and Green Star.
Project highlights:BMBF German Ministry of Education and Research (acquired post 31 December 2013) – The sustainable design includes photovoltaic panels, recycled glass panels, sustainable timber and communal heating. Winner of the Project Finance Deal of the Year Award 2011 for European Government Accommodation projects.
Pforzheim Schools, Germany – An innovative low energy heating, cooling and ventilation system has been successfully operating since 2008 and is the first of its kind to be used in a German school. Winner of the Innovation Award 2009 by the German Federal Association Public Private Partnership (‘BPPP’).
Bootle PFI, UK – Social and community involvement has included donations to a local food bank, work experience placements through Future Workforce and fundraising for the charity Zoe’s Place and the DEC Philippines Appeal. Environmental improvements include installation of waterless urinals, replacing multiple lights with LED lighting and waste segregation including food waste composting.
Dublin Criminal Courts, Ireland – Energy saving initiatives since 2010 have resulted in an average 18% reduction in energy use per year. Winner of New Build Project of the Year, CIBSE Sustainable Awards 2010.
Hereford and Worcester Courts, UK – Three of the courts utilise a TermoDeck system, an energy efficient environmental control solution that utilises the building’s thermal mass to provide balanced ventilation with passive heating.
Tower Hamlets Schools, UK – This project has partnered with social organisations to deliver wider benefits to the local community. This includes, working with KidSafe on a ‘safe for kids’ scheme focusing on personal and road safety awareness, the East End Shed, a theatre company for children, and Singing
Corporate Governance Report continued

INTERNATIONAL PUBLIC PARTNERSHIPS Annual Report and Financial Statements 2013 43
Com
pany O
verviewH
ighlightsC
hairman’s
LetterS
trategic R
eportC
orporate
Governance
Financial S
tatements
Playgrounds delivered through Ex Cathedra. Energy initiatives in various schools include solar PV panels, double glazed windows, automatic heating controls, passive infrared sensors and efficient boiler installations.
Durham Courts, Canada – This project has restored a four-acre brown-field site to productive use and is contributing to the area’s redevelopment. The Durham Region Courthouse meets LEED silver designation at completion of construction and has committed to achieve LEED Gold certification after six years of operation. It is intended that the project will be certified under the Building Owners and Managers Association (BOMA) Go Green Plus programme, requiring performance through a comprehensive environmental management system, benchmarked against other facilities in Canada. The project was the winner of the 2013 BOMA Earth Award for the office building in the 250,000 – 499,999 ft2 category in recognition of excellence in resource preservation and environmentally sound commercial building management.
Gold Coast – GoldLinQ Rail project, Australia – As part of the Project Local Industry Participation requirement under the Project Deed and government related Act, the project is currently achieving 94.75% of procurement of goods, services and employment from the local economy, exceeding its ‘stretched’ target of 78.87%.
The project has also supported various social programmes delivered through partners include: working with Surf Life Saving Queensland’s Gold Coast Nippers encouraging beach and public transport safety amongst children.
Orange & Associated Health Services, Australia – Installation of energy sub-meters and improved Building Management System controls to measure and reduce energy consumption. Reduced natural gas consumption through 72 roof mounted solar water heater panels. Winner of the Master Builders Association (Australia) Award 2012 – Excellence in Building & Construction for Orange Hospital; Winner Master Builders Association (NSW) Award 2012 – Excellence in Building & Construction for Bathurst Heritage Building redevelopment.
Royal Children’s Hospital, Australia – Winner of the Infrastructure Partnerships Australia National Infrastructure Awards 2012 – Project of the Year. Winner of the Australian Property Institute – Environmental Development Award. Winner of the International Design and Health Academy Awards 2012 – Sustainability Design. High Commendation in the Consult Australia Awards for Excellence 2012 – Sustainability Category.
Changes in RegulationThe Board actively monitors and responds to changes in regulation as it impacts the Company and its policies. A number of significant changes to regulation occurred during the year.
The Company’s response to these and significant other policies are set out below:
Alternative Investment Fund Management Directive (‘AIFMD’)AIFMD was transposed into law in European Union (‘EU’) member states on 22 July 2013. In the UK, a one-year transition period is available to existing AIFMs. The Board considers the Company to be an internally managed non-EU fund. A non-EU fund (i.e. it is the AIFM) which is internally managed is outside the full scope of AIFMD and will only be the subject of lighter AIFMD requirements at the point of marketing within the EU.
Foreign Account Tax Compliance Act (‘FATCA’) FATCA became effective on 1 January 2013 and is being gradually implemented internationally. The legislation is aimed at determining the ownership of US assets in foreign accounts and improving US Tax compliance with respect to those assets. The Board is in discussion with the Company’s service providers and advisors to ensure that the Company will comply with the Act’s requirements to the extent relevant to the Company.
Non-Mainstream Pooled Investment (‘NMPI’)On 1 January 2014 FCA rules relating to the restrictions on the retail distribution of unregulated collective investment schemes and close substitutes came into effect. The Board believes that the Company and its shareholders will not be affected by these changes.
Having taken legal advice, the Company confirms that its shares will qualify as an ‘excluded security’ under these new rules and will therefore be excluded from the FCA’s restrictions which apply to non-mainstream investment products. As such, the Company’s shares can continue to be recommended by independent financial advisors (‘IFAs’) to ordinary retail investors in accordance with the FCA’s rules.
The Company is advised that the basis of being excluded from these restrictions is principally due to the Company conducting its affairs in such a manner that it would have qualified for approval by HMRC as an investment that had been resident in the UK in its previous accounting periods. The Company intends to conduct its affairs so that this remains the case for the foreseeable future.

44 INTERNATIONAL PUBLIC PARTNERSHIPS Annual Report and Financial Statements 2013
During the year the Board approved new terms of reference for inclusion of risk within the Audit and Risk Committee’s (previously the Audit Committee) remit, which had previously been performed by the Board as a whole. For the majority of the financial year the committee purely focused on audit matters as is reflected in this report. The Audit and Risk Committee (the ‘Committee’) is an essential part of the Company’s governance framework to which the Board has delegated oversight of the Company’s financial reporting, internal controls and compliance and external audit. This report provides an overview of the work of the Committee and details how it has discharged its duties during the year.
The terms of reference for the Committee, together with details of the standard business considered by the Committee, have been approved by the Board and are available on the Company’s website.
Committee MeetingsMeetings of the Committee were attended by the Investment Advisor and Administrator by invitation during the year. A representative of the Group’s external auditors, Ernst and Young LLP, also attended by invitation those meetings at which the financial reporting planning and the annual and interim reports and financial statements were considered.
All of the Committee’s members are considered to be appropriately experienced to fulfil their role, having significant, recent and relevant financial experience in line with the AIC Code. Biographies of the Committee members can be found on pages 46 to 47.
Committee agendaThe Committee’s agenda during the year included performing:
> Review of the final and interim financial statements and matters raised by management and external auditors (including significant financial reporting judgements therein)
> Review of the appropriateness of the Company’s accounting policies
> Review of the effectiveness of the Group’s internal control systems > Review of the effectiveness, objectivity and independence of
the external auditors and the terms of engagement, cost effectiveness and the scope of the audit
> Approving the external auditor’s plan for the current year end > Review of the policy on the provision of non-audit services by
the external auditor > Consideration and challenge of the draft valuation of the
Group’s investments prepared by the Investment Advisor and recommendations made to the Board on the appropriateness of the valuation
> Review of the Group’s policy for preventing fraud and bribery Key Areas Reviewed During 2013The Committee undertook the following activities in discharging its responsibilities during 2013:
Adoption of investment entity reportingThe Company has chosen to adopt amendments to IFRS10, IFRS12 and IAS 27 available to qualifying investment entities a year ahead of the mandatory deadline. Under the new guidance the Company therefore no longer consolidates its underlying investment entities but instead it carries them at fair value.
The Company continues to consolidate service entities within the Group. The implications of early application and the impact on the Group’s financial statements were discussed with the Investment Advisor regularly during the year and with the auditors as part of the audit planning process.
The Investment Advisor prepared a detailed report to the Company outlining the impact of the changes from adopting the new guidance on the financial statements.
The Committee reviewed the Investment Advisor’s report and considered the reporting changes and their implications. The Committee recommended to the Board that the new guidance be adopted ahead of the mandatory deadline as it offered greater clarity to shareholders.
Significant issues considered in relation to the Financial StatementsFair Value of InvestmentsPrior to the Board’s review of the interim and year-end financial statements the Audit and Risk Committee considered the key accounting judgements made in preparing the financial statements. The most significant judgement related to the fair value of the Company’s investments.
As outlined in note 13 of the financial statements, the fair value of investments at 31 December 2013 was £844.4 million. Market quotations are not available for these financial assets. Instead their valuation is undertaken using a discounted cash flow methodology. This requires a series of judgements to be made as explained in note 13 to the financial statements.
The valuation process and methodology were discussed with the Investment Advisor regularly during the year and with the auditor as part of the year-end audit planning and interim review processes. The Committee also challenged the Investment Advisor on the year-end fair value of investments as part of its consideration of the final statutory financial statements.
During the period, the Board reviewed the Investment Advisor’s quarterly valuation report. The Investment Advisor determined that the valuation methodology had been applied consistently with the prior year with the exception of a change in the methodology for the valuing senior debt investments so as to be consistent with the basis of preparation of the financial statements (following adoption of investment entity reporting). The Committee, having considered the negligible impact on fair value of investments from the change in approach to senior debt, recommended its appropriateness to the Board.
The auditor explained the results of their review of the valuations, including their challenge of management’s underlying cash flow projections and assumptions; macro-economic assumptions; and discount rate methodology and output. On the basis of their audit work the auditor confirmed no material adjustments were proposed.
Audit and Risk Committee Report

INTERNATIONAL PUBLIC PARTNERSHIPS Annual Report and Financial Statements 2013 45
Com
pany O
verviewH
ighlightsC
hairman’s
LetterS
trategic R
eportC
orporate
Governance
Financial S
tatements
Internal controls over financial reportingThe Committee satisfied itself that the system of internal control and compliance over financial reporting was effective, through regular reports from the Investment Advisor and Administrator. The current (and previous) Audit Committee Chairman had direct access and independent discussions with the external auditor during the course of the year.
Controls and process reviewsThroughout 2013 the Company’s governance and assurance functions have continued to be enhanced, including the Company engaging an independent third party to perform reviews over selected controls and processes, the focus of which is agreed on an annual basis. As part of the 2013 review, the Committee procured a review of anti-bribery and corruption processes and controls. The review confirmed adequate procedures were in place and offered a recommendation for further enhancements.
External AuditorsThe Committee recommended to the Board the scope and terms of engagement of the third party audit firm. The Committee considered auditor effectiveness, audit tenure and audit tendering.
Objectivity and independenceIn assessing the objectivity of the auditors the Committee considered the terms under which the external auditors may be appointed to perform non-audit services. Work expected to be completed by external auditors includes formal reporting for shareholders, regulatory assurance reports and work in connection with new investments.
Under the policy there is a specific list of services for which the external auditors cannot be engaged as the Committee considers that the provision of such services would impact their independence. Any potential services to be provided by the external auditors that have an expected value of up to £50,000 and which are not prohibited by the policy must be pre-approved by the Chairman of the Committee (previously the Board), any services above this require pre-approval by the full Committee (previously by the Board).
Non-audit fees represented 16% of total audit fees, reflecting the relatively low level of non-audit work conducted.
In order to maintain Ernst and Young’s (‘EY’) independence and objectivity, EY undertook its standard independence procedures in relation to those engagements and confirmed compliance with these to the Committee. Further details on the amounts of non- audit work paid to EY are set out in note 8 to the financial statements. These were reported to and considered by the Committee as not being so significant so as to risk impacting objectivity and independence.
Audit tendering and tenureIn October 2010, the Company put the audits of the Company and controlled investment entities out to tender. In addition to complying with good practice and satisfying new corporate governance requirements, the tender enabled the Board to benchmark competitiveness and value for money.
A number of firms were approached to tender for the audit. The list was based upon their experience, industry skills and knowledge, their ability to perform the audit to a high standard and any pre-existing business relationships that might affect their independence. Following a review of the proposals received, a recommendation was made to the Board to appoint Ernst and Young LLP as the new auditors (previously Deloitte LLP).
The current auditors have therefore only been engaged for two previous year-end audits. In accordance with the relevant Corporate Governance Code principles the Committee will continue to review the effectiveness of the external auditor and seek to retender in line with best practice.
Review of auditor effectivenessFor the year ended 31 December 2013 the Committee reviewed the effectiveness and independence of the external auditors. This was facilitated through the completion of a questionnaire by the relevant stakeholders (including members of the Committee and key financial management of the Investment Advisor); interviews with finance staff; and a review of the audit plan and process for the year.
Following this review the Committee recommended to the Board that Ernst and Young LLP be reappointed as external auditors for the year ended December 2014.
Fair, Balanced and UnderstandableThe Committee has considered the Annual Report and Financial Statements and, taken as a whole, consider them to be fair, balanced and understandable and provides the information necessary for shareholders to assess the Company’s performance, business model and strategy.
The Company introduced a new process for the review of the2013 Annual Report and Financial Statements in order to ensure that it is ‘fair, balanced and understandable’. This process included thorough review of the revised regulatory requirements, a process to determine the accuracy, consistency and clarity of the financial results and language, and a detailed review by all appropriate parties including external advisors.
The Audit Committee has reviewed the Company’s 2013 Annual Report and Financial Statements and has advised the Board that, in its opinion, the Annual Report and Financial Statements, taken as a whole, is fair, balanced and understandable and provides the information necessary to assess the Company’s performance, operating model and strategy.
John Whittle26 March 2014Chairman, Audit and Risk Committee

46 INTERNATIONAL PUBLIC PARTNERSHIPS Annual Report and Financial Statements 2013
Board of Directors
Rupert Dorey Chairman
Background and ExperienceAged 53 and a resident of Guernsey, Rupert has over 30 years of experience in financial markets, including 17 years at CSFB where he specialised in credit related products.
Rupert’s expertise was principally in the areas of debt distribution, origination and trading, where he held a number of senior positions at CSFB, including Fixed income Credit product coordinator for European offices and head of UK Credit and Rates Sales.
Since 2005 Rupert has been a Non- Executive Director for a number of Hedge Funds, Private Equity & Infrastructure Funds.
Rupert is a member of the Institute of Directors.
Date of Appointment2 August 2006.
Listed Company and Other Relevant DirectorshipsGuernsey Chamber of Commerce (President), M&G General Partner Inc, Episode LLP & Episode Inc., Tetragon Financial Group Ltd/Tetragon Financial Group Master Fund Ltd, AP Alternative Assets LP, AAA Guernsey Ltd, Partners Group Global Opportunities Ltd, HarbourVest Senior Loans Europe Ltd, CQS Diversified Fund Ltd, Cinven Capital Management III, IV Ltd, V General Partner Ltd, Cinven Ltd.
Committee MembershipChairman of the Board Member of Audit and Risk Committee Member of Management Engagement Committee.
Giles Frost
Background and ExperienceAged 51, resident in the United Kingdom, Giles is a founder and director of Amber and has worked in the infrastructure investments sector for over 20 years. Giles qualified as a solicitor and partner in the law firm Wilde Sapte (now Dentons).
Giles is a director of Amber Infrastructure Group Holdings Limited, the ultimate holding company of the Investment Advisor to the Company and various of its subsidiaries.
Date of Appointment2 August 2006.
Listed Company and Other Relevant DirectorshipsGiles is also a director of a number of the Company’s subsidiary and investment holding entities and of other entities in which the Company has an investment. Neither he nor Amber Infrastructure Limited receives directors’ fees from such roles for the Company.
Keith Dorrian ex-Chairman
Background and ExperienceAged 67, a resident of Guernsey, Keith has over 40 years of relevant professional experience at Executive Board level in the banking, finance and fund management industries.
A former committee member of the Guernsey Investment Fund Association Keith is a member of the Institute of Financial Services, holds the Institute of Directors Diploma in Company Direction and has been elected a Fellow of the Institute.
Date of Appointment2 August 2006.
Listed Company and Other Relevant DirectorshipsBrevan Credit Catalyst Limited, Third Point Offshore Investors Limited, Eurocastle Investments Limited.
Committee MembershipMember of Audit and Risk Committee Member of Management EngagementCommittee.

INTERNATIONAL PUBLIC PARTNERSHIPS Annual Report and Financial Statements 2013 47
Com
pany O
verviewH
ighlights C
hairman’s
LetterS
trategic R
eportC
orporate
Governance
Financial S
tatements
John Whittle
Background and ExperienceAged 58, John is a resident of Guernsey. John is a Chartered Accountant and holds the Institute of Directors Diploma in Company Direction. John chairs the NED sub-committee of the Guernsey Investment Fund Association.
John was previously Finance Director of Close Fund Services, a large independent fund administrator.
Prior to moving to Guernsey, John was at Price Waterhouse in London before embarking on a career in business services, predominantly telecoms.
Date of Appointment6 August 2009.
Listed Company and Other Relevant DirectorshipsStarwood European Real Estate Finance Limited, Globalworth Real Estate Investments Ltd, India Capital Growth Fund Ltd and Advance Frontier Markets Fund Ltd.
Committee MembershipSenior Independent Director Chairman of Audit and Risk Committee Member of Management Engagement Committee.
Claire Whittet
Background and ExperienceAged 58 and a resident of Guernsey, Claire has over 35 years’ experience in the banking industry. Since 2003 Claire has been a Director and, more recently, Managing Director and Co-Head of Rothschild Bank International Ltd and Director of Rothschild Bank (CI) Ltd. Claire was previously with Bank of Scotland and was latterly Global Head of Private Client Credit at Bank of Bermuda.
Claire is a member of the Chartered Institute of Bankers in Scotland, a member of the Chartered Insurance Institute, a Chartered Banker, a member of the Institute of Directors and holds the Institute of Directors Diploma in Company Direction.
Date of Appointment10 September 2012.
Listed Company and Other Relevant DirectorshipsTwentyFour Select Monthly Income Fund Limited.
Listed Company and Other Relevant Directorships Chairman – Management Engagement Committee Member of Audit and Risk Committee.
John Stares
Background and ExperienceAged 62 and a resident of Guernsey since 2001, John has 40 years business experience.
Before moving to Guernsey John worked for 23 years as a management consultant with Accenture where he held a wide variety of leadership roles.
John is a Fellow of the Institute of Chartered Accounts in England and Wales, a member of the Worshipful Company of Management Consultants and a Freeman of the City of London.
Date of Appointment28 August 2013.
Listed Company and Other Relevant DirectorshipsJT Group (Chairman), Jersey Electricity, Terra Firma (Guernsey-based entities), Governor of More House School (Chair), New Philanthropy Capital (Trustee).
Committee MembershipChairman – Risk Sub Committee Member of Audit and Risk Committee Member of Management Engagement Committee.

48 INTERNATIONAL PUBLIC PARTNERSHIPS Annual Report and Financial Statements 2013
IntroductionThe Directors present their Annual Report on the performance of the Company and Group for the year ended 31 December 2013.
Principal ActivityThe Company is a limited liability, Guernsey incorporated authorised closed-ended investment company under Companies (Guernsey) Law, 2008. The Company shares have a premium listing on the Official List of the UK Listing Authority and are traded on the main market of the London Stock Exchange.
The Chairman’s Statement and Strategic Report contain a review of the business during the year. A Corporate Governance Statement is provided on pages 35 to 43.
Directors’ IndemnitiesThe Company has made qualifying third-party indemnity provisions for the benefit of its Directors which were made during the period and remain in force at the date of this report.
Substantial ShareholdingsAs at 31 December 2013, the Company had been notified, in accordance with chapter 5 of the Disclosure and Transparency Rules, of the following interests in 5% or more of the Company’s Ordinary Shares to which voting rights are attached:
Name of holder% Issued Capital
No. of Ordinary Shares Date notified
Schroder Investment Management Ltd
13.21%
63,274,260
10 May 2011
Investec Wealth & Investment
10.38%
80,543,156
15 Jan 2013
As at 21 March 2014, being the most current information available, this position was unchanged.
Directors’ Authority to Buy Back Shares and Treasury SharesThe Company did not purchase any shares for treasury or cancellation during the year.
The current authority of the Company to make market purchases of up to 14.99% of the issued Ordinary Share Capital expires on 12 June 2014. The Company will seek to renew such authority at the Annual General Meeting to take place on 12 June 2014. Any buy back of Ordinary Shares will be made subject to Guernsey law and within any guidelines established from time to time by the Board and the making and timing of any buy backs will be at the absolute discretion of the Board.
Purchases of Ordinary Shares will only be made through the market at prices below the prevailing NAV of the Ordinary Shares (as last calculated) where the Directors believe such purchases will enhance shareholder value. Such purchases will also only be made in accordance with the Listing Rules of the UK Listing
Authority which provide that the price to be paid must not be more than 5% above the average of the middle market quotations for the Ordinary Shares for the five business days before the shares are purchased (unless previously advised to shareholders). In accordance with the Company’s Articles of Association up to 10% of the Company’s shares may be held as treasury shares.
Going ConcernThe Group’s business activities, together with the factors likely to affect its future development, performance and position are set out in the Strategic Report on pages 7 to 34. The financial position of the Group, its cash flows, liquidity position and borrowing are described in the financial statements from page 52.
The Directors have considered significant areas of possible financial risk and comprehensive financial forecasts have been prepared and submitted to the Board for review. The Directors have, based on the information contained in these forecasts and the assessment of the committed banking facilities in place, formed a judgement, at the time of approving the financial statements, that the Group and the Company have adequate resources to continue in operational existence for the foreseeable future. After consideration, the Directors are satisfied that it is appropriate to adopt the going concern basis in preparing the financial statements.
Each of the persons who is a Director at the date of approval of this Annual Report confirms that:
> So far as the Director is aware, there is no relevant audit information of which the Company’s auditors are unaware
The Director has taken all the steps that he/she ought to have taken as a Director in order to make himself/herself aware of any relevant audit information and to establish that the Company’s auditors are aware of that information. This confirmation is given and should be interpreted in accordance with the provisions of Section 249 of the Companies (Guernsey) Law, 2008.
By order of the Board
Rupert Dorey John Whittle26 March 2014 26 March 2014Chairman Director
Directors’ Report

INTERNATIONAL PUBLIC PARTNERSHIPS Annual Report and Financial Statements 2013 49
Com
pany O
verviewH
ighlightsC
hairman’s
LetterS
trategic R
eportC
orporate
Governance
Financial S
tatements
The Directors are responsible for preparing financial statements for each year which give a true and fair view, in accordance with the applicable Guernsey law and International Financial Reporting Standards as adopted by the European Union, of the state of affairs of the Group and of the profit or loss of the Group for that year. In preparing those financial statements, the Directors are required to:
> Select suitable accounting policies and then apply them consistently
> Make judgments and estimates that are reasonable > State whether applicable accounting standards have been
followed, subject to any material departures disclosed and explained in the financial statements
> Prepare the financial statements on a going concern basis unless it is inappropriate to presume that the Group will continue in business
The Directors confirm that they have complied with the above requirements in preparing the financial statements.
The Directors are responsible for keeping proper accounting records, which disclose with reasonable accuracy at any time, the financial position of the Group and to enable them to ensure that the financial statements comply with The Companies (Guernsey) Law, 2008. They are also responsible for safeguarding the assets of the Group and hence for taking reasonable steps for the prevention and detection of fraud, error and non-compliance with law and regulations.
The maintenance and integrity of the Company’s website is the responsibility of the Directors; the work carried out by the auditors does not involve considerations of these matters and, accordingly, the auditors accept no responsibility for any change that may have occurred to the financial statements since they were initially presented on the website. Legislation in Guernsey governing the preparation and dissemination of the financial statements may differ from legislation in other jurisdictions.
Responsibility Statement of the Directors in respect of the Consolidated Annual Report and Financial Statements The Directors each confirm to the best of their knowledge that:
> The Consolidated Financial Statements, prepared in accordance with IFRSs as adopted by the European Union give a true and fair view of the assets, liabilities, financial position and net return of the Group
> The Annual Report includes a fair review of the development and performance of the business and the position of the Group, together with a description of the principal risks and uncertainties faced
Directors’ Statement under the UK Corporate Governance CodeThe Board as advised by the Audit and Risk Committee hasconsidered the Annual Report and Financial Statements and, taken as a whole, consider them to be fair, balanced and understandable and provides the information necessary for shareholders to assess the Company’s performance, business model and strategy.
By order of the Board
Rupert Dorey John Whittle26 March 2014 26 March 2014Chairman Director
Directors’ Responsibilities Statement

50 INTERNATIONAL PUBLIC PARTNERSHIPS Annual Report and Financial Statements 2013
We have audited the financial statements of International Public Partnerships Limited (the Group) for the year ended 31 December 2013 which comprise the Consolidated Statement of Comprehensive Income, the Consolidated Statement of Changes in Equity, the Consolidated Balance Sheet, the Consolidated Cash Flow Statement and related notes 1 to 23. The financial reporting framework that has been applied in their preparation is applicable law and International Financial Reporting Standards (‘IFRS’s) as adopted by the European Union.
This Report is made solely to the Company’s members, as a body, in accordance with Section 262 of Companies (Guernsey) Law, 2008. Our audit work has been undertaken so that we might state to the Company’s members those matters we are required to state to them in an auditor’s report and for no other purpose. To the fullest extent permitted by law, we do not accept or assume responsibility to anyone other than the Company and the Company’s members as a body, for our audit work, for this report, or for the opinions we have formed.
Respective Responsibilities of Directors and AuditorAs explained more fully in the Directors’ Responsibilities Statement set out on page 49, the Directors are responsible for the preparation of the financial statements and for being satisfied that they give a true and fair view. Our responsibility is to audit and express an opinion on the financial statements in accordance with applicable law and International Standards on Auditing (UK and Ireland). Those standards require us to comply with the Auditing Practices Board’s Ethical Standards for Auditors.
Scope of the Audit of the Financial StatementsAn audit involves obtaining evidence about the amounts and disclosures in the financial statements sufficient to give reasonable assurance that the financial statements are free from material misstatement, whether caused by fraud or error. This includes an assessment of whether the accounting policies are appropriate to the Group’s circumstances and have been consistently applied and adequately disclosed; the reasonableness of significant accounting estimates made by the Directors; and the overall presentation of the financial statements. In addition, we read all the financial and non-financial information in the Annual Report and Financial Statements to identify material inconsistencies with the audited financial statements and to identify any information that is apparently materially incorrect based on, or materially inconsistent with, the knowledge acquired by us in the course of performing the audit. If we become aware of any apparent material misstatements or inconsistencies we consider the implications for our Report.
Opinion on Financial Statements In our opinion the financial statements:
> give a true and fair view of the state of the Group’s affairs as at 31 December 2013 and of its profit for the year then ended;
> have been properly prepared in accordance with IFRSs as adopted by the European Union; and
> have been prepared in accordance with the requirements of the Companies (Guernsey) Law, 2008.
Our Assessment of Risks of Material MisstatementWe identified the following risk that has had the greatest effect on the overall audit strategy and scope; the allocation of resources in the audit; and directing the efforts of the engagement team:
> the assessment of the fair value of ‘Investments at Fair Value through Profit and Loss’.
Our Application of MaterialityWe determined materiality for the Group to be £9 million, which is approximately 1% of equity. This provided a basis for determining the nature, timing and extent of risk assessment procedures, identifying and assessing the risk of material misstatement and determining the nature, timing and extent of further audit procedures.
On the basis of our risk assessments, together with our assessment of the Group’s overall control environment, our judgement is that overall performance materiality for the Group should be 50% of materiality, namely £4.5 million.
A lower materiality of £1.2 million has been applied to Interest income, Dividend income and Management costs to be responsive to the expectations of the users of the financial statements with regard to misstatements in these balances of a lesser amount than the Group materiality. Performance materiality for these balances has been determined to be 50% of materiality, namely £0.65 million.
We agreed with the Audit Committee that we would report to the Committee all audit differences in excess of £0.45 million, as well as differences below that threshold that, in our view, warranted reporting on qualitative grounds.
Independent Auditor’s Report to the Members of International Public Partnerships Limited

INTERNATIONAL PUBLIC PARTNERSHIPS Annual Report and Financial Statements 2013 51
Com
pany O
verviewH
ighlights C
hairman’s
LetterS
trategic R
eportC
orporate G
overnanceFinancial S
tatements
An Overview of the Scope of our AuditIn assessing the risk of material misstatement to the consolidated financial statements, our Group audit scope focused on the fair value of investments through profit and loss and the consolidated investment entity and service entities in the Group, as defined by IFRS 10 Consolidated Financial Statements. Our response to the risk of material misstatement identified above included the following procedures:
> we evaluated the Board’s assessment of the investment group to be accounted for at fair value in accordance with IFRS;
> we understood the investment valuation process and key management controls around the financial models; and
> we challenged the Board’s assumptions underpinning the fair value of investments, including the key inputs of the forecast cash flows, the discount rates used, and the historical accuracy of forecasts. We used a valuation specialist to assist us with our consideration of the discount rates, foreign exchange rates and inflation rates used.
Matters on Which We are Required to Report by ExceptionWe have nothing to report in respect of the following:
Under the ISAs (UK and Ireland), we are required to report to you if, in our opinion, information in the Annual Report is:
> materially inconsistent with the information in the audited financial statements; or
> apparently materially incorrect based on, or materially inconsistent with, our knowledge of the Group acquired in the course of performing our audit; or
> is otherwise misleading.
In particular, we are required to consider whether we have identified any inconsistencies between our knowledge acquired during the audit and the Directors’ Statement that they consider the Annual Report is fair, balanced and understandable and whether the Annual Report appropriately discloses those matters that we communicated to the Audit Committee which we consider should have been disclosed.
Under the Companies (Guernsey) Law, 2008 we are required to report to you if, in our opinion:
> proper accounting records have not been kept; or > the financial statements are not in agreement with the
accounting records; or > we have not received all the information and explanations we
require for our audit.
Under the Listing Rules we are required to review the part of the Corporate Governance Statement relating to the Company’s compliance with the nine provisions of the UK Corporate Governance Code specified for our review.
Michael Banefor and on behalf of Ernst & Young LLP Recognised AuditorsGuernseyChannel Islands26 March 2014

52 INTERNATIONAL PUBLIC PARTNERSHIPS Annual Report and Financial Statements 2013
Financial Statements
52 Contents 53 Consolidated Statement of Comprehensive Income54 Consolidated Statement of Changes in Equity55 Consolidated Balance Sheet56 Consolidated Cash Flow Statement
57 Notes to the Financial Statements1 Basis of Preparation 2 Change in Accounting Policy – Investment Entities3 Significant Judgments and Estimates4 Segmental Reporting5 Investment Income6 Other Income7 Management Costs8 Transaction Costs9 Auditor’s Remuneration10 Finance Costs11 Tax12 Earnings Per Share13 Financial Instruments14 Investment Acquisitions15 Trade and Other Receivables16 Trade and Other Payables17 Share Capital and Reserves18 Net Assets Per Share19 Related Party Transactions20 Contingent Liabilities21 Events after Balance Sheet Date22 Other Mandatory Disclosures23 Service Concession Arrangements

INTERNATIONAL PUBLIC PARTNERSHIPS Annual Report and Financial Statements 2013 53
Com
pany O
verviewH
ighlights C
hairman’s
LetterS
trategic R
eportC
orporate G
overnanceFinancial S
tatements
Consolidated Statement of Comprehensive IncomeYear ended 31 December 2013
Notes
Year ended 31 December
2013 £’000s
Restated Year ended
31 December 2012
£’000s
Interest income 5 28,858 23,555Dividend income 5 17,669 17,275Net change in fair value of investments at fair value through profit or loss 5 30,697 40,554
Total investment income 77,224 81,384Other income 6 4,143 655
Total income 81,367 82,039
Management costs 7 (21,675) (9,418)Administrative expenses (1,378) (1,090)Transaction costs 8 (596) (1,301)Directors’ fees (245) (205)
Total expenses (23,894) (12,014)
Profit before finance costs and tax 57,473 70,025
Finance costs 10 (1,390) (1,603)
Profit before tax 56,083 68,422
Tax credit 11 2,551 1,812
Profit for the year 58,634 70,234
Earnings per shareFrom continuing operationsBasic and diluted (pence) 12 7.82 11.28
All results are from continuing operations in the year.
All income is attributable to the equity holders of the parent. There are no non-controlling interests within the Consolidated Group.
There are no other Comprehensive Income items in the current year (2012: nil). The profit for the year approximates the Total Comprehensive Income for the year.

54 INTERNATIONAL PUBLIC PARTNERSHIPS Annual Report and Financial Statements 2013
Consolidated Statement of Changes in EquityAs at 31 December 2013
Notes
Share capital Ordinary
£’000s
Other distributable
reserve £’000s
Retained earnings
£’000sTotal
£’000s
Balance at 31 December 2012 (Restated) 463,054 182,481 215,419 860,954
Total comprehensive income – – 58,634 58,634
Issue of Ordinary Shares 17 61,754 – – 61,754Issue fees applied to new shares 17 (415) – – (415)Distributions in the year 17 – – (45,536) (45,536)
Balance at 31 December 2013 524,393 182,481 228,517 935,391
As at 31 December 2012
Notes
Share capital Ordinary
£’000s
Hedging and translation
reserves £’000s
Revaluation reserves £’000s
Other distributable
reserve £’000s
Retained earnings
£’000sTotal
£’000s
Non-controlling
interest £’000s
Total £’000s
Balance at 31 December 2011 as previously reported 259,763 (158,335) 361 219,360 33,360 354,509 1,717 356,226Impact of change in accounting policy 2 – 158,335 (361) – 111,825 269,799 (1,717) 268,082
Restated balance at 31 December 2011 259,763 – – 219,360 145,185 624,308 – 624,308
Total comprehensive income – – – – 70,234 70,234 – 70,234
Issue of Ordinary Shares 17 206,367 – – – – 206,367 – 206,367Issue fees applied to new shares 17 (3,076) – – – – (3,076) – (3,076)Distributions in the year 17 – – – (36,879) – (36,879) – (36,879)
Balance at 31 December 2012 (Restated) 463,054 – – 182,481 215,419 860,954 – 860,954

INTERNATIONAL PUBLIC PARTNERSHIPS Annual Report and Financial Statements 2013 55
Com
pany O
verviewH
ighlights C
hairman’s
LetterS
trategic R
eportC
orporate G
overnanceFinancial S
tatements
Consolidated Balance SheetAs at 31 December 2013
Notes
31 December 2013
£’000s
Restated 31 December
2012 £’000s
Restated 1 January
2012 £’000s
Non-current assetsInvestments at fair value through profit or loss 13 844,382 790,663 619,399
Total non-current assets 844,382 790,663 619,399
Current assetsTrade and other receivables 15 13,020 10,955 14,635Cash and cash equivalents 13 80,609 65,776 14,110Derivative financial instruments 13 3,664 – –
Total current assets 97,293 76,731 28,745
Total assets 941,675 867,394 648,144
Current liabilitiesTrade and other payables 16 6,284 6,154 4,553Derivative financial instruments – 286 1,224
Total current liabilities 6,284 6,440 5,777
Non-current liabilitiesBank loans 10 – – 18,059
Total non-current liabilities – – 18,059
Total liabilities 6,284 6,440 23,836
Net assets 935,391 860,954 624,308
EquityShare capital 17 524,393 463,054 259,763Other distributable reserve 17 182,481 182,481 219,360Retained earnings 17 228,517 215,419 145,185
Equity attributable to equity holders of the parent 935,391 860,954 624,308
Net assets per share (pence per share) 18 123.0 121.0 116.9
The financial statements were approved by the Board of Directors on 26 March 2014.
They were signed on its behalf by:
Rupert Dorey John Whittle26 March 2014 26 March 2014Chairman Director

56 INTERNATIONAL PUBLIC PARTNERSHIPS Annual Report and Financial Statements 2013
Consolidated Cash Flow StatementAs at 31 December 2013
Notes
Year ended 31 December
2013 £’000s
Year ended 31 December
2012 £’000s
Profit from operations 58,634 70,234Adjusted for:Gain on investments at fair value through profit or loss 5 (30,697) (40,554)Unrealised exchange gain/(loss) 45 (82)Share settled performance fee 17 6,584 –Finance costs 10 1,390 1,603Net income tax credit 11 (2,551) (1,812)Fair value movement on derivative financial instruments 13 (3,950) (801)Working capital adjustments(Increase)/decrease in receivables (564) 4,673(Decrease)/increase in payables (257) 1,217Acquisition of investments at fair value through profit or loss (36,476) (146,623)Net repayments from investments at fair value through profit or loss 13,455 15,914
5,613 (96,231)Income tax paid 1,049 819
Net cash inflow from operations 6,662 (95,412)
Financing ActivitiesProceeds from issue of shares net of issue costs 17 46,080 196,941Dividends paid 17 (36,860) (30,530)Finance costs paid (1,005) (1,219)Loan repayments – (18,059)
Net cash provided by financing activities 8,215 147,133
Net increase in cash and cash equivalents 14,877 51,721Cash and cash equivalents at beginning of year 65,776 14,110Exchange loss on cash and cash equivalents (44) (55)
Cash and cash equivalents at end of year 80,6091 65,776
1 Includes restricted cash of £30.9 million available for investment.

INTERNATIONAL PUBLIC PARTNERSHIPS Annual Report and Financial Statements 2013 57
Com
pany O
verviewH
ighlights C
hairman’s
LetterS
trategic R
eportC
orporate G
overnanceFinancial S
tatements
Notes to the Financial Statements For the year ended 31 December 2013
1. Basis of Preparation International Public Partnerships Limited is a closed ended authorised investment company incorporated in Guernsey under Companies (Guernsey) Law, 2008. The address of the registered office is given on page 81. The nature of the Group’s operations and its principal activities are set out in pages 2 and 7 to 14 respectively.
These financial statements are presented in Pounds Sterling as this is the currency of the primary economic environment in which the Company operates and represents the functional currency of the parent and all values are rounded to the nearest (£’000), except when otherwise indicated.
Basis of preparationThese financial statements have been prepared in accordance with International Financial Reporting Standards (‘IFRS’), adopted by the European Union; interpretations issued by the International Financial Reporting Interpretations Committee; applicable legal and regulatory requirements of Guernsey; and the Listing Rules of the UK Listing Authority. The financial statements follow the historical cost basis, except for financial assets held at fair value through profit or loss and derivatives that have been measured at fair value. The principal accounting policies adopted are set out in relevant notes to the financial statements.
Going concernAs set out in the Directors’ Report, the Directors have reviewed comprehensive cash flow forecasts prepared by management. Based on those forecasts and an assessment of the Group’s (‘Parent and consolidated subsidiary entities’) committed banking facilities, they have concluded that it is appropriate to prepare the financial statements of the Group on a going concern basis.
In arriving at their conclusion that the Group has adequate financial resources, the Directors were mindful that the Group had unrestricted cash of £49.7 million as at 31 December 2013. On 20 January 2014, the Company’s corporate debt facility was renewed to £175 million (2012:£100 million) which is available for investment in new and existing projects and is committed until December 2016. The new facility is forecast to continue in full compliance with the associated banking covenants. The Company also continues to fully cover cost and distributions from underlying operational investment cash flows.
During the year, the Company completed various capital tap issuances as disclosed in note 17.
2. Change in Accounting Policy – Investment Entities (Amendments to IFRS 10, 11, 12 and IAS 27)International Public Partnerships Limited has chosen to early adopt IFRS 10, IFRS 12 and IAS 27 (‘Investment entities amendments’) which were endorsed by the European Union on 20 November 2013 and are mandatory for accounting periods beginning on or after 1 January 2014. The amendments require an investment entity as defined by IFRS 10 to consolidate only those subsidiaries that provide services relevant to its investment activities, such as management services, strategic advice and financial support to its investees. Subsidiaries that do not provide investment-related services are required to be measured at fair value through profit or loss in accordance with IAS 39 Financial Instruments: Recognition and Measurement.
The Directors have determined that International Public Partnerships Limited is an investment entity as defined by IFRS 10 on the basis that:a) it obtains funds from one or more investor(s) for the purpose of providing those investor(s) with investment management services;b) it commits to its investors that its business purpose is to invest funds solely for returns from capital appreciation, investment income,
or both; andc) it measures and evaluates the performance of substantially all of its investments on a fair value basis.
Part of the assessment in relation to meeting the business purpose aspects of the IFRS 10 criteria requires consideration of exit strategies. Given the Company does not intend to hold investments indefinitely (currently debt interests are not perpetual and the majority of equity interests are held in entities that have fixed term concessions) the Directors have determined the Company’s investment plans support its business purpose as an investment entity.
A small number of subsidiary entities within the International Public Partnerships Limited group have been deemed to provide investment related services and hence are consolidated on a line by line basis within the Company’s investment basis financial statements as at 31 December 2013.
The change in accounting policy has resulted in service concession entities previously consolidated now being recorded as investments at fair value through profit or loss. The significant unconsolidated subsidiary entities are disclosed in note 22.

58 INTERNATIONAL PUBLIC PARTNERSHIPS Annual Report and Financial Statements 2013
2. Change in Accounting Policy – Investment Entities (Amendments to IFRS 10, 11, 12 and IAS 27) continuedThe impact of the application of IFRS 10, 12 and 27 ‘Investment entity amendments’ on each of the line items in the 31 December 2012 financial statements is provided below:
Consolidated Balance Sheet
As at 31 December
2012
Impact of change in
accounting policy
Restated 31 December
2012
Intangible assets 376,470 (376,470) –Property, plant and equipment 7,085 (7,085) –Interest in joint ventures and associates 50,451 (50,451) –Investments at fair value through profit or loss – 790,663 790,663Available for sale financial assets 30,197 (30,197) –Deferred tax assets 36,102 (36,102) –Financial assets – Loans and receivables 2,627,349 (2,627,349) –Trade and other receivables 50,788 (39,833) 10,955Cash and cash equivalents 426,589 (360,813) 65,776Derivative financial instruments 1,632 (1,632) –Trade and other payables (81,984) 75,830 (6,154)Current tax liabilities (777) 777 –Bank loans (2,543,487) 2,543,487 –Deferred tax liabilities (83,574) 83,574 –Long-term provisions (18,289) 18,289 –Derivative financial instruments (358,182) 357,896 (286)
Net assets 520,370 340,584 860,954
Share capital 463,054 – 463,054Revaluation reserves 5,095 (5,095) –Hedging and translation reserves (187,877) 187,708 (169)Other distributable reserve 182,481 – 182,481Retained earnings 62,669 152,919 215,588
Equity and reserves 525,422 335,532 860,954Minority interest (5,052) 5,052 –
Equity and reserves attributable to shareholders of the Company 520,370 340,584 860,954
Consolidated Statement of Comprehensive Income
As at 31 December
2012
Impact of change in
accounting policy
Restated 31 December
2012
Interest income 180,571 (157,016) 23,555Dividend income – 17,275 17,275Investments at fair value through profit loss – 40,554 40,554Revenue 244,089 (244,089) –Cost of sales (215,860) 215,860 –Share of results of joint ventures and associates (999) 999 –Other operating income 4,151 (4,151) –Other net losses (1,772) 1,772 –Financial costs (144,617) 143,014 (1,603)Operating expenses (36,198) 36,853 655Management fees – (9,418) (9,418)Secretarial and administration fees – (1,090) (1,090)Transaction costs – (1,301) (1,301)Directors’ fees – (205) (205)Administrative expenses (2,487) 2,487 –Impairment charges (90) 90 –Tax 825 987 1,812Minority interest 1,696 (1,696) –Net income attributable to equity holders of the Parent 29,309 40,925 70,234
Earnings per share 4.71 6.57 11.28
Notes to the Financial Statements continuedFor the year ended 31 December 2013

INTERNATIONAL PUBLIC PARTNERSHIPS Annual Report and Financial Statements 2013 59
Com
pany O
verviewH
ighlights C
hairman’s
LetterS
trategic R
eportC
orporate G
overnanceFinancial S
tatements
3. Significant Judgments and Estimates Service entities and consolidation groupFollowing the adoption of IFRS 10 Investment Entity Amendments (see change in accounting policy in note 2), the consolidated financial statements incorporate the financial statements of the Company and service entities controlled by the Company up to 31 December 2013. Judgment is required in assessing the entities which qualify as service entities. Typically a service entity provides management services, strategic advice and financial support to investee entities. Judgment is therefore required in assessing which entities meet these definitional requirements. The Directors have reviewed and assessed the criteria applied in the assessment of services entities based on the guidance in place as at 31 December 2013 and are satisfied with the resulting conclusion. Since 31 December 2013 the International Financial Reporting Interpretations Council has proposed the International Accounting Standards Board (‘IASB’) provide further clarity on the accounting treatment for investment service entities. It is currently unclear if the IASB will make any changes to IFRS10.
If future guidance or changes to IFRS 10 require investment service entities (such as those currently consolidated) to instead be accounted for at fair value this would have an impact on disclosures in the Financial Statements, however this would not be expected to have a substantial impact on overall Group net assets.
Fair valuation of investments at fair value through profit or lossFair values are determined using the income approach which discounts the expected cash flows at a rate appropriate to the risk profile of each asset. In determining the discount rate, to relevant long-term government bond yields, specific risks and the evidence of recent transactions are considered. Details of the valuation process and key sensitivities are provided in note 13.
4. Segmental ReportingBased on a review of information provided to the chief operating decision makers in International Public Partnerships Limited, the Group has identified four reportable segments based on the geographical risk associated within the Group. The factors used to identify the Group’s reportable segments are centred on the risk free rates and the maturity of the Infrastructure sector (particularly PFI/PPP) within each country. Further, foreign exchange and political risk is identified, as these also determine where resources are allocated. Management has concluded that the Group is currently organised into four reportable segments being UK, Europe (non UK), Australia and North America.
Year ended 31 December 2013
UK £’000s
Europe Non UK
£’000s
NorthAmerica1
£’000sAustralia
£’000sTotal
£’000s
Segmental resultsDividend and interest income 36,763 1,555 2,965 5,244 46,527Fair value gain/(loss) on investments 36,195 10,761 (2,122) (14,137) 30,697
Total investment income 72,958 12,316 843 (8,893) 77,224
Reporting segment profit/(loss) 51,0202 12,436 1,389 (6,211) 58,634
Segmental financial positionInvestments at fair value 525,060 187,104 41,659 90,559 844,382Current assets 97,293 – – – 97,293
Total assets 622,353 187,104 41,659 90,559 941,675Total liabilities (6,284) – – – (6,284)
Net assets 616,069 187,104 41,659 90,559 935,391
1 North American segment currently relates entirely to projects in Canada. 2 Reporting segment results are stated net of operational costs including management fees.

60 INTERNATIONAL PUBLIC PARTNERSHIPS Annual Report and Financial Statements 2013
4. Segmental Reporting continuedYear ended 31 December 2012
UK £’000s
Europe Non UK
£’000s
NorthAmerica1
£’000sAustralia
£’000sTotal
£’000s
Segmental resultsDividend and interest income 30,167 1,884 2,918 5,861 40,830Fair value gain/(loss) on investments 12,386 22,601 (4,422) 9,989 40,554
Total investment income 42,553 24,485 (1,504) 15,850 81,384
Reporting segment profit 30,6782 24,489 (1,583) 16,650 70,234
Segmental financial positionInvestments at fair value 496,301 148,392 37,174 108,796 790,663Current assets 76,731 – – – 76,731
Total assets 573,032 148,392 37,174 108,796 867,394
Total liabilities (6,440) – – – (6,440)
Net assets 566,592 148,392 37,174 108,796 860,954
1 North American segment currently relates entirely to projects in Canada.2 Reporting segment results are stated net of operational costs including management fees.
Revenue from investee entities, representing more than 10% of the Group’s interest and dividend income approximates £18.04 million (2012: £15.65 million).
Fair value movements in the period for North America and Australia are primarily due to strengthening of Sterling against the local currency denominated underlying investment cash flows.
Fair value movements in the period for the UK are due to changes in macroeconomic assumptions, in particular, reduction in enacted tax rates and changes in long-term inflation assumptions.
5. Investment IncomeAccounting policyInterest IncomeInterest income is recognised when it is probable that the economic benefits will flow to the Group and the amount of income can be measured reliably. Interest income is accrued on a time-apportioned basis, using the effective interest rate of the instrument concerned as calculated at the acquisition or origination date. Interest income is recognised gross of withholding tax, if any.
The effective interest rate is the rate that exactly discounts the estimated future cash payments and receipts through the expected life of the financial instrument (or, when appropriate, a shorter period). When calculating the effective interest rate, the Group estimates future cash flows considering all contractual terms of the financial instrument, but not future credit losses.
Dividend IncomeDividend income is recognised gross of withholding tax in the Consolidated Statement of Comprehensive Income on the date the right to receive payment is established. This is usually the date when the Directors of the underlying project entity approve the payment of a dividend.
Net Gain from Financial Instruments at Fair Value through Profit or LossNet gain from financial instruments at fair value through profit or loss includes all realised and unrealised fair value changes (including foreign exchange movements) other than interest and dividend income recognised separately.
Notes to the Financial Statements continuedFor the year ended 31 December 2013

INTERNATIONAL PUBLIC PARTNERSHIPS Annual Report and Financial Statements 2013 61
Com
pany O
verviewH
ighlights C
hairman’s
LetterS
trategic R
eportC
orporate G
overnanceFinancial S
tatements
5. Investment Income continued
Year ended 31 December
2013 £’000s
Restated Year ended
31 December2012
£’000s
Interest incomeInterest on investments 28,309 23,409Interest on bank deposits 549 146
Total interest income 28,858 23,555
Dividend income 17,669 17,275Net change in fair value of financial assets at fair value through profit or loss 30,697 40,554
Total investment income 77,224 81,384
All dividend income and interest income has resulted from transactions with unconsolidated subsidiary entities. Gains on investments at fair value through profit or loss are also recognised on investments in unconsolidated subsidiaries.
6. Other Income Other income of £4.1 million (2012: £0.7 million) includes fair value movements in derivative financial instruments amounting to £3.9 million (2012: £0.8 million).
7. Management Costs
Year ended 31 December
2013 £’000s
Restated Year ended
31 December2012
£’000s
RecurringBase fee 10,702 9,418Non recurringIncentive fee1 10,973 –
Total management costs 21,675 9,418
1 Represents 100% of the incentive fee.
In 2013, the Investment Advisor was entitled to an additional incentive fee. This is the final incentive fee that will be due following the renegotiation of the Investment Advisory Agreement and Partnership Deed as detailed in note 19.
8. Transaction Costs
Year ended 31 December
2013 £’000s
Restated Year ended
31 December2012
£’000s
Investment advisory costs 548 1,022Legal and professional costs 48 279
Total transaction costs 596 1,301
Details of investment advisory costs paid are provided in note 19.

62 INTERNATIONAL PUBLIC PARTNERSHIPS Annual Report and Financial Statements 2013
9. Auditor’s Remuneration
Year ended 31 December
2013 £’000s
Restated Year ended
31 December2012
£’000s
Fees payable to the Company’s auditors for the audit of the Company’s financial statements 148 35Fees payable to the Company’s auditors and their associates for other services to the Group– The audit of the Company’s consolidated subsidiaries 7 7– The audit of the Company’s unconsolidated subsidiaries 438 762– Audit related assurance services 20 20
Total audit fees 613 824
Other fees– Regulatory reporting 55 97– Other services 18 75
Total non-audit fees 73 172
10. Finance CostsAccounting policyBorrowing costs are recognised in the Consolidated Statement of Comprehensive Income in the period in which they are incurred using the effective interest rate method. Arrangement fees are amortised over the term of the corporate borrowing facility.
Year ended 31 December
2013 £’000s
Restated Year ended
31 December2012
£’000s
Commitment fees and other charges 1,005 1,218Issue cost amortisation 385 385
Total finance costs 1,390 1,603
On 24 January 2014, the Company renewed the corporate debt facility with the existing providers, Royal Bank of Scotland and National Australia Bank Limited and increased the facility from £100 million to £175 million (refer to note 21 for further details). The amount undrawn at 31 December 2013 was £100 million (2012: £100 million undrawn). The interest rate margin on the corporate facility is 225 basis points over Libor. The loan facility matures in December 2016 and is secured over the assets of the Company.
11. TaxAccounting policyCurrent tax is based on taxable profit for the period. Taxable profit differs from net profit as reported in the Consolidated Statement of Comprehensive Income as it excludes items of income or expense that are taxable or deductible in past or future years and it further excludes items that are never taxable or deductible. The Group’s asset/liability for current tax is calculated using tax rates that have been enacted or substantively enacted by the balance sheet date. The current tax charge/credit in the Consolidated Statement of Comprehensive Income is recognised net of receivables recognised for losses surrendered to unconsolidated group subsidiary entities.
Under the current system of taxation in Guernsey, the Company itself is exempt from paying taxes on income, profits or capital gains. Dividend income and interest income received by the Consolidated Group may be subject to withholding tax imposed in the country of origin of such income.
Year ended 31 December
2013£’000s
Year ended 31 December
2012 £’000s
Current tax:UK corporation tax – current year (2,447) (2,171)UK corporation tax – prior year – 130Overseas tax – current year 66 229Overseas tax – prior year (170) –
Tax credit for the year (2,551) (1,812)
Notes to the Financial Statements continuedFor the year ended 31 December 2013

INTERNATIONAL PUBLIC PARTNERSHIPS Annual Report and Financial Statements 2013 63
Com
pany O
verviewH
ighlights C
hairman’s
LetterS
trategic R
eportC
orporate G
overnanceFinancial S
tatements
11. Tax continuedReconciliation of effective tax rate
Year ended 31 December
2013£’000s
Year ended 31 December
2012 £’000s
Profit before tax 56,083 68,422
Expected tax on profit at Guernsey corporation rate – 0% (2012: 0%) – –Application of overseas tax rates 66 229Group tax losses surrendered to unconsolidated investment entities (2,447) (2,171)Prior year adjustments (170) 130
Tax credit for the year (2,551) (1,812)
The income tax credit above does not represent the full tax position of the entire group as the investment returns received by the Company are net of tax payable at the underlying investee entity level. As a consequence of the adoption of IFRS 10 investment entity consolidation exemption, underlying investment entity tax is not consolidated within these financial statements. Total forecasted corporation tax payable by the Group’s underlying investments is £647 million over their full concession lives.
12. Earnings Per Share The calculation of basic and diluted earnings per share is based on the following data:
Year ended 31 December
2013 £’000s
Restated Year ended
31 December2012
£’000s
Earnings for the purposes of basic and diluted earnings per share being net profit attributable to equity holders of the Parent 58,634 70,234
Number Number
Number of sharesWeighted average number of Ordinary Shares for the purposes of basic and diluted earnings per share 749,629,388 622,834,422
Basic and diluted 7.82 11.28
The denominator for the purposes of calculating both basic and diluted earnings per share is the same, as the Company has not issued any share options or other instruments that would cause dilution.
13. Financial InstrumentsFinancial assets and financial liabilities are recognised when contractual provisions of the instrument are entered into. Financial assets are derecognised when the contractual rights to the cash flows from the instrument expire or the asset is transferred and the transfer qualifies for derecognition in accordance with IAS 39 ‘Financial Instruments: Recognition and Measurement’. Specific financial asset and liability accounting policies are provided below. Financial liabilities are derecognised when the obligation is discharged, cancelled or expired.
13.1 Financial assets
31 December2013
£’000s
Restated 31 December
2012 £’000s
Investments at fair value through profit and loss1 844,382 790,663Financial asset loans and receivablesTrade and other receivables 13,020 10,955Cash and cash equivalents 80,609 65,776Derivative financial instrumentsCurrency swaps 3,664 –
Total financial assets 941,675 867,394
1 Includes fair value of investments in associates amounting to £1.8 million (2012: £2.1 million). Movements in the period represent additional investments and fair value gains offset by net repayments from investments.

64 INTERNATIONAL PUBLIC PARTNERSHIPS Annual Report and Financial Statements 2013
13. Financial Instruments continued 13.1 Financial assets continuedAccounting PolicyThe Group classifies its financial assets as at fair value through profit or loss or as loans and receivables. The classification depends on the purpose for which the financial assets were acquired, with investments in unconsolidated subsidiaries (other than those providing investment-related services) being designated at fair value through profit and loss as required by IFRS 10.
Investments at Fair Value through Profit or LossInvestments in underlying unconsolidated subsidiaries are designated upon initial recognition as financial assets at fair value through profit or loss. The Group’s policy is to fair value both the equity and debt investments in PPP assets together. All transaction costs relating to the acquisition of new investments are recognised directly in profit or loss. Subsequent to initial recognition, the investments are measured on a combined basis at fair value with changes in fair value recognised within operating income in the Consolidated Statement of Comprehensive Income.
Financial Assets Loans and ReceivablesTrade receivables, loans and other receivables that are non-derivative financial assets and that have fixed or determinable payments and are not quoted in an active market are classified as ‘loans and other receivables’. Loans and other receivables are measured at amortised cost using the effective interest method, less any impairment. When calculating the effective interest rate, the Group estimates cash flows considering all contractual terms of the financial instruments, but does not consider future credit losses. Financial assets with maturities less than 12 months are included in current assets, financial assets with maturities greater than 12 months after the balance sheet date are classified as non-current assets.
Cash and Cash EquivalentsCash and cash equivalents comprise cash on hand and demand deposits and other short-term highly liquid investments with an original maturity of three months or less that are readily convertible to a known amount of cash and are subject to an insignificant risk of changes in value.
Impairment of Financial AssetsFinancial assets other than those classified as at fair value through profit or loss, are assessed for indicators of impairment at each balance sheet date. Financial assets are impaired where there is objective evidence that, as a result of one or more events that occurred after the initial recognition of the financial asset, the estimated future cash flows of the investment have been adversely impacted.
Derivative Financial InstrumentsDerivatives are recognised initially, and are subsequently remeasured, at fair value. Derivatives are classified as assets when their fair value is positive or as liabilities when their fair value is negative. Derivative assets and liabilities arising from different transactions are offset only if the transactions are with the same counterparty, a legal right of offset exists, and the parties intend to settle the cash flows on a net basis. Fair value movements on derivative financial instruments held for trading are recognised in Consolidated Statement of Comprehensive Income.
The method of recognising fair value gains or losses depends on whether derivatives are held for trading or are designated as hedging instruments, and if the latter, the nature of the risks being hedged.
13.2 Financial liabilities
31 December2013
£’000s
Restated 31 December
2012 £’000s
Financial liabilities at amortised costTrade and other payables (excluding deferred income) 6,284 6,154Derivative financial instrumentsCurrency swaps – 286
Total financial liabilities 6,284 6,440
Accounting PolicyTrade and other payablesFinancial liabilities, other than those specifically accounted for under a separate policy, are stated based on the amounts which are considered to be payable in respect of goods or services received up to the financial reporting date. The cost of other liabilities is considered to approximate their fair value.
Notes to the Financial Statements continuedFor the year ended 31 December 2013

INTERNATIONAL PUBLIC PARTNERSHIPS Annual Report and Financial Statements 2013 65
Com
pany O
verviewH
ighlights C
hairman’s
LetterS
trategic R
eportC
orporate G
overnanceFinancial S
tatements
13. Financial Instruments continued 13.3 Financial risk and management objectivesThe Group’s objective in managing risk is the creation and protection of shareholder value. Risk is inherent in the Group’s activities, but it is managed through a process of ongoing identification, measurement and monitoring, subject to risk limits and other controls. The process of risk management is critical to the Group’s continuing profitability. The Group is exposed to market risk (which includes currency risk, interest rate risk and inflation risk), credit risk and liquidity risk arising from the financial instruments it holds. The Group’s Investment Advisor is responsible for identifying and controlling risks. The Board of Directors supervises the Investment Advisor and is ultimately responsible for the overall risk management of the Group.
The Group’s risk management framework and approach is set out within the Strategic Report (pages 28 to 31). The Board’s considerations of key risks impacting the business are set out within the Strategic Report. The Board takes into account market, credit and liquidity risks in forming the Group’s risk management strategy.
Market RiskMarket risk is the risk that the fair value or future cash flows of financial instruments will fluctuate due to changes in market variables such as changes in inflation, foreign exchange rates and interest rates.
Inflation riskThe majority of the Group’s cash flows from underlying investments are linked to inflation indices. Changes in inflation rates can have a positive or negative impact on the Group’s cash flows from investments. The long-term inflation assumptions applied in the Group’s valuation of investments at fair value through profit or losses are disclosed in the fair value hierarchy section 13.4.
The Company’s portfolio of investments has been developed in anticipation of continued inflation at or above the levels used in the Group’s valuation assumptions. Where inflation is at levels below the assumed levels, investment performance may be impaired. The level of inflation linkage across the investments held by the Company varies and is not consistent.
Interest rate riskInterest rate risk arises from the possibility that changes in interest rates will affect future cash flows from underlying investments therefore impacting the value of investments at fair value through profit or loss. The Group has limited exposure to interest rate risk as the underlying borrowings within the investee entities are either hedged through interest rate swap arrangements or are fixed rate loans. It is generally a requirement under a PFI/PPP concession that any borrowings are matched to the life of the concession. Hedging activities are aligned with the period of the loan, which also mirrors the concession period and are highly effective. The Group’s corporate facility is unhedged on the basis it is utilised as an investment bridging facility and therefore drawn for a relatively short period of time. Therefore, the Group is not significantly exposed to cash flow risk due to changes in interest rates over its variable rate borrowings.
Foreign currency riskThe Group undertakes certain transactions denominated in foreign currencies and therefore is exposed to exchange rate fluctuations. Currency risk arises in financial instruments that are denominated in a foreign currency other than the functional currency in which they are measured. The carrying amounts of the Group’s foreign currency denominated monetary financial instruments at the reporting date are set out in the table below:
31 December 2013
£’000s
31 December 2012
£’000s
CashEuro 1,367 2,727Canadian Dollar 489 584Australian Dollar 1 –
1,857 3,311Current receivablesEuro receivables – 478Canadian Dollar receivables – 56
– 534Investments at fair value through profit or lossEuro 187,104 148,392Canadian Dollar 41,659 37,174Australian Dollar 90,559 108,796
319,322 294,362
Total 321,179 298,207
The Group uses forward foreign exchange contracts to mitigate the risk of short-term volatility in foreign exchange on significant investment returns from overseas investments.

66 INTERNATIONAL PUBLIC PARTNERSHIPS Annual Report and Financial Statements 2013
13. Financial Instruments continued13.3 Financial risk and management objectives continued Credit Risk Credit risk refers to the risk that a counterparty will default on its contractual obligations resulting in a financial loss to the Group. The Group has adopted a policy of dealing only with creditworthy counterparties at the underlying entity level. PFI/PPP concessions are entered into with government, quasi government, other public or equivalent low risk bodies.
Liquidity Risk Liquidity risk is defined as the risk that the Group would encounter difficulty in meeting obligations associated with financial liabilities that are settled by delivering cash or another financial asset. The Group invests in relatively illiquid investments (mainly non-listed equity and loans). As a closed-ended investment vehicle there are no automatic redemption of capital rights. Ultimate responsibility for liquidity risk management rests with the Board of Directors. The Group manages liquidity risk by maintaining adequate cash reserves, banking facilities and reserve borrowing facilities and by continuously monitoring the forecast and actual cash flows. Cash flow forecasts assume full availability of underlying infrastructure to the public sector entities. Failure to maintain assets available for use or operating in accordance with pre-determined performance standards may entitle the public sector to stop (wholly or partially) paying the income that the Group has projected to receive.
The Directors review the underlying performance of each investment on a quarterly basis, allowing asset performance to be monitored. Contractual mechanisms also allow for significant pass-down of unavailability and performance risk to sub-contractors.
13.4 Fair value hierarchyAll financial instruments for which fair value is recognised or disclosed are categorised within the fair value hierarchy, described as follows, based on the lowest level input that is significant to the fair value measurement as a whole:
> Level 1 — Quoted market prices in an active market (that are unadjusted) for identical assets or liabilities > Level 2 — Valuation techniques (for which the lowest level input that is significant to the fair value measurement is directly or indirectly
observable) > Level 3 — Valuation techniques (for which the lowest level input that is significant to the fair value measurement is unobservable)
During the period there were no transfers between Level 2 and Level 3 categories.
Level 1:The Group has no financial instruments classified as level 1.
Level 2:This category includes derivative financial instruments such as interest rate SWAPs, RPI SWAPs and currency forward contracts. As at 31 December 2013, the Group’s only derivative financial instruments were currency forward contracts amounting to an asset of £3.6 million (2012: liability of £0.3 million).
Financial instruments classified as Level 2 have been valued using models whose inputs are observable in an active market (spot exchange rates, yield curves, interest rate curves). Valuations based on observable inputs include financial instruments such as swaps and forward contracts which are valued using market standard pricing techniques where all the inputs to the market standard pricing models are observable.
Level 3:This category consists of investments in equity and loan instruments in underlying unconsolidated subsidiary entities which are classified at fair value through profit or loss. At 31 December 2013, fair value of financial instruments classified as level 3 totalled £844.4 million (2012: £790.7 million).
Financial instruments are classified as Level 3 if their valuation incorporates significant inputs that are not based on observable market data (unobservable inputs). A valuation input is considered observable if it can be directly observed from transactions in an active market, or if there is compelling external evidence demonstrating an executable exit price.
Valuation processValuations are the responsibility of the Board of Directors of the Group. The valuation of unlisted equity and debt investments is performed on a quarterly basis by the Investment Advisor and reviewed by the senior members of the Investment Advisor. The valuations are also subject to quality assurance procedures performed by the Investment Advisor. The Investment Advisor verifies the major inputs applied in the latest valuation by agreeing the information in the valuation computation to relevant project financial models and market information. In addition, the accuracy of the computation is tested. The latest valuation is also compared with the valuations in the preceding semi-annual and annual reporting periods. The senior members of the Investment Advisor consider the appropriateness of the valuation methods and inputs. On a quarterly basis, after the checks above have been performed the Investment Advisor presents the valuation results to the Audit and Risk Committee. This includes a discussion of the major assumptions used in the valuations, with an emphasis on the more significant investments. Any changes in valuation methods and assumptions are discussed and agreed with the Group’s Audit Committee.
Notes to the Financial Statements continuedFor the year ended 31 December 2013

INTERNATIONAL PUBLIC PARTNERSHIPS Annual Report and Financial Statements 2013 67
Com
pany O
verviewH
ighlights C
hairman’s
LetterS
trategic R
eportC
orporate G
overnanceFinancial S
tatements
13. Financial Instruments continued13.4 Fair value hierarchy continued Valuation methodologyThe valuation methodologies used are primarily based on discounting the underlying investee entities future projected net cash flows at appropriate discount rates. Valuations are also reviewed against recent market transactions for similar assets in comparable markets observed by the Group or Investment Advisor and adjusted where appropriate.
Projected net future cash flowsCash flow forecasts for each underlying investment are generated through detailed project specific financial models. Financial models forecast the project related cash flows for the full term of the underlying service concession. The cash flows included in the forecasts used to determine fair value are typically fixed under contracts however there are certain variable cash flows which are based on management estimation. These models also forecast the dividend, shareholder loan interest payments, capital repayments and senior debt repayments (where applicable) expected from the underlying investments. Key macroeconomic inputs and assumptions utilised in projecting the Group’s net future cash flows include:
UKEurope
Non UK North America Australia
Inflation 2.75% 2.00% 2.00% 2.50%Long-term tax 20.00% 12.50%–34.00% 25.00%–26.50% 30.00%Foreign exchange rates N/A 1.16 1.78 2.01Long-term deposit rates 3.50% 3.00% 3.00% 4.50%
Discount rateThe discount rate used for valuation of each investment is the aggregate of the following:
> yield on government bonds with an average life equivalent to the weighted average concession length of the Group, issued by the national government for the location of the asset (‘government bond yield’);
> a premium to reflect the inherent greater risk in investing in infrastructure assets over government bonds; > a further premium to reflect the state of maturity of the asset with a larger premium applied to immature assets and/or assets in
construction and/or to reflect any current asset specific or operational issues. Typically this risk premium will reduce over the life of any asset as an asset matures, its operating performance becomes more established, and the risks associated with its future cash flows decrease;
> a further adjustment reflective of market based transaction valuation evidence for similar assets.
Over the period, the weighted average government bond increased by 0.59%. This was offset by a 0.63% decrease in the weighted average project premium to reflect the transactions observed in the market and the decrease in risk premia relating to construction assets nearing or reached completion. Further details are provided within the Strategic Report (page 21).
Valuation Methodology31 December
201331 December
2012 Movement
Weighted Average Government Bond Rate 3.46% 2.87% 0.59%Weighted Average Project Premium 4.26% 4.89% (0.63%)
Weighted Average Discount Rate 7.72% 7.76% (0.04%)
Weighted Average Discount Rate1 8.20% 8.30% (0.10%)
1 Weighted average discount rate on risk capital only (equity and subordinated debt).
Reconciliation of Level 3 fair value measurements of financial assets:
31 December 2013
£’000s
Balance at 1 January 2013 790,663Additional investments during the year 36,477Net repayments during the year (13,455)Total gains in other comprehensive income 30,697
Balance at 31 December 2013 844,382

68 INTERNATIONAL PUBLIC PARTNERSHIPS Annual Report and Financial Statements 2013
13. Financial Instruments continued13.5 Sensitivity analysisThe valuation requires management to make certain assumptions in relation to unobservable inputs to the model, the significant assumptions along with sensitivity analysis are provided below:
Significant assumptionsWeighted average rate applied in
base case valuations Sensitivity factor+ change in fair value of
investment £’000 – change in fair value of
investment £’000
Discount rate 7.72% +/– 1.0% (75,177) 87,952
Inflation rate (overall) 2.52% +/– 1.0% 65,763 (59,472)
UK (RPI) 2.75% +/– 1.0% 21,638 (19,635)Europe (CPI) 2.00% +/– 1.0% 33,070 (27,032)North America (CPI) 2.00% +/– 1.0% 1,281 (1,121)Australia (CPI) 2.50% +/– 1.0% 9,774 (11,684)
FX rate n/a +/– 10% 35,496 (29,043)Tax rate 23.96% +/– 1.0% (5,928) 6,614Deposit rate 3.47% +/– 1.0% 13,520 (13,922)
14. Investment Acquisitions2013
Date of acquisition DescriptionConsideration
£’000s% Equity stake post acquisition
3 April 2013 The Group acquired the remaining 25% interest in the Alberta Schools project in Canada 7,476 100%11 April 2013 The Group acquired an additional 39.6% of the issued share capital of Inspiredspaces
STaG (Holdings 1) Limited1,000 90.1%
24 September 2013 The Group acquired an additional 25% of the share capital in Northern Diabolo Holdings Sarl (which owns 100% of the shares in Northern Diabolo NV) from Feronia Gmbh
28,000 100%
Total capital spend on new acquisitions during the year 36,476
2012
Date of acquisition DescriptionConsideration
£’000s% Equity stake post acquisition
30 June 2012 The Group acquired an additional 36% of the issued Ordinary Shares in Inspiredspaces Tameside (Holdings 1) Limited and Inspiredspaces Tameside (Holdings 2) Limited
6,750 46.0%
10 July 2012 The Group acquired 100% of the share capital in Ormonde offshore transmission project
115,100 100%
26 September 2012 The Group acquired 100% of the share capital (including investor loans) of BSF Newco Limited (previously Carillion Private Finance Education Limited). BSF Newco Limited is the holding entity for 100% of the A class shares of four PFI projects
14,600 100%
30 September 2012 The Group acquired an additional 36% of the issued Ordinary Shares in Inspiredspaces STaG (Holdings 1)
1,150 50.5%
September 2012 Various minority stakes in BSF projects 6,82330 October 2012 The Group acquired additional share capital of 0.15 % in Angel trains UK Limited 600 4.78%28 December 2012 The Group has acquired an additional 36% stake in QED Luton (Challney)
Holdings Limited1,600 46%
Total capital spend on new acquisitions during the year 146,623
15. Trade and Other Receivables31 December
2013 ‘000s
31 December 2012 ‘000s
Accrued interest receivable 8,659 6,631Other debtors 4,361 4,324
Total trade and other receivables 13,020 10,955
Other debtors included £3.7 million (2012: £2.9 million) of receivables from unconsolidated subsidiary entities for surrender of Group tax losses.
Notes to the Financial Statements continuedFor the year ended 31 December 2013

INTERNATIONAL PUBLIC PARTNERSHIPS Annual Report and Financial Statements 2013 69
Com
pany O
verviewH
ighlights C
hairman’s
LetterS
trategic R
eportC
orporate G
overnanceFinancial S
tatements
16. Trade and Other Payables 31 December
2013 £ ‘000s
31 December 2012
£ ‘000s
Accrued management fee 5,446 5,074Other creditors and accruals 838 1,080
Total trade and other payables 6,284 6,154
17. Share Capital and Reserves
Share capital
31 December 2013 shares
‘000s
31 December 2012 shares
‘000s
In issue 1 January 711,582 534,234Issued for cash 37,258 172,043Issued as a scrip dividend alternative 6,791 5,305Issued to the Investment Advisor as an incentive fee alternative 5,011 –
In issue at 31 December – fully paid 760,642 711,582
31 December 2013
£ ‘000s
31 December 2012
£ ‘000s
Opening balance 463,054 259,763
Issued for cash (excluding issue costs) 46,495 200,017Issued as a scrip dividend alternative 8,675 6,350Issued to the Investment Advisor as an incentive fee alternative 6,584 –
Total share capital issued in the year 61,754 206,367
Costs on issue of Ordinary Shares (415) (3,076)
Balance at 31 December 524,393 463,054
At present, the Company has one class of Ordinary Shares which carry no right to fixed income.
In January 2013, 32,258,065 new Ordinary fully paid Shares were issued by way of a tap issuance at 124.0 pence per share.
In April and May 2013, a total of 5,000,000 new Ordinary fully paid Shares were issued by way of further tap issuance between 128.32 pence per share and 131.92 pence per share.
In June 2013, 4,180,893 new Ordinary fully paid Shares were issued as a scrip dividend alternative in lieu of cash for the interim dividend in respect of the six months ended 31 December 2012.
In October 2013, 2,609,600 new Ordinary fully paid Shares were issued as a scrip dividend alternative in lieu of cash for the interim dividend in respect of the six months ended 30 June 2013.
A further 5,011,159 new Ordinary fully paid Shares were issued to the Investment Advisor, representing 60% of the performance fee payable, at 131.39 pence per share.
Other distributable reserve
31 December 2013
£ ‘000s
31 December 2012
£ ‘000s
Opening balance 182,481 219,360Dividends paid1 – (36,879)
Balance at 31 December 182,481 182,481
1 Includes scrip element of £6.3 million in 2012.
On 19 January 2007, the Company applied to the Royal Court of Guernsey, following the initial placing of shares, to reduce its share premium account in order to provide a distributable reserve to repurchase its shares if and when it is considered beneficial to do so by the Directors. Following court approval, the distributable reserve account was created.

70 INTERNATIONAL PUBLIC PARTNERSHIPS Annual Report and Financial Statements 2013
17. Share Capital and Reserves continued
Retained earnings
31 December 2013
£ ‘000s
31 December 2012
£ ‘000s
Opening balance 215,419 145,185Net profit for the year 58,634 70,234Dividends paid1 (45,536) –
Closing balance 228,517 215,419
1 Includes scrip element of £8.7 million in 2013.
DistributionsThe Board is satisfied that, in every respect, the solvency test as required by the Companies (Guernsey) Law, 2008, was satisfied for the proposed dividend and the dividend paid in respect of the year ended 31 December 2013.
The Board has approved interim distributions as follows: Year ended
31 December 2013
£’000s
Year ended 31 December
2012 £’000s
Amounts paid as distributions to equity holders for the year ended 31 December1 45,536 36,879
DeclaredInterim distribution for the period 1 January to 30 June 2013 was 3.075 pence per share (2012: 3.000 pence per share2)
23,155 21,253
Interim distribution for the period 1 July to 31 December 2013 was 3.075 pence per share (2012: 3.000 pence per share3)
23,390 22,381
1 Includes the 2012 interim distribution for the period 1 July to 31 December 2012.2 The interim distribution for the period was from 1 January to 30 June 2012.3 The distribution for the period 1 July to 31 December 2013 was approved by the Board on 27 March 2014 and therefore has not been included as a liability in the balance sheet for the year
ended 31 December 2013.
Capital risk managementThe Group seeks to efficiently manage its financial resources to seek to ensure that it is able to continue as going concern while providing improved returns to shareholders through the management of the debt and equity balances. The capital structure consists of the Group’s corporate facility, cash and cash equivalents and equity attributable to equity holders of the Parent, comprising issued capital, reserves and retained earnings. The Group aims to deliver its objective by investing available cash and using leverage whilst maintaining sufficient liquidity to meet ongoing expenses and dividend payments. The Group’s investment policy is set out in the Strategic Report.
The Group’s Investment Advisor reviews the capital structure on a semi-annual basis. As part of this review, the Investment Advisor considers the cost of capital and the risks associated with each class of capital.
18. Net Assets Per Share31 December
2013 £’000
31 December 2012
£’000
Net assets attributable to equity holders of the Parent 935,391 860,954
Number Number
Number of sharesOrdinary Shares outstanding at the end of the year 760,641,615 711,581,898
Net assets per share (pence per share) 123.0 121.0
Notes to the Financial Statements continuedFor the year ended 31 December 2013

INTERNATIONAL PUBLIC PARTNERSHIPS Annual Report and Financial Statements 2013 71
Com
pany O
verviewH
ighlights C
hairman’s
LetterS
trategic R
eportC
orporate G
overnanceFinancial S
tatements
19. Related Party TransactionsDuring the period, Group companies entered into certain transactions with related parties that are not members of the Group but are related parties by reason of being in the same group as Amber Infrastructure Group Holdings Limited, which is the ultimate holding company of the Investment Advisor, Amber Fund Management Limited (‘AFML’).
Under the Investment Advisory Agreement (‘IAA’), AFML was appointed to provide investment advisory services to the Company including advising the Company as to the strategic management of its portfolio of investments.
AFML is a subsidiary company of Amber Infrastructure Group Holdings Limited (‘Amber Group’), in which Mr Frost is a Director and also a substantial shareholder.
As Mr Frost is also a Director of International Public Partnerships Limited (the ‘Company’); International Public Partnerships Lux 1 Sarl; (a wholly owned subsidiary of the Company); and the majority of other companies in which the Company indirectly has an investment, the transactions with the Amber Group are considered related party transactions under IAS 24 ‘Related Party Disclosures’.
The Director’s fee for Mr Frost’s directorship of the Company are paid to his employer, Amber Infrastructure Limited.
The amounts of the transactions in the year that were related party transactions are set out in the table below:
Related party expense in the Income Statement
Amounts owing to related parties in the Balance Sheet
For the year ended
31 December 2013
£’000s
For the year ended
31 December 2012
£’000s
At 31 December
2013£’000s
At 31 December
2012 £’000s
Investment advisory fee 10,701 9,418 5,446 5,324Incentive fee1 10,974 – – –
International Public Partnerships GP Limited 21,675 9,418 5,446 5,324Amber Fund Management Limited2 548 1,022 – –
Total 22,223 10,440 5,446 5,324
1 60% settled in shares as disclosed later in this note. 2 Represents amounts paid to related parties to acquire or make investments or advisory fees associated with investments which are subsequently recorded in the balance sheet.
Investment advisory and incentive fee arrangementsAFML, the Investment Advisor, is a related party of the Group. The aggregate fees payable to AFML in its capacity as Investment Advisor includes both base and incentive fees, however the amount is reduced by any base or incentive profit share that has been paid (or are due and payable) to International Public Partnerships GP Limited. The amounts paid to AFML for the year ended 31 December 2013 was £548,096 (2012: £1,021,891) and relates to advisory fees on new acquisitions.
Investment advisory fees paid/payable during the year are calculated as follows:
For construction assets > 1.2% per annum of gross asset value of investments bearing construction risk
For fully operational assets > 1.2% per annum of the gross asset value (‘GAV’) excluding uncommitted cash from capital raisings up to £750 million > 1.0% per annum where GAV (excluding uncommitted cash from capital raisings) is between £750 million and £1.5 billion > 0.9% per annum where GAV (excluding uncommitted cash from capital raisings) exceeds £1.5 billion > There is a 1.5% asset origination fee of the value of new investments
72 INTERNATIONAL PUBLIC PARTNERSHIPS Annual Report and Financial Statements 2013
19. Related Party Transactions continuedChanges in the period
> Up to 30 June 2013, AFML was also entitled to an Incentive Fee in respect of each Incentive Period equal to 20% of the excess (if any) of the Ordinary Share Return over the Benchmark Return (as defined in the IAA) in the Incentive Period, provided that the Incentive Fee was only payable if and to the extent that the change in the Ordinary Share Return Index in the relevant Incentive Period was greater than the change in the Benchmark Return Index.
> The incentive fee was removed as part of the rebased IAA which was approved by the Board on 28 August 2013. > At the same time:
• The Company and the Investment Advisor agreed that retrospectively from 30 June 2013, the Base Fee payable to the Investment Advisor would reduce to 0.9% per annum in respect of the GAV of the Company’s operational projects that exceed £1.5 million. For GAV’s less than £1.5 billion and for non-operational projects the Base Fee payable to the Investment Advisor remains unchanged.
• Provisions in relation to the termination of the Investment Advisor in the IAA were amended to replace the existing mechanism for early termination which was linked to the relative performance of the Company’s shares to UK gilts, with (i) new mechanism allowing for early termination if less than 95% of the Company’s assets are available for use for certain periods and the Investment Advisor fails to implement a remediation plan agreed with the Company, and (ii) enhanced rights for the Company to monitor and manage Amber in order to reflect certain changes to the Listing Rules that were effective from 1 August 2013. The IAA may also be terminated by either party giving to the other five years notice of termination, expiring at any time after ten years from the date of the IAA.
Incentive fee payments – partly settled in sharesIncentive fee payments that have been part settled through the issue of Ordinary Shares by the Company, details are provided below:
Payable at Date paid % of fee paid through issuance of
Ordinary SharesNumber of New Ordinary Shares
issued
Issue price per share
(pence)
31 December 2009 5 May 2010 40% 2,991,220 114.1030 June 2013 13 October 2013 60% 5,011,159 131.39
This shareholding helps strengthen the alignment of interests between the Company and the Investment Advisor. As at 31 December 2013, Amber Infrastructure Limited still held these shares and received dividends thereon.
Transactions with directorsNo new shares were acquired by the Directors in the Company during the financial year ended 31 December 2013. Shares acquired by Directors in the financial year ended 31 December 2012 are disclosed below:
DirectorNumber of New Ordinary Shares
Keith Dorrian 7,262Rupert Dorey (including spouse) 100,000Giles Frost 25,000
Total purchased 132,262
Remuneration paid to the Non-Executive Directors is disclosed on page 37.
20. Contingent LiabilitiesThere were no contingent liabilities at the date of this report.
Notes to the Financial Statements continuedFor the year ended 31 December 2013

INTERNATIONAL PUBLIC PARTNERSHIPS Annual Report and Financial Statements 2013 73
Com
pany O
verviewH
ighlights C
hairman’s
LetterS
trategic R
eportC
orporate G
overnanceFinancial S
tatements
21. Events after Balance Sheet Date
Date Description
13 January 2014 The Group acquired an additional 48% interest in the Kent BSF education project for £6.8 million. The Group now owns 58% of the equity in this project
13 January 2014 The Group acquired a 10% interest in the Wolverhampton phase 2 project for £0.5 million. The Group now owns 10% of the equity in this project
24 January 2014 The Company renewed and increased its corporate credit facility with the existing providers, Royal Bank of Scotland (‘RBS’) and National Australia Bank (‘NAB’). The Company has increased the facility from £100 million to £175 million. The term of the facility is three years, expiring in December 2016. The majority of other terms remain the same as the previous facility with the margin on the facility remaining at 225bps over LIBOR
27 January 2014 The Group acquired a 97% equity interest and 100% of the subordinated debt in the new office building of the Federal German Ministry of Education and Research in Berlin. The interests were acquired from the Company’s Investment Advisor, Amber Infrastructure (‘Amber’), for £9.7 million, following an independent valuation
31 January 2014 The Company divested its minority interests in the Hull, Leeds, Newcastle, Rochdale and Sandwell BSF projects and its minority interest in the Leicester BSF project for a total consideration of £18.78 million
22. Other Mandatory DisclosuresAdoption of new and revised standardsIn the current period the Group has adopted the following ‘new and amended’ accounting standards and interpretations:
> Improvements to IFRS – Improvements to IFRS 1, IAS 1, IAS 16, IAS 32 and IAS 34 > IFRS 10 – Consolidated financial statements, IAS 27 Separate financial statements > IFRS 11 – Joint arrangements, IAS 28 Investments in associates and joint ventures > IFRS 12 – Disclosure of interest in Other Entities > IFRS 13 – Fair value measurements > IAS 27 (May 2011) – Separate financial statements > IAS 28 (May 2011) – investment in associates and joint ventures > IFRS 10, 11 and 12 (June 2012): Investment Entities Amendments
Except for the Investment Entities amendments, the adoption of the standards above did not have a material impact on the consolidated financial statements. Adoption of investment entities resulted in a change in accounting policy in the financial statements as discussed in note 2.
Standards Issued but Not Yet EffectiveStandards issued but not yet effective up to the date of issuance of the Group’s financial statements are listed below. The Group intends to adopt applicable standards when they become effective.
IFRS 9 Financial Instruments – Classification and Measurement effective date to 1 January 2015. The standard has been issued as the IASB completes each phase of its project to replace IAS 39. The first elements of IFRS 9 were issued in November 2009 and October 2010 to replace the parts of IAS 39 that relate to the classification and measurement of financial instruments. In November 2013 an amendment was issued to address hedge accounting and to remove the previously determined effective date of 1 January 2015. Instead, the IASB proposes to set the effective date of IFRS 9 when it completes the impairment phase of the project. The Group will assess IFRS 9’s full impact and will determine the date to adopt IFRS 9 once it is endorsed for use in the EU.
All of the below are mandatory for reporting periods beginning on or after 1 January 2014, except those marked * which are mandatory from 1 July 2014, these are not expected to impact the Group’s financial position or performance:
> Offsetting Financial Assets and Financial Liabilities — Amendments to IAS 32 > Amendments to IAS 39: Novation of Derivatives and Continuation of Hedge Accounting > Amendments to IAS 36: Recoverable Amount Disclosures for Non-financial Assets > Amendments to IAS 19: Defined Benefit Plans: Employee Contributions * > Annual Improvements to IFRSs 2010–2012 Cycle * > Annual Improvements to IFRSs 2011–2013 Cycle * > IFRIC 21, ‘Levies’

74 INTERNATIONAL PUBLIC PARTNERSHIPS Annual Report and Financial Statements 2013
22. Other Mandatory Disclosures continuedUnconsolidated subsidiariesA list of the significant investments in unconsolidated subsidiaries, including the name, country of incorporation as at 31 December 2013 and proportion of ownership is shown below:
Name
Place of incorporation
(or registration) and operation
Proportion of ownership
interest %
Abingdon Limited Partnership UK 100Access Justice Durham Limited Canada 100AKS Betriebs GmbH & Co. KG Germany 98BBPP Alberta Schools Limited Canada 100BPSL No. 2 Limited Partnership UK 100Building Schools for the Future Investments LLP UK 100Calderdale Schools Partnership UK 100CHP Unit Trust Australia 100Derbyshire Courts Limited Partnership UK 100Derbyshire Schools UK 100Derbyshire Schools Phase Two Partnership UK 100H&W Courts Limited Partnership UK 100INPP Infrastructure Germany GmbH & Co. KG Germany 100Inspire Partnership Limited Partnership UK 80IPP CCC Limited Partnership Ireland 100Inspiredspaces Durham (Project Co 1) Limited UK 91Inspiredspaces Nottingham (Project Co 1) Limited UK 82Inspiredspaces STaG (Project Co 1) Limited UK 87Inspiredspaces STaG (Project Co 2) Limited UK 87Inspiredspaces Wolverhampton (Project Co 1) Limited UK 82IPP (Moray Schools) Holdings Limited UK 100Maesteg School Partnership UK 100Medicaste Amiens SAS France 95Norfolk Limited Partnership UK 100Northampton Schools Limited Partnership UK 100Northern Diabolo N.V. Belgium 100Pinnacle Healthcare (OAHS) Trust Australia 100Plot B Partnership UK 100St Thomas More School Partnership UK 100PPP Solutions (Long Bay) Partnership Australia 100PPP Solutions (Showgrounds) Trust Australia 100Strathclyde Limited Partnership UK 100TH Schools Limited Partnership UK 100TC Robin Rigg OFTO Limited UK 100TC Barrow OFTO Limited UK 100TC Gunfleet Sands OFTO Limited UK 100TC Ormonde OFTO Limited UK 100
The entities listed above in aggregate represent 91.32% (2012: 91.03%) of investments at fair value through profit or loss. The remaining fair value is driven from joint ventures, associate interests and minority stakes held by the Group.
Notes to the Financial Statements continuedFor the year ended 31 December 2013

INTERNATIONAL PUBLIC PARTNERSHIPS Annual Report and Financial Statements 2013 75
Com
pany O
verviewH
ighlights C
hairman’s
LetterS
trategic R
eportC
orporate G
overnanceFinancial S
tatements
22. Other Mandatory Disclosures continuedConsolidated subsidiariesThe principal subsidiary undertakings of the Company, all of which have been included in these consolidated financial statements are as follows:
Name
Place of incorporation
(or registration) and operation
Proportion of ownership
interest %
International Public Partnerships Limited Partnership UK 100IPP Bond Limited UK 100IPP Investments Limited Partnership UK 100
23. Service Concession ArrangementsThe Group operates 33 service concession arrangements in the Accommodation, Custodial, Energy and Transport sectors. The concessions vary on the nature of the asset but typically require the construction and operation of an asset during the concession period. The concession may require the acquisition or replacement of an existing asset or the construction of a new asset. The operation of the accommodation based assets normally includes the provision of facilities management services such as cleaning, catering, caretaking, security, maintenance, and lifecycle. At the end of the concession period on the majority of the concessions the assets are returned back to the concession provider. However on seven of the projects the Group has a right to retain the asset.
The rights of both the concession provider and concession operator are stated within the specific project documentation. The standard rights of the provider to terminate the project include poor performance and in the event of force majeure. The operator’s rights to terminate include the failure of the provider to make payment under the agreement, a material breach of contract and relevant changes of law which would render it impossible for the service company to fulfil its requirements.
The table overleaf sets out the Group’s economic interests in PFI concessions that are consolidated within the financial statements. All economic interests reflect an investment in the capital of the underlying project.

76 INTERNATIONAL PUBLIC PARTNERSHIPS Annual Report and Financial Statements 2013
Project Short description of concession arrangements Start date End dateNo.
of yearsConstruction
Value (millions) Project
Abingdon Police Station Design, construct, finance and provision of facilities management to a police facility including HQ, station and training base for the Thames Valley Police Authority, UK.
25 March 2000 9 March 2030 30 £6.9 Development value of approximately £8 million. Retains an insignificant residual value in buildings/land
Access Justice Durham Design, construction, financing and provision of services for a new courthouse facility in Durham, Ontario, Canada.
2 March 2007 30 November 2039 30 C$98.0 Concession payment basis is both availability and service performance based
Alberta Schools Design, construction, financing and provision of services for 18 new schools throughout Edmonton and Calgary, Canada.
15 September 2008 30 September 2040 32 C$490.0 Concession payment basis is both availability and service performance based
Amiens Hospital Project Design, construct, finance and operate an instrument sterilisation facility at Amiens, France. 1 January 2008 31 July 2026 19 £7.1 Concession payment basis is both availability and service performance based
Bootle Government Offices Design, construct, finance and provision of facilities management to fully serviced accommodation in Bootle for the occupation of HM Revenue & Customs, UK.
17 July 2000 16 July 2025 25 £4.1 Public Sector Client has an option to break in 2015. Retains an insignificant residual value in buildings/land
Calderdale Schools Design, construct, finance and provision of facilities management to five schools in Calderdale, UK.
31 August 2004 17 March 2030 26 £44.6 Concession payment basis is both availability and service performance based
Derbyshire Magistrates Courts Design, construction, financing and provision of facilities management services to two courthouses in Derbyshire, UK.
4 June 2003 2 September 2028 25 £21.3 Concession payment basis is both availability and service performance based
Derbyshire Schools Phase 1 Design, build, finance and provision of facilities management services to two secondary schools in Derbyshire, UK.
28 March 200 28 March 2029 26 £25.3 Concession payment basis is both availability and service performance based
Derbyshire Schools Phase 2 Design, build, finance and provision of facilities management services to two secondary schools in Derbyshire, UK.
13 February 2006 12 February 2032 26 £28.3 Concession payment basis is both availability and service performance based
Diabolo Project Design, construction, financing and subsequent operation of a rail link, Belgium. 2 October 2007 30 June 2047 40 €285.0 Concession has both availability and an element of demand based revenue
Dublin Criminal Courts Design, construction, financing and subsequent operation of a courthouse Dublin, Ireland. 18 April 2007 30 June 2035 25 £105.0 Concession payment basis is both availability and service performance based
Hereford & Worcester Magistrates Courts
Design, construction, financing and subsequent operation of four courthouses in Hereford & Worcester, UK.
3 March 2003 5 March 2025 22 £23.5 Concession payment basis is both availability and service performance based
Inspiredspaces Durham BSF Design, redevelop, financing and subsequent operation services of schools in Durham county, UK.
14 August 2009 3 January 2036 27 £42.1 Concession payment basis is both availability and service performance based
Inspiredspaces Nottingham BSF Design, redevelop, financing and subsequent operation services of schools in Nottingham, UK. 13 June 2008 31 August 2034 26 £35.3 Concession payment basis is both availability and service performance based
Inspiredspaces STaG BSF Design, redevelop, financing and subsequent operation services of schools in South Tyneside & Gateshead County, UK.
21 December 2009 4 September 2036 27 £21.4 Concession payment basis is both availability and service performance based
Inspiredspaces Wolverhampton BSF Design, redevelop, financing and subsequent operation services of schools in Wolverhampton, UK.
30 April 2010 4 September 2037 27 £43.5 Concession payment basis is both availability and service performance based
Liverpool Central Library & Archive Project
Design, build, finance and provision of facilities management services for the Central Library and Archive facility in Liverpool, UK.
19 July 2010 7 November 2037 27 £40.8 Concession payment basis is both availability and service performance based
Long Bay Prison & Forensic Hospital Design, construction, financing and subsequent operation of prison and forensic hospital in Sydney, Australia.
1 August 2006 31 May 2034 28 A$147.0 Concession payment basis is both availability and service performance based
Maesteg Schools Project Design, build, finance and provision of facilities management services for new build schools in Maesteg, UK.
29 July 2008 30 September 2033 25 £17.6 Concession payment basis is both availability and service performance based
Melbourne Showgrounds Design, construction, financing and subsequent operation of the redevelopment of Melbourne showgrounds, Australia.
1 July 2005 1 August 2031 26 A$103.0 Concession payment basis is both availability and service performance based
Northamptonshire Schools Design, construct (being a mixture of new build and refurbishment), finance and provision of facilities management services in respect of 30 existing schools and 11 new build schools in Northamptonshire, UK.
31 December 2005 31 December 2037 32 £191.3 Concession payment basis is both availability and service performance based
North Wales Police HQ Design, construction, financing and subsequent supply of facilities management services to the North Wales Police HQ, UK.
1 March 2004 8 December 2028 24 £13.2 Concession payment basis is both availability and service performance based
Notes to the Financial Statements continuedFor the year ended 31 December 2013

INTERNATIONAL PUBLIC PARTNERSHIPS Annual Report and Financial Statements 2013 77
Com
pany O
verviewH
ighlights C
hairman’s
LetterS
trategic R
eportC
orporate G
overnanceFinancial S
tatements
Project Short description of concession arrangements Start date End dateNo.
of yearsConstruction
Value (millions) Project
Abingdon Police Station Design, construct, finance and provision of facilities management to a police facility including HQ, station and training base for the Thames Valley Police Authority, UK.
25 March 2000 9 March 2030 30 £6.9 Development value of approximately £8 million. Retains an insignificant residual value in buildings/land
Access Justice Durham Design, construction, financing and provision of services for a new courthouse facility in Durham, Ontario, Canada.
2 March 2007 30 November 2039 30 C$98.0 Concession payment basis is both availability and service performance based
Alberta Schools Design, construction, financing and provision of services for 18 new schools throughout Edmonton and Calgary, Canada.
15 September 2008 30 September 2040 32 C$490.0 Concession payment basis is both availability and service performance based
Amiens Hospital Project Design, construct, finance and operate an instrument sterilisation facility at Amiens, France. 1 January 2008 31 July 2026 19 £7.1 Concession payment basis is both availability and service performance based
Bootle Government Offices Design, construct, finance and provision of facilities management to fully serviced accommodation in Bootle for the occupation of HM Revenue & Customs, UK.
17 July 2000 16 July 2025 25 £4.1 Public Sector Client has an option to break in 2015. Retains an insignificant residual value in buildings/land
Calderdale Schools Design, construct, finance and provision of facilities management to five schools in Calderdale, UK.
31 August 2004 17 March 2030 26 £44.6 Concession payment basis is both availability and service performance based
Derbyshire Magistrates Courts Design, construction, financing and provision of facilities management services to two courthouses in Derbyshire, UK.
4 June 2003 2 September 2028 25 £21.3 Concession payment basis is both availability and service performance based
Derbyshire Schools Phase 1 Design, build, finance and provision of facilities management services to two secondary schools in Derbyshire, UK.
28 March 200 28 March 2029 26 £25.3 Concession payment basis is both availability and service performance based
Derbyshire Schools Phase 2 Design, build, finance and provision of facilities management services to two secondary schools in Derbyshire, UK.
13 February 2006 12 February 2032 26 £28.3 Concession payment basis is both availability and service performance based
Diabolo Project Design, construction, financing and subsequent operation of a rail link, Belgium. 2 October 2007 30 June 2047 40 €285.0 Concession has both availability and an element of demand based revenue
Dublin Criminal Courts Design, construction, financing and subsequent operation of a courthouse Dublin, Ireland. 18 April 2007 30 June 2035 25 £105.0 Concession payment basis is both availability and service performance based
Hereford & Worcester Magistrates Courts
Design, construction, financing and subsequent operation of four courthouses in Hereford & Worcester, UK.
3 March 2003 5 March 2025 22 £23.5 Concession payment basis is both availability and service performance based
Inspiredspaces Durham BSF Design, redevelop, financing and subsequent operation services of schools in Durham county, UK.
14 August 2009 3 January 2036 27 £42.1 Concession payment basis is both availability and service performance based
Inspiredspaces Nottingham BSF Design, redevelop, financing and subsequent operation services of schools in Nottingham, UK. 13 June 2008 31 August 2034 26 £35.3 Concession payment basis is both availability and service performance based
Inspiredspaces STaG BSF Design, redevelop, financing and subsequent operation services of schools in South Tyneside & Gateshead County, UK.
21 December 2009 4 September 2036 27 £21.4 Concession payment basis is both availability and service performance based
Inspiredspaces Wolverhampton BSF Design, redevelop, financing and subsequent operation services of schools in Wolverhampton, UK.
30 April 2010 4 September 2037 27 £43.5 Concession payment basis is both availability and service performance based
Liverpool Central Library & Archive Project
Design, build, finance and provision of facilities management services for the Central Library and Archive facility in Liverpool, UK.
19 July 2010 7 November 2037 27 £40.8 Concession payment basis is both availability and service performance based
Long Bay Prison & Forensic Hospital Design, construction, financing and subsequent operation of prison and forensic hospital in Sydney, Australia.
1 August 2006 31 May 2034 28 A$147.0 Concession payment basis is both availability and service performance based
Maesteg Schools Project Design, build, finance and provision of facilities management services for new build schools in Maesteg, UK.
29 July 2008 30 September 2033 25 £17.6 Concession payment basis is both availability and service performance based
Melbourne Showgrounds Design, construction, financing and subsequent operation of the redevelopment of Melbourne showgrounds, Australia.
1 July 2005 1 August 2031 26 A$103.0 Concession payment basis is both availability and service performance based
Northamptonshire Schools Design, construct (being a mixture of new build and refurbishment), finance and provision of facilities management services in respect of 30 existing schools and 11 new build schools in Northamptonshire, UK.
31 December 2005 31 December 2037 32 £191.3 Concession payment basis is both availability and service performance based
North Wales Police HQ Design, construction, financing and subsequent supply of facilities management services to the North Wales Police HQ, UK.
1 March 2004 8 December 2028 24 £13.2 Concession payment basis is both availability and service performance based

78 INTERNATIONAL PUBLIC PARTNERSHIPS Annual Report and Financial Statements 2013
Project Short description of concession arrangements Start date End dateNo.
of yearsConstruction
Value (millions) Project
Norfolk Police HQ Design, construct, finance and subsequent provision of facilities management services of serviced accommodation for a new HQ and ancillary facilities to the Norfolk Police Authority, UK.
17 December 2001 (operational services),
15 January 2002 (full service)
16 December 2036 35 £22.5 Authority has option to extend for a further 15 years and a second option to extend for a further 15 years thereafter. Project retains an insignificant residual value in buildings/land
Orange Hospital Design, build, finance and provision of facilities management services to the Orange Hospital, Australia.
21 December 2007 21 December 2035 28 A$170.0 Concession payment basis is both availability and service performance based
Pforzheim Schools Build, finance and provision of facilities management services in respect to two new secondary schools buildings and outside facilities in the City of Pforzheim, Germany.
11 September 2009 11 September 2039 30 €47.1 Concession payment basis is both availability and service performance based
Royal Children’s Hospital Design, build, finance and provision of facilities management services to the Royal Children’s Hospital, Australia.
20 December 2007 31 December 2036 29 A$1,400.0 Concession is a two stage project that includes new building and refurbishment of the existing facility. The payment basis is availability based
Strathclyde Police Training Centre Design, build, finance and provision of facilities management services to the Strathclyde Police Training Centre, UK.
17 October 2001 16 October 2026 25 £18.9 Concession payment basis is both availability and service performance based. Retains an insignificant residual value in buildings/land
St Thomas More School Design, construction, financing and provision of facilities management services to St Thomas More School, UK.
28 March 2003 28 March 2028 25 £12.9 Concession payment basis is both availability and service performance based
TC Barrow OFTO Finance, operate and maintain onshore/offshore substations, onshore and under-sea cables connecting the mainland electricity grid network to offshore wind-farms, UK.
27 September 2011 27 March 2030 18.5 £33.5 Concession payment basis is both availability and service performance based. Retains an insignificant residual value in buildings/land
TC Gunfleet Sands OFTO Finance, operate and maintain onshore/offshore substations, onshore and under-sea cables connecting the mainland electricity grid network to offshore wind-farms, UK.
19 July 2011 19 July 2031 20 £49.0 Concession payment basis is both availability and service performance based
TC Ormonde OFTO Finance, operate and maintain onshore/offshore substations, onshore and under-sea cables connecting the mainland electricity grid network to offshore wind-farms, UK.
10 July 2012 9 July 2032 20 £103.9 Concession payment basis is both availability and service performance based
TC Robin Rigg OFTO Finance, operate and maintain onshore substations, onshore and under-sea cables connecting the mainland electricity grid network to offshore wind-farms, UK.
2 March 2011 2 March 2031 20 £65.0 Concession payment basis is both availability and service performance based
Tower Hamlets Schools Design, construction (mix of new build and refurbishment) and provision of facilities management services in respect of 27 schools in Tower Hamlets, UK.
28 June 2002 (contract start date),
June 2007 (construction completion)
27 August 2027 25 £74.1 Under the concession the unitary payment commenced at financial close. There is provision for the sale of surplus land following the completion of the redevelopment
Notes to the Financial Statements continuedFor the year ended 31 December 2013

INTERNATIONAL PUBLIC PARTNERSHIPS Annual Report and Financial Statements 2013 79
Com
pany O
verviewH
ighlights C
hairman’s
LetterS
trategic R
eportC
orporate G
overnanceFinancial S
tatements
Project Short description of concession arrangements Start date End dateNo.
of yearsConstruction
Value (millions) Project
Norfolk Police HQ Design, construct, finance and subsequent provision of facilities management services of serviced accommodation for a new HQ and ancillary facilities to the Norfolk Police Authority, UK.
17 December 2001 (operational services),
15 January 2002 (full service)
16 December 2036 35 £22.5 Authority has option to extend for a further 15 years and a second option to extend for a further 15 years thereafter. Project retains an insignificant residual value in buildings/land
Orange Hospital Design, build, finance and provision of facilities management services to the Orange Hospital, Australia.
21 December 2007 21 December 2035 28 A$170.0 Concession payment basis is both availability and service performance based
Pforzheim Schools Build, finance and provision of facilities management services in respect to two new secondary schools buildings and outside facilities in the City of Pforzheim, Germany.
11 September 2009 11 September 2039 30 €47.1 Concession payment basis is both availability and service performance based
Royal Children’s Hospital Design, build, finance and provision of facilities management services to the Royal Children’s Hospital, Australia.
20 December 2007 31 December 2036 29 A$1,400.0 Concession is a two stage project that includes new building and refurbishment of the existing facility. The payment basis is availability based
Strathclyde Police Training Centre Design, build, finance and provision of facilities management services to the Strathclyde Police Training Centre, UK.
17 October 2001 16 October 2026 25 £18.9 Concession payment basis is both availability and service performance based. Retains an insignificant residual value in buildings/land
St Thomas More School Design, construction, financing and provision of facilities management services to St Thomas More School, UK.
28 March 2003 28 March 2028 25 £12.9 Concession payment basis is both availability and service performance based
TC Barrow OFTO Finance, operate and maintain onshore/offshore substations, onshore and under-sea cables connecting the mainland electricity grid network to offshore wind-farms, UK.
27 September 2011 27 March 2030 18.5 £33.5 Concession payment basis is both availability and service performance based. Retains an insignificant residual value in buildings/land
TC Gunfleet Sands OFTO Finance, operate and maintain onshore/offshore substations, onshore and under-sea cables connecting the mainland electricity grid network to offshore wind-farms, UK.
19 July 2011 19 July 2031 20 £49.0 Concession payment basis is both availability and service performance based
TC Ormonde OFTO Finance, operate and maintain onshore/offshore substations, onshore and under-sea cables connecting the mainland electricity grid network to offshore wind-farms, UK.
10 July 2012 9 July 2032 20 £103.9 Concession payment basis is both availability and service performance based
TC Robin Rigg OFTO Finance, operate and maintain onshore substations, onshore and under-sea cables connecting the mainland electricity grid network to offshore wind-farms, UK.
2 March 2011 2 March 2031 20 £65.0 Concession payment basis is both availability and service performance based
Tower Hamlets Schools Design, construction (mix of new build and refurbishment) and provision of facilities management services in respect of 27 schools in Tower Hamlets, UK.
28 June 2002 (contract start date),
June 2007 (construction completion)
27 August 2027 25 £74.1 Under the concession the unitary payment commenced at financial close. There is provision for the sale of surplus land following the completion of the redevelopment

80 INTERNATIONAL PUBLIC PARTNERSHIPS Annual Report and Financial Statements 2013
Notes

CONTACTSContacts
Investment Advisor Auditor Corporate BrokersAmber Fund Management Limited1st FloorTwo London BridgeLondonSE1 9RA
Ernst & Young LLP Royal ChambersSt Julian’s AvenueSt Peter PortGuernseyChannel IslandGY1 4AF
Numis Securities LimitedThe London Stock Exchange Building10 Paternoster SquareLondonEC4M 7LT
Registered Office Legal Advisor Public RelationsHeritage HallPO Box 225, Le Marchant StreetSt Peter PortGuernseyChannel IslandsGY1 4HY
Carey OlsenPO Box 98, Carey HouseLes BanquesGuernseyChannel IslandsGY1 4BZ
FTI Consulting200 AldersgateAldersgate StreetLondonEC1A 4HD
Administrator and Company Secretary
Corporate BankerRoyal Bank of Scotland International
Heritage International Fund Managers LimitedHeritage HallPO Box 225, Le Marchant StreetSt Peter PortGuernseyChannel IslandsGY1 4HY
1 Glategny EsplanadeSt Peter PortGuernseyChannel IslandsGY1 4BQ

www.internationalpublicpartnerships.com
International Public Partnershipsc/o Heritage International Fund Managers LimitedHeritage Hall, PO Box 225Le Marchant Street, St Peter PortGuernsey GY1 4HY
Tel: +44 1481 716000
INTERNATIONAL PUBLIC PARTNERSHIPS
International Public Partnerships Annual R
eport and Financial Statem
ents 2013