Embed Size (px)
Citation preview
INTERNATIONAL
PERSPECTIVES ON THE
SUPPLY OF INFORMAL
VENTURE CAPITAL
RICHARD T. HARRISON University of Ulster, U.K.
COLIN M. MASON University of Southampton, U.K.
EXECUTIVE SUMMARY
Despite major changes in the number and range of sources of jnance for new and small ventures in the United Kingdom in recent years, there continues to be a shortage of risk capital for ventures actively seeking external equity jnance. In the United States the informal venture capital market plays a major role in jlling this equity gap, particularly in the early stages of venture development.
However, there is little comparable information on the size of the informal venture capital pool in the United Kingdom or other European economies, despite recent recognition that the apparent underdevelopment of this market in the U.K. represents a major barrier to the development and growth of new ventures. This paper, therefore, presents the jrst analysis of the informal venture capital market in the U.K. and compares the characteristics and attitudes of U.K. informal investors with
those in the U.S. The data reported in this paper have been obtained from a combination of postal survey and
snowball sample techniques that generated useable information from 86 informal investors. Informal investors are playing an important role in venture financing in the U.K. in three ways: they make small scale investments in new and early stage ventures, where the equity gap is most signijcant; they are more permissive in their financing decisions than the formal venture capital industry in terms of having lower rejection rates, longer exit horizons, and lower target rates of return; and they invest locally and can thereby close the regional equity gap arising from the overconcentration of venture capital investment in the core South-East region in the U.K.
In terms of demographics, U.K. informal investors share many of the characteristics of North American informal investors: they are predominantly male, with an entrepreneurial background,
Address correspondence to Professor R.T. Harrison, Centre for Executive Development, University of Ulster at Jordanstown, Newtownabbey, Co Antrim BT37 OQB, N. Ireland.
The research on which this paper is based forms part of the Economic and Social Research Council’s Small Business Research Initiative. The authors wish to acknowledge the financial contributions from the ESRC, Barclays Bank, Commission of the European Communities (DGXXIII), Department of Employment, the Rural Development Commission, and the valuable research assistance of Jennifer Chaloner.
Journal of Business Venturing 7, 459-475 0 1992 Elsevier Science Publishing Co., Inc., 655 Avenue of tbe Americas, New York, NY 10010
459
460 R.T. HARRISON AND C.M. MASON
financially well-off without being super-rich, and identtfi investment opportunities from friends and business associates. There are a number of key differences, that may be attributable to d$6erences in context~l factors such as personal tax regimes, regulatory environments, wealth distribution, and the structure of the formal venture capital and IPO markets. For example, U.K. informal investors are significantly older than those in the U.S. reflecting the influence of higher U.K. tax rates on the rate of capital and wealth accumulation.
More generally, in comparison to U.S. investors, U.K. informal investors: have more investment opportunities brought to their attention: seriously consider more proposals but invest in no more opportunities; operate independently with sy~ication and joint investment relatively uncommon, re- ducing the average total investment per~~ncing round available to ventures; fail to identify entre- preneurs themselves as a primary source of information on investment opportunities; have higher rate of return and capital gains expectations; are slightly less patient investors; and are rather less satisfied with the overall performance of their informal investment porrfolios, reflecting intercountry and in- tertemporal variations in investment climate and conditions. It appears, therefore, that the general ine~ciency of the infor~l capital market ident$ed by Wetzel (1987) {which reflects the invisibili~ of informs investors, the fragmented nature of the market, and the imperfect channels of communication between investor and entrepreneur) is compounded in the U.K. case. The extent to which this reflects contextual dtperences on the one hand or simply a slower developmental process in the U.K. will only be common methodological basis. Based on the evidence presented in this paper, however, a key conclusion is that the information networks available to U.K. informal investors are less eflective than those in North America, and in particular appear to contain lower quality information and a higher degree of redun~nt information. Specific forms of inte~ention in the market by, for example, stimulating the fiow of information through the promotion of informal investment networking and brokerage services along the lines of U.S. and Canadian examples such as VCN and COIN therefore appear defensible.
~ODUCTION
It is widely accepted in the United Kingdom that, despite major changes in the number and range of sources of finance for new and small ventures in recent years, there continues to be a shortage of risk capital for ventures actively seeking external equity finance (NEDC 1986; Mason et al. 1988; ACOST 1990; Binks and Vale 1990; Mason and Harrison 1991a). For example, despite the growth of the formal venture capital industry in the U.K. during the 1980s (Mason and Harrison 1991b), and the intr~uction of the Business Expansion Scheme in particular (Harrison and Mason 1989), there has been little impact on the avail- ability of external equity finance at the lower end of the deal size range (especially below ;ElOO,OOO) where the most severe problems are believed to exist (NEDC 1986; ACOST 1990). Start-up and early stage investment accounts for a diminishing share of total formal venture capital investment in the U.K., down from 27% by volume in 1984 to just 7% in 1988 (Pratt 1990), and seed capital investment in particular, at &4 million, represented just 0.2% of U.K. venture capital investment in 1989 (Financial Times 1990). Further, a recent study reports that leading U.K. venture capitalists perceive this lack of seed and early stage investment as one of the major weaknesses of the U.K. venture capital industry that is unlikely to change in the operating conditions of the 1990s (Murray 1991). As a result, “there is a clear need . . . for the ready availability of smaller amounts of risk capital” (ACOST 1990, p_ 35) if the rate of venture formation and growth in the U.K. is to be increased.
In the United States a well-developed informal venture capital market plays a major role in filling the equity gap (Mason and Harrison 1991~). Informal investors-that is, private individuals who provide risk capital directly to new and growing ventures-represent the
SUPPLY OF INFORMAL VENTURE CAPITAL 461
largest pool of risk capital in the US., financing up to 20 times as many ventures and investing twice as much as the insti~tional venture capital industry (Wetzel 1986; Gaston 1989). Furthermore, they are “most prominent at the early stages of the firm’s development, when relatively small amounts are involved, and in those later stage linancings involving under $1 million” (Freear and Wetzel 1988, p. 353). The results of small-scale studies in Canada confirm the importance of the role played by informal investors in venture financing outside the U.S. (Riding and Short 1987a, 1987b; Short and Riding 1989).
However, there is little comparable info~ation on the size of the informal venture capital pool in the United Kingdom or other European economies, despite the growing interest in the study of the formal venture capital industry (but see Landstrom 1991 for an exception). Recent overviews of the availability of finance for new and early stage ventures in the U.K. ignore the role, actual and potential, of informal investors (NEDC 1986; Boocock 1990). The ACOST study notes the absence of any such information but concludes that the informal venture capital industry remains undevelo~d by comparison with its U.S. equiv- alent, and that this represents “a major gap in the spectrum of funds for smaller companies and a major contribution to barriers to their growth” (ACOST 1990, p. 39).
There are now signs that efforts will be made to close this gap and that the encour- agement of informal investment may emerge as a major strategy for venture development in the U.K. The ACOST study (1990) is the first official report for over 20 years to emphasize the importance of private venture capital in the financing of small firms. Indeed, it argues that “an active informal venture capital market is a pre-requisite for a vigorous enterprise economy” (ACOST 1990, p. 41). The Minister of State with responsibility for small firms is on record as being interested in exploring the scope for encouraging private individuals to invest in small businesses; he has been quoted as suggesting that one “very tentative idea” was for the government to back the creation of a marriage-broking service for investors and en~p~neu~ (Fi~nciu~ Times (London), 23 October 1990). This interest has subsequently led to the establishment of a pilot scheme under which five locally based Training and Enterprise Councils (private sector-public sector partnerships with responsibility for the provision of labor market services, including training, retraining, and enterprise support) have been given pump-priming assistance to stimulate the development of informal invest- ment networking services in the U.K. (Mason 1992). Similar initiatives are currently under discussion in parts of Europe, notably the Sc~dinavi~ economies, based on both the North American experience and these recent developments in the U.K. (Harrison and Mason, in preparation).
However, any discussion of the role of informal investors in contributing to the closing of the equity gap in the U.K. is handicapped by the complete absence of information on their characteristics, investment behavior, investment preferences, and motivations. Al- though evidence from North America can provide some guidance on these matters, it would be foolhardy in view of the very different entrepreneurial traditions, fiscal regimes, regulatory environments, strength of the domestic formal venture capital and IPO markets, and wealth distributions to assume that U.K. informal investors necessarily exhibit similar character- istics, motivations and investment behavior or that U.S. and Canadian financial matchmaking services (such as VCR and COIN) can be replicated wi~out modi~cation in the U.K. Indeed, one recent study of informal investment networks in the U.K. concluded that there was evidence that U.K. informal investors were less sophisticated and were motivated rather differently than their U.S. counterparts (Harrison and Mason 1991). If this is the case it implies that the informal venture capital market operates differently, and possibly less effectively, in the U.K. than in the U.S. and that it may not be possible, therefore, to simply
462 R.T. HARRISON AND C.M. MASON
replicate U.S. experience in attempting to develop that market in the U.K. Against this background, therefore, the aim of this paper is to examine similarities and differences between U.K. and other informal investors in the areas of investment behavior and portfolio perfor- mance and expectations, and to examine the difficulties that any identified differences create for the promotion of informal venture capital in the U.K. In the absence of suitable data for other European economies (the data in Landstrom 1991 are not comparable due to the much broader definition of “informal investor” he uses compared with that characteristic of the U.K. and North American research), this comparison is restricted to the use of U.K. data as the first step in attempting a cross-cultural comparison of the significance of informal investment activity.
METHODOLOGY
U.S. research has noted that informal investors are very difficult to identify-they have a preference for anonymity, there are no directories of individual investors and no public records of their investment transactions (Wetzel 198 1; 1987). They may also be reluctant to respond to research surveys because of the private and personal nature of the subject matter and the fear of being identified and then deluged with investment proposals (Haar et al. 1988). Consequently, the size and characteristics of the population of informal investors is unknown, and probably unknowable, and it is not possible, therefore, to undertake any survey that is based on a representative sample of investors.
Three main approaches have been used by North American researchers to identify samples of informal investors. First, and most common, has been the use of large-scale sample surveys, often using purchased mailing lists, of groups of individuals with a suffi- ciently high discretionary income that they might be involved in informal investment activity (Wetzel 1981; Haar et al. 1988; Postma and Sullivan 1990). Second, informal investors have been contacted through the firms in which they have invested, using the firm itself as the intermediary for survey instrument administration (Aram 1989; Gaston 1989). Third, a number of researchers have used the snowball, or nominated sample, approach that exploits the fact that investors tend to be linked by friendship and business networks and that finding one informal investor typically leads to the identification of others (Neiswander 1985; Short and Riding 1989; Postma and Sullivan 1990). None of these approaches is without problems, in terms of low response rates (due to the difficulty of identifying a population of informal investors), high resource costs relative to the number of investors contacted, the time required and a lack of representativesness, which may introduce unidentifiable bias into the results and make more difficult the undertaking of interstudy comparisons.
In the U.K. study, a combination of the postal survey and snowball sample approaches was used (Mason et al. 1991). Mailing lists used included owner-managers of SMEs, high income groups, investors in speculative stocks, contacts of a venture capital fund, respondents to an invitation to join an informal investment syndicate, subscribers to Venrure Capital Report (Gary 1991) (an investment opportunities bulletin), and advertisers in the investment opportunities section of the London Financial Times. The questionnaire used was a modified version of that used by Aram (1989) in the U.S. SBA-funded study. The overall response to the postal survey was in excess of 24%, the majority of which were responses from non- investors. Useable responses from informal investors represented a response rate of between 1 and 5%, rising to 14% for the investment syndicate list. A total of 13 of the 86 useable responses eventually obtained were identified from a snowball search process in the south of England.
SUPPLY OF INFORMAL VENTURE CAPITAL 463
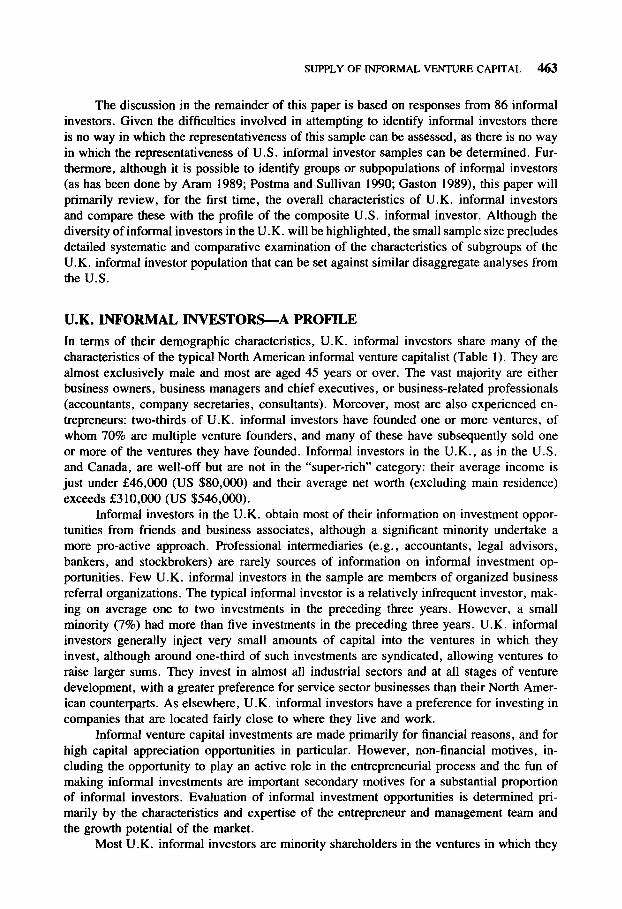
The discussion in the remainder of this paper is based on responses from 86 informal investors. Given the difficulties involved in attempting to identify informal investors there is no way in which the representativeness of this sample can be assessed, as there is no way in which the representativeness of U.S. informal investor samples can be determined. Fur- thermore, although it is possible to identify groups or subpopulations of informal investors (as has been done by Aram 1989; Postma and Sullivan 1990; Gaston 1989), this paper will primarily review, for the first time, the overall characteristics of U.K. informal investors and compare these with the profile of the composite U.S. informal investor. Although the diversity of informal investors in the U.K. will be highlighted, the small sample size precludes detailed systematic and comparative examination of the characteristics of subgroups of the U.K. informal investor population that can be set against similar disaggregate analyses from the U.S.
U.K. INFORMAL INVESTORS-A PROFILE
In terms of their demographic characteristics, U.K. informal investors share many of the characteristics of the typical North American informal venture capitalist (Table 1). They are almost exclusively male and most are aged 45 years or over. The vast majority are either business owners, business managers and chief executives, or business-related professionals (accountants, company secretaries, consultants). Moreover, most are also experienced en- trepreneurs: two-thirds of U.K. informal investors have founded one or more ventures, of whom 70% are multiple venture founders, and many of these have subsequently sold one or more of the ventures they have founded. Informal investors in the U.K., as in the U.S. and Canada, are well-off but are not in the “super-rich” category: their average income is just under f46,OOO (US $80,000) and their average net worth (excluding main residence) exceeds f310,OOO (US $546,000).
Informal investors in the U.K. obtain most of their information on investment oppor- tunities from friends and business associates, although a significant minority undertake a more pro-active approach. Professional intermediaries (e.g., accountants, legal advisors, bankers, and stockbrokers) are rarely sources of information on informal investment op- portunities. Few U.K. informal investors in the sample are members of organized business referral organizations. The typical informal investor is a relatively infrequent investor, mak- ing on average one to two investments in the preceding three years. However, a small minority (7%) had more than five investments in the preceding three years. U.K. informal investors generally inject very small amounts of capital into the ventures in which they invest, although around one-third of such investments are syndicated, allowing ventures to raise larger sums. They invest in almost all industrial sectors and at all stages of venture development. with a greater preference for service sector businesses than their North Amer- ican counterparts. As elsewhere, U.K. informal investors have a preference for investing in companies that are located fairly close to where they live and work.
Informal venture capital investments are made primarily for financial reasons, and for high capital appreciation opportunities in particular. However, non-financial motives, in- cluding the opportunity to play an active role in the entrepreneurial process and the fun of making informal investments are important secondary motives for a substantial proportion of informal investors. Evaluation of informal investment opportunities is determined pri- marily by the characteristics and expertise of the entrepreneur and management team and the growth potential of the market.
Most U.K. informal investors are minority shareholders in the ventures in which they

464 R.T. HARRISON AND C.M. MASON
TABLE 1 Comparative Analysis of “Typical” Investor Profiles
Characteristic
Sunbelt
Region U.S.A.
New England states
Ottawa- Carleton
United Kingdom
Age Sex
Family Income
Net Worth
49 years
Male
$7oOOO us
$750000 us
n/a
n/a
n/a n/a
50 years Male
>$ISOOOO Cdn
>$lOOOOOo Cdn
53 years
Male
E46000
f312000
Number of past
investments
Average value of investments
2 every 3
years
$37500 us
Involvement with
firm Consulting
help
Voting control
Geographic
preferences Business/ industry
Rejected op~~nities
Minimum required
rate of return
Liquidation
expectations
Future investments
Primary source of
op~~nities
Previous start-up
experience
Dissatisfaction with
existing
~mm~ication
channels
SO% within SO
miles
M~ufac~~ng,
finance,
real estate
2 per yeat 20%
34 years
1 in next
year Friends,
business
associates
<SO%
33%
dissatisfaction
N= IS8
1 every 2
years $50,000 us
Board of
Directors or
Consulting
n/a
within 50
miles
High tech
manufacturing
2-3 per year 6 per year 20% 32%
5-7 years 5 years
n/a I in next year
Friends,
business
associates
75%
Business
associates,
friends
84%
65%
dissatisfaction
33%
dissatisfaction
N = 133
1 every year
$109ooo Cdn
Board of
Directors
<IO% within 300
miles
High tech
manufacturing
N = 25
2 every 3 years
f22000 in total
(E10,OOO per venture)
None, Board of
Directors,
informal
consulting
help
1 O-24%
within 50 miles
Consumer
services,
distribution
high tech
manufacturing, finance
4 per year
31%
3-5 years
n/a
Business
associates,
friends
67%
47%
dissatisfaction/
very dissatisfied
N = 86
Sources: Gaston and Bell (1988); Wetzel (1981); Short and Riding (1989); Mason, Harrison, and Ch&ner (1991)
SUPPLY OF INFORMAL VENTURE CAPITAL 465
TABLE 2 Age of Informal Investor
U.K. (%) U.S. (%)
25-34
354 45-54
55-64 over 65
x2 = 21.08 df = 4
p < ,001
3 11
13 33 40 31
33 19 11 6
Source: Mason et al. (1991); Gaston (1989).
invest, and most play a “hands-on” role in the operation of the venture, although there are a significant proportion who remain passive (Harrison and Mason 1992), a finding consistent with Landstrom’s (1991) observation for private investors (on a wider definition) in Sweden. They are, as in North America, moderately patient investors with an exit horizon beyond that of the formal venture capital industry: exit routes, where they have been identified, include trade sale, market listing, and company share buy-back schemes. Overall, most U.K. informal investors want to invest more (up to three times the level of their current informal investments) but cannot find appropriate investment opportunities: it is unsurprising, therefore, that a substantial proportion are dissatisfied with existing communication channels between investors and investees (Table 1).
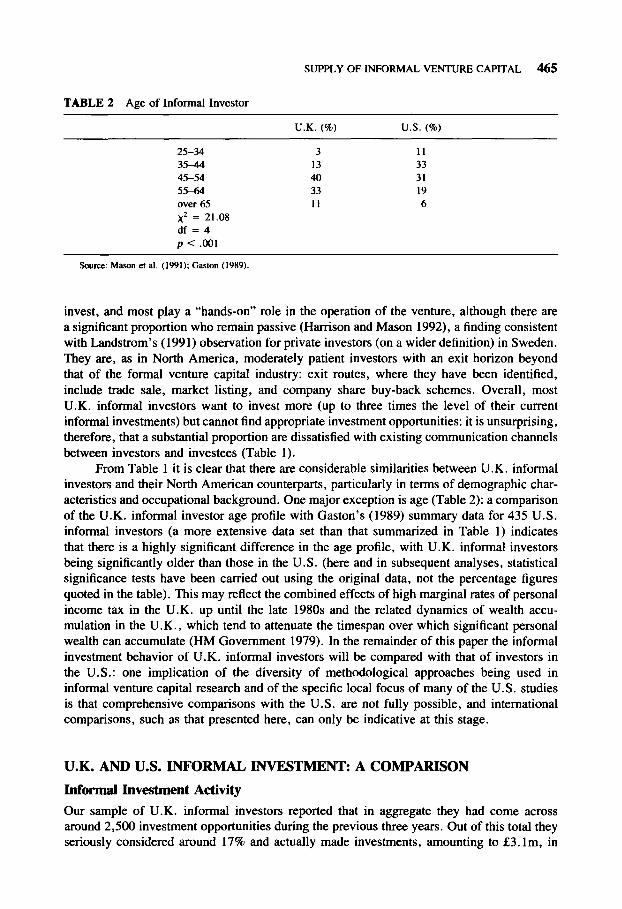
From Table 1 it is clear that there are considerable similarities between U.K. informal investors and their North American counterparts, particularly in terms of demographic char- acteristics and occupational background. One major exception is age (Table 2): a comparison of the U.K. informal investor age profile with Gaston’s (1989) summary data for 435 U.S. informal investors (a more extensive data set than that summarized in Table 1) indicates that there is a highly significant difference in the age profile, with U.K. informal investors being significantly older than those in the U.S. (here and in subsequent analyses, statistical significance tests have been carried out using the original data, not the percentage figures quoted in the table). This may reflect the combined effects of high marginal rates of personal income tax in the U.K. up until the late 1980s and the related dynamics of wealth accu- mulation in the U.K., which tend to attenuate the timespan over which significant personal wealth can accumulate (HM Government 1979). In the remainder of this paper the informal investment behavior of U.K. informal investors will be compared with that of investors in the U.S.: one implication of the diversity of methodological approaches being used in informal venture capital research and of the specific local focus of many of the U.S. studies is that comprehensive comparisons with the U.S. are not fully possible, and international comparisons, such as that presented here, can only be indicative at this stage.
U.K. AND U.S. INFORMAL INVESTMENT: A COMPARISON
Informal Investment Activity
Our sample of U.K. informal investors reported that in aggregate they had come across around 2,500 investment opportunities during the previous three years. Out of this total they seriously considered around 17% and actually made investments, amounting to f3. lm, in
466 R.T. HARRISON AND C.M. MASON
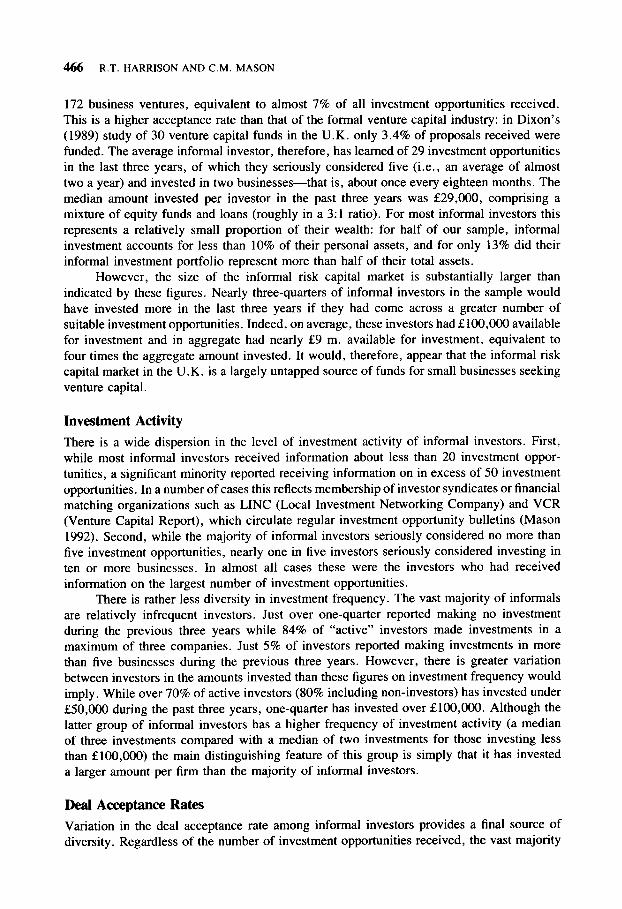
172 business ventures, equivalent to almost 7% of all investment opportunities received. This is a higher acceptance rate than that of the formal venture capital industry: in Dixon’s (1989) study of 30 venture capital funds in the U.K. only 3.4% of proposals received were funded. The average informal investor, therefore, has learned of 29 investment opportunities in the last three years, of which they seriously considered five (i.e., an average of almost two a year) and invested in two businesses-that is, about once every eighteen months. The median amount invested per investor in the past three years was &29,000, comprising a mixture of equity funds and loans (roughly in a 3:l ratio). For most informal investors this represents a relatively small proportion of their wealth: for half of our sample, informal investment accounts for less than 10% of their personal assets, and for only 13% did their informal investment portfolio represent more than half of their total assets.
However, the size of the informal risk capital market is substantially larger than indicated by these figures. Nearly three-quarters of informal investors in the sample would have invested more in the last three years if they had come across a greater number of suitable investment opportunities. Indeed, on average, these investors had flOO,OOO available for investment and in aggregate had nearly &9 m. available for investment, equivalent to four times the aggregate amount invested. It would, therefore, appear that the informal risk capital market in the U.K. is a largely untapped source of funds for small businesses seeking
venture capital.
Investment Activity
There is a wide dispersion in the level of investment activity of informal investors. First, while most informal investors received information about less than 20 investment oppor- tunities, a significant minority reported receiving information on in excess of 50 investment opportunities. In a number of cases this reflects membership of investor syndicates or financial matching organizations such as LINC (Local Investment Networking Company) and VCR (Venture Capital Report), which circulate regular investment opportunity bulletins (Mason 1992). Second, while the majority of informal investors seriously considered no more than five investment opportunities, nearly one in five investors seriously considered investing in ten or more businesses. In almost all cases these were the investors who had received information on the largest number of investment opportunities.
There is rather less diversity in investment frequency. The vast majority of informals are relatively infrequent investors. Just over one-quarter reported making no investment during the previous three years while 84% of “active” investors made investments in a maximum of three companies. Just 5% of investors reported making investments in more than five businesses during the previous three years. However, there is greater variation between investors in the amounts invested than these figures on investment frequency would imply. While over 70% of active investors (80% including non-investors) has invested under ;E50,000 during the past three years, one-quarter has invested over &lOO,OOO. Although the latter group of informal investors has a higher frequency of investment activity (a median of three investments compared with a median of two investments for those investing less than ElOO,OOO) the main distinguishing feature of this group is simply that it has invested a larger amount per firm than the majority of informal investors.
Deal Acceptance Rates
Variation in the deal acceptance rate among informal investors provides a final source of diversity. Regardless of the number of investment opportunities received, the vast majority
SUPPLY OF INFORMAL VENTURE CAPETAL 467
TABLE 3 U.K. Informal Investors’ Deal Acceptance Rate
Investments made as a proportion of investment opacities rtxeived Number of hwtment
opportunities received &9 IO-24 25-49 50-74 75-100
<5 4 0 5 3 I 5-9 4 4 5 3 0
IO-19 4 6 2 0 0
20-49 6 5 3 0 0 5t3+ 12 0 f 0 0
Overall acceptance rate Number 30 15 16 6 7 8 41 20 22 a 9
sowce: Mason et al. (1991).
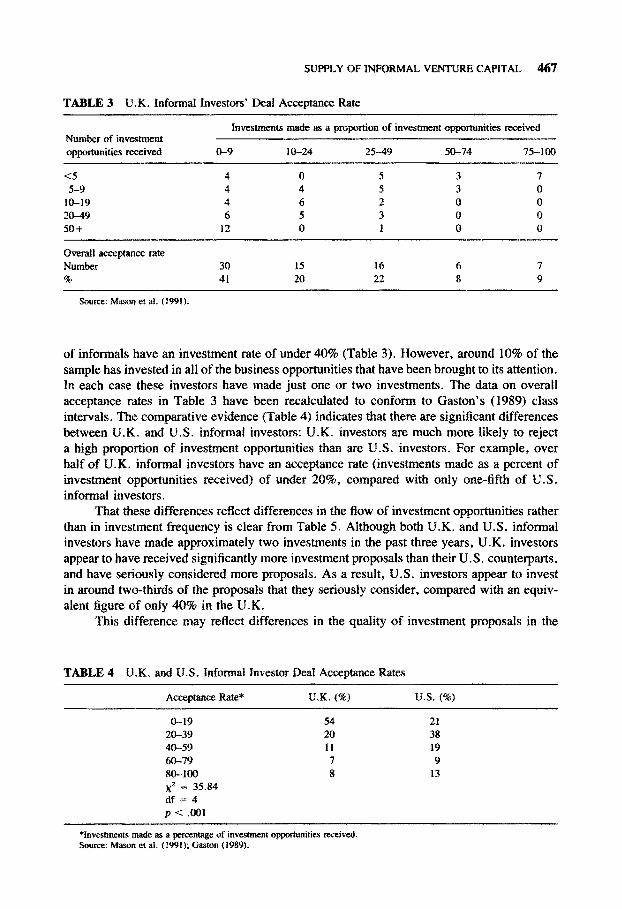
of informals have an investment rate of under 40% (Table 3). However, around 10% of the sample has invested in all of the business opportunities that have been brought to its attention. In each case these investors have made just one or two investments. The data on overall acceptance rates in Table 3 have been recalculated to conform to Gaston’s (1989) class intervals. The comparative evidence (Table 4) indicates that there are significant differences between U.K. and U.S. informal investors: U.K. investors are much more likely to reject a high cation of investment op~~unities than are U.S. investors. For example, over half of U.K. informal investors have an acceptance rate (investments made as a percent of investment opportunities received) of under 20%, compared with only one-fifth of U.S. informal investors.
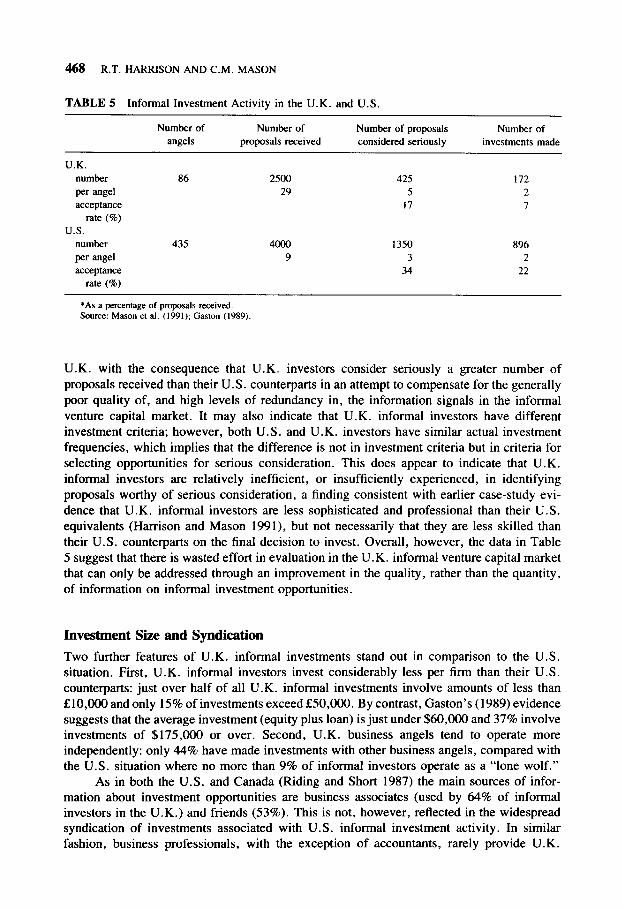
That these differences reflect differences in the flow of investment opportunities rather than in investment frequency is clear from Table 5. Although both U.K. and U.S. informal investors have made approximately two investments in the past three years, U.K. investors appear to have received significantly more investment proposals than their U.S. counterparts, and have seriously considered more proposals. As a result, U.S. investors appear to invest in around two-thirds of the proposals that they seriously consider, compared with an equiv- alent figure of only 40% in the U.K.
This difference may reflect differences in the quality of investment proposals in the
TABLE 4 U.K. and U.S. InformaI Investor Deal Acceptance Rates
Acceptance Rate* U.K. (%) U.S. (%)
o-19 54 21 20-39 20 38 40-59 II 19 60-79 7 9 80-100 8 13 x* = 35.84 df=4 p < .OOl
*Investments made as a percentage of investmerst opportunities received. Source: Mason et af. f1991); Gaston 11989f.
468 R.T. HARRISON AND C.M. MASON
TABLE 5 Informal Investment Activity in the U.K. and U.S.
U.K.
number
per angel
acceptance rate (%)
U.S.
number per angel
acceptance rate (I)
Number of
angels
86
435
Number of
proposals received
2500
29
4ooo 9
Number of proposals Number of considered seriously investments made
425 172
5 2
17 7
1350 896 3 2
34 22
*As a percentage of proposals received. Source: Mason et al. (1991); Gaston (1989).
U.K. with the consequence that U.K. investors consider seriously a greater number of proposals received than their U.S. counterparts in an attempt to compensate for the generally poor quality of, and high levels of redundancy in, the information signals in the informal venture capital market. It may also indicate that U.K. informal investors have different investment criteria; however, both U.S. and U.K. investors have similar actual investment frequencies, which implies that the difference is not in investment criteria but in criteria for selecting opportunities for serious consideration. This does appear to indicate that U.K. informal investors are relatively inefficient, or insufficiently experienced, in identifying proposals worthy of serious consideration, a finding consistent with earlier case-study evi- dence that U.K. informal investors are less sophisticated and professional than their U.S. equivalents (Harrison and Mason 1991), but not necessarily that they are less skilled than their U.S. counterparts on the final decision to invest. Overall, however, the data in Table 5 suggest that there is wasted effort in evaluation in the U.K. informal venture capital market that can only be addressed through an improvement in the quality, rather than the quantity, of information on informal investment opportunities.
Investment Size and Syndication
Two further features of U.K. informal investments stand out in comparison to the U.S. situation. First, U.K. informal investors invest considerably less per firm than their U.S. counterparts: just over half of all U.K. informal investments involve amounts of less than f10,OOO and only 15% of investments exceed f50,OOO. By contrast, Gaston’s (1989) evidence suggests that the average investment (equity plus loan) is just under $60,000 and 37% involve investments of $175,000 or over. Second, U.K. business angels tend to operate more independently: only 44% have made investments with other business angels, compared with the U.S. situation where no more than 9% of informal investors operate as a “lone wolf.”
As in both the U.S. and Canada (Riding and Short 1987) the main sources of infor- mation about investment opportunities are business associates (used by 64% of informal investors in the U.K.) and friends (53%). This is not, however, reflected in the widespread syndication of investments associated with U.S. informal investment activity. In similar fashion, business professionals, with the exception of accountants, rarely provide U.K.
SUPPLY OF INFORMAL VENTURE CAPITAL 469
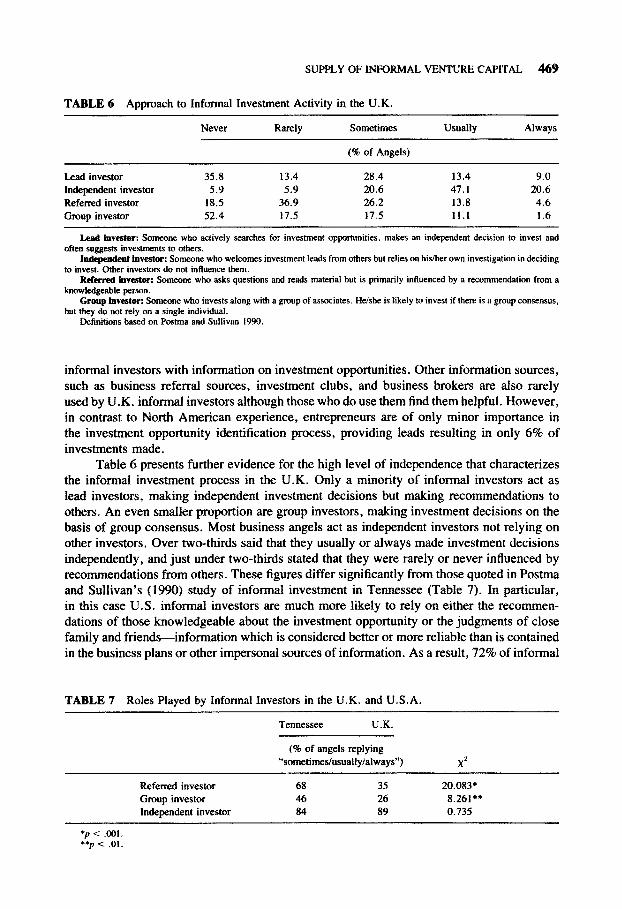
TABLE 6 Approach to Informal Investment Activity in the U.K.
Never Rarely Sometimes Usually Always
(96 of Angels)
Lead investor 35.8 13.4 28.4 13.4 9.0 Independent investor 5.9 5.9 20.6 47.1 20.6 Referred investor 18.5 36.9 26.2 13.8 4.6 Group investor 52.4 17.5 17.5 11.1 1.6
Lead Investtx Someone who actively searches for investment opportunities, makes an independent decision to invest and
often suggests investments to others.
Independent investor: Someone who welcomes investment leads from others but relies on his/her own investigation in deciding
to invest. Other investors do not influence them.
Referred Investor: Someone who asks questions and reads material but is primarily influenced by a recommendation from a
knowledgeable person.
Group investor: Someone who invests along with a group of associates. He/she is likely to invest if there is a group consensus,
but they do not rely on a single individual.
LMinitions based on Postma and Sullivan 1990.
informal investors with information on investment opportunities. Other information sources, such as business referral sources, investment clubs, and business brokers are also rarely used by U.K. informal investors although those who do use them find them helpful. However, in contrast to North American experience, entrepreneurs are of only minor importance in the investment opportunity identification process, providing leads resulting in only 6% of investments made.
Table 6 presents further evidence for the high level of independence that characterizes the informal investment process in the U.K. Only a minority of informal investors act as lead investors, making inde~ndent investment decisions but making recommendations to others. An even smaller proportion are group investors, making investment decisions on the basis of group consensus. Most business angels act as independent investors not relying on other investors, Over two-thirds said that they usually or always made investment decisions independently, and just under two-thirds stated that they were rarely or never influenced by recommendations from others. These figures differ significantly from those quoted in Postma and Sullivan’s (1990) study of informal investment in Tennessee (Table 7). In particular, in this case U.S. informal investors are much more likely to rely on either the recommen- dations of those knowledgeable about the investment opportunity or the judgments of close family and friends-information which is considered better or more reliable than is contained in the business plans or other impersonal sources of information. As a result, 72% of informal
TABLE 7 Roles Played by Informal investors in the U.K. and U.S.A.
Tennessee U.K.
Referred investor
Group investor Independent investor
(% of angels replying ~‘som~time~usual~y/always”)
68 35 46 26 84 89
x2
20.083*
8.261** 0.735
*p c: xJo1. *p < .Ol.
470 R.T. HARRISON AND C.M. MASON
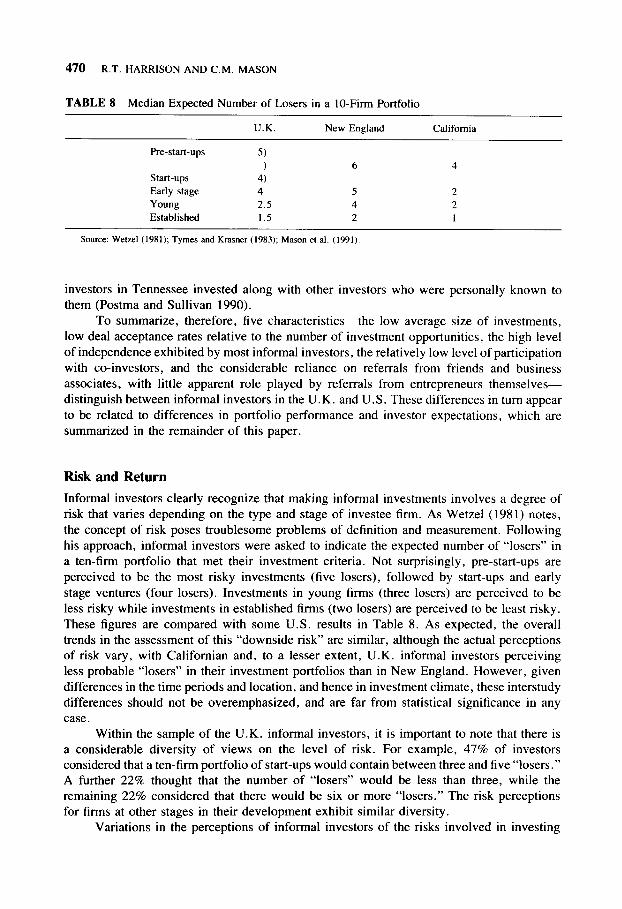
TABLE 8 Median Expected Number of Losers in a IO-Firm Portfolio
U.K. New England
Pre-start-ups 5) ) 6
Start-ups 4) Early stage 4 5
Young 2.5 4
Established 1.5 2
Source: Wet& (1981); Tymes and Krasner (1983); Mason et al. (1991).
California
4
2
2
1
investors in Tennessee invested along with other investors who were personally known to them (Postma and Sullivan 1990).
To summarize, therefore, five characteristics-the low average size of investments, low deal acceptance rates relative to the number of investment opportunities, the high level of independence exhibited by most informal investors, the relatively low level of participation with co-investors, and the considerable reliance on referrals from friends and business associates, with little apparent role played by referrals from entrepreneurs themselves- distinguish between informal investors in the U.K. and U.S. These differences in turn appear to be related to differences in portfolio performance and investor expectations, which are summarized in the remainder of this paper.
Risk and Return
Informal investors clearly recognize that making informal investments involves a degree of risk that varies depending on the type and stage of investee firm. As Wetzel (1981) notes, the concept of risk poses troublesome problems of definition and measurement. Following his approach, informal investors were asked to indicate the expected number of “losers” in a ten-firm portfolio that met their investment criteria. Not surprisingly, pre-start-ups are perceived to be the most risky investments (five losers), followed by start-ups and early stage ventures (four losers). investments in young firms (three losers) are perceived to be less risky while investments in established firms (two losers) are perceived to be least risky. These figures are compared with some U.S. results in Table 8. As expected, the overall trends in the assessment of this “downside risk” are similar, although the actual perceptions of risk vary, with Californian and, to a lesser extent, U.K. informal investors perceiving less probable “losers” in their investment portfolios than in New England. However, given differences in the time periods and location, and hence in investment climate, these interstudy differences should not be overemphasized, and are far from statistical significance in any case.
Within the sample of the U.K. informal investors, it is important to note that there is a considerable diversity of views on the level of risk. For example, 47% of investors considered that a ten-firm portfolio of start-ups would contain between three and five “losers.” A further 22% thought that the number of “losers” would be less than three, while the remaining 22% considered that there would be six or more “losers.” The risk perceptions for firms at other stages in their development exhibit similar diversity.
Variations in the perceptions of informal investors of the risks involved in investing
SUPPLY OF INFORMAL VENTURE CAPITAL 471
in companies at different stages of development are, in turn, reflected in their minimum rate of return expectations. Minimum rates of return decline as the length of period in which the company has traded increases. Thus informal investors are looking for a minimum rate of return on investment that ranges from a median of 50% for pre-start-ups and 40% for start- ups to around 25% for established firms. As a bench-mark, informal investors expect a minimum annual ROI of 15% for investments in “blue-chip” stocks. In terms of their expected capital gains, informal investors expect to achieve on average a five-fold increase in the value of their original investment over a five-year period.
U.K. informal investors appear to have slightly higher rate of return expectations than their U.S. counterparts, although it is not possible to test the statistical significance of these differences given the incomplete nature of the data reported in the various studies cited. Gaston (1989) reports that the median annual ROI amongst U.S. informal investors is 22%. Our U.K. results are also higher than those reported by Wetzel(1981) for informal investors in New England, where ROI expectations range from 20% for start-ups to 15% for established firms, but are similar to those of informal investors in California (Tymes and Krasner 1983). The capital gains expectations of U.K. informal investors are also higher than those of U.S. informal investors (Wetzel 1981; Tymes and Krasner 1983).
Exit Routes and Portfolio Performance
U.S. research describes informal investors as “patient investors” and, therefore, a more satisfactory and less threatening source of finance for new ventures in particular, where substantial returns may be attainable only in the medium term (Wetzel 1981). . U.K. informal investors appear to be slightly, but not significantly, less patient than their U.S. counterparts, although their exit horizon is still greater than that of most venture capital funds. Slightly over half of U.K. informal investors expect to liquidate their investments in between three and five years while 26% expect to hold their investments for between six and ten years. A further 11% did not regard the holding period as important and 3% did not have any specific investment horizon. This can be compared with an average maximum investment horizon of 7.4 years by U.K. venture capital funds (Dixon 1989), and a typical expected holding period of two to five years (Mason and Harrison 199 1 b).
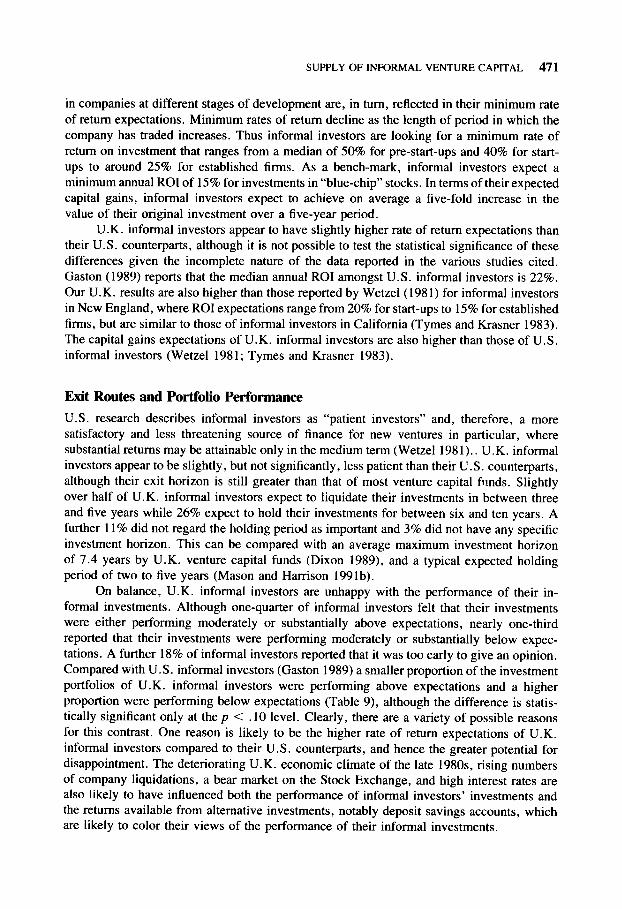
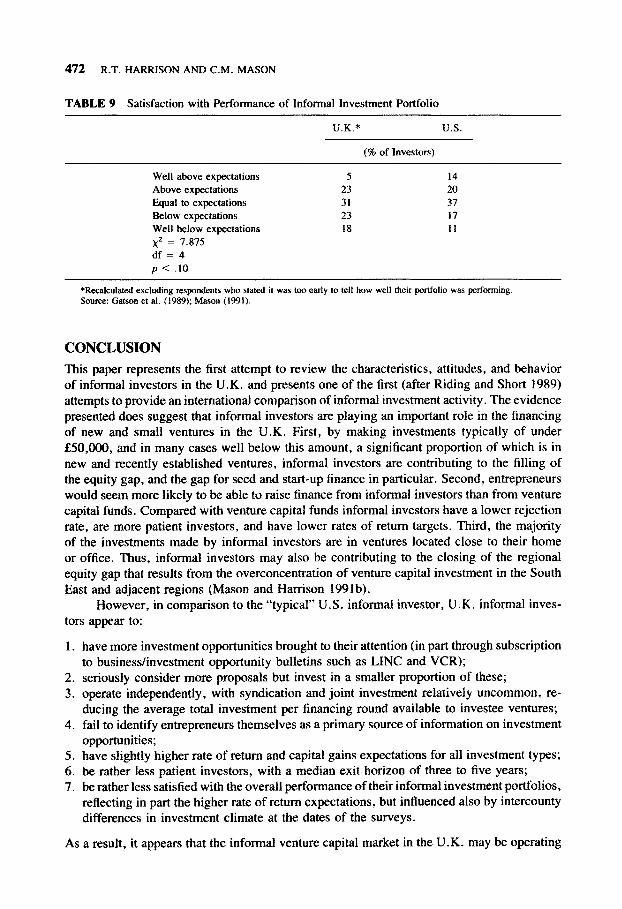
On balance, U.K. informal investors are unhappy with the performance of their in- formal investments. Although one-quarter of informal investors felt that their investments were either performing moderately or substantially above expectations, nearly one-third reported that their investments were performing moderately or substantially below expec- tations. A further 18% of informal investors reported that it was too early to give an opinion. Compared with U.S. informal investors (Gaston 1989) a smaller proportion of the investment portfolios of U.K. informal investors were performing above expectations and a higher proportion were performing below expectations (Table 9), although the difference is statis- tically significant only at the p < . 10 level. Clearly, there are a variety of possible reasons for this contrast. One reason is likely to be the higher rate of return expectations of U.K. informal investors compared to their U.S. counterparts, and hence the greater potential for disappointment. The deteriorating U.K. economic climate of the late 1980s rising numbers of company liquidations, a bear market on the Stock Exchange, and high interest rates are also likely to have influenced both the performance of informal investors’ investments and the returns available from alternative investments, notably deposit savings accounts, which are likely to color their views of the performance of their informal investments.
472 R.T. HARRISON AND C.M. MASON
TABLE 9 Satisfaction with Performance of Informal Investment Portfolio
U.K.* U.S.
(% of Investors)
Well above expectations Above expectations Equal to expectations Below expectations Well below expectations ,$ = 7.875 df = 4 p < .lO
5 14 23 20 31 37 23 17 18 11
*Recalculated excluding respondents who stated it was too early to tell how well their portfolio was performing Source: Gatson et at. (1989); Mason (1991).
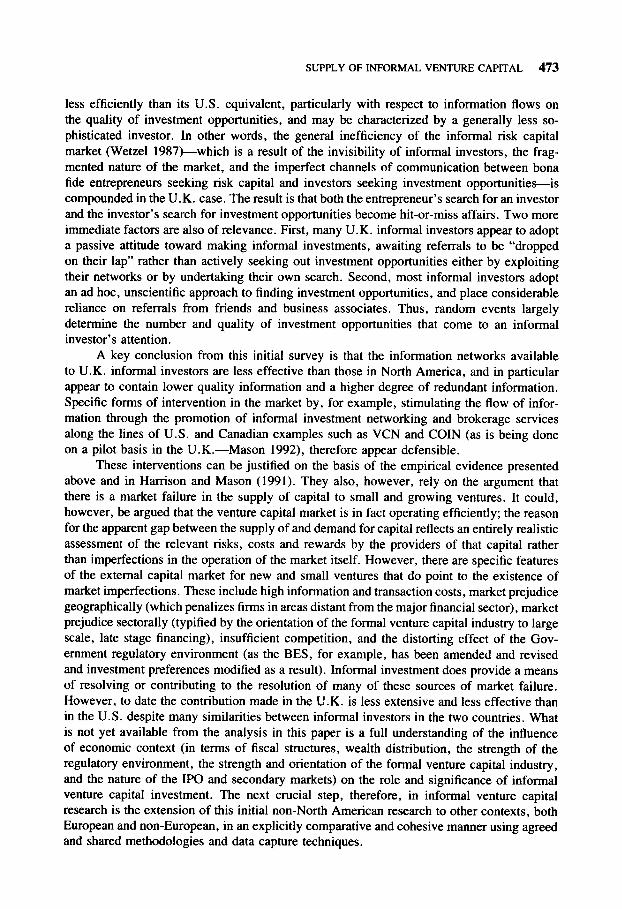
CONCLUSION
This paper represents the first attempt to review the characteristics, attitudes, and behavior of informal investors in the U.K. and presents one of the first (after Riding and Short 1989) attempts to provide an international comparison of informal investment activity. The evidence presented does suggest that informal investors are playing an irn~~ant role in the financing of new and small ventures in the U.K. First, by making investments typically of under fiO,OOO, and in many cases well below this amount, a significant proportion of which is in new and recently established ventures, informal investors are contributing to the filling of the equity gap, and the gap for seed and start-up finance in particular. Second, entrepreneurs would seem more likely to be able to raise finance from informal investors than from venture capital funds. Compared with venture capital funds informal investors have a lower rejection rate, are more patient investors, and have lower rates of return targets. Third, the majority of the investments made by informal investors are in ventures located close to their home or office. Thus, informal investors may also be contributing to the closing of the regional equity gap that results from the overconcentration of venture capital investment in the South East and adjacent regions (Mason and Harrison 199lb).
However, in comparison to the “typical” U.S. informal investor, U.K. informal inves- tors appear to:
1. have more investment opportunities brought to their attention (in part through subscription to business/investment opportunity bulletins such as LINC and VCR);
2. seriously consider more proposals but invest in a smaller proportion of these; 3. operate independently, with syndication and joint investment relatively uncommon, re-
ducing the average total investment per financing round available to investee ventures; 4. fail to identify entrepreneurs themselves as a primary source of information on investment
opportunities; 5. have slightly higher rate of return and capital gains expectations for all investment types; 6. be rather less patient investors, with a median exit horizon of three to five years; 7. be rather less satisfied with the overall performance of their informal investment portfolios,
reflecting in part the higher rate of return expectations, but influenced also by intercounty differences in investment climate at the dates of the surveys.
As a result, it appears that the informal venture capital market in the U.K. may be operating
SUPPLY OF INFORMAL VENTURE CAPITAL 473
less efficiently than its U.S. equivalent, particularly with respect to information flows on the quality of investment opportunities, and may be characterized by a generally less so- phisticated investor. In other words, the general inefficiency of the informal risk capital market (Wetzel 1987)-which is a result of the invisibility of informal investors, the frag- mented nature of the market, and the imperfect channels of communication between bona fide entrepreneurs seeking risk capital and investors seeking investment opportunities---is compounded in the U.K. case. The result is that both the entrepreneur’s search for an investor and the investor’s search for investment opportunities become hit-or-miss affairs. Two more immediate factors are also of relevance. First, many U.K. informal investors appear to adopt a passive attitude toward making informal investments, awaiting referrals to be “dropped on their lap” rather than actively seeking out investment opportunities either by exploiting their networks or by undertaking their own search. Second, most informal investors adopt an ad hoc, unscientific approach to finding investment opportunities, and place considerable reliance on referrals from friends and business associates. Thus, random events largely determine the number and quality of investment opportunities that come to an informal investor’s attention.
A key conclusion from this initial survey is that the information networks available to U.K. informal investors are less effective than those in North America, and in particular appear to contain lower quality information and a higher degree of redundant information. Specific forms of intervention in the market by, for example, stimulating the flow of infor- mation through the promotion of informal investment networking and brokerage services along the lines of U.S. and Canadian examples such as VCN and COIN (as is being done on a pilot basis in the U.K.-Mason 1992), therefore appear defensible.
These interventions can be justified on the basis of the empirical evidence presented above and in Harrison and Mason (1991). They also, however, rely on the argument that there is a market failure in the supply of capital to small and growing ventures. It could, however, be argued that the venture capital market is in fact operating efficiently; the reason for the apparent gap between the supply of and demand for capital reflects an entirely realistic assessment of the relevant risks, costs and rewards by the providers of that capital rather than imperfections in the operation of the market itself. However, there are specific features of the external capital market for new and small ventures that do point to the existence of market imperfections. These include high information and transaction costs, market prejudice geographically (which penalizes firms in areas distant from the major financial sector), market prejudice sectorally (typified by the orientation of the formal venture capital industry to large scale, late stage financing), insufficient competition, and the distorting effect of the Gov- ernment regulatory environment (as the BES, for example, has been amended and revised and investment preferences modified as a result). Informal investment does provide a means of resolving or contributing to the resolution of many of these sources of market failure. However, to date the contribution made in the U.K. is less extensive and less effective than in the U.S. despite many similarities between informal investors in the two countries. What is not yet available from the analysis in this paper is a full understanding of the influence of economic context (in terms of fiscal structures, wealth distribution, the strength of the regulatory environment, the strength and orientation of the formal venture capital industry, and the nature of the IPO and secondary markets) on the role and significance of informal venture capital investment. The next crucial step, therefore, in informal venture capital research is the extension of this initial non-North American research to other contexts, both European and non-European, in an explicitly comparative and cohesive manner using agreed and shared methodologies and data capture techniques.
474 R.T. HARRISON AND C.M. MASON
REFERENCES Advisory Council on Science and Technology (ACOST). 1990. The Enterprise Challenge: Overcoming
Barriers to Growth in Small Firms. London: HMSO.
Aram, J. 1989. Attitudes and behaviors of informal investors towards early-stage investments, tech- nology-based ventures and co-investors. Journal of Business Venturing 4:333-347.
Binks, M.R., Vale, P.A. 1990. Entrepreneurship and Economic Change. London: McGraw Hill.
Boocock, J.G. 1990. An examination of non-bank funding for small and medium-sized enterprises in the UK. Service Industries Journal 10:124-146.
Gary, L. 1991. The Venture Capital Report Guide to Venture Capital in Europe, 5th ed. London: Pitman.
Dixon, R. November 1989. Venture capitalists and investment appraisals, National Westminster Bank Quarterly Review, pp. 2-21.
Financial Times. 1990. Venture Capital Special Report, 26 November. London: Financial Times.
Freear, J., and Wetzel, W. 1988. Equity financing for new technology-based firms. In B.A. Kirchhoff, W.A. Long, W.E. McMullen, K.H. Vesper, and W.E. Wetzel, eds., Frontiers of Entrepre- neurship Research 1988. Wellesley, MA: Babson College, pp. 347-367.
Gaston, R.J. 1989. Finding Private Venture Capital for your Firm: A Complete Guide. New York: Wiley.
HM Government. 1979. Interim Report on the Financing of Small Firms (Wilson Report) Cmnd 7503. London, HMSO.
Haar, N.E., Starr, J., and MacMillan, I.C. 1988. Informal risk capital investors: investment patterns on the East Coast of the USA. Journal of Business Venturing 3: 1 l-29.
Harrison, R.T., and Mason, C.M. 1989. The role of the Business Expansion Scheme in the United Kingdom. Omega 17:147-157.
Harrison, R.T., and Mason, C.M. 1991. Informal investment networks: a case study from the United Kingdom. Entrepreneurship and Regional Development 3:269-280.
Harrison, R.T., and Mason, C.M. 1992. The roles of investors in entrepreneurial companies: a comparison of informal investors and venture capitalists. Paper to the Twelfth Babson Entre- preneurship Research Conference, INSEAD, June 1992.
Harrison, R.T., and Mason, C.M., eds, Informal Venture Capital: Information, Networks and Public Policy, (in preparation).
Landstrom, H. 1991. Private investors in Sweden: an agency theory approach. Paper to RENT V- Research in Entrepreneurship Workshop, Vaxjo University, Sweden.
Mason, C.M., ed., 1992. Promoting Informal Investment: The Role of Business Referral Services. Proceedings of the Department of Employment/Training and Enterprise Council Conference. Southampton: Department of Geography, University of Southampton.
Mason, C.M., and Harrison, R.T. 1991a. The equity gap since Bolton. In J. Stanworth and C. Gray, eds., Bolton Twenty Years On. London: Paul Chapman Publishing.
Mason, C.M., and Harrison, R.T. 1991b. Venture capital, the equity gap and the north-south divide in the U.K. In M. Green, ed., Venture Capital: International Comparisons. London: Routledge.
Mason, C.M., and Harrison, R.T. 1991~. Informal risk capital: a review of U.S. and U.K. evidence. Venture Finance Research Project Working Paper No. I, University of Southampton (Urban Policy Research Unit)/University of Ulster (Ulster Business School).
Mason, C.M., and Harrison, R.T. and Chaloner, J. (1991) Informal risk capital in the U.K.: a study of investor characteristics, investment preferences, and investment decision-making. Venture Finance Research Project Working Paper No. 2, University of Southampton (Urban Policy Research Unit)/University of Ulster (Ulster Business School).
Mason, C.M., Harrison, J., and Harrison, R.T. 1988. Closing the Equity Gap? An Assessment of the Business Expansion Scheme. London: Small Business Research Trust.
Murray, G. 1991. Change and Maturity in the U.K. Venture Capital Industry 1990-95. London: British Venture Capital Association.
NEDC. 1986. External Capital for Small Firms. London, National Economic Development Office.
SUPPLY OF INFORMAL VENTURE CAPITAL 475
Neiswander, D.K. 1985. Informal seed stage investors. In J.A. Homaday, E.B. Shils, J.A. Timmons, and K.H. Vesper, eds., Frontiers of Entrepreneurship Research 1985. Wellesley, MA: Babson College, pp. 142-154.
Postma, P.D., and Sullivan, M.K. 1990. Informal Risk Capital in the Knoxville Region. Knoxville, TN: University of Tennessee.
Pratt, G. 1990. Venture capital in the United Kingdom. Bank of England Quarterly Review 30:78- 83.
Riding, A.L., and Short, D.M. 1987a. On the estimation of the investment potential of informal market for risk capital. Journal of Small Business and Entrepreneurship 5(2): 19-30.
Riding, A.L., and Short, D.M. 1987b. On the estimation of the investment potential of informal investors: a capture: recapture approach, Journal of Small Business and Entrepreneurship 5(4):26- 40.
Short, D.M., and Riding, A.L. 1989 Informal investors in the Ottawa-Carleton region: experiences and expectations. Entrepreneurship and Regional Development 1:99-l 12.
Tymes, E.R., and Krasner, O.J. 1983 Informal risk capital in California. In J.A. Homday, J.A. Timmons, and K.H. Vesper, eds., Frontiers of Entrepreneurship Research 1983. Wellesley, MA: Babson College, pp. 347-368.
Wetzel, W.E. 1981. Informal risk capital in New England. In K.H. Vesper, ed., Frontiers of Entre- preneurship Research 1981. Wellesley, MA: Babson College, pp. 217-245.
Wetzel, W.E. 1986. Entrepreneurs, angels and economic renaissance. In R.D. Hisrich, ed., Entre- preneurship, Intrapreneurship and Venture Capital. Lexington, MA: Lexington Books, pp. 119-139.
Wetzel, W.E. 1987. The informal risk capital market: aspects of scale and efficiency. In N.C. Churchill, J.A. Homaday, B.A. Kirchhoff, O.J. Krasner, and K.H. Vesper, eds., Frontiers of Entrepre- neurship Research 1981. Wellesley, MA: Babson College, pp. 412-428.