Embed Size (px)
Citation preview
Work in progress, please don’t share or cite
International Negotiations and PublicOpinion: Is the Negotiation Behavior ofCountries in the UNFCCC Negotiations
Influenced by the Public?
Florian Weiler
University of Bamberg
Abstract
In international bargaining situations such as the climate change negotiations, statesform ties to support and reinforce each other’s views when they share common nego-tiation positions, and thus generate cooperative networks. So far, traditional networkanalysis has mainly focused on various centrality measures and how the actors in thenetwork are linked to each other. In this paper I employ exponential random graphmodels (ERGMs), a new approach to model networks allowing the researcher to for-mulate hypotheses derived from theory and to test them on the network serving asthe dependent variable. At the same time, these models are able to account for de-pendency structures in the network, i.e. the (realistic) assumption that tie formationis related to the formation of other ties can explicitly be modeled. The network in-vestigated in this study was constructed from observed cooperative behavior in theUNFCCC negotiations between December 2007 and December 2009. The hypothesesinvestigated in this paper are concerned with democratic control and the public opinion.
Keywords: network, ergm, climate change, public opinion, UNFCCC
1 Introduction
In settings were states’ interests diverge, achieving jointly beneficial cooperative outcomes
is difficult in the international system, according to both neorealists and liberals, due to
the lack of a global government able to enforce rules (Keohane, 1984; Waltz, 1979). Ac-
cepting anarchy as the ordering principle of world politics1, one way to realize cooperative
outcomes, according to Oye (1986), is through international negotiations. This article an-
alyzes bargaining behavior of countries in the multilateral negotiations under the auspices
of the United Nations Framework Convention on Climate Change (UNFCCC), which aim
(amongst others) at reducing the global greenhouse gas emissions in order to limit global
warming. According to Olson (1965, p.43-52), some form of coordination which emerges
among the various participants in the climate change negotiations is necessary to achieve
cooperative outcomes.
Looking at the climate change negotiations we notice that states indeed coordinate their
positions on issues on which they share closely related interest, but also that some countries
are more willing to coordinate their positions than others.2 Countries declare their common
negotiation positions by issuing joint statements during official negotiation meetings. In this
paper I analyze the thus formed network in which each of the joint statements serves as a tie
(i.e. a link between two nodes, or in this case countries). Statements were collected over a
two year period prior to the Conference of the Parties (COP) 15 in Copenhagen (December
2009), and the data are part of a newly collected dataset covering various issues of the climate
change negotiations such as positions and bargaining behavior. Various hypotheses on how
the democratic status of a country and the public opinion influence the bargaining behavior
are proposed, and then tested using a novel network approach employing exponential random
graph models (ERGMs). In what follows the terms joint statements and (network) ties will
be used interchangeably.
Why do states form ties with some states, but not with others? I propose that certain
characteristics induce states to coordinate their positions and to make joint statements. For
example, small, relatively powerless states with only relatively limited domestic greenhouse
gas emissions might want to increase the pressure on big, powerful emitters by showing them
that they act in unity. This is clearly the case when Tuvalu bonds up with other small island
states such as Micronesia or Barbados. On the other hand powerful states are very attractive
partners, hence when interests on certain issues overlap smaller countries have an incentive to
1 For a summary and a critique of this view see Wendt (1992) and also Lumsdaine (1993, p.3-29).2 Yet we also observe that countries with similar positions in many cases do not coordinate and issue
joint statements, hence similarity regarding positioning behavior alone is not enough to form ties in thenetwork.
2
issue joint statements with these players to amplify their opinion. For this reason, countries
like the US, China, or India tend to form a greater number of ties than less important states.
Similarly, I propose that the public opinion can also influence countries’ behavior in such
bargaining settings. Since the public opinion regarding climate change is hard to measure
for all participating countries, I rely on proxy variables to capture the public mood. The
thus derived hypotheses are then tested on the network formed through joint statements.
Making use of ERGMs I explore coordination of bargaining positions within the UN-
FCCC context and examine on the one hand whether the public opinion increase a single
country’s likelihood to form ties, and on the other hand whether similar pressure of the
public in different enhance the probability of position coordination among dyads (two coun-
tries). Conventional approaches to analyze international relations and cooperation, such as
neorealism and liberalism mentioned above, focus on actors attributes to analyze cooperative
behavior, most prominently power.
Traditional network analysis, on the other hand, is concerned with relational data, i.e.
ties, connections, and structures formed among players within a policy network (see e.g.
Hafner-Burton et al., 2009, p.559-560; Jonsson et al. 1998, p.324-326). ERGMs (described
in more detail below) combine these two ways of studying international relations by allowing
the researcher to test hypotheses regarding actors’ characteristics on a policy network, in the
case of this paper the network generated through the issuance of joint statements during the
various negotiation rounds of the climate change negotiations. Thus, the network serves as
the dependent variable of the analysis. This novel approach to study international relations,
although proposed in the literature (see Hafner-Burton et al., 2009, p.568), has to the best
of my knowledge not been used before.3
The aim of the ERGMs presented below is to explain how the public and democratic
control mechanisms influence the structure of the network formed among states during UN-
FCCC negotiations. The paper does not investigate the chances of the negotiations to lead
to an agreement able to deal with the global climate crisis, but instead sheds light on the
inner workings of the bargaining process, which is crucial to gain a better understanding of
how international regimes are formed. It is therefore important to distinguish between coop-
erative outcomes and coordination. The former, according to Dillenbourg et al. (1995), “is
accomplished by the division of labor among participants, as an activity where each [party]
is responsible for a portion of the problem solving”. Thus, a cooperative outcome in the
climate change case is congruent with finding an agreement which allocates to each party
3 Although there exists a working paper by Maliniak and Plouffe (2011) which applies this approach toexplain diplomatic ties between countries, creating the network based on the existence of embassies betweencountries.
3
its portion to solve the global climate crisis. Coordination, on the other hand, is an effort
by all or a subset of member countries to act in unity in the pursuit of a common goal. The
common goal of two or more countries coordinating their positions in the climate change ne-
gotiations is to achieve an agreement as close to their initial position, and thus as favorable
to them, as possible (see Weiler, 2012). Coordination with others is thus a crucial part of
a country’s diplomatic behavior. Yet not all countries with similar negotiation positions do
form coordinated ties, a clear indication that there are also strategic considerations at play.
This coordination activity between more or less likeminded players is the central topic of
this paper.
However, coordination and potential cooperative outcomes are of course closely related.
The basic problem in the climate change case, i.e. why countries have difficulties to tackle
global warming, stems from the fact that the climate system is a global public good (Stern,
2007, p.37-38). Polluters shift costs caused by their own emissions onto others, and at
the same time benefit from abatement efforts undertaken in other countries (Barrett, 2001,
p.1836-1838). From a game theoretical point of view every country has a dominant strat-
egy to continue polluting, and a disincentive to implement meaningful abatement measures
domestically. Thus, climate change constitutes a classical Prisoner’s dilemma (Hopmann,
1996, p.37-52; Ostrom 1990, p.3-5). Olson (1965) argues that coordination is required to
achieve cooperative outcomes and to overcome the Prisoner’s dilemma. Countries with simi-
lar interests should find it easiest and in their advantage to coordinate negotiation positions
in order to achieve common goals. Conversely, as coordination reduces the complexity of
the negotiations and creates reciprocal expectations, the prospects of finding a negotiated
agreement to limit global warming should increase (see Axelrod and Hamilton, 1981; Carraro
and Siniscalco, 1993; Dupont, 1994, 1996; Schelling, 1960, 2002). Studying coordination of
bargaining positions within the context of the UNFCCC negotiation is therefore important
in its own right. In this article, however, I particularly focus on whether the public opinion
plays a role for the observed coordination behavior.
2 Hypotheses
IR scholars have long established that in two player games mutuality of interests plays a
crucial role to achieve cooperative outcomes (see e.g. Axelrod, 1967; Jervis, 1978). Agree-
ment among actors is facilitated if preferences are relatively similar, because in such settings
the bargaining space is comparatively narrow and solutions are not too far away of the pre-
ferred outcome of either party (Hinich and Munger, 1997; Hopmann, 1996). Yet this insight
is difficult to transfer to situations with multiple players and widely diverging interests. In
4
complex systems, as international negotiations with multiple players, countries agreeing with
each other generally still face the problem that numerous other parties oppose them. Zart-
man (1994) describes this problem of complexity of multiparty negotiations in detail and
highlights possible approaches to analyze such multifaceted bargaining situations. One way
to reduce complexity and to facilitate finding an agreement is to form coalitions among par-
ties with similar interests (Dupont, 1994, 1996). In other words, two (or more) parties with
shared interests and attitudes decide to coordinate their positions, in general or on selected
issues, and thus substantiate their views vis-a-vis the remaining negotiating parties. Coordi-
nation among likeminded negotiators is what the Advocacy Coalition Framework (ACF, see
e.g. Sabatier and Jenkins-Smith, 1993) proposes. The ACF postulates coordination through
“biased assimilation”, which assumes that actors with similar characteristics “tend to in-
terpret evidence in a way that supports their prior beliefs and values. According to the
ACF, biased assimilation is the most basic engine that drives collaborative networking and
coalition formation around shared believe systems” (Henry, 2011, p.365). Network analysts
call such a “tendency for nodes [i.e. countries] to form ties based on common attributes
... to share strength and minimize weaknesses” (Hafner-Burton et al., 2009, p.567-568) ho-
mophily. The Resource Dependency Theory (RDT), on the other hand, postulates that
actors perceived as more influential tend to form more ties and are better connected than
less powerful players (Henry, 2011; Weible, 2005). Influence, or perceived influence, accord-
ing to this theory is thus correlated with the numbers of ties formed by an actor. While the
ACF aims at explaining why ties are formed among players with similar characteristic and
interests (homophily effect), the RDT sheds light on the total number of ties or how well an
actor is connected in the network (main effect). The RDT is complementary to the ACF in
explaining the way policy networks are formed.
Democracy, for example, is another factor in the international domain inducing dyadic
coordination, most prominently expressed in the theory of democratic peace (see e.g. Maoz
and Russett, 1993). Research has shown that democracies also tend to work more closely
together than non-democratic countries in other areas, e.g. in the field of international trade
(Morrow et al., 1998), the establishment of international organizations (Russett et al., 1998),
or the formation of alliances (Bennett, 1997; Thompson and Tucker, 1997). One reason to
expect increased coordinative behavior among democracies in negotiation settings is that
political leaders of democratic countries are more accustomed to the process of negotiating
compromises than their peers from less democratic states (see e.g. Dixon, 1994). More specific
to the climate change negotiations, I argue that the public opinion is an important driver why
democracies should be expected to work more closely together. A more “ambitious”4 treaty
4 The term ambitious is used repeatedly during the negotiations and implies a treaty aiming at limiting
5
to tackle climate change and limit global warming is in the interest of the general public,
and particularly the poorer parts of a society who will disproportionate feel the burden
of a warmer climate. Suffering of the poor can more easily be ignored in non-democratic
countries. Thus, relying on the ACF, countries with the same democratic status are expected
to exhibit an increased likelihood to coordinate their positions.
For this reason, i.e. the public opinion and audience costs, I expect democracies not only
to coordinate positions and make joint statements among them, but also to be more active in
forming ties generally, as they have to signal to the home audience that they take domestic
preferences seriously. Neumayer (2002) has shown that democracies tend to exhibit more
concern for the environment than non-democratic countries, since the electorate tends to be
better informed about environmental issues than people in authoritarian states. Further-
more, citizens are also able to express their views and to put pressure on their government
to act in environmentally friendly ways. This is also confirmed by Fredriksson and Gaston
(2000), who observe that the presence of civil liberties and democratic freedom increase the
probability of signing and ratifying environmental agreements.
H1a: The likelihood to form ties increases for countries at similar democracy
levels (homophily effect).
H1b: More democratic countries are more active and form more ties during
negotiations (main effect).
Sprinz and Vaahtoranta (1994) show that ecological vulnerability is an important factor
which shapes a country’s position in environmental negotiations such as those on climate
change due to common interests. Consequently, highly vulnerable countries constitute nat-
ural allies during the negotiations. Conversely, countries less vulnerable to climate change
also share common interest, e.g. their main goal might be to limit the costs of a potential
treaty. For this reason, I argue that vulnerability to climate change can be regarded as an-
other proxy for the public opinion. In countries less susceptible to the negative consequences
of climate change the public is more concerned with other political topics, for example the
potential (economic) loss for the country when the negotiated treaty comes into force. In
highly vulnerable countries instead, the potential negative effects of climate change are likely
one of the major concerns of the public. Hence, I use vulnerability to climate change im-
pacts as an intermediary to capture the public opinion regarding the issue. Together with
a country’s democratic status, I believe to obtain a (admittedly crude) measure of how the
public influences the bargaining behavior of states.
global warming to a maximum of 2 degree Celsius.
6
Relying on the ACF again, shared interests due to climate change vulnerability and,
thus, similar public opinions should lead countries to form ties. This is what Buys et al.
(2009) imply when they calculate vulnerability values for most countries of the world and
then conclude that based on these differing vulnerabilities “countries can have very different
orientations towards a global protocol” (p.303).
Negotiating parties also gain some sort of influence from higher vulnerability levels. Ac-
cording to theory, it might be difficult for other parties for whom the issue is less salient
to ignore highly vulnerable states’ concerns. The reason is again the public opinion, be-
cause domestic audiences put pressure on their governments to take concerns of weak and
vulnerable countries seriously (Fearon, 1994, 1997). These audience costs force players for
whom the issue is less salient to consider more vulnerable party’s apprehensions. In other
words, salience can help less powerful states to be taken seriously by more powerful countries.
Therefore, even small and supposedly weak parties can increase their impact on the negotia-
tions substantially.5 Vulnerability to climate change impacts thus may serve as a substitute
for (or be additive to) pure economic power during negotiations (Jonsson, 1981), although
some authors are more skeptical and state that vulnerability is a weakness as countries are
more dependent on finding a negotiated agreement and therefore more willing to make con-
cessions (Grundig et al., 2001). Yet, accepting vulnerability as a source of power, the RDT
suggests a higher likelihood of more vulnerable countries to form ties in the network. This
makes sense from a purely logical point of view. Countries highly sensitive to changes in the
climate system have a high motivation to get involved in the negotiations, to lobby others
by pressing their case, to seek out potential allies, and in general to be more active, which
ultimately causes them to form more ties.
H2a: The likelihood to form ties increases as the vulnerability levels of two coun-
tries become more similar (homophily effect).
H2b: More vulnerable parties are more active and form more ties during climate
change negotiations (main effect).
Coalition groups play a crucial role in the climate change negotiations. Coalition for-
mation is formalized within the UNFCCC context, and official negotiation groups based
on economic and/or regional characteristics appeared over time. Examples are the African
Group, the group of Least Developed Countries (LDCs), or the Alliance of Small Island
States (AOSIS). Official meeting are held at the negotiation group level during the interna-
tional negotiation rounds to coordinate negotiation positions of the coalition members for
5 An example of small countries achieving a lot more than expected is the AOSIS negotiation group, inparticular Tuvalu (see also Betzold et al., 2012).
7
the general meetings. It is therefore rather straight forward to expect countries of the same
coalition group to coordinate more often with each other than with countries from other
negotiation groups, first because they tend to share similar interests, and second because
regular interactions foster personal relations between negotiators over time, which facilitates
coordination (Rubin and Swap, 1994). For this reason I include coalition membership as a
control variable in all the models proposed in the remainder of this paper.
3 Research design
In order to test the proposed hypotheses I employ exponential random graph models (ERGMS).
In such models, the observed network is regarded as a self-organizing structure. It is further
assumed that social processes, which can be modeled, generate the dyadic relations (Robins
et al., 2007, p.175-177). Thus, in ERGMs the dependent variable is the observed network.
When modeling such a network purely on nodal attributes, the assumption underlying
the model is of dyadic independence, i.e. the formation of ties does not depend on other ties
(Goodreau et al., 2009, p.109). However, in social settings such as negotiations, it is rather
unrealistic to assume dyadic independence. Therefore the specification of dyadic dependence
models (also called dependence graphs) is proposed in the literature (see Jensen and Winzen,
2012, and in particular Snijders et al. 2006 for various possible model specifications). Fol-
lowing Goodreau et al. (2009) I propose models including one parameter for triad closure
(edge-wise shared partner parameter models) and another parameter for mean nodal degree6
in order to control for the dependency structures in the network. The former measures the
magnitude of triangular relationships formed in the network, or more specifically whether
two nodes forming ties with the same partner have an increased probability of forming a tie
as well (a friend of a friend is a friend, see also Robins et al., 2007). In practice, triad closure
is investigated making use of the geometrically weighted edge-wise shared partner (GWESP)
statistic provided by the ergm-package, part of the wider network-package written for the R
environment (Butts, 2008; Goodreau et al., 2008; Hunter et al., 2008). The weighting pa-
rameters included in the GWESP statistic is fixed at a set value (again following Goodreau
et al., 2009, p.111-112) to avoid the need for curved exponential family models, additional
parameter estimation, and model degeneracy issues (see Hunter, 2007).7
6 I employ the term ‘edges’ of the ergm-package for R for mean degree, which is measuring the same asthe ‘meandeg’-term of that same package, but is easier to interpret (see Morris et al., 2008). In addition,I also included the geometrically weighted dyadwise shared partner statistic (GWDSP, see Robins et al.,2007), yet this measure was not significant in any model tested and worsened the model fit, hence I droppedit.
7 To attain a value for the weighting parameter I employed the procedure explained in Goodreau et al.(2009, p.111-112). The value used is 0.10, although an alteration does not change the results dramatically.
8
ERGMs allow the estimation of homophily and main effects, both proposed in the hy-
potheses above, simultaneously. For the benefit of the reader unfamiliar ERGMs, I provide a
reading example how to interpret these effects here. If, for example, the estimated homophily
effect of a categorical variable is 0.3 (as in the democracy case below), these log-odds must
first be transformed into odds, which gives 1.35. This simply means that two countries from
the same category have a 35% higher likelihood to form a tie than countries from different
categories. The interpretation of homophily is slightly more complicated in the continuous
case. Say the estimated effect is -0.15, in this case the odds after the transformation are
0.86. This means that as the difference between two countries with respect to that continuous
variable increases by 1, the chances of forming a tie decrease by 14%. Again, more similar
countries have an increased chance of coordination, hence the term homophily. Therefore,
for continuous variables a negative effect indicates that countries more similar to each other
are more likely to coordinate, while in the categorical case a positive sign implies homophily.
Main effects, on the other hand, are interpreted in the usual fashion. Assuming the co-
efficient of a continuous variable to be 0.5, which de-logged is 1.65, this denotes that a 1
point increase in that variable increases the chance of forming a tie (with a randomly chosen
partner) by 65%. Hence, homophily is a dyadic measure which captures the probability of
coordination among countries based on similarity. Main effects, on the other hand, capture
how variations in characteristics influence the general activity of countries in the network.
3.1 The network of UNFCCC negotiations
During the UNFCCC negotiation meetings countries have the possibility to voice their views
in various segments such as the Ad hoc Working Group on Long-term Cooperative Action
under the Convention (AWG-LCA), the Ad hoc Working Group on Further Commitments
for Annex I Parties under the Kyoto Protocol (AWG-KP), the Subsidiary Body for Scientific
and Technological Advice (SBSTA), or the High Level Segment. These statements have been
registered and published by the Earth Negotiations Bulletin (ENBs, see IISD, 2009) for a
wide variety of environmental meetings and negotiations since 1992. An issue of the ENBs
is published for every day of the UNFCCC negotiations, and includes a summary (usually
about one sentence long) of the majority of statement made by the negotiation parties in
the publicly accessible meetings.
All the ENBs on the climate change negotiations during the 2-year period from COP 13 in
Bali (December 2007) to COP 15 in Copenhagen (December 2009) were hand-coded. Thus,
in total 11 negotiation rounds and 90 negotiation days are incorporated in the dataset from
which the network is derived. For every statement reported, four properties were recorded:
9
(i) who made the statement; (ii) which segment of the negotiations it was made in (e.g. COP,
AWG-KP, COP/MOP, AWG-LCA, SBI, SBSTA); (iii) the main topic of the statement (e.g.
mitigation, adaptation, finance, measuring, reporting, and verification), any subcategories,
and (if applicable) the kind of bargaining strategy used; (iv) whether the statement was
issued by a single country or as a joint statement by two or more parties, and whether it was
later supported or opposed (and if so, by whom). After the statements of each negotiation
day were coded, they were aggregated for every negotiation round, and finally combined
to obtain values for the whole 2-year period. The thus generated data not only provide
an overview of cooperation and position coordination among countries, but also provide an
indication of saliency of the different negotiation issues (how often were topics discussed by
a country).
The network serving as the dependent variable in this paper consists of all the joint
statements made over the two year period of the analysis. Hence, if two countries ever issued
a joint statement between (and including) COP 13 and COP 15, they appear in the network
as having formed a tie. The network thus constructed is represented in Figure 1.8 Statements
made by official negotiations groups were excluded from the analysis. Coalition groups are
expected to make joint statements at the outset of meetings, hence these statements merely
represent the smallest common denominator countries within a group could agree upon
and not coordinated positions. Furthermore, group statements do not allow the inclusion of
countries from outside the group, hence they cannot be interpreted as coordination as defined
above and investigated in this paper. The one exception is the European Union (EU), which
acts as a single entity in the negotiations. As the member states do not issue individual
statements during the negotiations, they are excluded from the analysis and instead the
EU’s group statements are recorded as coming from a single participant in the negotiations.9
This reflects the structure of the UNFCCC negotiations, were the EU is allowed to negotiate
as a block. Finally, negotiating parties not issuing any statements over the study period
were excluded from the analysis.
The thus generated network has 97 nodes, each representing a party to the UNFCCC. Of
the overall possible 4656 possible ties in the network 247 were realized during the two-year
8 Whether a given dyad has coordinated only once or multiple times during the period under study doesnot affect the network for the ERGMs, countries are registered as forming a tie independent of the numberof joint statements. In the network depicted in Figure 1, however, the line width of the edges depends onthe number of joint statement to give the reader a better idea of the collected data. ERGMs for valuednetworks (i.e. networks in which different values for edges representing the intensity of dyadic coordination)are currently under development at the University of Washington, Seattle (see Krivitsky, view). Futureversions of the ergm-package for R will make the implementation of such models possible for practitioners.
9 This means other attributes such as power, or democracy must be aggregated for the EU, which isdone either by averaging (e.g. democratic level) or by summating (e.g. CO2 emissions), whichever is moreappropriate.
10
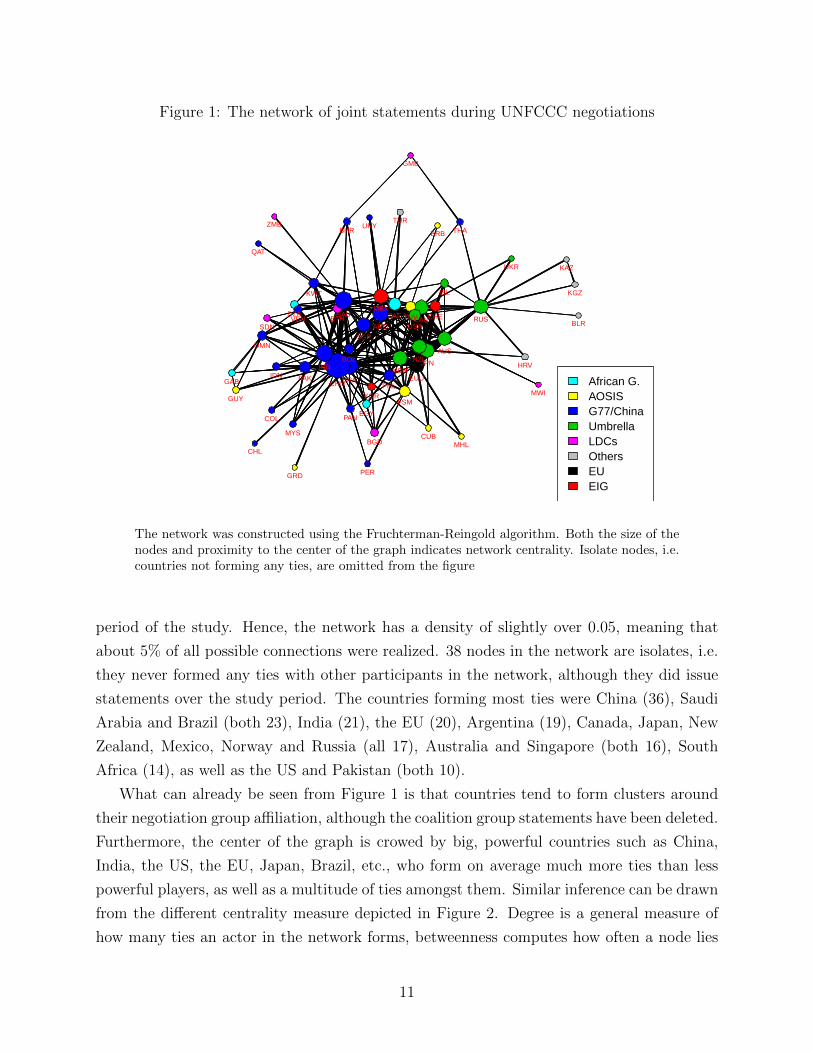
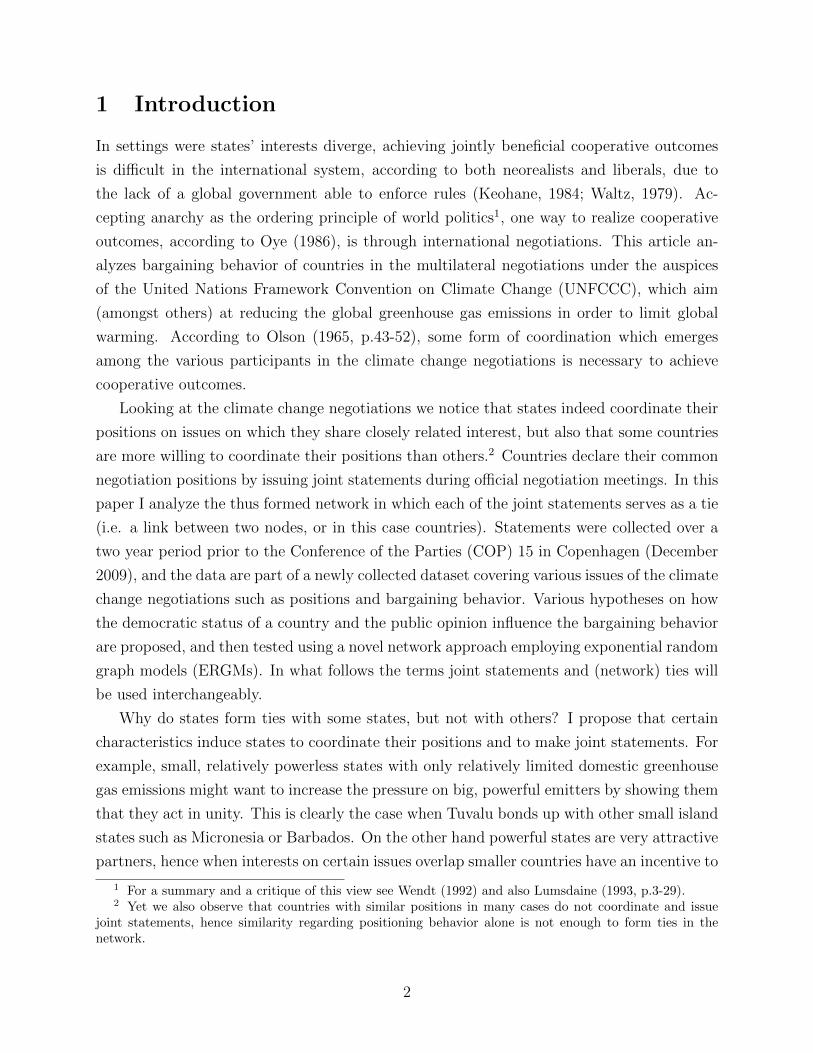
Figure 1: The network of joint statements during UNFCCC negotiations
DZA
ARG
AUS
BHR
BGD
BRB
BLR
BOL
BRA
CAN
CHL
CHN
COL
HRV
CUB
EGY
EUU
ETH
GAB
GMB
GRD
GUY
ISL
INDIDN
JPN
KAZ
KWT KGZ
MWI
MYS
MHL
MEX
FSM
NZL
NOR
OMN
PAK
PAN
PER
PHL
QAT
KOR
RUSSAU
SGP
ZAF
SDNCHE
THATUR
TUV
UKR
URY
USAVEN
ZMB
African G.AOSISG77/ChinaUmbrellaLDCsOthersEUEIG
The network was constructed using the Fruchterman-Reingold algorithm. Both the size of thenodes and proximity to the center of the graph indicates network centrality. Isolate nodes, i.e.countries not forming any ties, are omitted from the figure
period of the study. Hence, the network has a density of slightly over 0.05, meaning that
about 5% of all possible connections were realized. 38 nodes in the network are isolates, i.e.
they never formed any ties with other participants in the network, although they did issue
statements over the study period. The countries forming most ties were China (36), Saudi
Arabia and Brazil (both 23), India (21), the EU (20), Argentina (19), Canada, Japan, New
Zealand, Mexico, Norway and Russia (all 17), Australia and Singapore (both 16), South
Africa (14), as well as the US and Pakistan (both 10).
What can already be seen from Figure 1 is that countries tend to form clusters around
their negotiation group affiliation, although the coalition group statements have been deleted.
Furthermore, the center of the graph is crowed by big, powerful countries such as China,
India, the US, the EU, Japan, Brazil, etc., who form on average much more ties than less
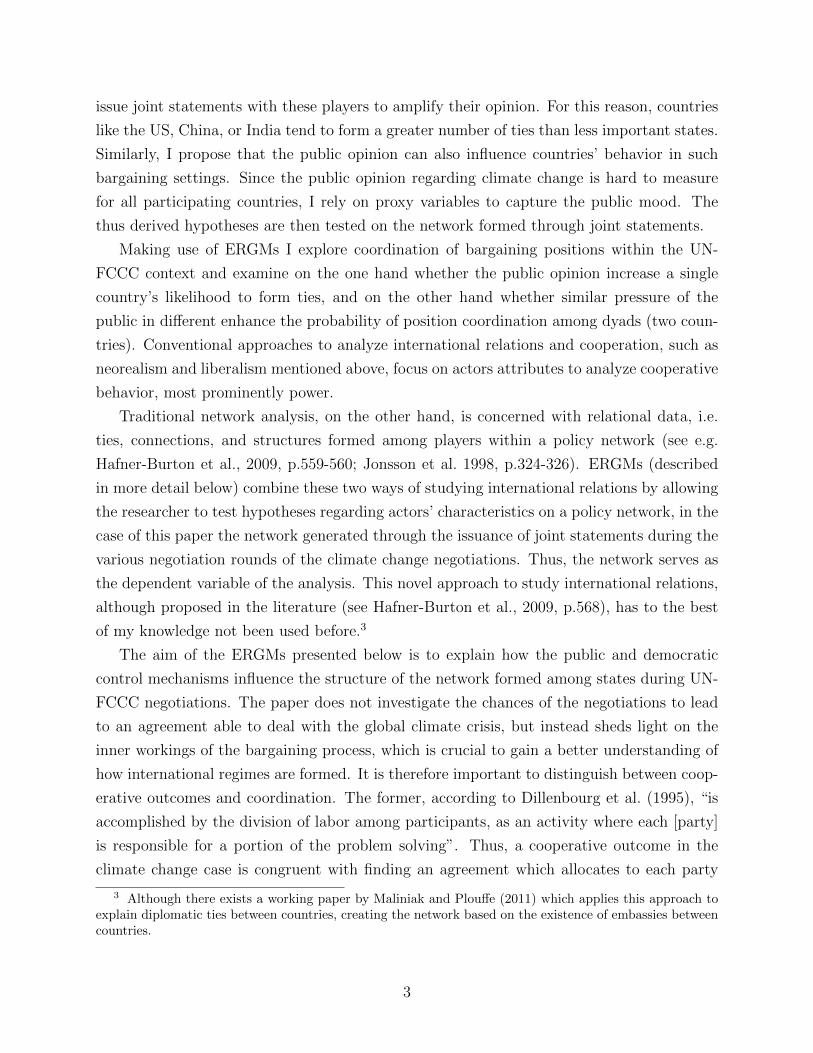
powerful players, as well as a multitude of ties amongst them. Similar inference can be drawn
from the different centrality measure depicted in Figure 2. Degree is a general measure of
how many ties an actor in the network forms, betweenness computes how often a node lies
11
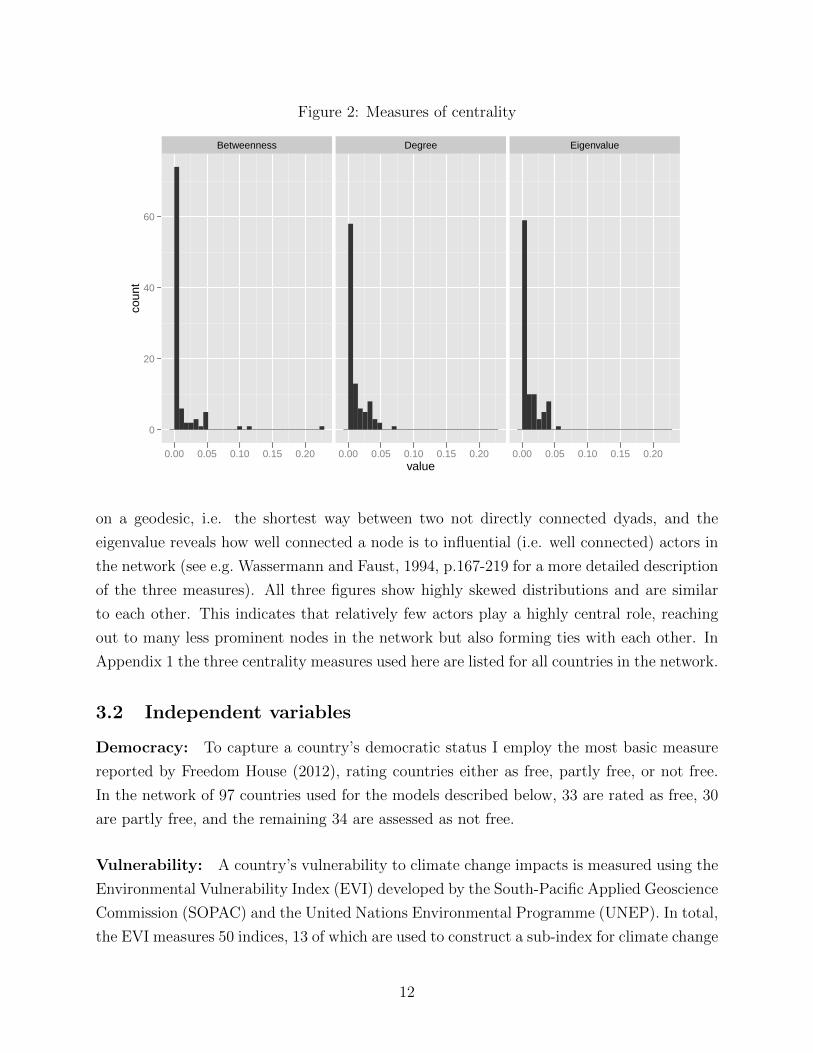
Figure 2: Measures of centrality
Betweenness Degree Eigenvalue
0
20
40
60
0.00 0.05 0.10 0.15 0.20 0.00 0.05 0.10 0.15 0.20 0.00 0.05 0.10 0.15 0.20value
coun
t
on a geodesic, i.e. the shortest way between two not directly connected dyads, and the
eigenvalue reveals how well connected a node is to influential (i.e. well connected) actors in
the network (see e.g. Wassermann and Faust, 1994, p.167-219 for a more detailed description
of the three measures). All three figures show highly skewed distributions and are similar
to each other. This indicates that relatively few actors play a highly central role, reaching
out to many less prominent nodes in the network but also forming ties with each other. In
Appendix 1 the three centrality measures used here are listed for all countries in the network.
3.2 Independent variables
Democracy: To capture a country’s democratic status I employ the most basic measure
reported by Freedom House (2012), rating countries either as free, partly free, or not free.
In the network of 97 countries used for the models described below, 33 are rated as free, 30
are partly free, and the remaining 34 are assessed as not free.
Vulnerability: A country’s vulnerability to climate change impacts is measured using the
Environmental Vulnerability Index (EVI) developed by the South-Pacific Applied Geoscience
Commission (SOPAC) and the United Nations Environmental Programme (UNEP). In total,
the EVI measures 50 indices, 13 of which are used to construct a sub-index for climate change
12
vulnerability (Kaly et al., 2004).10 Although the EVI has been criticized for various reasons
(Barnett et al., 2008), - for example, on the grounds that it is impossible to quantify complex
social-ecological processes - this criticism is not particular to it and applies to all indices that
measure vulnerability.
3.3 Control variables
Power: As can be seen from Figures 1 and 2, powerful countries play a crucial role in the
negotiations. For this reason, I include two measures of power in the models. First, by the
amount of greenhouse gases a country emitted in the last year of the negotiations(UN, 2011,
yet I transform the units to 100 millions of metric tons of CO2 due to model convergence
issues). Emissions capture power in the climate change negotiations in two ways. On the
one hand they are closely related to a country’s GDP and thus economic power.11 On the
other hand they are a proxy for the influence a country has on changing climate, adding
to the negotiation party’s importance in the negotiations on climate change. As a second
power measure I apply delegation size, obtained from the official UNFCCC participants
list at the Copenhagen Climate Change Conference in December 2009 (UNFCCC, 2009).
Delegation size captures a delegation’s potential to specialize, attend meetings, and to form
close relationships with a multitude of delegation members from other countries and thus
represents a softer form of power than greenhouse gas emissions.
Negotiation group: To control for coalition groups an additional variable capturing group
membership is added. Although some non-Annex 1 countries are members of more than one
negotiation group, for the purpose of this paper they are coded as belonging to only a single
coalition deemed most important for them. Almost all non-Annex 1 countries are members
of the G77/China, however, when they are also part of another group, they are coded as
members of that coalition. The same procedure is repeated for Africa, where all countries
are part of the African Group, but some in addition are members of the LDCs and are always
coded as such. All AOSIS countries are furthermore coded to belong to that group. Table 1
provides summary statistics for the independent variables.
10 These are indices capturing climatic changes such as precipitation, droughts, etc. CO2 emissions assuch are not included, only consequences of increased global temperatures. Thus, collinearity between thevulnerability index and the greenhouse gas emissions capturing power is not problematic.
11 When using GDP instead of emissions to capture power the results are very similar although slightlyless significant (at the 1% instead of the 0.1% level)
13
Table 1: Descriptive statistics of the independent variables
Variable name Obs. Mean s.d. Min. Max.Vulnerability 97 3.28 0.71 1.85 4.90Emissions 97 2.95 10.00 0 70.32Delegation size 97 68.7 80.64 6 450
4 Results and discussion
The results of the models described in this section are summarized below in Table 2. When
running a model including only the parameters capturing the dependency structure in the
network (triad closure and mean nodal degree, model not in Table 2), the model converges
quickly and both parameters are highly significant. However, both measures for goodness
of fit in this simple model, the AIC and the BIC (1621.4 and 1634.3 respectively), are
higher than in all models including additional parameters. This indicates that all presented
models include substantive effects and are an improvement over the baseline model. In what
follows, the various hypotheses will be further evaluated against the evidence provided by
the models. Table 3 provides a summary for the odds and the percentage change in the
odds for all significant effects of Model 4 in Table 2.12 These results are repeatedly used
in the following discussion. Models 1 and 2 of Table 2 are partial models, with Model 1
being the democracy model, and Model 2 the vulnerability model. Models 3 and 4 are full
models, yet the former includes all operationalized terms, while the latter only includes the
more substantial parameters for power. footnoteDyadic dependence models such as those
proposed in this paper are estimated using Markov chains Monte Carlo (MCMC) methods.
Hence, run length of the Markov chain is an important issue. For the partial models reveal
chains with a length of 300,000 iterations are sufficient to achieve convergence. However,
model diagnostics reveal that a run of about 3 million iterations is required to fully explore
Models 3 and 4. In what follows I discuss these models with a particular focus on Model 4,
as this is the model with the best goodness of fit according to the BIC.
Democracy: The results for a country’s democratic status indicate increased coordination
at similar levels of democracy, as H1a suggests. Although only significant at the 10% level
in the partial model, the significance increases in both full models and is thus corroborated.
The homophily effect of 0.30 in Model 5 of Table 2 translates to odds of 1.36, which implies
that countries sharing the same Freedom House rating have an higher likelihood to issue joint
12 The coefficients of the models are log-odds and must therefore be transformed into odds before theycan be interpreted further.
14
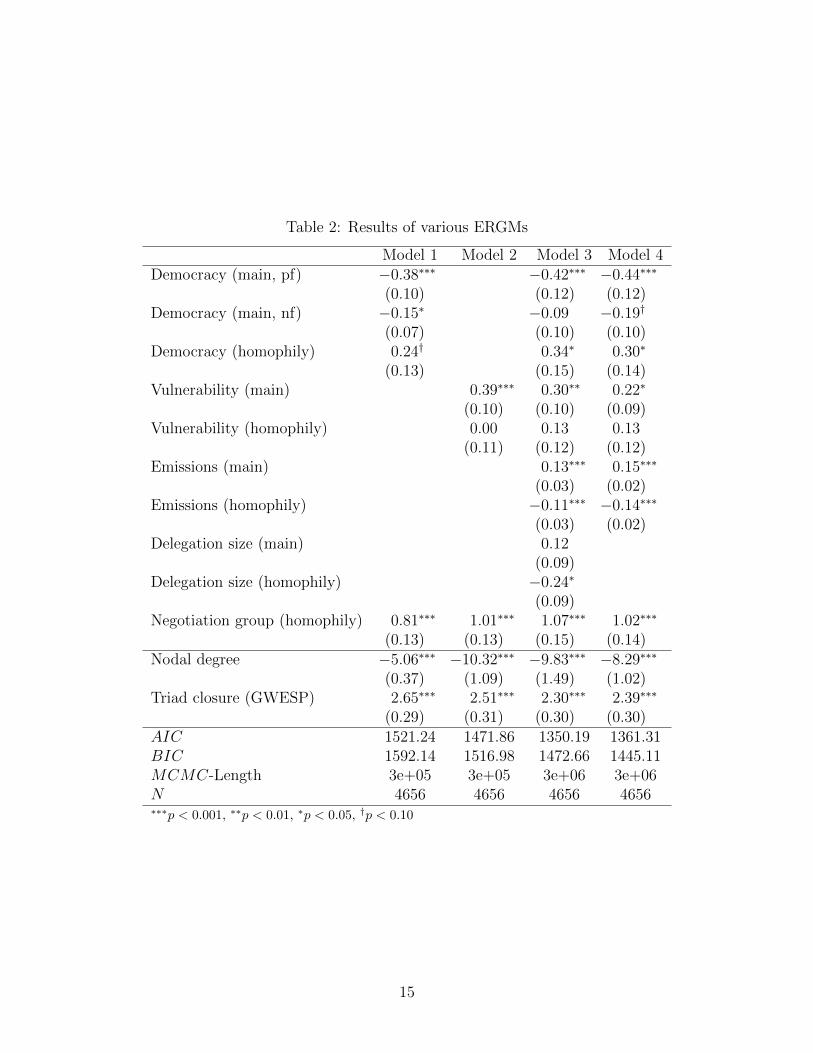
Table 2: Results of various ERGMs
Model 1 Model 2 Model 3 Model 4Democracy (main, pf) −0.38∗∗∗ −0.42∗∗∗ −0.44∗∗∗
(0.10) (0.12) (0.12)Democracy (main, nf) −0.15∗ −0.09 −0.19†
(0.07) (0.10) (0.10)Democracy (homophily) 0.24† 0.34∗ 0.30∗
(0.13) (0.15) (0.14)Vulnerability (main) 0.39∗∗∗ 0.30∗∗ 0.22∗
(0.10) (0.10) (0.09)Vulnerability (homophily) 0.00 0.13 0.13
(0.11) (0.12) (0.12)Emissions (main) 0.13∗∗∗ 0.15∗∗∗
(0.03) (0.02)Emissions (homophily) −0.11∗∗∗ −0.14∗∗∗
(0.03) (0.02)Delegation size (main) 0.12
(0.09)Delegation size (homophily) −0.24∗
(0.09)Negotiation group (homophily) 0.81∗∗∗ 1.01∗∗∗ 1.07∗∗∗ 1.02∗∗∗
(0.13) (0.13) (0.15) (0.14)Nodal degree −5.06∗∗∗ −10.32∗∗∗ −9.83∗∗∗ −8.29∗∗∗
(0.37) (1.09) (1.49) (1.02)Triad closure (GWESP) 2.65∗∗∗ 2.51∗∗∗ 2.30∗∗∗ 2.39∗∗∗
(0.29) (0.31) (0.30) (0.30)AIC 1521.24 1471.86 1350.19 1361.31BIC 1592.14 1516.98 1472.66 1445.11MCMC-Length 3e+05 3e+05 3e+06 3e+06N 4656 4656 4656 4656∗∗∗p < 0.001, ∗∗p < 0.01, ∗p < 0.05, †p < 0.10
15
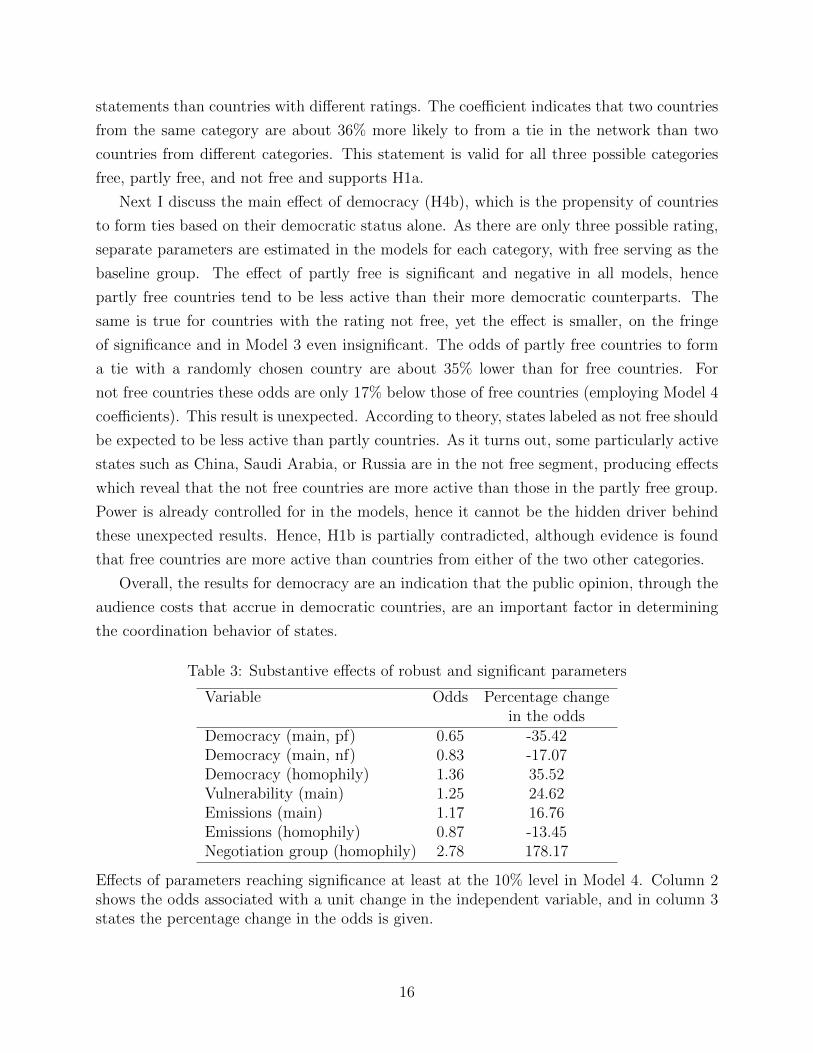
statements than countries with different ratings. The coefficient indicates that two countries
from the same category are about 36% more likely to from a tie in the network than two
countries from different categories. This statement is valid for all three possible categories
free, partly free, and not free and supports H1a.
Next I discuss the main effect of democracy (H4b), which is the propensity of countries
to form ties based on their democratic status alone. As there are only three possible rating,
separate parameters are estimated in the models for each category, with free serving as the
baseline group. The effect of partly free is significant and negative in all models, hence
partly free countries tend to be less active than their more democratic counterparts. The
same is true for countries with the rating not free, yet the effect is smaller, on the fringe
of significance and in Model 3 even insignificant. The odds of partly free countries to form
a tie with a randomly chosen country are about 35% lower than for free countries. For
not free countries these odds are only 17% below those of free countries (employing Model 4
coefficients). This result is unexpected. According to theory, states labeled as not free should
be expected to be less active than partly countries. As it turns out, some particularly active
states such as China, Saudi Arabia, or Russia are in the not free segment, producing effects
which reveal that the not free countries are more active than those in the partly free group.
Power is already controlled for in the models, hence it cannot be the hidden driver behind
these unexpected results. Hence, H1b is partially contradicted, although evidence is found
that free countries are more active than countries from either of the two other categories.
Overall, the results for democracy are an indication that the public opinion, through the
audience costs that accrue in democratic countries, are an important factor in determining
the coordination behavior of states.
Table 3: Substantive effects of robust and significant parameters
Variable Odds Percentage changein the odds
Democracy (main, pf) 0.65 -35.42Democracy (main, nf) 0.83 -17.07Democracy (homophily) 1.36 35.52Vulnerability (main) 1.25 24.62Emissions (main) 1.17 16.76Emissions (homophily) 0.87 -13.45Negotiation group (homophily) 2.78 178.17
Effects of parameters reaching significance at least at the 10% level in Model 4. Column 2shows the odds associated with a unit change in the independent variable, and in column 3states the percentage change in the odds is given.
16
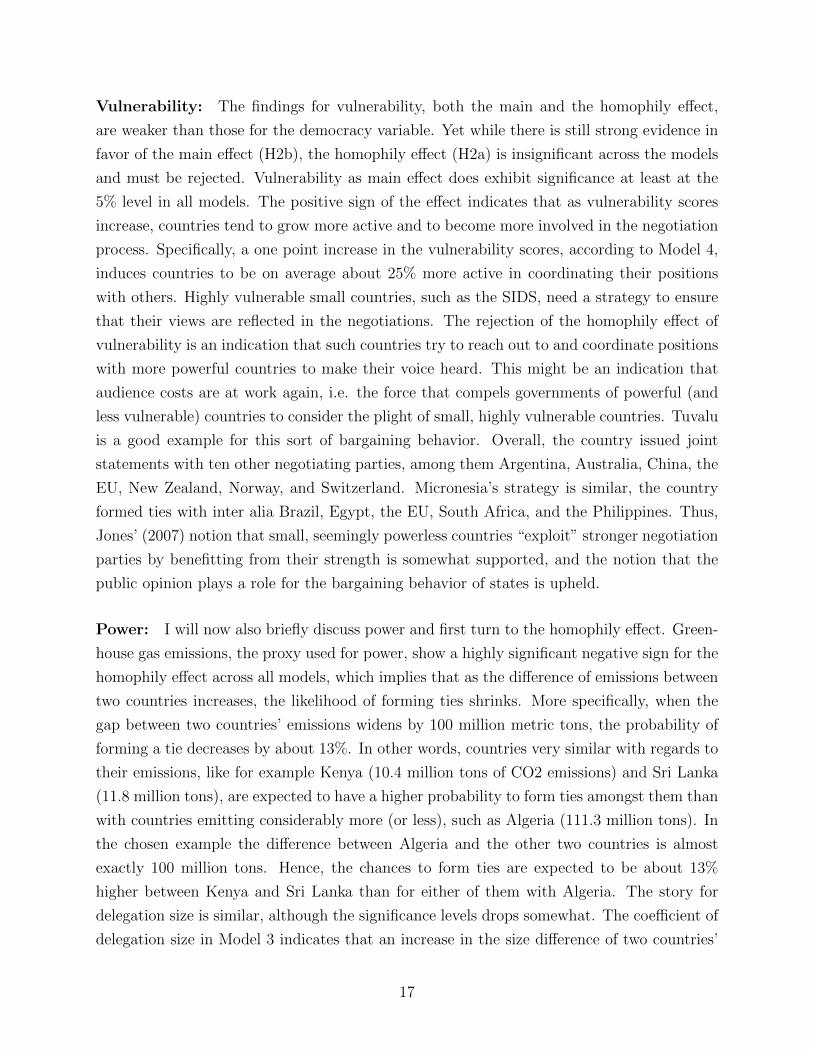
Vulnerability: The findings for vulnerability, both the main and the homophily effect,
are weaker than those for the democracy variable. Yet while there is still strong evidence in
favor of the main effect (H2b), the homophily effect (H2a) is insignificant across the models
and must be rejected. Vulnerability as main effect does exhibit significance at least at the
5% level in all models. The positive sign of the effect indicates that as vulnerability scores
increase, countries tend to grow more active and to become more involved in the negotiation
process. Specifically, a one point increase in the vulnerability scores, according to Model 4,
induces countries to be on average about 25% more active in coordinating their positions
with others. Highly vulnerable small countries, such as the SIDS, need a strategy to ensure
that their views are reflected in the negotiations. The rejection of the homophily effect of
vulnerability is an indication that such countries try to reach out to and coordinate positions
with more powerful countries to make their voice heard. This might be an indication that
audience costs are at work again, i.e. the force that compels governments of powerful (and
less vulnerable) countries to consider the plight of small, highly vulnerable countries. Tuvalu
is a good example for this sort of bargaining behavior. Overall, the country issued joint
statements with ten other negotiating parties, among them Argentina, Australia, China, the
EU, New Zealand, Norway, and Switzerland. Micronesia’s strategy is similar, the country
formed ties with inter alia Brazil, Egypt, the EU, South Africa, and the Philippines. Thus,
Jones’ (2007) notion that small, seemingly powerless countries “exploit” stronger negotiation
parties by benefitting from their strength is somewhat supported, and the notion that the
public opinion plays a role for the bargaining behavior of states is upheld.
Power: I will now also briefly discuss power and first turn to the homophily effect. Green-
house gas emissions, the proxy used for power, show a highly significant negative sign for the
homophily effect across all models, which implies that as the difference of emissions between
two countries increases, the likelihood of forming ties shrinks. More specifically, when the
gap between two countries’ emissions widens by 100 million metric tons, the probability of
forming a tie decreases by about 13%. In other words, countries very similar with regards to
their emissions, like for example Kenya (10.4 million tons of CO2 emissions) and Sri Lanka
(11.8 million tons), are expected to have a higher probability to form ties amongst them than
with countries emitting considerably more (or less), such as Algeria (111.3 million tons). In
the chosen example the difference between Algeria and the other two countries is almost
exactly 100 million tons. Hence, the chances to form ties are expected to be about 13%
higher between Kenya and Sri Lanka than for either of them with Algeria. The story for
delegation size is similar, although the significance levels drops somewhat. The coefficient of
delegation size in Model 3 indicates that an increase in the size difference of two countries’
17
delegations by 10 decreases the propensity to form ties by slightly more than 2%.
Now to the main effect of power. According to Model 4 of Table 2, an increase of
emissions by 100 million tons is congruent with a 17% increase in forming ties. To stick to
the example from above, although Algeria has a lower probability of forming a tie with Kenya
than Sri Lanka (due to homophily), the chances that Algeria coordinates with a randomly
chosen partner are about 17% higher than for either of the two others. The main effect of
delegation size tells a similar story, although the coefficient falls below significance in the full
model.
Finally, note that the effect of the control variable negotiation group is highly significant
across all models. The direction and size of the effect confirms that countries of a coalition
group tend to work much closer together than two randomly chosen countries, even after
discounting the purely group specific statements. Overall, coalition partners have an almost
three times higher probability of issuing joint statements than two countries from different
groups. Although not very surprising, this result shows that coalitions indeed play a pivotal
role in the climate change negotiations.
5 Conclusion
The results of the models described and discussed in this paper indicate that coordinated
behavior in the form of issuing joint statements during the climate change negotiations
strongly depends on countries’ interests and characteristics, and in particular that the public
opinion and democracy play a role in how ties are formed, and which countries work together.
ERGMs provide an ideal opportunity to empirically test hypotheses derived from the IR
literature on a network including a big number of the worlds’ countries. This novel approach
used in this paper, modeling country characteristics on a network of ties in the climate
change negotiations, helps to shed more light on the question why countries coordinate
their negotiation positions and how cooperation in a multiparty environment works. In
particular, the paper shows that a country’s power and its democratic status both play a
role in determining the coordinative behavior of parties to the UNFCCC. The statistical
models discussed above show that both homophily as well as main effects are important in
explaining the structure of the network formed in the climate change negotiations through
joint statements.
In the introduction of this paper I argued that explaining the structure of the network
formed during the UNFCCC negotiations is important to gain a better understanding of
regime formation. Coordination of negotiation positions reduces the complexity of the nego-
tiations and thus facilitates overcoming the Prisoner’s Dilemma. This paper demonstrates
18
that coordination indeed occurs and that the public opinion is one of the drivers of this co-
ordination. On the other hand, countries particularly vulnerable to climate change impacts
do not primarily seek partnership with other climate sensitive countries, but instead try
to voice their concerns by teaming up with often powerful and thus influential negotiating
parties, who cannot these weaker players due to audience costs. Thus, the overall network
shows clear patterns of coordination. On the one hand countries seek to maximize their
gains by influencing the outcome of the negotiations in their favor. On the other hand these
structures shed light on the inner process of regime formation, as clear battle lines between
democratic and non-democratic states and developed and developing countries (the coalition
groups).
To conclude, networks in international negotiations do not form randomly and the public
opinion is one important variable explaining why certain ties form, while others do not. Find-
ing alternative measures to capture the public opinion would be desirable, since the reliance
on proxies is prone to lead to mistakes. Yet, since other measures for the public opinion
regarding climate change are currently not available on a global scale, this first attempt to
measure the public’s influence on international climate change negotiations exhibits already
interesting results, and could be a first step indicating which direction future work might
take.
19
References
Adair, W. L. and J. M. Brett (2004). Culture and negotiation processes. In M. J. Gelfandand J. M. Brett (Eds.), The Handbook of Negotiation and Culture, pp. 158–176. Stanford,CA: Stanford Business Books.
Axelrod, R. (1967). Conflict of interest: An axiomatic approach. Journal of Conflict Reso-lution 11 (1), 87–99.
Axelrod, R. and W. D. Hamilton (1981). The evolution of cooperation. Science 211 (4489),1390–1396.
Bailer, S. (2004). Bargaining success in the European Union: The impact of exogenous andendogenous power resources. European Union Politics 5 (1), 99–123.
Barnett, J., S. Lambert, and I. Fry (2008). The hazards of indicators: Insights from the Envi-ronmental Vulnerability Index. Annals of the Association of American Geographers 98 (1),102–119.
Barrett, S. (2001). International cooperation for sale. European Economic Review 45 (2001),1835–1850.
Bennett, D. S. (1997). Testing alternative models of alliance duration, 1816-1984. AmericanJournal of Political Science 41 (3), 846–878.
Bernauer, T., A. Kalbhenn, V. Koubi, and G. Spilker (2009). A comparison of interna-tional and domestic sources of global governance dynamics. British Journal of PoliticalScience 40 (3), 487–508.
Betzold, C., P. Castro, and F. Weiler (2012). AOSIS in the UNFCCC negotiations: Fromunity to fragmentation? Climate Policy 12 (5), 591–613.
Bohringer, C., A. Loschel, U. Moslener, and T. Rutherford (2009). EU climate policy up to2020: An economic impact assessment. Energy Economics 31 (Supplement 2), S295–S305.
Butts, C. T. (2008). network: A package for managing relational data in R. Journal ofstatistical software 24 (2), 1–36.
Buys, P., U. Deichmann, C. Meisner, T. T. Thao, and D. Wheeler (2009). Country stakesin climate change negotiations: Two dimensions of vulnerability. Climate Policy 9 (3),288–305.
Carraro, C. and D. Siniscalco (1993). Strategies for the international protection of theenvironment. Journal of Public Economics 52, 309–328.
Diamond, L. (2011). A Fourth Wave or False Start? Democracy After the Arab Spring.Foreign Affairs, May 22.
20
Dillenbourg, P., M. J. Baker, A. Blaye, and C. O’Malley (1995). The evolution of researchon collaborative learning. In P. Reimann and H. Spada (Eds.), Learning in humans andMachines. Towards an Interdisciplinary Learning Science, Volume 189-211. London: Perg-amon.
Dixon, W. J. (1994). Democracy and the peaceful settlement of international conflict. Amer-ican Political Science Review 88 (1), 14–32.
Dupont, C. (1994). Coalition theory: Using power to build cooperation. In I. W. Zartman(Ed.), International Multilateral Negotiations. Approaches to the Management of Com-plexity, pp. 148–177. San Francisco: Jossey-Bass Publishers.
Dupont, C. (1996). Negotiation as coalition building. International Negotiation 1 (1), 47–64.
Fearon, J. D. (1994). Domstic political audiences and the escalation of international disputes.American Political Science Review 90 (7), 15–35.
Fearon, J. D. (1997). Signaling foreign policy interests: Tying hands versus sinking costs.The Journal of Conflict Resolution 41 (1), 68–90.
Fredriksson, P. G. and N. Gaston (2000). Ratification of the 1992 climate change convention:What determines legislative delay? Public Choice 104 (3), 345–368.
Freedom House (2012). Country ratings and status, fiw 1973-2009, available athttp://www.freedomhouse.org/report-types/freedom-world.
Gelfand, M. J., L. H. Nishii, K. M. Holcombe, N. Dyer, K.-I. Ohbuchi, and M. Fukuno(2001). Cultural influences on cognitive representations of conflict: Interpretations ofconflict episodes in the united states and japan. Journal of Applied Psychology 86 (6),1059–1074.
Goodreau, S. M., M. S. Handcock, D. R. Hunter, C. T. Butts, and M. Morris (2008). Astatnet tutorial. Journal of statistical software 24 (9), 1–27.
Goodreau, S. M., J. A. Kitts, and M. Morris (2009). Birds of a feather, or friend of afriend? using exponential random graph models to investigate adolescent social networks*.Demography 46 (1), 103–125.
Goodwin, J. and M. Emirbayer (1994). Network analysis, culture, and the problem of agency.The American Journal of Sociology 99 (6), 1441–1454.
Grundig, F., H. Ward, and E. P. Zorick (2001). Modelling Global Climate Negotiations,Volume 153-182 of International Relations and Global Climate Change. Cambridge, MA:MIT Press.
Hafner-Burton, E. M., M. Kahler, and A. H. Montgomery (2009). Network analysis forinternational relations. International Organization 63 (3), 559–92.
Henry, A. D. (2011). Ideology, power, and the structure of policy networks. Policy StudiesJournal 39 (3), 361–383.
21
Hinich, M. and M. Munger (1997). Analytical Politics. Cambridge, New York, Melbourne:Cambridge University Press.
Hopmann, P. T. (1996). The Negotiation Process and the Resolution of International Con-flicts. Columbia: University of South Carolina Press.
Hunter, D. R., M. S. Handcock, C. T. Butts, S. M. Goodreau, and M. Morris (2008). ergm:A package to fit, simulate and diagnose exponential-family models for networks. Journalof statistical software 24 (3), 1–29.
IISD (2007-2009). Earth negotiation bulletin. http://www.iisd.ca/vol12.
Jensen, T. and T. Winzen (2012). Legislative negotiations in the european parliament.European Union Politics 13 (1), 118–149.
Jervis, R. (1978). Cooperation under the security dilemma. World politics 30 (2), 167–214.
Jones, P. (2007). Colluding victims: A public choice analysis of international alliances. PublicChoice 132 (3), 319–332.
Jonsson, C. (1981). Bargaining power: Notes on an elusive concept. Cooperation and Con-flict 16 (4), 249–57.
Jonsson, C., B. Bjurulf, O. Elgstrom, A. Sannerstedt, and M. Stromvik (1998). Negotiationsin networks in the european union. International Negotiation 3 (3), 319–344.
Kaly, U., C. Pratt, and J. Mitchell (2004). The demonstration environmental vulnerabilityindex (EVI) 2004. Technical report, SOPAC Technical Report 384.
Keohane, R. O. (1984). After Hegemony: Cooperation and Discord in the World PoliticalEconomy. Princeton: Princeton Universtiy Press.
Krivitsky, P. N. (under review). Exponential-family random graph models for valued net-works. Arxiv preprint (arXiv:1101.1359), available at http://arxiv.org/pdf/1101.1359.pdf.
Lumsdaine, D. H. (1993). Moral vision in international politics: the foreign aid regime,1949-1989. Princeton: Princeton University Press.
Maliniak, D. and M. Plouffe (2011). A network approach to the formation of diplomatic ties.
Maoz, Z. and B. Russett (1993). Normative and structural causes of democratic peace,1946-1986. American Political Science Review , 624–638.
Morgenthau, H. (1948). Politics Among Nations. The Struggle for Power and Peace. NewYork: Alfred A. Knopf.
Morris, M., M. S. Handcock, and D. R. Hunter (2008). Specification of exponential-familyrandom graph models: Terms and computational aspects. Journal of statistical soft-ware 24 (4), 1–24.
22
Morrow, J. D., R. M. Siverson, and T. E. Tabares (1998). The political determinants ofinternational trade: The major powers, 1907-90. American Political Science Review , 649–661.
Naurin, D. (2008). Choosing partners. coalition-building in the Council of the EU. Paperpresented at the American Political Science Association Annual Meeting, Boston August28-31, and at the ECPRs Fourth Pan-European Conference on EU Politics, Riga, Septem-ber 25-27, 2008.
Neumayer, E. (2002). Do democracies exhibit stronger international environmental commit-ment? A cross-country analysis. Journal of Peace Research 39 (2), 139–164.
Olson, M. (1965). The Logic of Collective Action. Public Goods and the Theory of Groups.Cambridge, London: Harvard University Press.
Ostrom, E. (1990). Governing the commons. The evoluton of institutions for collective action.Cambridge: Cambridge University Press.
Oye, K. A. (1986). Explaining cooperation under anarchy: hypotheses and strategies. WorldPolitics 38 (1), 1–24.
Pevehouse, J. C., T. Nordstrom, and K. Warnke (2004). The correlates of war 2 inter-national governmental organizations data version 2.0. Conflict Management and PeaceScience 21 (2), 101–119. Data available at http://www.correlatesofwar.org/COW2
Robins, G., P. Pattison, Y. Kalish, and D. Lusher (2007). An introduction to exponentialrandom graph (p*) models for social networks. Social networks 29 (2), 173–191.
Robins, G., T. A. Snijders, P. Wang, M. S. Handcock, and P. E. Pattison (2007). Re-cent developments in exponential random graph (p*) models for social networks. Socialnetworks 29 (2), 192–215.
Rubin, J. Z. and W. C. Swap (1994). Small group theory: Forming consensus through groupprocesses. In I. W. Zartman (Ed.), International Multilateral Negotiation: Approaches tothe Management of Complexity, pp. 132–147. San Francisco: Jossey-Bass.
Russett, B., J. R. Oneal, and D. R. Davis (1998). The third leg of the kantian tripodfor peace: International organizations and militarized disputes, 195085. InternationalOrganization 52 (3), 441–467.
Sabatier, P. A. and H. C. Jenkins-Smith (1993). Policy change and learning: An advocacycoalition approach. Boulder, CO: Westview Press.
Schelling, T. C. (1960). The Stategy of Conflict. Cambridge, London: Harvard UniversityPress.
Schelling, T. C. (2002). What makes greenhouse sense? time to rethink the kyoto protocol.Foreign Affairs 81 (3), 2–9.
23
Snijders, T. A., P. E. Pattison, G. L. Robins, and M. S. Handcock (2006). New specificationsfor exponential random graph models. Sociological Methodology 36 (1), 99–153.
Sprinz, D. and T. Vaahtoranta (1994). The interest-based explanation of international envi-ronmental policy. International Organization 48 (1), 77–105.
Stern, N. (2007). The Economics of Climate Change: The Stern Review. Cambridge: Cam-bridge University Press.
Thompson, W. R. and R. M. Tucker (1997). A tale of two democratic peace critiques.Journal of Conflict Resolution 41 (3), 428–454.
UNFCCC (2009). Copenhagen accord.
Waltz, K. N. (1979). Theory of International Politics. New York: Random House.
Wassermann, S. and K. Faust (1994). Social network analysis: Methods and applications.Cambridge, New York: Cambridge University Press.
Weible, C. M. (2005). Beliefs and perceived influence in a natural resource conflict: Anadvocacy coalition approach to policy networks. Political Research Quarterly 58 (3), 461–475.
Weidmann, N. B. and K. S. Gleditsch (2010). Mapping and measuring country shapes. TheR Journal 2 (1), 18–24.
Weiler, F. (2012). Determinants of bargaining success in the climate change negotiations.Climate Policy 12 (5), 552–574.
Wendt, A. (1992). Anarchy is what states make of it: the social construction of powerpolitics. International Organization 46 (2), 391–425.
Zartman, I. W. (1994). Introduction: Twos company and moresa crowd: the complexitiesof multilateral negotiation. In I. W. Zartman (Ed.), International Multilateral Negotia-tions. Approaches to the Management of Complexity, pp. 1–12. San Francisco: Jossey-BassPublishers.
24
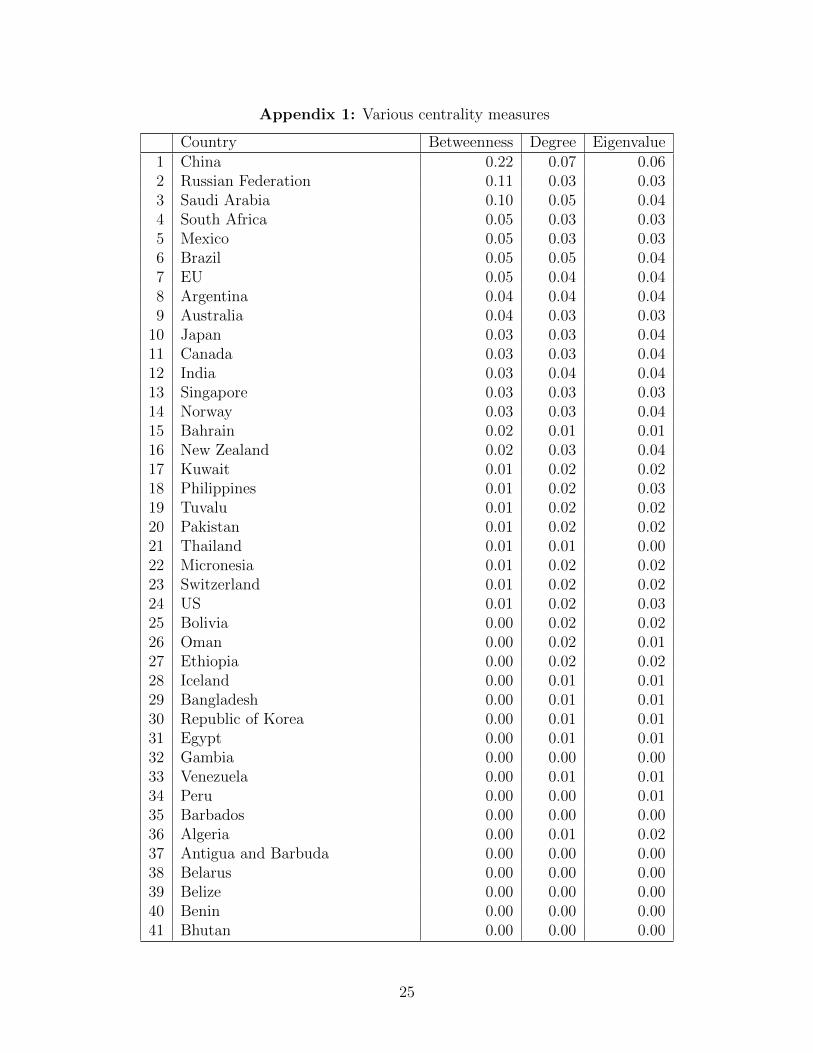
Appendix 1: Various centrality measures
Country Betweenness Degree Eigenvalue1 China 0.22 0.07 0.062 Russian Federation 0.11 0.03 0.033 Saudi Arabia 0.10 0.05 0.044 South Africa 0.05 0.03 0.035 Mexico 0.05 0.03 0.036 Brazil 0.05 0.05 0.047 EU 0.05 0.04 0.048 Argentina 0.04 0.04 0.049 Australia 0.04 0.03 0.03
10 Japan 0.03 0.03 0.0411 Canada 0.03 0.03 0.0412 India 0.03 0.04 0.0413 Singapore 0.03 0.03 0.0314 Norway 0.03 0.03 0.0415 Bahrain 0.02 0.01 0.0116 New Zealand 0.02 0.03 0.0417 Kuwait 0.01 0.02 0.0218 Philippines 0.01 0.02 0.0319 Tuvalu 0.01 0.02 0.0220 Pakistan 0.01 0.02 0.0221 Thailand 0.01 0.01 0.0022 Micronesia 0.01 0.02 0.0223 Switzerland 0.01 0.02 0.0224 US 0.01 0.02 0.0325 Bolivia 0.00 0.02 0.0226 Oman 0.00 0.02 0.0127 Ethiopia 0.00 0.02 0.0228 Iceland 0.00 0.01 0.0129 Bangladesh 0.00 0.01 0.0130 Republic of Korea 0.00 0.01 0.0131 Egypt 0.00 0.01 0.0132 Gambia 0.00 0.00 0.0033 Venezuela 0.00 0.01 0.0134 Peru 0.00 0.00 0.0135 Barbados 0.00 0.00 0.0036 Algeria 0.00 0.01 0.0237 Antigua and Barbuda 0.00 0.00 0.0038 Belarus 0.00 0.00 0.0039 Belize 0.00 0.00 0.0040 Benin 0.00 0.00 0.0041 Bhutan 0.00 0.00 0.00
25
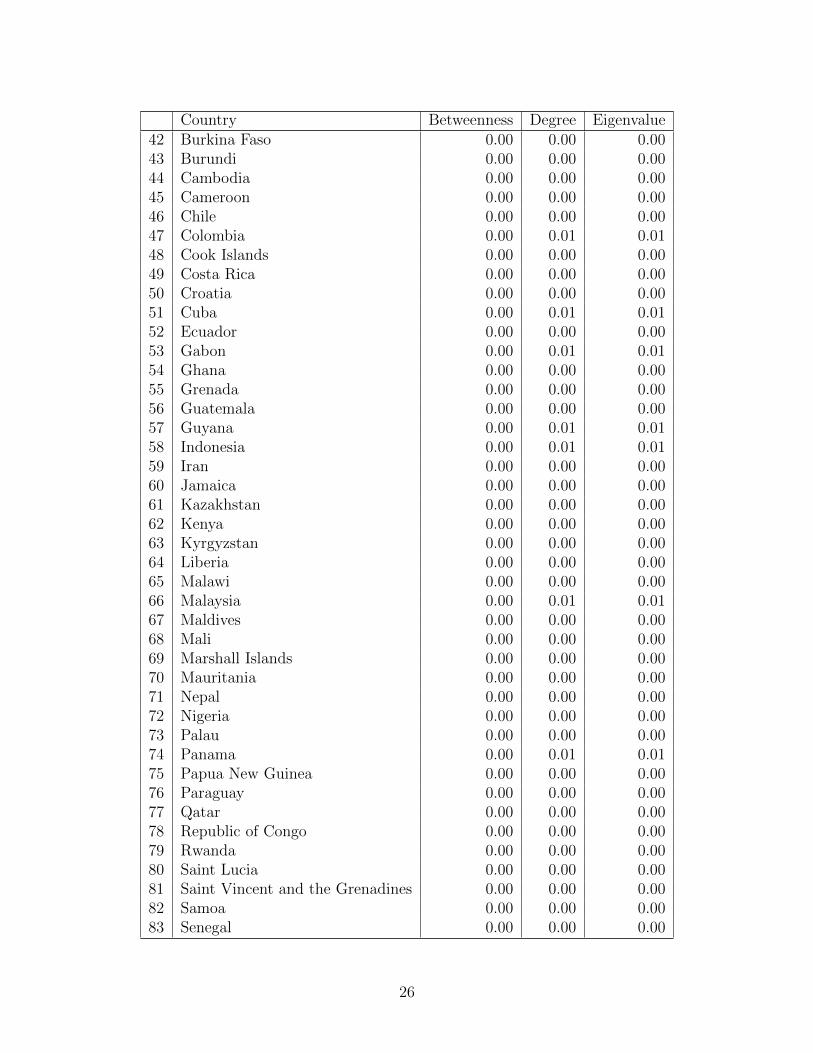
Country Betweenness Degree Eigenvalue42 Burkina Faso 0.00 0.00 0.0043 Burundi 0.00 0.00 0.0044 Cambodia 0.00 0.00 0.0045 Cameroon 0.00 0.00 0.0046 Chile 0.00 0.00 0.0047 Colombia 0.00 0.01 0.0148 Cook Islands 0.00 0.00 0.0049 Costa Rica 0.00 0.00 0.0050 Croatia 0.00 0.00 0.0051 Cuba 0.00 0.01 0.0152 Ecuador 0.00 0.00 0.0053 Gabon 0.00 0.01 0.0154 Ghana 0.00 0.00 0.0055 Grenada 0.00 0.00 0.0056 Guatemala 0.00 0.00 0.0057 Guyana 0.00 0.01 0.0158 Indonesia 0.00 0.01 0.0159 Iran 0.00 0.00 0.0060 Jamaica 0.00 0.00 0.0061 Kazakhstan 0.00 0.00 0.0062 Kenya 0.00 0.00 0.0063 Kyrgyzstan 0.00 0.00 0.0064 Liberia 0.00 0.00 0.0065 Malawi 0.00 0.00 0.0066 Malaysia 0.00 0.01 0.0167 Maldives 0.00 0.00 0.0068 Mali 0.00 0.00 0.0069 Marshall Islands 0.00 0.00 0.0070 Mauritania 0.00 0.00 0.0071 Nepal 0.00 0.00 0.0072 Nigeria 0.00 0.00 0.0073 Palau 0.00 0.00 0.0074 Panama 0.00 0.01 0.0175 Papua New Guinea 0.00 0.00 0.0076 Paraguay 0.00 0.00 0.0077 Qatar 0.00 0.00 0.0078 Republic of Congo 0.00 0.00 0.0079 Rwanda 0.00 0.00 0.0080 Saint Lucia 0.00 0.00 0.0081 Saint Vincent and the Grenadines 0.00 0.00 0.0082 Samoa 0.00 0.00 0.0083 Senegal 0.00 0.00 0.00
26
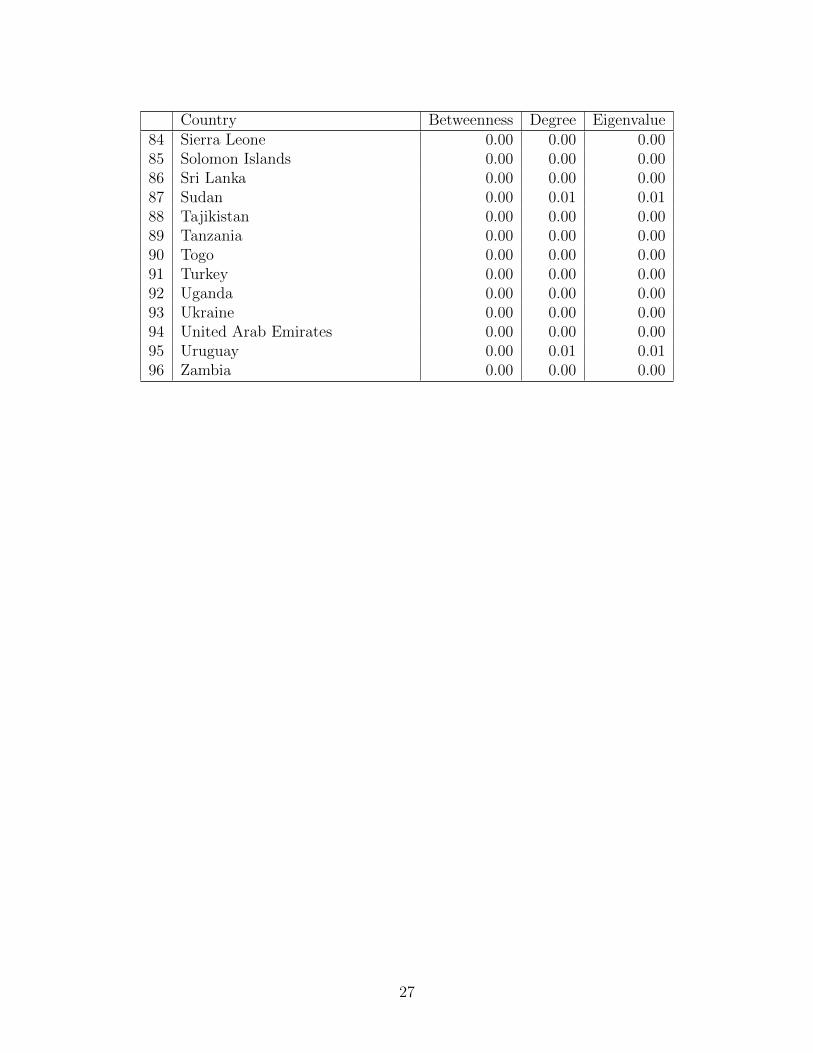
Country Betweenness Degree Eigenvalue84 Sierra Leone 0.00 0.00 0.0085 Solomon Islands 0.00 0.00 0.0086 Sri Lanka 0.00 0.00 0.0087 Sudan 0.00 0.01 0.0188 Tajikistan 0.00 0.00 0.0089 Tanzania 0.00 0.00 0.0090 Togo 0.00 0.00 0.0091 Turkey 0.00 0.00 0.0092 Uganda 0.00 0.00 0.0093 Ukraine 0.00 0.00 0.0094 United Arab Emirates 0.00 0.00 0.0095 Uruguay 0.00 0.01 0.0196 Zambia 0.00 0.00 0.00
27