Embed Size (px)
Citation preview

© 2008 International Monetary Fund July 2008 IMF Country Report No. 08/208
[Month, Day], 2001 August 2, 2001 January 29, 2001 [Month, Day], 2001 August 2, 2001
Romania: 2008 Article IV Consultation—Staff Report; Public Information Notice on the Executive Board Discussion; and Statement by the Executive Director for Romania Under Article IV of the IMF’s Articles of Agreement, the IMF holds bilateral discussions with members, usually every year. In the context of the 2008 Article IV consultation with Romania, the following documents have been released and are included in this package: • The staff report for the 2008 Article IV consultation, prepared by a staff team of the IMF,
following discussions that ended on April 22, 2008, with the officials of Romania on economic developments and policies. Based on information available at the time of these discussions, the staff report was completed on June 12, 2008. The views expressed in the staff report are those of the staff team and do not necessarily reflect the views of the Executive Board of the IMF.
• A Public Information Notice (PIN) summarizing the views of the Executive Board as expressed during its June 25, 2008 discussion of the staff report that concluded the Article IV consultation.
• A statement by the Executive Director for Romania.
The document listed below has been or will be separately released.
Selected Issues Paper
The policy of publication of staff reports and other documents allows for the deletion of market-sensitive information.
Copies of this report are available to the public from
International Monetary Fund • Publication Services 700 19th Street, N.W. • Washington, D.C. 20431
Telephone: (202) 623-7430 • Telefax: (202) 623-7201 E-mail: [email protected] • Internet: http://www.imf.org
Price: $18.00 a copy
International Monetary Fund
Washington, D.C.


INTERNATIONAL MONETARY FUND
ROMANIA
Staff Report for the 2008 Article IV Consultation
Prepared by the Staff Representatives for the 2008 Consultation with Romania
Approved by Juha Kähkönen and Matthew Fisher
June 12, 2008
Executive Summary
Background: A capital-inflow-driven absorption boom has underpinned rapid catch-up growth but also fuelled macroeconomic imbalances. In particular, the external current-account deficit has risen to unsustainable levels. And, since mid-2007, headline CPI inflation has surged well above the central bank’s target, in part reflecting the first-round effects of food and energy price shocks. Rapid credit growth has raised risks to financial stability, although the largely foreign-owned banking system remains well-placed to absorb shocks. In this setting, fiscal policy has been highly procyclical and lacked medium-term orientation. Monetary policy, also faced with a depreciating exchange rate since international financial tensions erupted in mid-2007, has tightened its stance. However, and notwithstanding unfavorable global economic headwinds, the economy has yet to show signs of slowing. Staff views: The main short-term challenge is to tighten fiscal policy, putting less of the stabilization burden on the fledgling inflation-targeting framework, while also avoiding the need to shift to a procyclical stance once boom conditions dissipate. Moreover, fiscal policies should be anchored within a more medium-term framework, also to address looming structural bottlenecks to catch-up growth in a forward-looking manner. The quality of credit portfolios needs careful monitoring, and additional preemptive measures to contain financial stability risks are warranted. The authorities’ views: The authorities broadly shared the staff’s diagnosis and policy proposals, but noted that the fiscal deficit had remained well below 3 percent of GDP, while pressing investment needs and political constraints had made it difficult to adopt a less procyclical fiscal stance.
2
Contents Page
Executive Summary. ..................................................................................................................1 I. Overview............................................................................................................................4 II. Background ........................................................................................................................5 A. Real and Nominal Convergence ................................................................................5 B. External and Internal Balance ....................................................................................5 C. Financial Stability ....................................................................................................10 D. Policy Developments ...............................................................................................16 III. Policy Discussions ...........................................................................................................19 A. Outlook.....................................................................................................................21 B. Fiscal Policy .............................................................................................................23 C. Monetary Policy .......................................................................................................26 D. Financial Sector Policies ..........................................................................................26 IV. Staff Appraisal .................................................................................................................27 Boxes 1. Response to IMF Advice ...................................................................................................4 2. Exchange Rate Assessment..............................................................................................11 Figures 1. Real, Nominal, and Financial Convergence ......................................................................6 2. Selected EU Countries: A Regional Perspective on Absorption Booms, 2003–07...........8 3. Capacity Pressures and Inflation Indicators, 2003–08.......................................................9 4. Exchange Rate Developments, 2007–08 .........................................................................13 5. External Balance Sheet Indicators, 2000–07 ...................................................................14 6. Financial Sector Vulnerabilities, 2004–07.......................................................................15 7. Selected Asset Prices, 2007–08 .......................................................................................17 8. Fiscal and Incomes Policy, 2005–07 ...............................................................................18 9. Monetary Policy, 2007–08...............................................................................................20 10. Macroeconomic Prospects Under Different Policies, 2007–13.......................................22 11. Selected EU Countries: Fiscal Policy Responses to Absorption Booms, 2003–07.........25 Tables 1. Selected Economic and Social Indicators, 2005–09 ........................................................30 2. Real GDP Components and Implicit Deflators, 2003–09................................................31 3. Balance of Payments, 2005–13........................................................................................32 4. External Financial Assets and Liabilities, 2005–13.........................................................33

3
5a. Monetary Survey, 2005–09..............................................................................................34 5b. Balance Sheet of the National Bank, 2005–09 ................................................................35 6. Selected Financial Soundness Indicators, 2003–07 .........................................................36 7a. General Government Operations and Balance Sheet, 2005–13 (in billions of lei)..........37 7b. General Government Operations and Balance Sheet, 2005–13 (in percent of GDP) ......38 8. Rankings of Selected Competitiveness and Structural Indicators ...................................39 9a. Macroeconomic Framework, Baseline, Unchanged Policies Scenario, 2005–13............40 9b. Macroeconomic Framework, Recommended Policies Scenario, 2005–13......................41 Appendices I. Debt Sustainability...........................................................................................................42 II. Fund Relations .................................................................................................................46 III. IMF-World Bank Relations .............................................................................................49 IV. Statistical Issues ...............................................................................................................52

4
I. OVERVIEW
1. Large capital inflows have put Romania on a fast-growth track, but, amid uncoordinated policy responses, macroeconomic imbalances are widening. Propelled by EU accession and massive capital inflows, Romania has enjoyed a stretch of strong economic performance, combining brisk catch-up growth with, until mid-2007, disinflation. But economic tensions have built up. The current-account deficit has surged to unsustainable levels. And, with booming absorption increasingly running up against binding supply constraints, procyclical fiscal policies have clashed with the National Bank of Romania’s (NBR) inflation-targeting framework (Box 1). Nominal exchange rate volatility and large adverse shocks to food and energy prices have further complicated inflation control.
Box 1. Romania’s Response to IMF Advice
With capital inflows surging, the Fund advised that automatic fiscal stabilizers should be allowed to operate, while public wage and employment policies should avoid aggravating private-sector labor shortages. The government, however, argued that fiscal policies foremost need to boost the economy’s supply capacity, including by increasing investment spending, and that fiscal procyclicality may well be a price worth paying for this. There has been broad agreement on the appropriate monetary framework and policy requirements.
2. Romania’s fragmented politics is integral to concerns about economic prospects. The minority government controls little more than twenty percent of parliamentary seats and has to rely on ad hoc coalitions to adopt key legislation. With parliamentary elections due in late-2008 or early-2009, proactive policy making, particularly as regards politically-difficult structural reforms, is largely on hold. However, new election rules, which include raising the voter threshold to 5 percent, could result in future coalition governments with a stronger mandate and purpose.
3. Romania envisages entering the ERM II mechanism in 2012 and adopting the euro in 2014. The authorities hope that this plan will allow time for the capital-inflow-driven macroeconomic imbalances to normalize, while anchoring policies to a clear, ambitious, but achievable euro-adoption calendar.
5
II. BACKGROUND
A. Real and Nominal Convergence
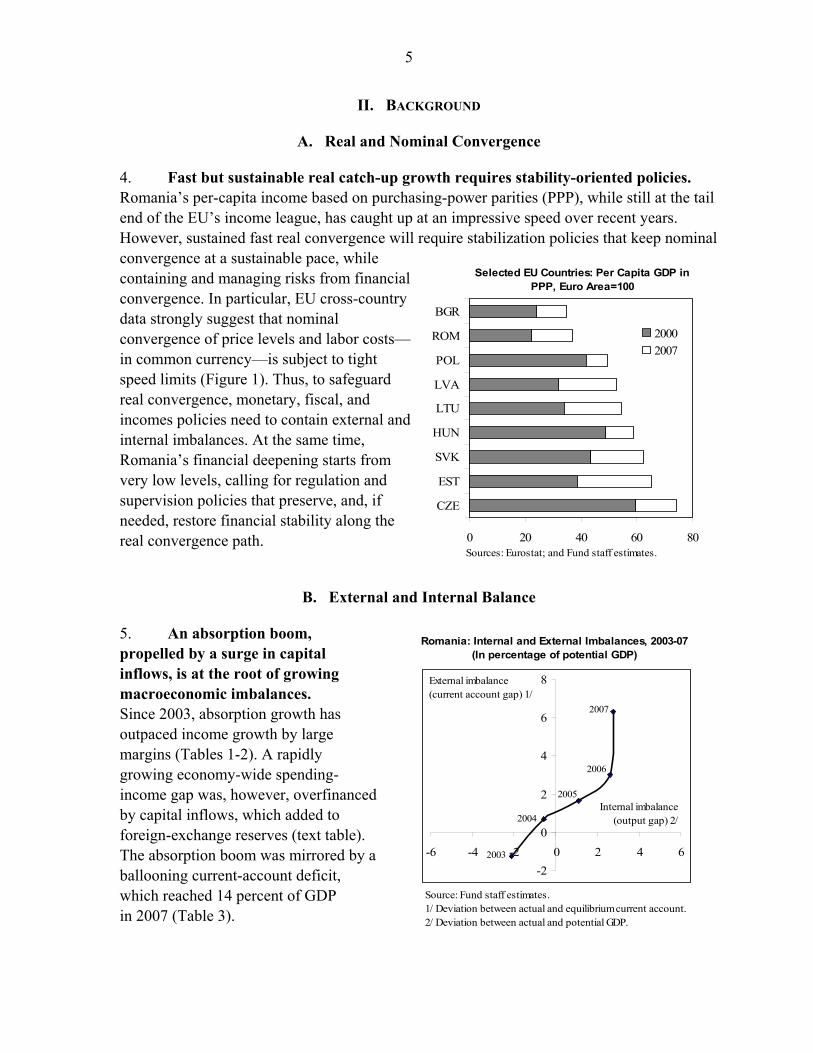
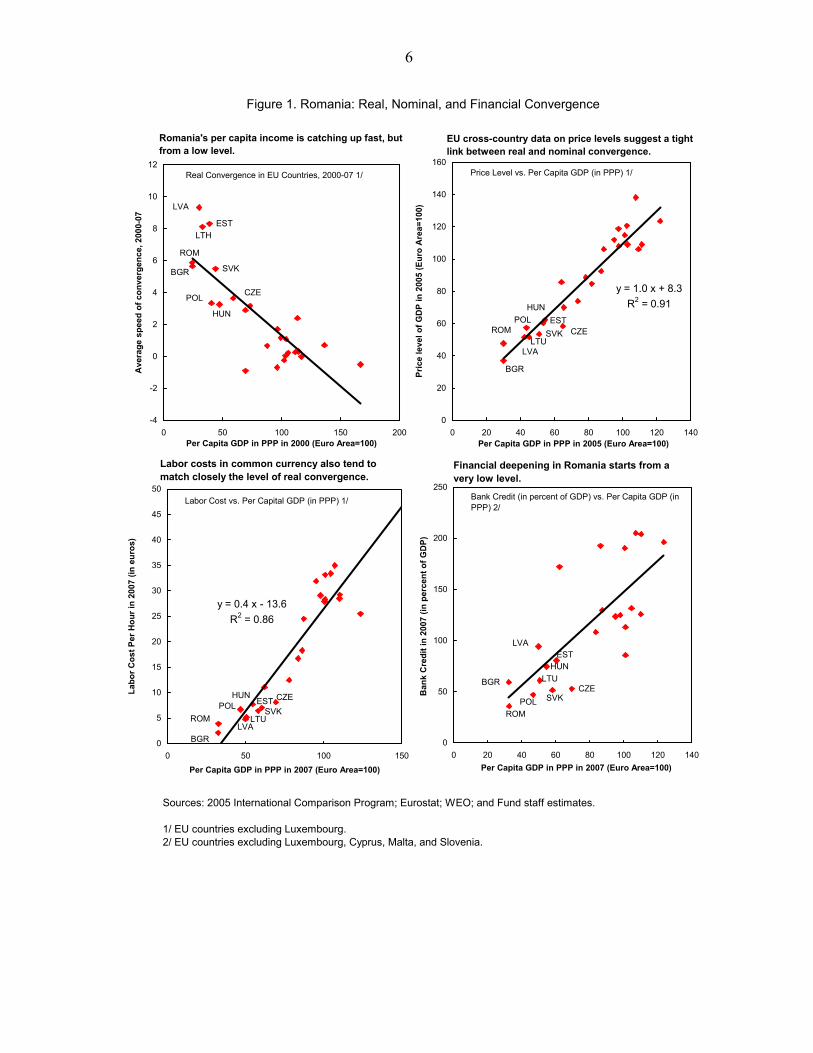
4. Fast but sustainable real catch-up growth requires stability-oriented policies. Romania’s per-capita income based on purchasing-power parities (PPP), while still at the tail end of the EU’s income league, has caught up at an impressive speed over recent years. However, sustained fast real convergence will require stabilization policies that keep nominal convergence at a sustainable pace, while containing and managing risks from financial convergence. In particular, EU cross-country data strongly suggest that nominal convergence of price levels and labor costs—in common currency—is subject to tight speed limits (Figure 1). Thus, to safeguard real convergence, monetary, fiscal, and incomes policies need to contain external and internal imbalances. At the same time, Romania’s financial deepening starts from very low levels, calling for regulation and supervision policies that preserve, and, if needed, restore financial stability along the real convergence path.
B. External and Internal Balance
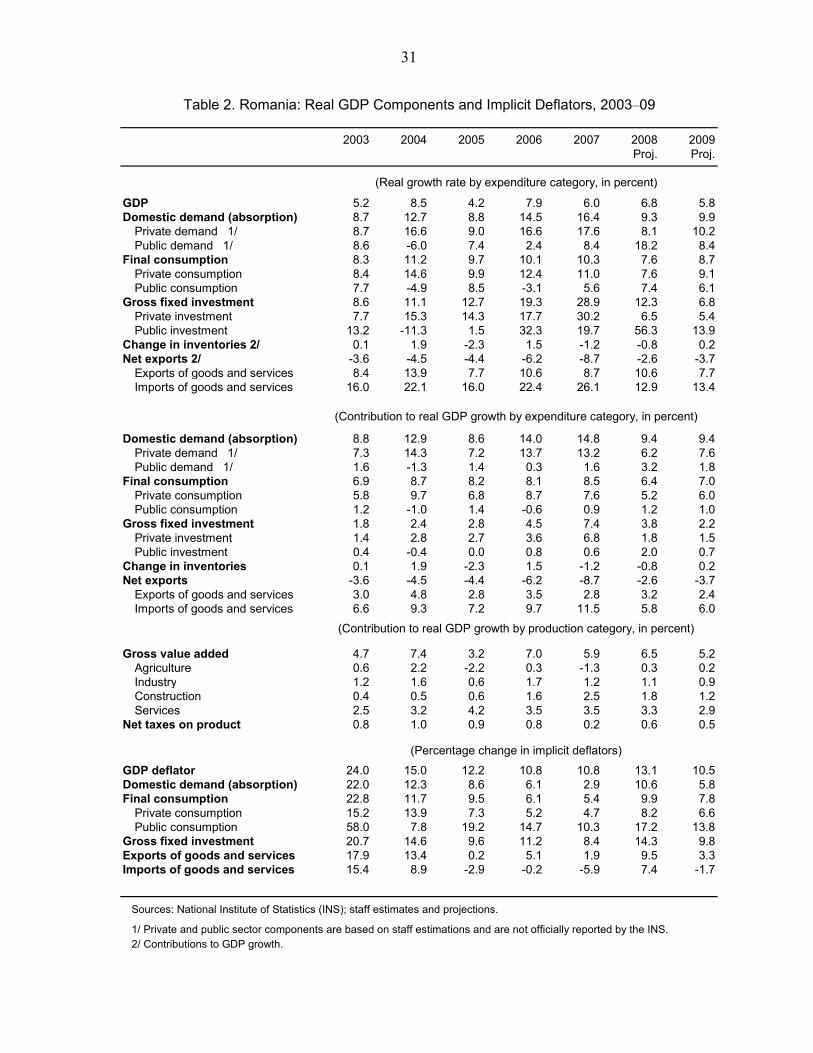
5. An absorption boom, propelled by a surge in capital inflows, is at the root of growing macroeconomic imbalances. Since 2003, absorption growth has outpaced income growth by large margins (Tables 1-2). A rapidly growing economy-wide spending-income gap was, however, overfinanced by capital inflows, which added to foreign-exchange reserves (text table). The absorption boom was mirrored by a ballooning current-account deficit, which reached 14 percent of GDP in 2007 (Table 3).
Sources: Eurostat; and Fund staff estimates.0 20 40 60 80
CZE
EST
SVK
HUN
LTU
LVA
POL
ROM
BGR
20002007
Selected EU Countries: Per Capita GDP in PPP, Euro Area=100
Romania: Internal and External Imbalances, 2003-07(In percentage of potential GDP)
2003
2004
2005
2006
2007
-2
0
2
4
6
8
-6 -4 -2 0 2 4 6
Internal imbalance(output gap) 2/
External imbalance(current account gap) 1/
Source: Fund staff estimates. 1/ Deviation between actual and equilibrium current account.2/ Deviation between actual and potential GDP.
6
Figure 1. Romania: Real, Nominal, and Financial Convergence
Sources: 2005 International Comparison Program; Eurostat; WEO; and Fund staff estimates.
1/ EU countries excluding Luxembourg.2/ EU countries excluding Luxembourg, Cyprus, Malta, and Slovenia.
Real Convergence in EU Countries, 2000-07 1/
BGR
CZE
EST
HUN
LVA
LTH
POL
ROM
SVK
-4
-2
0
2
4
6
8
10
12
0 50 100 150 200Per Capita GDP in PPP in 2000 (Euro Area=100)
Ave
rage
spe
ed o
f con
verg
ence
, 200
0-07
Romania's per capita income is catching up fast, but from a low level.
Labor Cost vs. Per Capital GDP (in PPP) 1/
SVKROM
POLLTU
LVA
HUNEST CZE
BGR
y = 0.4 x - 13.6R2 = 0.86
0
5
10
15
20
25
30
35
40
45
50
0 50 100 150Per Capita GDP in PPP in 2007 (Euro Area=100)
Labo
r Cos
t Per
Hou
r in
2007
(in
euro
s)
Labor costs in common currency also tend to match closely the level of real convergence.
Bank Credit (in percent of GDP) vs. Per Capita GDP (in PPP) 2/
BGRCZE
ESTHUN
LVA
LTU
POLROM
SVK
0
50
100
150
200
250
0 20 40 60 80 100 120 140Per Capita GDP in PPP in 2007 (Euro Area=100)
Ban
k C
redi
t in
2007
(in
perc
ent o
f GD
P)
Financial deepening in Romania starts from a very low level.
Price Level vs. Per Capita GDP (in PPP) 1/
BGR
CZEEST
HUN
LVALTU
POLROM SVK
y = 1.0 x + 8.3R2 = 0.91
0
20
40
60
80
100
120
140
160
0 20 40 60 80 100 120 140Per Capita GDP in PPP in 2005 (Euro Area=100)
Pric
e le
vel o
f GD
P in
200
5 (E
uro
Are
a=10
0)
EU cross-country data on price levels suggest a tight link between real and nominal convergence.

7
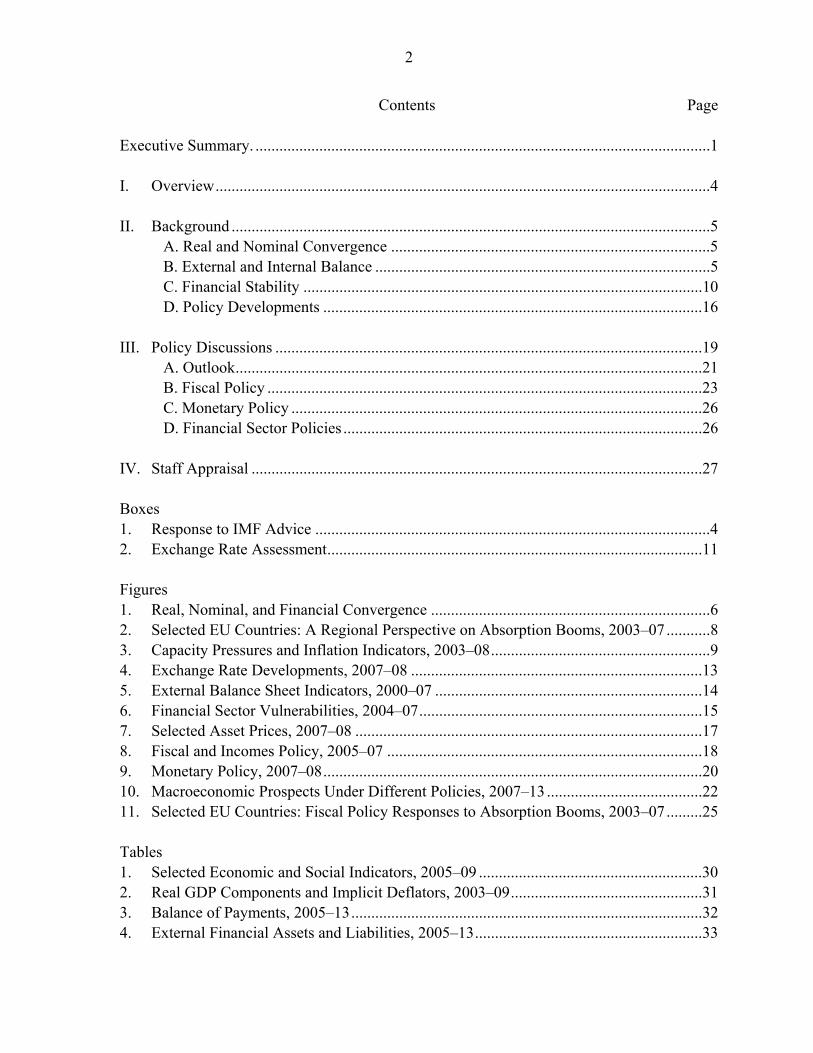
6. As elsewhere in the region, private investment was the absorption boom’s main driver (Figure 2). Capital inflows were facilitated by capital account liberalization and high global risk appetite. But, with EU accession prospects secure, capital flows, particularly foreign direct investment (FDI), were also attracted by perceptions of lower investment risk, triggering a re-assessment of Romania as an investment location. Skyrocketing asset prices, easy capital gains, and rising collateral values added self-reinforcing momentum to the absorption boom. As in other countries, Romania’s private consumption-GDP ratio remained remarkably stable, suggesting that consumption smoothing was not a principal boom driver.
7. Inflation has re-emerged as a serious worry. Real GDP growth (excluding agricultural production) has been robust, but is increasingly running up against capacity bottlenecks (Figure 3). Large-scale emigration, notably to Italy and Spain, and high demand for workers, especially in construction, have resulted in tight labor market conditions. As a result, real wage growth has outpaced productivity growth, with buoyant public-sector wages adding to private-sector wage pressures. With core inflation picking up, headline inflation has surged, partly owing to the first-round effects of shocks to energy and food prices, the latter also reflecting
2003 2004 2005 2006 2007
Absorption (domestic demand) 107.5 109.1 110.2 112.0 114.3Consumption 85.7 85.3 87.5 85.6 84.7Investment 21.8 23.8 22.6 26.5 29.6
= Gross disposable income 1/ 101.7 100.7 101.3 101.7 100.3
+ Net capital inflows 6.7 15.7 15.7 15.7 17.7
+ FX Reserves ( - is accumulation) -0.9 -7.3 -6.8 -5.3 -3.7
1/ GDP plus net factor income and transfer balance from abroad. Sources: Romanian authorities; and Fund staff estimates and projections.
Romania: Absorption, Income, and Capital Flows, 2003-07(In percent of GDP)
Inflation expectations seem to have risen along with actual inflation.
Sources: WEO; Eurostat; and Fund staff estimates.1/ Consumer survey measure of expected price trends over next 12 months.
0
4
8
12
16
2006M1 2006M7 2007M1 2007M7 2008M128
36
44
52
60
68
CPI inflationInflation expectations, RHS 1/
(Percentage change, y-o-y)

8
Figure 2. Selected EU Countries: A Regional Perspective on Absorption Booms, 2003–07
Sources: WEO; IFS; and Fund staff estimates.
Current Account Deficit (in percent of GDP)
0
5
10
15
20
25
30
2003 2007 2003-07Change
Romania
Bulgaria
Estonia
Latvia
Lithuania
Romania's surging current account is not unique in the region ...
Private Consumption (in percent of GDP)
-10
10
30
50
70
90
2003 2007 2003-07Change
Romania
Bulgaria
Estonia
Latvia
Lithuania
Private consumption remained remarkably stable (as a percent of GDP) in most countries ...
Gross Private Investment (in percent of GDP)
0
10
20
30
40
2003 2007 2003-07Change
Romania
Bulgaria
Estonia
Latvia
Lithuania
... while the absorption booms mainly boosted private investment (as a percent of GDP).
Bank Credit (in percent of GDP)
0
20
40
60
80
100
120
2003 2007 2003-07 Change
Romania
Bulgaria Estonia
Latvia Lithuania
… although it was accompanied by a more moderate credit boom.

9
Figure 3. Romania: Capacity Pressures and Inflation Indicators, 2003–08
Sources: WEO; Eurostat; and Fund staff estimates and projections.
-4
-2
0
2
4
6
8
10
12
2003 2004 2005 2006 200766
68
70
72
74
76
78
80
82
… and there are increasing pressures on productive capacities.
Output gap (excluding agricultural fluctuations)
(In percent)
Industry capacity utilization, RHS
0
4
8
12
16
2006M1 2006M7 2007M1 2007M7 2008M1
CPIPPI
… while producer price inflation has surged well above consumer price inflation.
(Percentage change, y-o-y)
7000
7500
8000
8500
9000
9500
10000
2003 2004 2005 2006 20070
2
4
6
8
Labor market conditions have tightened ...
Employment,thousands
Unemployment,thousands
Unemployment rate, RHS
Labor force,thousands
0
4
8
12
16
2006M1 2006M7 2007M1 2007M7 2008M1
CPI
HIPC excl. energy, food, alcohol and tobacco
Capacity constraints and rising labor costs have begun to feed into core inflation ...
(Percentage change, y-o-y)
-20
0
20
40
60
80
100
2006M1 2006M7 2007M1 2007M7 2008M1
Public realwage growth(CPI-deflated)Private realwage growth(CPI-deflated)
Strong public-sector wage growth has added to private-sector wage-push inflation ...
(Percentage change, y-o-y)
0
4
8
12
16
20
2006M2 2006M8 2007M2 2007M8 2008M2
Industry real wage growthIndustry labor productivity growth
… and real wage growth in industry is outpacing productivity growth.
(Percentage change, y-o-y)

10
the 2007 drought. Price setters, faced with higher unit labor and other input costs, have been trying to maintain their markups, as also indicated by surging producer-price inflation.1 Available sketchy survey data suggest that inflation expectations may be creeping upward.
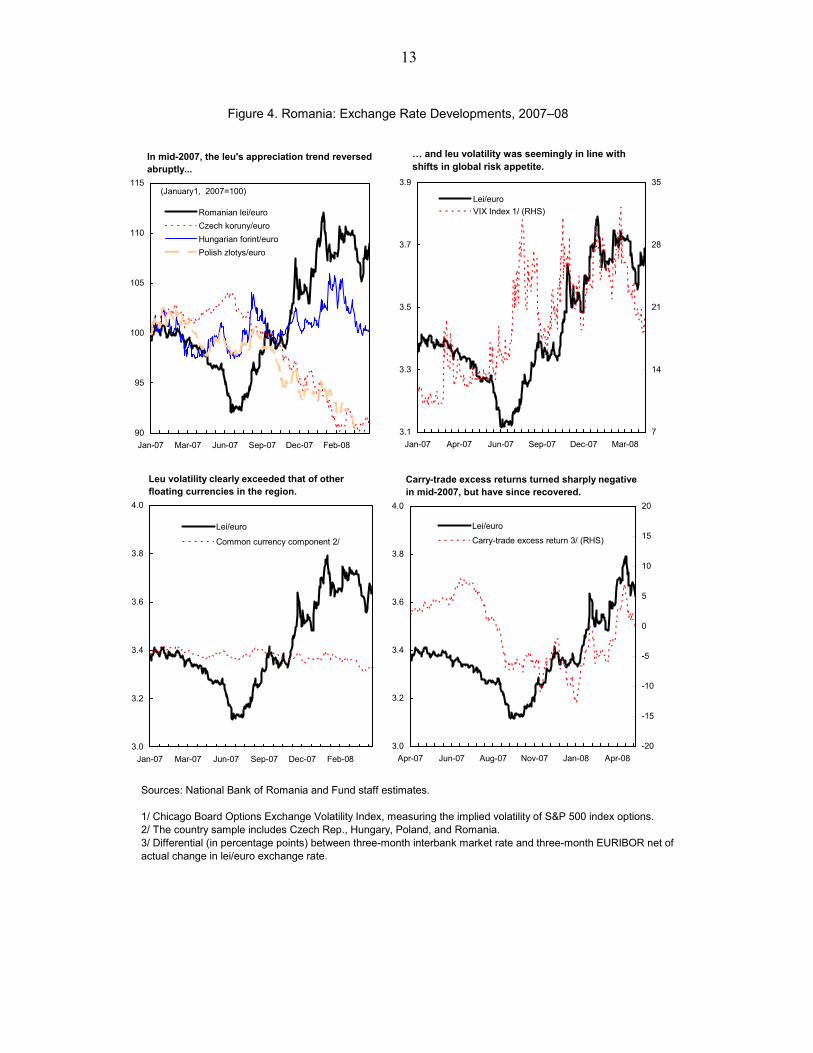
8. The exchange rate has been on a rollercoaster, but, at present levels, does not raise significant external stability concerns. Following the shift to an inflation-targeting regime in August 2005, Romania adopted a managed float with no predetermined path. During the first half of 2007, the leu appreciated sharply against the euro, outperforming other regional floating currencies (Figure 4). However, with global risk appetite tanking in mid-2007, the leu abruptly reversed course, depreciating by over 15 percent. Estimates of the leu’s common region-wide and country-specific components indicate that most of this recent volatility was specific to Romania. While the external deficit exceeds sustainable levels, there is no strong evidence that real effective exchange rate levels are significantly out of line with fundamentals, although some margin of overvaluation can not be ruled out (Box 2).
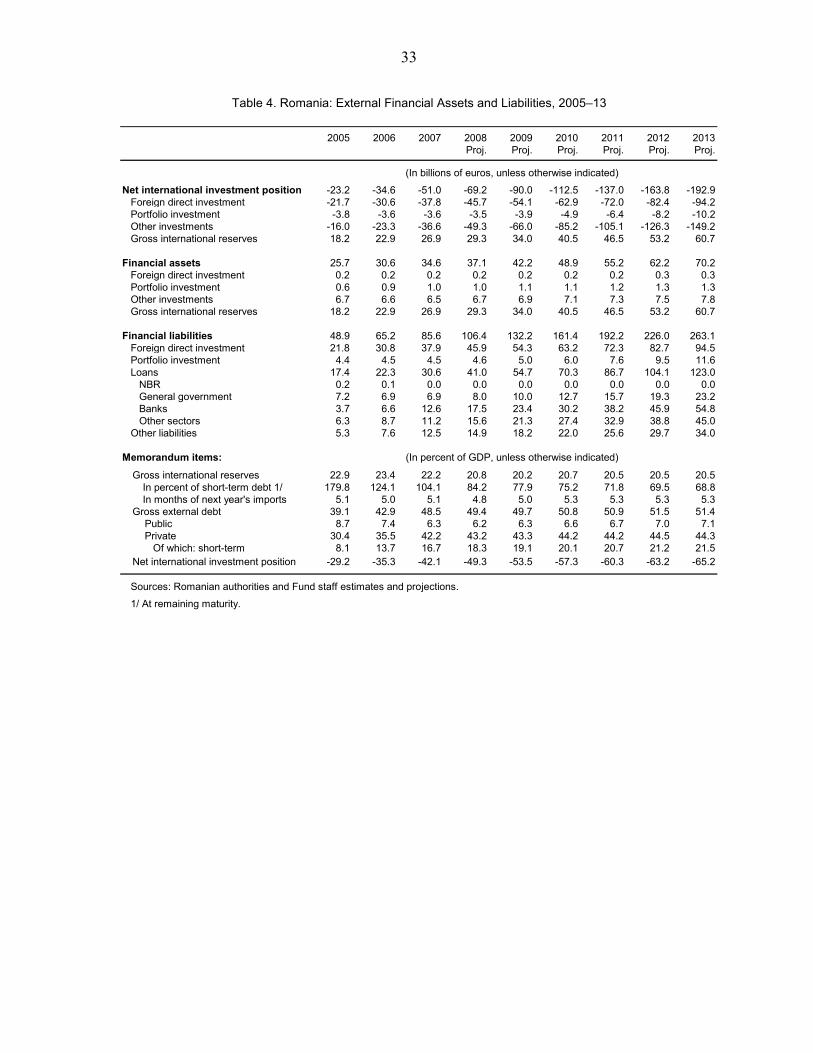
9. Romania’s external net exposure remains contained, but rising short-term debt has raised external stability risks. Although it has deteriorated sharply, the net IIP compares favorably with that in other regional economies (Figure 5, Table 4). However, a significant increase of debt at shorter maturities has raised the risk of abrupt shifts in capital flows, although foreign-exchange reserve coverage of short-term debt remains satisfactory.
C. Financial Stability
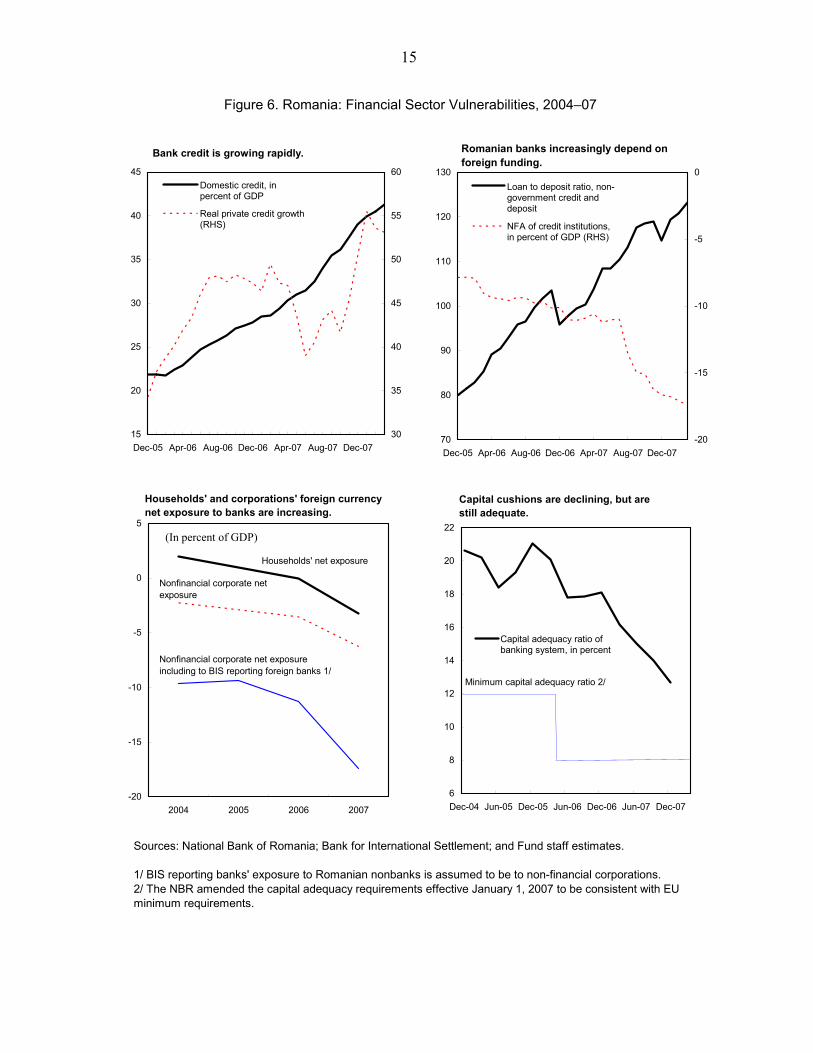
10. Direct and indirect credit risks are rising, and the banking system is increasingly dependent on foreign funding. Real private credit expanded by some 50 percent in 2007, and has increasingly been funded by foreign borrowing, mainly through parent banks, rather than domestic deposits (Figure 6, Table 5). Particularly strong growth in domestic foreign-currency credit—including a surge in Swiss-franc denominated credits from a low base—and heavy direct foreign borrowing abroad have increased currency mismatches in corporate and household balance sheets. While financial soundness indicators for the largely foreign-owned 1 See Selected Issues Chapter II “Wage-Price Setting in Romania and Other New EU Member States.”
Actual and equilibrium real effective exchange rate(2000=100)
70
80
90
100
110
120
130
140
150
2000 2001 2002 2003 2004 2005 2006 2007
Actual rateEquilibrium rate
Estimates of the equilibrium real exchange rate point to a small margin of overvaluation in 2007. 1/
Source: Fund staff estimates.1/ For details, see Selected Issues Chapter I, "Romania External Stability Risks."
11
Box 2. Romania: Exchange Rate Assessment1/
Overall, staff’s various approaches do not point to strong evidence of a significantly overvalued real exchange rate at present that could result in future external instability.
As a general caveat, it is difficult to pinpoint the equilibrium real exchange rate or the equilibrium current account for an EU convergence economy like Romania because the economy has generally operated in out-of-equilibrium mode, starting convergence from significantly undervalued real exchange rate levels.
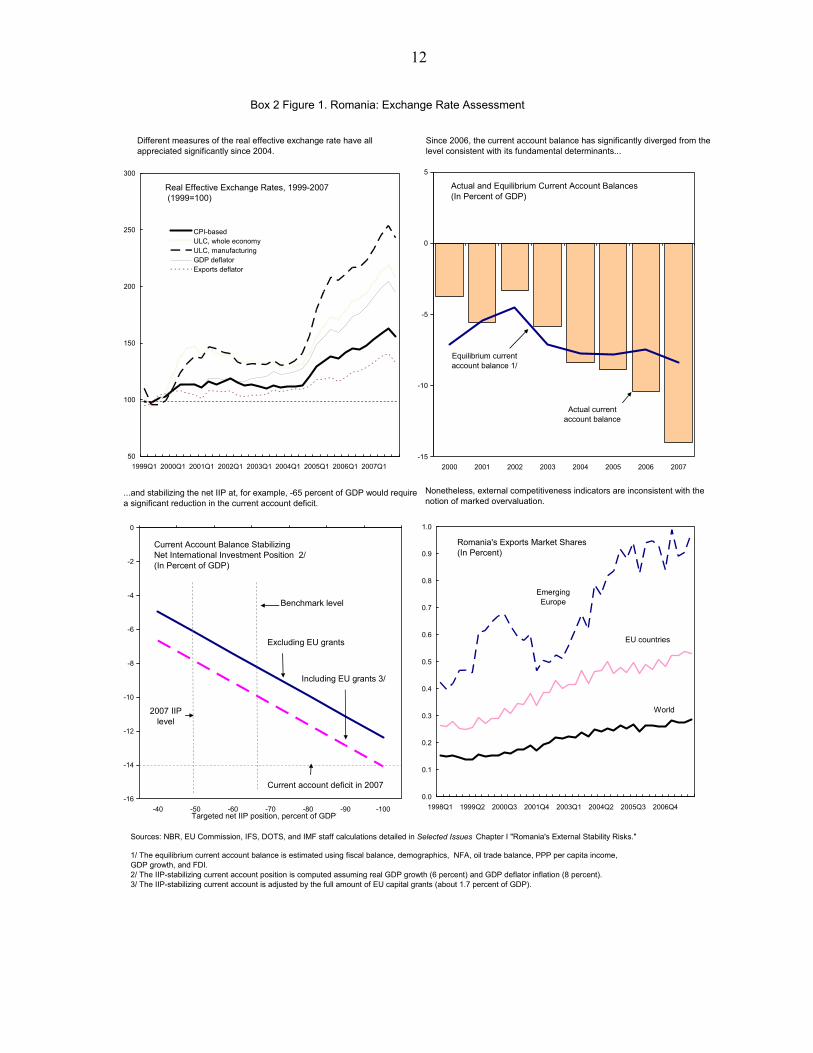
This said, the macroeconomic-balance approach suggests that Romania’s current-account deficit norm, taking account of about 1½ percent of GDP capital transfers, is 10¼ percent of GDP, but with considerable margins of uncertainty (Box Figure). This compares with an estimate of the underlying current-account deficit of 12½ percent, taking account of Romania’s output gap as the only temporary factor. The difference between norm and underlying current-account deficit indicate an overvaluation margin of about 11 percent.
The external-sustainability approach also points to a sustainable external deficit norm of about 10 percent of GDP, assuming Romania’s negative net international investment position (IIP) will stabilize at some 65 percent of GDP, consistent with a 13 percent overvaluation margin.
However, the equilibrium real-exchange-rate approach based on panel data suggests real exchange rate overvaluation of only about 7 percent in 2007. Reflecting the sharp nominal depreciation since mid-2007, the level of the real exchange rate in March 2008 was already some 4 percent lower than the 2007-average, indicating that any remaining margin of overvaluation would likely be small.
Turning to external price and cost competitiveness indicators, Romania’s export market shares have steadily increased for all major export destinations. While nominal unit labor costs (ULC) in manufacturing have risen particularly sharply, profitability remains intact, and Romania’s euro-denominated wages are still among the lowest in the EU; foreign-investor interest in re-locating production to Romania remains also strong.
1/ For details, see Selected Issues Chapter I “Romania’s External Stability Risks.”
12
Box 2 Figure 1. Romania: Exchange Rate Assessment
Sources: NBR, EU Commission, IFS, DOTS, and IMF staff calculations detailed in Selected Issues Chapter I "Romania's External Stability Risks."
Real Effective Exchange Rates, 1999-2007 (1999=100)
50
100
150
200
250
300
1999Q1 2000Q1 2001Q1 2002Q1 2003Q1 2004Q1 2005Q1 2006Q1 2007Q1
CPI-basedULC, whole economyULC, manufacturingGDP deflatorExports deflator
Actual and Equilibrium Current Account Balances (In Percent of GDP)
-15
-10
-5
0
5
2000 2001 2002 2003 2004 2005 2006 2007
Actual current account balance
Equilibrium current account balance 1/
Different measures of the real effective exchange rate have all appreciated significantly since 2004.
Since 2006, the current account balance has significantly diverged from the level consistent with its fundamental determinants...
Current Account Balance Stabilizing Net International Investment Position 2/(In Percent of GDP)
-16
-14
-12
-10
-8
-6
-4
-2
0
-40 -50 -60 -70 -80 -90 -100Targeted net IIP position, percent of GDP
Current account deficit in 2007
Benchmark level
2007 IIP level
Excluding EU grants
Including EU grants 3/
...and stabilizing the net IIP at, for example, -65 percent of GDP would require a significant reduction in the current account deficit.
1/ The equilibrium current account balance is estimated using fiscal balance, demographics, NFA, oil trade balance, PPP per capita income, GDP growth, and FDI.2/ The IIP-stabilizing current account position is computed assuming real GDP growth (6 percent) and GDP deflator inflation (8 percent).3/ The IIP-stabilizing current account is adjusted by the full amount of EU capital grants (about 1.7 percent of GDP).
Romania's Exports Market Shares(In Percent)
World
EU countries
Emerging Europe
0.0
0.1
0.2
0.3
0.4
0.5
0.6
0.7
0.8
0.9
1.0
1998Q1 1999Q2 2000Q3 2001Q4 2003Q1 2004Q2 2005Q3 2006Q4
Nonetheless, external competitiveness indicators are inconsistent with the notion of marked overvaluation.
13
Figure 4. Romania: Exchange Rate Developments, 2007–08
Sources: National Bank of Romania and Fund staff estimates.
1/ Chicago Board Options Exchange Volatility Index, measuring the implied volatility of S&P 500 index options.2/ The country sample includes Czech Rep., Hungary, Poland, and Romania.3/ Differential (in percentage points) between three-month interbank market rate and three-month EURIBOR net of actual change in lei/euro exchange rate.
90
95
100
105
110
115
Jan-07 Mar-07 Jun-07 Sep-07 Dec-07 Feb-08
Romanian lei/euroCzech koruny/euroHungarian forint/euroPolish zlotys/euro
In mid-2007, the leu's appreciation trend reversed abruptly...
(January1, 2007=100)
3.0
3.2
3.4
3.6
3.8
4.0
Apr-07 Jun-07 Aug-07 Nov-07 Jan-08 Apr-08-20
-15
-10
-5
0
5
10
15
20
Lei/euro
Carry-trade excess return 3/ (RHS)
Carry-trade excess returns turned sharply negative in mid-2007, but have since recovered.
3.1
3.3
3.5
3.7
3.9
Jan-07 Apr-07 Jun-07 Sep-07 Dec-07 Mar-087
14
21
28
35
Lei/euroVIX Index 1/ (RHS)
… and leu volatility was seemingly in line with shifts in global risk appetite.
3.0
3.2
3.4
3.6
3.8
4.0
Jan-07 Mar-07 Jun-07 Sep-07 Dec-07 Feb-08
Lei/euro
Common currency component 2/
Leu volatility clearly exceeded that of other floating currencies in the region.

14
Figure 5. Romania: External Balance Sheet Indicators, 2000–07
Sources: National Bank of Romania; IFS; and Fund staff calculations.
External debt(percent of GDP)
19 20 19 18 1714
119
911 12 12 14
1718 23
22 3 4
58 14
17
0
10
20
30
40
50
60
2000 2001 2002 2003 2004 2005 2006 2007
Short-term private debtMedium and long-term private debtMedium and long-term public debt
Net International Investment Position(percent of GDP)
-140
-120
-100
-80
-60
-40
-20
0
20
CRO HUN LAT EST LIT POL BGR ROM CZE
2000 2007
...but the structure of private external debt has shifted to shorter-term maturities.
Romania's net external balance position remains relatively strong...
15
Figure 6. Romania: Financial Sector Vulnerabilities, 2004–07
Sources: National Bank of Romania; Bank for International Settlement; and Fund staff estimates.
1/ BIS reporting banks' exposure to Romanian nonbanks is assumed to be to non-financial corporations.2/ The NBR amended the capital adequacy requirements effective January 1, 2007 to be consistent with EU minimum requirements.
15
20
25
30
35
40
45
Dec-05 Apr-06 Aug-06 Dec-06 Apr-07 Aug-07 Dec-0730
35
40
45
50
55
60Domestic credit, inpercent of GDP
Real private credit growth(RHS)
Bank credit is growing rapidly.
70
80
90
100
110
120
130
Dec-05 Apr-06 Aug-06 Dec-06 Apr-07 Aug-07 Dec-07-20
-15
-10
-5
0Loan to deposit ratio, non-government credit anddeposit
NFA of credit institutions,in percent of GDP (RHS)
Romanian banks increasingly depend on foreign funding.
-20
-15
-10
-5
0
5
2004 2005 2006 2007
Households' and corporations' foreign currency net exposure to banks are increasing.
Households' net exposure
Nonfinancial corporate net exposure
Nonfinancial corporate net exposure including to BIS reporting foreign banks 1/
(In percent of GDP)
6
8
10
12
14
16
18
20
22
Dec-04 Jun-05 Dec-05 Jun-06 Dec-06 Jun-07 Dec-07
Capital adequacy ratio ofbanking system, in percent
Minimum capital adequacy ratio 2/
Capital cushions are declining, but are still adequate.

16
banking sector as a whole look still relatively solid, capital buffers have declined and non-performing loans have increased, amid strong competition among banks to gain market share (Table 6). 11. Romania is vulnerable to adverse spillovers from global financial tensions. In line with the growing external deficit and short-term debt, gross external financing requirements soared to about 28 percent of GDP in 2007 (Table 3). Financial markets have reacted with palpable concern: in addition to the recent sharp leu depreciation, a substantial correction took place in the stock market, and sovereign-bond spreads and credit-default swap rates widened substantially (Figure 7). Two rating agencies have downgraded Romania’s outlook to negative.
D. Policy Developments
12. The fiscal policy stance in 2007 was highly procyclical (Figure 8). The cash-based fiscal deficit increased to 2¼ percent of GDP, up from ½ percent of GDP in 2006 (Table 7). Adjusted for the automatic effects of the booming economy on the fiscal position, the mission estimates that the 2007 structural deficit rose to almost 4 percent of GDP. As a result, the fiscal stance was highly expansionary, adding an estimated net fiscal stimulus of 2 percent of GDP to an already overheating economy. However, the general government balance sheet is strong: end-2007 gross public debt, excluding public guarantees, amounted to only 12 percent of GDP, and net financial worth was positive.
2004 2005 2006 2007 2007Budget Est.
Revenue 30.0 30.2 31.0 35.1 31.4Expenditure 31.1 31.0 31.6 37.5 33.7Fiscal balance (cash basis) -1.0 -0.8 -0.6 -2.4 -2.3Structural fiscal balance 1/ -0.9 -1.3 -1.8 ... -3.9
Sources: Ministry of Finance; and Fund staff estimates and projections.
1/ Actual fiscal balance adjusted for the automatic effects of both output gap and absorption gap on fiscal position. See IMF Country Report No. 07/390, Chapter III for details.
Romania: General Government Operations, 2004–07(In percent of GDP)
13. Fiscal policy management remained short-term oriented.2 The originally approved 2007 budget was revised four times, leaving little time or resources for more medium-term budget planning. The traditional end-year spending surge could not be contained, despite control efforts by the Ministry of Finance. Moreover, in its first accession year, Romania had limited success in tapping EU grants, indicating weak capital-budget
2 For details, see Selected Issues Chapter III “Retooling Romania’s Budget Culture.”

17
Figure 7. Romania: Selected Asset Prices, 2007–08
Sources: National Bank of Romania; Bulgaria National Bank; and Bloomberg.
70
80
90
100
110
120
Jan-07 Apr-07 Jul-07 Oct-07 Jan-08 Apr-08
Erste Bank/Vienna index
Raiffeisen/Vienna index
Unicredito/Milan index
Index (1/2/2007=100)
… and share prices of selected Romanian banks' parents have been volatile.
80
100
120
140
160
180
Jan-07 Apr-07 Jul-07 Oct-07 Jan-08 Apr-08
RomaniaBulgariaHungaryPoland
Southeastern European Countries(Jan 1, 2007=100)
Romania's stock market has slumped ...
0
40
80
120
160
Jan-07 Apr-07 Jul-07 Oct-07 Jan-08 Apr-08
EMBI Romania EuroEMBI Bulgaria EuroEMBI Hungary EuroEMBI Poland Euro
… while sovereign bond spreads have widened.
(Basis points)
0
40
80
120
160
200
240
Jan-07 Apr-07 Jul-07 Oct-07 Jan-08 Apr-08
RomaniaBulgariaHungaryPoland
Credit default swaps (CDS) on 5-year sovereign bonds (Basis points)
Romania's credit default swap rates have also increased significantly ...

18
Figure 8. Romania: Fiscal and Incomes Policy, 2005–07
Sources: WEO; and Fund staff estimates.
Gross Wage (2003=100)
100
120
140
160
180
200
220
2005 2006 2007
Economy widePublic administrationEducationHealth
A loose public-sector wage policy ...
Employment (2004=100)
100
105
110
115
120
125
130
135
140
2005 2006 2007
Economy widePublic administrationEducationHealth
... was accompanied by higher government employment.
(In percent of GDP)
0
2
4
6
2005 2006 2007
Grants (budget) Grants (actual)Capital (budget) Capital (actual)
Capital budget implementation has been weak.
Monthly Fiscal Balance (In percent of annual GDP)
-2.5
-2
-1.5
-1
-0.5
0
0.5
1
1.5
Jan-07 Mar-07 May-07 Jul-07 Sep-07 Nov-07
Despite a tight fiscal stance maintained until October, ...
Monthly Expenditure, 2007 (in percent of total)
0
5
10
15
20
Jan-07 Mar-07 May-07 Jul-07 Sep-07 Nov-07
… an end-year splurge in expenditures ...
(In percent of GDP)
-5
-4
-3
-2
-1
0
1
2005 2006 2007
Fiscal balance
Structural balance
... led to a procyclical fiscal stance in 2007.
19
planning and implementation capacities. Finally, in mid-2007, a proposal to hike pensions in two steps during 2008–09 passed unanimously on a fast-track basis, although there was little clarity on the financing of the second-stage hike or the implications for the medium-term financial integrity of public pensions.
14. Monetary policy responded proactively to the fluid macroeconomic environment. During the first half of 2007, the NBR reacted to the sharply appreciating currency and declining inflation with policy-rate easing. While booming domestic demand and growing capacity pressures raised some questions about the wisdom of this easing course, the NBR also had countervailing concerns that the nominal exchange rate might have become overvalued. However, starting in July 2007, surging food and energy prices as well as the sharply depreciating exchange rate pushed inflation well above the target band (Figure 9). The NBR responded by hiking its policy rate in several steps to 9.75 percent.
15. The NBR also took measures to contain banking system vulnerabilities. Additional provisions for foreign-currency denominated loans to unhedged borrowers took effect in March 2008. Moreover, with structural excess liquidity in the banking system tightening, a new regulation has been issued requiring banks to strengthen their liquidity management.
16. In part reflecting political gridlock and post-EU-accession fatigue, the pace of structural reforms has slowed down. The future speed of sustainable real convergence will largely depend on advancing structural reforms. Looming structural growth bottlenecks include Romania’s exceptionally large and inefficient agricultural sector, inflexible labor markets, an education system insufficiently focused on marketable skills, an underdeveloped public infrastructure, and low energy efficiency. Romania continues to trail best-performing new EU member peers on most structural reform indicators, lagging particularly in the areas of business licensing, ease of employing workers, registering property, public infrastructure, and control of corruption (Table 8).
III. POLICY DISCUSSIONS
17. The Article IV discussions focused on the policies best suited to achieve sustainable real and nominal convergence:
• What is the outlook for a soft landing over the medium term, especially under different fiscal and incomes policies?
• What changes in fiscal policy management could help underpin less procyclical and more proactive fiscal policies?
• How should the NBR implement its fledgling inflation-targeting framework given high inflation but also concerns about rising financial vulnerabilities?

20
Figure 9. Romania: Monetary Policy, 2007–08(in percent)
Sources: National authorities; Eurostat; IFS; and Fund staff estimates.
1/ HICP inflation rate excluding food, energy, and tobacco.
-2
-1
0
1
2
3
4
5
6
7
Jun-07 Mar-08
RomaniaHungaryPolandCzech Rep.
Deviation of Headline CPI Inflation from Target
… as in the region's other inflation targeting countries.
-2
-1
0
1
2
3
4
Jun-07 Mar-08
RomaniaHungaryPolandCzech Rep.
Deviation of Core CPI Inflation from Target 1/
In Romania, core inflation has also picked up.
-15
-10
-5
0
5
10
15
20
Change (March 08/June 07)
RomaniaHungaryPolandCzech Rep.
Percent Depreciation of Exchange Rate vis-à-vis the Euro
The NBR, also faced with a depreciating exchange rate since mid-2007, ...
0
1
2
3
4
Change (May 08/June 07)
RomaniaHungaryPolandCzech Rep.
Change in Main Policy Interest Rate (In percentage points)
... has reacted by sharply hiking the policy rate.
0
2
4
6
8
10
Jan-06 Jun-06 Nov-06 Apr-07 Sep-07 Feb-08
CPI, headline
Since mid-2007, inflation in Romania has surged outside the inflation target band...
-6
-4
-2
0
2
4
6
Jan-06 Jun-06 Nov-06 Apr-07 Sep-07 Feb-08
Real MCI, 50 percent weights onreal interest rate and realexchange rate
Romania's monetary conditions have been volatile, reflecting the NBR's challenging environment.

21
• What are the main financial vulnerabilities and how should financial-sector policies insure against a potential hard landing?
A. Outlook
18. Romania’s economic sentiment remains robust, but both global and regional leading indicators point to strong cyclical headwinds. In the latest World Economic Outlook, global and EU growth is projected to cool during 2008–09, and economic sentiment in some other regional absorption-boom economies has already declined sharply. Although the timing of an eventual slowdown in Romania remains quite uncertain, especially with the construction sector still booming, there was broad agreement that the push forces behind Romania’s absorption boom are likely to lose momentum.
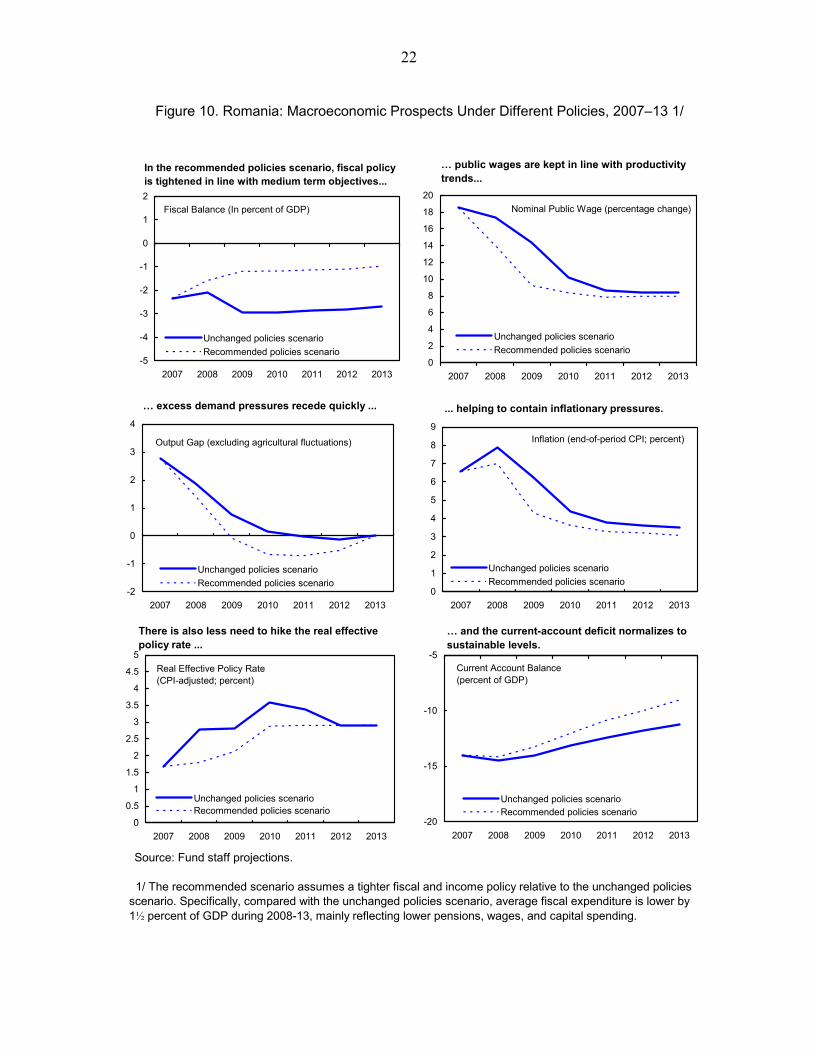
19. Under unchanged fiscal policies, staff argued that it could be quite difficult to keep inflation expectations anchored and to achieve external balance over the medium term. The staff baseline scenario assumes that the authorities will meet their presently planned 2008 fiscal deficit target (2 percent of GDP), while fiscal deficits beyond 2008 would revert to close to 3 percent of GDP, as envisaged in the 2007-10 Convergence Program. Although a tight monetary policy is assumed to counter excess-demand pressures, the uncoordinated policy mix would make it difficult to bring inflation back into target range by 2009, potentially undermining the credibility of the inflation-targeting framework (Figure 10, Table 9a). Moreover, relatively loose fiscal policies over the medium term could also—by lowering public and private savings—frustrate external adjustment to a more sustainable current-account deficit, although the external imbalance would narrow relative to the present level, and external debt would stabilize at about 50 percent of GDP by 2013 (Appendix I). This scenario could, however, also reach a tipping point, where a sudden adverse shift in market sentiment may result in a sharp slowdown of capital inflows. A resulting slump in output combined with an abrupt depreciation could adversely affect the debt-servicing capacity of households and enterprises, thus putting the banking system under strain.
20. Against this backdrop, the mission suggested that a soft landing would need to be underpinned by a more prudent policy mix. In the staff’s recommended policies scenario, fiscal policy would be tightened during 2008–09, reducing the deficit in two steps
Romania's economic sentiment has remained strong.
Source: Eurostat.
Economic sentiment indicator (s.a.)
80
90
100
110
120
130
140
Jan-06 Jul-06 Jan-07 Jul-07 Jan-08
ROMBGRESTLVALTU
22
Figure 10. Romania: Macroeconomic Prospects Under Different Policies, 2007–13 1/
Source: Fund staff projections.
1/ The recommended scenario assumes a tighter fiscal and income policy relative to the unchanged policies scenario. Specifically, compared with the unchanged policies scenario, average fiscal expenditure is lower by 1½ percent of GDP during 2008-13, mainly reflecting lower pensions, wages, and capital spending.
Current Account Balance (percent of GDP)
-20
-15
-10
-5
2007 2008 2009 2010 2011 2012 2013
Unchanged policies scenarioRecommended policies scenario
… and the current-account deficit normalizes to sustainable levels.
Fiscal Balance (In percent of GDP)
-5
-4
-3
-2
-1
0
1
2
2007 2008 2009 2010 2011 2012 2013
Unchanged policies scenarioRecommended policies scenario
In the recommended policies scenario, fiscal policy is tightened in line with medium term objectives...
Inflation (end-of-period CPI; percent)
0
1
2
3
4
5
6
7
8
9
2007 2008 2009 2010 2011 2012 2013
Unchanged policies scenarioRecommended policies scenario
... helping to contain inflationary pressures.
Output Gap (excluding agricultural fluctuations)
-2
-1
0
1
2
3
4
2007 2008 2009 2010 2011 2012 2013
Unchanged policies scenarioRecommended policies scenario
… excess demand pressures recede quickly ...
Nominal Public Wage (percentage change)
0
2
4
6
8
10
12
14
16
18
20
2007 2008 2009 2010 2011 2012 2013
Unchanged policies scenarioRecommended policies scenario
… public wages are kept in line with productivity trends...
Real Effective Policy Rate (CPI-adjusted; percent)
0
0.5
1
1.5
2
2.5
3
3.5
4
4.5
5
2007 2008 2009 2010 2011 2012 2013
Unchanged policies scenarioRecommended policies scenario
There is also less need to hike the real effective policy rate ...
23
close to what is broadly agreed to be a reasonable medium-term fiscal deficit target for Romania (1 percent of GDP). With absorption growth moderating faster than under the baseline, this facilitates more rapid disinflation and a gradual reduction in the current-account deficit to sustainable levels (Figure 10, Table 9b). In fact, the authorities’ own medium-term scenario, while somewhat more optimistic on short-term growth, had broadly similar features, although it did not elaborate on the assumed policy mix. Staff noted that even a prudent policy mix might not suffice to prevent a sharp slowdown given financial exposures and external uncertainties, and financial sector policies especially would need to be prepared for a potential hard landing. On the other hand, there would also be the upside risk that favorable external developments continued to underpin a boom for some time, widening the current-account deficit further, and rendering controlling underlying inflation pressures by tightening the policy mix even more challenging.
21. Thus, going forward, Romania’s external stability risks will be contingent on future policies and shocks. However, under a more-balanced policy mix, external stability risks should remain contained, particularly if financial-sector buffers are also strengthened further. Conversely, given accumulated financial vulnerabilities, the risk of disruptive future exchange rate movements would increase under less-balanced policies or large adverse shocks.
B. Fiscal Policy
22. There was broad agreement on the desirable features of a stability- and growth-oriented fiscal framework:
• A medium-term fiscal deficit target of about 1 percent of GDP would be appropriate to maintain fiscal sustainability and to allow unimpeded symmetric operation of automatic fiscal stabilizers.
• To help stabilize the economy, fiscal policy should avoid procyclicality as the economy moves through different growth phases.
• And to support fast real convergence, while also attending to the population’s social protection needs, fiscal policy should use budget resources, including EU funds, more efficiently to strengthen the economy’s supply side.
23. The mission argued that recent budgets were not in line with these requirements. In particular, given the absorption boom, a cyclically-neutral fiscal stance would have resulted in a small 2007 budget surplus, rather than the 2¼ percent of GDP deficit actually registered. As regards the 2008 budget, a recent budget rectification and measures to control spending have reduced the deficit target to close to 2 percent of GDP, clearly steps in the right direction (Table 7). However, staff considered that a still lower 2008 deficit target of 1½ percent of GDP, while not first best given past years’ large procyclical fiscal impulses, would provide a more balanced policy mix. The mission also expressed concern that revenue

24
projections seemed overoptimistic (by ¾ percent of GDP). At the same time, the mission saw scope to curtail the large budgeted hikes in spending on capital as well as maintenance and operations in line with the advocated tighter fiscal stance, while also relieving overheating pressures in the booming construction sector.
24. The government authorities noted that massive investment needs and political constraints account for a perhaps less-than-ideal cyclical fiscal stance. While recognizing the nub of the procyclicality problem, the government authorities viewed Romania’s low debt and the 3 percent Maastricht deficit ceiling as providing fiscal space to boost investment spending. The mission noted that EU fiscal norms, properly interpreted, militate against procyclical fiscal behavior, and also pointed out that other regional absorption-boom economies have behaved much less procyclically than Romania during 2003–07, while broadly matching Romania’s achieved increases in public investment (Figure 11).
25. Owing to populist pressures ahead of elections, both the mission and the authorities saw significant upside risks to the 2008 fiscal deficit, which would need to be strongly resisted. The upper house had already approved a cut in the VAT rate on food items from 19 to 5 percent, with full-year fiscal cost amounting to up to ½ percent of GDP, depending on implementation details. Some political parties had suggested to bring forward the already approved pension increase from January 2009 to an earlier date. And there could be potentially significant overruns in the public-sector wage bill, which the 2008 budget aims at broadly stabilizing at the 2007 level as a ratio to GDP.
26. There was also broad agreement that progress toward better fiscal policies would need to be underpinned by changes in Romania’s “budget culture.” The mission highlighted cross-country evidence for EU countries suggesting that sound budgetary procedures and the effective use of medium-term fiscal frameworks are associated with lower deficits and debts, less procyclical fiscal policies, and increased efficiency of government spending.3 Key steps to improve fiscal institutions should include: upgrading fiscal expertise and capacity at the executive and legislative levels; modifying rules and procedures to alleviate the present short-term policy orientation, including by reducing the scope for multiple budget revisions; and using independent expert panels to provide macroeconomic and revenue forecasts, insulating the budget process from politically motivated biases.
27. The 2009 budget would provide a good testing ground for a more forward-looking fiscal policy approach. In staff’s view, besides the need to implement a stability-oriented fiscal stance consistent with a deficit target close to 1 percent of GDP, the 2009 budget needs to be based on a review of the sustainability of the public pension system,
3 See Selected Issues Chapter III “Retooling Romania’s Budget Culture.”

25
Figure 11. Selected EU Countries: Fiscal Policy Responses to Absorption Booms, 2003–07 1/
Sources: Economic Forecasts Spring 2008, European Commission.
1/ To ensure cross-country data consistency and comparability, data are based on the European System of Accounts 1995, and taken from the European Commission's Spring 2008 Economic Forecasts.
Fiscal Balance (in percent of GDP)
-3
-2
-1
0
1
2
3
4
5
2003 2007 2003-07Change
RomaniaBulgariaEstoniaLatviaLithuania
Actual fiscal balances improved during 2003-07, except for Romania ...
Output Gap (in percent)
-4
-2
0
2
4
6
8
2003 2007 2003-07Change
RomaniaBulgariaEstoniaLatviaLithuania
… while all countries' cyclical positions switched into overheating mode ...
Structural Balance (in percent of GDP)
-4
-3
-2
-1
0
1
2
3
4
2003 2007 2003-07Change
RomaniaBulgariaEstoniaLatviaLithuania
… Romania's fiscal stance turned highly procyclical ...
Public Investment (in percent of GDP)
0
1
2
3
4
5
6
7
8
2003 2007 2003-07Change
RomaniaBulgariaEstoniaLatviaLithuania
… and Romania's public investment increased only in line with other countries.

26
address concerns about the efficiency of public spending, including on education and health care, and improve the capital budget’s absorption of EU funds.4
C. Monetary Policy
28. The monetary stance going forward will need to remain clearly focused on lowering inflation in line with the announced target path. While the macroeconomic outlook is likely to remain fluid, there was agreement that, absent a sharp-slowdown scenario, additional policy tightening may be needed to keep inflation expectations anchored, while bringing inflation back into the end-2009 target range. Without prejudice to its primary objective, the NBR also intended to give continued consideration to the impact of further policy rate increases on financial vulnerabilities, but expressed confidence that price and financial stability considerations complement each other at this point. There was also broad agreement that NBR communication needs to try to avoid fostering impressions in the markets that it would be strongly averse to allowing either the policy rate or the lei/euro exchange rate to cross certain unconditional threshold values.
29. Although inflation now exceeds the target range by an uncomfortable margin, there was agreement that the inflation-targeting framework has proven its mettle in a difficult external and domestic environment. In particular, the mission and the authorities saw little merit in raising the inflation target or widening the band, as such accommodating steps could only add to the difficulty of keeping inflation expectations anchored. However, with inflation likely to remain significantly above the target range before re-entering it in 2009, implementation and communication of the inflation-targeting framework would remain a difficult challenge. The NBR plans to continue upgrading its implementation capacity. The mission also noted that, following the lead of selected best-practice inflation-targeting central banks, an independent expert review of the framework might also be useful to take stock of the NBR’s accumulated experience.
D. Financial Sector Policies
30. With financial vulnerabilities rising, the NBR plans to further intensify financial sector surveillance. There was agreement that risks to financial stability, foremost direct and indirect credit risk, but also liquidity risk, had increased and needed close monitoring. The NBR, while recognizing that capital buffers had shrunk considerably, took comfort from stress tests—which included exchange rate, interest rate, and liquidity shocks—indicating that existing buffers remain adequate. The mission noted that the NBR’s Financial Stability Report testified to its greatly enhanced capacity to monitor and assess financial sector trends and risks. At the same time, stress testing methodologies could be refined further, including
4 The analysis and detailed proposals in World Bank, 2006, “Romania: Public Expenditure and Institutional Review” on these and other spending issues remain largely apposite.

27
by allowing stronger feedback effects between the real economy and banking soundness indicators. The recent initiative to remedy the lack of reliable statistics for real estate prices, while overdue, was also welcome.
31. There was broad agreement that additional preemptive measures were warranted to contain risks to financial stability. To contain credit risk, the mission advised higher capital requirements for riskier exposures, including real estate ones. The mission also urged to complement the new regulation for liquidity risks with on-site inspections and to consider broadening the range of eligible collateral for its overdraft facility. With many banks seemingly still focused on aggressively gaining market share, including by promoting exotic credit products, it would also be important that the NBR continued to encourage monitoring and containing operational risks. The authorities stressed that they were ready to take additional measures as necessary. The NBR also underlined that it will only allow banks to fully exploit the flexibility in Basel II after having carefully vetted banks’ internal models.
32. As part of EU commitments, the authorities are strengthening their crisis preparedness arrangements. A crisis management group has been established, and a crisis contingency plan is being prepared. The key elements of a safety net—lender of last resort rules, deposit insurance, bank resolution framework—are in place, but remain largely untested. The most recent memorandum of understanding on cross-border financial crisis preparedness, signed by all EU countries, has again highlighted the need to coordinate regulatory and prudential actions with pertinent foreign regulators.
IV. STAFF APPRAISAL
33. Romania has made significant strides in catching up with EU income levels, but fast real convergence has gone hand-in-hand with growing macroeconomic imbalances. Once EU accession prospects looked secure, foreign capital flooded into Romania to take advantage of perceived improvements in investment risks and returns, triggering an absorption boom. This boom has been mirrored by a widening current-account deficit, although the present level of the exchange rate does not raise significant external stability concerns. With labor market conditions tightening and fiscal policies in procyclical mode, the absorption boom has also raised underlying inflation pressures. Food and energy price shocks have pushed headline inflation well above the NBR’s target range, while global financial market turbulence so far has been mainly reflected in somewhat higher external funding costs and increased exchange rate volatility.
34. While the economic outlook is quite uncertain, with a better policy mix macroeconomic imbalances should gradually normalize over the medium term, in line with Romania’s ambition to adopt the euro by 2014. The economy has yet to show signs of slowing to a more sustainable pace; at the same time, lingering global financial market tensions hold the risk of a sharp slowdown. However, under any scenario, a key challenge for

28
Romania will be to adopt more stability-oriented fiscal and incomes policies that complement, rather than counteract, the NBR’s monetary policy. But Romania’s policy-making challenges go well beyond plain policy coordination problems in an overheating economy. In particular, the sustainable speed of real convergence will ultimately depend on the ability of policies to address growth bottlenecks in a forward-looking manner, calling for fresh efforts to catch up with best-performing new EU member peers on structural reforms.
35. Fiscal policy should be tightened. Romania’s fiscal position—particularly as indicated by low public debt levels—is relatively sound. Nevertheless, it would have been appropriate to respond to the private-sector absorption boom by allowing automatic fiscal stabilizers to operate around the broadly agreed medium-term fiscal deficit target of 1 percent of GDP. As illustrated by the experience of other regional economies, a less procyclical fiscal stance does not need to conflict with increased spending on capital. In this vein, and building on the recent welcome budget rectification, the fiscal stance in 2008 should be tightened further to achieve a deficit of about 1½ percent of GDP. A tighter fiscal stance would relieve the burden on monetary policy, but also put the deficit on a credible consolidation path toward its medium-term target and avoid the need to adopt a procyclical fiscal stance when the economy shifts to a slower-growth phase. While upcoming elections will make achieving this more ambitious deficit target politically difficult, there is considerable scope to restrain budgeted spending on maintenance and operations as well as on capital, and such spending restraint could help mitigate overheating pressures in the booming construction sector. It will also be important to maintain wage discipline in the public sector, and resist populist pressures to increase social spending or cut taxes during the run-up to the elections.
36. A more proactive fiscal policy will need to be underpinned by a less myopic budget culture. The present short-term focus of fiscal policies may well have been aligned with the demands of an early stage of transition. At this point, such a policy culture has become counterproductive, as illustrated by Romania’s so far limited success in tapping and absorbing EU funds. Improving fiscal policy management requires increasing fiscal expertise and capacity at all government levels, modifying the rules and procedures that underpin the present short-term orientation, and establishing a role for independent expert panels to mitigate biases in macroeconomic and fiscal forecasts.
37. Monetary policy is facing a difficult environment in its efforts to restore low and stable inflation. An absorption boom, a highly volatile exchange rate, and procyclical fiscal policies would already constitute considerable challenges for a central bank still building its inflation-targeting credentials. However, adverse supply shocks have aggravated headline inflation pressures, and inflation expectations may no longer be fully anchored. The NBR appropriately responded by tightening the monetary stance through several policy rate hikes, and additional tightening may be needed to bring inflation back into target range by 2009. Concurrently, the NBR should continue to strengthen its capacity to implement its framework, including by taking stock of its inflation-targeting experience since 2005.
29
38. Given rising financial stability risks, continued vigilance and additional preemptive measures are warranted. Financial deepening has progressed at a rapid clip, and private-sector currency mismatches are increasing. Moreover, banks’ non-performing loans are rising, and previously large capital and liquidity buffers are being eroded, although financial soundness indicators remain relatively healthy. Admittedly, it is difficult to identify, motivate, and implement preemptive measures in a setting where financial fragilities are rising but not yet acute. The recent preemptive measures addressing foreign-exchange risks of unhedged borrowers and improving banks’ liquidity management are commendable steps in the right direction. However, larger capital cushions for more risky exposures, including real-estate exposures, are advisable, while additional measures to contain liquidity and operational risks should also be considered. The envisaged update of the Financial Sector Assessment Program later in the year will provide a good opportunity for reviewing the strengths and vulnerabilities of Romania’s financial system.
39. It is proposed that the next Article IV consultation be held on the standard 12-month cycle.

30
2005 2006 2007 2008 2009Proj. Proj.
Output, prices, and labor marketReal GDP 4.2 7.9 6.0 6.8 5.8Real GDP excluding agricultural sector 6.4 7.6 7.4 6.5 5.6Real domestic demand (absorption) 8.8 14.5 16.4 9.3 9.9Consumer price index (CPI, average) 9.0 6.6 4.8 8.2 6.6Consumer price index (CPI, end of period) 8.6 4.9 6.6 7.9 6.2Employment -0.7 0.7 1.4 0.9 0.6Nominal wages 17.0 18.9 22.6 20.5 16.9
Public sector wages 25.9 27.3 18.5 17.4 14.4Private sector wages 14.8 16.6 23.7 21.4 17.6
Nominal unit labor cost 11.5 11.0 17.2 13.8 11.2
General government financesRevenue 30.2 31.0 31.4 34.7 35.2Expenditure 31.0 31.6 33.7 36.8 38.2Fiscal balance -0.8 -0.6 -2.3 -2.1 -2.9Structural fiscal balance 1/ -1.3 -1.8 -3.9 -3.4 -3.8Gross public debt 15.8 12.4 12.1 11.4 11.5Net financial worth 16.2 12.4 8.2 8.2 8.6
Money and creditBroad money (M3) 36.5 28.1 33.5 36.4 25.7Domestic credit 43.7 52.0 64.5 32.8 24.9
Interest ratesEuro, six-month LIBOR 2.2 3.1 4.3 4.2 4.0Interbank rate … 8.2 7.6 … …Lending rate 21.0 14.8 13.3 … …Real lending rate (CPI adjusted) 12.0 8.3 8.5 … …
Balance of paymentsCurrent account balance -8.9 -10.4 -14.0 -14.4 -14.0
Merchandise trade balance -9.9 -12.0 -14.6 -14.9 -14.4Capital and financial account balance 15.6 15.7 17.6 16.1 16.8
Foreign direct investment balance 6.6 8.9 5.9 5.6 5.0Net international investment position -29.2 -35.3 -42.1 -49.3 -53.5
Gross official reserves 18.4 18.6 16.2 14.2 13.7Gross external debt 39.1 42.9 48.5 49.4 49.7
Exchange ratesLei per euro (end of period) 3.66 3.41 3.53 … …Lei per euro (average) 3.63 3.52 3.34 … …Real effective exchange rate
CPI based (percentage change) 17.9 7.6 9.0 1.3 6.5GDP deflator based (percentage change) 21.4 11.9 15.2 5.9 10.5
Social Indicators (reference year in parentheses)
Sources: Romanian authorities; Fund staff estimates and projections; and World Development Indicators database.
1/ Actual fiscal balance adjusted for the automatic effects of output gap and absorption gap on the fiscal position. See IMF Country Report No. 07/390, Chapter III for details.
Per capita GNI (Atlas method, 2006): US $4,850; Income distribution (GINI index, 2003): 31.1; Poverty rate (2005): 13 percent; Primary education completion rate (2005): 99.4 percent; Life expectancy at birth (2005): 71.7; Infant mortality per 1000 live births (2005): 16.
Table 1. Romania: Selected Economic and Social Indicators, 2005–09
(In percent of GDP)
(Annual percentage change)
(In percent of GDP)
(Annual percentage change)
(In percent)
31
2003 2004 2005 2006 2007 2008 2009Proj. Proj.
GDP 5.2 8.5 4.2 7.9 6.0 6.8 5.8Domestic demand (absorption) 8.7 12.7 8.8 14.5 16.4 9.3 9.9
Private demand 1/ 8.7 16.6 9.0 16.6 17.6 8.1 10.2Public demand 1/ 8.6 -6.0 7.4 2.4 8.4 18.2 8.4
Final consumption 8.3 11.2 9.7 10.1 10.3 7.6 8.7Private consumption 8.4 14.6 9.9 12.4 11.0 7.6 9.1Public consumption 7.7 -4.9 8.5 -3.1 5.6 7.4 6.1
Gross fixed investment 8.6 11.1 12.7 19.3 28.9 12.3 6.8Private investment 7.7 15.3 14.3 17.7 30.2 6.5 5.4Public investment 13.2 -11.3 1.5 32.3 19.7 56.3 13.9
Change in inventories 2/ 0.1 1.9 -2.3 1.5 -1.2 -0.8 0.2Net exports 2/ -3.6 -4.5 -4.4 -6.2 -8.7 -2.6 -3.7
Exports of goods and services 8.4 13.9 7.7 10.6 8.7 10.6 7.7Imports of goods and services 16.0 22.1 16.0 22.4 26.1 12.9 13.4
Domestic demand (absorption) 8.8 12.9 8.6 14.0 14.8 9.4 9.4Private demand 1/ 7.3 14.3 7.2 13.7 13.2 6.2 7.6Public demand 1/ 1.6 -1.3 1.4 0.3 1.6 3.2 1.8
Final consumption 6.9 8.7 8.2 8.1 8.5 6.4 7.0Private consumption 5.8 9.7 6.8 8.7 7.6 5.2 6.0Public consumption 1.2 -1.0 1.4 -0.6 0.9 1.2 1.0
Gross fixed investment 1.8 2.4 2.8 4.5 7.4 3.8 2.2Private investment 1.4 2.8 2.7 3.6 6.8 1.8 1.5Public investment 0.4 -0.4 0.0 0.8 0.6 2.0 0.7
Change in inventories 0.1 1.9 -2.3 1.5 -1.2 -0.8 0.2Net exports -3.6 -4.5 -4.4 -6.2 -8.7 -2.6 -3.7
Exports of goods and services 3.0 4.8 2.8 3.5 2.8 3.2 2.4Imports of goods and services 6.6 9.3 7.2 9.7 11.5 5.8 6.0
Gross value added 4.7 7.4 3.2 7.0 5.9 6.5 5.2Agriculture 0.6 2.2 -2.2 0.3 -1.3 0.3 0.2Industry 1.2 1.6 0.6 1.7 1.2 1.1 0.9Construction 0.4 0.5 0.6 1.6 2.5 1.8 1.2Services 2.5 3.2 4.2 3.5 3.5 3.3 2.9
Net taxes on product 0.8 1.0 0.9 0.8 0.2 0.6 0.5
GDP deflator 24.0 15.0 12.2 10.8 10.8 13.1 10.5Domestic demand (absorption) 22.0 12.3 8.6 6.1 2.9 10.6 5.8Final consumption 22.8 11.7 9.5 6.1 5.4 9.9 7.8
Private consumption 15.2 13.9 7.3 5.2 4.7 8.2 6.6Public consumption 58.0 7.8 19.2 14.7 10.3 17.2 13.8
Gross fixed investment 20.7 14.6 9.6 11.2 8.4 14.3 9.8Exports of goods and services 17.9 13.4 0.2 5.1 1.9 9.5 3.3Imports of goods and services 15.4 8.9 -2.9 -0.2 -5.9 7.4 -1.7
2/ Contributions to GDP growth.
(Contribution to real GDP growth by production category, in percent)
1/ Private and public sector components are based on staff estimations and are not officially reported by the INS.
Sources: National Institute of Statistics (INS); staff estimates and projections.
Table 2. Romania: Real GDP Components and Implicit Deflators, 2003–09
(Real growth rate by expenditure category, in percent)
(Contribution to real GDP growth by expenditure category, in percent)
(Percentage change in implicit deflators)

32
2005 2006 2007 2008 2009 2010 2011 2012 2013Proj. Proj. Proj. Proj. Proj. Proj.
Current account balance -7.1 -10.2 -17.0 -20.3 -23.5 -25.7 -28.1 -30.6 -33.3Merchandise trade balance -7.9 -11.8 -17.7 -20.9 -24.2 -26.4 -28.9 -31.6 -34.7
Exports of goods 22.3 25.9 29.4 33.7 38.0 43.3 49.4 56.9 65.5Imports of goods -30.2 -37.6 -47.1 -54.6 -62.2 -69.7 -78.4 -88.5 -100.3
Services balance -0.4 0.0 0.2 0.5 0.7 1.1 1.5 2.1 2.9Exports of non-factor services 3.9 5.5 7.6 9.3 11.1 13.2 15.7 18.9 22.7Imports of non-factor services -4.4 -5.5 -7.4 -8.9 -10.4 -12.2 -14.2 -16.8 -19.8
Income balance -2.3 -3.2 -4.4 -5.1 -6.0 -7.3 -8.6 -10.1 -11.8Receipts 1.2 1.7 2.4 2.5 3.0 3.5 4.1 4.7 5.3Payments -3.6 -5.0 -6.8 -7.6 -9.0 -10.8 -12.7 -14.8 -17.1
Current transfer balance 3.6 4.8 4.9 5.2 5.9 6.9 7.9 9.1 10.4
Capital and financial account balance 12.4 15.4 21.4 22.7 28.3 32.2 34.1 37.2 40.8Capital transfer balance 0.6 0.0 0.8 2.1 2.7 3.3 3.6 3.8 4.1Foreign direct investment balance 5.2 8.7 7.2 7.9 8.4 8.8 9.1 10.4 11.8Portfolio investment balance 0.8 -0.3 0.0 0.0 0.4 0.9 1.6 1.8 2.0Other investment balance 5.8 6.9 13.4 12.7 16.7 19.2 19.9 21.3 22.9
General government 0.4 -0.1 -0.1 1.1 2.0 2.6 3.0 3.7 3.9Domestic banks 2.6 3.8 6.0 4.8 5.7 6.7 7.7 7.5 8.6Other private sector 2.8 3.3 7.5 6.8 9.0 9.9 9.2 10.1 10.4
Errors and omissions 0.3 0.1 0.2 0.0 0.0 0.0 0.0 0.0 0.0
Overall balance 5.6 5.3 4.6 2.4 4.8 6.5 6.0 6.6 7.6
Financing -5.6 -5.3 -4.6 -2.4 -4.8 -6.5 -6.0 -6.6 -7.6Gross international reserves (increase: -) -5.4 -5.2 -4.5 -2.4 -4.8 -6.5 -6.0 -6.6 -7.6Use of Fund credit, net -0.1 -0.1 -0.1 0.0 0.0 0.0 0.0 0.0 0.0
Purchases 0.0 0.0 0.0 0.0 0.0 0.0 0.0 0.0 0.0Repurchases 0.1 0.1 0.1 0.0 0.0 0.0 0.0 0.0 0.0
Other liabilities, net -0.1 0.0 0.0 0.0 0.0 0.0 0.0 0.0 0.0
Memorandum items:Current account balance -8.9 -10.4 -14.0 -14.4 -14.0 -13.1 -12.4 -11.8 -11.3
Merchandise trade balance -9.9 -12.0 -14.6 -14.9 -14.4 -13.5 -12.7 -12.2 -11.7Exports of goods 28.0 26.4 24.3 24.0 22.6 22.1 21.8 22.0 22.2Imports of goods -37.9 -38.5 -38.8 -38.9 -36.9 -35.6 -34.5 -34.2 -33.9
Services balance -0.5 0.0 0.2 0.3 0.4 0.5 0.7 0.8 1.0Income balance -2.9 -3.3 -3.6 -3.6 -3.5 -3.7 -3.8 -3.9 -4.0Current transfer balance 4.5 5.0 4.0 3.7 3.5 3.5 3.5 3.5 3.5
Foreign direct investment balance 6.6 8.9 5.9 5.7 5.0 4.5 4.0 4.0 4.0Gross external financing requirement 16.6 20.2 28.2 35.4 35.9 36.8 37.4 38.1 38.1
Merchandise export volume 6.1 6.8 8.7 9.0 6.4 8.5 8.5 9.2 9.3Merchandise import volume 15.0 22.3 26.1 12.4 12.9 12.1 12.1 12.3 12.7Merchandise export prices 9.6 8.5 4.6 5.2 5.8 5.2 5.2 5.4 5.4Merchandise import prices 7.0 2.2 -0.8 3.2 0.8 0.1 0.3 0.5 0.5Terms of trade (merchandise) 2.8 6.4 5.4 1.9 5.0 5.1 4.9 4.8 4.8
GDP 79.5 97.8 121.2 140.4 168.4 196.1 227.1 259.0 295.8
Sources: Romanian authorities; and Fund staff estimates and projections.
Table 3. Romania: Balance of Payments, 2005–13(In billions of euros, unless otherwise indicated)
(In percent of GDP)
(Annual percentage change)
33
2005 2006 2007 2008 2009 2010 2011 2012 2013Proj. Proj. Proj. Proj. Proj. Proj.
Net international investment position -23.2 -34.6 -51.0 -69.2 -90.0 -112.5 -137.0 -163.8 -192.9 Foreign direct investment -21.7 -30.6 -37.8 -45.7 -54.1 -62.9 -72.0 -82.4 -94.2 Portfolio investment -3.8 -3.6 -3.6 -3.5 -3.9 -4.9 -6.4 -8.2 -10.2 Other investments -16.0 -23.3 -36.6 -49.3 -66.0 -85.2 -105.1 -126.3 -149.2 Gross international reserves 18.2 22.9 26.9 29.3 34.0 40.5 46.5 53.2 60.7
Financial assets 25.7 30.6 34.6 37.1 42.2 48.9 55.2 62.2 70.2 Foreign direct investment 0.2 0.2 0.2 0.2 0.2 0.2 0.2 0.3 0.3 Portfolio investment 0.6 0.9 1.0 1.0 1.1 1.1 1.2 1.3 1.3 Other investments 6.7 6.6 6.5 6.7 6.9 7.1 7.3 7.5 7.8 Gross international reserves 18.2 22.9 26.9 29.3 34.0 40.5 46.5 53.2 60.7
Financial liabilities 48.9 65.2 85.6 106.4 132.2 161.4 192.2 226.0 263.1 Foreign direct investment 21.8 30.8 37.9 45.9 54.3 63.2 72.3 82.7 94.5 Portfolio investment 4.4 4.5 4.5 4.6 5.0 6.0 7.6 9.5 11.6 Loans 17.4 22.3 30.6 41.0 54.7 70.3 86.7 104.1 123.0 NBR 0.2 0.1 0.0 0.0 0.0 0.0 0.0 0.0 0.0 General government 7.2 6.9 6.9 8.0 10.0 12.7 15.7 19.3 23.2 Banks 3.7 6.6 12.6 17.5 23.4 30.2 38.2 45.9 54.8 Other sectors 6.3 8.7 11.2 15.6 21.3 27.4 32.9 38.8 45.0 Other liabilities 5.3 7.6 12.5 14.9 18.2 22.0 25.6 29.7 34.0
Memorandum items:
Gross international reserves 22.9 23.4 22.2 20.8 20.2 20.7 20.5 20.5 20.5In percent of short-term debt 1/ 179.8 124.1 104.1 84.2 77.9 75.2 71.8 69.5 68.8In months of next year's imports 5.1 5.0 5.1 4.8 5.0 5.3 5.3 5.3 5.3
Gross external debt 39.1 42.9 48.5 49.4 49.7 50.8 50.9 51.5 51.4 Public 8.7 7.4 6.3 6.2 6.3 6.6 6.7 7.0 7.1 Private 30.4 35.5 42.2 43.2 43.3 44.2 44.2 44.5 44.3
Of which: short-term 8.1 13.7 16.7 18.3 19.1 20.1 20.7 21.2 21.5Net international investment position -29.2 -35.3 -42.1 -49.3 -53.5 -57.3 -60.3 -63.2 -65.2
Sources: Romanian authorities and Fund staff estimates and projections.
1/ At remaining maturity.
Table 4. Romania: External Financial Assets and Liabilities, 2005–13
(In percent of GDP, unless otherwise indicated)
(In billions of euros, unless otherwise indicated)

34
2005 2006 2007
December December December December December
Net foreign assets 41.5 38.7 29.1 32.6 38.1In billions of euros 11.3 11.5 8.1 9.7 11.1Of which: Commercial banks -7.1 -11.9 -18.7 -21.7 -24.8
NBR 18.4 23.4 26.7 31.4 35.9
Net domestic assets 45.0 72.1 118.9 169.2 215.5
Domestic credit 63.1 95.9 157.8 209.4 261.6Private sector credit 59.8 92.4 148.2 197.4 247.5Of which in foreign currency (In percent) 54.7 47.4 54.3 ... ...
Other items net -18.1 -23.8 -38.8 -40.2 -46.0
Broad money (M3) 86.5 110.8 148.0 201.8 253.6Currency in circulation 11.4 15.1 21.3 29.5 39.0Deposits from non-government clients 74.8 96.4 129.1 172.3 214.5Of which in foreign currencies (In percent) 34.6 32.3 32.1 … …
Memorandum items: Domestic credit growth (In percent) 43.7 52.0 64.5 32.8 24.9Private sector credit growth (In percent) 45.8 54.5 60.4 33.2 25.4
Broad money (M3) growth (In percent) 36.5 28.1 33.5 36.4 25.7Net foreign asset contribution (In percentage points) 9.7 -3.2 -8.7 2.4 2.7Net domestic asset contribution (In percentage points) 26.8 31.3 42.3 34.0 22.9
Growth of currency in circulation (In percent) 52.5 32.9 40.9 38.5 32.2
Real broad money growth (In percent) 25.5 22.1 25.3 26.4 18.3
CPI inflation (In percent) 8.6 4.9 6.6 7.9 6.2Exchange rate (Lei/euro, e.o.p.) 3.66 3.41 3.53 … …M3 velocity 3.3 2.8 2.7 2.4 2.3Money multiplier 3.9 3.2 3.0 3.1 2.9
Sources: Romanian authorities; and Fund staff estimates and projections.
Note: Starting January 2007, monetary indicators are calculated based on NBR Norms No 13/2006. Only some time serieshave been restated back to 2004.
(In billions of lei, unless otherwise indicated)Table 5a. Romania: Monetary Survey, 2005–09
2008
Proj.
2009
Proj.

35
2005 2006 2007
December December December December December
Net foreign assets 67.5 79.1 96.5 105.4 122.9In billion of euros 18.4 23.4 26.7 31.4 35.9
Net domestic assets -45.3 -44.5 -47.7 -40.4 -34.6 Total credit -25.4 -21.1 -15.4 -21.1 -19.5
Net credit to government 1/ -3.9 -9.6 -8.5 -4.7 -3.7 Other items net -20.0 -23.5 -32.3 -19.4 -15.1
Reserve money 22.2 34.6 48.7 65.0 88.2Currency 12.7 17.4 25.3 36.9 51.0Deposits with the NBR 9.5 17.2 23.4 28.1 37.2
Memorandum items:Real reserve money growth (In percent) 49.1 48.5 32.3 23.5 27.9Nominal reserve money growth (In percent) 62.1 55.7 41.0 33.3 35.8 Net domestic asset contribution (In percentage points) -94.5 3.5 -9.1 14.9 9.0 Net foreign asset contribution (In percentage points) 156.6 52.2 50.1 18.4 26.8
CPI inflation (In percent) 8.6 4.9 6.6 7.9 6.2Inflation target range (In percent) 6.5 - 8.5 4 - 6 3 - 5 2.8 - 4.8 2.5 - 4.5
Policy interest rate (Percent p.a.) 7.50 8.75 7.50 ... ...Effective policy interest rate (Percent p.a.) 2/ 7.2 8.2 7.5 ... ...Real effective policy interest rate (Percent p.a.) -1.4 3.2 0.9 ... ...Money market rate, deposits, monthly average (Percent p.a.) ... 8.2 7.6 ... ...
Lending rates of credit institutions (Percent p.a.) 3/ 21.0 14.8 13.3 ... ...Deposit rates of credit institutions (Percent p.a.) 3/ 8.3 6.5 6.7 ... ...
Sources: Romanian authorities; and Fund staff estimates and projections.
Note: Starting January 2007, monetary indicators are calculated based on NBR Norms No 13/2006. Only some time serieshave been restated back to 2004.1/ Treasury's deposits with the NBR. The NBR is not allowed to provide direct credit to the government. 2/ The effective policy rate is calculated as the average of the interest rate of the daily flows of CDs, deposit auctions, and the deposit facility. 3/ Average rates for local currency denominated transactions of non-financial corporations and households.
Table 5b. Romania: Balance Sheet of the National Bank, 2005–09 (In billions of lei, unless otherwise indicated)
2008
Proj.
2009
Proj.

36
2003 2004 2005 2006 2007
Capital buffers:Capital adequacy ratio 1/ 21.1 20.6 21.1 18.1 12.6Own capital ratio 1/ 10.9 8.9 9.2 8.6 6.7
Credit risk:Assets, percent of GDP 31.2 37.1 45.2 50.9 64.2Domestic credit, percent of GDP 15.2 17.8 21.9 27.8 39.0 Lending for real estate purchase, percent of GDP 2/ 3/ 1.2 1.9 2.7 3.9 6.5 Medium and long term credits, percent of private credit ... 58.4 63.9 68.4 76.0Non-performing loans, percent of loans 4/ 8.3 8.1 8.3 7.9 9.7Specific provisions, percent of non-performing loans 4/ 12.6 16.1 14.4 18.2 25.3
Foreign exchange risk:Net open position in foreign exchange 1.6 -2.0 -0.6 0.6 0.3Lending in foreign exchange, percent of private credit 64.8 61.8 54.7 47.4 54.3Foreign currency liabilities, percent of total liabilities 45.0 46.8 44.3 44.1 42.5Net foreign assets of credit institutions, percent of GDP -1.9 -3.7 -7.9 -10.1 -16.7
Liquidity risk:Liquidity ratio 5/ 3.0 2.3 2.6 2.3 2.2Liquid assets, percent of total assets 62.7 63.6 61.8 54.4 48.3Liquid assets, percent of short term liabilities 210.8 193.9 245.7 207.2 171.7Loan to deposit ratio 6/ ... 77.2 84.4 99.5 108.9
Profitability and concentration:Return on average assets 2.7 2.5 1.9 1.7 1.3Return on average equity 20.0 19.3 15.4 13.6 11.5Market share (assets) of five largest banks 63.9 59.2 58.8 60.3 56.4
Memorandum items:Number of credit institutions 39 40 40 39 39Stock market capitalization, percent of GDP 7/ 10.2 17.1 22.3 24.4 27.3
Sources: National Bank of Romania, Romanian National Institute of Statistics, and Fund staff estimates.
SIBEX, are excluded.
about 82 percent of total loans and commitments granted.3/ During 2007, the share of credit to households for house purchase has remained relatively constant around 19–20 percent.4/ Non-perfroming loans reflect unadjusted exposure to non-performing loans classified as "loss", "doubtful" and "substandard",
according to the NBR's loan classification regulations, as percent of total loans.
6/ Loan-to-deposit ratio (domestic credit to domestic deposits, including government). 7/ Covers the regulated market at Bucharest Stock Exchange, including SIFs, and RASDAQ. Derivatives, which are traded at
Table 6. Romania: Selected Financial Soundness Indicators, 2003–07
Note: On January 1, 2007, the NBR introduced the ESCB's statistical methodology. Only some time series have been recalculated back to December 2004.
(In percent, unless otherwise indicated)
5/ Effective liquidity over required liquidity, the mandatory ratio is thus one.
1/ The NBR amended the capital adequacy requirements effective January 1, 2007 to be consistent with EU minimum requirements. The former 12 percent capital adequacy ratio and 8 percent Tier I were substituted by a new 8 percent solvency ratio.
2/ Refers to loans and commitments to a single debtor above RON 20,000 according to the Central Credit Register, which covers

37
2005 2006 2007 2007 2008 1/ 2008 2009 2010 2011 2012 2013Budget Budget
Revenue 87.0 106.9 142.1 127.1 172.9 169.6 201.3 230.8 256.6 288.5 324.7 Taxes 78.4 96.8 121.4 115.2 143.8 143.3 168.7 193.8 219.6 248.0 280.2 Taxes on profits 7.8 9.3 12.8 11.9 14.5 14.7 17.6 20.6 23.6 26.8 30.5 Taxes on income 6.9 9.8 14.1 14.4 17.6 18.3 21.9 25.6 29.4 33.6 38.4 Value-added taxes 22.5 27.8 35.5 31.2 41.0 41.0 48.4 55.5 63.1 71.0 80.1 Excises 9.1 10.6 13.9 12.5 15.1 14.0 15.1 16.2 17.5 18.9 20.4 Customs duties 2.2 2.6 1.6 0.9 1.1 1.0 1.2 1.3 1.5 1.7 1.9 Social security contributions 27.0 33.0 38.0 38.8 47.9 47.6 56.7 65.7 74.6 84.8 96.4 Other taxes 2.9 3.7 5.4 5.4 6.6 6.7 7.8 8.9 10.0 11.2 12.5 Nontax revenue 6.5 7.4 11.7 8.1 16.6 13.8 16.1 18.4 21.3 23.8 26.6 Capital revenue 0.4 0.9 0.7 0.9 1.0 1.0 1.2 1.4 1.6 1.7 2.0 Grants 1.7 1.8 8.4 2.9 11.4 11.4 15.3 17.2 14.1 15.0 15.9
Expenditure 89.2 109.0 151.6 136.5 183.0 179.7 218.1 250.1 277.4 311.5 349.3 Current expenditure 81.6 97.8 134.1 122.1 155.0 153.2 185.0 210.8 233.5 261.4 292.6 Compensation of employees 15.5 21.0 26.2 25.6 28.7 28.7 33.8 38.8 43.7 49.3 55.6 Maintenance and operations 21.5 22.1 28.4 25.8 35.6 33.8 40.1 46.0 52.1 58.6 65.5 Interest 3.0 2.7 3.1 2.7 3.8 3.8 4.4 4.7 5.1 5.6 6.2 Subsidies 6.5 7.4 6.8 6.9 6.7 6.7 7.2 7.7 8.0 8.5 9.9 Transfers 34.3 43.4 67.4 59.0 78.4 78.4 97.2 111.2 121.7 136.2 151.9 Pensions 16.7 18.5 22.9 22.6 31.6 31.6 43.0 49.9 56.0 63.2 70.6 Other social transfers 9.9 12.3 16.9 15.7 18.1 18.1 20.9 23.8 26.5 29.5 32.9 Contribution to EU budget ... ... 4.0 3.8 4.2 4.2 4.0 4.4 4.3 4.6 4.7 Other transfers 2/ 7.7 12.6 23.6 16.9 24.5 24.5 29.2 33.1 34.8 38.9 43.8 Other spending 0.9 1.2 2.2 2.1 1.9 1.9 2.2 2.5 2.8 3.1 3.5 Capital expenditure 7.6 11.1 16.8 14.4 27.2 25.7 32.2 38.2 42.8 48.8 55.3 Reserve fund 0.0 0.0 0.6 0.0 0.5 0.5 0.6 0.7 0.7 0.8 0.9 Net lending 0.0 0.0 0.1 0.0 0.3 0.3 0.3 0.4 0.4 0.5 0.5
Fiscal balance (cash basis) -2.3 -2.1 -9.5 -9.4 -10.1 -10.1 -16.8 -19.2 -20.9 -23.0 -24.6
Financing 2.3 2.1 9.5 9.4 10.1 10.1 16.8 19.2 20.9 23.0 24.6 Privatization proceeds 3.7 1.5 0.6 0.6 0.6 0.6 0.3 0.1 0.0 0.0 0.0 External 1.5 0.3 0.2 0.2 … 0.5 0.0 0.0 0.0 0.0 0.0 Domestic -2.9 0.3 8.7 8.6 … 9.0 16.6 19.2 20.9 23.0 24.6
Financial assets 104.4 101.0 ... 98.0 ... 111.8 130.6 153.6 175.5 199.3 224.6Financial liabilities 57.8 58.4 ... 64.8 ... 71.7 81.5 94.6 105.0 115.5 125.5 Gross public debt 3/ 45.6 42.6 ... 49.0 ... 55.9 65.7 78.8 89.2 99.7 109.7 External 25.2 25.6 ... 25.3 ... 30.5 36.2 43.1 49.4 57.3 65.4 Domestic 20.4 17.0 ... 23.7 ... 25.4 29.5 35.7 39.8 42.4 44.2Net financial worth 46.6 42.6 ... 33.2 ... 40.1 49.2 58.9 70.5 83.8 99.2
Sources: Ministry of Finance; Eurostat; and Fund staff projections.
1/ First budget rectification approved in March 2008. 2/ Includes co-financing of EU projects. 3/ Excluding public debt guarantees.
Table 7a. Romania: General Government Operations and Balance Sheet, 2005–13(In billions of lei)
Projections, unchanged policies

38
2005 2006 2007 2007 2008 1/ 2008 2009 2010 2011 2012 2013Budget Budget
Revenue 30.2 31.0 35.1 31.4 35.4 34.7 35.2 35.3 34.9 35.1 35.4 Taxes 27.2 28.1 30.0 28.5 29.4 29.3 29.5 29.6 29.9 30.2 30.5 Taxes on profits 2.7 2.7 3.2 3.0 3.0 3.0 3.1 3.1 3.2 3.3 3.3 Taxes on income 2.4 2.8 3.5 3.6 3.6 3.7 3.8 3.9 4.0 4.1 4.2 Value-added taxes 7.8 8.1 8.8 7.7 8.4 8.4 8.5 8.5 8.6 8.6 8.7 Excises 3.2 3.1 3.4 3.1 3.1 2.9 2.6 2.5 2.4 2.3 2.2 Customs duties 0.8 0.8 0.4 0.2 0.2 0.2 0.2 0.2 0.2 0.2 0.2 Social security contributions 9.4 9.6 9.4 9.6 9.8 9.7 9.9 10.0 10.2 10.3 10.5 Other taxes 1.0 1.1 1.3 1.3 1.3 1.4 1.4 1.4 1.4 1.4 1.4 Nontax revenue 2.2 2.2 2.9 2.0 3.4 2.8 2.8 2.8 2.9 2.9 2.9 Capital revenue 0.2 0.2 0.2 0.2 0.2 0.2 0.2 0.2 0.2 0.2 0.2 Grants 0.6 0.5 2.1 0.7 2.3 2.3 2.7 2.6 1.9 1.8 1.7
Expenditure 31.0 31.6 37.5 33.7 37.4 36.8 38.2 38.2 37.8 37.9 38.0 Current expenditure 28.3 28.4 33.1 30.2 31.7 31.3 32.4 32.2 31.8 31.8 31.9 Compensation of employees 5.4 6.1 6.5 6.3 5.9 5.9 5.9 5.9 5.9 6.0 6.1 Maintenance and operations 7.5 6.4 7.0 6.4 7.3 6.9 7.0 7.0 7.1 7.1 7.1 Interest 1.0 0.8 0.8 0.7 0.8 0.8 0.8 0.7 0.7 0.7 0.7 Subsidies 2.2 2.2 1.7 1.7 1.4 1.4 1.3 1.2 1.1 1.0 1.1 Transfers 11.9 12.6 16.7 14.6 16.0 16.0 17.0 17.0 16.6 16.6 16.5 Pensions 5.8 5.4 5.7 5.6 6.5 6.5 7.5 7.6 7.6 7.7 7.7 Other social transfers 3.4 3.6 4.2 3.9 3.7 3.7 3.7 3.6 3.6 3.6 3.6 Contribution to EU budget ... ... 1.0 0.9 0.9 0.9 0.7 0.7 0.6 0.6 0.5 Other 2/ 2.7 3.7 5.8 4.2 5.0 5.0 5.1 5.1 4.7 4.7 4.8 Other spending 0.3 0.3 0.5 0.5 0.4 0.4 0.4 0.4 0.4 0.4 0.4 Capital expenditure 2.6 3.2 4.1 3.6 5.6 5.3 5.6 5.8 5.8 5.9 6.0 Reserve fund 0.0 0.0 0.2 0.0 0.1 0.1 0.1 0.1 0.1 0.1 0.1 Net lending 0.0 0.0 0.0 0.0 0.1 0.1 0.1 0.1 0.1 0.1 0.1
Fiscal balance (cash basis) -0.8 -0.6 -2.4 -2.3 -2.1 -2.1 -2.9 -2.9 -2.8 -2.8 -2.7
Financing 0.8 0.6 2.4 2.3 2.1 2.1 2.9 2.9 2.8 2.8 2.7 Privatization proceeds 1.3 0.4 0.1 0.1 0.1 0.1 0.0 0.0 0.0 0.0 0.0 External 0.5 0.1 0.1 0.1 … 0.1 0.0 0.0 0.0 0.0 0.0 Domestic -1.0 0.1 2.1 2.1 … 1.8 2.9 2.9 2.8 2.8 2.7
Financial assets 36.2 29.3 ... 24.2 ... 22.9 22.9 23.5 23.9 24.3 24.5
Financial liabilities 20.1 16.9 ... 16.0 ... 14.7 14.3 14.5 14.3 14.1 13.7 Gross public debt 3/ 15.8 12.4 ... 12.1 ... 11.4 11.5 12.0 12.1 12.1 11.9 External 8.7 7.4 ... 6.3 ... 6.2 6.3 6.6 6.7 7.0 7.1 Domestic 7.1 4.9 ... 5.9 ... 5.2 5.2 5.5 5.4 5.2 4.8
Net financial worth 16.2 12.4 ... 8.2 ... 8.2 8.6 9.0 9.6 10.2 10.8
Memorandum items:Structural fiscal balance 4/ -1.3 -1.8 ... -3.9 ... -3.4 -3.8 -3.5 -3.2 -3.1 -2.9Conventional structural fiscal balance -1.1 -1.4 ... -3.2 ... -2.7 -3.2 -3.0 -2.8 -2.7 -2.7Output gap 5/ 1.1 2.6 ... 2.8 ... 1.9 0.8 0.2 0.0 -0.1 0.0Absorption gap 6/ 2.6 5.8 ... 9.1 ... 8.0 5.8 4.4 3.5 2.8 2.3Fiscal balance (ESA95 basis) 7/ -1.4 -2.2 ... -2.5 -2.4 ... ... ... ... ... ...Nominal GDP (in billions of lei) 288.2 344.5 ... 404.7 ... 488.9 571.5 654.7 734.6 821.4 918.3
Sources: Ministry of Finance; Eurostat; and Fund staff projections.
1/ First budget rectification approved in March 2008.2/ Includes co-financing of EU projects.3/ Excluding public debt guarantees.
5/ Percentage deviation of actual from potential GDP.6/ Percentage deviation between actual absorption and the level consistent with external balance.7/ The significant difference between cash-based and ESA95 fiscal balances in 2006 is mainly due to cancellation of Iraq debt and accrued spending commitments (including by the property compensation fund and local governments).
Table 7b. Romania: General Government Operations and Balance Sheet, 2005–13(In percent of GDP)
Projections, unchanged policies
4/ Actual fiscal balance adjusted for the automatic effects of output gap and absorption gap on the fiscal position. See IMF Country Report No. 07/390, Chapter III for details.
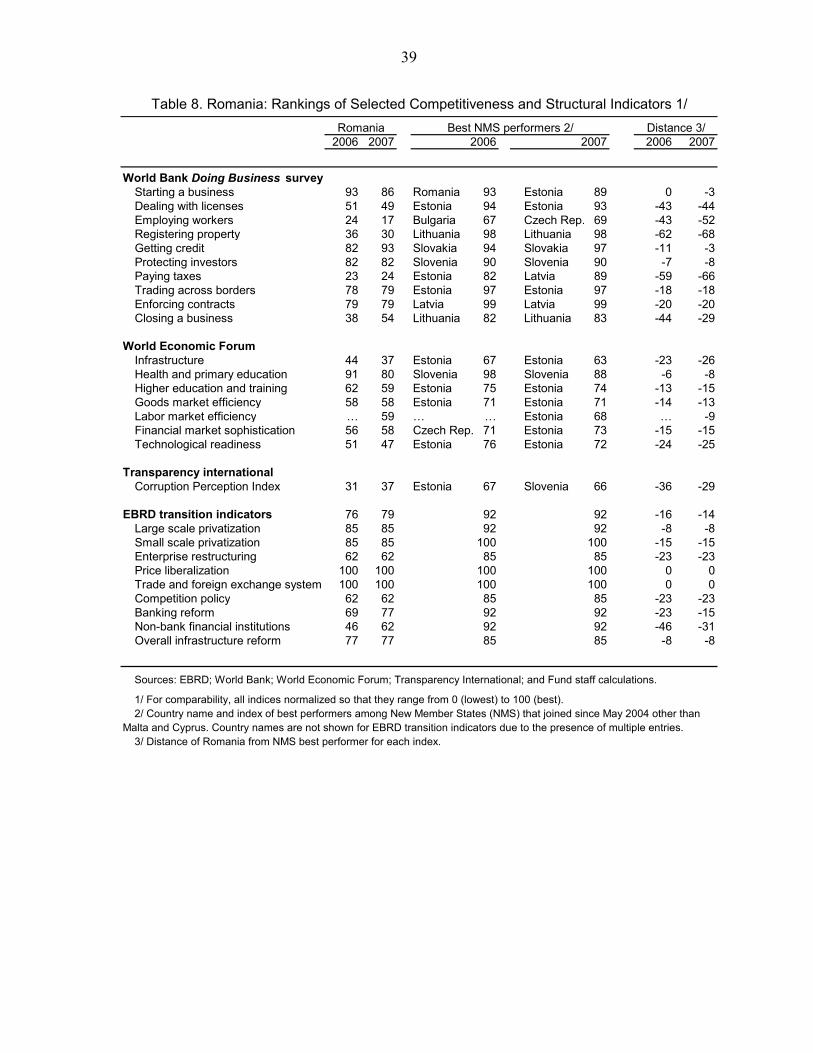
39
2006 2007 2006 2007
World Bank Doing Business surveyStarting a business 93 86 Romania 93 Estonia 89 0 -3Dealing with licenses 51 49 Estonia 94 Estonia 93 -43 -44Employing workers 24 17 Bulgaria 67 Czech Rep. 69 -43 -52Registering property 36 30 Lithuania 98 Lithuania 98 -62 -68Getting credit 82 93 Slovakia 94 Slovakia 97 -11 -3Protecting investors 82 82 Slovenia 90 Slovenia 90 -7 -8Paying taxes 23 24 Estonia 82 Latvia 89 -59 -66Trading across borders 78 79 Estonia 97 Estonia 97 -18 -18Enforcing contracts 79 79 Latvia 99 Latvia 99 -20 -20Closing a business 38 54 Lithuania 82 Lithuania 83 -44 -29
World Economic ForumInfrastructure 44 37 Estonia 67 Estonia 63 -23 -26Health and primary education 91 80 Slovenia 98 Slovenia 88 -6 -8Higher education and training 62 59 Estonia 75 Estonia 74 -13 -15Goods market efficiency 58 58 Estonia 71 Estonia 71 -14 -13Labor market efficiency … 59 … … Estonia 68 … -9Financial market sophistication 56 58 Czech Rep. 71 Estonia 73 -15 -15Technological readiness 51 47 Estonia 76 Estonia 72 -24 -25
Transparency international Corruption Perception Index 31 37 Estonia 67 Slovenia 66 -36 -29
EBRD transition indicators 76 79 92 92 -16 -14Large scale privatization 85 85 92 92 -8 -8Small scale privatization 85 85 100 100 -15 -15Enterprise restructuring 62 62 85 85 -23 -23Price liberalization 100 100 100 100 0 0Trade and foreign exchange system 100 100 100 100 0 0Competition policy 62 62 85 85 -23 -23Banking reform 69 77 92 92 -23 -15Non-bank financial institutions 46 62 92 92 -46 -31Overall infrastructure reform 77 77 85 85 -8 -8
Table 8. Romania: Rankings of Selected Competitiveness and Structural Indicators 1/Romania Distance 3/
2006Best NMS performers 2/
2007
Malta and Cyprus. Country names are not shown for EBRD transition indicators due to the presence of multiple entries.
1/ For comparability, all indices normalized so that they range from 0 (lowest) to 100 (best).
Sources: EBRD; World Bank; World Economic Forum; Transparency International; and Fund staff calculations.
3/ Distance of Romania from NMS best performer for each index.
2/ Country name and index of best performers among New Member States (NMS) that joined since May 2004 other than

40
2005 2006 2007 2008 2009 2010 2011 2012 2013
GDP and prices (annual percent change)Real GDP 4.2 7.9 6.0 6.8 5.8 5.6 5.7 5.8 6.0Real domestic demand (absorption) 8.8 14.5 16.4 9.3 9.9 8.7 8.8 8.5 8.7GDP deflator 12.2 10.8 10.8 13.1 10.5 8.5 6.2 5.7 5.4Domestic demand deflator 8.6 6.1 2.9 10.6 5.8 4.5 2.4 2.4 2.3Consumer price index (CPI, average) 9.0 6.6 4.8 8.2 6.6 5.5 4.0 3.7 3.5Consumer price index (CPI, end of period) 8.6 4.9 6.6 7.9 6.2 4.4 3.8 3.6 3.5Nominal wages 17.0 18.9 22.6 20.5 16.9 13.7 11.5 11.3 11.3
Public sector wages 25.9 27.3 18.5 17.4 14.4 10.3 8.7 8.5 8.4Private sector wages 14.8 16.6 23.7 21.4 17.6 14.6 12.3 12.0 12.0
Real effective exchange rate, CPI based 17.9 7.6 9.0 1.3 6.5 5.5 5.5 4.0 4.0Real effective exchange rate, GDP deflator based 21.4 11.9 15.2 5.9 10.5 8.4 7.7 6.0 5.9
Monetary aggregates (annual percent change)Broad money 36.5 28.1 33.5 36.4 25.7 23.2 20.6 20.3 20.2Domestic credit 43.7 52.0 64.5 32.8 24.9 22.2 20.0 20.1 19.5
Saving and investment (in percent of GDP)Foreign saving 8.9 10.4 14.0 14.4 14.0 13.1 12.4 11.8 11.3Gross national saving 13.7 16.1 15.6 17.1 16.7 17.6 18.1 18.2 18.3
Government 1.8 2.6 1.2 3.2 2.7 2.9 3.0 3.1 3.3Private 11.9 13.5 14.4 13.9 14.0 14.7 15.1 15.1 14.9
Gross domestic investment 22.6 26.5 29.6 31.5 30.7 30.7 30.5 30.1 29.5Government 2.6 3.2 3.6 5.3 5.6 5.8 5.8 5.9 6.0Private 20.0 23.3 26.0 26.2 25.1 24.9 24.6 24.1 23.5
General government (in percent of GDP)Revenue 30.2 31.0 31.4 34.7 35.2 35.3 34.9 35.1 35.4Expenditure 31.0 31.6 33.7 36.8 38.2 38.2 37.8 37.9 38.0Fiscal balance -0.8 -0.6 -2.3 -2.1 -2.9 -2.9 -2.8 -2.8 -2.7Structural fiscal balance 1/ -1.3 -1.8 -3.9 -3.4 -3.8 -3.5 -3.2 -3.1 -2.9Gross public debt 15.8 12.4 12.1 11.4 11.5 12.0 12.1 12.1 11.9
Balance of payments (in percent of GDP)Current account -8.9 -10.4 -14.0 -14.4 -14.0 -13.1 -12.4 -11.8 -11.3
Merchandise trade balance -9.9 -12.0 -14.6 -14.9 -14.4 -13.5 -12.7 -12.2 -11.7Services balance -0.5 0.0 0.2 0.3 0.4 0.5 0.7 0.8 1.0Income balance -2.9 -3.3 -3.6 -3.6 -3.5 -3.7 -3.8 -3.9 -4.0Transfers balance 4.5 5.0 4.0 3.7 3.5 3.5 3.5 3.5 3.5
Capital and financial account balance 15.6 15.7 17.6 16.1 16.8 16.4 15.0 14.4 13.8Foreign direct investment, balance 6.6 8.9 5.9 5.7 5.0 4.5 4.0 4.0 4.0
Memorandum items:Gross international reserves (in billions of euros) 18.2 22.9 26.9 29.3 34.0 40.5 46.5 53.2 60.7Gross international reserves (in months of next year's imports) 5.1 5.0 5.1 4.8 5.0 5.3 5.3 5.3 5.3Net international investment position (in percent of GDP) -29.2 -35.3 -42.1 -49.3 -53.5 -57.3 -60.3 -63.2 -65.2External debt (in percent of GDP) 39.1 42.9 48.5 49.4 49.7 50.8 50.9 51.5 51.4Short-term external debt (in percent of GDP) 8.1 13.7 17.0 18.5 19.3 20.2 20.8 21.3 21.6Merchandise export volume (percent change) 6.1 6.8 8.7 9.0 6.4 8.5 8.5 9.2 9.3Merchandise import volume (percent change) 15.0 22.3 26.1 12.4 12.9 12.1 12.1 12.3 12.7Terms of trade (percent change) 2.8 6.4 5.4 1.9 5.0 5.1 4.9 4.8 4.8Nominal GDP (in billions of lei) 288.2 344.5 404.7 488.9 571.5 654.7 734.6 821.4 918.3
1/ Actual fiscal balance adjusted for the automatic effects of output gap and absorption gap on the fiscal position. See IMF Country Report No. 07/390, Chapter III for details.
Table 9a: Romania: Macroeconomic Framework, Baseline, Unchanged Policies Scenario, 2005–13
Unchanged policies scenario
Sources: Romanian authorities; and Fund staff estimates and projections.
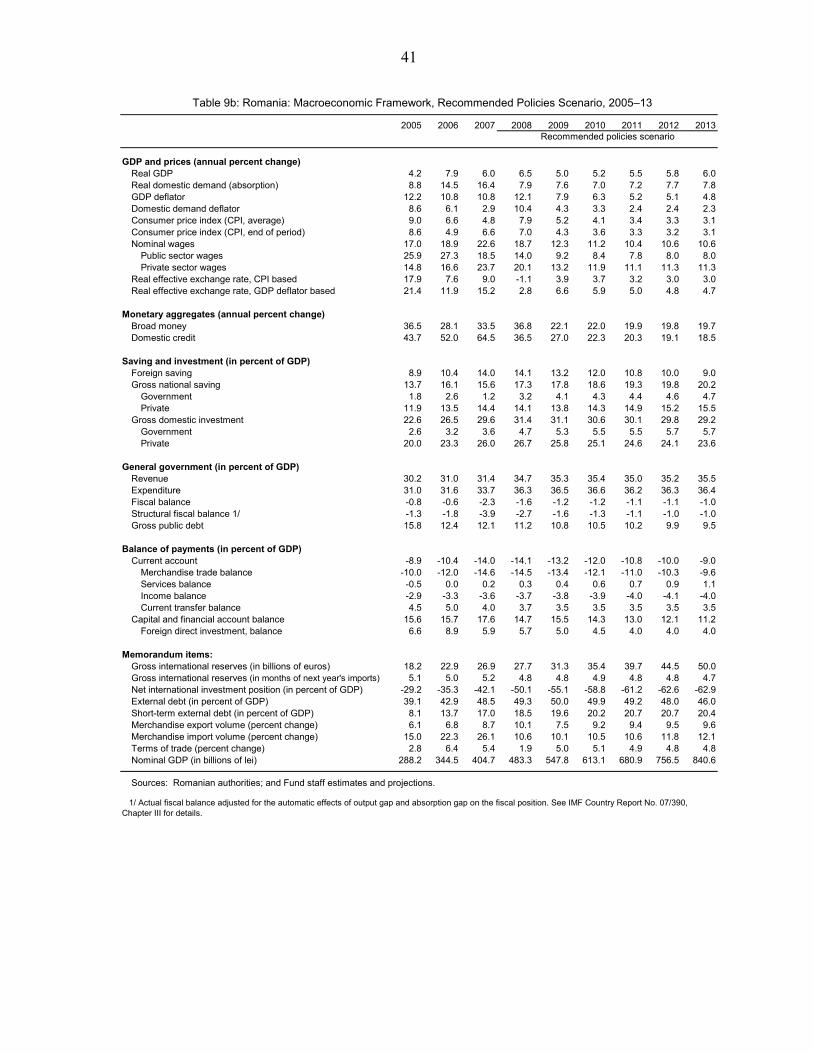
41
2005 2006 2007 2008 2009 2010 2011 2012 2013
GDP and prices (annual percent change)Real GDP 4.2 7.9 6.0 6.5 5.0 5.2 5.5 5.8 6.0Real domestic demand (absorption) 8.8 14.5 16.4 7.9 7.6 7.0 7.2 7.7 7.8GDP deflator 12.2 10.8 10.8 12.1 7.9 6.3 5.2 5.1 4.8Domestic demand deflator 8.6 6.1 2.9 10.4 4.3 3.3 2.4 2.4 2.3Consumer price index (CPI, average) 9.0 6.6 4.8 7.9 5.2 4.1 3.4 3.3 3.1Consumer price index (CPI, end of period) 8.6 4.9 6.6 7.0 4.3 3.6 3.3 3.2 3.1Nominal wages 17.0 18.9 22.6 18.7 12.3 11.2 10.4 10.6 10.6
Public sector wages 25.9 27.3 18.5 14.0 9.2 8.4 7.8 8.0 8.0Private sector wages 14.8 16.6 23.7 20.1 13.2 11.9 11.1 11.3 11.3
Real effective exchange rate, CPI based 17.9 7.6 9.0 -1.1 3.9 3.7 3.2 3.0 3.0Real effective exchange rate, GDP deflator based 21.4 11.9 15.2 2.8 6.6 5.9 5.0 4.8 4.7
Monetary aggregates (annual percent change)Broad money 36.5 28.1 33.5 36.8 22.1 22.0 19.9 19.8 19.7Domestic credit 43.7 52.0 64.5 36.5 27.0 22.3 20.3 19.1 18.5
Saving and investment (in percent of GDP)Foreign saving 8.9 10.4 14.0 14.1 13.2 12.0 10.8 10.0 9.0Gross national saving 13.7 16.1 15.6 17.3 17.8 18.6 19.3 19.8 20.2
Government 1.8 2.6 1.2 3.2 4.1 4.3 4.4 4.6 4.7Private 11.9 13.5 14.4 14.1 13.8 14.3 14.9 15.2 15.5
Gross domestic investment 22.6 26.5 29.6 31.4 31.1 30.6 30.1 29.8 29.2Government 2.6 3.2 3.6 4.7 5.3 5.5 5.5 5.7 5.7Private 20.0 23.3 26.0 26.7 25.8 25.1 24.6 24.1 23.6
General government (in percent of GDP)Revenue 30.2 31.0 31.4 34.7 35.3 35.4 35.0 35.2 35.5Expenditure 31.0 31.6 33.7 36.3 36.5 36.6 36.2 36.3 36.4Fiscal balance -0.8 -0.6 -2.3 -1.6 -1.2 -1.2 -1.1 -1.1 -1.0Structural fiscal balance 1/ -1.3 -1.8 -3.9 -2.7 -1.6 -1.3 -1.1 -1.0 -1.0Gross public debt 15.8 12.4 12.1 11.2 10.8 10.5 10.2 9.9 9.5
Balance of payments (in percent of GDP)Current account -8.9 -10.4 -14.0 -14.1 -13.2 -12.0 -10.8 -10.0 -9.0
Merchandise trade balance -10.0 -12.0 -14.6 -14.5 -13.4 -12.1 -11.0 -10.3 -9.6Services balance -0.5 0.0 0.2 0.3 0.4 0.6 0.7 0.9 1.1Income balance -2.9 -3.3 -3.6 -3.7 -3.8 -3.9 -4.0 -4.1 -4.0Current transfer balance 4.5 5.0 4.0 3.7 3.5 3.5 3.5 3.5 3.5
Capital and financial account balance 15.6 15.7 17.6 14.7 15.5 14.3 13.0 12.1 11.2Foreign direct investment, balance 6.6 8.9 5.9 5.7 5.0 4.5 4.0 4.0 4.0
Memorandum items:Gross international reserves (in billions of euros) 18.2 22.9 26.9 27.7 31.3 35.4 39.7 44.5 50.0Gross international reserves (in months of next year's imports) 5.1 5.0 5.2 4.8 4.8 4.9 4.8 4.8 4.7Net international investment position (in percent of GDP) -29.2 -35.3 -42.1 -50.1 -55.1 -58.8 -61.2 -62.6 -62.9External debt (in percent of GDP) 39.1 42.9 48.5 49.3 50.0 49.9 49.2 48.0 46.0Short-term external debt (in percent of GDP) 8.1 13.7 17.0 18.5 19.6 20.2 20.7 20.7 20.4Merchandise export volume (percent change) 6.1 6.8 8.7 10.1 7.5 9.2 9.4 9.5 9.6Merchandise import volume (percent change) 15.0 22.3 26.1 10.6 10.1 10.5 10.6 11.8 12.1Terms of trade (percent change) 2.8 6.4 5.4 1.9 5.0 5.1 4.9 4.8 4.8Nominal GDP (in billions of lei) 288.2 344.5 404.7 483.3 547.8 613.1 680.9 756.5 840.6
Sources: Romanian authorities; and Fund staff estimates and projections.
1/ Actual fiscal balance adjusted for the automatic effects of output gap and absorption gap on the fiscal position. See IMF Country Report No. 07/390, Chapter III for details.
Table 9b: Romania: Macroeconomic Framework, Recommended Policies Scenario, 2005–13
Recommended policies scenario

42
Appendix I. Debt Sustainability
Proj
ectio
ns20
0320
0420
0520
0620
0720
0820
0920
1020
1120
1220
13D
ebt-s
tabi
lizin
gno
n-in
tere
st
curr
ent a
ccou
nt 6
/B
asel
ine:
Ext
erna
l deb
t33
.735
.839
.142
.948
.549
.449
.750
.850
.951
.551
.4-8
.4
Cha
nge
in e
xter
nal d
ebt
0.4
2.1
3.3
3.8
5.5
0.9
0.3
1.1
0.2
0.5
-0.1
Iden
tifie
d ex
tern
al d
ebt-c
reat
ing
flow
s (4
+8+9
)-1
.4-4
.6-7
.0-5
.6-0
.26.
06.
45.
85.
24.
63.
9C
urre
nt a
ccou
nt d
efic
it, e
xclu
ding
inte
rest
pay
men
ts4.
57.
17.
79.
312
.812
.211
.710
.79.
99.
28.
6D
efic
it in
bal
ance
of g
oods
and
ser
vice
s7.
49.
110
.512
.014
.414
.513
.912
.912
.111
.410
.8Ex
ports
34.7
35.9
32.9
32.1
30.5
30.7
29.2
28.8
28.7
29.2
29.8
Impo
rts
42.1
45.0
43.4
44.1
44.9
45.2
43.1
41.8
40.8
40.6
40.6
Net
non
-deb
t cre
atin
g ca
pita
l inf
low
s (n
egat
ive)
-4.6
-8.4
-7.5
-8.6
-5.9
-5.6
-5.2
-5.0
-4.7
-4.7
-4.7
Auto
mat
ic d
ebt d
ynam
ics
1/-1
.3-3
.2-7
.2-6
.2-7
.1-0
.6-0
.10.
10.
00.
0-0
.1C
ontri
butio
n fro
m n
omin
al in
tere
st ra
te1.
31.
31.
21.
11.
22.
22.
32.
42.
52.
62.
6C
ontri
butio
n fro
m re
al G
DP
grow
th
-1.6
-2.5
-1.1
-2.5
-2.1
-2.8
-2.4
-2.4
-2.5
-2.6
-2.7
Con
tribu
tion
from
pric
e an
d ex
chan
ge ra
te c
hang
es 2
/ -1
.0-2
.1-7
.3-4
.8-6
.2...
......
......
...R
esid
ual,
incl
. cha
nge
in g
ross
fore
ign
asse
ts (2
-3) 3
/1.
86.
710
.49.
45.
8-5
.0-6
.1-4
.7-5
.0-4
.0-3
.9
Exte
rnal
deb
t-to-
expo
rts ra
tio (i
n pe
rcen
t)97
.099
.711
8.7
133.
915
8.7
161.
017
0.3
176.
017
7.5
176.
017
2.3
Gro
ss e
xter
nal f
inan
cing
nee
d (in
bill
ions
of e
uros
) 4/
6.5
9.8
14.0
21.6
35.6
49.7
60.7
72.5
85.3
99.1
112.
9in
per
cent
of G
DP
12.4
16.2
17.6
22.1
29.4
35.4
36.0
37.0
37.6
38.3
38.2
Scen
ario
with
key
var
iabl
es a
t the
ir hi
stor
ical
ave
rage
s 5/
49.4
44.2
39.8
35.3
31.6
28.4
-9.4
Key
Mac
roec
onom
ic A
ssum
ptio
ns U
nder
lyin
g B
asel
ine
Rea
l GD
P gr
owth
(in
perc
ent)
5.2
8.5
4.2
7.9
6.0
6.8
5.8
5.6
5.7
5.8
6.0
GD
P de
flato
r in
euro
s (c
hang
e in
per
cent
)3.
16.
625
.414
.116
.98.
513
.310
.39.
67.
87.
7N
omin
al e
xter
nal i
nter
est r
ate
(in p
erce
nt)
4.4
4.4
4.2
3.5
3.5
5.3
5.6
5.7
5.8
5.8
5.8
Gro
wth
of e
xpor
ts (e
uros
term
s, in
per
cent
)6.
719
.419
.919
.818
.016
.314
.015
.215
.216
.316
.5G
row
th o
f im
ports
(eu
ros
term
s, in
per
cent
)11
.523
.426
.124
.926
.316
.614
.312
.913
.113
.714
.1C
urre
nt a
ccou
nt b
alan
ce, e
xclu
ding
inte
rest
pay
men
ts
-4.5
-7.1
-7.7
-9.3
-12.
8-1
2.2
-11.
7-1
0.7
-9.9
-9.2
-8.6
Net
non
-deb
t cre
atin
g ca
pita
l inf
low
s 4.
68.
47.
58.
65.
95.
65.
25.
04.
74.
74.
7
1/ D
eriv
ed a
s [r
- g -
ρ(1+
g) +
εα(
1+r)]
/(1+g
+ ρ+g
ρ) ti
mes
pre
viou
s pe
riod
debt
sto
ck, w
ith r
= no
min
al e
ffect
ive
inte
rest
rate
on
exte
rnal
deb
t; ρ
= ch
ange
in d
omes
tic G
DP
def
lato
r in
eur
o te
rms,
g =
real
GD
P gr
owth
rate
, ε =
nom
inal
app
reci
atio
n (in
crea
se in
eur
o va
lue
of d
omes
tic c
urre
ncy)
, and
α =
sha
re o
f dom
estic
-cur
renc
y de
nom
inat
ed d
ebt i
n to
tal e
xter
nal d
ebt.
2/ T
he c
ontri
butio
n fro
m p
rice
and
exch
ange
rate
cha
nges
is d
efin
ed a
s [- ρ
(1+g
) + ε
α(1+
r )]/
(1+g
+ ρ+g
ρ) ti
mes
pre
viou
s pe
riod
debt
sto
ck. ρ
incr
ease
s w
ith a
n ap
prec
iatin
g do
mes
tic
curr
ency
(e >
0) a
nd ri
sing
infla
tion
(bas
ed o
n G
DP
def
lato
r).
3/ F
or p
roje
ctio
n, li
ne in
clud
es th
e im
pact
of p
rice
and
exch
ange
rate
cha
nges
.4/
Def
ined
as
curr
ent a
ccou
nt d
efic
it, p
lus
amor
tizat
ion
on m
ediu
m- a
nd lo
ng-te
rm d
ebt,
plus
sho
rt-te
rm d
ebt a
t end
of p
revi
ous
perio
d.
5/ T
he k
ey v
aria
bles
incl
ude
real
GD
P gr
owth
; nom
inal
inte
rest
rate
; eur
o de
flato
r gro
wth
; and
bot
h no
n-in
tere
st c
urre
nt a
ccou
nt a
nd n
on-d
ebt i
nflo
ws
in p
erce
nt o
f GD
P.
6/ L
ong-
run,
con
stan
t bal
ance
that
sta
biliz
es th
e de
bt ra
tio a
ssum
ing
that
key
var
iabl
es (r
eal G
DP
gro
wth
, nom
inal
inte
rest
rate
, eur
o de
flato
r gro
wth
, and
non
-deb
t inf
low
s in
per
cent
of
GD
P) r
emai
n at
thei
r lev
els
of th
e la
st p
roje
ctio
n ye
ar.
Actu
al
Tabl
e 1.
Rom
ania
: Ext
erna
l Deb
t Sus
tain
abilit
y Fr
amew
ork,
200
3-20
13(In
per
cent
of G
DP,
unl
ess
othe
rwis
e in
dica
ted)

43
Gross financing need under baseline (right scale)
Interest rate shock (in percent)
52i-rate shock
51Baseline
30
35
40
45
50
55
60
2003 2005 2007 2009 2011 2013
Romania: External Debt Sustainability: Bound Tests 1/(External debt in percent of GDP)
Sources: International Monetary Fund, Country desk data, and staff estimates.1/ Shaded areas represent actual data. Individuual shocks to (i) interest rate and growth and (ii) non-interest current account are permanent one and one-half standard deviation shocks, respectively. Figures in the boxes represent average projections for the respective variables in the baseline and scenario being presented. Seven-year historical average for the variable is also shown. 2/ Permanent 1/4 standard deviation shocks applied to real interest rate, growth rate, and current account balance.3/ One-time real depreciation of 30 percent occurs in 2009.
Baseline and historical scenarios
28
Historical
51
Baseline
20
25
30
35
40
45
50
55
60
2003 2005 2007 2009 2011 201310
15
20
25
30
35
40
45
50
59
CA shock
51
Baseline
30
35
40
45
50
55
60
2003 2005 2007 2009 2011 2013
Combined shock 2/
56Combined shock
51
Baseline
30
35
40
45
50
55
60
2003 2005 2007 2009 2011 2013
Real depreciation shock 3/
58
30 % depreciation
51Baseline
30
35
40
45
50
55
60
65
70
75
2003 2005 2007 2009 2011 2013
Non-interest current account shock (in percent of GDP)Growth shock (in percent per year)
53Growth shock
51Baseline
30
35
40
45
50
55
60
2003 2005 2007 2009 2011 2013
Baseline:
Scenario:
Historical:
5.86.3
4.2
Baseline:
Scenario:
Historical:
5.84.2
6.1
Baseline:
Scenario:
Historical:
--11.8
-6.8

44
Proj
ectio
ns20
0320
0420
0520
0620
0720
0820
0920
1020
1120
1220
13D
ebt-s
tabi
lizin
gpr
imar
yba
lanc
e 9/
Bas
elin
e: P
ublic
sec
tor d
ebt 1
/25
.718
.815
.812
.412
.111
.411
.512
.012
.112
.111
.9-0
.9o/
w fo
reig
n-cu
rren
cy d
enom
inat
ed13
.110
.18.
87.
26.
66.
06.
46.
46.
76.
97.
1
Cha
nge
in p
ublic
sec
tor d
ebt
-2.7
-6.9
-3.0
-3.5
-0.2
-0.7
0.1
0.5
0.1
0.0
-0.2
Iden
tifie
d de
bt-c
reat
ing
flow
s (4
+7+1
2)-4
.9-6
.0-2
.6-3
.70.
0-0
.11.
21.
51.
51.
51.
4Pr
imar
y de
ficit
0.2
-0.2
-0.3
-0.2
1.7
1.4
2.2
2.2
2.2
2.2
2.1
Rev
enue
and
gra
nts
28.7
30.0
30.2
31.0
31.4
34.7
35.2
35.3
34.9
35.1
35.4
Prim
ary
(non
inte
rest
) exp
endi
ture
28.9
29.8
29.9
30.8
33.1
36.0
37.4
37.4
37.2
37.3
37.5
Auto
mat
ic d
ebt d
ynam
ics
2/-4
.8-5
.2-1
.1-3
.0-1
.6-1
.4-0
.9-0
.7-0
.7-0
.7-0
.7C
ontri
butio
n fro
m in
tere
st ra
te/g
row
th d
iffer
entia
l 3/
-4.6
-3.8
-1.7
-1.8
-1.2
-1.4
-0.9
-0.7
-0.7
-0.7
-0.7
Of w
hich
con
tribu
tion
from
real
inte
rest
rate
-3
.5-2
.1-1
.0-0
.8-0
.5-0
.7-0
.3-0
.1-0
.1-0
.1-0
.1O
f whi
ch c
ontri
butio
n fro
m re
al G
DP
gro
wth
-1.1
-1.7
-0.7
-1.0
-0.6
-0.7
-0.6
-0.6
-0.6
-0.6
-0.7
Con
tribu
tion
from
exc
hang
e ra
te d
epre
ciat
ion
4/-0
.2-1
.40.
6-1
.3-0
.4...
......
......
...O
ther
iden
tifie
d de
bt-c
reat
ing
flow
s-0
.2-0
.6-1
.3-0
.4-0
.1-0
.10.
00.
00.
00.
00.
0Pr
ivat
izat
ion
rece
ipts
(neg
ativ
e)-0
.2-0
.6-1
.3-0
.4-0
.1-0
.10.
00.
00.
00.
00.
0R
ecog
nitio
n of
impl
icit
or c
ontin
gent
liab
ilitie
s0.
00.
00.
00.
00.
00.
00.
00.
00.
00.
00.
0O
ther
(spe
cify
, e.g
. ban
k re
capi
taliz
atio
n)0.
00.
00.
00.
00.
00.
00.
00.
00.
00.
00.
0R
esid
ual,
incl
udin
g as
set c
hang
es (2
-3) 5
/2.
1-0
.9-0
.40.
2-0
.2-0
.6-1
.2-0
.9-1
.4-1
.5-1
.6
Publ
ic s
ecto
r deb
t-to-
reve
nue
ratio
1/
89.8
62.6
52.4
39.8
38.6
32.9
32.6
34.2
34.8
34.6
33.8
Gro
ss fi
nanc
ing
need
6/
3.3
1.8
1.7
1.0
3.0
2.8
3.5
3.5
3.5
3.5
3.4
in b
illion
s of
U.S
. dol
lars
2.0
1.4
1.7
1.3
4.9
5.7
8.7
10.3
12.0
13.8
15.4
Scen
ario
with
key
var
iabl
es a
t the
ir hi
stor
ical
ave
rage
s 7/
11.4
8.7
6.7
4.4
2.5
0.8
-0.1
Scen
ario
with
no
polic
y ch
ange
(con
stan
t prim
ary
bala
nce)
in 2
008-
2013
11.4
10.6
10.6
9.9
9.2
8.5
-0.7
Key
Mac
roec
onom
ic a
nd F
isca
l Ass
umpt
ions
Und
erly
ing
Bas
elin
e
Rea
l GD
P gr
owth
(in
perc
ent)
5.2
8.5
4.2
7.9
6.0
6.8
5.8
5.6
5.7
5.8
6.0
Aver
age
nom
inal
inte
rest
rate
on
publ
ic d
ebt (
in p
erce
nt) 8
/9.
36.
26.
56.
06.
47.
18.
17.
85.
55.
35.
1Av
erag
e re
al in
tere
st ra
te (n
omin
al ra
te m
inus
cha
nge
in G
DP
defla
tor,
in p
erce
nt)
-14.
6-8
.9-5
.7-4
.9-4
.4-6
.0-2
.4-0
.7-0
.7-0
.4-0
.3N
omin
al a
ppre
ciat
ion
(incr
ease
in U
S do
llar v
alue
of l
ocal
cur
renc
y, in
per
cent
)1.
914
.2-6
.219
.46.
5...
......
......
...In
flatio
n ra
te (G
DP
defla
tor,
in p
erce
nt)
24.0
15.0
12.2
10.8
10.8
13.1
10.5
8.5
6.2
5.7
5.4
Gro
wth
of r
eal p
rimar
y sp
endi
ng (d
efla
ted
by G
DP
defla
tor,
in p
erce
nt)
3.8
12.1
4.5
11.2
13.7
16.4
9.7
5.7
5.0
6.2
6.4
Prim
ary
defic
it0.
2-0
.2-0
.3-0
.21.
71.
42.
22.
22.
22.
22.
1
1/ In
dica
te c
over
age
of p
ublic
sec
tor,
e.g.
, gen
eral
gov
ernm
ent o
r non
finan
cial
pub
lic s
ecto
r. A
lso
whe
ther
net
or g
ross
deb
t is
used
.2/
Der
ived
as
[(r -
π(1+
g) -
g +
αε(1
+r)]/
(1+g
+π+g
π)) t
imes
pre
viou
s pe
riod
debt
ratio
, with
r =
inte
rest
rate
; π =
gro
wth
rate
of G
DP
defla
tor;
g =
real
GD
P gr
owth
rate
; α =
sha
re o
f for
eign
-cur
renc
y de
nom
inat
ed d
ebt;
and
ε =
nom
inal
exc
hang
e ra
te d
epre
ciat
ion
(mea
sure
d by
incr
ease
in lo
cal c
urre
ncy
valu
e of
U.S
. dol
lar)
.3/
The
real
inte
rest
rate
con
tribu
tion
is d
eriv
ed fr
om th
e de
nom
inat
or in
foot
note
2/ a
s r -
π (1
+g) a
nd th
e re
al g
row
th c
ontri
butio
n as
-g.
4/ T
he e
xcha
nge
rate
con
tribu
tion
is d
eriv
ed fr
om th
e nu
mer
ator
in fo
otno
te 2
/ as
αε(
1+r).
5/
For
pro
ject
ions
, thi
s lin
e in
clud
es e
xcha
nge
rate
cha
nges
.6/
Def
ined
as
publ
ic s
ecto
r def
icit,
plu
s am
ortiz
atio
n of
med
ium
and
long
-term
pub
lic s
ecto
r deb
t, pl
us s
hort-
term
deb
t at e
nd o
f pre
viou
s pe
riod.
7/
The
key
var
iabl
es in
clud
e re
al G
DP
grow
th; r
eal i
nter
est r
ate;
and
prim
ary
bala
nce
in p
erce
nt o
f GD
P.
8/ D
eriv
ed a
s no
min
al in
tere
st e
xpen
ditu
re d
ivid
ed b
y pr
evio
us p
erio
d de
bt s
tock
.9/
Ass
umes
that
key
var
iabl
es (r
eal G
DP
gro
wth
, rea
l int
eres
t rat
e, a
nd o
ther
iden
tifie
d de
bt-c
reat
ing
flow
s) re
mai
n at
the
leve
l of t
he la
st p
roje
ctio
n ye
ar.
Actu
al
Tabl
e 2.
Cou
ntry
: Pub
lic S
ecto
r Deb
t Sus
tain
abilit
y Fr
amew
ork,
200
3-20
13(In
per
cent
of G
DP,
unl
ess
othe
rwis
e in
dica
ted)

45
Primary balance shock (in percent of GDP) andno policy change scenario (constant primary balance)Growth shock (in percent per year)
20
Growth shock
12Baseline
0
5
10
15
20
25
30
2003 2005 2007 2009 2011 2013
15PB shock
12
Baseline
8
0
5
10
15
20
25
30
2003 2005 2007 2009 2011 2013
Interest rate shock (in percent)
14i-rate shock
12Baseline
0
5
10
15
20
25
30
2003 2005 2007 2009 2011 2013
Romania: Public Debt Sustainability: Bound Tests 1/ (Public debt in percent of GDP)
Sources: International Monetary Fund, country desk data, and staff estimates.1/ Shaded areas represent actual data. Individual shocks are permanent one standard deviation shocks. Figures in the boxes represent average projections for the respective variables in the baseline and scenario being presented. Seven-year historical average for the variable is also shown.2/ Permanent 1/4 standard deviation shocks applied to real interest rate, growth rate, and primary balance.3/ One-time real depreciation of 30 percent and 10 percent of GDP shock to contingent liabilities occur in 2009, with real depreciation defined as nominal depreciation (measured by percentage fall in dollar value of local currency) minus domestic inflation (based on GDP deflator).
Baseline and historical scenarios
Historical
1
Baseline
12
0
5
10
15
20
25
30
2003 2005 2007 2009 2011 20130
1
2
3
4
5
6
7
8
Combined shock 2/
13Combined
shock
12Baseline
0
5
10
15
20
25
30
2003 2005 2007 2009 2011 2013
1912
Baseline
23
0
5
10
15
20
25
30
2003 2005 2007 2009 2011 2013
Contingent liabilities shock30%
depreciation
Real depreciation shock 3/
Gross financing need under baseline (right scale)
No policy change
Baseline: -2.2Scenario: -2.9Historical: 0.0
Baseline: 5.8Scenario: 4.2Historical: 6.1
Baseline: -0.9Scenario: 4.1Historical: -9.2
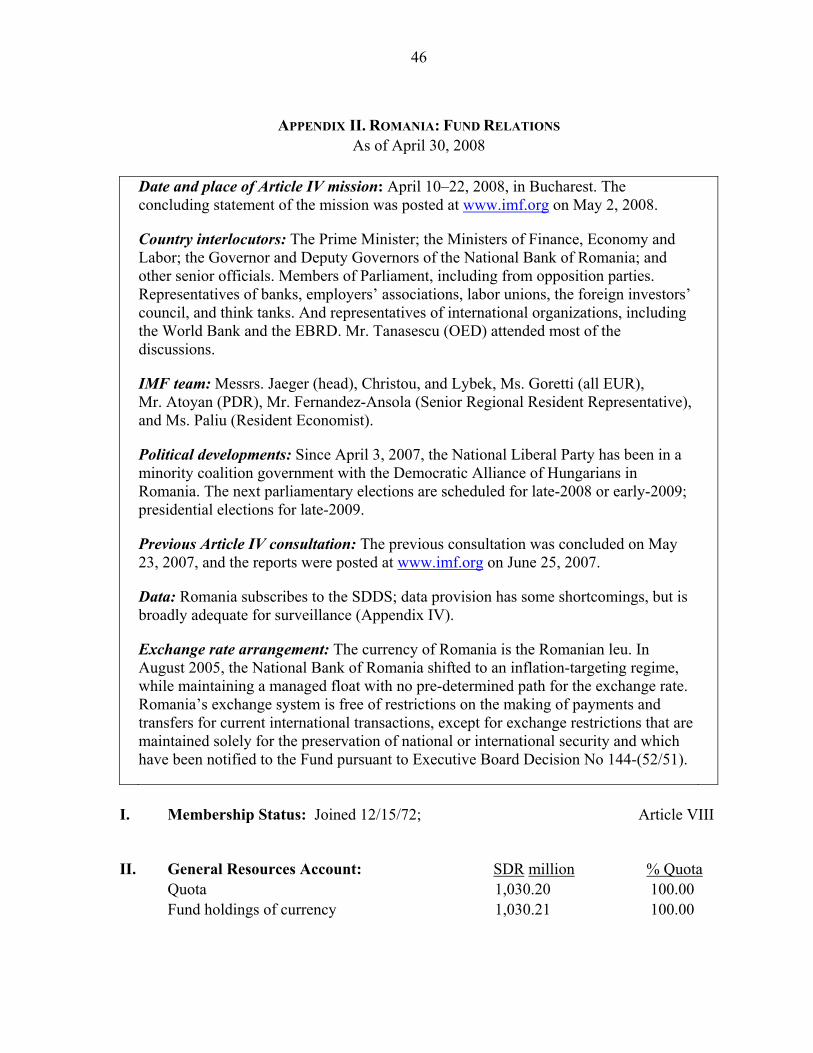
46
APPENDIX II. ROMANIA: FUND RELATIONS
As of April 30, 2008
Date and place of Article IV mission: April 10–22, 2008, in Bucharest. The concluding statement of the mission was posted at www.imf.org on May 2, 2008.
Country interlocutors: The Prime Minister; the Ministers of Finance, Economy and Labor; the Governor and Deputy Governors of the National Bank of Romania; and other senior officials. Members of Parliament, including from opposition parties. Representatives of banks, employers’ associations, labor unions, the foreign investors’ council, and think tanks. And representatives of international organizations, including the World Bank and the EBRD. Mr. Tanasescu (OED) attended most of the discussions.
IMF team: Messrs. Jaeger (head), Christou, and Lybek, Ms. Goretti (all EUR), Mr. Atoyan (PDR), Mr. Fernandez-Ansola (Senior Regional Resident Representative), and Ms. Paliu (Resident Economist).
Political developments: Since April 3, 2007, the National Liberal Party has been in a minority coalition government with the Democratic Alliance of Hungarians in Romania. The next parliamentary elections are scheduled for late-2008 or early-2009; presidential elections for late-2009.
Previous Article IV consultation: The previous consultation was concluded on May 23, 2007, and the reports were posted at www.imf.org on June 25, 2007.
Data: Romania subscribes to the SDDS; data provision has some shortcomings, but is broadly adequate for surveillance (Appendix IV).
Exchange rate arrangement: The currency of Romania is the Romanian leu. In August 2005, the National Bank of Romania shifted to an inflation-targeting regime, while maintaining a managed float with no pre-determined path for the exchange rate. Romania’s exchange system is free of restrictions on the making of payments and transfers for current international transactions, except for exchange restrictions that are maintained solely for the preservation of national or international security and which have been notified to the Fund pursuant to Executive Board Decision No 144-(52/51).
I. Membership Status: Joined 12/15/72; Article VIII
II. General Resources Account: SDR million % Quota Quota 1,030.20 100.00 Fund holdings of currency 1,030.21 100.00

47
III. SDR Department: SDR million % Allocation Net cumulative allocation 75.95 100.00 Holdings 79.03 104.05 IV. Outstanding Purchases and Loans: None V. Financial Arrangements: Expira- Amount Amount Approval tion Approved Drawn Type Date Date (SDR million) (SDR million) Stand-By 07/07/04 07/06/06 250.00 0.00 Stand-By 10/31/01 10/15/03 300.00 300.00 Stand-By 08/05/99 02/28/01 400.00 139.75 Stand-By 04/22/97 05/21/98 301.50 120.60 Stand-By 05/11/94 04/22/97 320.50 94.27 Stand-By 05/29/92 03/28/93 314.04 261.70 Stand-By 04/11/91 04/10/92 380.50 318.10 VI. Projected Payments to Fund (Expectations Basis)5 (SDR million; based on existing use of resources and present holdings of SDRs):
Forthcoming 2008 2009 2010 2011 2012
Principal Charges/interest 0.21 0.00 0.00 0.00 0.00 Total 0.21 0.00 0.00 0.00 0.00 VII. Implementation of HIPC Initiative: Not Applicable VIII. Implementation of Multilateral Debt Relief Initiative (MDRI): Not Applicable IX. Technical Assistance The transition in Romania has been supported by substantial technical assistance from multilateral agencies and bilateral donors. The Fund has provided support in a number of areas with more than 40 technical assistance missions since 1990, although the authorities
5 This schedule presents all currently scheduled payments to the IMF, including repayment expectations where applicable and repayment obligations otherwise. The IMF Executive Board can extend repayment expectations (within predetermined limits) upon request by the debtor country if its external payments position is not strong enough to meet the expectations without undue hardship or risk.

48
have had a mixed record with regard to implementation. Expert Fund assistance has focused on a number of key areas, including: fiscal reforms; modernization of the central bank and the banking system; creating a market-oriented legal structure; training; and improving the collection and reporting of statistics. The implementation of a comprehensive tax administration reform designed in line with the recommendations of several technical assistance missions of the Fund’s Fiscal Affairs Department started in January 2003. A report on the observance of standards and codes (ROSC) on fiscal transparency was completed on November 6, 2002 (IMF Country Report No. 02/254). In 2003 an FSAP was completed, and an FSAP Update is tentatively scheduled for November 2008. Furthermore, technical assistance by the Fund’s Monetary and Capital Markets Department on inflation targeting is ongoing. X. Anti-Money Laundering and Combating the Financing of Terrorism framework
The legislative framework for anti-money laundering and combating the financing of terrorism (AML/CFT) has been recently updated to bring Romania in line with international standards and to fulfill the requirements set forth by the third EU directive on AML/CFT. Obligations have been introduced for reporting entities to ascertain beneficial ownership of client accounts and to carry out enhanced due diligence for high-risk customers, such as in the case of politically exposed persons. The supervisory framework has been extended to cover certain non-financial businesses and professions. The level of AML supervision of the banking sector has improved, and the NBR appears to be taking this issue seriously. The authorities have also started to undertake more inspections of the financial sector at large and on the non financial sector (including casinos, a sector that had been pointed out in the past as particularly vulnerable to money laundering risks). Romania recently underwent an AML/CFT mutual evaluation conducted by MONEYVAL, and the report is expected to be approved at the forthcoming MONEYVAL Plenary (July 2008). The authorities should ensure the effective implementation of the new AML/CFT provisions and continue to focus on supervision of the financial sector at large as well as of casinos and bureaus de change. XI. Resident Representative
The Fund has had a resident representative in Bucharest since 1991. Mr. Juan Jose Fernandez-Ansola assumed the post of senior regional resident representative in September 2006.

49
APPENDIX III. ROMANIA: IMF-WORLD BANK RELATIONS
A. Partnership in Romania’s Development Strategy
1. The World Bank has taken the lead in the policy dialogue on structural and institutional reforms aimed at Romania’s successful EU integration and convergence. Reforms include private and financial sector development, institution building and governance. The World Bank has several sector investment operations, economic work such as the Municipal Finance Policy Note and the Public Expenditure and Institutions Review, and commitments through the International Finance Corporation (IFC). Policy areas where the Bank leads and which are not directly incorporated into the IMF country dialogue include strengthening the social safety nets, revitalizing the economy in rural areas, institution building and governance, and improving the business environment.
2. The Bank’s analysis is shared with the IMF and is used as input to the fiscal framework, including structural reform measures which have important fiscal implications, such as energy sector reform and restructuring. There are further areas of formal joint responsibility such as the Financial Sector Assessment Program (FSAP).
3. Overall the IMF and World Bank staff maintain a close collaborative relationship in supporting the Government’s reform program and are coordinating their policy advice to the Romanian authorities.
B. IMF-World Bank Collaboration in Specific Areas
4. Financial Sector. The Bank and the IMF jointly conducted a FSAP for Romania which was completed in June 2003. The FSAP provided a shared perspective on the development agenda of the country and on the prioritization and sequencing of reforms in the financial sector. An update on the FSAP is tentatively scheduled for November 2008.
5. Municipal finance reform. The Bank has led the dialogue on municipal finance reform by preparing a Policy Note on the legal and regulatory reforms for municipal finance, including a detailed assessment of the deficiencies of the legal and regulatory framework for municipal borrowing and municipal bond issuance.
6. Energy sector. The Bank has also led the dialogue on restructuring, reform and eventual privatization of enterprises in the electricity, district heating and gas industries and on the adoption of regulatory legislation in preparation for privatization to strategic investors. As part of this process the Bank is supporting, inter alia, energy tariff reforms and reforms in the electricity, district heat and gas sectors. These objectives are woven into the policy conditions of the Programmatic Adjustment Loan (PAL) program, along with conditions related to the privatization of electricity distribution enterprises. These conditions have been closely coordinated with the IMF. The dialogue with the Government is focused on such critical long-term issues as restructuring of power generation and the integration of the
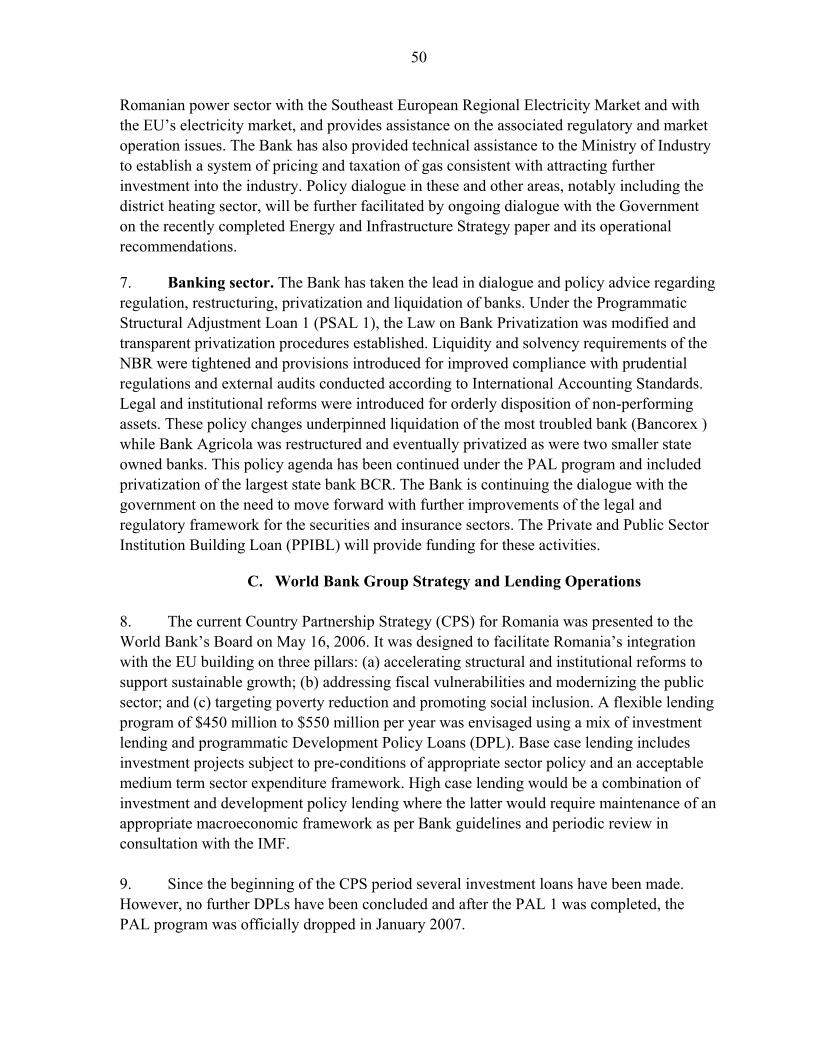
50
Romanian power sector with the Southeast European Regional Electricity Market and with the EU’s electricity market, and provides assistance on the associated regulatory and market operation issues. The Bank has also provided technical assistance to the Ministry of Industry to establish a system of pricing and taxation of gas consistent with attracting further investment into the industry. Policy dialogue in these and other areas, notably including the district heating sector, will be further facilitated by ongoing dialogue with the Government on the recently completed Energy and Infrastructure Strategy paper and its operational recommendations.
7. Banking sector. The Bank has taken the lead in dialogue and policy advice regarding regulation, restructuring, privatization and liquidation of banks. Under the Programmatic Structural Adjustment Loan 1 (PSAL 1), the Law on Bank Privatization was modified and transparent privatization procedures established. Liquidity and solvency requirements of the NBR were tightened and provisions introduced for improved compliance with prudential regulations and external audits conducted according to International Accounting Standards. Legal and institutional reforms were introduced for orderly disposition of non-performing assets. These policy changes underpinned liquidation of the most troubled bank (Bancorex ) while Bank Agricola was restructured and eventually privatized as were two smaller state owned banks. This policy agenda has been continued under the PAL program and included privatization of the largest state bank BCR. The Bank is continuing the dialogue with the government on the need to move forward with further improvements of the legal and regulatory framework for the securities and insurance sectors. The Private and Public Sector Institution Building Loan (PPIBL) will provide funding for these activities.
C. World Bank Group Strategy and Lending Operations 8. The current Country Partnership Strategy (CPS) for Romania was presented to the World Bank’s Board on May 16, 2006. It was designed to facilitate Romania’s integration with the EU building on three pillars: (a) accelerating structural and institutional reforms to support sustainable growth; (b) addressing fiscal vulnerabilities and modernizing the public sector; and (c) targeting poverty reduction and promoting social inclusion. A flexible lending program of $450 million to $550 million per year was envisaged using a mix of investment lending and programmatic Development Policy Loans (DPL). Base case lending includes investment projects subject to pre-conditions of appropriate sector policy and an acceptable medium term sector expenditure framework. High case lending would be a combination of investment and development policy lending where the latter would require maintenance of an appropriate macroeconomic framework as per Bank guidelines and periodic review in consultation with the IMF. 9. Since the beginning of the CPS period several investment loans have been made. However, no further DPLs have been concluded and after the PAL 1 was completed, the PAL program was officially dropped in January 2007.
51
10. The World Bank has been active in Romania since 1991, and the portfolio is now the largest in the ECA Region in terms of number of projects and third largest in commitments. While the portfolio grew rapidly between 2004 and 2007, in the run-up to EU accession, no new projects are currently planned. The current IBRD and GEF portfolio consists of 23 projects with aggregate net commitments totaling $1.785 billion and a total undisbursed balance of $1.27 billion. Sector composition in terms of net commitments is dominated by environment and socially sustainable development (35 percent, 12 projects), and energy and infrastructure (39 percent, 5 projects), followed by the social sectors (14 percent, four projects).
11. Implementation of projects in the Bank’s Romania portfolio has slowed in recent years. In FY06 and FY07 Romania’s annual disbursement ratio fell below its 16 percent historical average and from a peak of 27 percent in FY03. Today, 86 percent of the portfolio’s net commitments have been approved in the last four FYs, and three-fourths of them are less than three years old. Given that new loans typically do not start disbursing very much during the first two years following loan approval, this accounts for some of the portfolio disbursement slowdown, while other delays are attributable to implementation delays, policy changes or delays and financing gaps. The Bank and the Government are working together to address this issue.
12. IFC has dedicated substantial resources to assist the development of capital markets and infrastructure (utilities and telecommunication), and provide support for small and medium enterprises (SMEs). To date, IFC has committed over US$772 million of its own funds in 42 projects and has arranged over $241 million in syndications to support projects in the financial markets, information technology, food and beverage, general manufacturing, health care and infrastructure. In addition to investments, IFC has undertaken a number of advisory assignments aimed at supporting the privatization and restructuring of large state-owned enterprises, public utilities and the health sector.
Questions may be referred to Ivailo Izvorski (458-8807) or Penny Williams (458-5342)
52
APPENDIX IV. ROMANIA: STATISTICAL ISSUES
1. Data provided to the Fund have some shortcomings, but are broadly adequate for surveillance. The quality of the national accounts, price, fiscal, and balance of payments data still needs improvement. The authorities have made progress in improving economic and financial statistics with technical assistance, including from the Fund, over the past several years. Romania began participating in the GDDS in February 2001 and graduated to subscription to the SDDS in May 2005.
Real Sector 2. Quarterly and annual national accounts statistics are produced by the National Institute for Statistics (INS) using the European System of Accounts 1995 (ESA95). Estimates are methodologically sound and are reported to the Fund on a timely basis for publication in the International Financial Statistics (IFS). However, quarterly and annual national accounts are not harmonized on a regular basis and late revisions have sometimes been significant. Provisional and semi-final versions are disseminated in the Statistical Yearbook and other publications, as well as on the web (www.insse.ro).
3. The Consumer Price Index is subject to standard annual re-weighting, and is considered reliable. In January 2004, the INS changed the coverage of the Producer Price Index to include the domestic and export sectors.
4. There are still deficiencies in labor market statistics that hamper the assessment of developments in employment and wages, as well as their consistency and comparability with labor statistics from other countries in the region. In order to address these shortcomings, the INS (i) is addressing the reporting coverage of private sector wages, especially in the construction sector; (ii) has started including ad hoc bonuses in the public-sector wage series, although only as from 2007; (iii) is working on a new definition of employment consistent with ESA 95.
Public Finance 5. Annual GFS data are reported on an accrual basis derived from cash data using various adjustment methods. Tax revenues are adjusted using the time-adjusted cash method; expense data are adjusted using due-for-payments data; and, interest payments are calculated on an accrual basis. Beginning in 2002, the Special Fund for Development of the Energy System, the Special Fund for Public Roads, the Special Fund “Romanian Agriculture Development,” and the Special Fund “Romania” were included in the state budget, while the Special Fund for Insured Protection was eliminated from general government accounts. The

53
reported data excluded data on the Agency for Recovery Bank Assets.6 EUR receives monthly budget data. The authorities introduced a new budget classification for the 2006 budget and have also produced the 2004-05 budget outturns on the basis of the new classification.
6. Consolidated data on central government operations are reported for inclusion in the GFS Yearbook, albeit with a significant lag. Consolidated general government data were reported for the first time for inclusion in the 2005 GFS Yearbook.
Monetary and Financial 7. Monetary statistics need to be reconciled with government finance statistics. In line with 1993 SNA and MFSM, accrued interest on deposits and loans, and securities other than shares should be incorporated in the corresponding outstanding amount of the financial instrument.
8. The National Bank of Romania (NBR) reports monetary and financial statistics on a regular and timely basis for publication in the IFS. Since December 2004, the NBR reports monetary data to STA using the Standardized Report Forms (SRFs). The data are being published in the IFS Supplement, beginning September 2006. Romania’s data and metadata for financial soundness indicators are posted on the IMF’s website (http://www.imf.org/external/np/sta/fsi/eng/cce/index.htm).
Balance of Payments 9. The NBR routinely reports balance of payments statistics to the Fund in a timely fashion. A 2003 STA mission undertook a detailed review of the NBR’s compilation methodology for balance of payments and international investment position statistics, developed in consultation with Eurostat, and concluded that the proposed system is broadly appropriate. The STA mission supported implementation of this compilation system in 2004, along with a new FDI survey.
6 Formerly, the Agency for Bank Asset Recovery and the Authority for Privatization and Management of State Ownership.

54
ROMANIA: TABLE OF COMMON INDICATORS REQUIRED FOR SURVEILLANCE (AS OF MAY 23, 2008)
Date of latest
observation
Date received
Frequency of
Data6
Frequency of Reporting6
Frequency of Publication6
Exchange Rates Mar.2008 Apr.2008 D and M D and M D and M
International Reserve Assets and Reserve Liabilities of the Monetary Authorities1
Mar. 2008 Apr. 2008 D and M W and M M
Reserve/Base Money Mar. 2008 May 2008 D and M W and M M
Broad Money Mar. 2008 May 2008 M M M
Central Bank Balance Sheet Mar. 2008 May 2008 M M M
Consolidated Balance Sheet of the Banking System
Mar. 2008 May 2008 M M M
Interest Rates2 Mar. 2008 Apr. 2008 M M M
Consumer Price Index Mar. 2008 Apr. 2008 M M M
Revenue, Expenditure, Balance and Composition of Financing3 – General Government4
Dec. 2007
Feb. 2008
M
M
M
Revenue, Expenditure, Balance and Composition of Financing3– Central Government
Jan. 2008
Feb. 2008
M
M
M
Stocks of Central Government and Central Government-Guaranteed Debt5
Dec. 2007 Feb. 2008 M M M
External Current Account Balance Dec. 2007 Jan. 2008 M M Q
Exports and Imports of Goods and Services Jun. 2007 Jan. 2008 M M M
GDP/GNP Q4 2007 Mar. 2008 Q Q Q
Gross External Debt Dec. 2007 Feb. 2008 M M Q
International Investment Position 7 Q1 2008 May 2008 Q Q Q
1 Includes reserve assets pledged or otherwise encumbered as well as net derivative positions. 2 Both market-based and officially-determined, including discount rates, money market rates, rates on treasury bills, notes and bonds. 3 Foreign, domestic bank, and domestic non-bank financing. 4 The general government consists of the central government (budgetary funds, extra budgetary funds, and social security funds), and state and local governments. 5 Including currency and maturity composition.
6 Daily (D), weekly (W), monthly (M), quarterly (Q), annually (A), irregular (I); and not available (NA). 7 Includes external gross financial asset and liability positions vis-à-vis nonresidents.

International Monetary Fund 700 19th Street, NW Washington, D. C. 20431 USA
Public Information Notice (PIN) No. 08/76 FOR IMMEDIATE RELEASE June 27, 2008
IMF Executive Board Concludes 2008 Article IV Consultation with Romania
On June 25, 2008, the Executive Board of the International Monetary Fund (IMF) concluded the Article IV consultation with Romania.1 Background Underpinned by massive capital inflows, GDP growth has remained strong. In 2007, real GDP grew by 6 percent, but agriculture was adversely affected by a drought (non-agricultural output expanded at a robust 7.4 percent). Despite healthy export growth, the current-account deficit widened markedly from 10.4 percent of GDP in 2006 to 14 percent of GDP in 2007, reflecting booming domestic demand, strong credit growth, and procyclical fiscal and incomes policies. The fiscal deficit (cash basis) in 2007 increased to 2¼ percent of GDP, sharply up from a deficit of ½ percent of GDP. The government has reduced its original fiscal deficit target for 2008 to close to 2 percent of GDP. Higher agricultural and energy prices as well as excess demand contributed to more than a doubling of headline inflation from May 2007 (3.8 percent, year-on-year) to May 2008 (8.5 percent, year-on-year). The exchange rate depreciated sharply after the turmoil in international financial markets started in August 2007, but has stabilized since February 2008. In response to inflation rising well above its target range, the National Bank of Romania (NBR) increased its policy rate several times from October (7.0 percent) to May (9.75 percent).
1 Under Article IV of the IMF's Articles of Agreement, the IMF holds bilateral discussions with members, usually every year. A staff team visits the country, collects economic and financial information, and discusses with officials the country's economic developments and policies. On return to headquarters, the staff prepares a report, which forms the basis for discussion by the Executive Board. At the conclusion of the discussion, the Managing Director, as Chairman of the Board, summarizes the views of Executive Directors, and this summary is transmitted to the country's authorities.
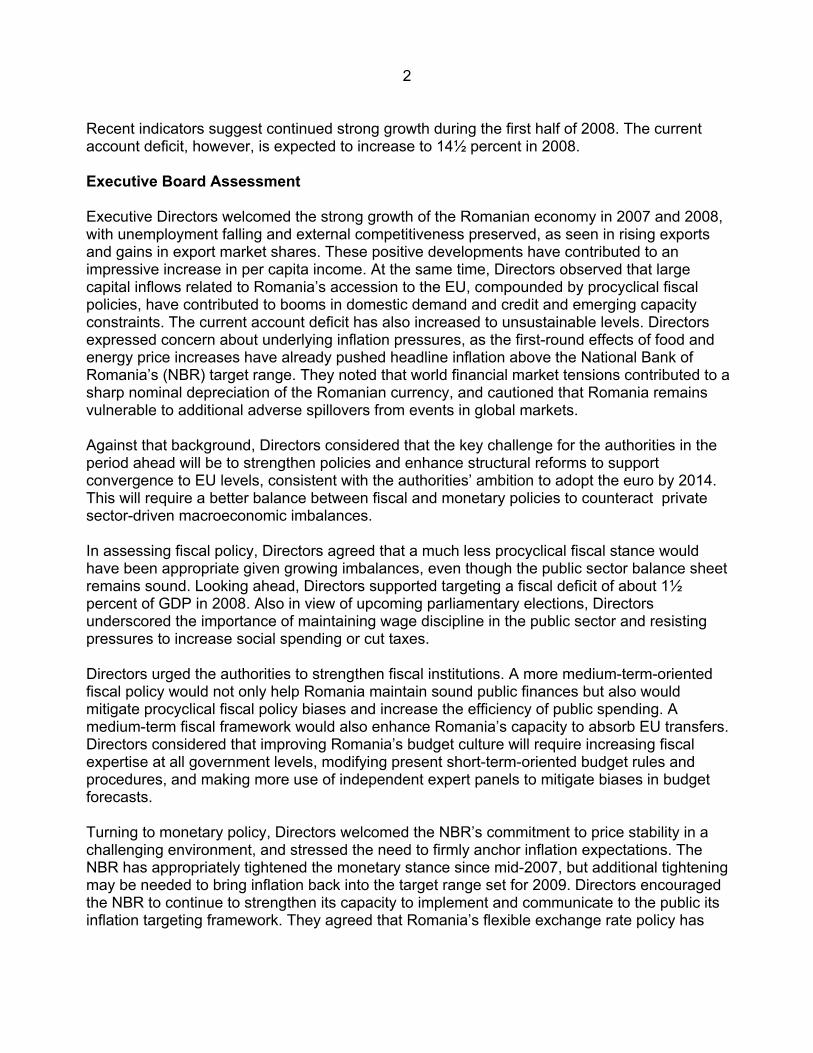
2 Recent indicators suggest continued strong growth during the first half of 2008. The current account deficit, however, is expected to increase to 14½ percent in 2008. Executive Board Assessment Executive Directors welcomed the strong growth of the Romanian economy in 2007 and 2008, with unemployment falling and external competitiveness preserved, as seen in rising exports and gains in export market shares. These positive developments have contributed to an impressive increase in per capita income. At the same time, Directors observed that large capital inflows related to Romania’s accession to the EU, compounded by procyclical fiscal policies, have contributed to booms in domestic demand and credit and emerging capacity constraints. The current account deficit has also increased to unsustainable levels. Directors expressed concern about underlying inflation pressures, as the first-round effects of food and energy price increases have already pushed headline inflation above the National Bank of Romania’s (NBR) target range. They noted that world financial market tensions contributed to a sharp nominal depreciation of the Romanian currency, and cautioned that Romania remains vulnerable to additional adverse spillovers from events in global markets. Against that background, Directors considered that the key challenge for the authorities in the period ahead will be to strengthen policies and enhance structural reforms to support convergence to EU levels, consistent with the authorities’ ambition to adopt the euro by 2014. This will require a better balance between fiscal and monetary policies to counteract private sector-driven macroeconomic imbalances. In assessing fiscal policy, Directors agreed that a much less procyclical fiscal stance would have been appropriate given growing imbalances, even though the public sector balance sheet remains sound. Looking ahead, Directors supported targeting a fiscal deficit of about 1½ percent of GDP in 2008. Also in view of upcoming parliamentary elections, Directors underscored the importance of maintaining wage discipline in the public sector and resisting pressures to increase social spending or cut taxes. Directors urged the authorities to strengthen fiscal institutions. A more medium-term-oriented fiscal policy would not only help Romania maintain sound public finances but also would mitigate procyclical fiscal policy biases and increase the efficiency of public spending. A medium-term fiscal framework would also enhance Romania’s capacity to absorb EU transfers. Directors considered that improving Romania’s budget culture will require increasing fiscal expertise at all government levels, modifying present short-term-oriented budget rules and procedures, and making more use of independent expert panels to mitigate biases in budget forecasts. Turning to monetary policy, Directors welcomed the NBR’s commitment to price stability in a challenging environment, and stressed the need to firmly anchor inflation expectations. The NBR has appropriately tightened the monetary stance since mid-2007, but additional tightening may be needed to bring inflation back into the target range set for 2009. Directors encouraged the NBR to continue to strengthen its capacity to implement and communicate to the public its inflation targeting framework. They agreed that Romania’s flexible exchange rate policy has

3 served the country well, operating as a self-correcting mechanism during the current imbalances. Directors took note of the staff assessment that the real effective exchange rate is close to its equilibrium level. Directors were encouraged by the authorities’ efforts to manage proactively and contain the present financial stability risks, as evidenced by the rising level of nonperforming loans and shrinking capital and liquidity buffers during a period of rapid credit growth. They welcomed recent measures to raise provisioning for unhedged foreign exchange borrowing and to require banks to improve their liquidity management. Additional preemptive measures to increase cushions for more risky credit exposures may be needed, particularly in the real estate sector. Directors welcomed the authorities’ commitment to conduct an Financial Sector Assessment Program update later this year. Directors recommended that structural reform efforts be relaunched to support per capita income convergence to EU levels. Foreign investor interest in Romania remains strong, but looming structural bottlenecks will need to be addressed if this interest is to be preserved or even expanded. Further emphasis will need to be placed on structural reforms with a view to raising energy efficiency, developing public infrastructure, liberalizing further the labor markets, and strengthening the judicial system.
Public Information Notices (PINs) form part of the IMF's efforts to promote transparency of the IMF's views and analysis of economic developments and policies. With the consent of the country (or countries) concerned, PINs are issued after Executive Board discussions of Article IV consultations with member countries, of its surveillance of developments at the regional level, of post-program monitoring, and of ex post assessments of member countries with longer-term program engagements. PINs are also issued after Executive Board discussions of general policy matters, unless otherwise decided by the Executive Board in a particular case.

Romania: Selected Economic and Social Indicators, 2005–09
2005 2006 2007
2008 Proj.
2009 Proj.
Output, prices and labor market (Annual percentage change) Real GDP 4.2 7.9 6.0 6.8 5.8 Real GDP excluding agricultural sector 6.4 7.6 7.4 6.5 5.6 Real domestic demand (absorption) 8.8 14.5 16.4 9.3 9.9 Consumer price index (CPI, average) 9.0 6.6 4.8 8.2 6.6 Consumer price index (CPI, end of period) 8.6 4.9 6.6 7.9 6.2 Employment -0.7 0.7 1.4 0.9 0.6 Nominal wages 17.0 18.9 22.6 20.5 16.9 Public sector wages 25.9 27.3 18.5 17.4 14.4 Private sector wages 14.8 16.6 23.7 21.4 17.6 Nominal unit labor cost 11.5 11.0 17.2 13.8 11.2 General government finances (In percent of GDP) Revenue 30.2 31.0 31.4 34.7 35.2 Expenditure 31.0 31.6 33.7 36.8 38.2 Fiscal balance -0.8 -0.6 -2.3 -2.1 -2.9 Structural fiscal balance 1/ -1.3 -1.8 -3.9 -3.4 -3.8 Gross public debt 15.8 12.4 12.1 11.4 11.5 Net financial worth 16.2 12.4 8.2 8.2 8.6 Money and credit (Annual percentage change) Broad money (M3) 36.5 28.1 33.5 36.4 25.7 Domestic credit 43.7 52.0 64.5 32.8 24.9 Interest rates (In percent) Euro, six-month LIBOR 2.2 3.1 4.3 4.2 4.0 Interbank rate … 8.2 7.6 … … Lending rate 21.0 14.8 13.3 … … Real lending rate (CPI adjusted) 12.0 8.3 8.5 … … Balance of payments (In percent of GDP) Current account balance -8.9 -10.4 -14.0 -14.4 -14.0 Merchandise trade balance -9.9 -12.0 -14.6 -14.9 -14.4 Capital and financial account balance 15.6 15.7 17.6 16.1 16.8 Foreign direct investment balance 6.6 8.9 5.9 5.6 5.0 Net international investment balance -29.2 -35.3 -42.1 -49.3 -53.5 Gross official reserves 18.4 18.6 16.2 14.2 13.7 Gross external debt 39.1 42.9 48.5 49.4 49.7 Exchange rates Lei per euro (end of period) 3.66 3.41 3.53 … … Lei per euro (average) 3.63 3.52 3.34 … … Real effective exchange rate CPI based (percentage change) 17.9 7.6 9.0 1.3 6.5 GDP deflator based (percentage change) 21.4 11.9 15.2 5.9 10.5
Social Indicators (reference year in parentheses) Per capita GNI (Atlas method, 2006): US $4,850; Income distribution (GINI index, 2003): 31.1; Poverty rate (2005): 13 percent; Primary education completion rate (2005): 99.4 percent;
Life expectancy at birth (2005): 71.7; Infant mortality per 1000 live births (2005): 16.
Sources: Romanian authorities; Fund staff estimates and projections; and World Development Indicators database 1/ Actual fiscal balance adjusted for the automatic effects of output gap and absorption gap on the fiscal position. See IMF Country Report No. 07/390, Chapter III.

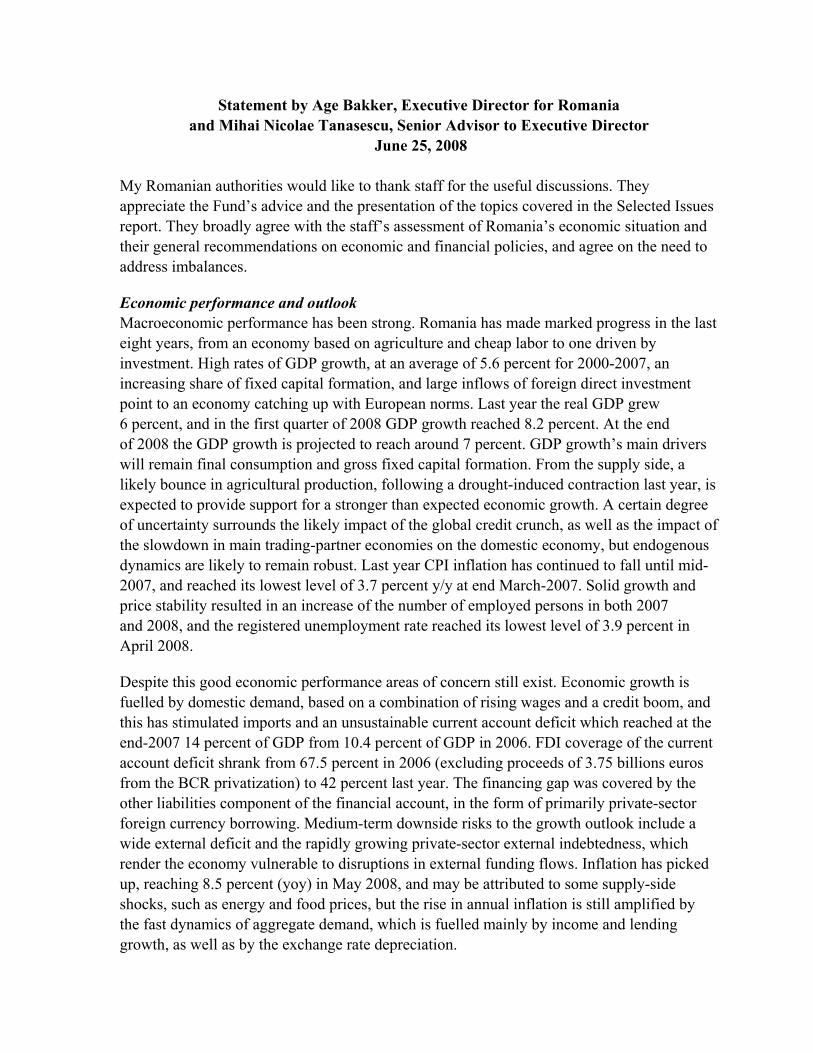
Statement by Age Bakker, Executive Director for Romania and Mihai Nicolae Tanasescu, Senior Advisor to Executive Director
June 25, 2008
My Romanian authorities would like to thank staff for the useful discussions. They appreciate the Fund’s advice and the presentation of the topics covered in the Selected Issues report. They broadly agree with the staff’s assessment of Romania’s economic situation and their general recommendations on economic and financial policies, and agree on the need to address imbalances.
Economic performance and outlook Macroeconomic performance has been strong. Romania has made marked progress in the last eight years, from an economy based on agriculture and cheap labor to one driven by investment. High rates of GDP growth, at an average of 5.6 percent for 2000-2007, an increasing share of fixed capital formation, and large inflows of foreign direct investment point to an economy catching up with European norms. Last year the real GDP grew 6 percent, and in the first quarter of 2008 GDP growth reached 8.2 percent. At the end of 2008 the GDP growth is projected to reach around 7 percent. GDP growth’s main drivers will remain final consumption and gross fixed capital formation. From the supply side, a likely bounce in agricultural production, following a drought-induced contraction last year, is expected to provide support for a stronger than expected economic growth. A certain degree of uncertainty surrounds the likely impact of the global credit crunch, as well as the impact of the slowdown in main trading-partner economies on the domestic economy, but endogenous dynamics are likely to remain robust. Last year CPI inflation has continued to fall until mid-2007, and reached its lowest level of 3.7 percent y/y at end March-2007. Solid growth and price stability resulted in an increase of the number of employed persons in both 2007 and 2008, and the registered unemployment rate reached its lowest level of 3.9 percent in April 2008.
Despite this good economic performance areas of concern still exist. Economic growth is fuelled by domestic demand, based on a combination of rising wages and a credit boom, and this has stimulated imports and an unsustainable current account deficit which reached at the end-2007 14 percent of GDP from 10.4 percent of GDP in 2006. FDI coverage of the current account deficit shrank from 67.5 percent in 2006 (excluding proceeds of 3.75 billions euros from the BCR privatization) to 42 percent last year. The financing gap was covered by the other liabilities component of the financial account, in the form of primarily private-sector foreign currency borrowing. Medium-term downside risks to the growth outlook include a wide external deficit and the rapidly growing private-sector external indebtedness, which render the economy vulnerable to disruptions in external funding flows. Inflation has picked up, reaching 8.5 percent (yoy) in May 2008, and may be attributed to some supply-side shocks, such as energy and food prices, but the rise in annual inflation is still amplified by the fast dynamics of aggregate demand, which is fuelled mainly by income and lending growth, as well as by the exchange rate depreciation.
2
The authorities recognize the potential risks associated with Romania’s external imbalances, especially in light of the diminished global growth outlook and persistent strains in commodity and financial markets. Both fiscal and monetary policies for 2008 have adopted some measures to contain the current risks. The government already approved a new budget rectification and measures to control spending, and reduced its fiscal deficit target for 2008 from 2.8 percent of GDP to 2.3 percent of GDP (GDP as projected by authorities). At the same time, the authorities have expressed their commitment to adopt a wage increase policy in line with productivity gains, and to improve the public spending structure. The Central Bank (NBR) responded proactively, and has already tightened broad money conditions, and has raised its policy rate in several steps to 9.75 percent. The NBR also took measures to contain banking system vulnerabilities by adding new provisions for foreign currency denominated loans, and approved a new regulation requiring banks to strengthen their liquidity management. On a positive note, non-privatization FDI, excluding the proceeds from the BCR privatization, grew by 44 percent yoy in 2007, and the first four months of 2008 balance-of-payments data showed a considerable improvement in FDI inflows, which reached 3.2 billion euros, double the amount in the same period of 2007. The FDI inflows have been concentrated in export-oriented industries, which likely reflects the strong profitability of Romania’s export-oriented industries and suggests that the potential for further inroads into world markets may be significant. At the same time the trade deficit shows signs of stabilization in the first quarter of 2008. This was the result of growth in exports outpacing that of imports (13.5 percent yoy vs. 12.3 percent yoy), and constitutes an improvement relative to the first quarter of 2007, when we saw a large deterioration in the trade deficit (108 percent yoy). Romania’s exports structure has been increasingly shifting toward higher value added non-textile manufacturing goods, and shows an upward trend in unit values of primary manufactured products, suggesting quality improvement in the country’s exports. The authorities recognize that it is still too early to view the recent narrowing of the gap between exports and imports as a trend. We note that the sharp current account deficit widening in recent years has had a large investment component, and the latter is expected to boost the productive capacity and the export orientation of the economy in the medium-term.
Fiscal policy My authorities plan to maintain a prudent fiscal stance within the Maastricht limits, in order to anchor macro stability. In the last three years the fiscal balance played an important role in bringing down the inflation rate, and fiscal deficits remained below 3 percent of GDP. For 2008 the fiscal deficit is now projected at 2.3 percent of GDP and the authorities’ view is that it is still broadly consistent with macro stability. They are of the view that a deficit of this magnitude does not alter Romania’s sound fundamentals, including the very low level of public debt (12.1 percent of GDP end-2007). This, together with the anchor provided by EU membership, makes the country less vulnerable to an abrupt change in market sentiment. In the first four months of 2008 the consolidated budget ran a 0.2 percent of GDP surplus against a 0.1 percent deficit in the same period of 2007. The Romanian authorities are

3
committed to avoiding a fiscal slippage ahead of the end-2008 parliamentary elections, and they consider crucial that fiscal policy supports the monetary policy’s disinflation objectives and the anchoring of inflation expectations. The Ministry of Economy and Finance has taken tough measures to control the budgetary expenditures, both at central and local levels, including monthly caps for line ministries spending, and ceilings on the annual local government borrowings and drawings under loan facilities.
Against this background, my authorities are fully committed to continuing to improve the country’s budget culture and the fiscal institutions, avoiding short-term measures and the practice of multiple budget revisions, and focusing on well-defined budgetary procedures and on effective medium-term fiscal frameworks. In this context, a multiannual fiscal framework will be drafted this year for the next three years, and projections will be supported by a clear policy statement and based on realistic macroeconomic assumptions. At the same time, the authorities are also working on creating mechanisms to ensure the efficient allocation of resources and absorption of the EU funds, which will help implementing a more uniform spending pattern over the year.
Monetary policy and financial sector Monetary policy will remain clearly focused on lowering the inflation rate in line with the announced target path, and NBR envisages a return of inflation to the target range in 2009, while preserving financial stability and avoiding a widening of current macroeconomic imbalances. After reaching a post-communist low of 3.7 percent yoy in March 2007, inflation has returned to an upward path, overshooting the NBR’s end-2007 inflation target of 4.0 percent (+/-1 percent) by a significant margin. The main culprits of the recent inflation rise were the higher fuel and food prices, the effects from a weaker leu, and demand side pressures, due to rapid wage and credit growth. Recently, the NBR upped its end-2008 inflation projection to 6.0 percent yoy, from 5.9 percent yoy, a rate that exceeds this year’s 3.8 percent (+/- 1percent) tolerance range. In this context the NBR tightened its policy to curb inflation, raising its key policy rate by a cumulative 275 bps since last October to 9.75 percent and pushed up the sterilized liquidity volumes in a move to bring the levels of interbank rates closer to the monetary policy interest rate. At the same time, the NBR maintained the existing minimum reserve requirements on both leu- and foreign exchange denominated liabilities at 20 percent and 40 percent respectively, and extended higher provisioning for foreign exchange denominated credits to unhedged borrowers, which has reduced the share of foreign exchange credit from over 62 percent in March 2005 to around 55 percent currently. Even though the annual inflation rate is projected to exceed the upper limit of the annual variation band, the NBR remains committed to inflation targeting, and also stands ready to tighten its monetary policy stance further to achieve the target of 3.5 percent yoy at end-2009. In this respect, the NBR plans to continue upgrading the implementation and communication capacity of the inflation targeting framework, including by taking stock of its inflation targeting experience since 2005.
4
The leu’s nominal appreciation path over the last three years came to a halt in mid-2007, due to the global credit crisis. We would like to note that, despite its short-term impact on inflation, exchange rate flexibility is a plus, as it operates as a self-correcting mechanism for current imbalances, alleviating the impact of external shocks, and it has helped move Romania’s real effective exchange rate close to its equilibrium level.
The Romanian banking sector remains well-capitalized with an adequate solvency ratio at12.7 percent at the end-2007, liquid, and resilient to shocks. The recent global financial market turmoil has not had a major impact on Romanian banks, but the rapid credit growth and the significant volume of foreign currency denominated credit represent risk factors that deserve special attention by supervisors. In this context, the NBR is looking to contain credit risk and to adopt new measures for riskier exposures, including real estate, and to complement the new regulation for liquidity risks by broadening the range of eligible collateral for its overdraft facility. Building on the progress made in strengthening the regulatory and supervisory framework, the NBR enhanced its cooperation cross-border with supervisory authorities in other countries. The authorities intend to have an FSAP update late this year.
Structural reforms My authorities consider that the continuation of structural reforms is crucial for real convergence. Implementing tough structural reforms has enabled strong foreign-investor interest in locating production in Romania, and consolidated the economy’s overall external price and cost competitiveness. In this context, recently, both Nokia and Ford have opened new factories in Cluj-Napoca and Craiova respectively, which offers new perspectives of job creation and improving the standard of living for the people from these regions. On the energy side, my authorities are determined to continue with the adjustments of the energy prices and to close the gap with international prices, and to continue with the privatization of the energy-sector companies. At the beginning of this year Romania has introduced the second pillar of the pension system and it is committed to further restructuring the pension system as a whole. The authorities will also continue with the implementation of their judicial reform agenda. However, due to political constraints in the last year, difficult structural reforms were largely on hold, but with parliamentary elections due in late-2008, the future coalition government, with a stronger mandate and purpose, will continue to accelerate implementing structural reforms.
Concluding, my authorities consider that the present economic policy mix will prevent wide macroeconomic imbalances, which could be costly and disorderly. In this respect, the continuation of structural reforms is crucial to boost both productivity and the external competitiveness of Romanian products, and a tighter than projected fiscal policy together with prudent monetary policy will help narrowing macroeconomic imbalances and will consolidate the path to euro adoption which now is foreseen for 2014.