Embed Size (px)
Citation preview
International migration in Venezuela and the Growth Collapse
Dan LevyVisiting Assistant Professor, Kennedy School of Government, Harvard University
Dean YangAssistant Professor, Ford School, University of Michigan
Presentation at the Kennedy School of Government, April 2006
Two key objectives
I. Characterize history of international migration in Venezuela
II. Assess link between migration and growth collapse in Venezuela
Data Encuesta de Hogares (1975-2003) : Semi-annual household
survey Allows us to get a history of number of foreign born
people and net flows
Key variables Place of birth Year of birth Entrepreneur status
Limitations Year of arrival to Venezuela only available for 1994-2003 Can only infer net flows Entrepreneur status variable is relatively crude measure

I - History of International Migration in Venezuela

Key questions
How has the stock of immigrants evolved over time?
How has the composition of immigrants evolved over time?
How do immigrants differ from natives in their: Entrepreneurship Human capital
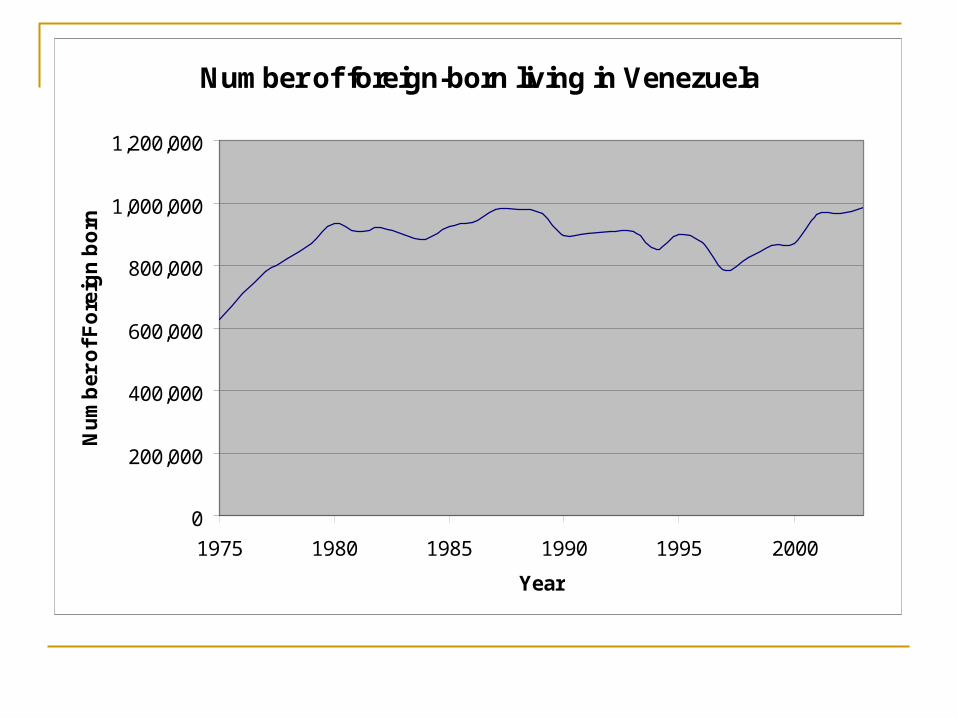
Number of foreign-born living in Venezuela
0
200,000
400,000
600,000
800,000
1,000,000
1,200,000
1975 1980 1985 1990 1995 2000
Year
Nu
mb
er
of
Fo
reig
n b
orn
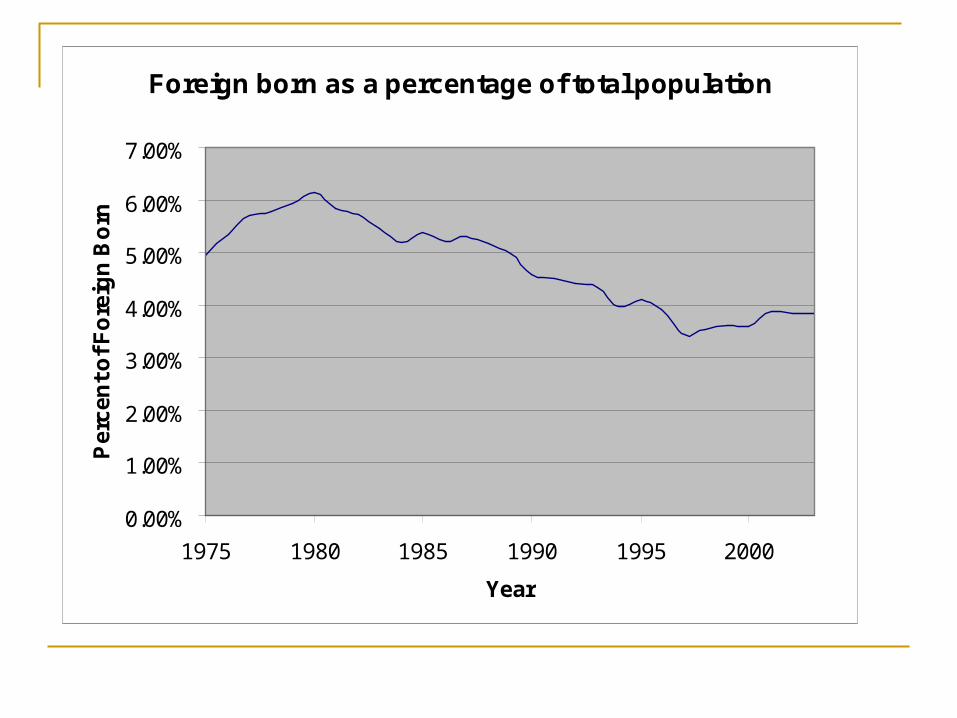
Foreign born as a percentage of total population
0.00%
1.00%
2.00%
3.00%
4.00%
5.00%
6.00%
7.00%
1975 1980 1985 1990 1995 2000
Year
Pe
rce
nt
of
Fo
reig
n B
orn
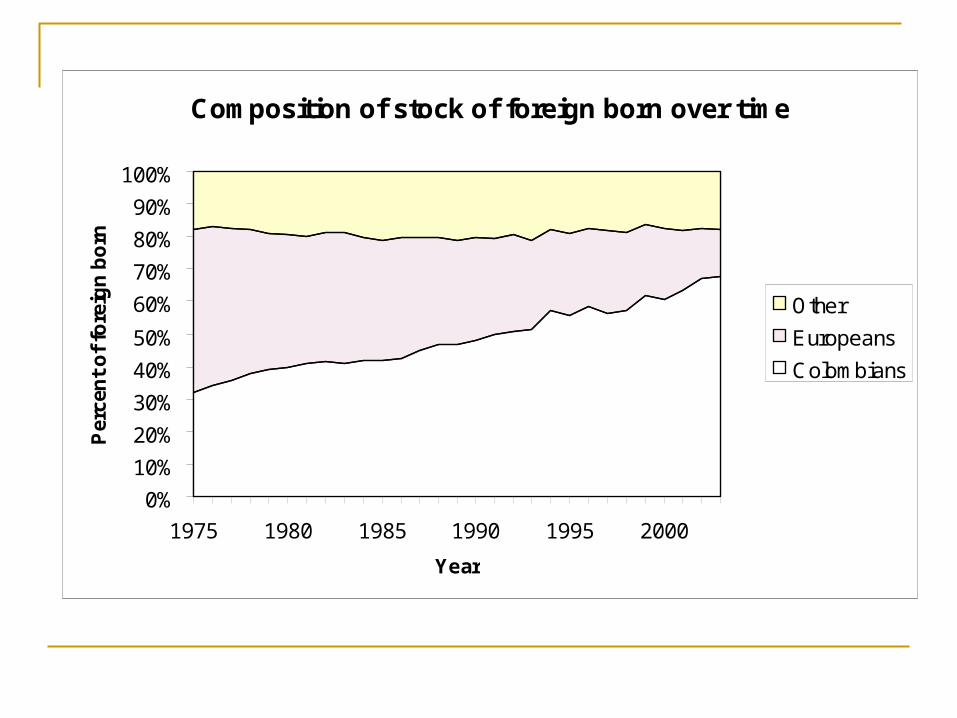
Composition of stock of foreign born over time
0%
10%
20%
30%
40%
50%
60%
70%
80%
90%
100%
1975 1980 1985 1990 1995 2000
Year
Per
cen
t o
f fo
reig
n b
orn
Other
Europeans
Colombians
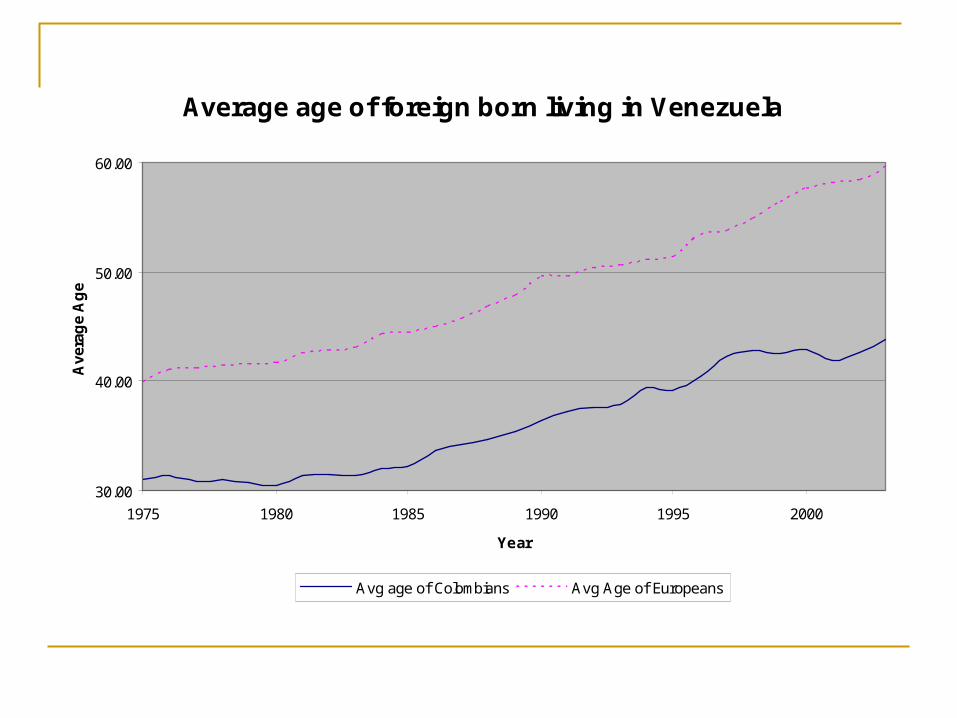
Average age of foreign born living in Venezuela
30.00
40.00
50.00
60.00
1975 1980 1985 1990 1995 2000
Year
Ave
rag
e A
ge
Avg age of Colombians Avg Age of Europeans
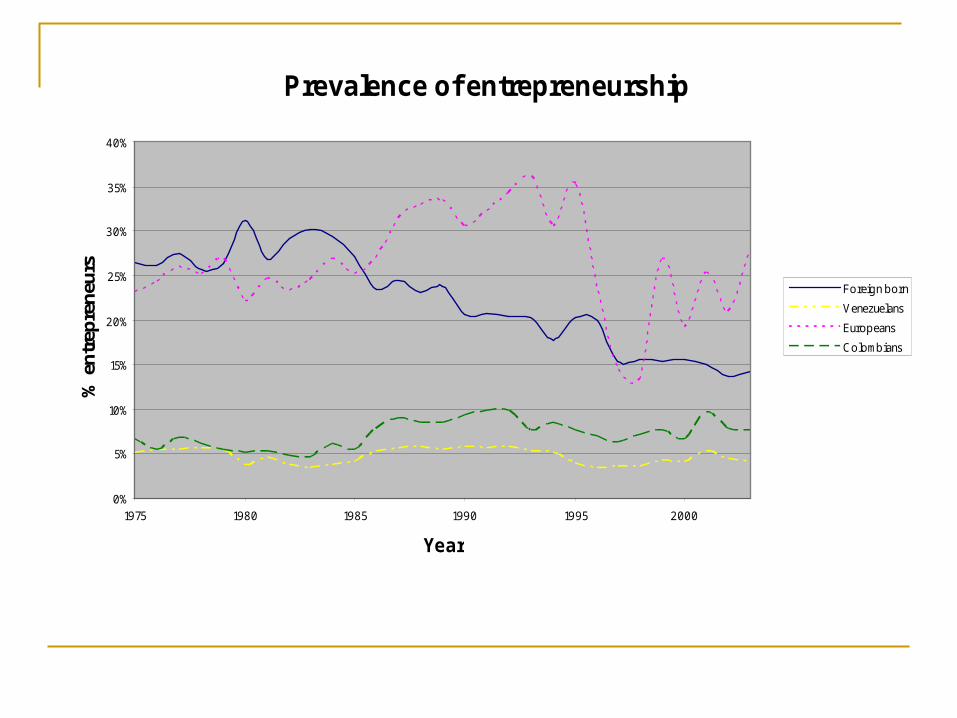
Prevalence of entrepreneurship
0%
5%
10%
15%
20%
25%
30%
35%
40%
1975 1980 1985 1990 1995 2000
Year
% e
ntr
epre
neu
rs
Foreign born
Venezuelans
Europeans
Colombians
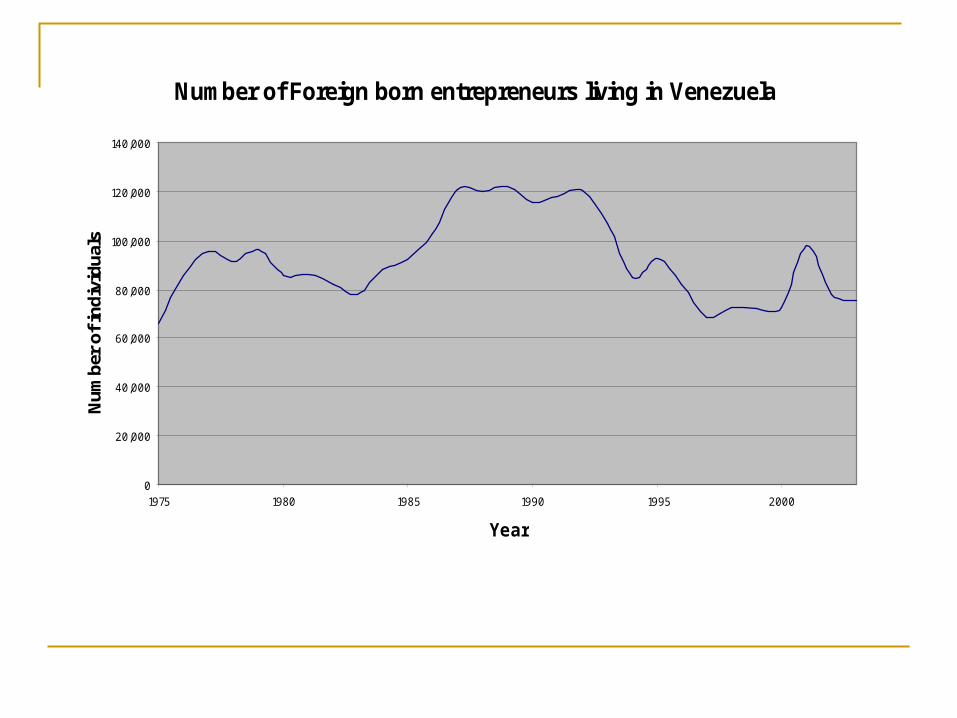
Number of Foreign born entrepreneurs living in Venezuela
0
20,000
40,000
60,000
80,000
100,000
120,000
140,000
1975 1980 1985 1990 1995 2000
Year
Nu
mb
er o
f in
div
idu
als
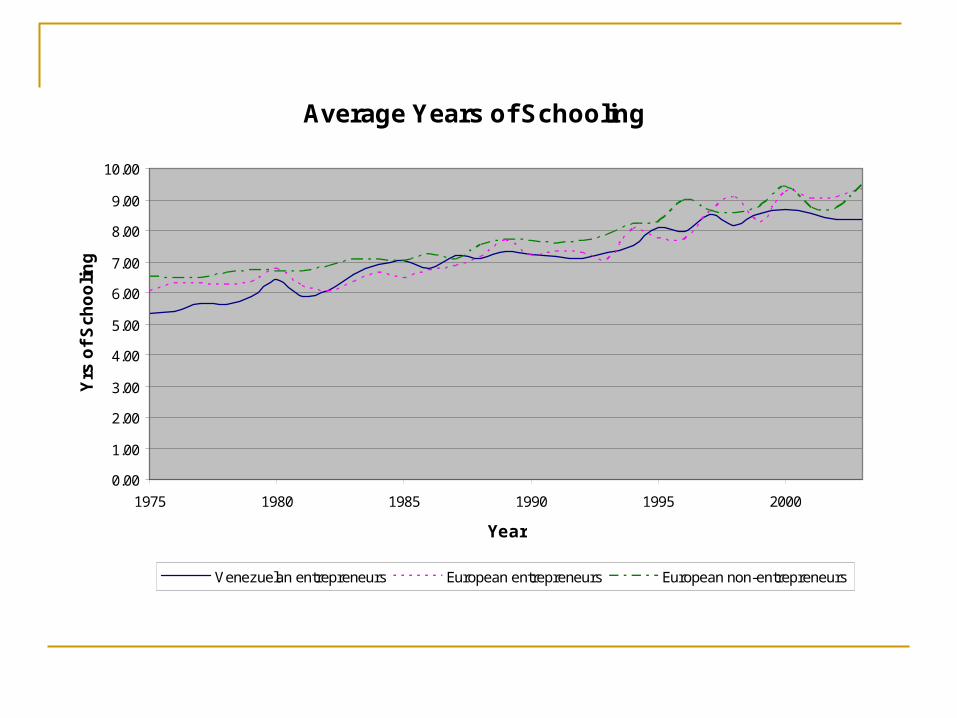
Average Years of Schooling
0.00
1.00
2.00
3.00
4.00
5.00
6.00
7.00
8.00
9.00
10.00
1975 1980 1985 1990 1995 2000
Year
Yrs
of
Sch
oo
lin
g
Venezuelan entrepreneurs European entrepreneurs European non-entrepreneurs
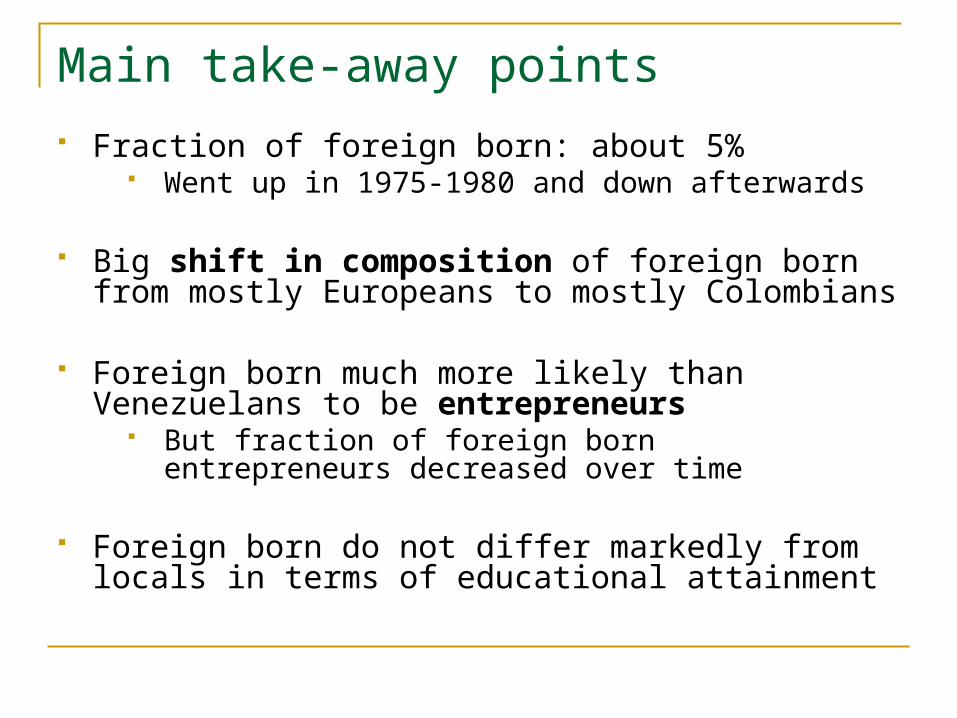
Main take-away points Fraction of foreign born: about 5%
Went up in 1975-1980 and down afterwards
Big shift in composition of foreign born from mostly Europeans to mostly Colombians
Foreign born much more likely than Venezuelans to be entrepreneurs
But fraction of foreign born entrepreneurs decreased over time
Foreign born do not differ markedly from locals in terms of educational attainment
II – Assessing link between international migration and the growth collapse in Venezuela
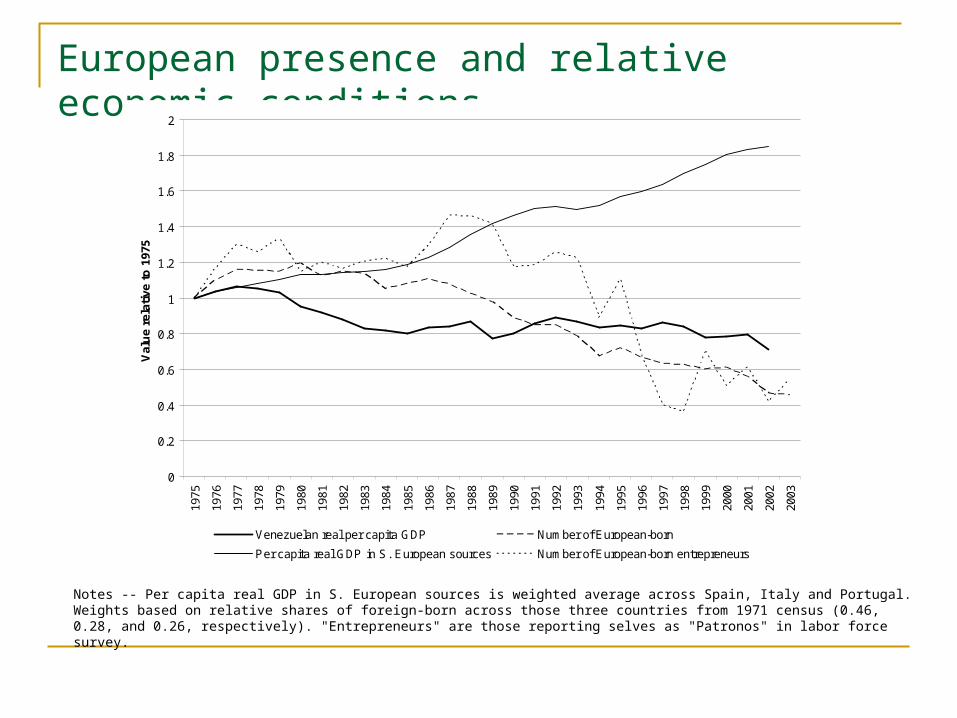
European presence and relative economic conditions
Notes -- Per capita real GDP in S. European sources is weighted average across Spain, Italy and Portugal. Weights based on relative shares of foreign-born across those three countries from 1971 census (0.46, 0.28, and 0.26, respectively). "Entrepreneurs" are those reporting selves as "Patronos" in labor force survey.
0
0.2
0.4
0.6
0.8
1
1.2
1.4
1.6
1.8
2
1975
1976
1977
1978
1979
1980
1981
1982
1983
1984
1985
1986
1987
1988
1989
1990
1991
1992
1993
1994
1995
1996
1997
1998
1999
2000
2001
2002
2003
Val
ue
rela
tive
to
197
5
Venezuelan real per capita GDP Number of European-born
Per capita real GDP in S. European sources Number of European-born entrepreneurs
Migration and the collapse: key questions Generally
How have the large changes in migrant inflows and outflows affected the Venezuelan economy in the last 30 years?
In particular How have changes in the fraction foreign born affected
Venezuelan natives’ labor market outcomes? Outcomes: wages, employment, labor force participation, total
output or production Focus on natives in the same “group” as foreign-born, such as:
1) industries, 2) states Examine differential effects of Colombian vs. European
migrants
Challenges to identification
Fraction foreign born (in industries or states) is endogenous with respect to outcomes of interest Reverse causation: growing industries may attract more foreign-
born Omitted variables: third factors (e.g., industry subsidies, sector-
specific trade liberalization) may influence both natives’ labor market outcomes and fraction foreign-born
Need a source of variation in fraction foreign-born that is exogenous with respect to natives’ labor market outcomes
Identification strategy
Use shocks in migrants’ origin countries as instruments for changes in fraction foreign-born
Economic conditions in origin countries should affect new inflows, as well as rate of return migration
To get variation at industry or state level, interact shocks with initial (~1975) fraction foreign born in industry or state
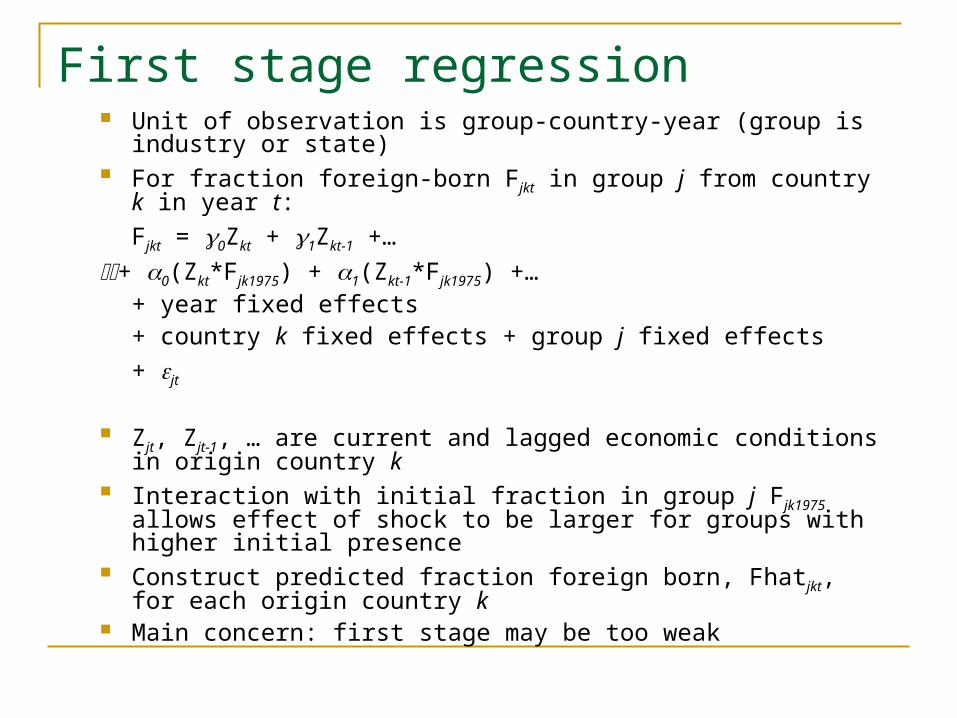
First stage regression Unit of observation is group-country-year (group is industry or state) For fraction foreign-born Fjkt in group j from country k in year t:
Fjkt = 0Zkt + 1Zkt-1 +…
+ 0(Zkt*Fjk1975) + 1(Zkt-1*Fjk1975) +… + year fixed effects+ country k fixed effects + group j fixed effects
+ jt
Zjt, Zjt-1, … are current and lagged economic conditions in origin country k
Interaction with initial fraction in group j Fjk1975 allows effect of shock to be larger for groups with higher initial presence
Construct predicted fraction foreign born, Fhatjkt, for each origin country k
Main concern: first stage may be too weak

Instrumental variables regression For labor market outcome Yjt in “group” (industry or state) j and year t:
Yjt = 0Fraction_Colombianjt + 1Fraction_Europeanjt +…
+ year fixed effects
+ group j fixed effects
+ jt
Fraction_Colombianjt , Fraction_Europeanjt, … are predicted values from first stage
Coefficients 0, 1, … are effect of exogenous changes in fraction foreign born on labor market outcomes of natives in same “group”

Comments welcome
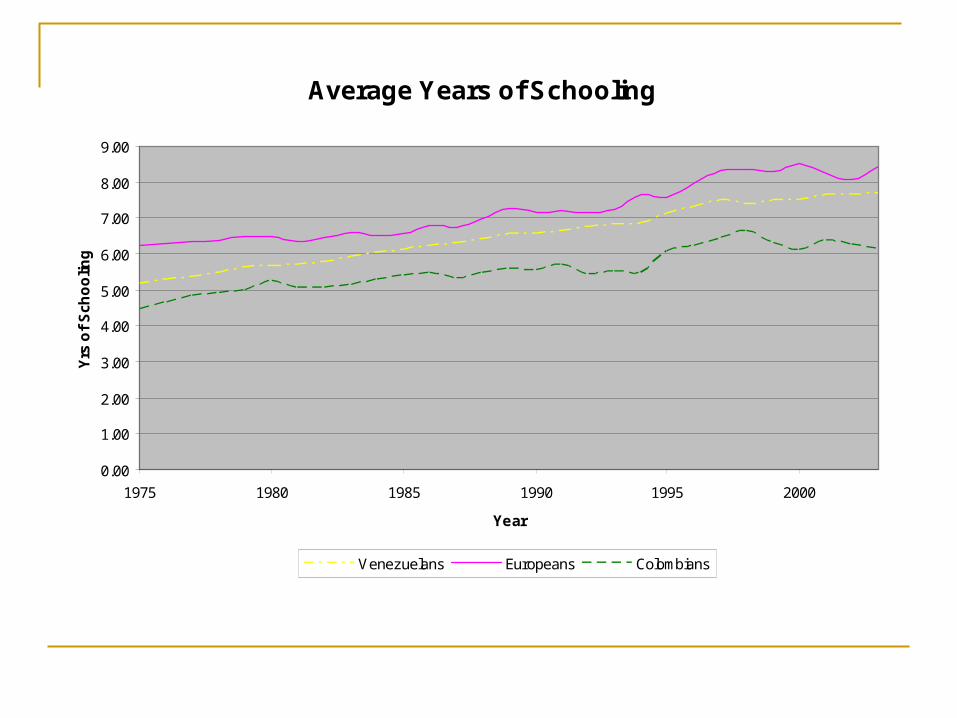
Average Years of Schooling
0.00
1.00
2.00
3.00
4.00
5.00
6.00
7.00
8.00
9.00
1975 1980 1985 1990 1995 2000
Year
Yrs
of
Sch
oo
ling
Venezuelans Europeans Colombians