Embed Size (px)
Citation preview
Australian Curriculum, Assessment and Reporting Authority
Curriculum Mapping Project
Phase 4a
Comparing International
Curricula against the Australian
Curriculum
Final Report
Prepared by:
Graeme Jane Bruce Wilson
Vic Zbar
13 July 2011
Laulon Pty Ltd trading as Laulon Management, Education and Technology Solutions
ACN 063 581 804 ABN 62 063 581 804

30 Lorne Street Moonee Ponds Victoria 3039 Australia Phone (03) 9326 1191 Facsimile (03) 9326 1839 Mobile 0418 396972
Email [email protected]
2
CONTENTS PAGE
Curriculum Mapping Project Report
Executive Summary 3 Introduction 6 The reports 10
English 14 Mathematics 16 Science 19
Appendices
1. International Mapping Proposal 22
2. International Mapping Report 28
3. Porter Source Methodology 36
4. ACARA Curriculum Mapping Calculations 38
5. English reports 40
6. Mathematics reports 59
7. Science reports 87
8. Subject surveys 116
Document Tracking
Version Description Release Date
V1 Revised Report 13/7/11
3
EXECUTIVE SUMMARY
This paper contains the final report on the International Curriculum Mapping Project commissioned by AEEYSOC and set up by ACARA as part of the development of the Australian Curriculum. The project involves an analysis of similarities and differences between the final Australian Curriculum and international curricula in English, Mathematics and Science.
The jurisdictions selected for international comparison were:
English: Ontario and New Zealand
Mathematics: Singapore and Finland Science: Ontario and Finland.
The criteria on which these selections were made are discussed in the body of the report. The data on the international curricula are drawn from expert mapping conducted on 21 and 22 September 2010. The data on the Australian Curriculum in Mathematics and Science are drawn from expert mapping conducted from 12‐21 November 2010. The data on the Australian Curriculum in English are drawn from expert mapping conducted from 7‐17 June 2011. The project was designed to provide international benchmarks against which to evaluate the Australian Curriculum. The project reports will also be useful in the further development of the Australian Curriculum.
A separate report compares the final Australian Curriculum with curricula in each state and territory.
The project involved the development of a survey instrument for each learning area based on a consistent language for describing the learning area, including:
• a language for describing the knowledge base; and
• a language for describing the ‘cognitive demand’ of each area, consisting of descriptions of what students can do with particular knowledge.
The survey instrument requires those completing the survey to respond on a matrix to indicate whether a curriculum framework being considered:
• includes a specific topic; • if so, to what extent; and
• at what level of cognitive demand students are expected to operate in relation to that topic.
International mapping
The conduct of mapping of curricula from other countries had some added complexities. The project consultants were asked by ACARA to develop a paper (see Appendix 1) discussing the potential for mapping of international curricula, and advising on how it might be done. The paper recommended that mapping of English, Mathematics and Science was feasible, but that mapping of History was not realistic because of significant content differences between countries.
The second issue discussed in the paper concerned which international curricula should be mapped for comparison purposes. The paper identified a number of criteria to guide
4
the selection process. The criteria include Mandatory Criteria, which must have been met for the curriculum to be considered and Desirable Criteria, which would be used to discriminate between curricula that met the Mandatory Criteria. The consultants’ paper proposed that an initial review be conducted of potential comparison curricula and a paper prepared recommending appropriate curricula in priority order. This further paper (see Appendix 2) recommended the following priority order for countries for comparison mapping:
English Mathematics Science
1. Ontario
2. New Zealand
3. England, Wales and
Northern Ireland
1. Singapore
2. Finland
3. Hong Kong
1. Ontario
2. Finland
3. Singapore
The findings were accepted by ACARA, and the top two recommended countries in each learning area were included in the mapping process. International curriculum documents for the mapping process were sourced by the project consulting team. These documents are detailed in the body of the report.
The mapping of curricula from the comparison countries occurred in Sydney on 21‐22 September, 2010. Curriculum experts from States and Territories and ACARA were brought together to take part in the mapping process. They were provided with a briefing including the background to the project, and a training session in completing the surveys. The project consultants worked with them to respond to questions and provide advice on the completion of the survey. Each rater was asked to map the Australian Curriculum and two international curricula in the same learning area. The same raters were subsequently asked to remap the final Australian Curriculum following changes made to the September version. This further mapping was conducted from 12‐21 November, 2010. On this occasion mapping was undertaken online using the site developed by Education Services Australia.
Subsequently, a repeat mapping of the final English curriculum (but not the other subjects) was undertaken. On this occasion a mostly new and enlarged group of raters was brought together in Sydney on 7 June and provided with a training session and the opportunity to work together and moderate their results. Most raters continued the work during the following days, and the final rater data became available on 17 June.
Data arising from these mapping processes were analysed and compared, then compiled into the present report. Appendix 4 outlines the steps involved in this analysis.
The data in the report have some weaknesses. Despite training sessions and consultant availability to the curriculum experts in the completion of the survey, there were inconsistencies in some survey responses. All data for the international report were collected using the online system, which assisted in ensuring data quality, but it is important to remember that the data arise from expert judgment about curriculum and may be subject to errors of rater interpretation.
Findings English showed a very high degree of alignment in content topic coverage between Australia and Ontario. Almost all phases of schooling were aligned at extraordinarily high levels, suggesting that the two curricula are as close as is likely to occur in an international comparison. Cognitive demand was also closely aligned between the two
5
curricula, although Ontario shows a materially greater representation of ‘Perform procedures/Explain’, and a stronger focus on ‘Generate/Create/Demonstrate’, while Australia had a stronger focus on ‘Memorise/Recall’ and ‘Evaluate’. The data showed a moderate level of alignment in content topic coverage with New Zealand. The variation occurred markedly in three content topic groups that showed consistent and significant differences. In the case of cognitive demand, across the whole curriculum Australia showed a materially greater representation of ‘Evaluate’, while New Zealand was much stronger in ‘Perform Procedures/Explain’. Australia had a greater overall focus on ‘Generate/create…’ and ‘Analyse/Investigate’, while the reverse was true of ‘Memorise’.
In Mathematics, alignment in content topic coverage between the Australian Curriculum and the Singapore and Finland curricula were consistently moderate to high. In the case of Singapore, six phases of schooling showed high alignment, while three showed moderate alignment. In the case of cognitive demand, Singapore shows a materially greater focus across the years of schooling on ‘Solve non‐routine problems/make connections’ (most notably in the later primary and early secondary years), while Australia has a materially greater focus on ‘Conjecture/generalise’. While there are some areas of misalignment, overall the results suggest that the two curricula are aligned to a significant degree. The results for Finland showed two phases of schooling with high alignment in content topic coverage and one with moderate alignment. Differences are notably in content topic groups which are represented in both countries, but where the level of emphasis is different. The cognitive demand comparison with Finland is similar to that with Singapore in showing a greater focus in Australia on ‘Conjecture/ generalise’ both overall and at all phases of schooling.
In Science, alignment levels in content topic coverage with Ontario and Finland were mostly moderate, although a significant element in the variation arose from differences in timing rather than differences in curriculum emphasis. Virtually all Ontario phases of schooling were aligned at moderate levels in relation to content topic coverage. In the case of cognitive demand, there were no overall material variations between Australia and Ontario, suggesting a very high level of alignment. All three Finland phases of schooling were aligned in relation to content topic coverage around the boundary between moderate and low alignment. In the case of cognitive demand, Finland showed a materially greater representation of the category ‘Communicate understanding of science concepts’ and a greater focus on ‘Perform procedures/investigate’. Australia showed a greater focus on the higher‐order categories of cognitive demand, namely ‘Analyse information and advance scientific argument’ and ‘Apply concepts/make connections’.
6
Introduction
This paper contains the final report on the International Curriculum Mapping Project set up by ACARA as part of the development of the Australian Curriculum. The project involves an analysis of similarities and differences between the final Australian Curriculum and international curricula in English, Mathematics and Science.
The jurisdictions selected for international comparison are:
English: Ontario and New Zealand
Mathematics: Singapore and Finland Science: Ontario and Finland.
The criteria on which these selections were made are discussed below. The data on the international curricula are drawn from expert mapping conducted on 21 and 22 September 2010. The data on the Australian Curriculum are drawn from a further mapping process conducted from 12‐21 November, 2010 (in Mathematics and Science) and from 7‐17 June 2011 (in English). The project is designed to provide international benchmarks against which to evaluate the Australian Curriculum. The project reports will also be useful in the further development of the Australian Curriculum.
This report covers Phases 4 and 4a of the broader Curriculum Mapping Project initiated by ACARA. The first phase of the project involved curriculum experts nominated by each state and territory and ACARA mapping curriculum documents in English, Mathematics, Science and History. Each state or territory document was rated by the experts nominated by that jurisdiction and by those nominated by one other state or territory or ACARA, using the phases of schooling in use for that jurisdiction. Each state or territory provided documents appropriate to the task. The data arising from the expert surveys were then analysed and compiled into an interim report.
In the second phase of the project, each state and territory was invited to nominate teachers to participate in a mapping of the enacted curriculum in that jurisdiction. Six jurisdictions accepted the invitation: ACT, New South Wales, Northern Territory, Queensland, Tasmania and Western Australia. Teachers completed surveys for particular subjects at year levels (rather than phase or stage of schooling). Across Australia, 890 teachers in the six states and territories completed 1196 surveys. Following the completion of the teacher surveys, the results were analysed and combined with the data from the expert surveys to generate a single set of results for each state and territory. For South Australia and Victoria, which did not participate in the teacher mapping, the data in the report were derived from expert mapping only.
The curriculum experts involved in third phase mapping were asked to map three documents each. All participants were asked to map the September version of the Australian Curriculum in one subject. In addition, they mapped two international comparison curricula in the same subject. The jurisdictions selected for international comparison were:
English: Ontario and New Zealand Mathematics: Singapore and Finland Science: Ontario and Finland.
The current report is part of Phases 4 and 4a of the project, including two parts:
7
• This report comparing the final Australian Curriculum with each of the international curricula;
• A report comparing the final Australian Curriculum with curricula in each state and territory, using the same state and territory data as used in the final report on the draft Australian Curriculum. The data drawn from the November 2010 mapping of the Australian Curriculum in Mathematics, Science and History and the June 2011 mapping in English provide the basis for the state and territory comparisons.
The project involved the development of a consistent language for describing each subject addressed in the project, based on a ‘uniform language’ developed by Porter and colleagues (see Appendix 3 for further information on the source methodology). This includes:
• a language for describing in detail the knowledge base in each of English, science,
history and mathematics. This consists of lists of topics arranged in broad content categories in each subject domain. In English, for example, the topic group of ‘Language Study’ includes topics such as ‘spelling’ and ‘effects of race, gender or ethnicity on language and language use’. In Science, ‘ecosystems’ and ‘adaptation and variation’ appear as topics within ‘Ecology’. The lists of topics are intended to be complete and universal, so that they could be used to describe any curriculum in the relevant domain, regardless of year level, context or level of complexity; and
• a language for describing the ‘cognitive demand’ of each area, based on a hierarchy
of performance expectations. This consists of descriptions of what students can do with particular knowledge. These descriptions are different for each learning area, though they are based on a similar hierarchy of demands consisting of five levels in categories like the following: • memory and recall
• performing procedures
• communicating, demonstrating, explaining, creating
• analysis, argument and investigation • evaluation and application in different contexts
A survey instrument was then developed for each subject, based on this ‘uniform language’. The survey instrument was used by expert respondents to describe an official curriculum document, and by teachers to describe their teaching programs. The survey instrument requires those completing the survey to respond on a matrix to indicate whether a curriculum framework or teaching program being considered:
• includes a specific topic; • if so, to what extent; and
• at what level of cognitive demand students are expected to operate in relation to that topic.
This phase of the project was conducted over an extended period. During the third phase of the overall mapping project, curriculum experts from States and Territories and ACARA were invited to take part in mapping curriculum documents. Those nominated were brought together in Sydney on 21‐22 September, 2010. They were provided with a briefing including the background to the project, and a training session in completing the surveys. The project consultants worked with them to respond to questions and provide advice on the completion of the survey. The surveys were
8
completed using the online system developed on behalf of ACARA by Education Services Australia, in a project managed by the project consultants.
A further mapping of the Australian Curriculum was held in November 2010. This fourth phase involved remapping the Australian Curriculum following revisions undertaken to the September draft. Raters involved in phase 3 were asked to undertake a further mapping of the curriculum as at 12 November, 2010 to ensure that the ratings reflected recent changes to the documents. This mapping process occurred in the period 12‐21 November. On this occasion, raters were not brought together, since they had been trained and supported in the phase 3 mapping. Instead, mapping was undertaken online, using the site developed by Education Services Australia.
Phase 4a involved remapping the Australian English curriculum because of concerns about the data set in English following the Phase 4 mapping. The Phase 4 mapping of English resulted in a low number of raters completing the task. This led to the decision to remap English with a larger number of raters, included dedicated primary and secondary school raters. The Phase 4a process began on 7 June 2011 with a training session in Sydney. Raters then undertook the mapping process and were able to moderate their results. Most raters continued the work over subsequent days, completing the work by 17 June 2011 at the latest.
This report compares data arising from the phase 4 and 4a mapping of the final Australian Curriculum with data from phase 3 mapping of curricula from international comparison jurisdictions.
International mapping The conduct of mapping of curricula from other countries had some added complexities. The project consultants were asked by ACARA to develop a paper (see Appendix 1) discussing the potential for mapping of international curricula, and advising on how it might be done. The paper first discussed which subjects were appropriate for international mapping. In summary, the paper recommended that mapping of English, Mathematics and Science was feasible, but that mapping of History was not realistic.
The exclusion of History occurred on the basis that History curricula in different countries strongly reflect local history. Because the mapping methodology requires a rating of specific content as well as cognitive demand, the existence of substantial variations in content makes the methodology inapplicable. The paper also noted that History is less consistently described in curricula in some countries, appearing in different forms (although this issue also applies in Australia, and was not a barrier to completion of the surveys).
The second issue discussed in the paper concerned which international curricula should be mapped for comparison purposes. The paper identified a number of criteria to guide the selection process. The criteria were divided into two categories: Mandatory Criteria, which must be met for the curriculum to be considered; and Desirable Criteria, which would be used to discriminate between the curricula that met the Mandatory Criteria. The criteria are as follows:
Mandatory criteria
1. The curricula for comparison must be written in English.
9
2. Comparison nations must have a relatively well‐established system of universal or near‐universal primary and secondary education, at least up to the middle years of secondary schooling.
3. The years of schooling must be broadly comparable with those for Australia. 4. The country from which the curriculum for comparison is provided must be willing
to assist in the process.
Desirable criteria
5. Partner nations should have variations in starting ages no greater than those existing in Australia.
6. The curricula for comparison should preferably be national curricula. 7. The curricula for mapping should be mainstream curricula designed to cater for a
wide range of normal performance. 8. The curricula for comparison should preferably be articulated at year levels (at
least in explanatory or support documents) rather than phases or stages of schooling
9. It would also be desirable for comparisons to be made with nations that have had a degree of success in international assessment programs.
10. Curricula for mapping should be checked for style to ensure comparability.
The consultants’ paper proposed that an initial review be conducted of potential comparison curricula and a paper prepared recommending appropriate curricula in priority order. This further paper was prepared (see Appendix 2). The paper discussed each criterion with the exception of criterion 4, which was set aside in the paper because it requires contact with potential comparison jurisdictions, which was not necessary unless the proposal to subsequently involve personnel from the other jurisdictions in the process were pursued.
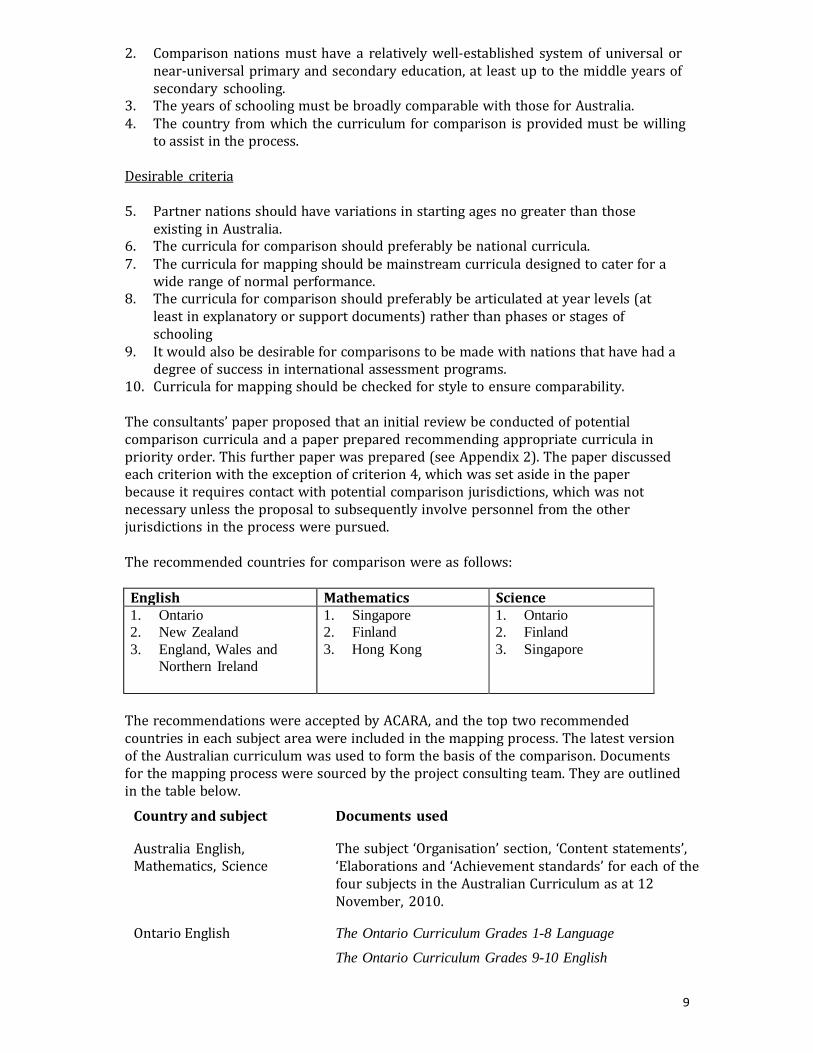
The recommended countries for comparison were as follows:
English Mathematics Science 1. Ontario
2. New Zealand
3. England, Wales and
Northern Ireland
1. Singapore
2. Finland
3. Hong Kong
1. Ontario
2. Finland
3. Singapore
The recommendations were accepted by ACARA, and the top two recommended countries in each subject area were included in the mapping process. The latest version of the Australian curriculum was used to form the basis of the comparison. Documents for the mapping process were sourced by the project consulting team. They are outlined in the table below.
Country and subject Documents used
Australia English, Mathematics, Science
The subject ‘Organisation’ section, ‘Content statements’, ‘Elaborations and ‘Achievement standards’ for each of the four subjects in the Australian Curriculum as at 12 November, 2010.
Ontario English The Ontario Curriculum Grades 1-8 Language
The Ontario Curriculum Grades 9-10 English
10
New Zealand English The New Zealand Curriculum: Achievement Objectives by
Learning Area
The New Zealand Curriculum: Reading and Writing Standards
for Years 1-8
Singapore Mathematics Mathematics Syllabus Primary 2007
Mathematics Syllabus Secondary 2006
Finland Mathematics National Core Curriculum for Basic Education 2004
Ontario Science The Ontario Curriculum Grades 1-8 Science and Technology
Finland Science National Core Curriculum for Basic Education 2004
The data arising from the expert surveys were then analysed and compiled into this draft report. Appendix 2 outlines the steps involved in this analysis.
The reports
This report summarises the key findings of the project. These can be found at pages 14‐ 21, organized by subject. They include, for each subject, a table showing topic coverage indices for each country for each phase of schooling. The table for each subject is accompanied by a commentary noting the extent of alignment between the Australian Curriculum and curriculum documents in the other two countries, and identifying those areas where the greatest differences are evident.
The detailed data supporting the findings can be found in the attachments to this paper, which are organised by subject. Within each subject, the report analyses data comparing the Australian Curriculum with each comparison country in turn, using the curriculum phases used in each of these countries as the organiser. For each phase for each country, the report includes:
• Graphs which represent the outcomes of the mapping processes for the draft
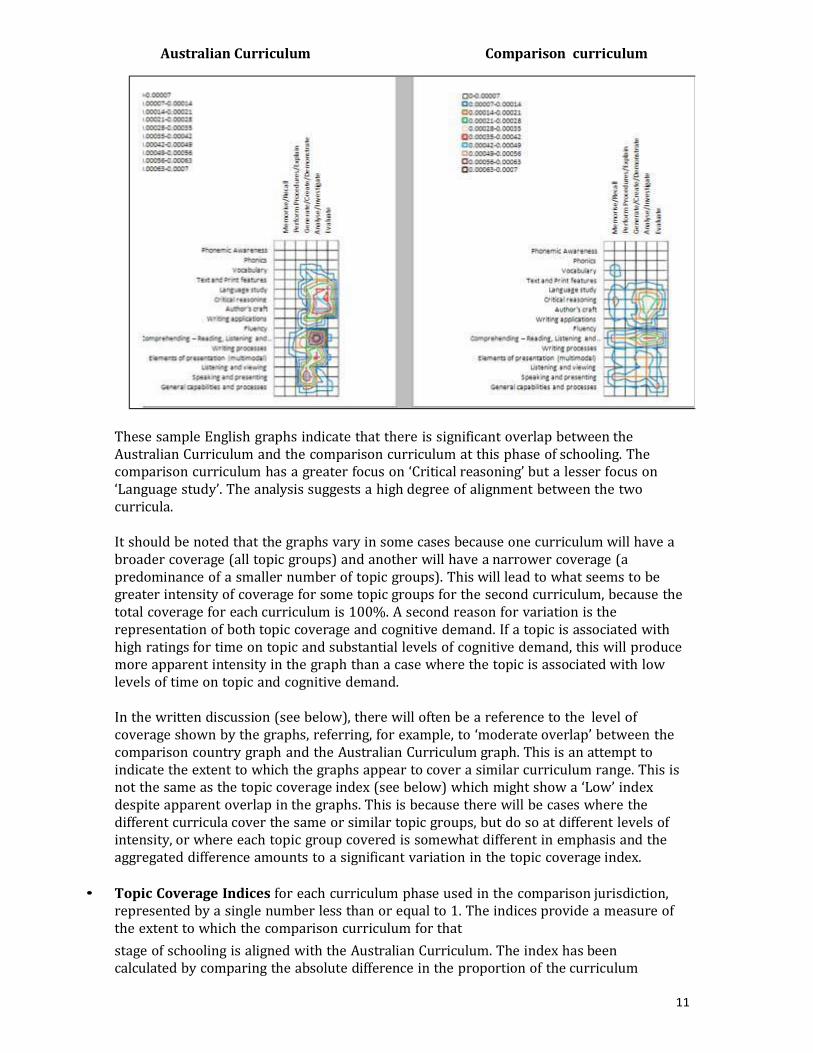
Australian Curriculum and the documents mapped for each curriculum phase used in the comparison country. They show the topic and topic group coverage, and the levels of cognitive demand for each of the comparison curriculum phases. The graphs show both the extent of coverage (in simple terms, the area covered by the graph lines) and the extent of emphasis on each topic/topic group and area of cognitive demand (in simple terms, the colour and closeness of the graph lines). The following English graphs show the difference in the spread of the topics covered and the associated extent of emphasis on each topic group and the range of cognitive demands addressed for each topic group.
11
Australian Curriculum Comparison curriculum
These sample English graphs indicate that there is significant overlap between the Australian Curriculum and the comparison curriculum at this phase of schooling. The comparison curriculum has a greater focus on ‘Critical reasoning’ but a lesser focus on ‘Language study’. The analysis suggests a high degree of alignment between the two curricula.
It should be noted that the graphs vary in some cases because one curriculum will have a broader coverage (all topic groups) and another will have a narrower coverage (a predominance of a smaller number of topic groups). This will lead to what seems to be greater intensity of coverage for some topic groups for the second curriculum, because the total coverage for each curriculum is 100%. A second reason for variation is the representation of both topic coverage and cognitive demand. If a topic is associated with high ratings for time on topic and substantial levels of cognitive demand, this will produce more apparent intensity in the graph than a case where the topic is associated with low levels of time on topic and cognitive demand.
In the written discussion (see below), there will often be a reference to the level of coverage shown by the graphs, referring, for example, to ‘moderate overlap’ between the comparison country graph and the Australian Curriculum graph. This is an attempt to indicate the extent to which the graphs appear to cover a similar curriculum range. This is not the same as the topic coverage index (see below) which might show a ‘Low’ index despite apparent overlap in the graphs. This is because there will be cases where the different curricula cover the same or similar topic groups, but do so at different levels of intensity, or where each topic group covered is somewhat different in emphasis and the aggregated difference amounts to a significant variation in the topic coverage index.
• Topic Coverage Indices for each curriculum phase used in the comparison jurisdiction,
represented by a single number less than or equal to 1. The indices provide a measure of the extent to which the comparison curriculum for that
stage of schooling is aligned with the Australian Curriculum. The index has been calculated by comparing the absolute difference in the proportion of the curriculum
12
devoted to each topic by the Australian Curriculum and the comparison curriculum. An index number of 1.00 (or 100%) represents an exact alignment. An index of 0 (or 0%) represents no alignment. These indices are summarised in tabular form at the beginning of each subject report (see 1 above) along with a legend indicating the levels of alignment represented by the different numbers.
• A table showing the percentage of the curriculum devoted to each topic group in the
Australian Curriculum and the relevant comparison curriculum. The percentage of the curriculum devoted to each topic group is listed for the Australian Curriculum and for each jurisdiction.
The following table relates to the English graphs above:
% of Curriculum devoted to Topic Group Australian Curriculum
Comparison Curriculum
Phonemic Awareness 0.23% 1.54%
Phonics 0.23% 1.76%
Vocabulary 4.21% 3.56%
Text and Print features 3.97% 3.19%
Language study 10.51% 7.48%
Critical reasoning 10.28% 12.32%
Author's craft 9.46% 10.78%
Writing applications 5.61% 6.82%
Fluency 1.64% 2.20%
Comprehending – Reading, Listening and Viewing 17.17% 16.69%
Writing processes 6.43% 5.57%
Elements of presentation (multimodal) 7.48% 7.77%
Listening and viewing 5.96% 5.39%
Speaking and presenting 11.45% 10.27%
General capabilities and processes 5.37% 4.66%
The surveys used, showing a full list of topic groups/topics is appended to this report. These tables support a more detailed analysis of differences at the topic group level between the Australian Curriculum and the comparison curriculum. It allows the reader to determine where the important differences lie. In many cases, the extent to which the topic coverage index is below 1 results from the sum of mostly small variations in coverage of the various topic groups. This table is a major component of the brief written analysis (see next point for further discussion, including a set of guidelines for determining the significance of different levels of variation between curricula).
• A short written discussion of the key variations between the Australian Curriculum
and the comparison curriculum at the level of topic groups. The graphs and this written discussion provide some explanation as to why the topic coverage index is at the level indicated. In the written discussion, the following guidelines have been adopted:
• a difference of more than 4% between the topic group coverage percentage
indicated for the Australian Curriculum and the percentage
13
indicated for the relevant comparison curriculum (eg a difference between 2.1% and 6.4%) is regarded as significant and is referred to in the written commentary;
• a difference of more than 2% but less than 4% is regarded as worth noting but as
falling with an acceptable range of variation, and is referred to in the written commentary;
• a case where one framework has a result above 2% and the other has a result of
0% (ie the topic is not represented in that framework at that level), is regarded as material and is referred to in the written commentary;
• differences smaller than 2% are regarded as not material, and are not referred
to in the written commentary.
• A discussion of relative cognitive demand in the subject as represented in the
Australian Curriculum and the comparison curriculum. This includes graphic representation of the relative representation of cognitive demand at each phase in the subject and in the subject overall. It also includes a table of percentages of each element of cognitive demand at each phase which are the basis for the graphic representation. In
the written discussion, the following guidelines have been adopted:
• a difference of more than 10% in cognitive demand percentage indicated for the
Australian curriculum and the percentage indicated for the relevant comparison curriculum is regarded as significant and referred to in the written commentary
• a difference of more than 5% but less than 10% is regarded as worth noting but as falling within an acceptable range of variation and is referred to in the written commentary
• a case where one curriculum has a result above 5% and the other has 0% is regarded as material and referred to in the written commentary
• differences smaller than 5% are not regarded as material and hence not referred to in the commentary.
The data in the report have some weaknesses. Despite training sessions and consultant availability to the curriculum experts and teachers in the completion of the survey, there were inconsistencies in some survey responses. All data for the international report were collected using the online system, which assisted in ensuring data quality, but it is important to remember that the data arise from expert judgment about curriculum and may be subject to errors of rater interpretation.
14
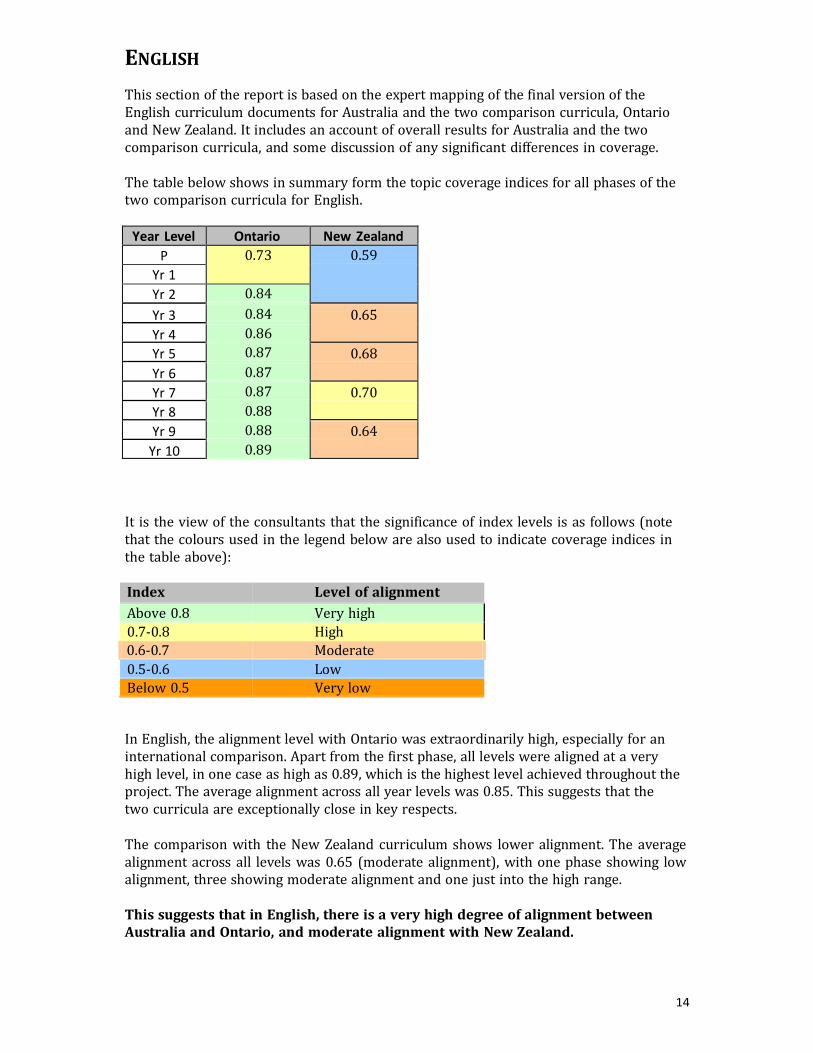
ENGLISH
This section of the report is based on the expert mapping of the final version of the English curriculum documents for Australia and the two comparison curricula, Ontario and New Zealand. It includes an account of overall results for Australia and the two comparison curricula, and some discussion of any significant differences in coverage.
The table below shows in summary form the topic coverage indices for all phases of the two comparison curricula for English.
Year Level Ontario New Zealand
P 0.73 0.59
Yr 1
Yr 2 0.84
Yr 3 0.84 0.65
Yr 4 0.86
Yr 5 0.87 0.68
Yr 6 0.87
Yr 7 0.87 0.70
Yr 8 0.88
Yr 9 0.88 0.64
Yr 10 0.89
It is the view of the consultants that the significance of index levels is as follows (note that the colours used in the legend below are also used to indicate coverage indices in the table above):
Index Level of alignment
Above 0.8 Very high
0.7‐0.8 High
0.6‐0.7 Moderate
0.5‐0.6 Low
Below 0.5 Very low
In English, the alignment level with Ontario was extraordinarily high, especially for an international comparison. Apart from the first phase, all levels were aligned at a very high level, in one case as high as 0.89, which is the highest level achieved throughout the project. The average alignment across all year levels was 0.85. This suggests that the two curricula are exceptionally close in key respects.
The comparison with the New Zealand curriculum shows lower alignment. The average alignment across all levels was 0.65 (moderate alignment), with one phase showing low alignment, three showing moderate alignment and one just into the high range.
This suggests that in English, there is a very high degree of alignment between Australia and Ontario, and moderate alignment with New Zealand.
15
At a more detailed level, (see Appendix 5) the data show results for topic groups by comparison curriculum and by phase. From this data, the following findings emerge:
1. It was notable that the graphs of the Ontario‐Australia comparisons showed very
similar patterns. In most cases the high levels of alignment were reflected not only in coverage of topic groups, but also in similar levels of intensity of coverage, and in similar breadth of cognitive demand. This means that the two curricula outline very closely related programs in terms of both curriculum content and cognitive demand.
2. Remarkably, there were only three occasions in the entire Australia‐Ontario
comparison where a topic group fell outside an acceptable range of difference (ie a difference of more than 4% in the percentage of the curricula devoted to the topic group). All occurred in the early years of schooling and in all three cases the difference concerned a higher representation of ‘Phonics’ in the Australian Curriculum at the first three phases (F‐1,2 and 3). Apart from these isolated examples, all topic groups at every level fell within an acceptable range of difference.
3. The analysis of cognitive demand also shows similarities between Australia and
Ontario, although there were more areas of material difference. Ontario has a materially greater representation across the curriculum of ‘Perform procedures…’. Australia has a greater focus on ‘Memorise/Recall’ and ‘Evaluate’ overall and at a number of levels, while Ontario has a greater focus on ‘Generate/Create…’ overall and at a number of levels.
4. In summary, this means that the curricula for Ontario and Australia are as close as
is likely to occur in an international comparison.
5. In the case of New Zealand, the lower levels of alignment can be tracked in significant part to three topic groups that showed material variations in a consistent direction across a number of year levels. The most striking difference occurred in ‘Comprehending – Reading, Listening and Viewing’ and ‘Elements of presentation (multimodal)’, which were materially stronger in New Zealand at all five phases. ‘Speaking and presenting’ was almost as consistently strong in Australia across all phases. These topic groups appear to show significant and consistent differences in emphasis between the two curricula. ‘Critical reasoning’ was also stronger in New Zealand, though not to the same extent.
6. In the case of cognitive demand, across the whole curriculum Australia showed a
materially greater representation of ‘Evaluate’, while New Zealand was much stronger in ‘Perform Procedures/Explain’. Australia had a greater overall focus on ‘Generate/create…’ and ‘Analyse/Investigate’, while the reverse was true of ‘Memorise’.
7. It is important to note that higher or lower levels of alignment are not in
themselves measures of quality. They are, to a significant extent, measures of similarity in curriculum coverage and structure. The English data suggest that the Australian curriculum is notably similar to the Ontario curriculum, but has important and identifiable differences from New Zealand.
16
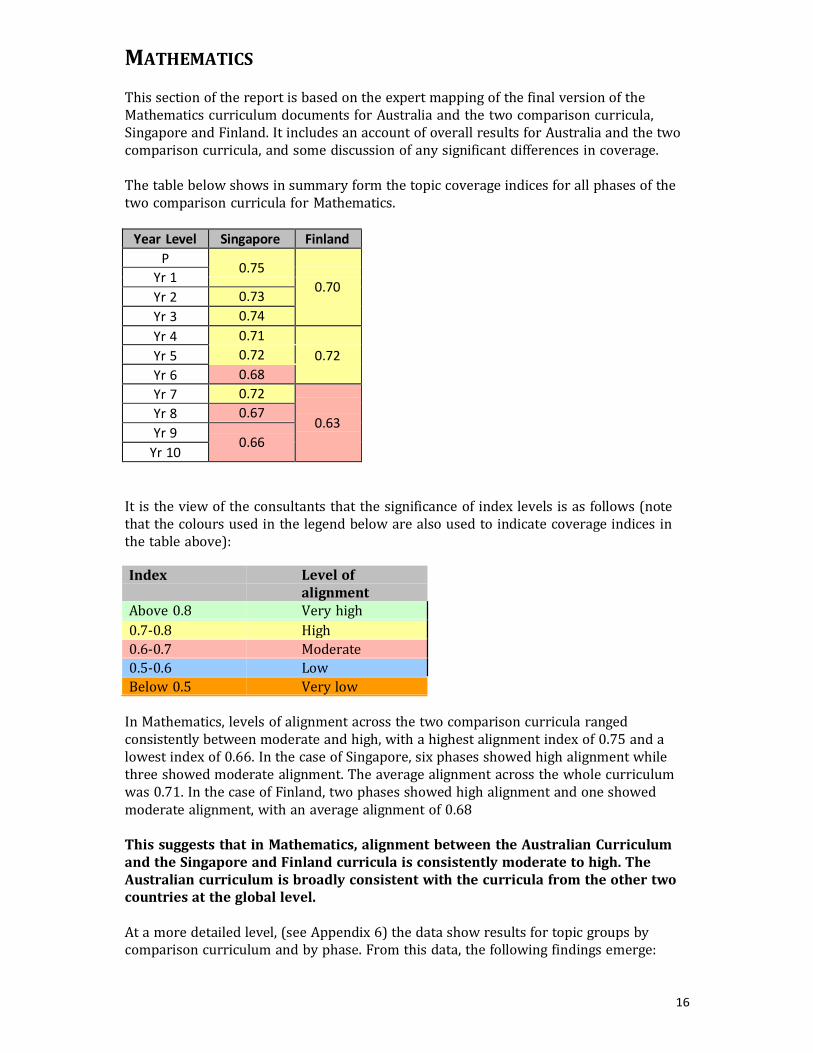
MATHEMATICS
This section of the report is based on the expert mapping of the final version of the Mathematics curriculum documents for Australia and the two comparison curricula, Singapore and Finland. It includes an account of overall results for Australia and the two comparison curricula, and some discussion of any significant differences in coverage.
The table below shows in summary form the topic coverage indices for all phases of the two comparison curricula for Mathematics.
Year Level Singapore Finland
P
0.75
Yr 1 0.70
Yr 2 0.73
Yr 3 0.74
Yr 4 0.71
Yr 5 0.72 0.72
Yr 6 0.68
Yr 7 0.72
0.63 Yr 8 0.67
Yr 9
0.66 Yr 10
It is the view of the consultants that the significance of index levels is as follows (note that the colours used in the legend below are also used to indicate coverage indices in the table above):
Index Level of
alignment Above 0.8 Very high
0.7‐0.8 High
0.6‐0.7 Moderate
0.5‐0.6 Low
Below 0.5 Very low
In Mathematics, levels of alignment across the two comparison curricula ranged consistently between moderate and high, with a highest alignment index of 0.75 and a lowest index of 0.66. In the case of Singapore, six phases showed high alignment while three showed moderate alignment. The average alignment across the whole curriculum was 0.71. In the case of Finland, two phases showed high alignment and one showed moderate alignment, with an average alignment of 0.68
This suggests that in Mathematics, alignment between the Australian Curriculum and the Singapore and Finland curricula is consistently moderate to high. The Australian curriculum is broadly consistent with the curricula from the other two countries at the global level.
At a more detailed level, (see Appendix 6) the data show results for topic groups by comparison curriculum and by phase. From this data, the following findings emerge:
17
1. In the case of Singapore, a number of topic groups showed material variations between the two curricula. The Australian curriculum has a significantly greater representation of ‘Number sense…’. At K‐1, Year 6 and Year 8 this difference is marked. ‘Measurement’ is also better represented in Australia, notably at K‐1, and Years 4, 5 and 8. ‘Instructional technology’ appears earlier in the Australian curriculum and is better represented at every year level from Year 2 onwards.
2. Conversely, Singapore has a significantly greater representation of ‘Operations’ up
to Year 5 and on average across the years of schooling. The story is similar with ‘Geometric concepts’, which constitutes a major focus in Singapore from the beginning of schooling. The group is also present throughout the Australian curriculum at a material level, but at a lower level.
3. Other differences, while less substantial, do reveal some patterns. Australia
introduces ‘General capabilities and processes’ earlier, and has a greater continuing focus, than in Singapore. The same is true of ‘Probability’, which appears through the Australian curriculum, but only in secondary school in Singapore. ‘Basic algebra’ is similarly present in both curricula in primary school, but stronger in Singapore in secondary.
4. In about half of the topic groups, the overall difference between the two countries
over the years of schooling is negligible. While the topic groups noted above do show patterns of difference, the overall position is that the Australian and Singapore mathematics curricula show acceptable levels of alignment.
5. In the case of Finland, the differences are similar in scale. It is notable that the
largest differences occur in those topic groups that have a material representation in both curricula. In most cases, it is not that one country makes a dramatically different set of choices about the focus of mathematics, but that where both countries see a topic group as a priority, one spends somewhat more time on the area.
6. It is worth noting however, that for the three topic groups where Finland shows a
materially greater representation than Australia, the direction of difference was the same as in the comparison with Singapore. The greatest variation occurs in ‘Geometric concepts’. Here, Finland spends materially more time on the topic group, though it is the third most prevalent topic group in the Australian curriculum. ‘Operations’ is more evident in the Finnish curriculum, but it is also the fourth most prevalent group in the Australian curriculum. ‘Basic algebra’ is also stronger in Finland overall, but stronger in Australia in the early years. These three topic groups were also stronger in the Singapore curriculum than in Australia.
7. The Australian curriculum is notably stronger in ‘Data displays’ throughout
schooling, and in ‘Probability’, especially in the primary years. ‘Consumer applications’, ‘Instructional technology’ and ‘General capabilities and processes’ are also somewhat more evident in Australia, but the differences are less material.
8. Again, as with Singapore, about half of the topic groups show negligible patterns of
difference, and alignment across the two curricula is at acceptable levels throughout the years of schooling.
9. In the case of cognitive demand, Singapore shows a materially greater focus across
the years of schooling on ‘Solve non‐routine problems/make connections’ (most
18
notably in the later primary and early secondary years), while Australia has a materially greater focus on ‘Conjecture/generalise’. The comparison with Finland shows a similarly greater focus in Australia on ‘Conjecture/ generalise’ both overall and at all phases.
19
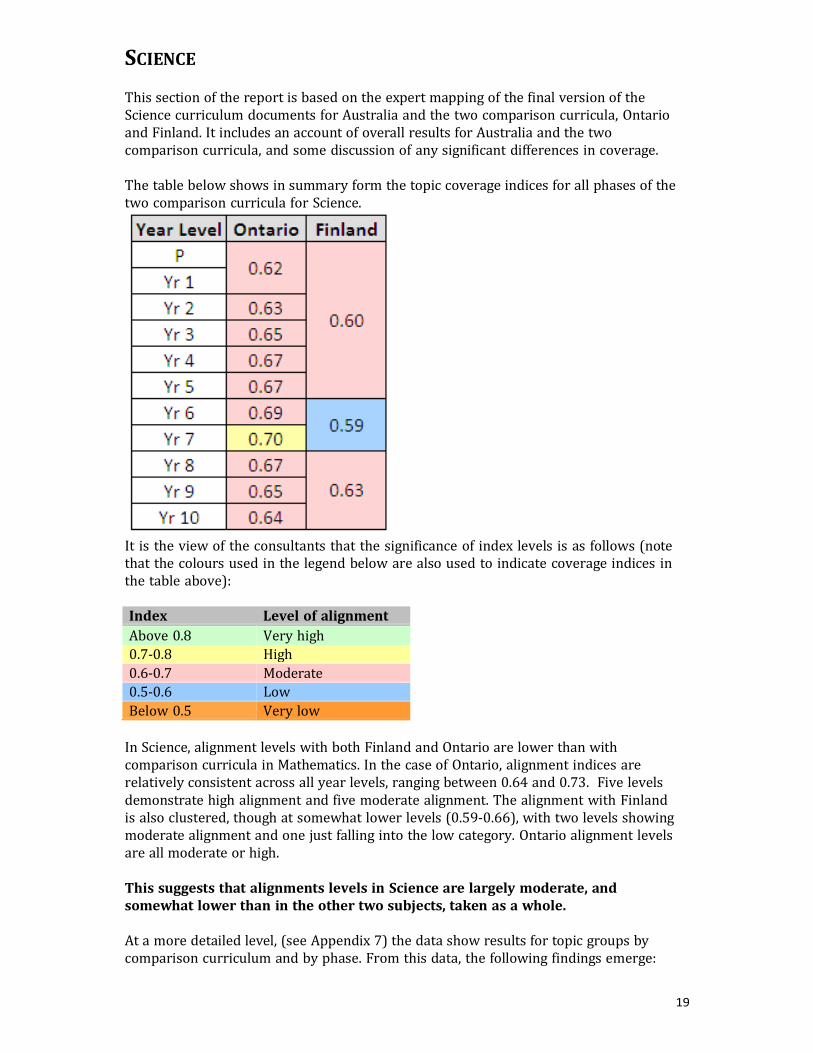
SCIENCE
This section of the report is based on the expert mapping of the final version of the Science curriculum documents for Australia and the two comparison curricula, Ontario and Finland. It includes an account of overall results for Australia and the two comparison curricula, and some discussion of any significant differences in coverage.
The table below shows in summary form the topic coverage indices for all phases of the two comparison curricula for Science.
It is the view of the consultants that the significance of index levels is as follows (note that the colours used in the legend below are also used to indicate coverage indices in the table above):
Index Level of alignment
Above 0.8 Very high
0.7‐0.8 High
0.6‐0.7 Moderate
0.5‐0.6 Low
Below 0.5 Very low
In Science, alignment levels with both Finland and Ontario are lower than with comparison curricula in Mathematics. In the case of Ontario, alignment indices are relatively consistent across all year levels, ranging between 0.64 and 0.73. Five levels demonstrate high alignment and five moderate alignment. The alignment with Finland is also clustered, though at somewhat lower levels (0.59‐0.66), with two levels showing moderate alignment and one just falling into the low category. Ontario alignment levels are all moderate or high.
This suggests that alignments levels in Science are largely moderate, and somewhat lower than in the other two subjects, taken as a whole.
At a more detailed level, (see Appendix 7) the data show results for topic groups by comparison curriculum and by phase. From this data, the following findings emerge:
20
1. The alignment of the Australian Science curriculum with that of Ontario is generally at acceptable levels, almost completely in the ‘Moderate’ range. A notable cause of this concerns the sequencing of elements of the science curriculum. This is particularly evident in the number of topic groups that appear at a material level in one curriculum at a level, but not in the other.
2. There are two broad possible explanations for this phenomenon. The first is that
the two curricula simply focus on different aspects of science. The second is that while they focus on similar aspects of science, they time and sequence them differently. The data support the second explanation. An examination of the prevalence of different topic groups across all the years of schooling reveals that there are no topic groups showing a material difference in overall coverage. The topic group with the greatest variation is ‘Nature of science’ where Australia has a greater focus across the curriculum than Ontario but the difference is not material. All topic groups show a relatively consistent overall coverage across the two curricula.
3. This makes clear that the material difference between Ontario and Australia in
Science is sequencing. Some examples illustrate the point. ‘Evolution’ receives its greatest focus in Australia at Years 7 and 10. In Ontario it is virtually absent from 7‐ 10, but represented in the primary years, especially Grade 6. ‘Animal biology’ is much better represented in Ontario at Grades 1, 2 and 10, but the reverse is true at most other years of schooling. ‘Human biology’ receives a major focus on Ontario at Grade 5 (where is almost unmentioned in the Australian curriculum) and Grade 10, but is a focus in Australia at Years 8 and 9. ‘Ecology’ is a major focus in Ontario at Grades 4 and 7 but in Australia at Years 6 and 8.
4. The differences between the two curricula are virtually all to do with the timing and
sequencing of topics, and hardly at all to do with significantly different overall emphases. There are, however, two topic groups which show relatively consistent differences. ‘Nature of science’ shows a somewhat greater representation of the topic group in Australia at every year level, the difference being especially marked at Years 5 and 6. This suggests a real difference in approach between the two countries, and a more explicit focus in this country on ideas about the practice of science. While the difference is less dramatic, ‘Measurement and calculation in science’ is also better represented in Australia at all levels except Years 8 and 9.
5. There are, therefore, some topic groups where there does appear to be a variation
in the value attributed to them by the two countries. In general, however, Australia and Ontario have made closely related decisions about what students should learn, but somewhat different decisions about when they should learn each topic group. This suggests that taking the curriculum as a whole, the levels of agreement between Ontario and Australia about the Science curriculum are very high.
6. In the case of Finland, alignment levels are somewhat lower, but this difference is
not strongly evident at the topic group level, partly because there are more groups and so fewer cases where a small number of groups dominate the coverage. The greatest variation occurs in the case of ‘Earth systems’ and ‘Ecology’ which are substantially better represented in the Australian curriculum at all levels. Finland shows somewhat stronger representation of ‘Science, health and environment’, ‘Human biology’, ‘Energy’, ‘Chemical reactions and formulas’ and ‘General capabilities and processes’ at all levels of schooling.
21
7. There are also isolated cases where there are significant differences in sequencing, but not in overall emphasis. ‘Components of living systems’ for example, is stronger in Finland in the early years, but this is reversed from Year 5 onwards. ‘Astronomy/space’ is stronger in the early and later years in Australia, but the reverse is true in the middle years. These differences appear to be variations in timing rather than emphasis.
8. Despite the somewhat lower levels of overall alignment, it is notable that 15 of the
29 topic groups show negligible levels of variation between Australia and Finland across the years of schooling. While the indices show moderate levels of alignment between the Finnish and Australian science curricula, it seems that the material variation is largely confined to a small number of topic groups.
9. In the case of cognitive demand, it is notable that there are no overall material
variations between Australia and Ontario in science. Even at specific years levels, there are very few examples of material variation. This suggests a very high degree of alignment in cognitive demand. The position with Finland is, however, different. Finland has a materially greater representation of ‘Communicate understanding of science concepts’ and a greater focus on ‘Perform procedures/investigate’. Australia has a greater focus on both ‘Analyse information and advance scientific argument’ and ‘Apply concepts/make connections’.
22
APPENDIX 1: INTERNATIONAL MAPPING PROPOSAL
Introduction
The draft Australian curricula for English, mathematics, science and history, K-10, have been
mapped to both the curriculum documentation in each of the states and territories and to what
a significant sample of teachers around Australia actually teach. ACARA now seeks a
proposal for the conduct of a mapping process to compare the Australian Curriculum with
international peers. It is anticipated that the process would be conducted using the final
released version of the curriculum. This proposal concerns the four subjects developed as part
of Stage 1.
Issues to resolve
There are two issues to consider prior to the development of a detailed proposal. The first
concerns which subjects would be able to be mapped internationally. The second concerns
the identification of appropriate international peers.
Which subjects? Of the four subjects developed to date, it is likely that mathematics would be most amenable
to international comparison. This reflects the fact that mathematics is subject to considerable
international commonality and is not unduly affected by cultural matters. The review of the
Porter survey instrument for mathematics led to relatively limited changes to suit Australian
curriculum although it was clear that the Australian reviewers (nominated by ACARA) felt
that the changes were worth making. It is likely that the instrument would be useable
internationally, but this would need to be resolved with potential international partners if they
were to be involved in the mapping process.
Science is also likely to be generally comparable internationally, although there are some
variations in subject arrangements that could make the comparison more difficult in some
jurisdictions. In Hong Kong, for example, primary school science is incorporated in General
Studies, which also includes Social Studies and Health Education. In Singapore, science is
not taught until Year 3. These variations would make the form of international mapping in
science more problematic, but ways could be found to accommodate them.
English should also be manageable for international mapping, though it may be somewhat
more difficult than mathematics. English teaching is somewhat more culturally specific than
mathematics, in that the theoretical framework of English teaching is somewhat culturally
specific, and it is possible that some approaches and references might be unfamiliar to some
international curriculum raters. The Australian survey, for example, includes elements to do
with Viewing (eg ‘screen conventions’ under Text and print features) which were not part of
the US survey and which may not be familiar to raters in other countries. The Australian
version also includes more material related to a view of English as culturally located, such as
‘Use of language to generate different responses’ and ‘Relationship of form and structure of
language use to cultural context’ (both under Language study) which may not be as familiar
to international raters. These differences are, however, relatively minor and could be
accommodated by noting them for international raters.
A further issue potentially affecting English concerns some of the likely peer nations.
Singapore and Hong Kong, for example, have student cohorts for whom English is not
always their first language, and it is possible that their curriculum documents in English are
affected by the need to deal with multiple official languages. This could make mapping a less
useful exercise. On the other hand, these are two of our natural regional peers, and would
provide valuable comparisons.
23
In the case of history, the survey instrument was almost completely rewritten for Australian
use. It was clear that the Porter survey would not be suitable to mapping history in this
country because of the volume of Australia-specific material contained in the draft
curriculum document. This issue will recur in any international mapping process, and is
likely to make any international history mapping impossible except by using a generic survey
stripped of content identifiers. This is not likely to be a useful approach. This difficulty is
exacerbated by the limited extent to which history is identified as a separate subject in some
primary school curricula. In Singapore it is part of Social Studies in the primary years. In
Hong Kong it is part of General Studies in primary schools.
On the basis of this analysis, it is proposed that international mapping of English,
mathematics and science would be feasible, but that history is not feasible.
Which international peers? The second issue requiring resolution concerns which countries would provide appropriate
and feasible comparison curriculum documents. The discussion below is intended to provide
a basis for the establishment of a short list of criteria, some of which should be mandatory
and some of which constitute preferences. These criteria should guide the choice of
international mapping partners.
Mandatory criteria
1. The curricula for comparison must be written in English. It is not realistic to compare
curricula across linguistic boundaries. Apart from those cases where the curriculum is
written in a language other than English, there are cases where English is not the
medium of instruction in schools (eg Hong Kong), or where English is the medium of
instruction but most students have a different mother tongue (eg Singapore). It will be
important to determine the extent to which variations of this kind would affect the
validity of the comparison.
2. Comparison nations must have a relatively well-established system of universal or
near-universal primary and secondary education, at least up to the middle years of
secondary schooling. In India, for example, fewer than 40% of adolescents attend
secondary school, half of India’s students leave school by 14 and half of 10-year-old
children cannot read at a basic level. These circumstances mean that a curriculum
mapping comparison would be less meaningful and would carry little weight with users
of the data.
3. The years of schooling must be broadly comparable with those for Australia. It is
worth noting that PISA, for example, avoids this problem by sampling students by age
rather than by year of schooling. Table 1 below illustrates some of the variations in
equivalent year levels up to Australia’s Year 10 between some natural comparison
systems. It illustrates some practical difficulties in the development of international
comparisons, although it also demonstrates that the difficulties largely occur in the first
year or two of schooling. On the basis of the data below, it is proposed that each of
these curricula would be suitable for mapping because the differences are relatively
minor.
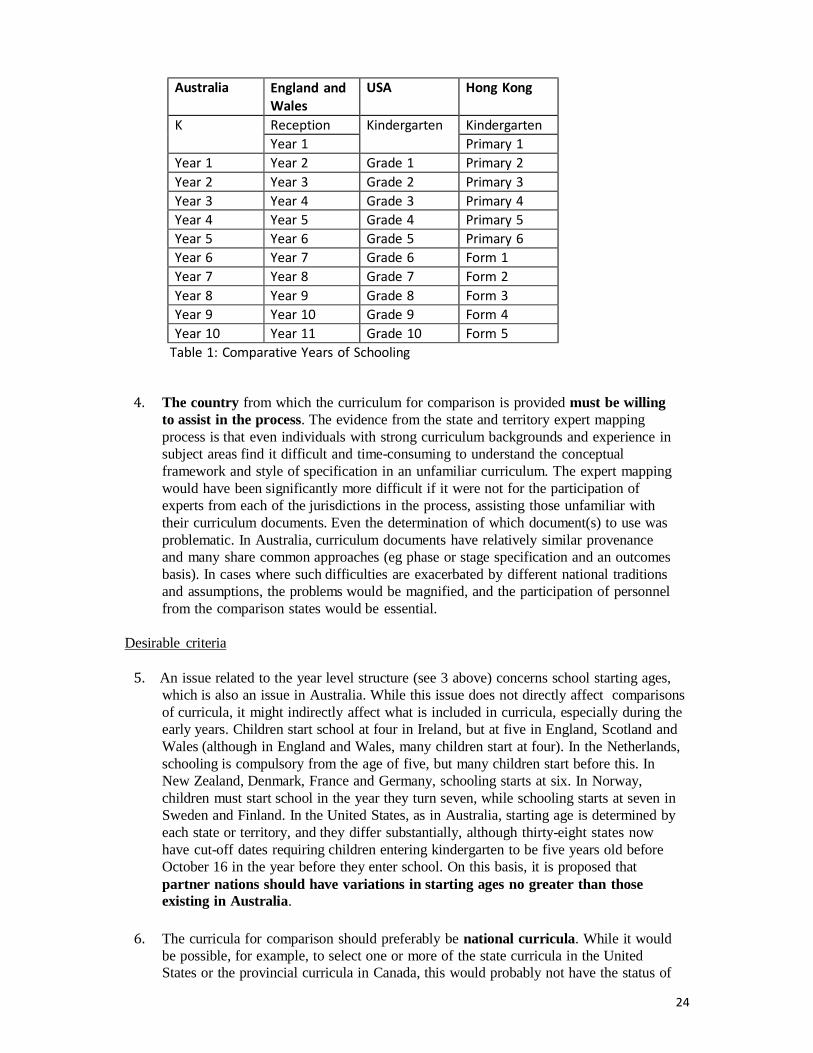
24
Australia England and Wales
USA Hong Kong
K Reception Kindergarten Kindergarten
Year 1 Primary 1
Year 1 Year 2 Grade 1 Primary 2
Year 2 Year 3 Grade 2 Primary 3
Year 3 Year 4 Grade 3 Primary 4
Year 4 Year 5 Grade 4 Primary 5
Year 5 Year 6 Grade 5 Primary 6
Year 6 Year 7 Grade 6 Form 1
Year 7 Year 8 Grade 7 Form 2
Year 8 Year 9 Grade 8 Form 3
Year 9 Year 10 Grade 9 Form 4
Year 10 Year 11 Grade 10 Form 5
Table 1: Comparative Years of Schooling
4. The country from which the curriculum for comparison is provided must be willing
to assist in the process. The evidence from the state and territory expert mapping
process is that even individuals with strong curriculum backgrounds and experience in
subject areas find it difficult and time-consuming to understand the conceptual
framework and style of specification in an unfamiliar curriculum. The expert mapping
would have been significantly more difficult if it were not for the participation of
experts from each of the jurisdictions in the process, assisting those unfamiliar with
their curriculum documents. Even the determination of which document(s) to use was
problematic. In Australia, curriculum documents have relatively similar provenance
and many share common approaches (eg phase or stage specification and an outcomes
basis). In cases where such difficulties are exacerbated by different national traditions
and assumptions, the problems would be magnified, and the participation of personnel
from the comparison states would be essential.
Desirable criteria
5. An issue related to the year level structure (see 3 above) concerns school starting ages,
which is also an issue in Australia. While this issue does not directly affect comparisons
of curricula, it might indirectly affect what is included in curricula, especially during the
early years. Children start school at four in Ireland, but at five in England, Scotland and
Wales (although in England and Wales, many children start at four). In the Netherlands,
schooling is compulsory from the age of five, but many children start before this. In
New Zealand, Denmark, France and Germany, schooling starts at six. In Norway,
children must start school in the year they turn seven, while schooling starts at seven in
Sweden and Finland. In the United States, as in Australia, starting age is determined by
each state or territory, and they differ substantially, although thirty-eight states now
have cut-off dates requiring children entering kindergarten to be five years old before
October 16 in the year before they enter school. On this basis, it is proposed that
partner nations should have variations in starting ages no greater than those
existing in Australia.
6. The curricula for comparison should preferably be national curricula. While it would
be possible, for example, to select one or more of the state curricula in the United
States or the provincial curricula in Canada, this would probably not have the status of
25
comparisons involving national curricula, and could provide additional barriers to
comparison (eg local specificity). These curricula are, however, easily available for
mapping and would have considerable structural and other similarities to Australian
curricula, making the process more manageable. It should be noted that the
involvement of American states in the process could raise an issue about the adaptation
of the Porter methodology and survey instruments, since some would have participated
in mapping using the original methodology and surveys. It could also, however, be
valuable because of the potential availability of trained raters (and possibly of existing
data for a large proportion of the survey items).
7. A further complication concerns the extent to which countries have differentiated
curricula, especially in the secondary school. In Singapore, the results of the Primary
School Leaving Examination determine which of four secondary education tracks
students enter. Each track has its own curriculum structure. This makes the
identification of the appropriate curriculum for mapping more difficult. It is proposed
that curricula for mapping should be mainstream curricula designed to cater for a
wide range of normal performance.
8. The curricula for comparison should preferably be articulated at year levels (at least
in explanatory or support documents) rather than phases or stages of schooling. In the
Australian mapping, the comparison of the year level basis of the Australian
Curriculum with phase- or stage-based state and territory curricula was managed
through the use of an algorithm to enable the comparison. While this approach works,
it adds an additional layer of complexity in the process. International comparisons will
already involve additional degrees of difficulty and complexity, and it would be best to
avoid unnecessary additional complications.
9. It would also be desirable for comparisons to be made with nations that have had a
degree of success in international assessment programs. There is little point in a
comparison with a nation that has been identified as performing poorly by comparison
with Australia, in part because the comparison will carry less weight with users.
10. There may also be an issue in some cases about the style in which the curriculum is
written, and its accessibility to international raters. This is a marginal issue, but it is
proposed that curricula for mapping should be checked for style to ensure
comparability. This extract from the Scottish Curriculum for Excellence document for
Literacy and English at the second curriculum level (covering learning up to the end of
Primary year 7) illustrates a style issue which may affect the mapping process:
As I listen or watch, I can identify and discuss the purpose, main ideas and supporting
detail contained within the text, and use this information for different purposes.
As the set of issues identified above makes clear, the identification of partner nations with
which to compare curricula is complex. There are almost no curricula that satisfy all of the
criteria and preferences above. Singapore comes close. Its curriculum is written in English (as
well as Chinese), it has broadly similar arrangements for schooling, children start school at 6-
7 but have two years of Kindergarten before, it has a national curriculum, it does well in
international comparisons, has a well-established universal education system and its
curriculum is written in a familiar style. Its curriculum is not, however, clearly aligned with
year levels, and it has differentiated curricula for different tracks.
It is proposed that a review be undertaken to determine which curricula have the highest
degree of alignment with the criteria and preferences outlined above, that a selection of these
26
be made and that selected countries be approached to determine their interest in taking part in
international mapping.
The extent to which, and the means by which, resulting data would be published or otherwise
disseminated might affect the participation of other nations. It is likely that participating
nations would want the capacity to check the data before finalisation, and to exercise a degree
or control over the public use of data arising from the mapping of their curricula.
Process for mapping
In principle, it would be possible to adopt a range of different options for the conduct of the
mapping process. These could include:
• A model based directly on the Australian expert mapping process, with international
systems taking the place of states and territories. This is the preferred model discussed in
more detail below.
• A model involving each participating system mapping its own curriculum in situ, along
with one other curriculum, and submitting completed surveys. This would require a
training session in each participating country and assistance with survey completion. It
would be more difficult for participating experts to complete surveys of curricula with
which they were not familiar because of the absence of expert advice from those familiar
with the curriculum being mapped. This model is easier and less expensive to set up but
is likely to produce less reliable data.
• A model involving completion of all surveys by Australian experts from states and
territories (and ACARA if desired), followed by some checking process involving
experts from the participating systems. This approach would be the easiest and cheapest
to implement, and could probably draw on at least some experts already familiar with the
methodology, providing them with a valuable professional development experience. The
lack of involvement in the survey process of experts from the participating jurisdictions
would, however, substantially weaken the process. It is difficult to see why other
systems would agree to a process of this kind, since it puts responsibility for mapping
their curricula (and using the results) in other hands.
Variations could be developed around each of these models. On balance, however, based on
the integrity of the process, the first model is recommended. The conduct of international
mapping should be based as far as possible on the existing Australian methodology, and must
use the Australian surveys so the data is directly comparable. The process should include the
following elements:
• Involvement of personnel from each of the participating systems in the mapping process.
This is designed to ensure that the curricula to be mapped are well understood and that
personnel who are familiar with each document are available to assist other raters in
making judgments. In the Australian mapping process, it was clear that some raters
found it difficult to grasp the conceptual organisation of curricula from other
jurisdictions and that this affected their capacity to make reliable judgments. This
difficulty may be greater with international raters and curricula.
• Face-to-face training to ensure that all raters understand the methodology. In the
Australian experience, even with face-to-face training some raters found it difficult to
understand and apply the methodology.
• Allocation of raters to their own and one other curriculum to ensure that each curriculum
is rated by experts who are familiar with it, and by experts who are independent.
• Engagement of raters for at least three full days to allow them to become familiar with
the methodology and to practice the rating process prior to completion of a survey. In the
Australian case, although most raters were involved for at least two full days, some took
27
a considerable time to master the methodology and some found it impossible to complete
two full surveys in the time available. Following the training and survey completion
session, it was difficult to persuade raters to complete and submit unfinished surveys.
• Use of the online survey process to simplify and systematize the process.
The consultants who took responsibility for the Australian mapping, or by others nominated
by ACARA could manage such a process.
In addition, it will be necessary to develop a means for involving participating countries. This
process should involve the preparation of a statement about how countries were selected for
invitation to participate, a detailed summary of the process to be involved, the expectations of
participants and the rules governing the publication and use of the resulting data.
Recommendations
11. That if ACARA decides to proceed with an international mapping process, the procedure
for the Australian expert mapping process be adopted.
12. That the international mapping process focus on English, mathematics and science at
Years K-10.
13. That a review be undertaken to determine which international curricula have the highest
degree of alignment with the criteria and preferences outlined above, that a selection of
these be made and that selected countries be approached to determine their interest in
taking part in international mapping.
14. That a protocol be prepared for participating jurisdictions outlining:
• how countries were selected for invitation to participate;
• the process to be involved including required elements;
• expectations of participants; and
• rules governing how data from the survey would be quality assured and how control
of publication, dissemination and use would be managed.
28
APPENDIX 2: INTERNATIONAL MAPPING REPORT
Introduction
ACARA has decided to map the final version of the Australian Curriculum in English,
Science and Mathematics against selected international curricula to provide benchmarks for
the new curriculum. It was resolved not to map History because of substantial content
differences between countries. This paper provides advice on which international curricula
are most appropriate to the task.
Criteria
The consultants prepared a paper at the request of ACARA setting out, inter alia, criteria for
the selection of international comparison curricula and arguments for the adoption of these
criteria. The criteria were divided into two categories: Mandatory Criteria, which must be met
for the curriculum to be considered; and Desirable Criteria, which would be used to
discriminate between the curricula that met the Mandatory Criteria. The criteria are as
follows:
Mandatory criteria
11. The curricula for comparison must be written in English.
12. Comparison nations must have a relatively well-established system of universal or
near-universal primary and secondary education, at least up to the middle years of
secondary schooling.
13. The years of schooling must be broadly comparable with those for Australia.
14. The country from which the curriculum for comparison is provided must be willing
to assist in the process.
Note that criterion 4 has been ignored in this paper, because it requires contact with potential
comparison jurisdictions, which is not necessary until a later stage of the process.
Desirable criteria
15. Partner nations should have variations in starting ages no greater than those
existing in Australia.
16. The curricula for comparison should preferably be national curricula.
17. The curricula for mapping should be mainstream curricula designed to cater for a
wide range of normal performance.
18. The curricula for comparison should preferably be articulated at year levels (at least
in explanatory or support documents) rather than phases or stages of schooling
19. It would also be desirable for comparisons to be made with nations that have had a
degree of success in international assessment programs.
20. Curricula for mapping should be checked for style to ensure comparability.
The consultants’ paper proposed that an initial review be conducted of potential comparison
curricula and a paper prepared recommending appropriate curricula in priority order. This
paper is intended to satisfy that recommendation.
29
The original paper noted that there appeared to be no curricula that satisfied all of the criteria.
Criterion 1: The curricula for comparison must be written in English.
The first criterion, that the curriculum be written in English, if strictly applied, would rule out
most of the potential comparison curricula. Other than Australia, of the countries which
performed best in Programme for International Student Assessment (PISA) Science, Reading
and Mathematics in 2006 (scoring at or higher than the OECD average in all subjects) for
example, only five candidates have curricula written in English: Canada, New Zealand, Hong
Kong, the United Kingdom and Ireland. Note that curriculum in the United Kingdom consists
of the Scottish Curriculum and the National Curriculum for England, Wales and Northern
Ireland.
Apart from these candidate countries, Singapore, which also has a curriculum written in
English (as well as Chinese), did not participate in PISA 2006 but has performed well in
other test years. The United States has curricula written in English (but has no national
curriculum and has not generally performed well in PISA).
Some countries which do not have curricula written in English have translations into English.
Finland, which has been the most consistent high performer in PISA, is one example. The
Finnish translated curriculum is of good quality, so has been included in the next stage of the
analysis because of the extremely high international reputation of Finnish education.
The eight curricula selected for further analysis are:
Canada
New Zealand Hong Kong
England, Wales and Northern Ireland
Scotland
Singapore
Finland
United States
Criterion 2: Comparison nations must have a relatively well-established system of
universal or near-universal primary and secondary education
All eight of the potential comparison curricula come from countries with effectively universal
education systems.
30
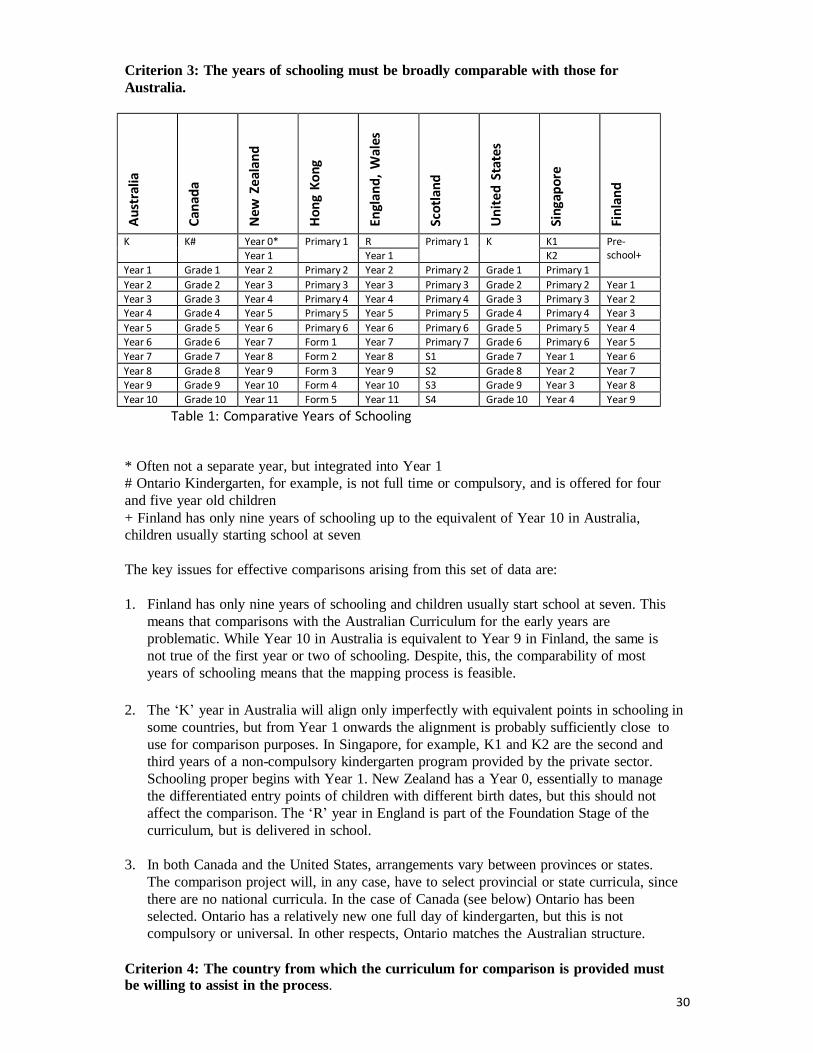
Criterion 3: The years of schooling must be broadly comparable with those for
Australia.
Au
stra
lia
Can
ada
New
Zea
lan
d
Ho
ng
Ko
ng
Engl
and
, W
ales
Sco
tlan
d
Un
ite
d S
tate
s
Sin
gap
ore
Fin
lan
d
K K# Year 0* Primary 1 R Primary 1 K K1 Pre‐ school+ Year 1 Year 1 K2
Year 1 Grade 1 Year 2 Primary 2 Year 2 Primary 2 Grade 1 Primary 1
Year 2 Grade 2 Year 3 Primary 3 Year 3 Primary 3 Grade 2 Primary 2 Year 1
Year 3 Grade 3 Year 4 Primary 4 Year 4 Primary 4 Grade 3 Primary 3 Year 2 Year 4 Grade 4 Year 5 Primary 5 Year 5 Primary 5 Grade 4 Primary 4 Year 3
Year 5 Grade 5 Year 6 Primary 6 Year 6 Primary 6 Grade 5 Primary 5 Year 4 Year 6 Grade 6 Year 7 Form 1 Year 7 Primary 7 Grade 6 Primary 6 Year 5
Year 7 Grade 7 Year 8 Form 2 Year 8 S1 Grade 7 Year 1 Year 6
Year 8 Grade 8 Year 9 Form 3 Year 9 S2 Grade 8 Year 2 Year 7 Year 9 Grade 9 Year 10 Form 4 Year 10 S3 Grade 9 Year 3 Year 8
Year 10 Grade 10 Year 11 Form 5 Year 11 S4 Grade 10 Year 4 Year 9
Table 1: Comparative Years of Schooling
* Often not a separate year, but integrated into Year 1
# Ontario Kindergarten, for example, is not full time or compulsory, and is offered for four
and five year old children
+ Finland has only nine years of schooling up to the equivalent of Year 10 in Australia,
children usually starting school at seven
The key issues for effective comparisons arising from this set of data are:
1. Finland has only nine years of schooling and children usually start school at seven. This
means that comparisons with the Australian Curriculum for the early years are
problematic. While Year 10 in Australia is equivalent to Year 9 in Finland, the same is
not true of the first year or two of schooling. Despite, this, the comparability of most
years of schooling means that the mapping process is feasible.
2. The ‘K’ year in Australia will align only imperfectly with equivalent points in schooling in
some countries, but from Year 1 onwards the alignment is probably sufficiently close to
use for comparison purposes. In Singapore, for example, K1 and K2 are the second and
third years of a non-compulsory kindergarten program provided by the private sector.
Schooling proper begins with Year 1. New Zealand has a Year 0, essentially to manage
the differentiated entry points of children with different birth dates, but this should not
affect the comparison. The ‘R’ year in England is part of the Foundation Stage of the
curriculum, but is delivered in school.
3. In both Canada and the United States, arrangements vary between provinces or states.
The comparison project will, in any case, have to select provincial or state curricula, since
there are no national curricula. In the case of Canada (see below) Ontario has been
selected. Ontario has a relatively new one full day of kindergarten, but this is not
compulsory or universal. In other respects, Ontario matches the Australian structure.
Criterion 4: The country from which the curriculum for comparison is provided must
be willing to assist in the process.
31
This criterion is not in use at this stage of the analysis (see above)
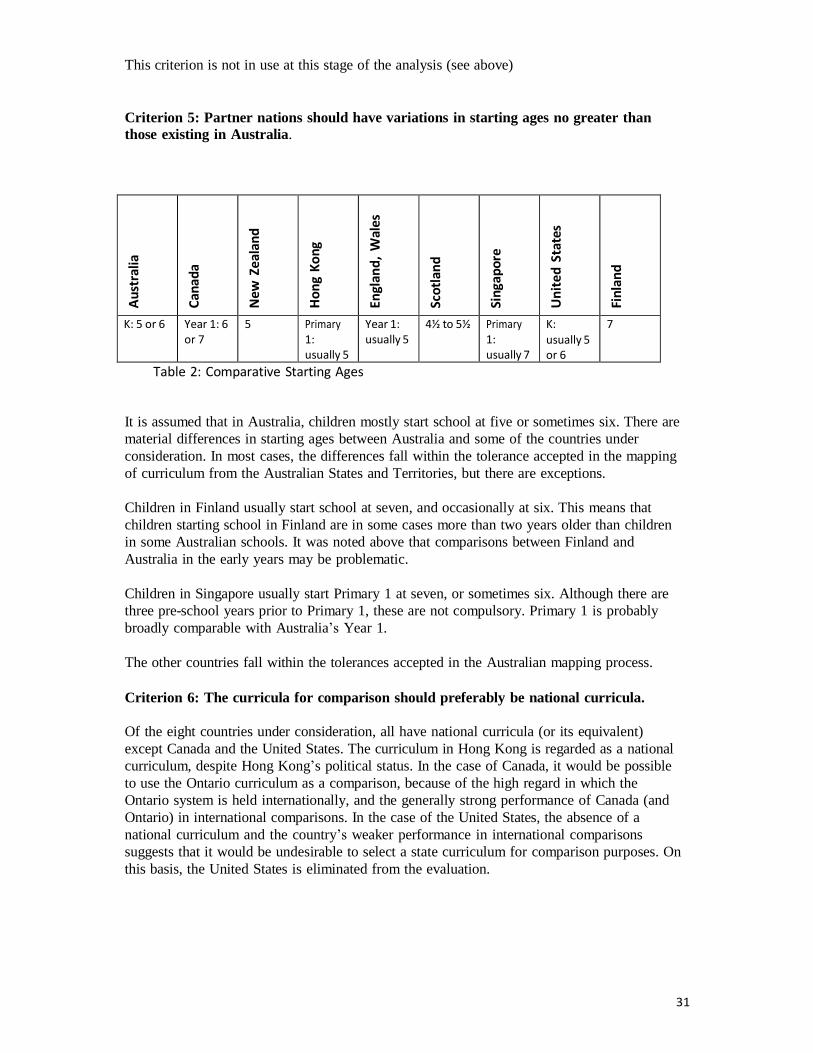
Criterion 5: Partner nations should have variations in starting ages no greater than
those existing in Australia.
Au
stra
lia
Can
ada
New
Zea
lan
d
Ho
ng
Ko
ng
Engl
and
, W
ales
Sco
tlan
d
Sin
gap
ore
Un
ite
d S
tate
s
Fin
lan
d
K: 5 or 6 Year 1: 6 or 7
5 Primary 1: usually 5
Year 1: usually 5
4½ to 5½ Primary 1: usually 7
K: usually 5 or 6
7
Table 2: Comparative Starting Ages
It is assumed that in Australia, children mostly start school at five or sometimes six. There are
material differences in starting ages between Australia and some of the countries under
consideration. In most cases, the differences fall within the tolerance accepted in the mapping
of curriculum from the Australian States and Territories, but there are exceptions.
Children in Finland usually start school at seven, and occasionally at six. This means that
children starting school in Finland are in some cases more than two years older than children
in some Australian schools. It was noted above that comparisons between Finland and
Australia in the early years may be problematic.
Children in Singapore usually start Primary 1 at seven, or sometimes six. Although there are
three pre-school years prior to Primary 1, these are not compulsory. Primary 1 is probably
broadly comparable with Australia’s Year 1.
The other countries fall within the tolerances accepted in the Australian mapping process.
Criterion 6: The curricula for comparison should preferably be national curricula.
Of the eight countries under consideration, all have national curricula (or its equivalent)
except Canada and the United States. The curriculum in Hong Kong is regarded as a national
curriculum, despite Hong Kong’s political status. In the case of Canada, it would be possible
to use the Ontario curriculum as a comparison, because of the high regard in which the
Ontario system is held internationally, and the generally strong performance of Canada (and
Ontario) in international comparisons. In the case of the United States, the absence of a
national curriculum and the country’s weaker performance in international comparisons
suggests that it would be undesirable to select a state curriculum for comparison purposes. On
this basis, the United States is eliminated from the evaluation.
32
Criterion 7: The curricula for mapping should be mainstream curricula designed to
cater for a wide range of normal performance.
Most systems under consideration have a common mainstream curriculum.
Singapore conducts a Primary School Leaving Examination at the end of Primary 6, and on
the basis of results in this assessment students are placed in different secondary education
streams. While Mathematics in primary is common, there are different Mathematics curricula
for the different streams in secondary. In the Normal (Technical) and Normal (Academic)
streams, Science is not compulsory, but is available as an elective. Science is common in
primary school, but syllabuses seem to reflect the different streams in secondary school.
The other countries involved have an essentially mainstream curriculum structure, despite
opportunities in some systems (eg Hong Kong) for subject and course choices in the middle
of secondary school.
Criterion 8: The curricula for comparison should preferably be articulated at year
levels (at least in explanatory or support documents) rather than phases or stages of
schooling
The value of a curriculum written in year levels is that it enables an easy comparison with
Australia. Curricula written in phases or stages can be compared relatively easily if the
phases are directly linked to year levels. Where loosely-coupled phases are provided, the
phases need to be formally linked to specific year levels to enable the mapping report to be
written.
Only Ontario’s curriculum is fully articulated at year levels. Hong Kong’s curriculum is laid
out in Key Stages, but units are allocated to year levels, so it is easily comparable with
Australia.
Singapore curriculum varies in its structure. Mathematics is set out in year levels. Science is
presented in multi-year blocks (eg Primary 3-6).
In England, Wales and Northern Ireland, curriculum is articulated in key stages comprising
specified years of schooling. In the case of Finland, the curriculum is set out in three phases
up to the end of Year 9 (equivalent to Year 10 in Australia). In Scotland, the curriculum is set
out in five levels that are only loosely linked with year levels. New Zealand’s standards are
set out over eight levels, of which about six are related to Years K-10, though the alignment
is loose.
Criterion 9: It would also be desirable for comparisons to be made with nations that
have had a degree of success in international assessment programs.
All curricula selected for evaluation come from countries that have performed well in
international assessment programs such as PISA, Trends in International Mathematics and
Science Study (TIMSS) and Progress in International Reading Literacy Study (PIRLS). All
seven remaining curricula satisfy this criterion. Finland was the best performing country in
PISA 2006 Mathematics, Reading and Science and has an exceptionally strong international
reputation.
33
Of the other countries under consideration, Hong Kong, Canada and New Zealand had the
best results in each of Reading, Mathematics and Science. In each case, the United Kingdom
was at or above the OECD average. Singapore did not participate in PISA in 2006.
TIMSS results in 2007 showed Hong Kong and Singapore were the best performing
countries, Singapore having been the best performer in 1995 and 2003.
Hong Kong and Singapore did best in PIRLS in 2006 along with Ontario. England performed
better than Scotland and New Zealand, though all were above the PIRLS average.
Criterion 10: Curricula for mapping should be checked for style to ensure
comparability.
Curricula from most of the countries/regions included for evaluation follow a style that is
sufficiently consistent with the writing of the Australian Curriculum to enable effective
comparison. This is particularly the case for Ontario, Singapore and Finland and the new
curriculum in New Zealand.
The Scottish curriculum adopts a different style of writing:
To help me develop an informed view, I am learning to recognise the difference
between fact and opinion
While this is distinctive, it may be amenable to comparison, though the style would probably
make the comparison task somewhat more difficult.
Other Issues
A further set of issues concerns the way in which specific subjects are articulated in the
curriculum or offered in schools.
Hong Kong does not offer Science as a standard subject in primary schools, although it is
taught in some schools. Science in the primary school curriculum is incorporated as part of a
General Studies course. Finland divides Science into a number of parts: Environmental and
Natural Sciences (or studies), appearing at Years 1-4; Biology and Geography appearing as a
single subject at Years 5-6; Biology at Years 7-9; Physics and Chemistry at Year 5-6; and
Physics and Chemistry separately at Years 7-9. This is complex, but does offer a rich set of
data for comparison. Singapore does not include Science in its curriculum statement until
Primary 3.
The position of English in Finland, Hong Kong and Singapore means that it would probably
be inappropriate to use curricula in these countries as comparison documents with Australia.
In Hong Kong, only a handful of schools can maintain English as the medium of instruction,
so that English is very widely a second language in schools. In Singapore, although education
is largely conducted in English, it is a second language for a proportion of students. In
Finland, English is almost universally a second language.
In addition, there are political and educational judgments to make about those countries that
would most generally be viewed as appropriate benchmarks for Australia. It is probably the
case, for example, that in the general community economically successful countries will be
seen as better benchmarks, while in the educational community countries which do better in
international assessments may be seen as more appropriate.
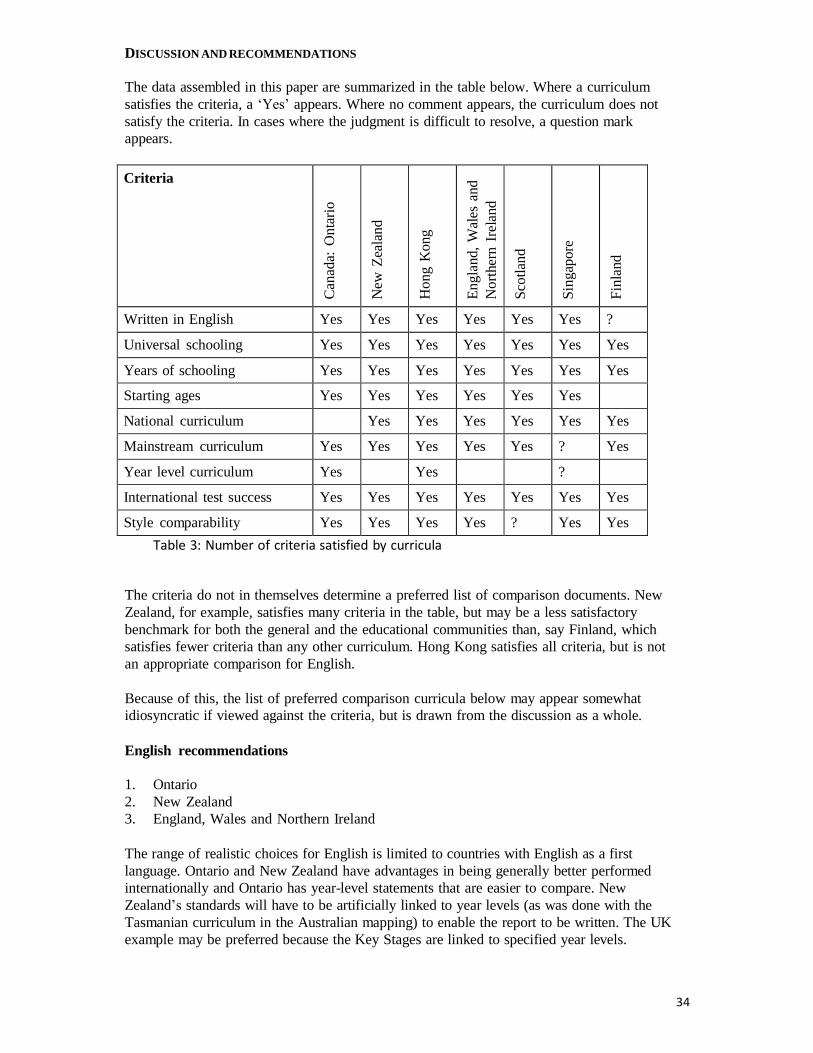
34
DISCUSSION AND RECOMMENDATIONS
The data assembled in this paper are summarized in the table below. Where a curriculum
satisfies the criteria, a ‘Yes’ appears. Where no comment appears, the curriculum does not
satisfy the criteria. In cases where the judgment is difficult to resolve, a question mark
appears.
Criteria
Can
ada:
On
tari
o
New
Zea
lan
d
Ho
ng K
ong
En
gla
nd,
Wal
es a
nd
No
rther
n I
rela
nd
Sco
tlan
d
Sin
gap
ore
Fin
land
Written in English Yes Yes Yes Yes Yes Yes ?
Universal schooling Yes Yes Yes Yes Yes Yes Yes
Years of schooling Yes Yes Yes Yes Yes Yes Yes
Starting ages Yes Yes Yes Yes Yes Yes
National curriculum Yes Yes Yes Yes Yes Yes
Mainstream curriculum Yes Yes Yes Yes Yes ? Yes
Year level curriculum Yes Yes ?
International test success Yes Yes Yes Yes Yes Yes Yes
Style comparability Yes Yes Yes Yes ? Yes Yes
Table 3: Number of criteria satisfied by curricula
The criteria do not in themselves determine a preferred list of comparison documents. New
Zealand, for example, satisfies many criteria in the table, but may be a less satisfactory
benchmark for both the general and the educational communities than, say Finland, which
satisfies fewer criteria than any other curriculum. Hong Kong satisfies all criteria, but is not
an appropriate comparison for English.
Because of this, the list of preferred comparison curricula below may appear somewhat
idiosyncratic if viewed against the criteria, but is drawn from the discussion as a whole.
English recommendations
1. Ontario
2. New Zealand
3. England, Wales and Northern Ireland
The range of realistic choices for English is limited to countries with English as a first
language. Ontario and New Zealand have advantages in being generally better performed
internationally and Ontario has year-level statements that are easier to compare. New
Zealand’s standards will have to be artificially linked to year levels (as was done with the
Tasmanian curriculum in the Australian mapping) to enable the report to be written. The UK
example may be preferred because the Key Stages are linked to specified year levels.
35
Mathematics recommendations
1. Singapore
2. Finland
3. Hong Kong
Singapore provides a strong comparison because of the country’s strong reputation in
Mathematics and the fact that Mathematics is presented in year levels enabling easy
comparison. A selection will need to be made of the secondary streamed curricula: it is
proposed that the ‘O Level’ mathematics syllabus be used as the syllabus that leads on to
further study. Finland, despite some difficulties in year alignments with Australia, is
demonstrably the best performing nation internationally in Mathematics and Science, and has
a very well articulated curriculum. Hong Kong’s curriculum is laid out in Key Stages, but
units are allocated to year levels, so it is more easily comparable. Hong Kong also has a strong
Mathematics reputation.
Science recommendations
1. Ontario
2. Finland
3. Singapore
Ontario aligns well with Australia, has a strong reputation in science and has a curriculum
which is relatively easy to map. Finland, despite some difficulties in year alignments with
Australia, is demonstrably the best performing nation internationally in Mathematics and
Science, and has a very well articulated curriculum. Singapore’s Science curriculum is clearly
strong but does not start until Primary 3 and has a streamed structure in the secondary years.
Singapore does, however, perform exceptionally well in international tests.
36
APPENDIX 3: PORTER SOURCE METHODOLOGY
The methodology selected to address this task is based on an approach developed by
Porter, Polikoff and Smithson1, who established a ‘uniform language’ for describing curriculum content, which was then used to analyse and compare curriculum frameworks (the intended curriculum), classroom practice (the enacted curriculum) and assessment regimes (the assessed curriculum). The language can also be used to describe the content of assessment items, text‐books and teaching materials. The uniform language developed by the researchers involves two components:
• a language for describing in detail the knowledge base in each of English, science, history and mathematics; and
• a language for describing the ‘cognitive demand’ of each area, based on a
hierarchy of performance expectations.
The first of these consists of lists of topics arranged in broad content categories in each subject domain. In English, for example, the topic group of ‘Language Study’ includes topics
such as ‘spelling’ and ‘effects of race, gender or ethnicity on language and language use’. In Science, ‘ecosystems’ and ‘adaptation and variation’ appear as topics within ‘Ecology’. The lists of topics are intended to be complete and universal, so that they could be used to describe any curriculum in the relevant domain, regardless of year level, context or level of complexity.
The second category, ‘cognitive demand’, consists of descriptions of what students can do with particular knowledge. These descriptions are different for each learning area, though they are based on a similar hierarchy of demands consisting of five levels in categories like the following:
• memory and recall
• performing procedures
• communicating, demonstrating, explaining, creating
• analysis, argument and investigation
• evaluation and application in different contexts
Porter (2004: 3) argues that ‘the content language for an academic subject should be exhaustive in its inclusion of all possible types of content, and it should be common in the sense that the same language is used across studies and purposes’. He proposes that the
terms used in the uniform language should have a common meaning to different people and over time. The tool for analysis using these categories is a survey listing the knowledge base and cognitive demand applying to a subject area (eg English or mathematics). The strength of the surveys arises from the interaction of these two categories: respondents (usually curriculum developers or teachers) are asked to respond on a matrix that requires them to indicate whether, for example, a curriculum framework being considered includes:
• a specific topic;
• if so, to what extent; and
• at what level of cognitive demand students are expected to operate in relation to that topic.
A mathematics framework might, for example, include the expectation that a student will use a linear equation (the topic) to solve a novel problem (the cognitive demand). In English, a framework might require a student at one level to recall (cognitive demand) the difference
1 Porter (2002); Porter (2004)
37
between fact and opinion (the topic), while at a different level the requirement could be evaluate (cognitive demand) whether a writer has used facts and opinions (the topic) appropriately in a newspaper article. The topic in this example is the same in both cases (fact and opinion), but the cognitive demand is different.
It is, therefore, in the intersections between the topic lists and the cognitive demands that the curriculum is described. Any curriculum is likely to include some but not all of the content topics for the field, and some curricula will be more comprehensive in their inclusion of topics. Any curriculum is likely to include a range of cognitive demands, and some will include a greater or lesser proportion of higher or lower cognitive demands. Bibliography
Porter, A.C. (2002, October). Measuring the content of instruction: Uses in research and practice. Educational Researcher, 31 (7), 3‐14. Porter, A.C. (2004). Curriculum Assessment. Pre‐publication draft of an article in J. Green, G. Camilli, & P. Elmore (eds), Complementary Methods for Research in Education. Washington, DC: American Educational Research Association, 2004.
38
APPENDIX 4: ACARA CURRICULUM MAPPING CALCULATIONS
Porter Graph
Step 1 Quality check of survey data Perform following checks:
1. Ensure that a Level of Coverage cell is rated for all topics 2. Check that no more than one Level of Coverage cell is rated for each topic 3. Where Level of Coverage – None, ensure no Expectation of Students cell is rated for
the topic
Step 2 Average Level of Coverage ratings Where more than one survey has been completed for a domain/jurisdiction/phase of schooling, average Level of Coverage ratings for each topic across multiple surveys
Step 3 Sum weighted Level of Coverage ratings
Weight Level of Coverage ratings (weighted 1 X Slight Coverage, 2 x Moderate Coverage and 3 X Sustained Coverage) for each survey and add together to find total.
Step 3a Aggregate ACARA surveys to equal Phase of Schooling for comparison curriculum Find maximum of Level of Coverage ratings for each topic across multiple year levels of National curriculum surveys
Find average of Cognitive Demand ratings for each topic across multiple year levels of National curriculum surveys
Step 4: Level of coverage % For each topic, weight the Level of Coverage (1 X Slight Coverage, 2 x Moderate Coverage and 3 X Sustained Coverage) and divide by Total from Step 3
Step 5: Average Cognitive Demand
Where more than one survey has been completed for a domain/jurisdiction/phase of schooling, average Cognitive Demand ratings for each topic across multiple surveys
Step 6: Total Cognitive Demand
Sum of all Cognitive Demand ratings from Step 5.
Step 7: Calculate Cognitive Demand % Cognitive demand cell/Total Cognitive Demand from Step 6
Step 8: Cognitive Demand% X Level of Demand% For each cell, Level of coverage % x Cognitive Demand %
Step 9: Generate Graph
Use steps 1‐8 for the expert mapping data and the teacher mapping data. Average the % coverage and the cognitive demand for the expert mapping data and the teacher mapping data and generate the graph.
Topic Coverage Index Step 1: Level of coverage % for national and comparison curricula
Take Level of coverage % for National curriculum and selected combined comparison curriculum.
39
Step 2: Find absolute differences Find absolute difference between Level of coverage % for national and Level of coverage %
for the combined comparison curricula
Step3: Calculate Coverage Index
For comparison of any two curricula,
Where X = ACARA Level of coverage %
Y = Comparison Combined Curriculum Level of coverage %
% of Curriculum devoted to Topic Group Step 1: Sum Level of coverage % for all topics in each topic group for national curriculum Sum Level of coverage % for all topics in each topic group for national curriculum.
Step 2: Sum Level of coverage % for all topics in each topic group for comparison combined curriculum
Sum Level of coverage % for all topics in each topic group for the comparison combined curriculum.
Step 3: Report
Report Level of coverage % for each topic group for national and the comparison combined curricula, or in cases where there is no data, the comparison curriculum documents.
% of Cognitive Demand Step 1: Sum % Cognitive Demand for all topics in each topic group for national curriculum
For each cognitive demand, sum % Cognitive Demand for all topics in each topic group for national curriculum.
Step 2: Sum % Cognitive Demand for all topics in each topic group for comparison curriculum
For each cognitive demand, sum % Cognitive Demand for all topics in each topic group for
comparison curriculum.
Step 3: Weighted Average Cognitive Demand for national curriculum
For each cognitive demand, average((Phase 1 Sum %Cognitive Demand x Phase years) +( Phase 1
Sum % Cognitive Demand x Phase years) + … (Phase N Sum % Cognitive Demand x Phase years) for
nationalcurriculum.
Step 4: Weighted Average Cognitive Demand for comparison curriculum
For each cognitive demand, average((Phase 1 Sum %Cognitive Demand x Phase years) +( Phase 1
Sum % Cognitive Demand x Phase years) + … (Phase N Sum % Cognitive Demand x Phase years) for
comparison curriculum.
40
APPENDIX 5: ACARA CURRICULUM MAPPING – English
INTERNATIONAL ENGLISH REPORTS
This section of the report is based on the expert mapping of final version of the English curriculum documents for Australia and the two comparison curricula, Ontario and New Zealand. It provides details of the results for Ontario and New Zealand compared with results for the Australian Curriculum, organized by the curriculum phases used in the comparison curriculum.
As indicated in the overall report, for each subject report at each phase or year level within each jurisdiction, this appendix includes the following elements:
1. Graphs which represent the data resulting from the mapping process for the
Australian Curriculum and the comparison curriculum. The graphs represent the emphasis in the curriculum on both topic coverage and cognitive demand.
2. Topic Coverage Indices for each year‐level grouping used in that jurisdiction,
represented by a single number less than or equal to 1. The indices provide a measure of the extent to which the comparison curriculum for that stage of schooling is aligned with the Australian Curriculum. The index has been calculated by comparing the percentage of the curriculum devoted to each topic.
3. A table showing the percentage of the curriculum devoted to each topic group in
the Australian Curriculum and the comparison curriculum. This table supports a more detailed analysis of differences at the topic group level between each jurisdiction’s documents. The percentage of the curriculum devoted to each topic group is listed for the Australian curriculum and for the comparison jurisdiction.
4. A short written discussion of the key variations between the Australian
Curriculum and the comparison curriculum.
5. A discussion of relative cognitive demand in the subject as represented in the
Australian Curriculum and each State and Territory curriculum. This includes graphic representation of the relative representation of cognitive demand at each phase in the subject and in the subject overall. It also includes a table of percentages of each element of cognitive demand at each phase which are the basis for the graphic representation.
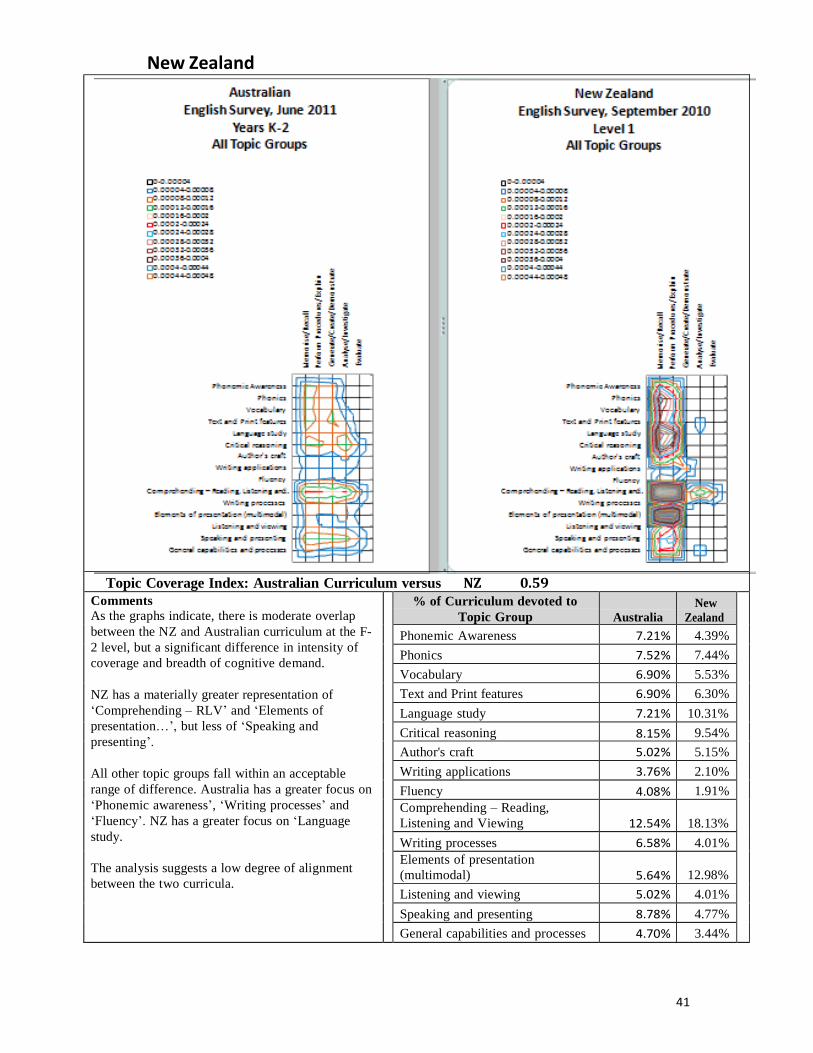
41
New Zealand
Topic Coverage Index: Australian Curriculum versus NZ 0.59 Comments As the graphs indicate, there is moderate overlap
between the NZ and Australian curriculum at the F-
2 level, but a significant difference in intensity of
coverage and breadth of cognitive demand.
NZ has a materially greater representation of
‘Comprehending – RLV’ and ‘Elements of
presentation…’, but less of ‘Speaking and
presenting’.
All other topic groups fall within an acceptable
range of difference. Australia has a greater focus on
‘Phonemic awareness’, ‘Writing processes’ and
‘Fluency’. NZ has a greater focus on ‘Language
study.
The analysis suggests a low degree of alignment
between the two curricula.
% of Curriculum devoted to
Topic Group
Australia
New
Zealand
Phonemic Awareness 7.21% 4.39%
Phonics 7.52% 7.44%
Vocabulary 6.90% 5.53%
Text and Print features 6.90% 6.30%
Language study 7.21% 10.31%
Critical reasoning 8.15% 9.54%
Author's craft 5.02% 5.15%
Writing applications 3.76% 2.10%
Fluency 4.08% 1.91%
Comprehending – Reading,
Listening and Viewing
12.54%
18.13%
Writing processes 6.58% 4.01%
Elements of presentation
(multimodal)
5.64%
12.98%
Listening and viewing 5.02% 4.01%
Speaking and presenting 8.78% 4.77%
General capabilities and processes 4.70% 3.44%
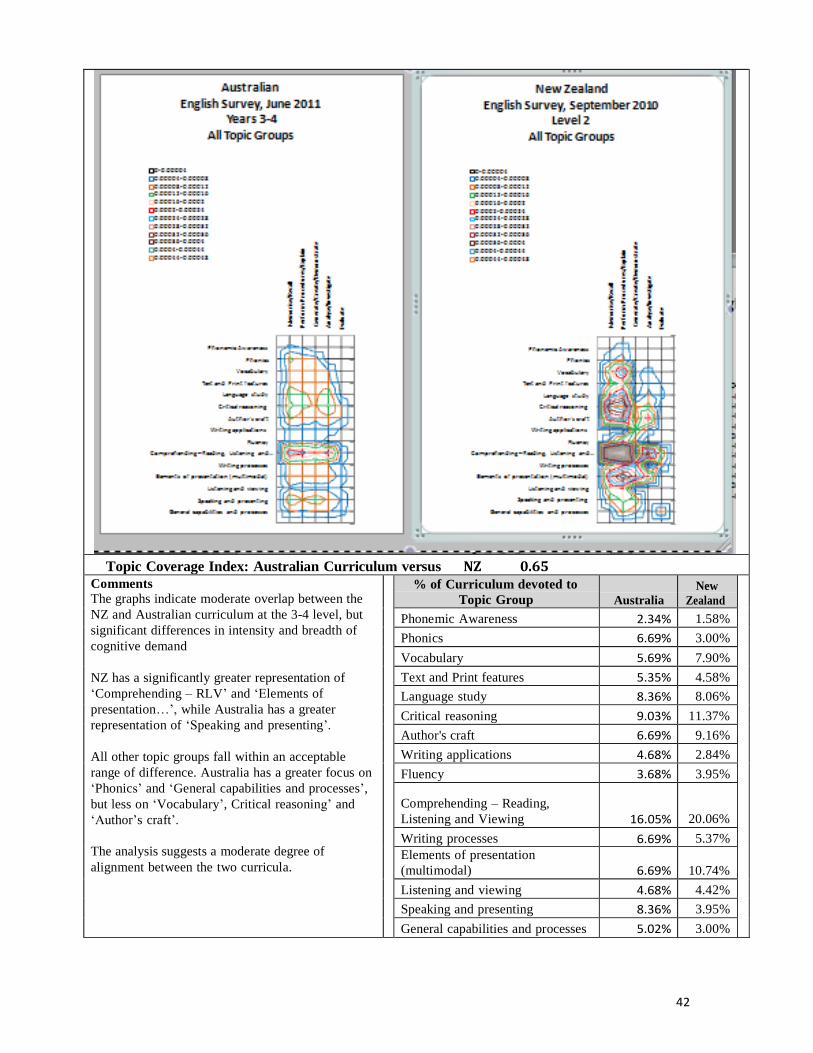
42
Topic Coverage Index: Australian Curriculum versus NZ 0.65
Comments The graphs indicate moderate overlap between the
NZ and Australian curriculum at the 3-4 level, but
significant differences in intensity and breadth of
cognitive demand
NZ has a significantly greater representation of
‘Comprehending – RLV’ and ‘Elements of
presentation…’, while Australia has a greater
representation of ‘Speaking and presenting’.
All other topic groups fall within an acceptable
range of difference. Australia has a greater focus on
‘Phonics’ and ‘General capabilities and processes’,
but less on ‘Vocabulary’, Critical reasoning’ and
‘Author’s craft’.
The analysis suggests a moderate degree of
alignment between the two curricula.
% of Curriculum devoted to
Topic Group
Australia
New
Zealand
Phonemic Awareness 2.34% 1.58%
Phonics 6.69% 3.00%
Vocabulary 5.69% 7.90%
Text and Print features 5.35% 4.58%
Language study 8.36% 8.06%
Critical reasoning 9.03% 11.37%
Author's craft 6.69% 9.16%
Writing applications 4.68% 2.84%
Fluency 3.68% 3.95% Comprehending – Reading,
Listening and Viewing
16.05%
20.06%
Writing processes 6.69% 5.37%
Elements of presentation
(multimodal)
6.69%
10.74%
Listening and viewing 4.68% 4.42%
Speaking and presenting 8.36% 3.95%
General capabilities and processes 5.02% 3.00%
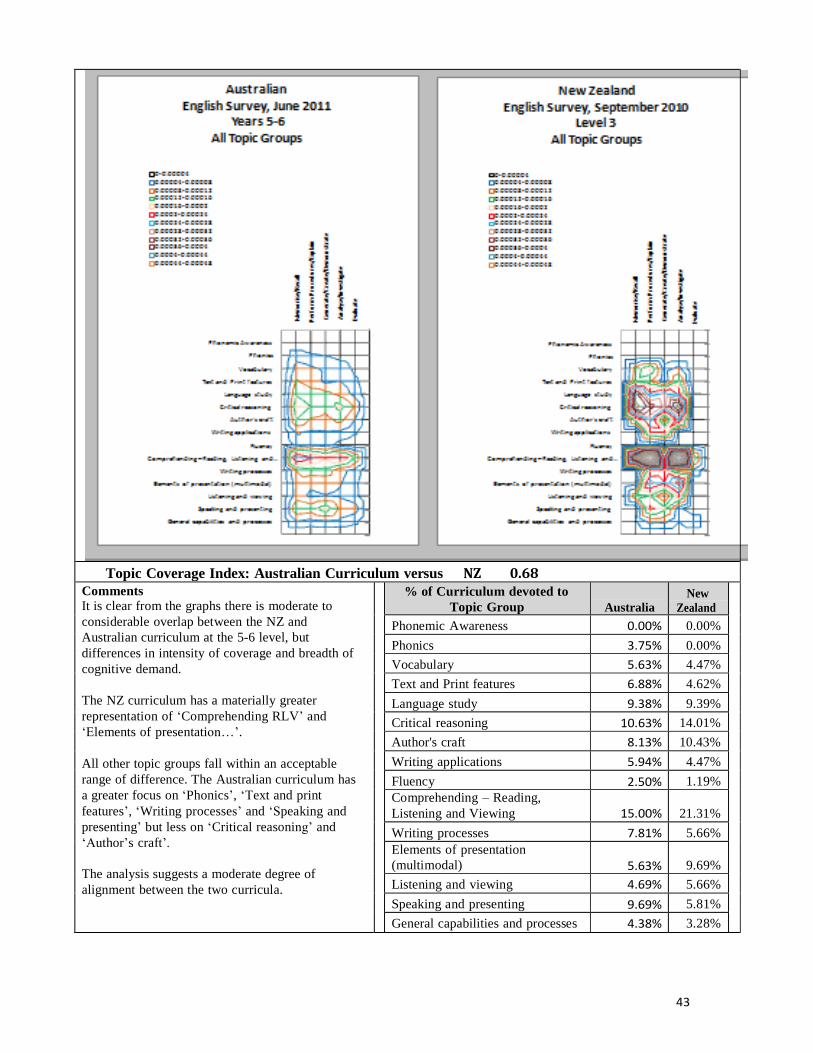
43
Topic Coverage Index: Australian Curriculum versus NZ 0.68 Comments It is clear from the graphs there is moderate to
considerable overlap between the NZ and
Australian curriculum at the 5-6 level, but
differences in intensity of coverage and breadth of
cognitive demand.
The NZ curriculum has a materially greater
representation of ‘Comprehending RLV’ and
‘Elements of presentation…’.
All other topic groups fall within an acceptable
range of difference. The Australian curriculum has
a greater focus on ‘Phonics’, ‘Text and print
features’, ‘Writing processes’ and ‘Speaking and
presenting’ but less on ‘Critical reasoning’ and
‘Author’s craft’.
The analysis suggests a moderate degree of
alignment between the two curricula.
% of Curriculum devoted to
Topic Group
Australia New
Zealand
Phonemic Awareness 0.00% 0.00%
Phonics 3.75% 0.00%
Vocabulary 5.63% 4.47%
Text and Print features 6.88% 4.62%
Language study 9.38% 9.39%
Critical reasoning 10.63% 14.01%
Author's craft 8.13% 10.43%
Writing applications 5.94% 4.47%
Fluency 2.50% 1.19%
Comprehending – Reading,
Listening and Viewing
15.00%
21.31%
Writing processes 7.81% 5.66%
Elements of presentation
(multimodal)
5.63%
9.69%
Listening and viewing 4.69% 5.66%
Speaking and presenting 9.69% 5.81%
General capabilities and processes 4.38% 3.28%
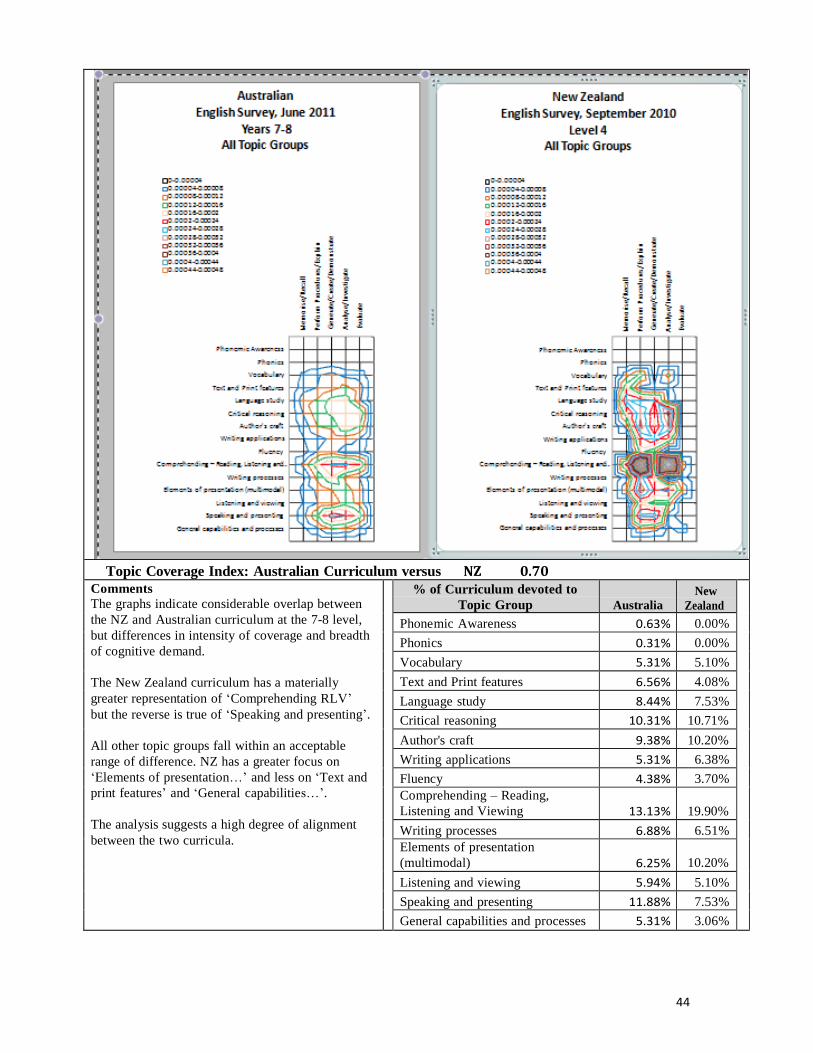
44
Topic Coverage Index: Australian Curriculum versus NZ 0.70 Comments
The graphs indicate considerable overlap between
the NZ and Australian curriculum at the 7-8 level,
but differences in intensity of coverage and breadth
of cognitive demand.
The New Zealand curriculum has a materially
greater representation of ‘Comprehending RLV’
but the reverse is true of ‘Speaking and presenting’.
All other topic groups fall within an acceptable
range of difference. NZ has a greater focus on
‘Elements of presentation…’ and less on ‘Text and
print features’ and ‘General capabilities…’.
The analysis suggests a high degree of alignment
between the two curricula.
% of Curriculum devoted to
Topic Group
Australia New
Zealand
Phonemic Awareness 0.63% 0.00%
Phonics 0.31% 0.00%
Vocabulary 5.31% 5.10%
Text and Print features 6.56% 4.08%
Language study 8.44% 7.53%
Critical reasoning 10.31% 10.71%
Author's craft 9.38% 10.20%
Writing applications 5.31% 6.38%
Fluency 4.38% 3.70%
Comprehending – Reading,
Listening and Viewing
13.13%
19.90%
Writing processes 6.88% 6.51%
Elements of presentation
(multimodal)
6.25%
10.20%
Listening and viewing 5.94% 5.10%
Speaking and presenting 11.88% 7.53%
General capabilities and processes 5.31% 3.06%
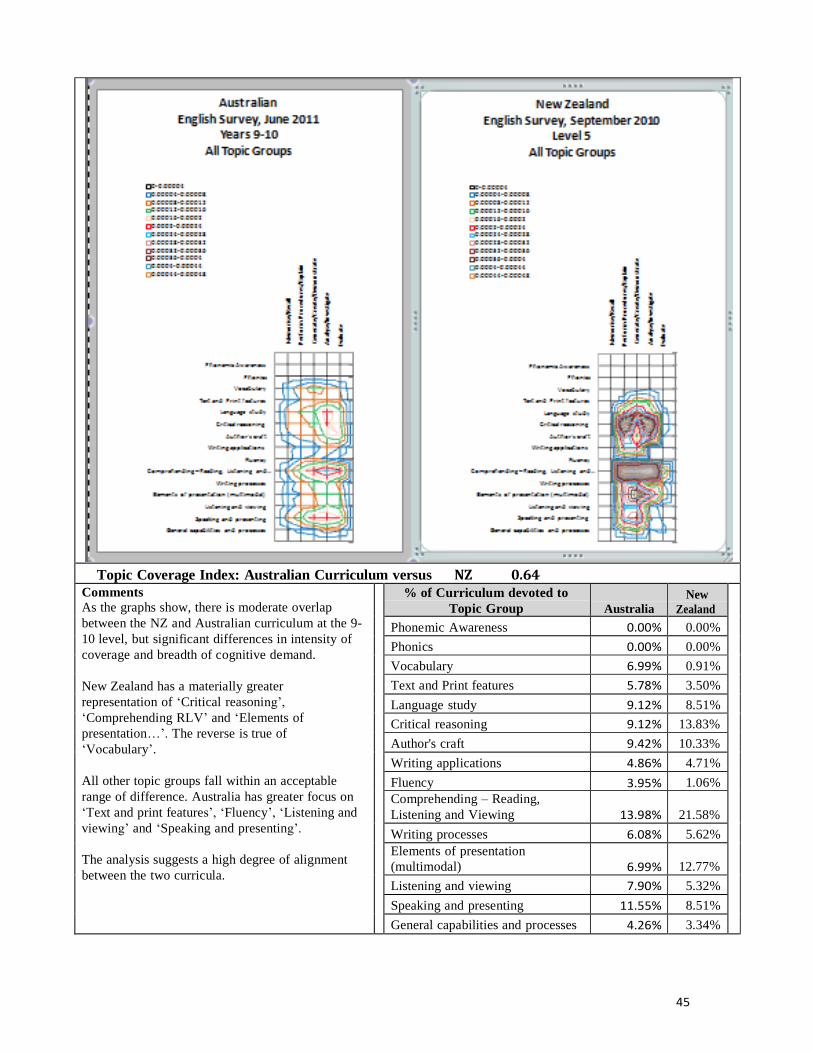
45
Topic Coverage Index: Australian Curriculum versus NZ 0.64
Comments As the graphs show, there is moderate overlap
between the NZ and Australian curriculum at the 9-
10 level, but significant differences in intensity of
coverage and breadth of cognitive demand.
New Zealand has a materially greater
representation of ‘Critical reasoning’,
‘Comprehending RLV’ and ‘Elements of
presentation…’. The reverse is true of
‘Vocabulary’.
All other topic groups fall within an acceptable
range of difference. Australia has greater focus on
‘Text and print features’, ‘Fluency’, ‘Listening and
viewing’ and ‘Speaking and presenting’.
The analysis suggests a high degree of alignment
between the two curricula.
% of Curriculum devoted to
Topic Group
Australia
New
Zealand
Phonemic Awareness 0.00% 0.00%
Phonics 0.00% 0.00%
Vocabulary 6.99% 0.91%
Text and Print features 5.78% 3.50%
Language study 9.12% 8.51%
Critical reasoning 9.12% 13.83%
Author's craft 9.42% 10.33%
Writing applications 4.86% 4.71%
Fluency 3.95% 1.06%
Comprehending – Reading,
Listening and Viewing
13.98%
21.58%
Writing processes 6.08% 5.62%
Elements of presentation
(multimodal)
6.99%
12.77%
Listening and viewing 7.90% 5.32%
Speaking and presenting 11.55% 8.51%
General capabilities and processes 4.26% 3.34%
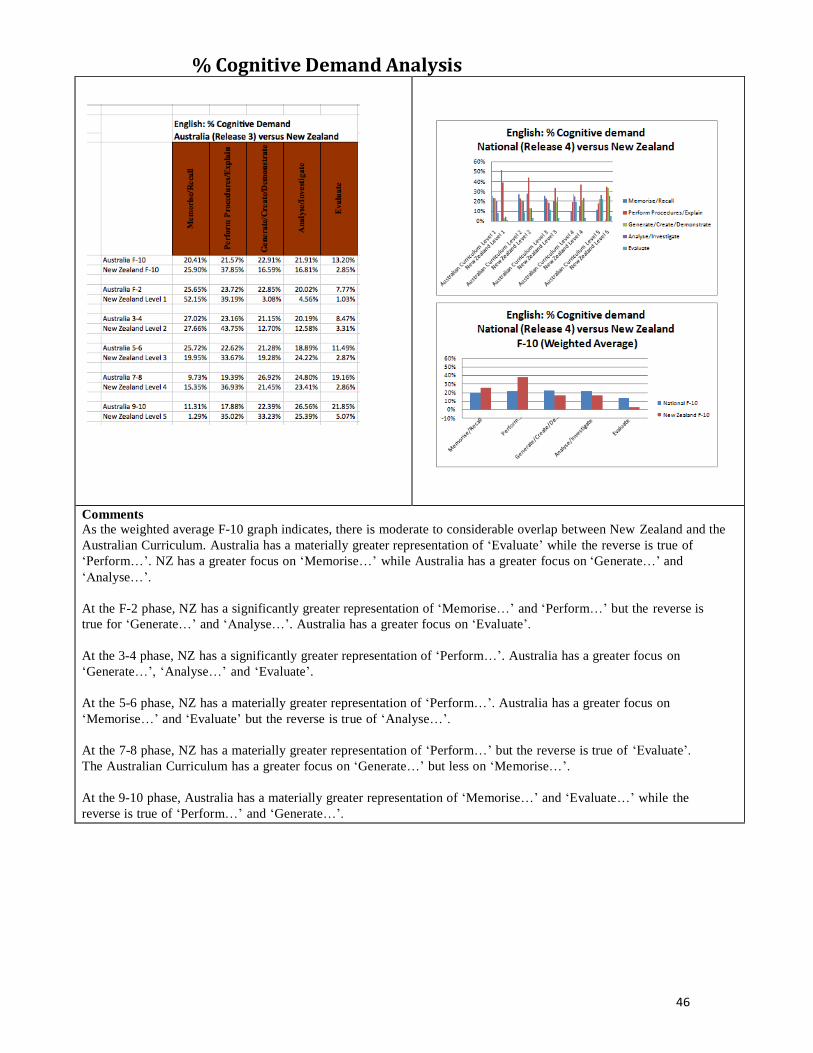
46
% Cognitive Demand Analysis
Comments As the weighted average F-10 graph indicates, there is moderate to considerable overlap between New Zealand and the
Australian Curriculum. Australia has a materially greater representation of ‘Evaluate’ while the reverse is true of
‘Perform…’. NZ has a greater focus on ‘Memorise…’ while Australia has a greater focus on ‘Generate…’ and
‘Analyse…’.
At the F-2 phase, NZ has a significantly greater representation of ‘Memorise…’ and ‘Perform…’ but the reverse is
true for ‘Generate…’ and ‘Analyse…’. Australia has a greater focus on ‘Evaluate’.
At the 3-4 phase, NZ has a significantly greater representation of ‘Perform…’. Australia has a greater focus on
‘Generate…’, ‘Analyse…’ and ‘Evaluate’.
At the 5-6 phase, NZ has a materially greater representation of ‘Perform…’. Australia has a greater focus on
‘Memorise…’ and ‘Evaluate’ but the reverse is true of ‘Analyse…’.
At the 7-8 phase, NZ has a materially greater representation of ‘Perform…’ but the reverse is true of ‘Evaluate’.
The Australian Curriculum has a greater focus on ‘Generate…’ but less on ‘Memorise…’.
At the 9-10 phase, Australia has a materially greater representation of ‘Memorise…’ and ‘Evaluate…’ while the
reverse is true of ‘Perform…’ and ‘Generate…’.
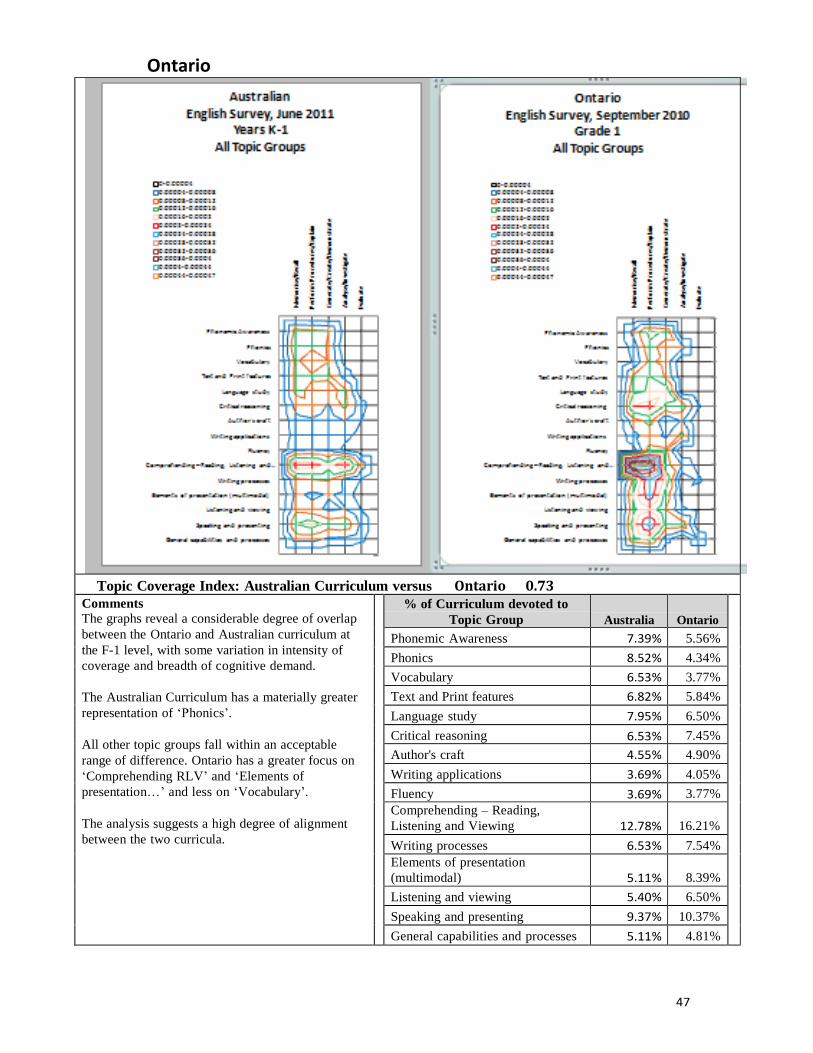
47
Ontario
Topic Coverage Index: Australian Curriculum versus Ontario 0.73 Comments The graphs reveal a considerable degree of overlap
between the Ontario and Australian curriculum at
the F-1 level, with some variation in intensity of
coverage and breadth of cognitive demand.
The Australian Curriculum has a materially greater
representation of ‘Phonics’.
All other topic groups fall within an acceptable
range of difference. Ontario has a greater focus on
‘Comprehending RLV’ and ‘Elements of
presentation…’ and less on ‘Vocabulary’.
The analysis suggests a high degree of alignment
between the two curricula.
% of Curriculum devoted to
Topic Group
Australia
Ontario
Phonemic Awareness 7.39% 5.56%
Phonics 8.52% 4.34%
Vocabulary 6.53% 3.77%
Text and Print features 6.82% 5.84%
Language study 7.95% 6.50%
Critical reasoning 6.53% 7.45%
Author's craft 4.55% 4.90%
Writing applications 3.69% 4.05%
Fluency 3.69% 3.77%
Comprehending – Reading,
Listening and Viewing
12.78%
16.21%
Writing processes 6.53% 7.54%
Elements of presentation
(multimodal)
5.11%
8.39%
Listening and viewing 5.40% 6.50%
Speaking and presenting 9.37% 10.37%
General capabilities and processes 5.11% 4.81%
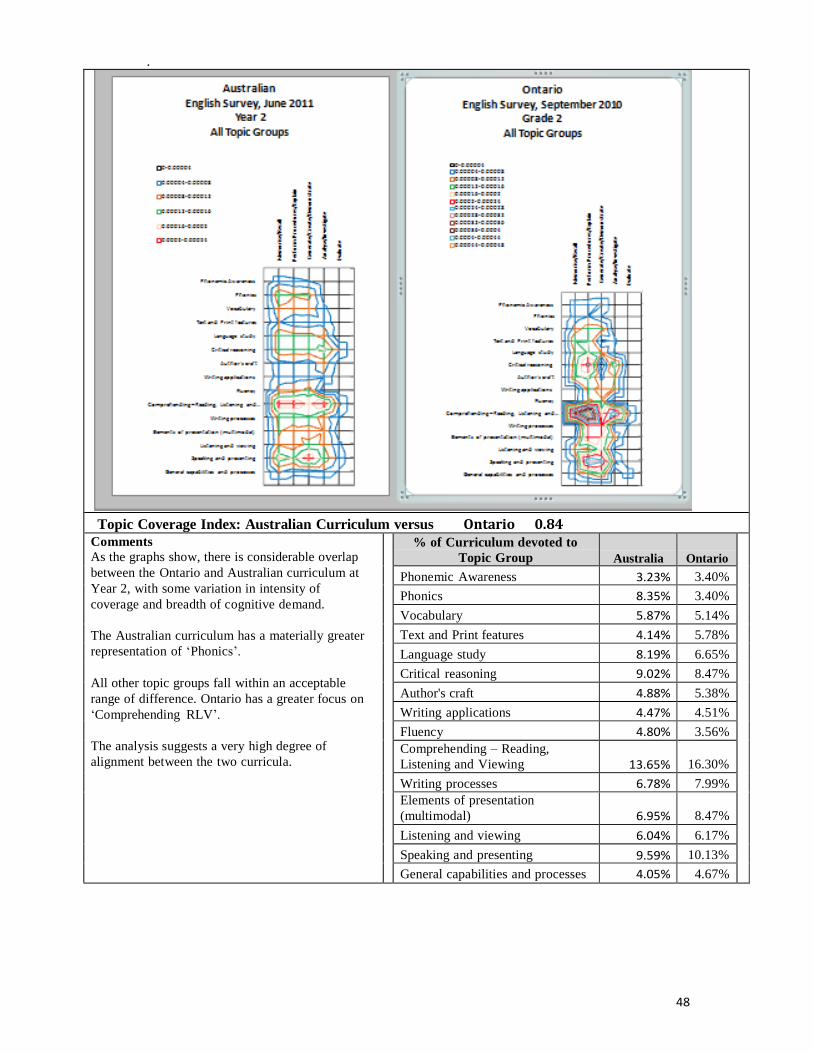
48
.
Topic Coverage Index: Australian Curriculum versus Ontario 0.84 Comments
As the graphs show, there is considerable overlap
between the Ontario and Australian curriculum at
Year 2, with some variation in intensity of
coverage and breadth of cognitive demand.
The Australian curriculum has a materially greater
representation of ‘Phonics’.
All other topic groups fall within an acceptable
range of difference. Ontario has a greater focus on
‘Comprehending RLV’.
The analysis suggests a very high degree of
alignment between the two curricula.
% of Curriculum devoted to
Topic Group
Australia
Ontario
Phonemic Awareness 3.23% 3.40%
Phonics 8.35% 3.40%
Vocabulary 5.87% 5.14%
Text and Print features 4.14% 5.78%
Language study 8.19% 6.65%
Critical reasoning 9.02% 8.47%
Author's craft 4.88% 5.38%
Writing applications 4.47% 4.51%
Fluency 4.80% 3.56%
Comprehending – Reading,
Listening and Viewing
13.65%
16.30%
Writing processes 6.78% 7.99%
Elements of presentation
(multimodal)
6.95%
8.47%
Listening and viewing 6.04% 6.17%
Speaking and presenting 9.59% 10.13%
General capabilities and processes 4.05% 4.67%
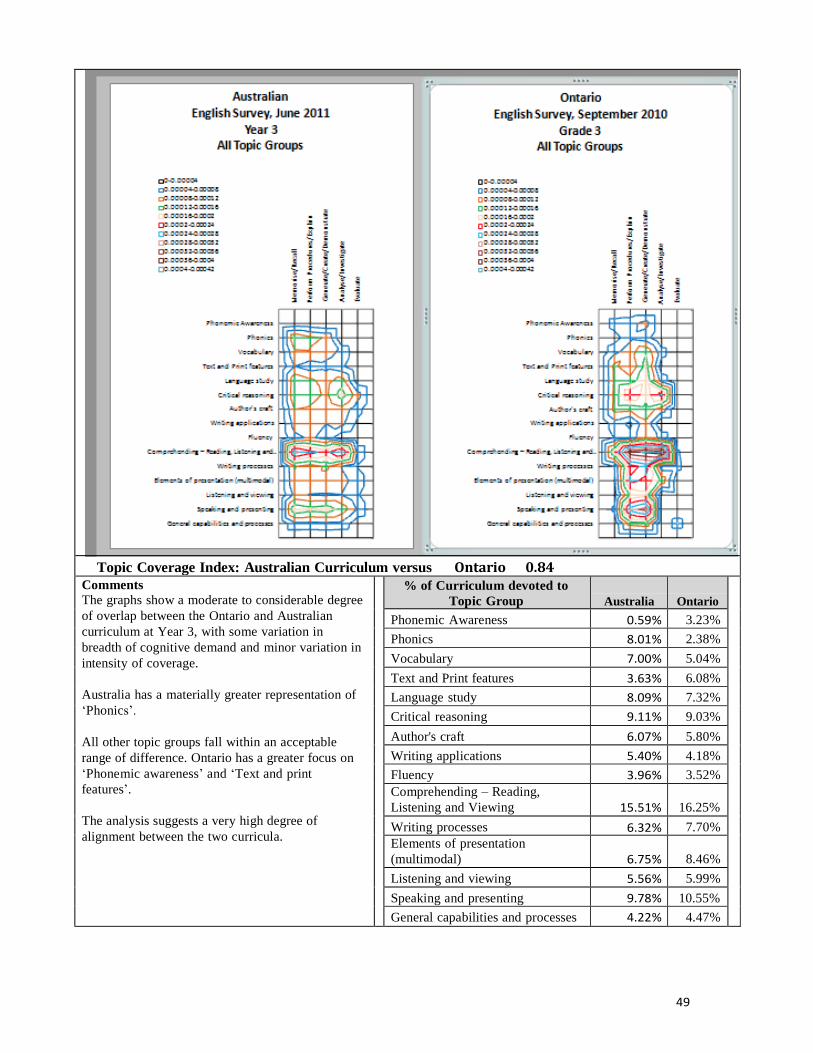
49
Topic Coverage Index: Australian Curriculum versus Ontario 0.84 Comments The graphs show a moderate to considerable degree
of overlap between the Ontario and Australian
curriculum at Year 3, with some variation in
breadth of cognitive demand and minor variation in
intensity of coverage.
Australia has a materially greater representation of
‘Phonics’.
All other topic groups fall within an acceptable
range of difference. Ontario has a greater focus on
‘Phonemic awareness’ and ‘Text and print
features’.
The analysis suggests a very high degree of
alignment between the two curricula.
% of Curriculum devoted to
Topic Group
Australia
Ontario
Phonemic Awareness 0.59% 3.23%
Phonics 8.01% 2.38%
Vocabulary 7.00% 5.04%
Text and Print features 3.63% 6.08%
Language study 8.09% 7.32%
Critical reasoning 9.11% 9.03%
Author's craft 6.07% 5.80%
Writing applications 5.40% 4.18%
Fluency 3.96% 3.52%
Comprehending – Reading,
Listening and Viewing
15.51%
16.25%
Writing processes 6.32% 7.70%
Elements of presentation
(multimodal)
6.75%
8.46%
Listening and viewing 5.56% 5.99%
Speaking and presenting 9.78% 10.55%
General capabilities and processes 4.22% 4.47%
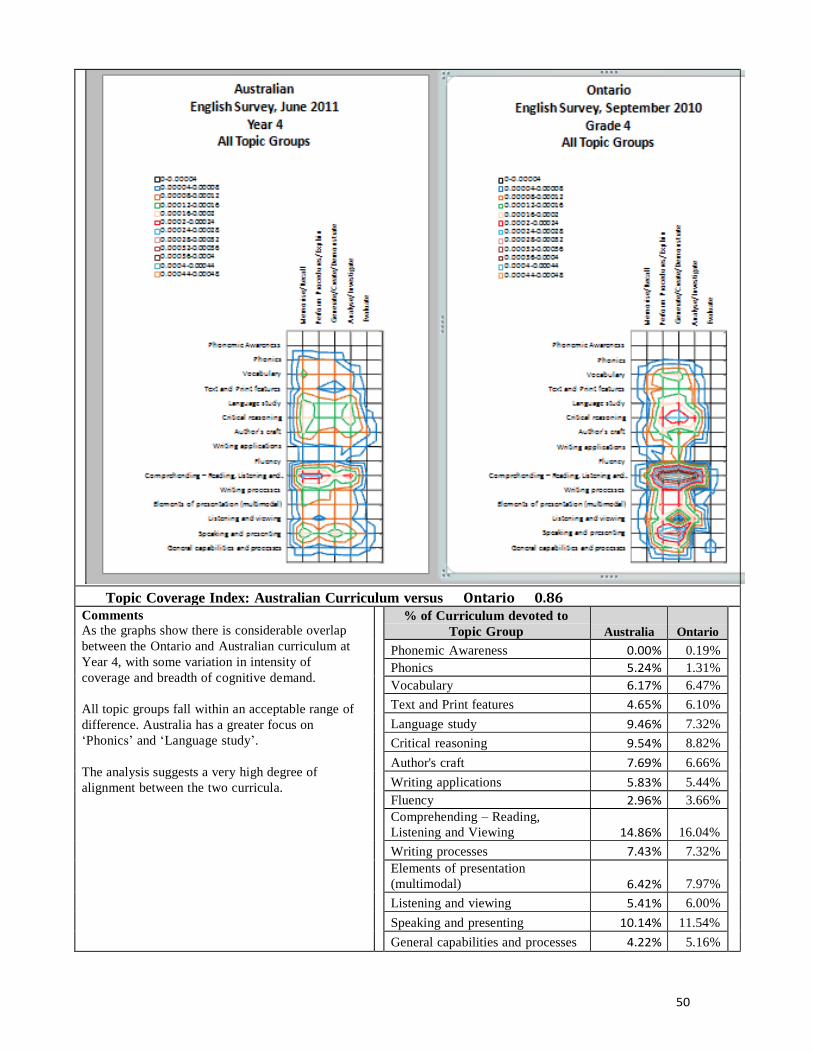
50
Topic Coverage Index: Australian Curriculum versus Ontario 0.86 Comments As the graphs show there is considerable overlap
between the Ontario and Australian curriculum at
Year 4, with some variation in intensity of
coverage and breadth of cognitive demand.
All topic groups fall within an acceptable range of
difference. Australia has a greater focus on
‘Phonics’ and ‘Language study’.
The analysis suggests a very high degree of
alignment between the two curricula.
% of Curriculum devoted to
Topic Group
Australia
Ontario
Phonemic Awareness 0.00% 0.19%
Phonics 5.24% 1.31%
Vocabulary 6.17% 6.47%
Text and Print features 4.65% 6.10%
Language study 9.46% 7.32%
Critical reasoning 9.54% 8.82%
Author's craft 7.69% 6.66%
Writing applications 5.83% 5.44%
Fluency 2.96% 3.66%
Comprehending – Reading,
Listening and Viewing
14.86%
16.04%
Writing processes 7.43% 7.32%
Elements of presentation
(multimodal)
6.42%
7.97%
Listening and viewing 5.41% 6.00%
Speaking and presenting 10.14% 11.54%
General capabilities and processes 4.22% 5.16%
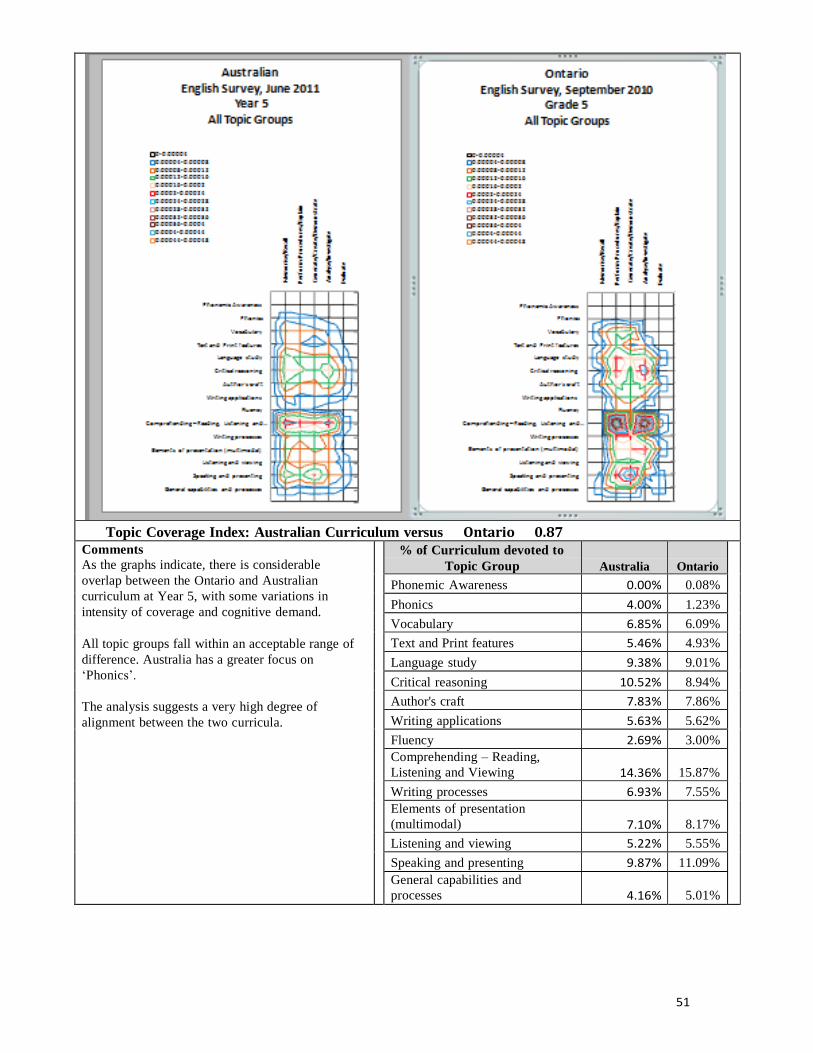
51
Topic Coverage Index: Australian Curriculum versus Ontario 0.87 Comments
As the graphs indicate, there is considerable
overlap between the Ontario and Australian
curriculum at Year 5, with some variations in
intensity of coverage and cognitive demand.
All topic groups fall within an acceptable range of
difference. Australia has a greater focus on
‘Phonics’.
The analysis suggests a very high degree of
alignment between the two curricula.
% of Curriculum devoted to
Topic Group
Australia
Ontario
Phonemic Awareness 0.00% 0.08%
Phonics 4.00% 1.23%
Vocabulary 6.85% 6.09%
Text and Print features 5.46% 4.93%
Language study 9.38% 9.01%
Critical reasoning 10.52% 8.94%
Author's craft 7.83% 7.86%
Writing applications 5.63% 5.62%
Fluency 2.69% 3.00%
Comprehending – Reading,
Listening and Viewing
14.36%
15.87%
Writing processes 6.93% 7.55%
Elements of presentation
(multimodal)
7.10%
8.17%
Listening and viewing 5.22% 5.55%
Speaking and presenting 9.87% 11.09%
General capabilities and
processes
4.16%
5.01%
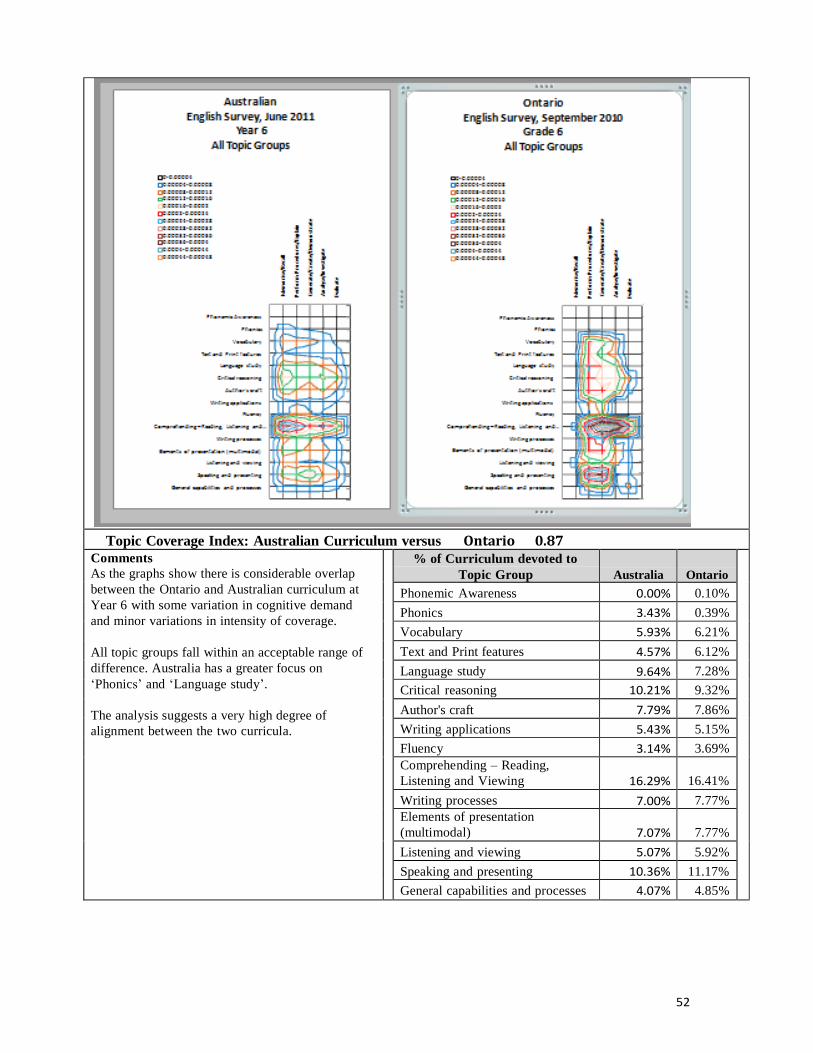
52
Topic Coverage Index: Australian Curriculum versus Ontario 0.87 Comments
As the graphs show there is considerable overlap
between the Ontario and Australian curriculum at
Year 6 with some variation in cognitive demand
and minor variations in intensity of coverage.
All topic groups fall within an acceptable range of
difference. Australia has a greater focus on
‘Phonics’ and ‘Language study’.
The analysis suggests a very high degree of
alignment between the two curricula.
% of Curriculum devoted to
Topic Group
Australia
Ontario
Phonemic Awareness 0.00% 0.10%
Phonics 3.43% 0.39%
Vocabulary 5.93% 6.21%
Text and Print features 4.57% 6.12%
Language study 9.64% 7.28%
Critical reasoning 10.21% 9.32%
Author's craft 7.79% 7.86%
Writing applications 5.43% 5.15%
Fluency 3.14% 3.69%
Comprehending – Reading,
Listening and Viewing
16.29%
16.41%
Writing processes 7.00% 7.77%
Elements of presentation
(multimodal)
7.07%
7.77%
Listening and viewing 5.07% 5.92%
Speaking and presenting 10.36% 11.17%
General capabilities and processes 4.07% 4.85%
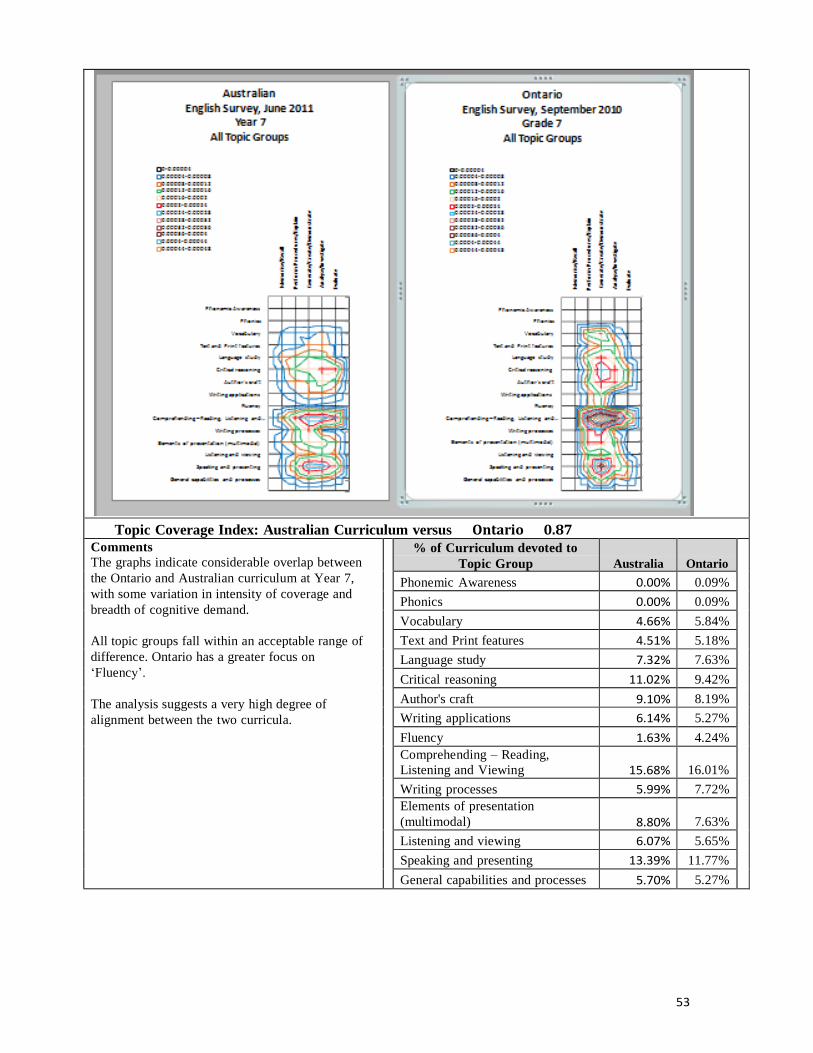
53
Topic Coverage Index: Australian Curriculum versus Ontario 0.87 Comments
The graphs indicate considerable overlap between
the Ontario and Australian curriculum at Year 7,
with some variation in intensity of coverage and
breadth of cognitive demand.
All topic groups fall within an acceptable range of
difference. Ontario has a greater focus on
‘Fluency’.
The analysis suggests a very high degree of
alignment between the two curricula.
% of Curriculum devoted to
Topic Group
Australia
Ontario
Phonemic Awareness 0.00% 0.09%
Phonics 0.00% 0.09%
Vocabulary 4.66% 5.84%
Text and Print features 4.51% 5.18%
Language study 7.32% 7.63%
Critical reasoning 11.02% 9.42%
Author's craft 9.10% 8.19%
Writing applications 6.14% 5.27%
Fluency 1.63% 4.24%
Comprehending – Reading,
Listening and Viewing
15.68%
16.01%
Writing processes 5.99% 7.72%
Elements of presentation
(multimodal)
8.80%
7.63%
Listening and viewing 6.07% 5.65%
Speaking and presenting 13.39% 11.77%
General capabilities and processes 5.70% 5.27%
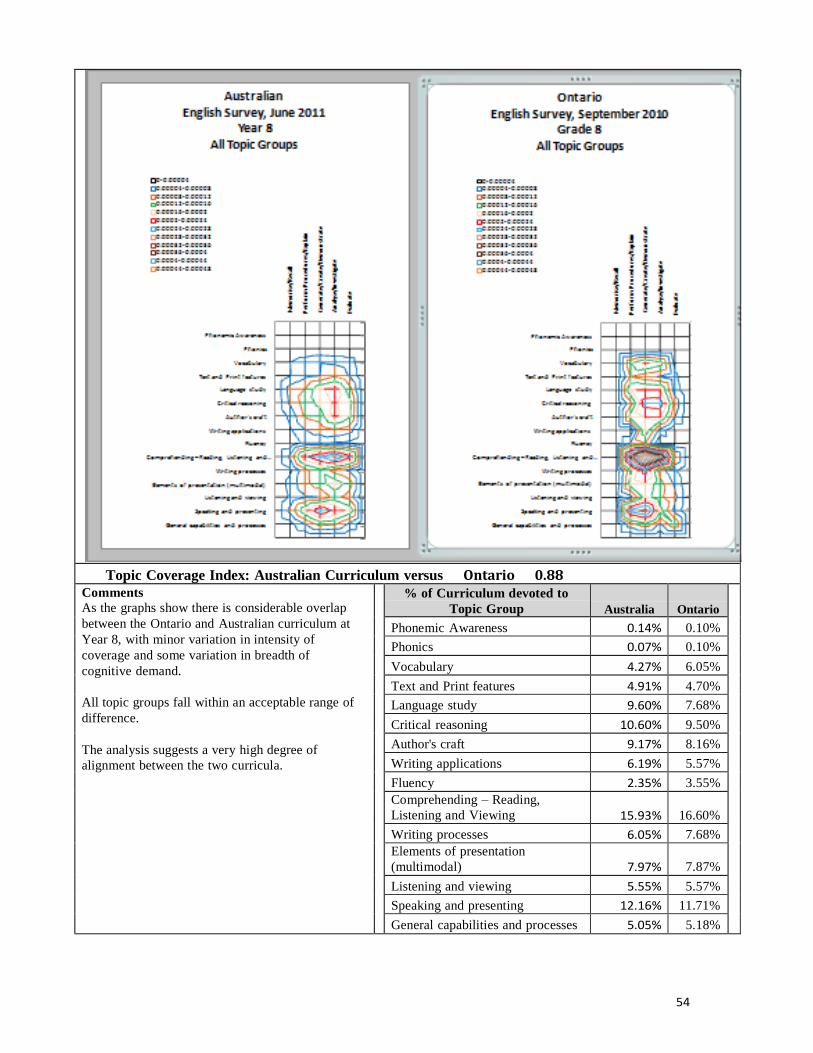
54
Topic Coverage Index: Australian Curriculum versus Ontario 0.88 Comments
As the graphs show there is considerable overlap
between the Ontario and Australian curriculum at
Year 8, with minor variation in intensity of
coverage and some variation in breadth of
cognitive demand.
All topic groups fall within an acceptable range of
difference.
The analysis suggests a very high degree of
alignment between the two curricula.
% of Curriculum devoted to
Topic Group
Australia
Ontario
Phonemic Awareness 0.14% 0.10%
Phonics 0.07% 0.10%
Vocabulary 4.27% 6.05%
Text and Print features 4.91% 4.70%
Language study 9.60% 7.68%
Critical reasoning 10.60% 9.50%
Author's craft 9.17% 8.16%
Writing applications 6.19% 5.57%
Fluency 2.35% 3.55%
Comprehending – Reading,
Listening and Viewing
15.93%
16.60%
Writing processes 6.05% 7.68%
Elements of presentation
(multimodal)
7.97%
7.87%
Listening and viewing 5.55% 5.57%
Speaking and presenting 12.16% 11.71%
General capabilities and processes 5.05% 5.18%
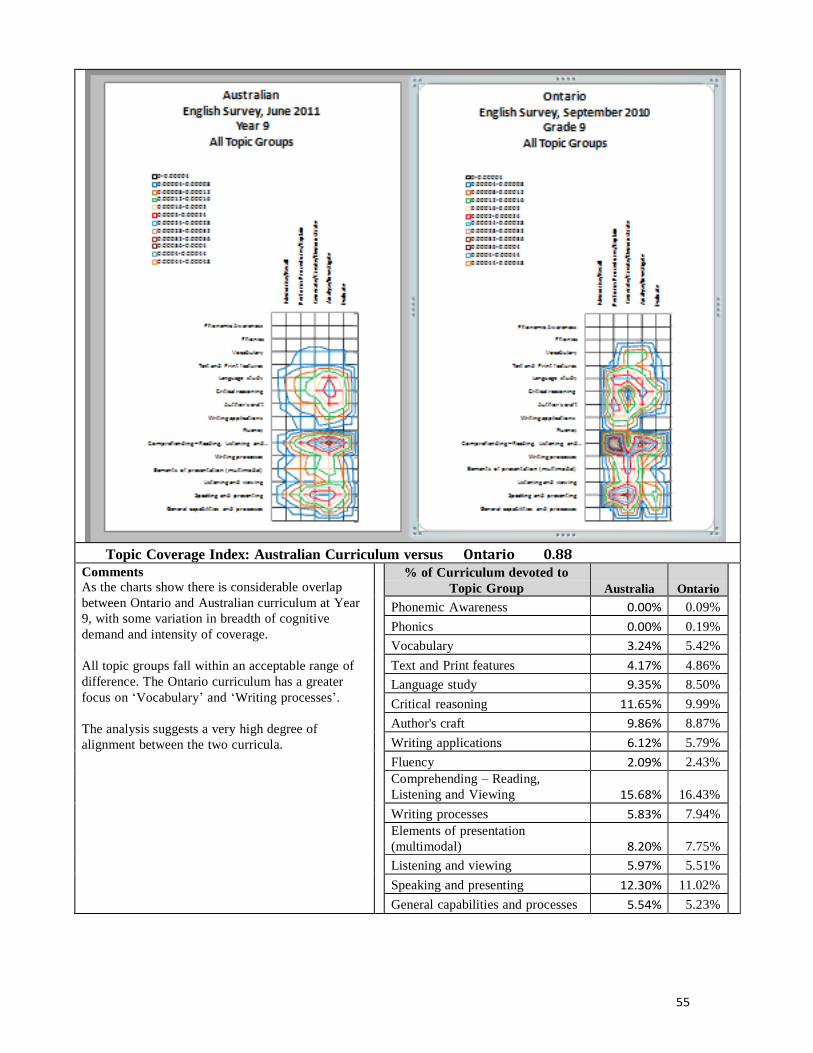
55
Topic Coverage Index: Australian Curriculum versus Ontario 0.88 Comments As the charts show there is considerable overlap
between Ontario and Australian curriculum at Year
9, with some variation in breadth of cognitive
demand and intensity of coverage.
All topic groups fall within an acceptable range of
difference. The Ontario curriculum has a greater
focus on ‘Vocabulary’ and ‘Writing processes’.
The analysis suggests a very high degree of
alignment between the two curricula.
% of Curriculum devoted to
Topic Group
Australia
Ontario
Phonemic Awareness 0.00% 0.09%
Phonics 0.00% 0.19%
Vocabulary 3.24% 5.42%
Text and Print features 4.17% 4.86%
Language study 9.35% 8.50%
Critical reasoning 11.65% 9.99%
Author's craft 9.86% 8.87%
Writing applications 6.12% 5.79%
Fluency 2.09% 2.43%
Comprehending – Reading,
Listening and Viewing
15.68%
16.43%
Writing processes 5.83% 7.94%
Elements of presentation
(multimodal)
8.20%
7.75%
Listening and viewing 5.97% 5.51%
Speaking and presenting 12.30% 11.02%
General capabilities and processes 5.54% 5.23%
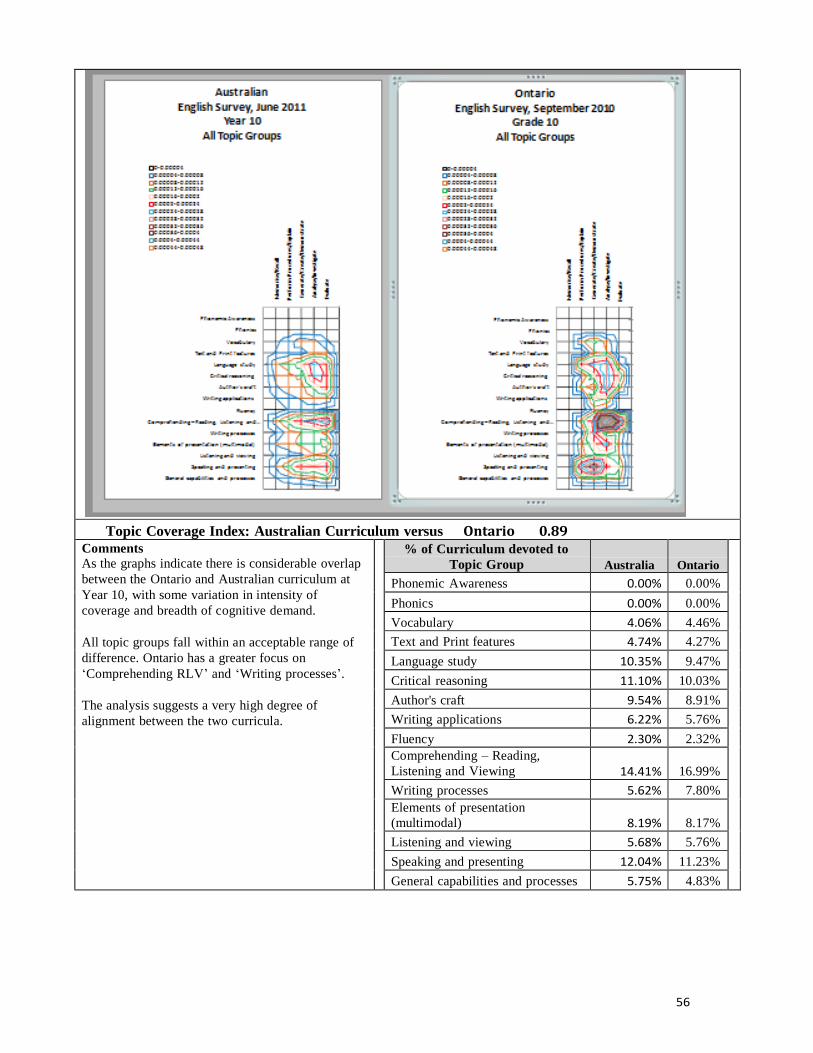
56
Topic Coverage Index: Australian Curriculum versus Ontario 0.89 Comments As the graphs indicate there is considerable overlap
between the Ontario and Australian curriculum at
Year 10, with some variation in intensity of
coverage and breadth of cognitive demand.
All topic groups fall within an acceptable range of
difference. Ontario has a greater focus on
‘Comprehending RLV’ and ‘Writing processes’.
The analysis suggests a very high degree of
alignment between the two curricula.
% of Curriculum devoted to
Topic Group
Australia
Ontario
Phonemic Awareness 0.00% 0.00%
Phonics 0.00% 0.00%
Vocabulary 4.06% 4.46%
Text and Print features 4.74% 4.27%
Language study 10.35% 9.47%
Critical reasoning 11.10% 10.03%
Author's craft 9.54% 8.91%
Writing applications 6.22% 5.76%
Fluency 2.30% 2.32%
Comprehending – Reading,
Listening and Viewing
14.41%
16.99%
Writing processes 5.62% 7.80%
Elements of presentation
(multimodal)
8.19%
8.17%
Listening and viewing 5.68% 5.76%
Speaking and presenting 12.04% 11.23%
General capabilities and processes 5.75% 4.83%
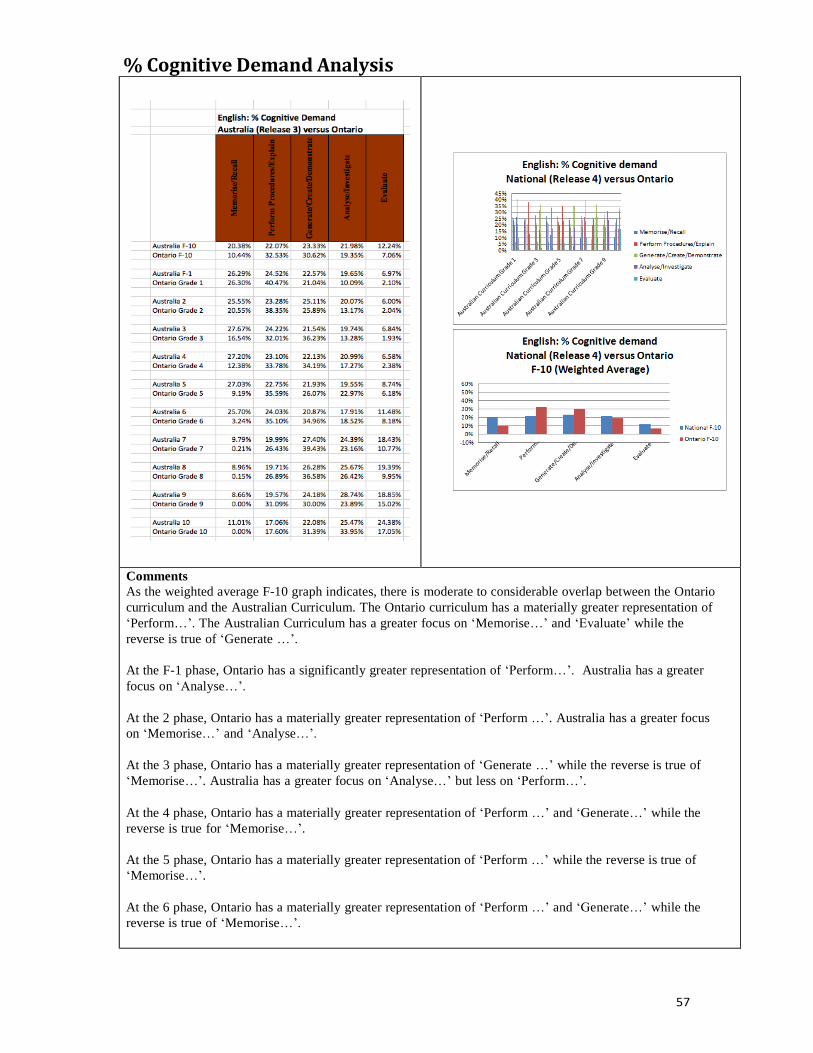
57
% Cognitive Demand Analysis
Comments
As the weighted average F-10 graph indicates, there is moderate to considerable overlap between the Ontario
curriculum and the Australian Curriculum. The Ontario curriculum has a materially greater representation of
‘Perform…’. The Australian Curriculum has a greater focus on ‘Memorise…’ and ‘Evaluate’ while the
reverse is true of ‘Generate …’.
At the F-1 phase, Ontario has a significantly greater representation of ‘Perform…’. Australia has a greater
focus on ‘Analyse…’.
At the 2 phase, Ontario has a materially greater representation of ‘Perform …’. Australia has a greater focus
on ‘Memorise…’ and ‘Analyse…’.
At the 3 phase, Ontario has a materially greater representation of ‘Generate …’ while the reverse is true of
‘Memorise…’. Australia has a greater focus on ‘Analyse…’ but less on ‘Perform…’.
At the 4 phase, Ontario has a materially greater representation of ‘Perform …’ and ‘Generate…’ while the
reverse is true for ‘Memorise…’.
At the 5 phase, Ontario has a materially greater representation of ‘Perform …’ while the reverse is true of
‘Memorise…’.
At the 6 phase, Ontario has a materially greater representation of ‘Perform …’ and ‘Generate…’ while the
reverse is true of ‘Memorise…’.
58
At the 7 phase, Ontario has a materially greater representation of ‘Generate…’. Ontario has a greater
focus on ‘Perform, while Australia has a greater focus on ‘Memorise…’ and ‘Evaluate’.
At the 8 phase, Ontario has a materially greater representation of ‘Generate…’. Ontario has a greater
focus on ‘Perform…’ while the reverse is true of ‘Memorise…’ and ‘Evaluate’.
At the 9 phase, Memorise is absent from the Ontario curriculum. Ontario has a materially
greater representation of ‘Perform…’ and a greater focus on ‘Generate…’.
At the 10 phase, Memorise is absent from the Ontario curriculum. Australia has a greater focus on
‘Evaluate’ but the reverse is true of ‘Generate
59
APPENDIX 6: ACARA CURRICULUM MAPPING - Mathematics
INTERNATIONAL MATHEMATICS REPORTS
This section of the report is based on the expert mapping of final version of the Mathematics curriculum documents for Australia and the two comparison curricula, Finland and Singapore. It provides details of the results for Finland and Singapore compared with results for the Australian Curriculum, organized by the curriculum phases used in the comparison curriculum.
As indicated in the overall report, for each subject report at each phase or year level within each jurisdiction, this appendix includes the following elements:
1. Graphs which represent the data resulting from the mapping process for the
Australian Curriculum and the comparison curriculum. The graphs represent the emphasis in the curriculum on both topic coverage and cognitive demand.
2. Topic Coverage Indices for each year‐level grouping used in that jurisdiction,
represented by a single number less than or equal to 1. The indices provide a measure of the extent to which the comparison curriculum for that stage of schooling is aligned with the Australian Curriculum. The index has been calculated by comparing the percentage of the curriculum devoted to each topic.
3. A table showing the percentage of the curriculum devoted to each topic group in
the Australian Curriculum and the comparison curriculum. This table supports a more detailed analysis of differences at the topic group level between each jurisdiction’s documents. The percentage of the curriculum devoted to each topic group is listed for the Australian curriculum and for the comparison jurisdiction.
4. A short written discussion of the key variations between the Australian
Curriculum and the comparison curriculum.
5. A discussion of relative cognitive demand in the subject as represented in the
Australian Curriculum and each comparison curriculum. This includes graphic representation of the relative representation of cognitive demand at each phase in the subject and in the subject overall. It also includes a table of percentages of each element of cognitive demand at each phase which are the basis for the graphic representation.
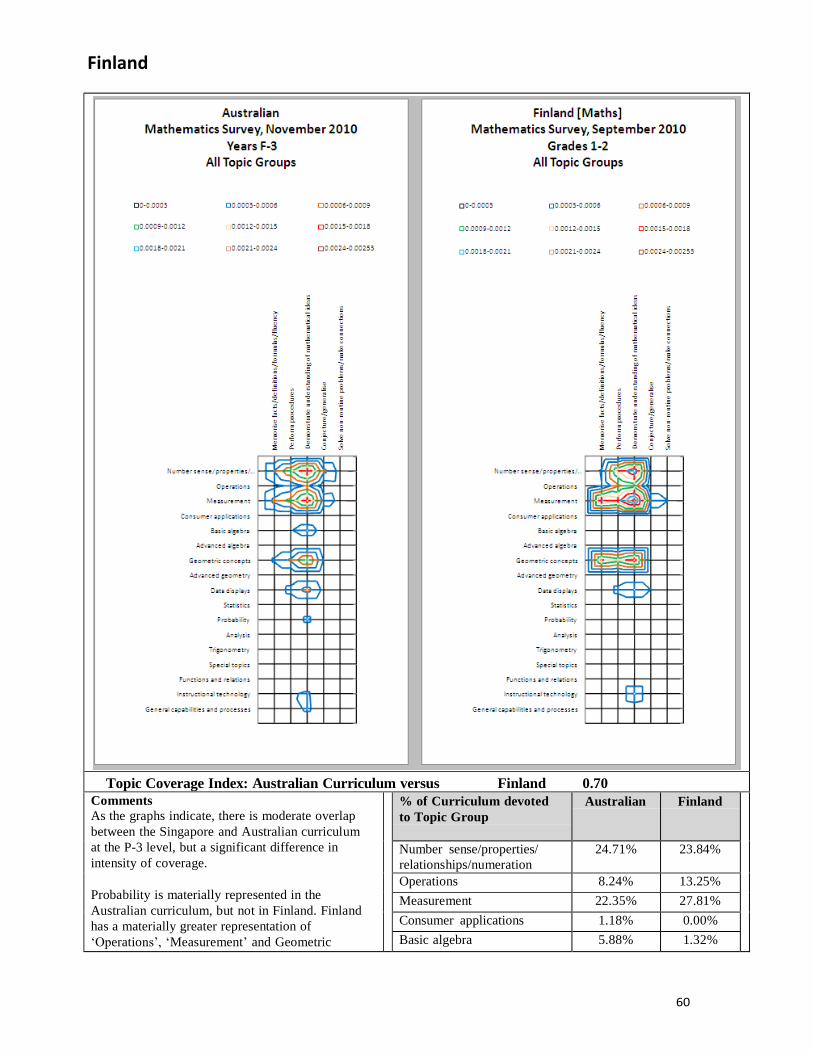
60
Finland
Topic Coverage Index: Australian Curriculum versus Finland 0.70
Comments
As the graphs indicate, there is moderate overlap
between the Singapore and Australian curriculum
at the P-3 level, but a significant difference in
intensity of coverage.
Probability is materially represented in the
Australian curriculum, but not in Finland. Finland
has a materially greater representation of
‘Operations’, ‘Measurement’ and Geometric
% of Curriculum devoted
to Topic Group
Australian Finland
Number sense/properties/
relationships/numeration
24.71% 23.84%
Operations 8.24% 13.25% Measurement 22.35% 27.81% Consumer applications 1.18% 0.00% Basic algebra 5.88% 1.32%
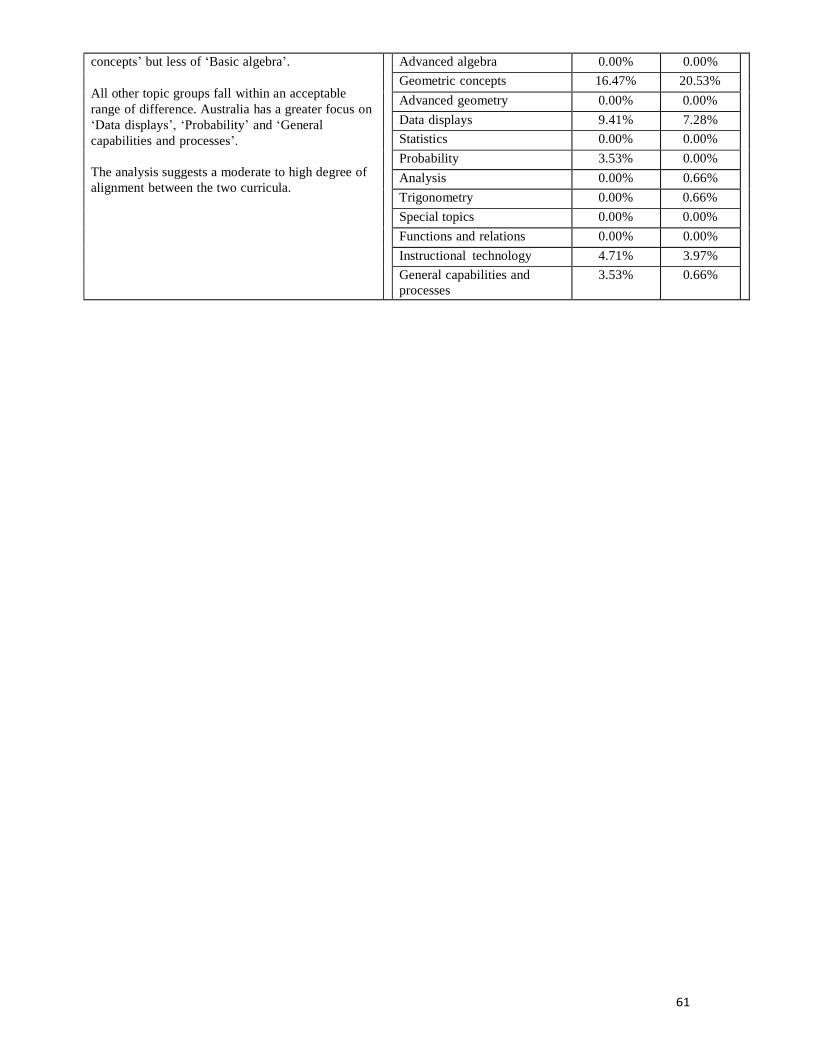
61
concepts’ but less of ‘Basic algebra’.
All other topic groups fall within an acceptable
range of difference. Australia has a greater focus on
‘Data displays’, ‘Probability’ and ‘General
capabilities and processes’.
The analysis suggests a moderate to high degree of
alignment between the two curricula.
Advanced algebra 0.00% 0.00% Geometric concepts 16.47% 20.53% Advanced geometry 0.00% 0.00% Data displays 9.41% 7.28% Statistics 0.00% 0.00% Probability 3.53% 0.00% Analysis 0.00% 0.66% Trigonometry 0.00% 0.66% Special topics 0.00% 0.00% Functions and relations 0.00% 0.00% Instructional technology 4.71% 3.97% General capabilities and
processes
3.53% 0.66%
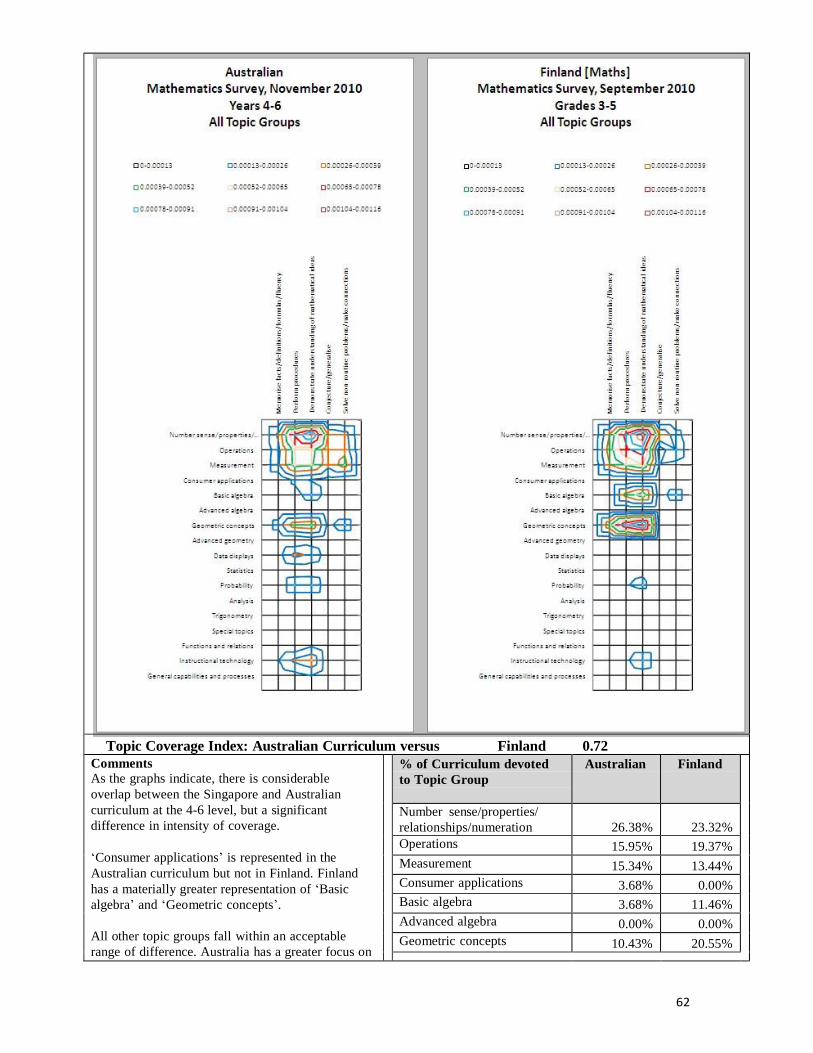
62
Topic Coverage Index: Australian Curriculum versus Finland 0.72
Comments As the graphs indicate, there is considerable
overlap between the Singapore and Australian
curriculum at the 4-6 level, but a significant
difference in intensity of coverage.
‘Consumer applications’ is represented in the
Australian curriculum but not in Finland. Finland
has a materially greater representation of ‘Basic
algebra’ and ‘Geometric concepts’.
All other topic groups fall within an acceptable
range of difference. Australia has a greater focus on
% of Curriculum devoted
to Topic Group
Australian Finland
Number sense/properties/
relationships/numeration
26.38%
23.32%
Operations 15.95% 19.37% Measurement 15.34% 13.44% Consumer applications 3.68% 0.00% Basic algebra 3.68% 11.46% Advanced algebra 0.00% 0.00% Geometric concepts 10.43% 20.55%
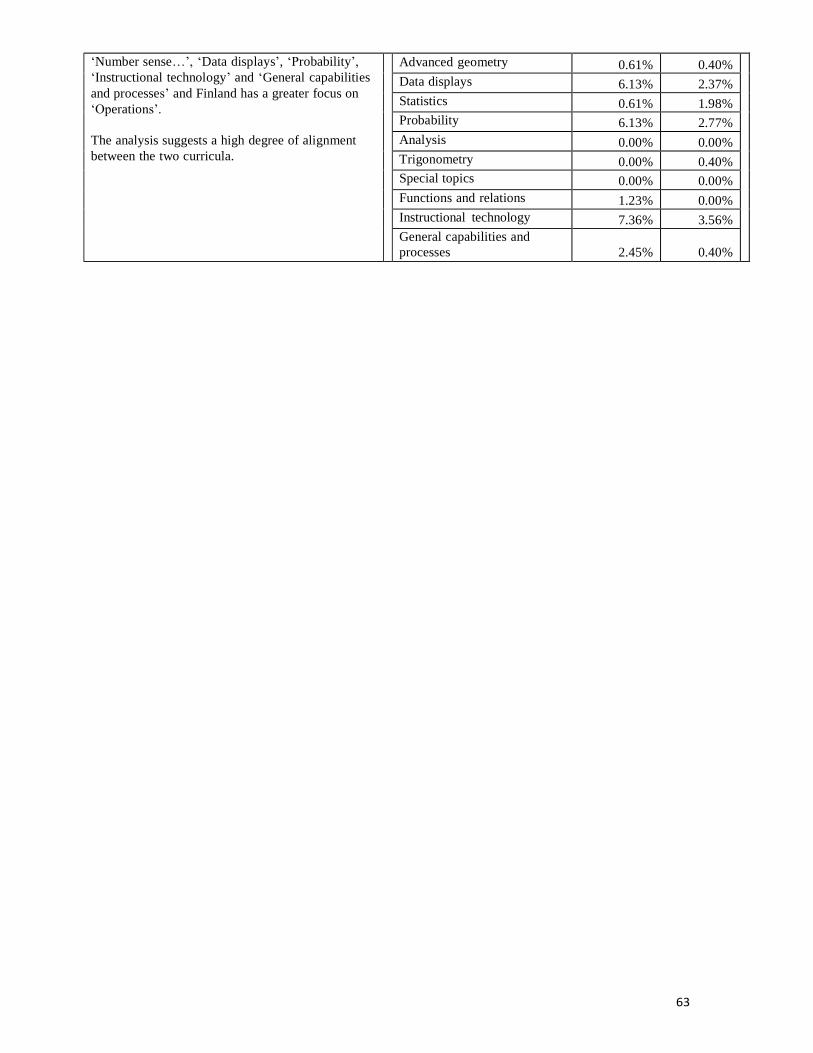
63
‘Number sense…’, ‘Data displays’, ‘Probability’,
‘Instructional technology’ and ‘General capabilities
and processes’ and Finland has a greater focus on
‘Operations’.
The analysis suggests a high degree of alignment
between the two curricula.
Advanced geometry 0.61% 0.40% Data displays 6.13% 2.37% Statistics 0.61% 1.98% Probability 6.13% 2.77% Analysis 0.00% 0.00% Trigonometry 0.00% 0.40% Special topics 0.00% 0.00% Functions and relations 1.23% 0.00% Instructional technology 7.36% 3.56% General capabilities and
processes
2.45%
0.40%
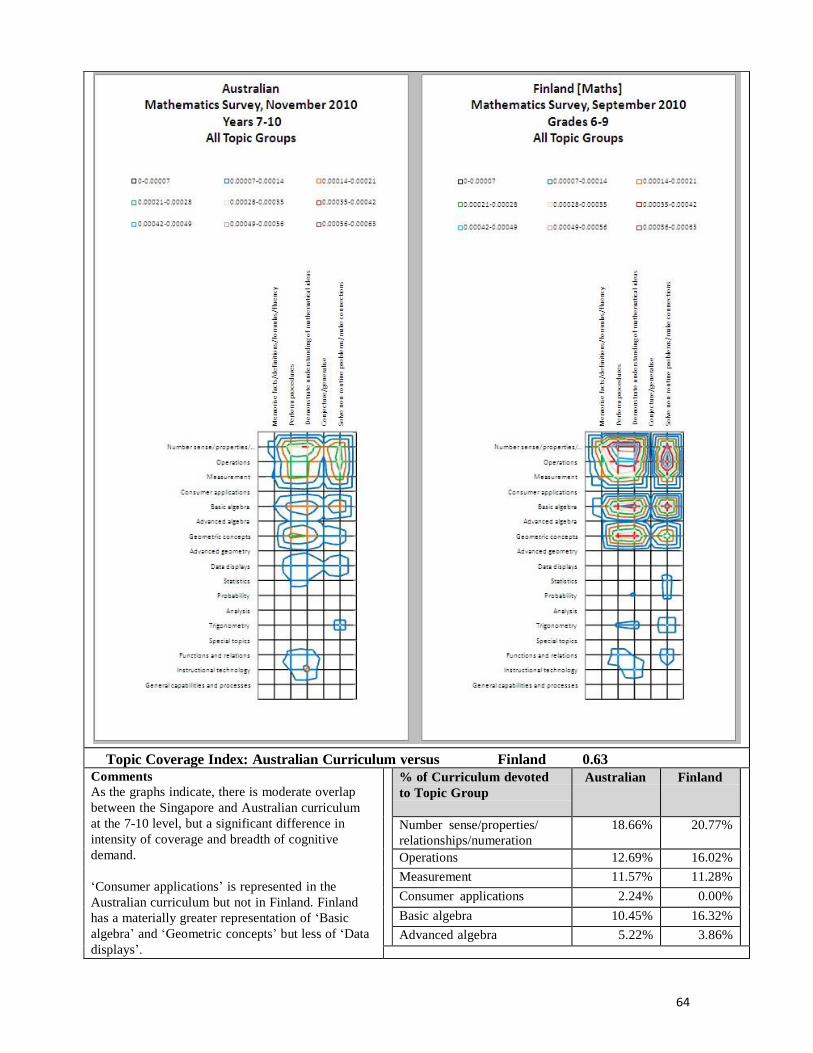
64
Topic Coverage Index: Australian Curriculum versus Finland 0.63 Comments
As the graphs indicate, there is moderate overlap
between the Singapore and Australian curriculum
at the 7-10 level, but a significant difference in
intensity of coverage and breadth of cognitive
demand.
‘Consumer applications’ is represented in the
Australian curriculum but not in Finland. Finland
has a materially greater representation of ‘Basic
algebra’ and ‘Geometric concepts’ but less of ‘Data
displays’.
% of Curriculum devoted
to Topic Group
Australian Finland
Number sense/properties/
relationships/numeration
18.66% 20.77%
Operations 12.69% 16.02% Measurement 11.57% 11.28% Consumer applications 2.24% 0.00% Basic algebra 10.45% 16.32% Advanced algebra 5.22% 3.86%

65
All other topic groups fall within an acceptable
range of difference. Australia has a greater focus on
‘Advanced geometry’ while Finland has a greater
focus on ‘Number sense…’ and ‘Operations’.
The analysis suggests a moderate degree of
alignment between the two curricula.
Geometric concepts 10.45% 14.54% Advanced geometry 2.99% 0.89% Data displays 5.97% 1.19% Statistics 3.73% 2.37% Probability 2.99% 2.37% Analysis 0.37% 0.00% Trigonometry 2.61% 3.26% Special topics 0.37% 0.00% Functions and relations 4.10% 3.86% Instructional technology 4.48% 2.67% General capabilities and
processes
1.12% 0.59%
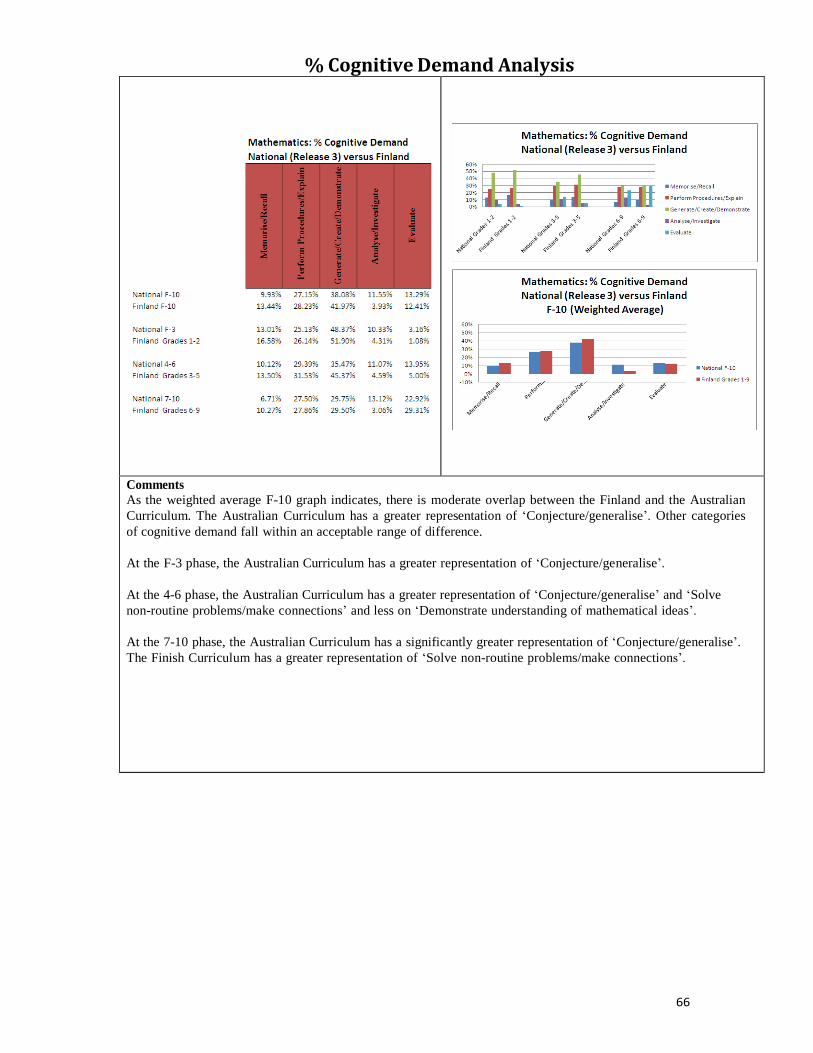
66
% Cognitive Demand Analysis
Comments
As the weighted average F-10 graph indicates, there is moderate overlap between the Finland and the Australian
Curriculum. The Australian Curriculum has a greater representation of ‘Conjecture/generalise’. Other categories
of cognitive demand fall within an acceptable range of difference.
At the F-3 phase, the Australian Curriculum has a greater representation of ‘Conjecture/generalise’.
At the 4-6 phase, the Australian Curriculum has a greater representation of ‘Conjecture/generalise’ and ‘Solve
non-routine problems/make connections’ and less on ‘Demonstrate understanding of mathematical ideas’.
At the 7-10 phase, the Australian Curriculum has a significantly greater representation of ‘Conjecture/generalise’.
The Finish Curriculum has a greater representation of ‘Solve non-routine problems/make connections’.
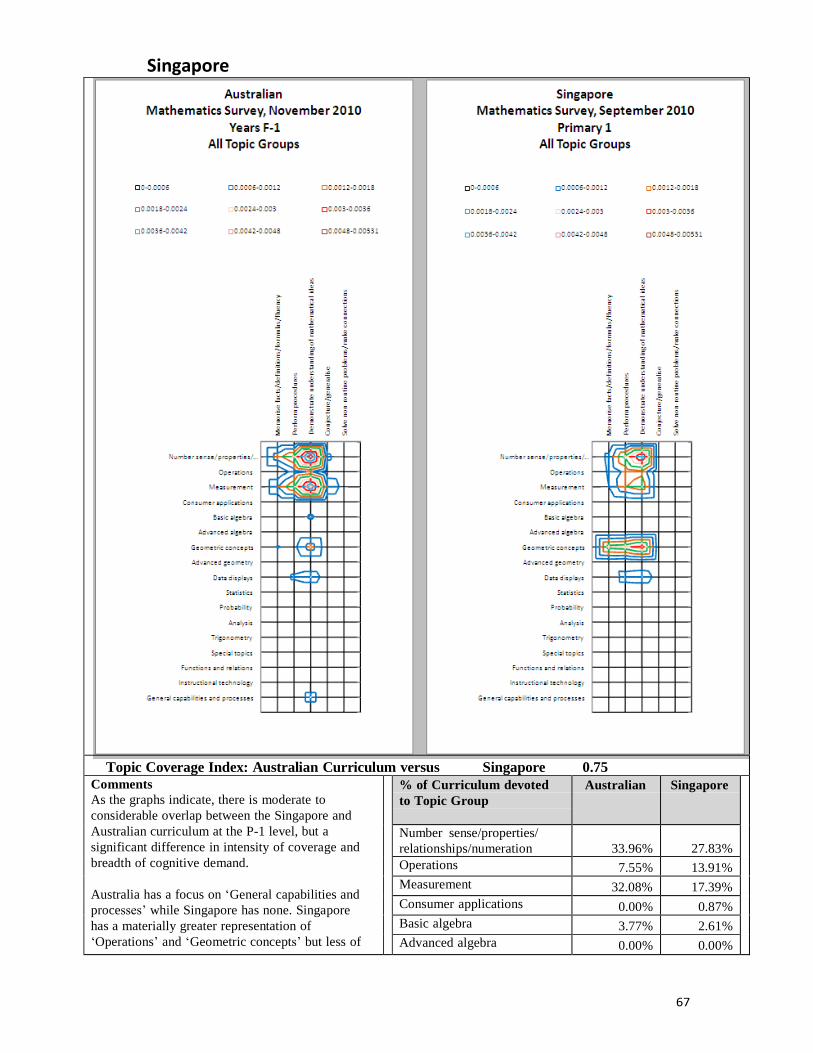
67
Singapore
Topic Coverage Index: Australian Curriculum versus Singapore 0.75 Comments
As the graphs indicate, there is moderate to
considerable overlap between the Singapore and
Australian curriculum at the P-1 level, but a
significant difference in intensity of coverage and
breadth of cognitive demand.
Australia has a focus on ‘General capabilities and
processes’ while Singapore has none. Singapore
has a materially greater representation of
‘Operations’ and ‘Geometric concepts’ but less of
% of Curriculum devoted
to Topic Group
Australian Singapore
Number sense/properties/
relationships/numeration
33.96%
27.83%
Operations 7.55% 13.91% Measurement 32.08% 17.39% Consumer applications 0.00% 0.87% Basic algebra 3.77% 2.61% Advanced algebra 0.00% 0.00%
68
‘Number sense…’ and ‘Measurement’.
All other topic groups fall within an acceptable
range of difference.
The analysis suggests a high degree of alignment
between the two curricula.
Geometric concepts 9.43% 26.96% Advanced geometry 0.00% 0.87% Data displays 7.55% 8.70% Statistics 0.00% 0.00% Probability 1.89% 0.00% Analysis 0.00% 0.00% Trigonometry 0.00% 0.00% Special topics 0.00% 0.87% Functions and relations 0.00% 0.00% Instructional technology 0.00% 0.00% General capabilities and
processes
3.77%
0.00%
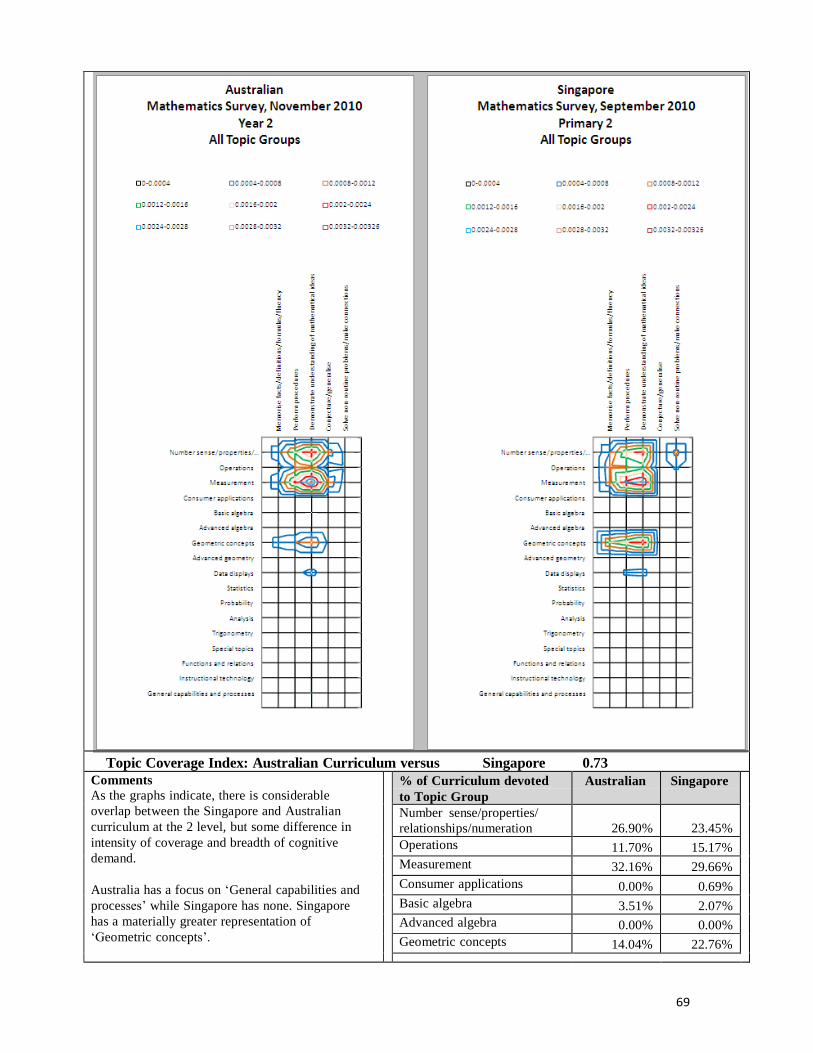
69
Topic Coverage Index: Australian Curriculum versus Singapore 0.73
Comments
As the graphs indicate, there is considerable
overlap between the Singapore and Australian
curriculum at the 2 level, but some difference in
intensity of coverage and breadth of cognitive
demand.
Australia has a focus on ‘General capabilities and
processes’ while Singapore has none. Singapore
has a materially greater representation of
‘Geometric concepts’.
% of Curriculum devoted
to Topic Group
Australian Singapore
Number sense/properties/
relationships/numeration
26.90%
23.45%
Operations 11.70% 15.17% Measurement 32.16% 29.66% Consumer applications 0.00% 0.69% Basic algebra 3.51% 2.07% Advanced algebra 0.00% 0.00% Geometric concepts 14.04% 22.76%

70
All other topic groups fall within an acceptable
range of difference. Australia has a greater focus on
‘Number sense…’ and ‘Measurement’ and less on
‘Operations’.
The analysis suggests a high degree of alignment
between the two curricula.
Advanced geometry 0.00% 0.00% Data displays 5.26% 6.21% Statistics 0.00% 0.00% Probability 1.75% 0.00% Analysis 0.00% 0.00% Trigonometry 0.00% 0.00% Special topics 0.00% 0.00% Functions and relations 0.00% 0.00% Instructional technology 1.75% 0.00% General capabilities and
processes
2.92%
0.00%
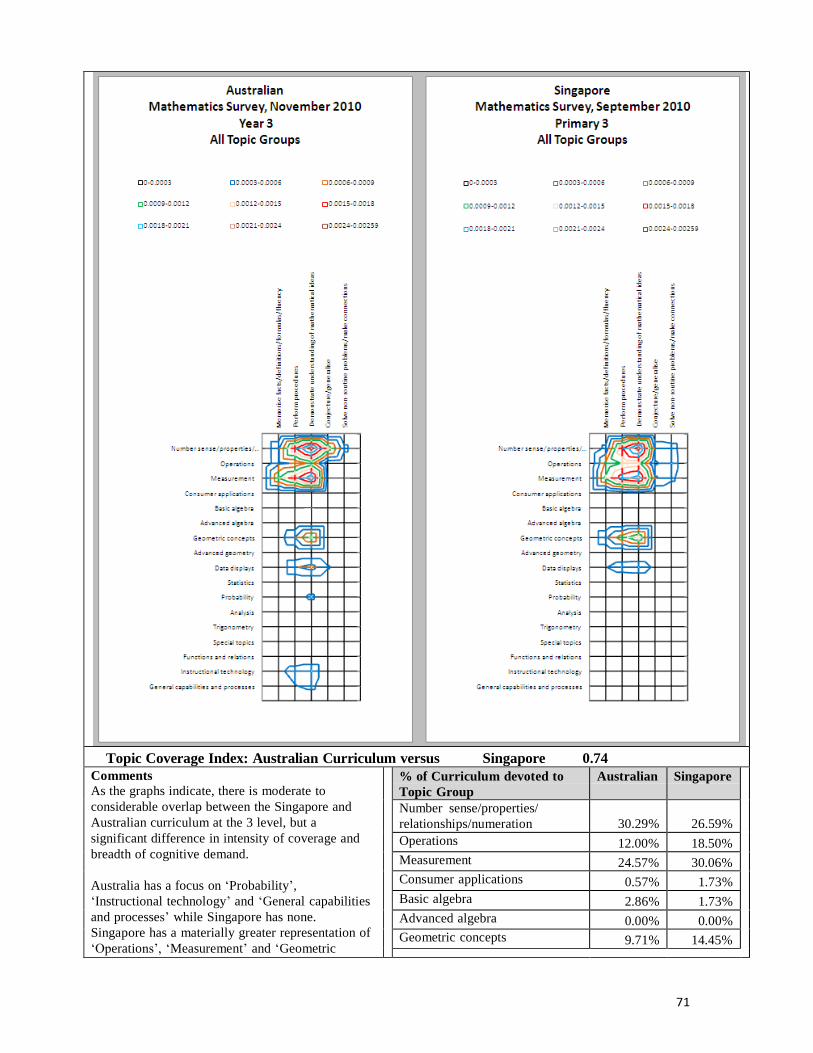
71
Topic Coverage Index: Australian Curriculum versus Singapore 0.74
Comments
As the graphs indicate, there is moderate to
considerable overlap between the Singapore and
Australian curriculum at the 3 level, but a
significant difference in intensity of coverage and
breadth of cognitive demand.
Australia has a focus on ‘Probability’,
‘Instructional technology’ and ‘General capabilities
and processes’ while Singapore has none.
Singapore has a materially greater representation of
‘Operations’, ‘Measurement’ and ‘Geometric
% of Curriculum devoted to
Topic Group
Australian Singapore
Number sense/properties/
relationships/numeration
30.29%
26.59%
Operations 12.00% 18.50% Measurement 24.57% 30.06% Consumer applications 0.57% 1.73% Basic algebra 2.86% 1.73% Advanced algebra 0.00% 0.00% Geometric concepts 9.71% 14.45%

72
concepts’.
All other topic groups fall within an acceptable
range of difference. Australia has a greater focus on
‘Number sense…’.
The analysis suggests a high degree of alignment
between the two curricula.
Advanced geometry 0.00% 0.00% Data displays 8.00% 6.94% Statistics 0.00% 0.00% Probability 2.86% 0.00% Analysis 0.00% 0.00% Trigonometry 0.00% 0.00% Special topics 0.00% 0.00% Functions and relations 0.00% 0.00% Instructional technology 5.71% 0.00% General capabilities and
processes
3.43%
0.00%
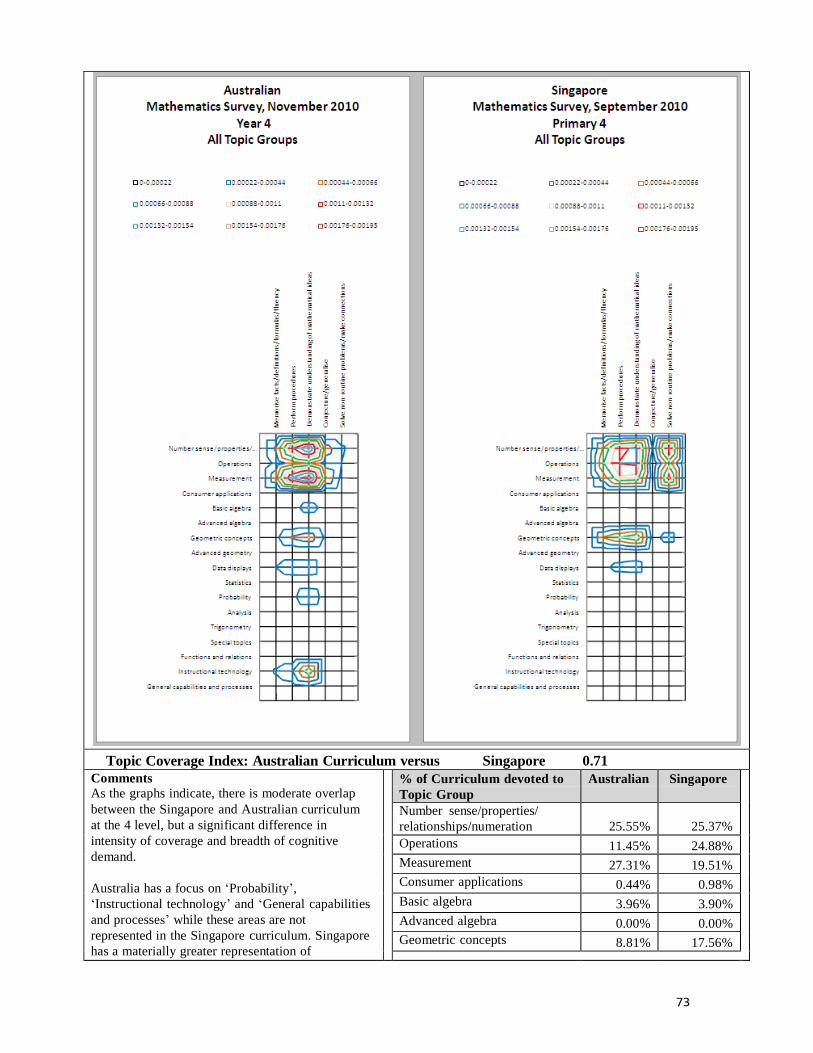
73
Topic Coverage Index: Australian Curriculum versus Singapore 0.71
Comments As the graphs indicate, there is moderate overlap
between the Singapore and Australian curriculum
at the 4 level, but a significant difference in
intensity of coverage and breadth of cognitive
demand.
Australia has a focus on ‘Probability’,
‘Instructional technology’ and ‘General capabilities
and processes’ while these areas are not
represented in the Singapore curriculum. Singapore
has a materially greater representation of
% of Curriculum devoted to
Topic Group
Australian Singapore
Number sense/properties/
relationships/numeration
25.55%
25.37%
Operations 11.45% 24.88% Measurement 27.31% 19.51% Consumer applications 0.44% 0.98% Basic algebra 3.96% 3.90% Advanced algebra 0.00% 0.00% Geometric concepts 8.81% 17.56%
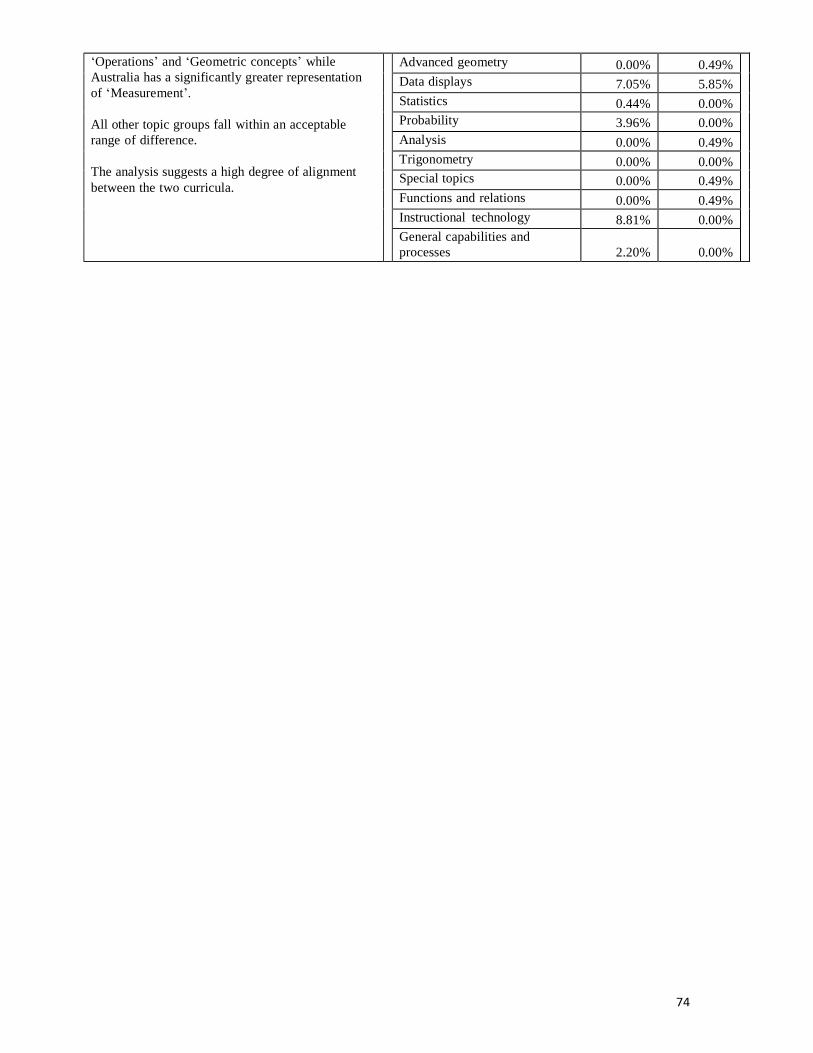
74
‘Operations’ and ‘Geometric concepts’ while
Australia has a significantly greater representation
of ‘Measurement’.
All other topic groups fall within an acceptable
range of difference.
The analysis suggests a high degree of alignment
between the two curricula.
Advanced geometry 0.00% 0.49% Data displays 7.05% 5.85% Statistics 0.44% 0.00% Probability 3.96% 0.00% Analysis 0.00% 0.49% Trigonometry 0.00% 0.00% Special topics 0.00% 0.49% Functions and relations 0.00% 0.49% Instructional technology 8.81% 0.00% General capabilities and
processes
2.20%
0.00%
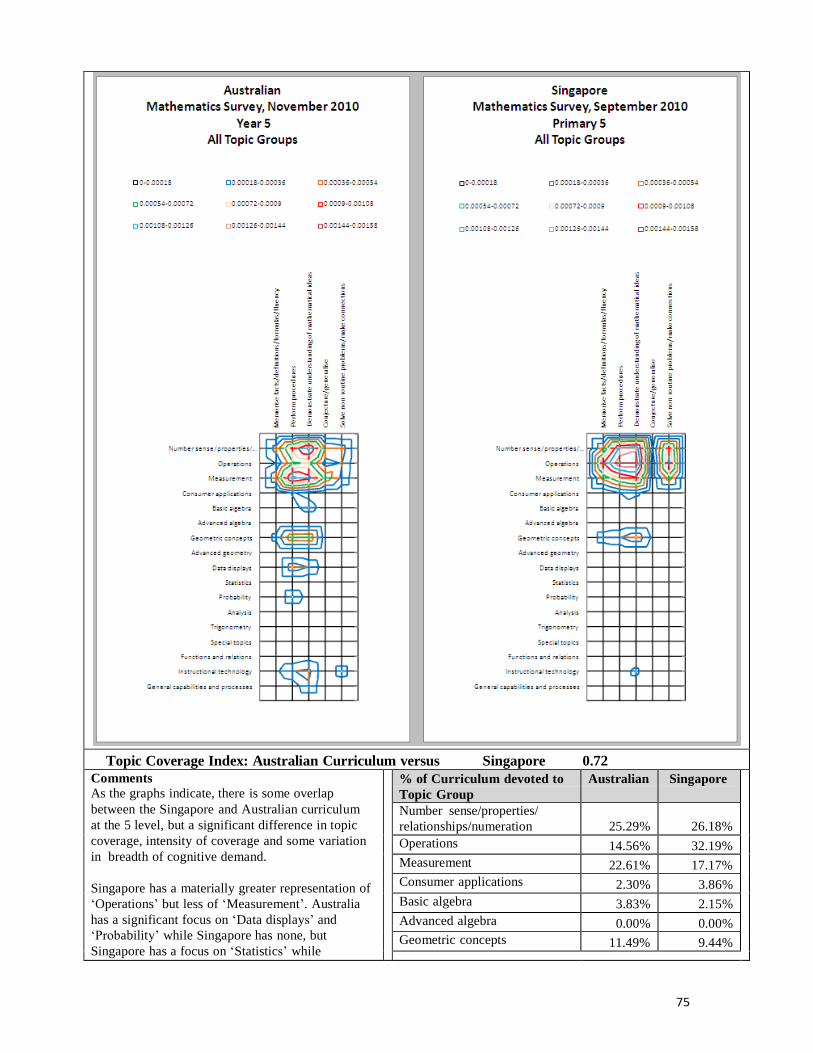
75
Topic Coverage Index: Australian Curriculum versus Singapore 0.72
Comments As the graphs indicate, there is some overlap
between the Singapore and Australian curriculum
at the 5 level, but a significant difference in topic
coverage, intensity of coverage and some variation
in breadth of cognitive demand.
Singapore has a materially greater representation of
‘Operations’ but less of ‘Measurement’. Australia
has a significant focus on ‘Data displays’ and
‘Probability’ while Singapore has none, but
Singapore has a focus on ‘Statistics’ while
% of Curriculum devoted to
Topic Group
Australian Singapore
Number sense/properties/
relationships/numeration
25.29%
26.18%
Operations 14.56% 32.19% Measurement 22.61% 17.17% Consumer applications 2.30% 3.86% Basic algebra 3.83% 2.15% Advanced algebra 0.00% 0.00% Geometric concepts 11.49% 9.44%

76
Australia has none.
All other topic groups fall within an acceptable
range of difference. Australia has a greater focus on
‘Geometric concepts’ and ‘Instructional
technology’.
The analysis suggests a high degree of alignment
between the two curricula.
Advanced geometry 0.00% 0.00% Data displays 6.13% 0.00% Statistics 0.00% 2.58% Probability 3.45% 0.00% Analysis 0.00% 0.00% Trigonometry 0.00% 0.86% Special topics 0.00% 0.43% Functions and relations 0.77% 0.86% Instructional technology 6.51% 2.58% General capabilities and
processes
3.07%
1.72%
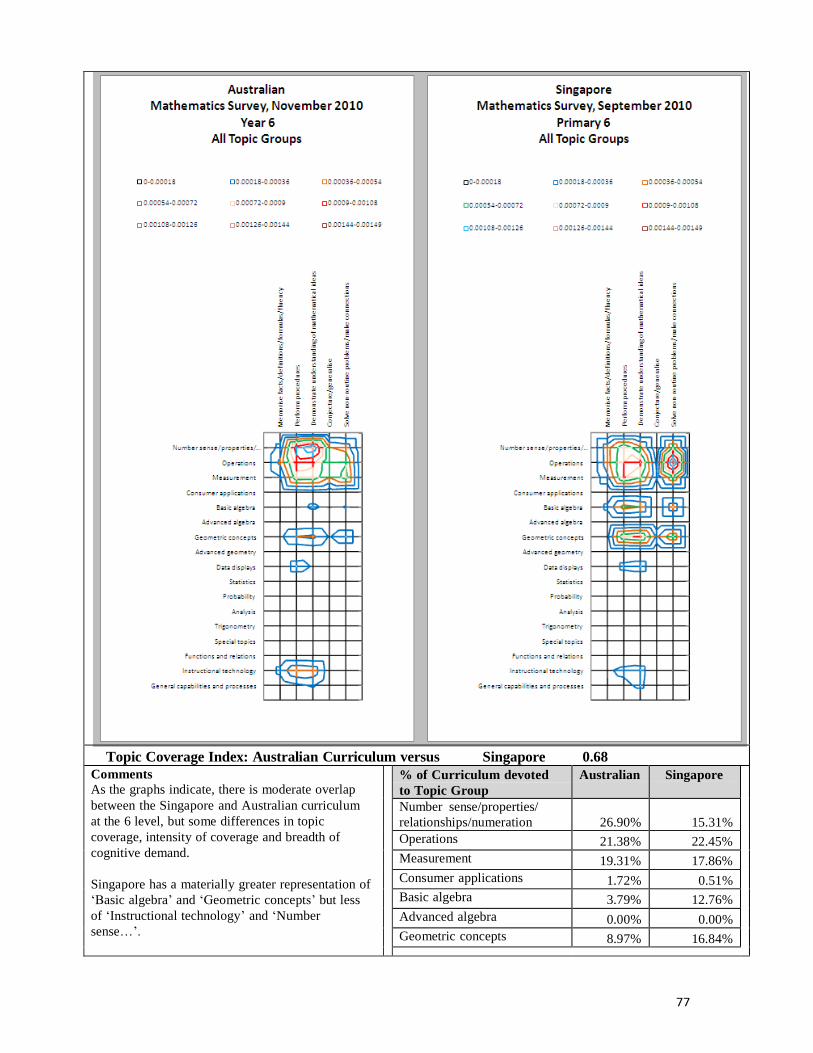
77
Topic Coverage Index: Australian Curriculum versus Singapore 0.68
Comments
As the graphs indicate, there is moderate overlap
between the Singapore and Australian curriculum
at the 6 level, but some differences in topic
coverage, intensity of coverage and breadth of
cognitive demand.
Singapore has a materially greater representation of
‘Basic algebra’ and ‘Geometric concepts’ but less
of ‘Instructional technology’ and ‘Number
sense…’.
% of Curriculum devoted
to Topic Group
Australian Singapore
Number sense/properties/
relationships/numeration
26.90%
15.31%
Operations 21.38% 22.45% Measurement 19.31% 17.86% Consumer applications 1.72% 0.51% Basic algebra 3.79% 12.76% Advanced algebra 0.00% 0.00% Geometric concepts 8.97% 16.84%
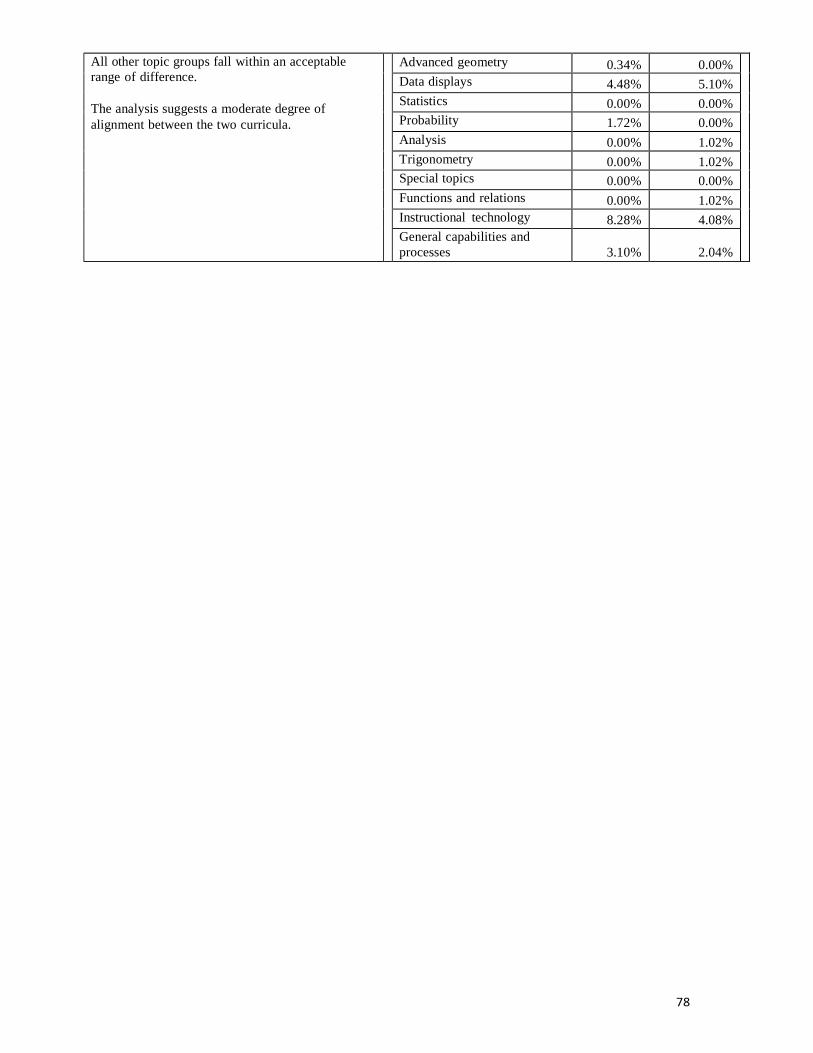
78
All other topic groups fall within an acceptable
range of difference.
The analysis suggests a moderate degree of
alignment between the two curricula.
Advanced geometry 0.34% 0.00% Data displays 4.48% 5.10% Statistics 0.00% 0.00% Probability 1.72% 0.00% Analysis 0.00% 1.02% Trigonometry 0.00% 1.02% Special topics 0.00% 0.00% Functions and relations 0.00% 1.02% Instructional technology 8.28% 4.08% General capabilities and
processes
3.10%
2.04%
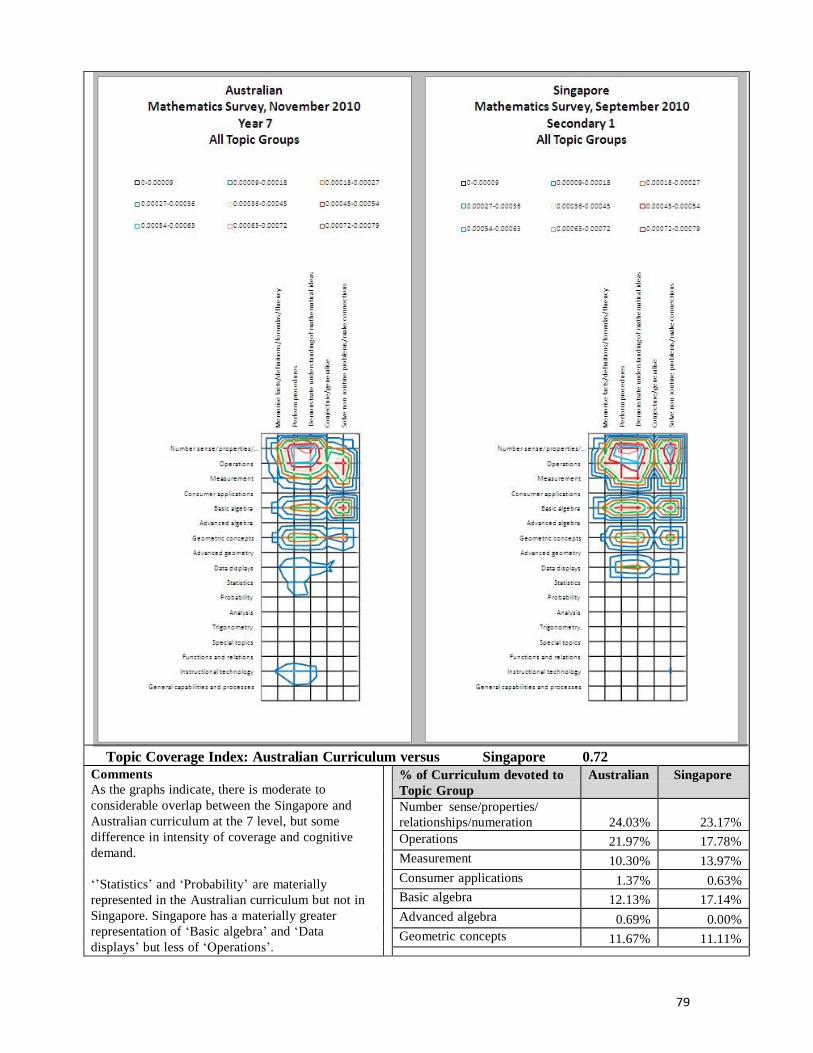
79
Topic Coverage Index: Australian Curriculum versus Singapore 0.72
Comments
As the graphs indicate, there is moderate to
considerable overlap between the Singapore and
Australian curriculum at the 7 level, but some
difference in intensity of coverage and cognitive
demand.
‘’Statistics’ and ‘Probability’ are materially
represented in the Australian curriculum but not in
Singapore. Singapore has a materially greater
representation of ‘Basic algebra’ and ‘Data
displays’ but less of ‘Operations’.
% of Curriculum devoted to
Topic Group
Australian Singapore
Number sense/properties/
relationships/numeration
24.03%
23.17%
Operations 21.97% 17.78%
Measurement 10.30% 13.97%
Consumer applications 1.37% 0.63%
Basic algebra 12.13% 17.14%
Advanced algebra 0.69% 0.00%
Geometric concepts 11.67% 11.11%
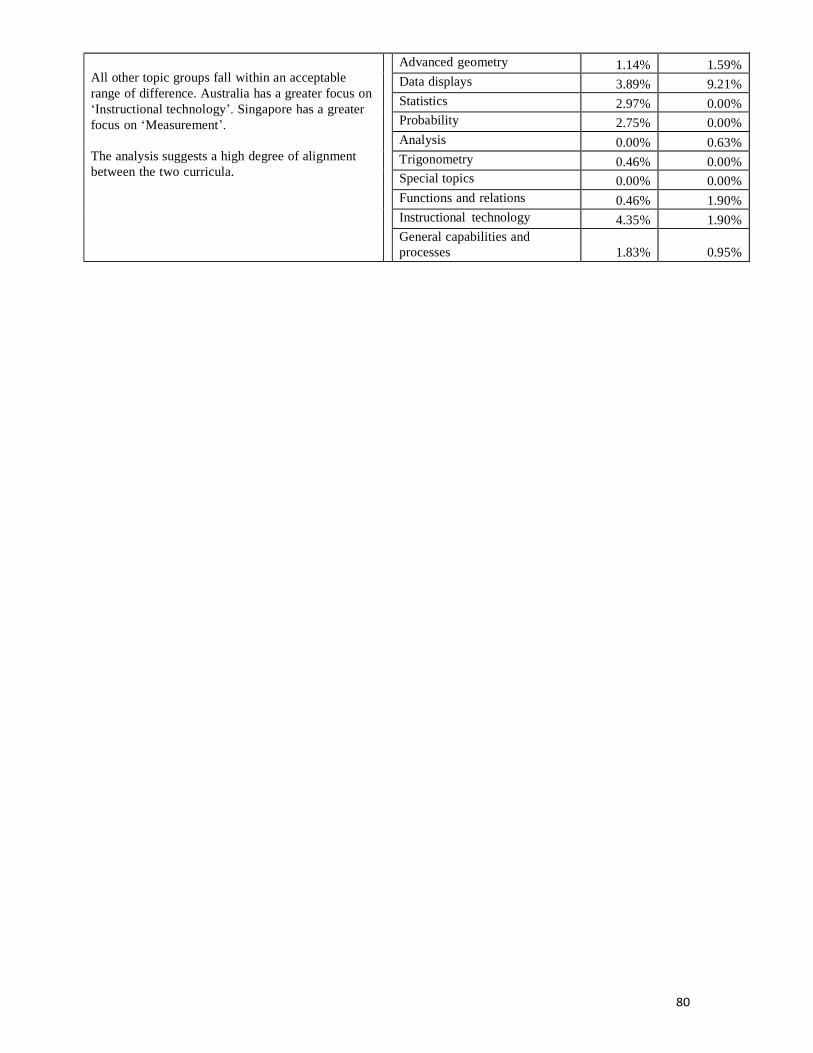
80
All other topic groups fall within an acceptable
range of difference. Australia has a greater focus on
‘Instructional technology’. Singapore has a greater
focus on ‘Measurement’.
The analysis suggests a high degree of alignment
between the two curricula.
Advanced geometry 1.14% 1.59%
Data displays 3.89% 9.21%
Statistics 2.97% 0.00%
Probability 2.75% 0.00%
Analysis 0.00% 0.63%
Trigonometry 0.46% 0.00%
Special topics 0.00% 0.00%
Functions and relations 0.46% 1.90%
Instructional technology 4.35% 1.90%
General capabilities and
processes
1.83%
0.95%
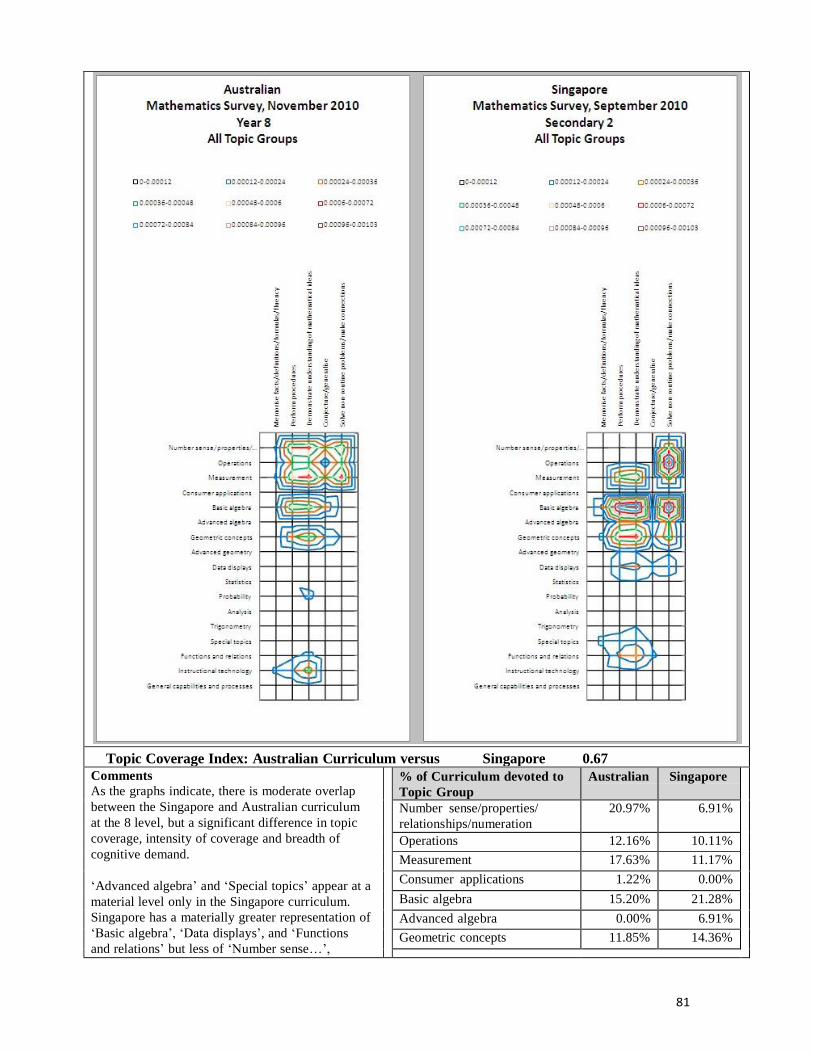
81
Topic Coverage Index: Australian Curriculum versus Singapore 0.67 Comments
As the graphs indicate, there is moderate overlap
between the Singapore and Australian curriculum
at the 8 level, but a significant difference in topic
coverage, intensity of coverage and breadth of
cognitive demand.
‘Advanced algebra’ and ‘Special topics’ appear at a
material level only in the Singapore curriculum.
Singapore has a materially greater representation of
‘Basic algebra’, ‘Data displays’, and ‘Functions
and relations’ but less of ‘Number sense…’,
% of Curriculum devoted to
Topic Group
Australian Singapore
Number sense/properties/
relationships/numeration
20.97% 6.91%
Operations 12.16% 10.11% Measurement 17.63% 11.17% Consumer applications 1.22% 0.00% Basic algebra 15.20% 21.28% Advanced algebra 0.00% 6.91% Geometric concepts 11.85% 14.36%

82
‘Measurement’ and ‘Instructional technology’.
All other topic groups fall within an acceptable
range of difference. Australia has a greater focus on
‘Operations. Singapore has a greater focus on
‘Geometric concepts’.
The analysis suggests a moderate degree of
alignment between the two curricula.
Advanced geometry 1.82% 2.66% Data displays 2.13% 6.91% Statistics 3.04% 2.66% Probability 2.74% 2.13% Analysis 0.00% 0.00% Trigonometry 0.91% 1.60% Special topics 0.00% 4.26% Functions and relations 2.74% 6.91% Instructional technology 6.08% 1.60% General capabilities and
processes
1.52% 0.53%
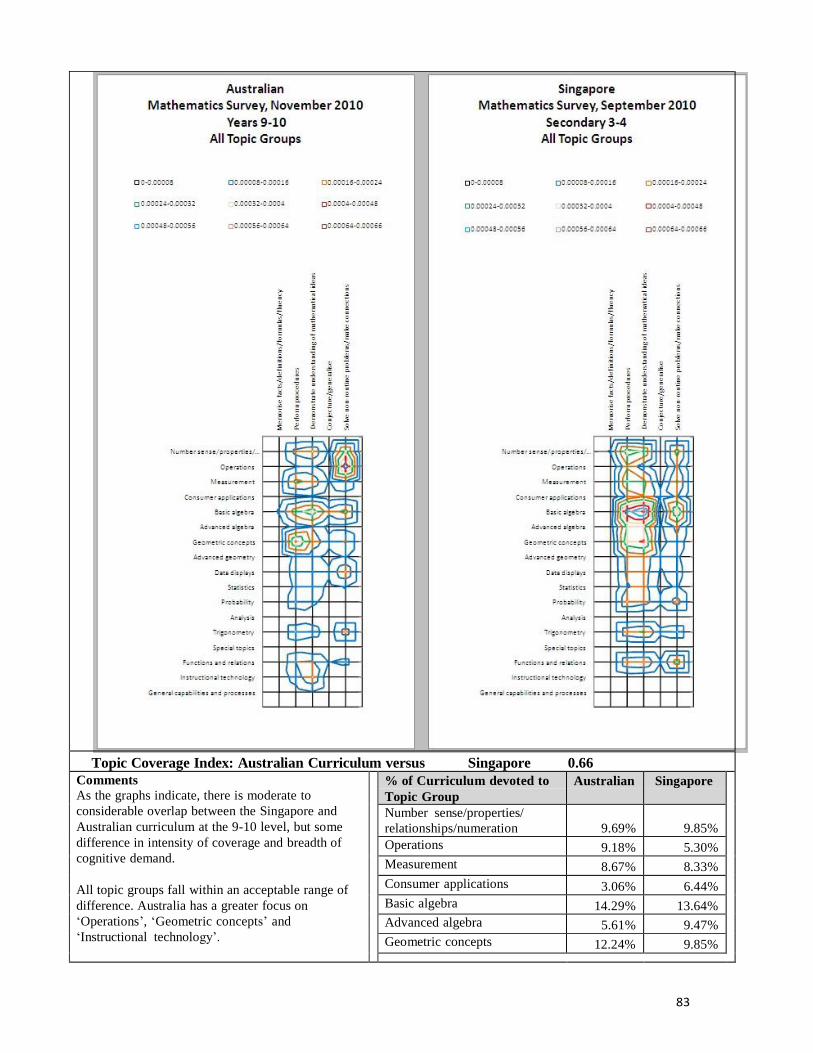
83
Topic Coverage Index: Australian Curriculum versus Singapore 0.66
Comments
As the graphs indicate, there is moderate to
considerable overlap between the Singapore and
Australian curriculum at the 9-10 level, but some
difference in intensity of coverage and breadth of
cognitive demand.
All topic groups fall within an acceptable range of
difference. Australia has a greater focus on
‘Operations’, ‘Geometric concepts’ and
‘Instructional technology’.
% of Curriculum devoted to
Topic Group
Australian Singapore
Number sense/properties/
relationships/numeration
9.69%
9.85%
Operations 9.18% 5.30% Measurement 8.67% 8.33% Consumer applications 3.06% 6.44% Basic algebra 14.29% 13.64% Advanced algebra 5.61% 9.47% Geometric concepts 12.24% 9.85%
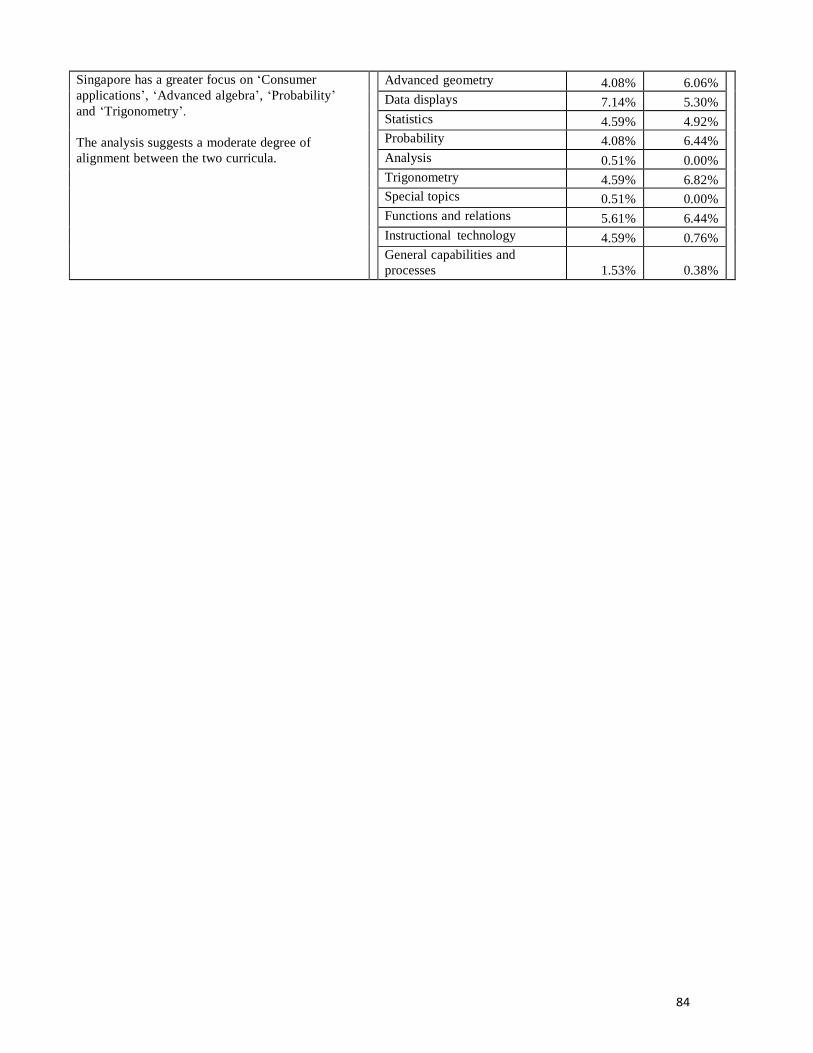
84
Singapore has a greater focus on ‘Consumer
applications’, ‘Advanced algebra’, ‘Probability’
and ‘Trigonometry’.
The analysis suggests a moderate degree of
alignment between the two curricula.
Advanced geometry 4.08% 6.06% Data displays 7.14% 5.30% Statistics 4.59% 4.92% Probability 4.08% 6.44% Analysis 0.51% 0.00% Trigonometry 4.59% 6.82% Special topics 0.51% 0.00% Functions and relations 5.61% 6.44% Instructional technology 4.59% 0.76% General capabilities and
processes
1.53%
0.38%
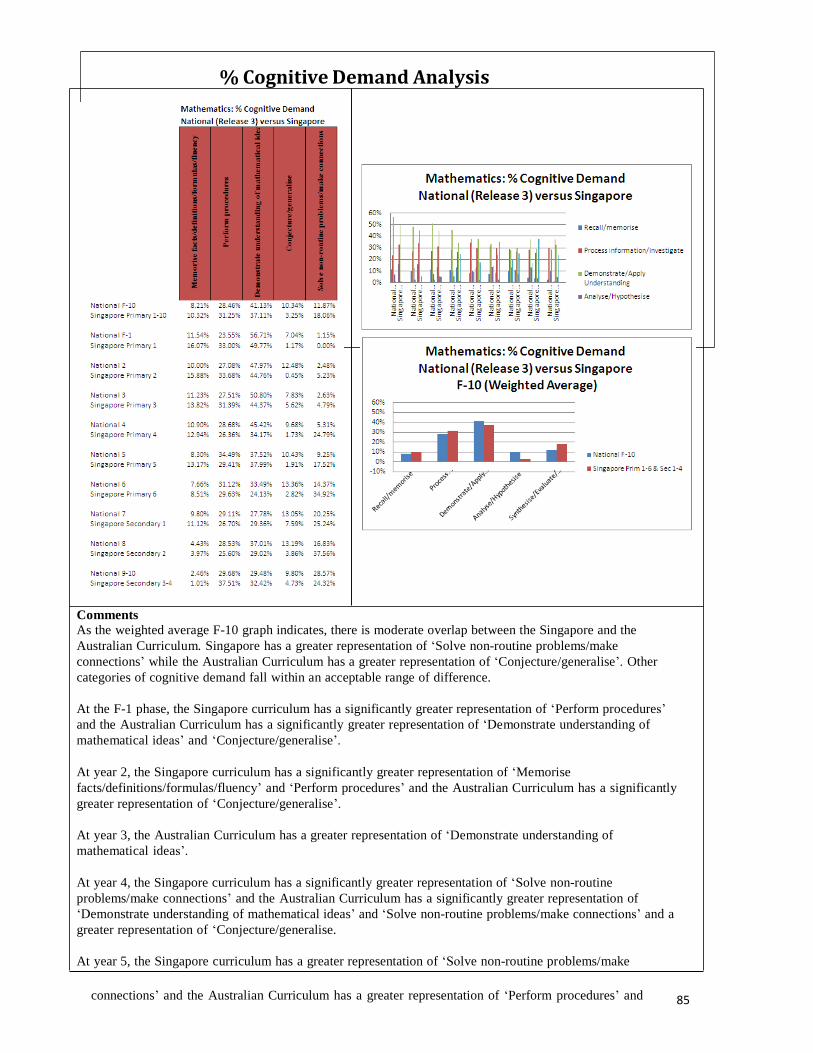
% Cognitive Demand Analysis
Comments As the weighted average F-10 graph indicates, there is moderate overlap between the Singapore and the
Australian Curriculum. Singapore has a greater representation of ‘Solve non-routine problems/make
connections’ while the Australian Curriculum has a greater representation of ‘Conjecture/generalise’. Other
categories of cognitive demand fall within an acceptable range of difference.
At the F-1 phase, the Singapore curriculum has a significantly greater representation of ‘Perform procedures’
and the Australian Curriculum has a significantly greater representation of ‘Demonstrate understanding of
mathematical ideas’ and ‘Conjecture/generalise’.
At year 2, the Singapore curriculum has a significantly greater representation of ‘Memorise
facts/definitions/formulas/fluency’ and ‘Perform procedures’ and the Australian Curriculum has a significantly
greater representation of ‘Conjecture/generalise’.
At year 3, the Australian Curriculum has a greater representation of ‘Demonstrate understanding of
mathematical ideas’.
At year 4, the Singapore curriculum has a significantly greater representation of ‘Solve non-routine
problems/make connections’ and the Australian Curriculum has a significantly greater representation of
‘Demonstrate understanding of mathematical ideas’ and ‘Solve non-routine problems/make connections’ and a
greater representation of ‘Conjecture/generalise.
At year 5, the Singapore curriculum has a greater representation of ‘Solve non-routine problems/make
connections’ and the Australian Curriculum has a greater representation of ‘Perform procedures’ and 85
86
‘Conjecture/generalise’.
At year 6, the Singapore curriculum has a significantly greater representation of ‘Solve non-routine
problems/make connections’ and the Australian Curriculum has a significantly greater representation of
‘Conjecture/generalise’ and a greater representation of ‘Demonstrate understanding of mathematical ideas’.
At year 7, the Australian Curriculum has a greater representation of ‘Conjecture/generalise’.
At year 8, the Singapore curriculum has a significantly greater representation of ‘Solve non-routine
problems/make connections’ and the Australian Curriculum has a greater representation of ‘Demonstrate
understanding of mathematical ideas ‘ and ‘Conjecture/generalise’.
At years 9 and 10, the Singapore curriculum has a greater representation of ‘Perform procedures’ and the
Australian Curriculum has a greater representation of ‘Conjecture/generalise’.
87
APPENDIX 7: ACARA CURRICULUM MAPPING – Science
INTERNATIONAL SCIENCE REPORTS
This section of the report is based on the expert mapping of the final version of the Science curriculum documents for Australia and the two comparison curricula, Ontario and Finland. It provides details of the results for Ontario and Finland compared with results for the Australian Curriculum, organized by the curriculum phases used in the comparison curriculum.
As indicated in the overall report, for each subject report at each phase or year level within each jurisdiction, this appendix includes the following elements:
1. Graphs which represent the data resulting from the mapping process for the Australian
Curriculum and the comparison curriculum. The graphs represent the emphasis in the curriculum on both topic coverage and cognitive demand.
2. Topic Coverage Indices for each year‐level grouping used in that jurisdiction, represented by a
single number less than or equal to 1. The indices provide a measure of the extent to which the comparison curriculum for that stage of schooling is aligned with the Australian Curriculum. The index has been calculated by comparing the percentage of the curriculum devoted to each topic.
3. A table showing the percentage of the curriculum devoted to each topic group in the Australian
Curriculum and the comparison curriculum. This table supports a more detailed analysis of differences at the topic group level between each jurisdiction’s documents. The percentage of the curriculum devoted to each topic group is listed for the Australian curriculum and for the comparison jurisdiction.
4. A short written discussion of the key variations between the Australian Curriculum and the
comparison curriculum.
5. A discussion of relative cognitive demand in the subject as represented in the Australian
Curriculum and each comparison curriculum. This includes graphic representation of the relative representation of cognitive demand at each phase in the subject and in the subject overall. It also includes a table of percentages of each element of cognitive demand at each phase which are the basis for the graphic representation.
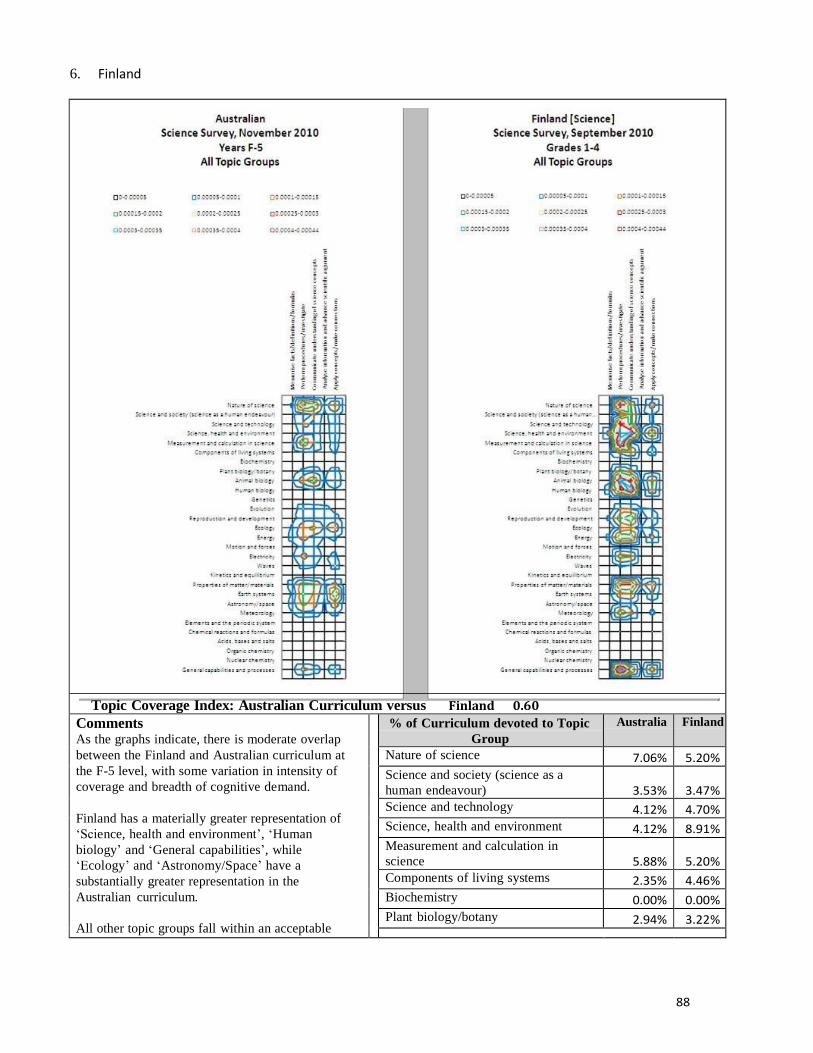
88
6. Finland
Topic Coverage Index: Australian Curriculum versus Finland 0.60
Comments As the graphs indicate, there is moderate overlap
between the Finland and Australian curriculum at
the F-5 level, with some variation in intensity of
coverage and breadth of cognitive demand.
Finland has a materially greater representation of
‘Science, health and environment’, ‘Human
biology’ and ‘General capabilities’, while
‘Ecology’ and ‘Astronomy/Space’ have a
substantially greater representation in the
Australian curriculum.
All other topic groups fall within an acceptable
% of Curriculum devoted to Topic
Group
Australia Finland
Nature of science 7.06% 5.20%
Science and society (science as a
human endeavour)
3.53%
3.47%
Science and technology 4.12% 4.70%
Science, health and environment 4.12% 8.91%
Measurement and calculation in
science
5.88%
5.20%
Components of living systems 2.35% 4.46%
Biochemistry 0.00% 0.00%
Plant biology/botany 2.94% 3.22%

89
range of difference. Finland has a greater focus on
‘Components of living systems’, but less on
‘Motion and forces’.
The analysis suggests a low to moderate degree of
alignment between the two curricula.
Animal biology 6.47% 7.67% Human biology 1.76% 7.43%
Genetics 0.00% 0.00%
Evolution 3.53% 3.22% Reproduction and development 3.53% 5.20%
Ecology 7.65% 2.97%
Energy 4.71% 6.68%
Motion and forces 2.94% 0.50% Electricity 4.71% 3.96%
Waves 2.94% 1.49%
Kinetics and equilibrium 0.00% 0.00% Properties of matter/materials 7.65% 7.18%
Earth systems 9.41% 4.21%
Astronomy/space 6.47% 1.73%
Meteorology 4.12% 3.47% Elements and the periodic system 0.00% 0.00%
Chemical reactions and formulas 0.59% 1.24%
Acids, bases and salts 0.00% 0.00% Organic chemistry 0.00% 0.00% Nuclear chemistry 0.00% 0.00%
General capabilities and processes 3.53% 7.92%
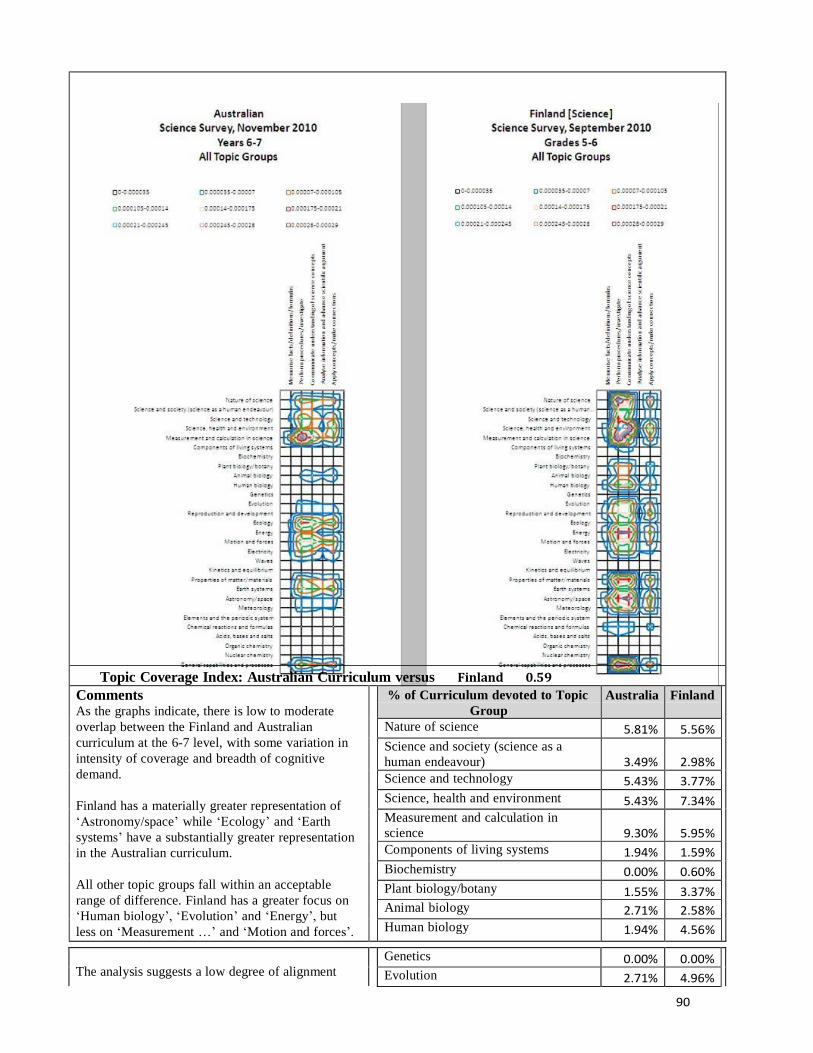
90
Topic Coverage Index: Australian Curriculum versus Finland 0.59
Comments As the graphs indicate, there is low to moderate
overlap between the Finland and Australian
curriculum at the 6-7 level, with some variation in
intensity of coverage and breadth of cognitive
demand.
Finland has a materially greater representation of
‘Astronomy/space’ while ‘Ecology’ and ‘Earth
systems’ have a substantially greater representation
in the Australian curriculum.
All other topic groups fall within an acceptable
range of difference. Finland has a greater focus on
‘Human biology’, ‘Evolution’ and ‘Energy’, but
less on ‘Measurement …’ and ‘Motion and forces’.
% of Curriculum devoted to Topic
Group
Australia Finland
Nature of science 5.81% 5.56% Science and society (science as a
human endeavour)
3.49%
2.98%
Science and technology 5.43% 3.77% Science, health and environment 5.43% 7.34% Measurement and calculation in
science
9.30%
5.95%
Components of living systems 1.94% 1.59% Biochemistry 0.00% 0.60% Plant biology/botany 1.55% 3.37% Animal biology 2.71% 2.58% Human biology 1.94% 4.56%
The analysis suggests a low degree of alignment
Genetics 0.00% 0.00% Evolution 2.71% 4.96%
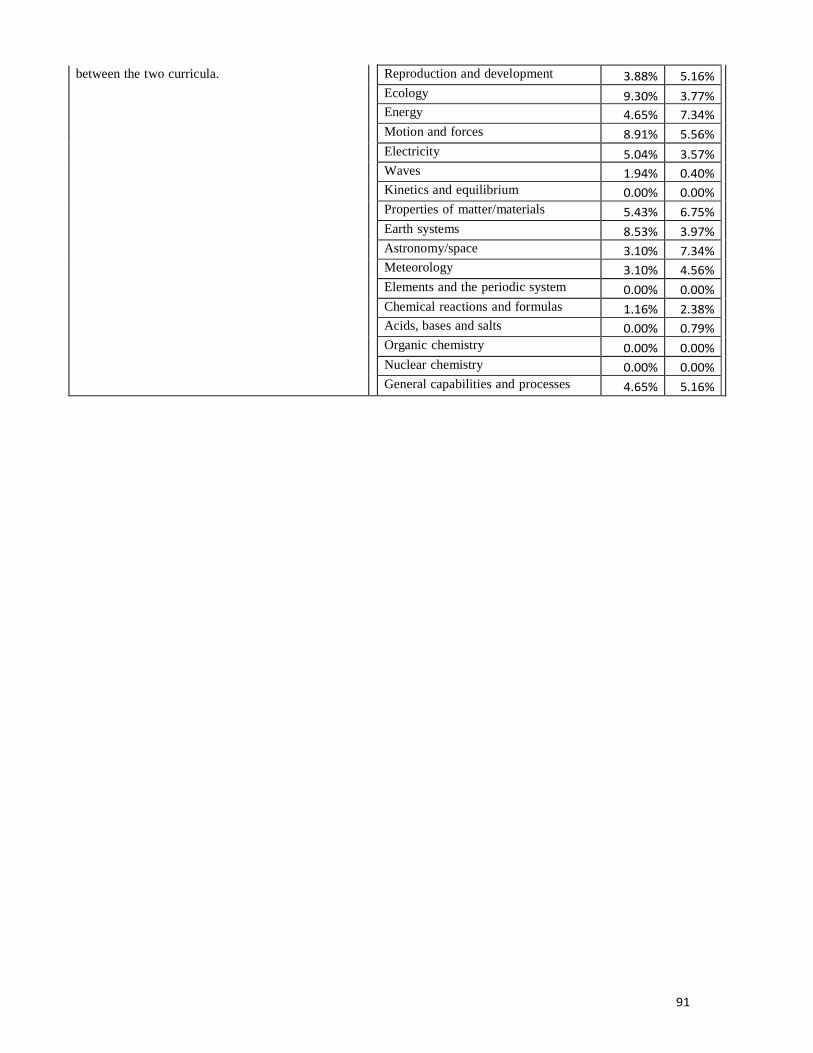
91
between the two curricula. Reproduction and development 3.88% 5.16% Ecology 9.30% 3.77% Energy 4.65% 7.34% Motion and forces 8.91% 5.56% Electricity 5.04% 3.57% Waves 1.94% 0.40% Kinetics and equilibrium 0.00% 0.00% Properties of matter/materials 5.43% 6.75% Earth systems 8.53% 3.97% Astronomy/space 3.10% 7.34% Meteorology 3.10% 4.56% Elements and the periodic system 0.00% 0.00% Chemical reactions and formulas 1.16% 2.38% Acids, bases and salts 0.00% 0.79% Organic chemistry 0.00% 0.00% Nuclear chemistry 0.00% 0.00% General capabilities and processes 4.65% 5.16%
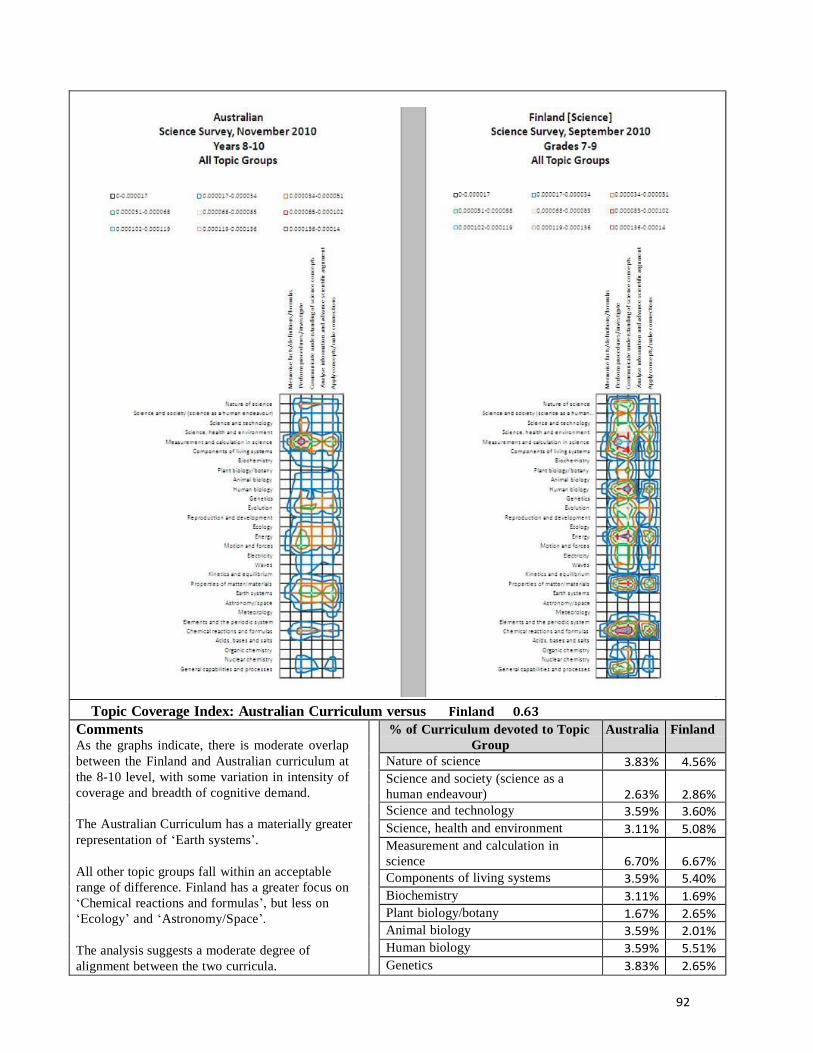
92
Topic Coverage Index: Australian Curriculum versus Finland 0.63
Comments As the graphs indicate, there is moderate overlap
between the Finland and Australian curriculum at
the 8-10 level, with some variation in intensity of
coverage and breadth of cognitive demand.
The Australian Curriculum has a materially greater
representation of ‘Earth systems’.
All other topic groups fall within an acceptable
range of difference. Finland has a greater focus on
‘Chemical reactions and formulas’, but less on
‘Ecology’ and ‘Astronomy/Space’.
The analysis suggests a moderate degree of
alignment between the two curricula.
% of Curriculum devoted to Topic
Group
Australia Finland
Nature of science 3.83% 4.56%
Science and society (science as a
human endeavour)
2.63%
2.86%
Science and technology 3.59% 3.60%
Science, health and environment 3.11% 5.08%
Measurement and calculation in
science
6.70%
6.67%
Components of living systems 3.59% 5.40%
Biochemistry 3.11% 1.69%
Plant biology/botany 1.67% 2.65% Animal biology 3.59% 2.01%
Human biology 3.59% 5.51%
Genetics 3.83% 2.65%
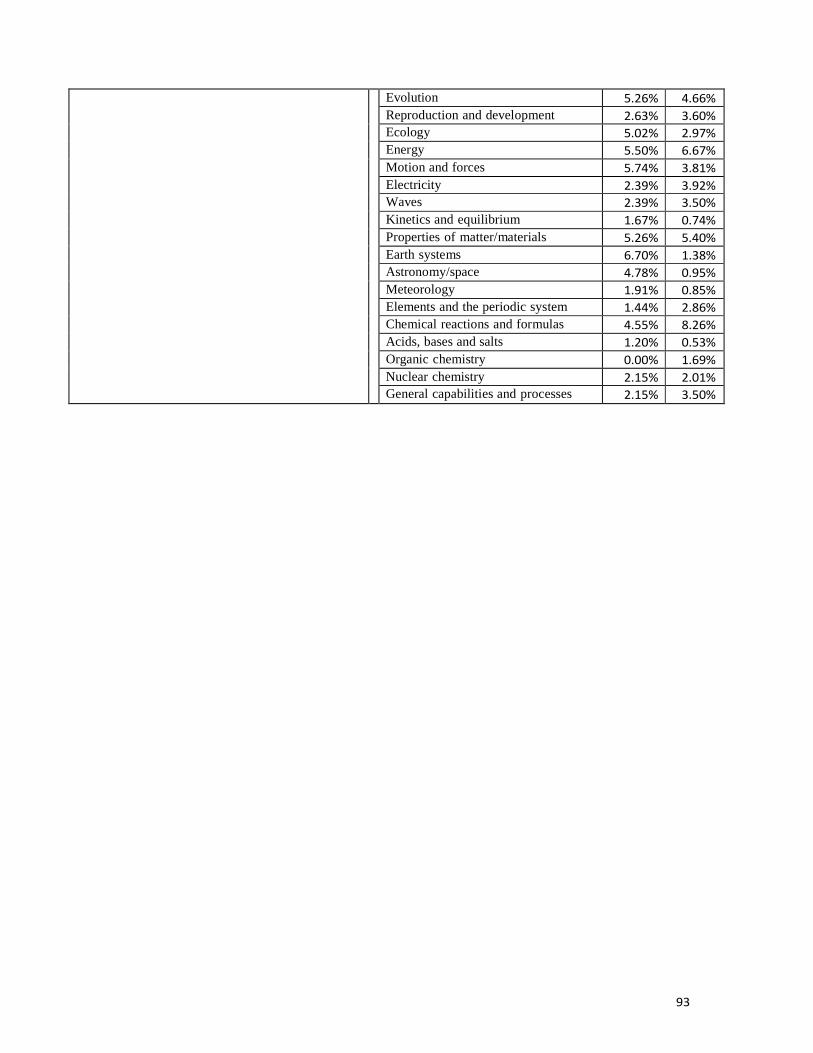
93
Evolution 5.26% 4.66%
Reproduction and development 2.63% 3.60% Ecology 5.02% 2.97% Energy 5.50% 6.67%
Motion and forces 5.74% 3.81%
Electricity 2.39% 3.92% Waves 2.39% 3.50%
Kinetics and equilibrium 1.67% 0.74%
Properties of matter/materials 5.26% 5.40%
Earth systems 6.70% 1.38% Astronomy/space 4.78% 0.95%
Meteorology 1.91% 0.85%
Elements and the periodic system 1.44% 2.86%
Chemical reactions and formulas 4.55% 8.26%
Acids, bases and salts 1.20% 0.53%
Organic chemistry 0.00% 1.69%
Nuclear chemistry 2.15% 2.01% General capabilities and processes 2.15% 3.50%
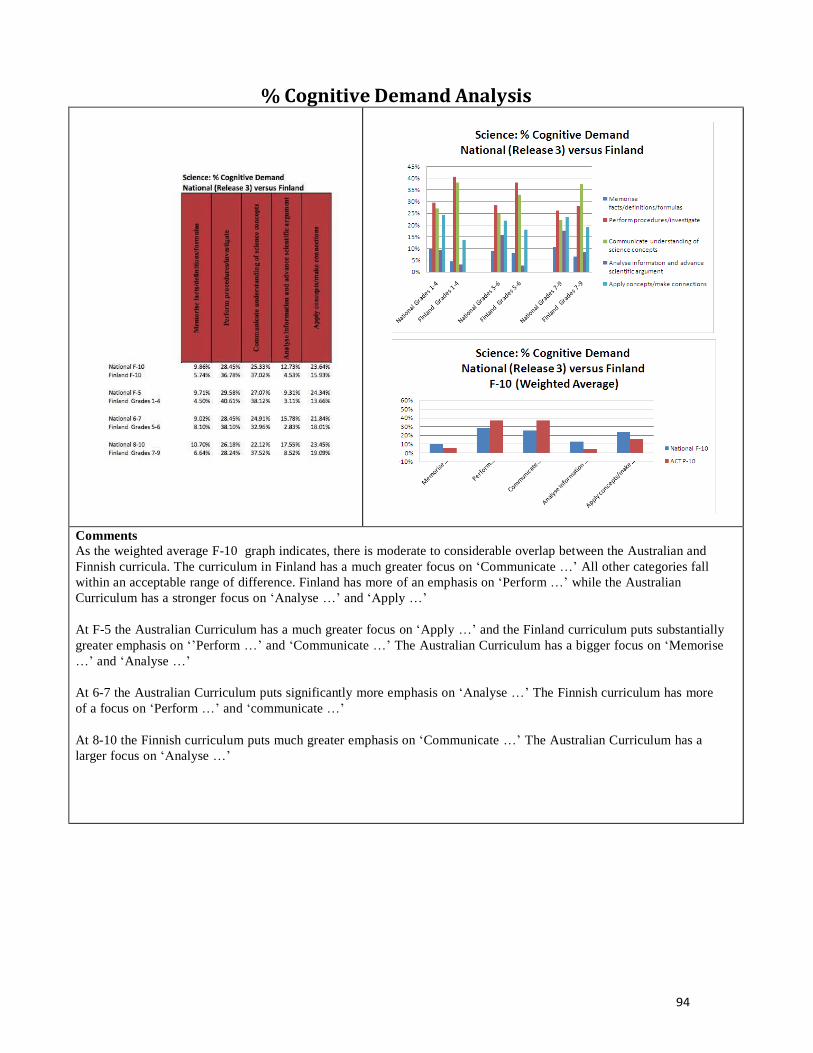
94
% Cognitive Demand Analysis
Comments
As the weighted average F-10 graph indicates, there is moderate to considerable overlap between the Australian and
Finnish curricula. The curriculum in Finland has a much greater focus on ‘Communicate …’ All other categories fall
within an acceptable range of difference. Finland has more of an emphasis on ‘Perform …’ while the Australian
Curriculum has a stronger focus on ‘Analyse …’ and ‘Apply …’
At F-5 the Australian Curriculum has a much greater focus on ‘Apply …’ and the Finland curriculum puts substantially
greater emphasis on ‘’Perform …’ and ‘Communicate …’ The Australian Curriculum has a bigger focus on ‘Memorise
…’ and ‘Analyse …’
At 6-7 the Australian Curriculum puts significantly more emphasis on ‘Analyse …’ The Finnish curriculum has more
of a focus on ‘Perform …’ and ‘communicate …’
At 8-10 the Finnish curriculum puts much greater emphasis on ‘Communicate …’ The Australian Curriculum has a
larger focus on ‘Analyse …’
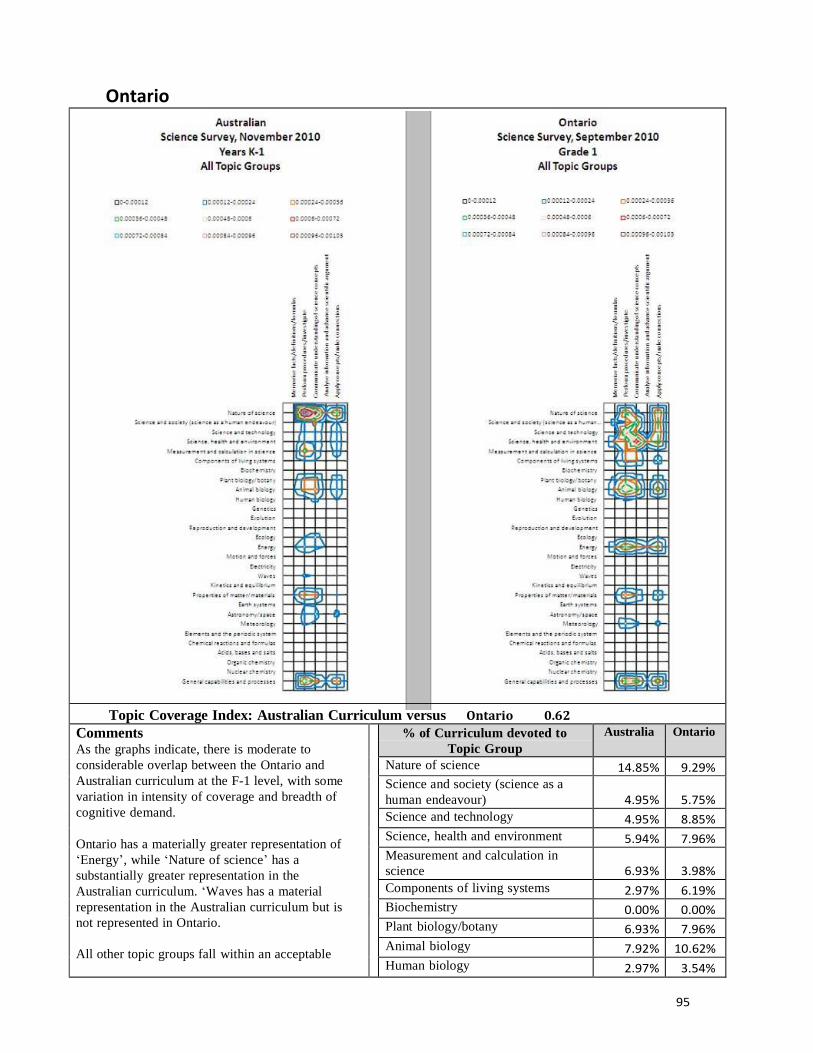
95
Ontario
Topic Coverage Index: Australian Curriculum versus Ontario 0.62
Comments As the graphs indicate, there is moderate to
considerable overlap between the Ontario and
Australian curriculum at the F-1 level, with some
variation in intensity of coverage and breadth of
cognitive demand.
Ontario has a materially greater representation of
‘Energy’, while ‘Nature of science’ has a
substantially greater representation in the
Australian curriculum. ‘Waves has a material
representation in the Australian curriculum but is
not represented in Ontario.
All other topic groups fall within an acceptable
% of Curriculum devoted to
Topic Group
Australia Ontario
Nature of science 14.85% 9.29% Science and society (science as a
human endeavour)
4.95%
5.75%
Science and technology 4.95% 8.85%
Science, health and environment 5.94% 7.96%
Measurement and calculation in
science
6.93%
3.98%
Components of living systems 2.97% 6.19%
Biochemistry 0.00% 0.00%
Plant biology/botany 6.93% 7.96%
Animal biology 7.92% 10.62%
Human biology 2.97% 3.54%
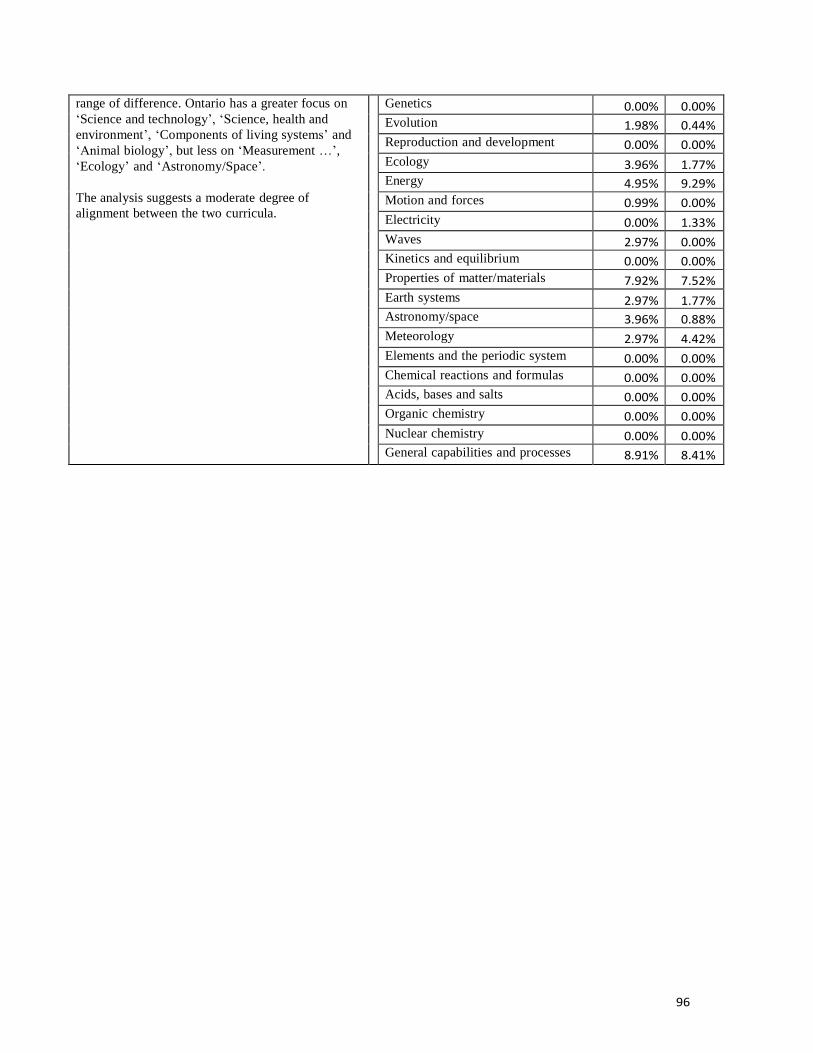
96
range of difference. Ontario has a greater focus on
‘Science and technology’, ‘Science, health and
environment’, ‘Components of living systems’ and
‘Animal biology’, but less on ‘Measurement …’,
‘Ecology’ and ‘Astronomy/Space’.
The analysis suggests a moderate degree of
alignment between the two curricula.
Genetics 0.00% 0.00% Evolution 1.98% 0.44%
Reproduction and development 0.00% 0.00%
Ecology 3.96% 1.77% Energy 4.95% 9.29%
Motion and forces 0.99% 0.00%
Electricity 0.00% 1.33%
Waves 2.97% 0.00% Kinetics and equilibrium 0.00% 0.00%
Properties of matter/materials 7.92% 7.52%
Earth systems 2.97% 1.77% Astronomy/space 3.96% 0.88%
Meteorology 2.97% 4.42%
Elements and the periodic system 0.00% 0.00%
Chemical reactions and formulas 0.00% 0.00% Acids, bases and salts 0.00% 0.00% Organic chemistry 0.00% 0.00%
Nuclear chemistry 0.00% 0.00% General capabilities and processes 8.91% 8.41%
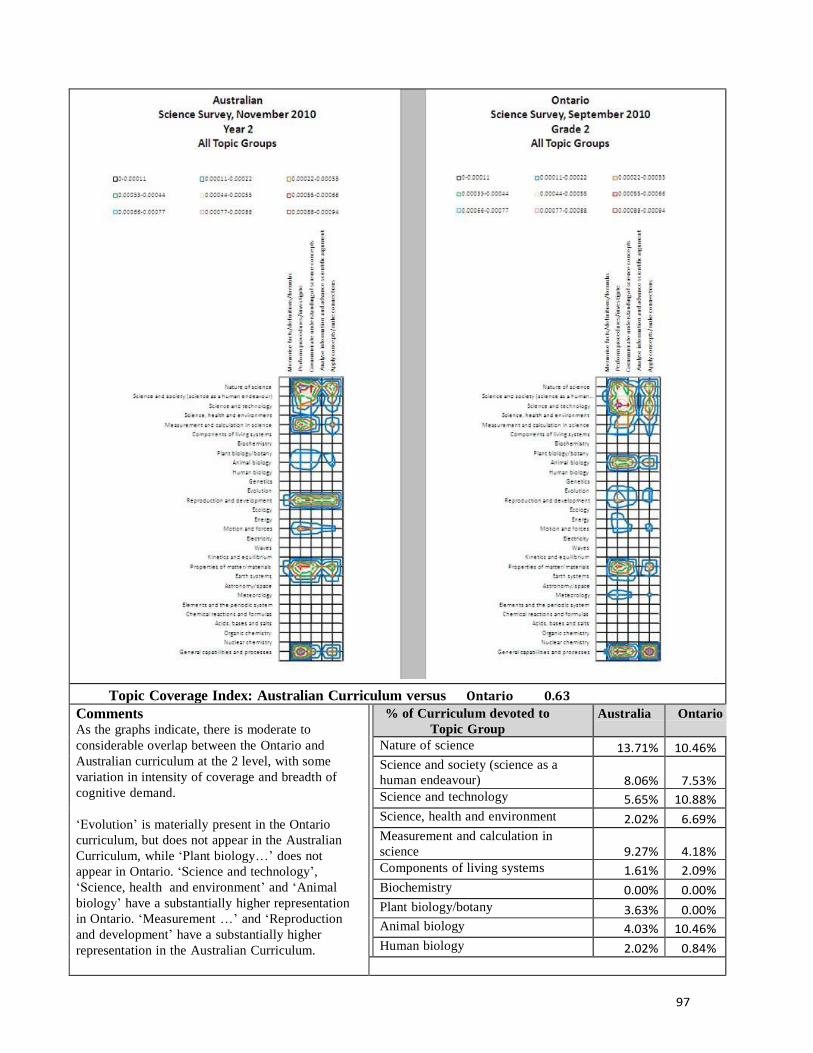
97
Topic Coverage Index: Australian Curriculum versus Ontario 0.63
Comments As the graphs indicate, there is moderate to
considerable overlap between the Ontario and
Australian curriculum at the 2 level, with some
variation in intensity of coverage and breadth of
cognitive demand.
‘Evolution’ is materially present in the Ontario
curriculum, but does not appear in the Australian
Curriculum, while ‘Plant biology…’ does not
appear in Ontario. ‘Science and technology’,
‘Science, health and environment’ and ‘Animal
biology’ have a substantially higher representation
in Ontario. ‘Measurement …’ and ‘Reproduction
and development’ have a substantially higher
representation in the Australian Curriculum.
% of Curriculum devoted to
Topic Group
Australia Ontario
Nature of science 13.71% 10.46%
Science and society (science as a
human endeavour)
8.06%
7.53% Science and technology 5.65% 10.88%
Science, health and environment 2.02% 6.69%
Measurement and calculation in
science
9.27%
4.18%
Components of living systems 1.61% 2.09%
Biochemistry 0.00% 0.00%
Plant biology/botany 3.63% 0.00% Animal biology 4.03% 10.46%
Human biology 2.02% 0.84%
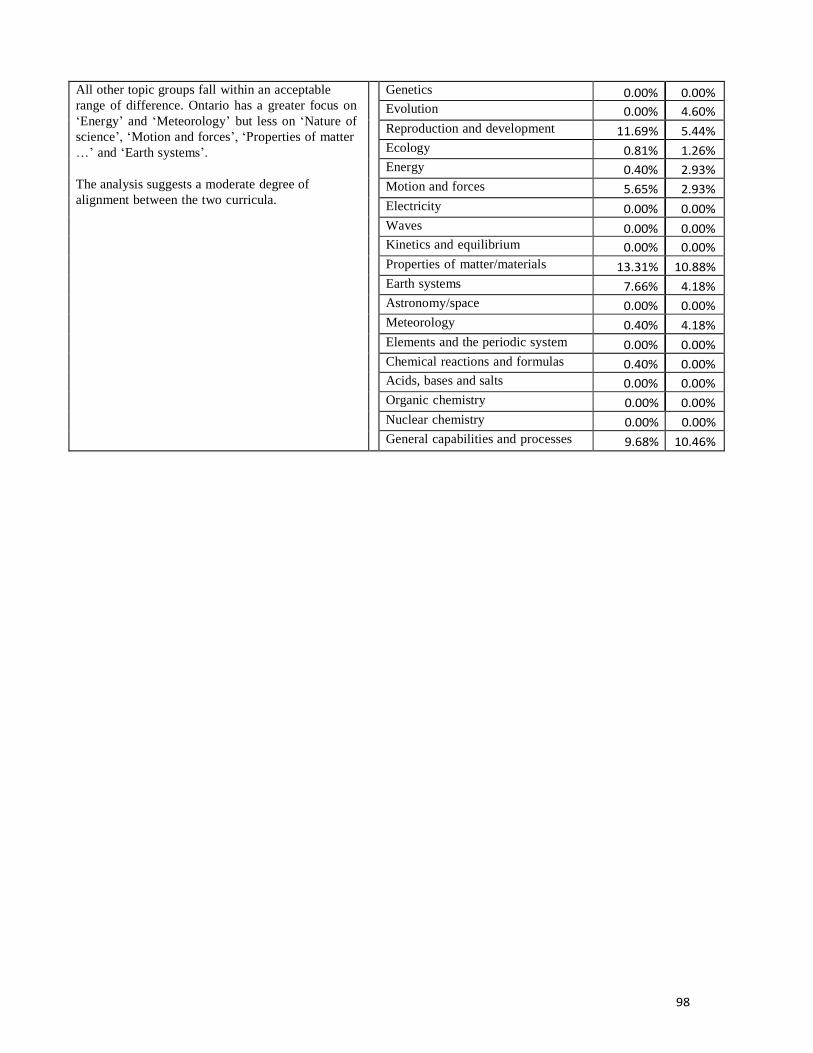
98
All other topic groups fall within an acceptable
range of difference. Ontario has a greater focus on
‘Energy’ and ‘Meteorology’ but less on ‘Nature of
science’, ‘Motion and forces’, ‘Properties of matter
…’ and ‘Earth systems’.
The analysis suggests a moderate degree of
alignment between the two curricula.
Genetics 0.00% 0.00% Evolution 0.00% 4.60%
Reproduction and development 11.69% 5.44%
Ecology 0.81% 1.26% Energy 0.40% 2.93%
Motion and forces 5.65% 2.93%
Electricity 0.00% 0.00%
Waves 0.00% 0.00% Kinetics and equilibrium 0.00% 0.00%
Properties of matter/materials 13.31% 10.88%
Earth systems 7.66% 4.18% Astronomy/space 0.00% 0.00%
Meteorology 0.40% 4.18%
Elements and the periodic system 0.00% 0.00%
Chemical reactions and formulas 0.40% 0.00% Acids, bases and salts 0.00% 0.00%
Organic chemistry 0.00% 0.00%
Nuclear chemistry 0.00% 0.00%
General capabilities and processes 9.68% 10.46%
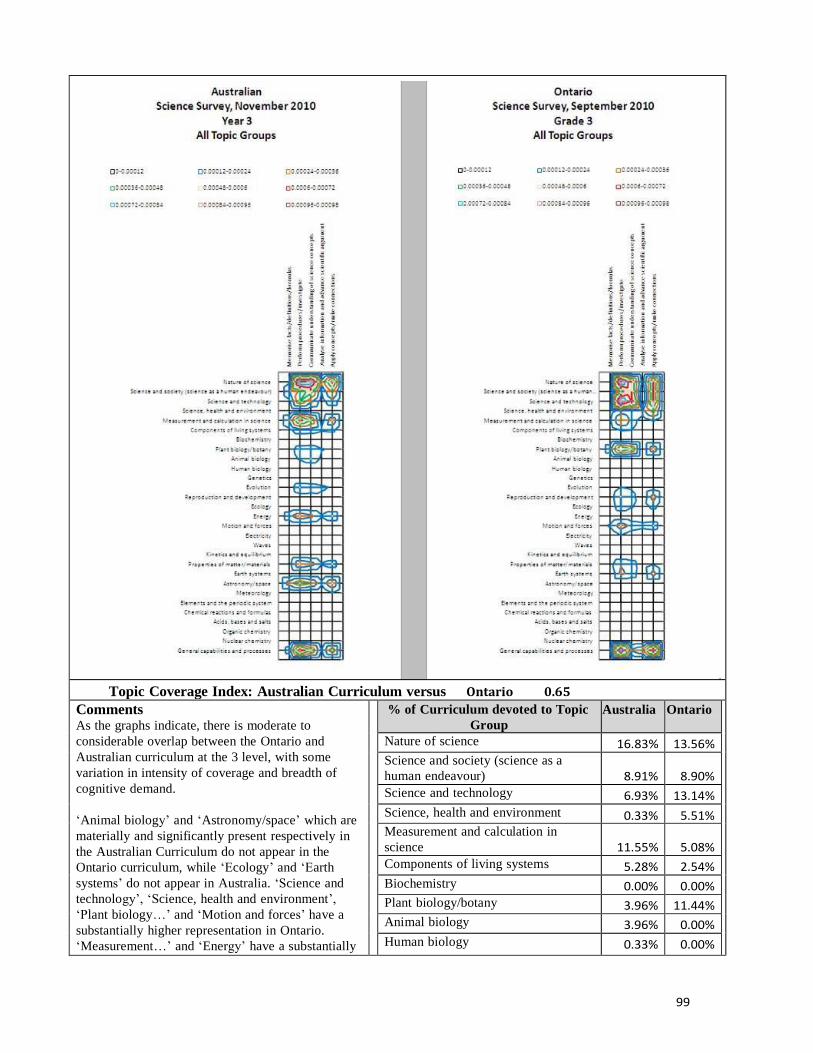
99
Topic Coverage Index: Australian Curriculum versus Ontario 0.65
Comments As the graphs indicate, there is moderate to
considerable overlap between the Ontario and
Australian curriculum at the 3 level, with some
variation in intensity of coverage and breadth of
cognitive demand.
‘Animal biology’ and ‘Astronomy/space’ which are
materially and significantly present respectively in
the Australian Curriculum do not appear in the
Ontario curriculum, while ‘Ecology’ and ‘Earth
systems’ do not appear in Australia. ‘Science and
technology’, ‘Science, health and environment’,
‘Plant biology…’ and ‘Motion and forces’ have a
substantially higher representation in Ontario.
‘Measurement…’ and ‘Energy’ have a substantially
% of Curriculum devoted to Topic
Group
Australia Ontario
Nature of science 16.83% 13.56% Science and society (science as a
human endeavour)
8.91%
8.90%
Science and technology 6.93% 13.14% Science, health and environment 0.33% 5.51% Measurement and calculation in
science
11.55%
5.08%
Components of living systems 5.28% 2.54% Biochemistry 0.00% 0.00% Plant biology/botany 3.96% 11.44% Animal biology 3.96% 0.00% Human biology 0.33% 0.00%

100
higher representation in the Australian Curriculum.
All other topic groups fall within an acceptable
range of difference. Ontario has a greater focus on
‘Reproduction and development’, but less on
‘Nature of science’ and ‘Components of living
systems’.
The analysis suggests a moderate degree of
alignment between the two curricula.
Genetics 0.00% 0.00% Evolution 4.29% 2.54% Reproduction and development 1.98% 4.24% Ecology 0.00% 4.24% Energy 7.59% 0.42% Motion and forces 0.33% 6.78% Electricity 0.00% 1.27% Waves 0.00% 0.00% Kinetics and equilibrium 0.00% 0.00% Properties of matter/materials 6.60% 4.66% Earth systems 0.00% 4.24% Astronomy/space 8.91% 0.00% Meteorology 0.99% 0.42% Elements and the periodic system 0.00% 0.00% Chemical reactions and formulas 0.33% 0.00% Acids, bases and salts 0.00% 0.00% Organic chemistry 0.00% 0.00% Nuclear chemistry 0.00% 0.00% General capabilities and processes 10.89% 11.02%
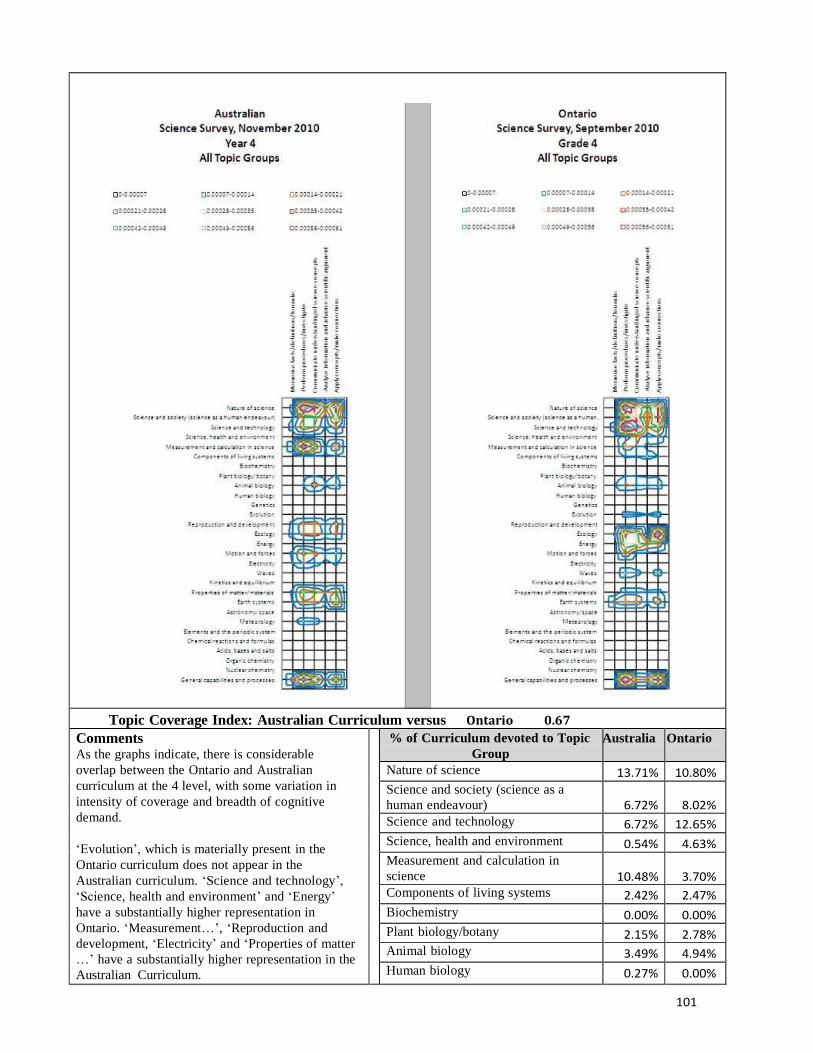
101
Topic Coverage Index: Australian Curriculum versus Ontario 0.67
Comments As the graphs indicate, there is considerable
overlap between the Ontario and Australian
curriculum at the 4 level, with some variation in
intensity of coverage and breadth of cognitive
demand.
‘Evolution’, which is materially present in the
Ontario curriculum does not appear in the
Australian curriculum. ‘Science and technology’,
‘Science, health and environment’ and ‘Energy’
have a substantially higher representation in
Ontario. ‘Measurement…’, ‘Reproduction and
development, ‘Electricity’ and ‘Properties of matter
…’ have a substantially higher representation in the
Australian Curriculum.
% of Curriculum devoted to Topic
Group
Australia Ontario
Nature of science 13.71% 10.80%
Science and society (science as a
human endeavour)
6.72%
8.02%
Science and technology 6.72% 12.65%
Science, health and environment 0.54% 4.63%
Measurement and calculation in
science
10.48%
3.70%
Components of living systems 2.42% 2.47%
Biochemistry 0.00% 0.00%
Plant biology/botany 2.15% 2.78% Animal biology 3.49% 4.94%
Human biology 0.27% 0.00%
102
All other topic groups fall within an acceptable
range of difference. Australia has a greater focus on
‘Nature of science’, ‘Motion and forces’ and
‘Meteorology’, while Ontario has a stronger focus
on ‘Ecology’ and ‘Waves’.
The analysis suggests a moderate degree of
alignment between the two curricula.
Genetics 0.00% 0.00% Evolution 0.00% 2.47%
Reproduction and development 6.18% 0.00%
Ecology 5.91% 9.57% Energy 0.27% 9.88%
Motion and forces 6.99% 4.01%
Electricity 4.03% 0.00% Waves 0.54% 3.70% Kinetics and equilibrium 0.00% 0.00%
Properties of matter/materials 8.60% 3.70%
Earth systems 7.80% 6.79% Astronomy/space 0.00% 0.00%
Meteorology 3.49% 0.93%
Elements and the periodic system 0.00% 0.00%
Chemical reactions and formulas 0.00% 0.00% Acids, bases and salts 0.00% 0.00%
Organic chemistry 0.00% 0.00%
Nuclear chemistry 0.00% 0.00%
General capabilities and processes 9.68% 8.95%
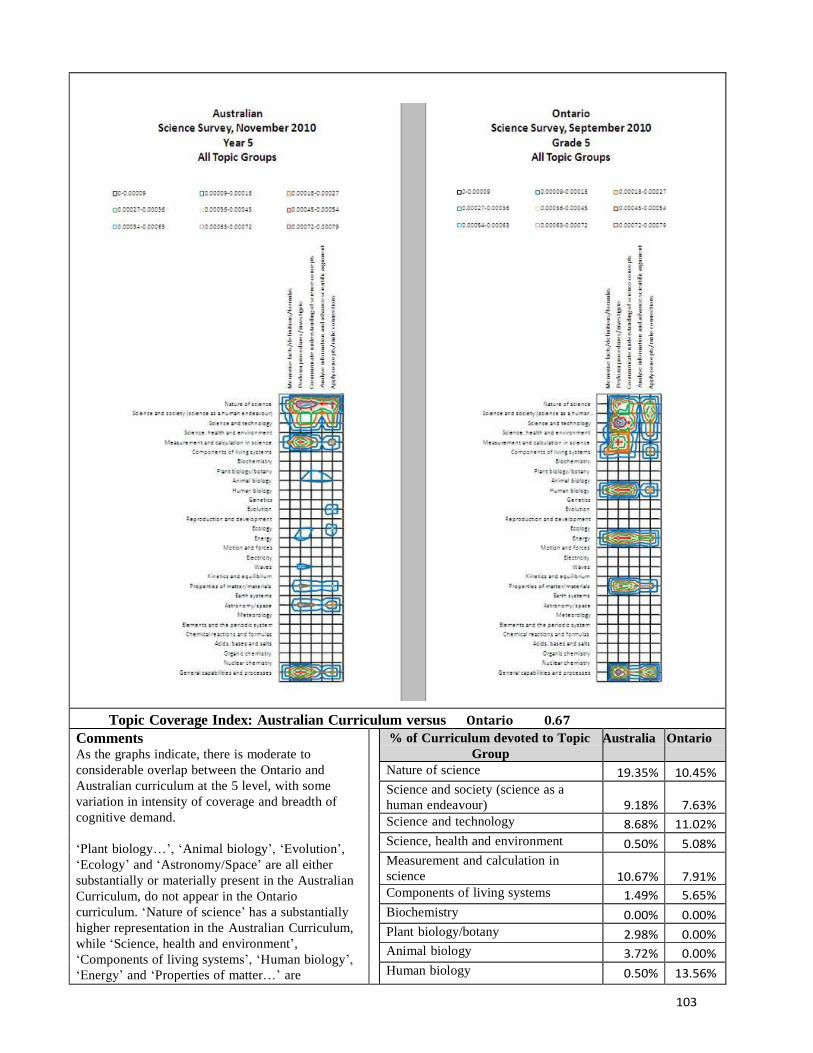
103
Topic Coverage Index: Australian Curriculum versus Ontario 0.67
Comments As the graphs indicate, there is moderate to
considerable overlap between the Ontario and
Australian curriculum at the 5 level, with some
variation in intensity of coverage and breadth of
cognitive demand.
‘Plant biology…’, ‘Animal biology’, ‘Evolution’,
‘Ecology’ and ‘Astronomy/Space’ are all either
substantially or materially present in the Australian
Curriculum, do not appear in the Ontario
curriculum. ‘Nature of science’ has a substantially
higher representation in the Australian Curriculum,
while ‘Science, health and environment’,
‘Components of living systems’, ‘Human biology’,
‘Energy’ and ‘Properties of matter…’ are
% of Curriculum devoted to Topic
Group
Australia Ontario
Nature of science 19.35% 10.45%
Science and society (science as a
human endeavour)
9.18%
7.63%
Science and technology 8.68% 11.02%
Science, health and environment 0.50% 5.08%
Measurement and calculation in
science
10.67%
7.91%
Components of living systems 1.49% 5.65%
Biochemistry 0.00% 0.00%
Plant biology/botany 2.98% 0.00% Animal biology 3.72% 0.00%
Human biology 0.50% 13.56%
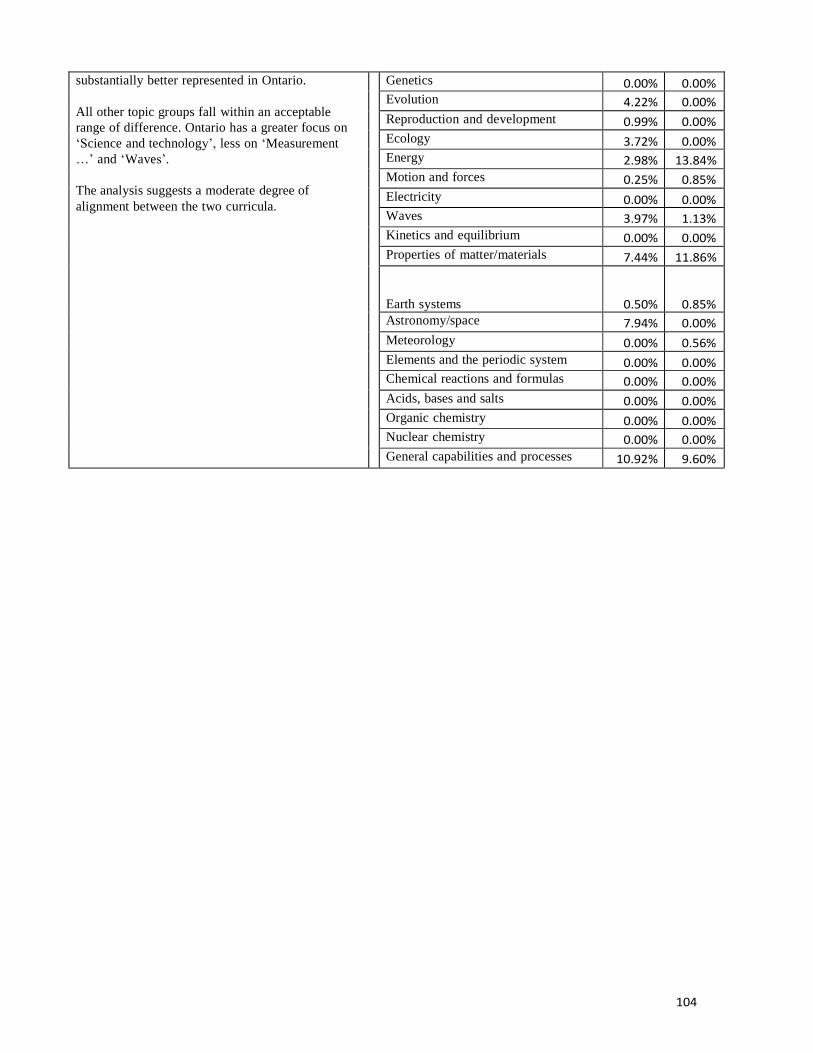
104
substantially better represented in Ontario.
All other topic groups fall within an acceptable
range of difference. Ontario has a greater focus on
‘Science and technology’, less on ‘Measurement
…’ and ‘Waves’.
The analysis suggests a moderate degree of
alignment between the two curricula.
Genetics 0.00% 0.00% Evolution 4.22% 0.00%
Reproduction and development 0.99% 0.00%
Ecology 3.72% 0.00% Energy 2.98% 13.84%
Motion and forces 0.25% 0.85%
Electricity 0.00% 0.00% Waves 3.97% 1.13% Kinetics and equilibrium 0.00% 0.00%
Properties of matter/materials 7.44% 11.86% Earth systems
0.50%
0.85% Astronomy/space 7.94% 0.00%
Meteorology 0.00% 0.56%
Elements and the periodic system 0.00% 0.00% Chemical reactions and formulas 0.00% 0.00%
Acids, bases and salts 0.00% 0.00%
Organic chemistry 0.00% 0.00% Nuclear chemistry 0.00% 0.00%
General capabilities and processes 10.92% 9.60%
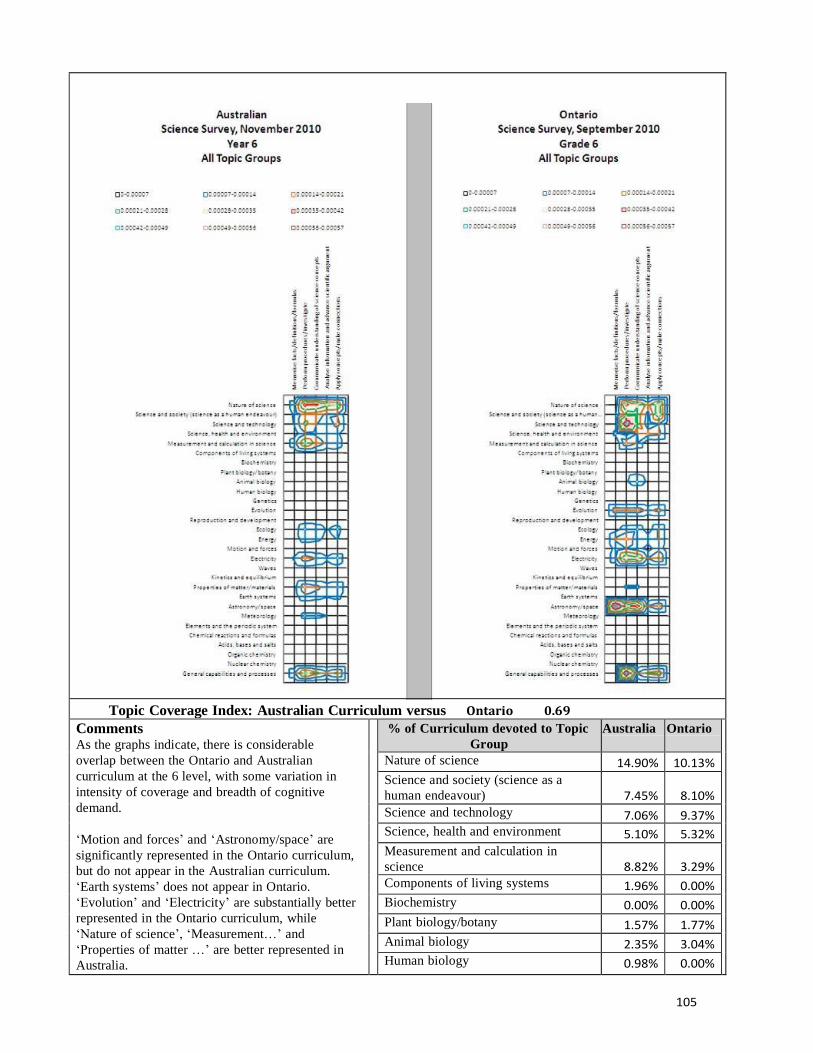
105
Topic Coverage Index: Australian Curriculum versus Ontario 0.69
Comments As the graphs indicate, there is considerable
overlap between the Ontario and Australian
curriculum at the 6 level, with some variation in
intensity of coverage and breadth of cognitive
demand.
‘Motion and forces’ and ‘Astronomy/space’ are
significantly represented in the Ontario curriculum,
but do not appear in the Australian curriculum.
‘Earth systems’ does not appear in Ontario.
‘Evolution’ and ‘Electricity’ are substantially better
represented in the Ontario curriculum, while
‘Nature of science’, ‘Measurement…’ and
‘Properties of matter …’ are better represented in
Australia.
% of Curriculum devoted to Topic
Group
Australia Ontario
Nature of science 14.90% 10.13% Science and society (science as a
human endeavour)
7.45%
8.10%
Science and technology 7.06% 9.37% Science, health and environment 5.10% 5.32% Measurement and calculation in
science
8.82%
3.29%
Components of living systems 1.96% 0.00% Biochemistry 0.00% 0.00% Plant biology/botany 1.57% 1.77% Animal biology 2.35% 3.04% Human biology 0.98% 0.00%

106
All other topic groups fall within an acceptable
range of difference. Australia has a greater focus on
‘Meteorology’, while Ontario has a stronger focus
on ‘Science and technology’ and ‘energy’.
The analysis suggests a moderate degree of
alignment between the two curricula.
Genetics 0.00% 0.00% Evolution 0.98% 7.09% Reproduction and development 1.96% 0.00% Ecology 5.69% 4.81% Energy 4.51% 6.84% Motion and forces 0.00% 4.56% Electricity 6.47% 11.65% Waves 1.96% 0.00% Kinetics and equilibrium 0.00% 0.00% Properties of matter/materials 8.24% 2.78% Earth systems 5.69% 0.00% Astronomy/space 0.00% 12.15% Meteorology 4.51% 0.76% Elements and the periodic system 0.00% 0.00% Chemical reactions and formulas 0.59% 0.00% Acids, bases and salts 0.00% 0.00% Organic chemistry 0.00% 0.00% Nuclear chemistry 0.00% 0.25% General capabilities and processes 9.22% 8.10%
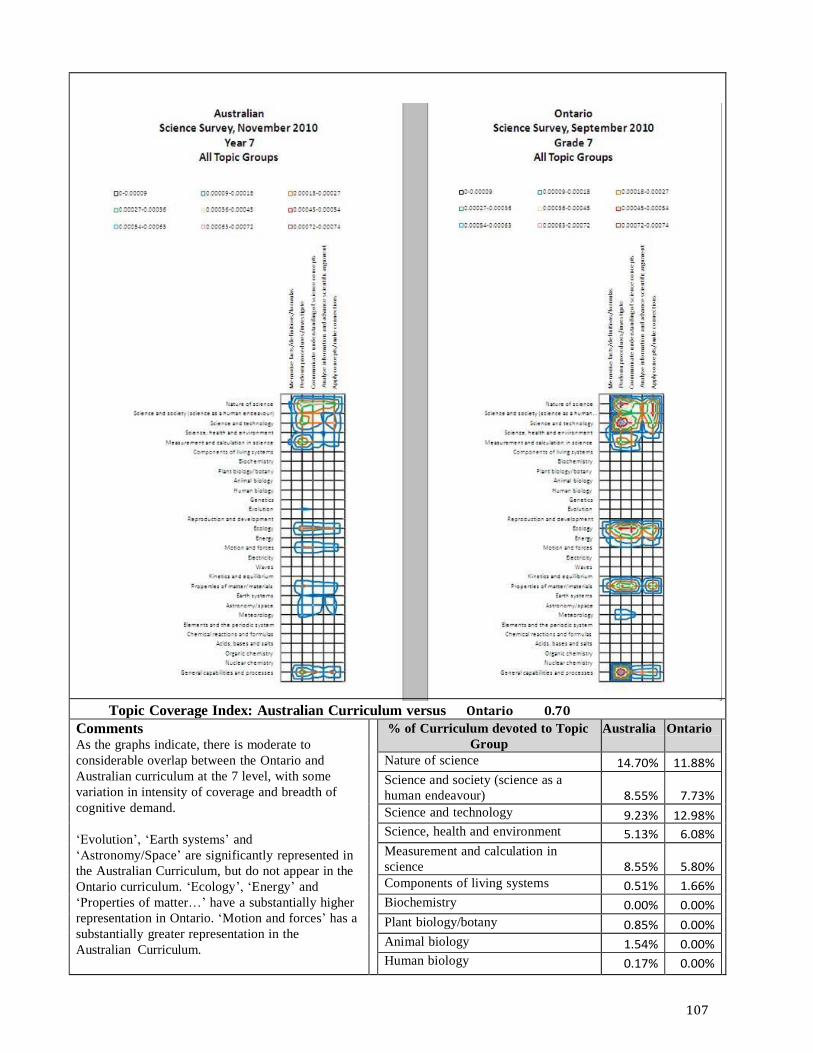
107
Topic Coverage Index: Australian Curriculum versus Ontario 0.70
Comments As the graphs indicate, there is moderate to
considerable overlap between the Ontario and
Australian curriculum at the 7 level, with some
variation in intensity of coverage and breadth of
cognitive demand.
‘Evolution’, ‘Earth systems’ and
‘Astronomy/Space’ are significantly represented in
the Australian Curriculum, but do not appear in the
Ontario curriculum. ‘Ecology’, ‘Energy’ and
‘Properties of matter…’ have a substantially higher
representation in Ontario. ‘Motion and forces’ has a
substantially greater representation in the
Australian Curriculum.
% of Curriculum devoted to Topic
Group
Australia Ontario
Nature of science 14.70% 11.88% Science and society (science as a
human endeavour)
8.55%
7.73%
Science and technology 9.23% 12.98% Science, health and environment 5.13% 6.08% Measurement and calculation in
science
8.55%
5.80%
Components of living systems 0.51% 1.66% Biochemistry 0.00% 0.00% Plant biology/botany 0.85% 0.00% Animal biology 1.54% 0.00% Human biology 0.17% 0.00%

108
All other topic groups fall within an acceptable
range of difference. Ontario has a greater focus on
‘Science and technology’, but less on ‘Nature of
science’ and ‘Measurement …’
The analysis suggests a moderate to high degree of
alignment between the two curricula.
Genetics 0.00% 0.00% Evolution 4.10% 0.00% Reproduction and development 0.00% 0.00% Ecology 8.72% 15.19% Energy 0.85% 8.29% Motion and forces 7.52% 2.76% Electricity 0.51% 0.55% Waves 0.00% 0.00% Kinetics and equilibrium 0.00% 1.10% Properties of matter/materials 7.18% 12.71% Earth systems 4.10% 0.00% Astronomy/space 4.79% 0.00% Meteorology 4.27% 2.76% Elements and the periodic system 0.00% 0.00% Chemical reactions and formulas 0.00% 0.28% Acids, bases and salts 0.00% 0.00% Organic chemistry 0.00% 0.00% Nuclear chemistry 0.00% 0.28% General capabilities and processes 8.72% 9.94%
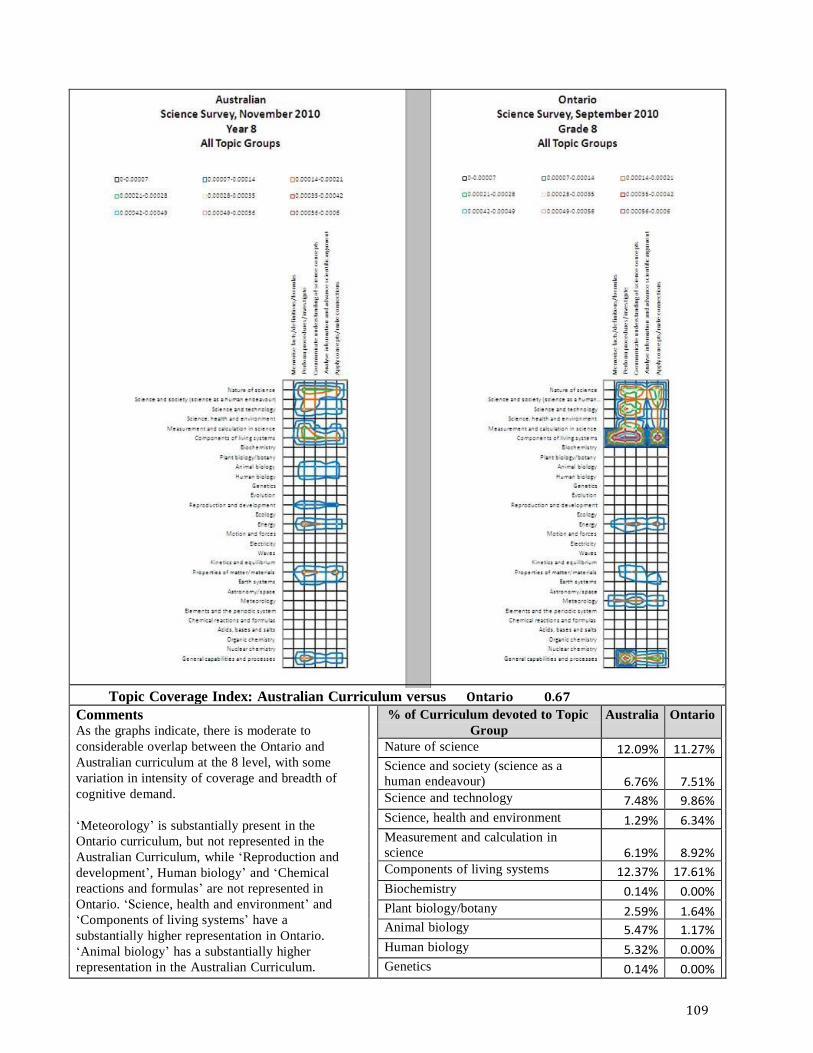
109
Topic Coverage Index: Australian Curriculum versus Ontario 0.67
Comments As the graphs indicate, there is moderate to
considerable overlap between the Ontario and
Australian curriculum at the 8 level, with some
variation in intensity of coverage and breadth of
cognitive demand.
‘Meteorology’ is substantially present in the
Ontario curriculum, but not represented in the
Australian Curriculum, while ‘Reproduction and
development’, Human biology’ and ‘Chemical
reactions and formulas’ are not represented in
Ontario. ‘Science, health and environment’ and
‘Components of living systems’ have a
substantially higher representation in Ontario.
‘Animal biology’ has a substantially higher
representation in the Australian Curriculum.
% of Curriculum devoted to Topic
Group
Australia Ontario
Nature of science 12.09% 11.27% Science and society (science as a
human endeavour)
6.76%
7.51%
Science and technology 7.48% 9.86% Science, health and environment 1.29% 6.34% Measurement and calculation in
science
6.19%
8.92%
Components of living systems 12.37% 17.61% Biochemistry 0.14% 0.00% Plant biology/botany 2.59% 1.64% Animal biology 5.47% 1.17% Human biology 5.32% 0.00% Genetics 0.14% 0.00%
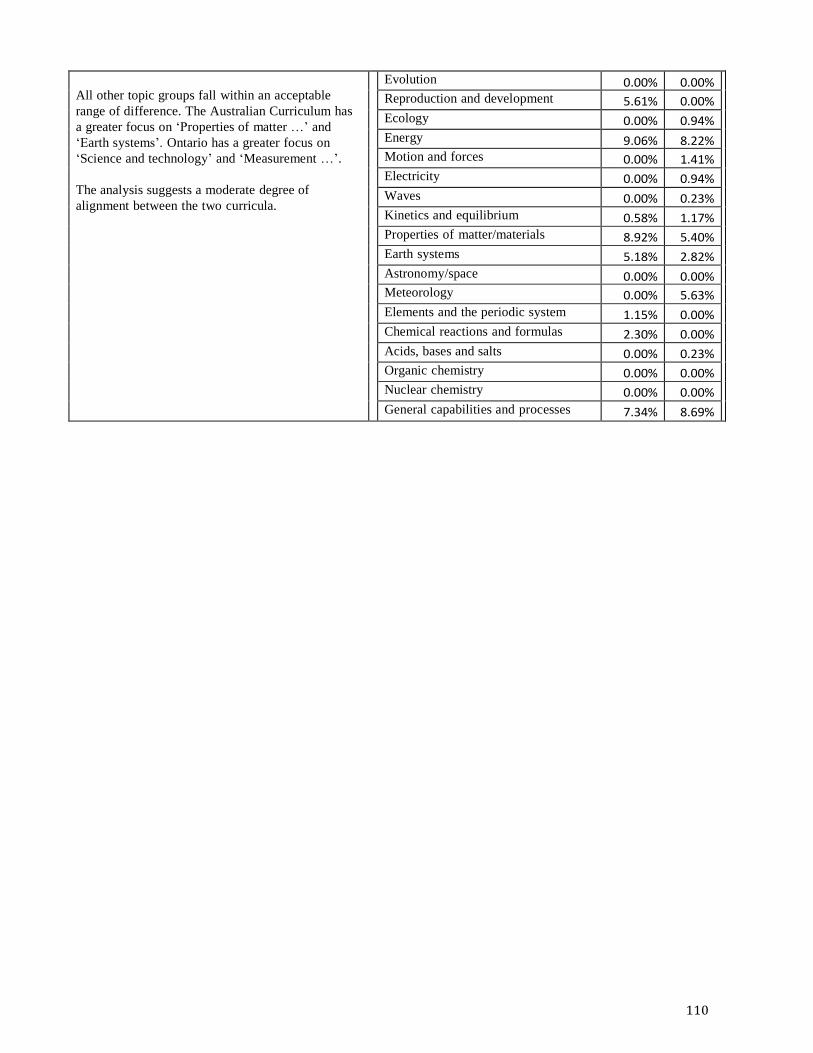
110
All other topic groups fall within an acceptable
range of difference. The Australian Curriculum has
a greater focus on ‘Properties of matter …’ and
‘Earth systems’. Ontario has a greater focus on
‘Science and technology’ and ‘Measurement …’.
The analysis suggests a moderate degree of
alignment between the two curricula.
Evolution 0.00% 0.00% Reproduction and development 5.61% 0.00% Ecology 0.00% 0.94% Energy 9.06% 8.22% Motion and forces 0.00% 1.41% Electricity 0.00% 0.94% Waves 0.00% 0.23% Kinetics and equilibrium 0.58% 1.17% Properties of matter/materials 8.92% 5.40% Earth systems 5.18% 2.82% Astronomy/space 0.00% 0.00% Meteorology 0.00% 5.63% Elements and the periodic system 1.15% 0.00% Chemical reactions and formulas 2.30% 0.00% Acids, bases and salts 0.00% 0.23% Organic chemistry 0.00% 0.00% Nuclear chemistry 0.00% 0.00% General capabilities and processes 7.34% 8.69%
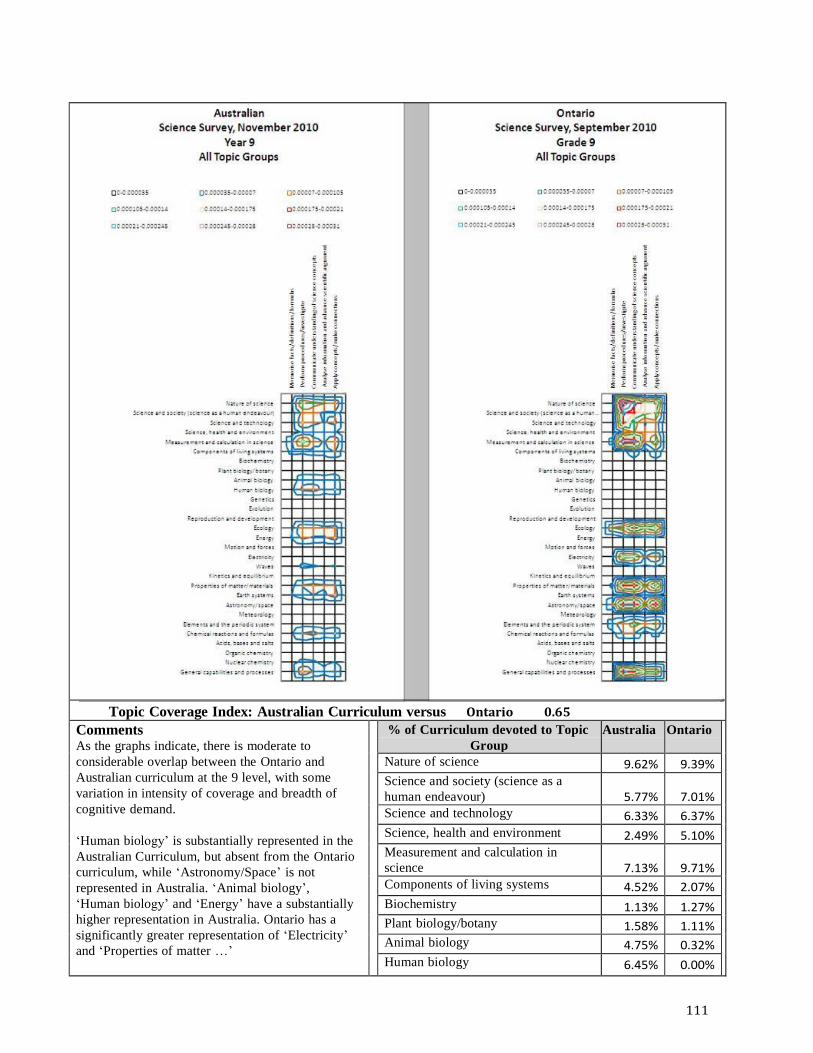
111
Topic Coverage Index: Australian Curriculum versus Ontario 0.65
Comments As the graphs indicate, there is moderate to
considerable overlap between the Ontario and
Australian curriculum at the 9 level, with some
variation in intensity of coverage and breadth of
cognitive demand.
‘Human biology’ is substantially represented in the
Australian Curriculum, but absent from the Ontario
curriculum, while ‘Astronomy/Space’ is not
represented in Australia. ‘Animal biology’,
‘Human biology’ and ‘Energy’ have a substantially
higher representation in Australia. Ontario has a
significantly greater representation of ‘Electricity’
and ‘Properties of matter …’
% of Curriculum devoted to Topic
Group
Australia Ontario
Nature of science 9.62% 9.39% Science and society (science as a
human endeavour)
5.77%
7.01%
Science and technology 6.33% 6.37% Science, health and environment 2.49% 5.10% Measurement and calculation in
science
7.13%
9.71%
Components of living systems 4.52% 2.07% Biochemistry 1.13% 1.27% Plant biology/botany 1.58% 1.11% Animal biology 4.75% 0.32% Human biology 6.45% 0.00%
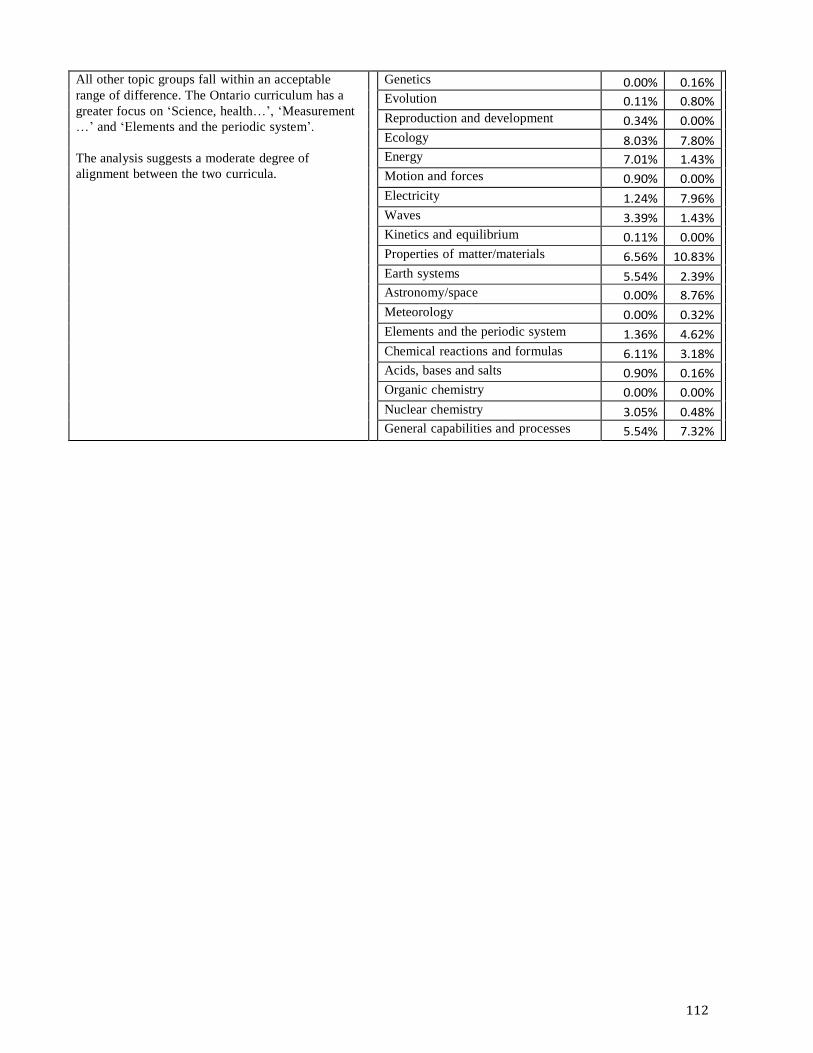
112
All other topic groups fall within an acceptable
range of difference. The Ontario curriculum has a
greater focus on ‘Science, health…’, ‘Measurement
…’ and ‘Elements and the periodic system’.
The analysis suggests a moderate degree of
alignment between the two curricula.
Genetics 0.00% 0.16% Evolution 0.11% 0.80% Reproduction and development 0.34% 0.00% Ecology 8.03% 7.80% Energy 7.01% 1.43% Motion and forces 0.90% 0.00% Electricity 1.24% 7.96% Waves 3.39% 1.43% Kinetics and equilibrium 0.11% 0.00% Properties of matter/materials 6.56% 10.83% Earth systems 5.54% 2.39% Astronomy/space 0.00% 8.76% Meteorology 0.00% 0.32% Elements and the periodic system 1.36% 4.62% Chemical reactions and formulas 6.11% 3.18% Acids, bases and salts 0.90% 0.16% Organic chemistry 0.00% 0.00% Nuclear chemistry 3.05% 0.48% General capabilities and processes 5.54% 7.32%
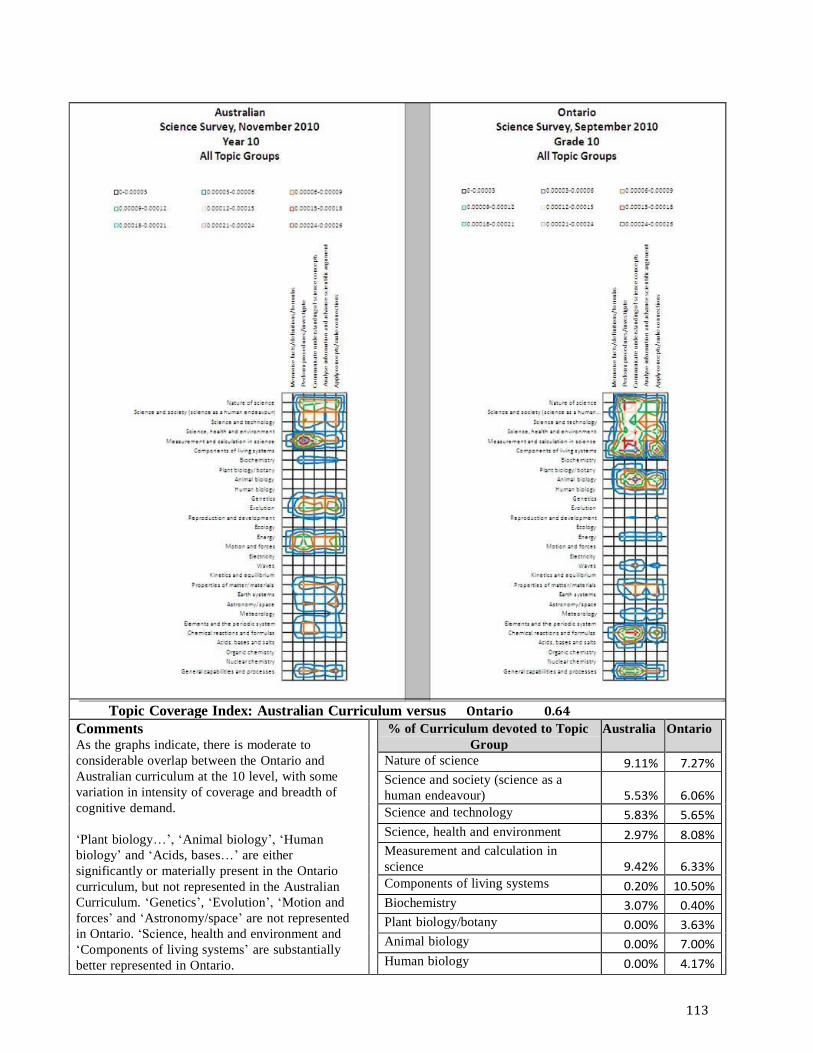
113
Topic Coverage Index: Australian Curriculum versus Ontario 0.64
Comments As the graphs indicate, there is moderate to
considerable overlap between the Ontario and
Australian curriculum at the 10 level, with some
variation in intensity of coverage and breadth of
cognitive demand.
‘Plant biology…’, ‘Animal biology’, ‘Human
biology’ and ‘Acids, bases…’ are either
significantly or materially present in the Ontario
curriculum, but not represented in the Australian
Curriculum. ‘Genetics’, ‘Evolution’, ‘Motion and
forces’ and ‘Astronomy/space’ are not represented
in Ontario. ‘Science, health and environment and
‘Components of living systems’ are substantially
better represented in Ontario.
% of Curriculum devoted to Topic
Group
Australia Ontario
Nature of science 9.11% 7.27% Science and society (science as a
human endeavour)
5.53%
6.06%
Science and technology 5.83% 5.65% Science, health and environment 2.97% 8.08% Measurement and calculation in
science
9.42%
6.33%
Components of living systems 0.20% 10.50% Biochemistry 3.07% 0.40% Plant biology/botany 0.00% 3.63% Animal biology 0.00% 7.00% Human biology 0.00% 4.17%

114
All other topic groups fall within an acceptable
range of difference. The Ontario curriculum has a
greater focus on ‘Waves’ and ‘Chemical
reactions…’ but less on ‘Measurement…’,
‘Biochemistry’, ‘Energy’ and ‘Elements and the
periodic system’.
The analysis suggests a moderate degree of
alignment between the two curricula.
Genetics 5.02% 0.00% Evolution 7.57% 0.00% Reproduction and development 2.66% 1.88% Ecology 0.51% 0.27% Energy 7.06% 3.50% Motion and forces 7.78% 0.00% Electricity 0.00% 0.00% Waves 0.72% 3.50% Kinetics and equilibrium 1.33% 0.00% Properties of matter/materials 5.73% 4.98% Earth systems 3.68% 3.63% Astronomy/space 5.22% 0.00% Meteorology 2.05% 3.63% Elements and the periodic system 4.30% 1.35% Chemical reactions and formulas 5.02% 8.21% Acids, bases and salts 0.00% 3.50% Organic chemistry 0.00% 0.00% Nuclear chemistry 0.10% 0.00% General capabilities and processes 5.12% 6.46%
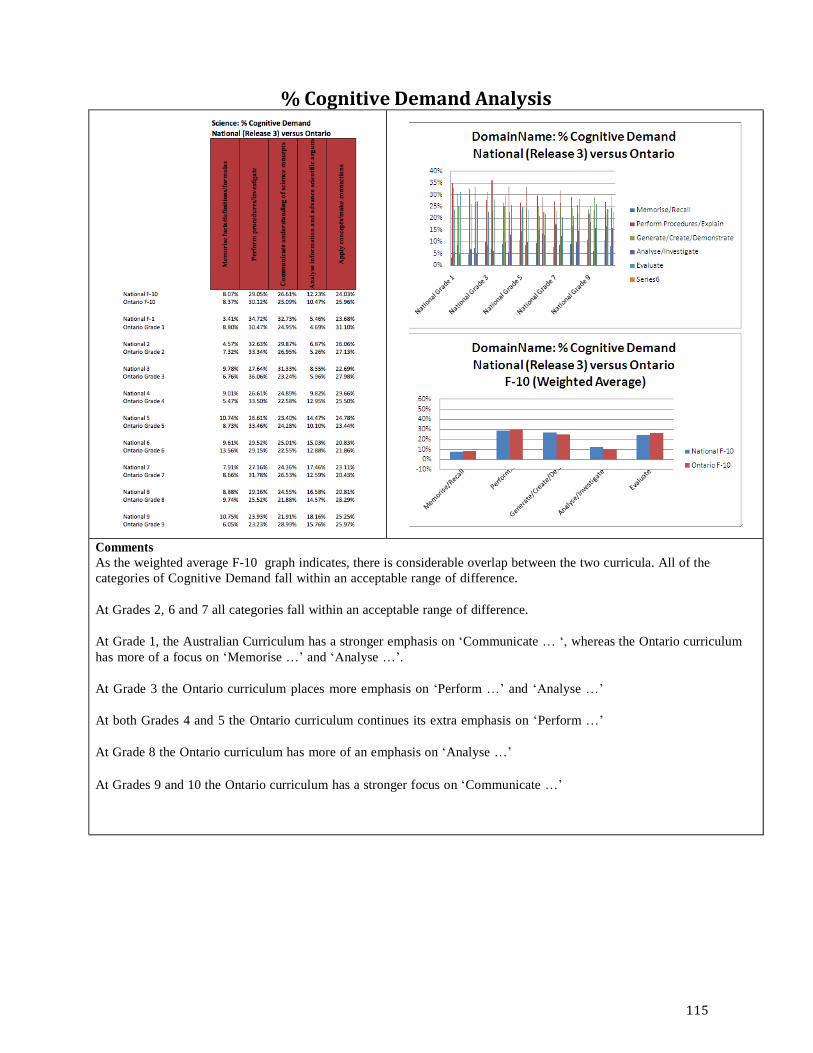
115
% Cognitive Demand Analysis
Comments
As the weighted average F-10 graph indicates, there is considerable overlap between the two curricula. All of the
categories of Cognitive Demand fall within an acceptable range of difference.
At Grades 2, 6 and 7 all categories fall within an acceptable range of difference.
At Grade 1, the Australian Curriculum has a stronger emphasis on ‘Communicate … ‘, whereas the Ontario curriculum
has more of a focus on ‘Memorise …’ and ‘Analyse …’.
At Grade 3 the Ontario curriculum places more emphasis on ‘Perform …’ and ‘Analyse …’
At both Grades 4 and 5 the Ontario curriculum continues its extra emphasis on ‘Perform …’
At Grade 8 the Ontario curriculum has more of an emphasis on ‘Analyse …’
At Grades 9 and 10 the Ontario curriculum has a stronger focus on ‘Communicate …’
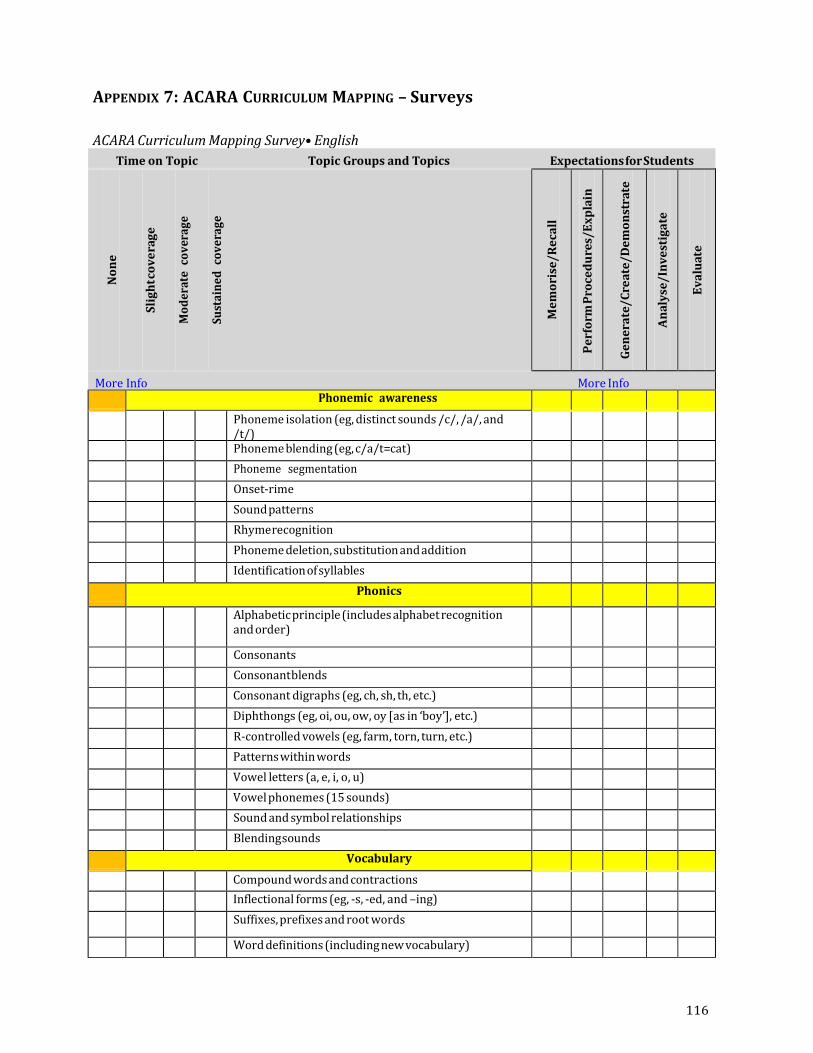
116
APPENDIX 7: ACARA CURRICULUM MAPPING – Surveys
ACARA Curriculum Mapping Survey• English
Time on Topic Topic Groups and Topics Expectations for Students
N
on
e
S
lig
ht c
ov
era
ge
Mo
der
ate
co
ver
age
Sust
ain
ed
co
ve
rage
Me
mo
rise
/R
eca
ll
Pe
rfo
rmP
roce
du
res/
Ex
pla
in
G
en
era
te/
Cre
ate
/D
em
on
stra
te
An
aly
se/
Inv
est
iga
te
Ev
alu
ate
More Info More Info
Phonemic awareness
Phoneme isolation (eg, distinct sounds /c/, /a/, and /t/)
Phoneme blending (eg, c/a/t=cat)
Phoneme segmentation
Onset‐rime
Sound patterns
Rhyme recognition
Phoneme deletion, substitution and addition
Identification of syllables
Phonics
Alphabetic principle (includes alphabet recognition and order)
Consonants
Consonant blends
Consonant digraphs (eg, ch, sh, th, etc.)
Diphthongs (eg, oi, ou, ow, oy [as in ‘boy’], etc.)
R‐controlled vowels (eg, farm, torn, turn, etc.)
Patterns within words
Vowel letters (a, e, i, o, u)
Vowel phonemes (15 sounds)
Sound and symbol relationships
Blending sounds
Vocabulary
Compound words and contractions
Inflectional forms (eg, ‐s, ‐ed, and –ing)
Suffixes, prefixes and root words
Word definitions (including new vocabulary)
117
Word origins
Synonyms, antonyms and homonyms
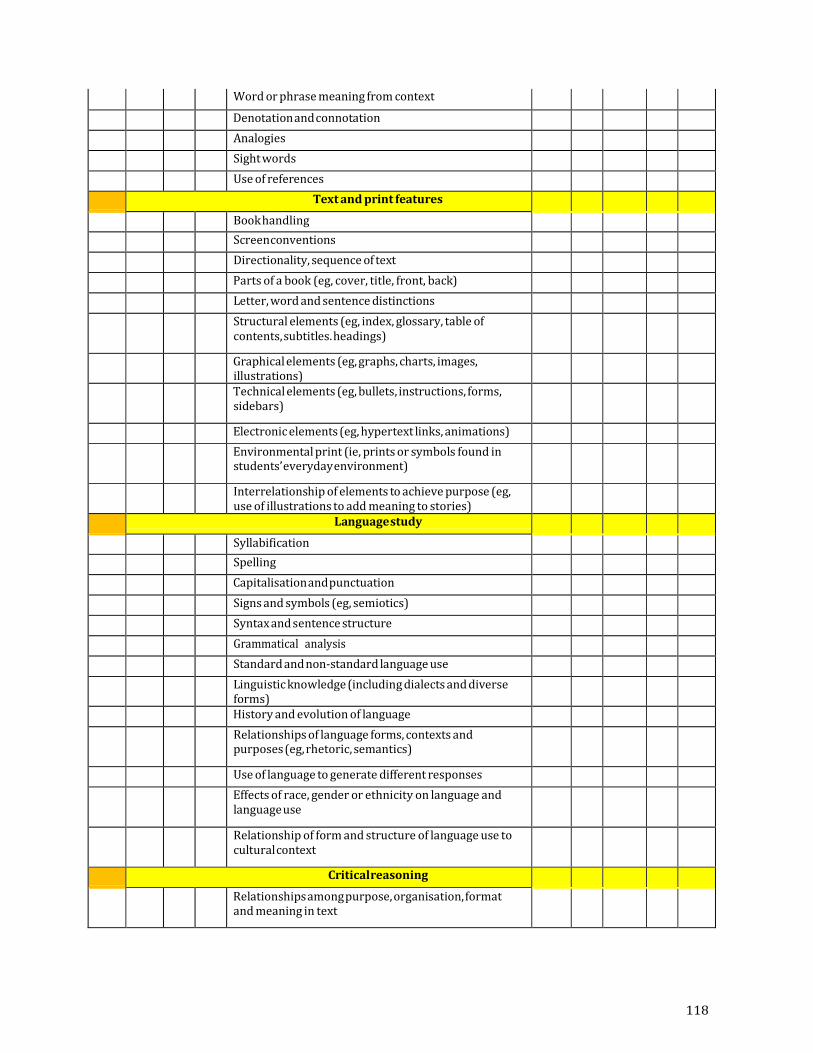
118
Word or phrase meaning from context
Denotation and connotation
Analogies
Sight words
Use of references
Text and print features
Book handling
Screen conventions
Directionality, sequence of text
Parts of a book (eg, cover, title, front, back)
Letter, word and sentence distinctions
Structural elements (eg, index, glossary, table of contents, subtitles. headings)
Graphical elements (eg, graphs, charts, images, illustrations)
Technical elements (eg, bullets, instructions, forms, sidebars)
Electronic elements (eg, hypertext links, animations)
Environmental print (ie, prints or symbols found in students’ everyday environment)
Interrelationship of elements to achieve purpose (eg, use of illustrations to add meaning to stories)
Language study
Syllabification
Spelling
Capitalisation and punctuation
Signs and symbols (eg, semiotics)
Syntax and sentence structure
Grammatical analysis
Standard and non‐standard language use
Linguistic knowledge (including dialects and diverse forms)
History and evolution of language
Relationships of language forms, contexts and purposes (eg, rhetoric, semantics)
Use of language to generate different responses
Effects of race, gender or ethnicity on language and language use
Relationship of form and structure of language use to cultural context
Critical reasoning
Relationships among purpose, organisation, format and meaning in text
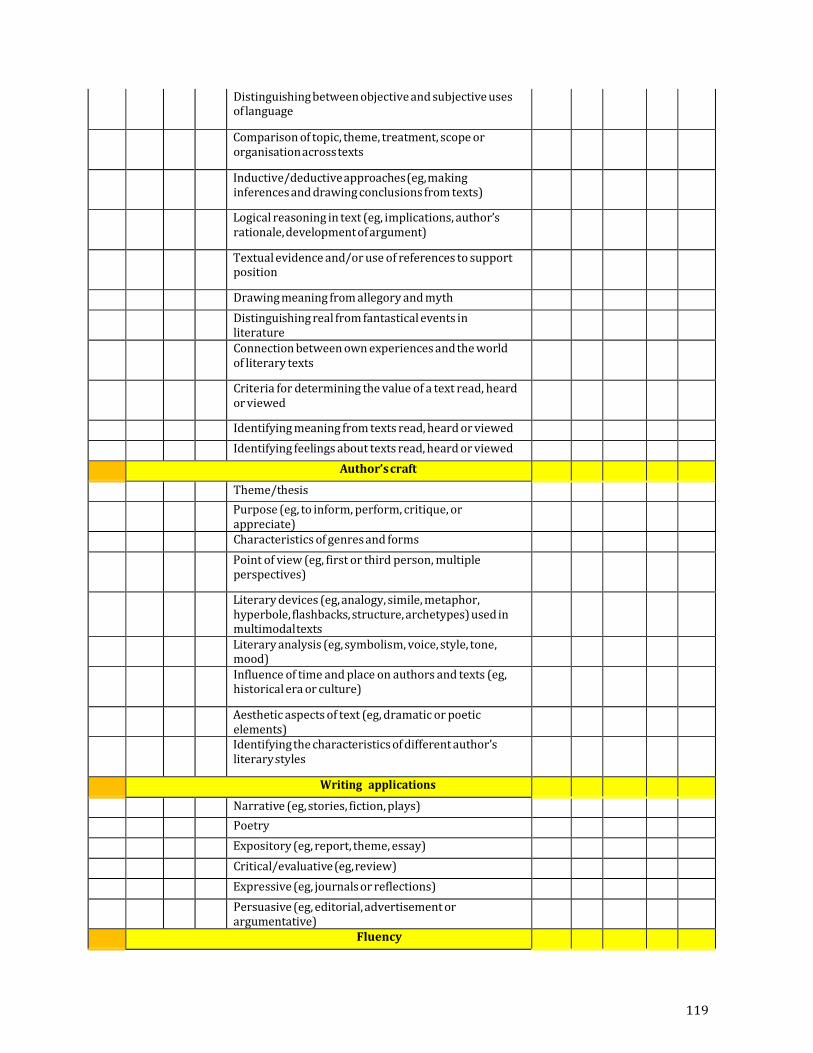
119
Distinguishing between objective and subjective uses of language
Comparison of topic, theme, treatment, scope or organisation across texts
Inductive/deductive approaches (eg, making inferences and drawing conclusions from texts)
Logical reasoning in text (eg, implications, author’s rationale, development of argument)
Textual evidence and/or use of references to support position
Drawing meaning from allegory and myth
Distinguishing real from fantastical events in literature
Connection between own experiences and the world of literary texts
Criteria for determining the value of a text read, heard or viewed
Identifying meaning from texts read, heard or viewed
Identifying feelings about texts read, heard or viewed
Author’s craft
Theme/thesis
Purpose (eg, to inform, perform, critique, or appreciate)
Characteristics of genres and forms
Point of view (eg, first or third person, multiple perspectives)
Literary devices (eg, analogy, simile, metaphor, hyperbole, flashbacks, structure, archetypes) used in multimodal texts
Literary analysis (eg, symbolism, voice, style, tone, mood)
Influence of time and place on authors and texts (eg, historical era or culture)
Aesthetic aspects of text (eg, dramatic or poetic elements)
Identifying the characteristics of different author’s literary styles
Writing applications
Narrative (eg, stories, fiction, plays)
Poetry
Expository (eg, report, theme, essay)
Critical/evaluative (eg, review)
Expressive (eg, journals or reflections)
Persuasive (eg, editorial, advertisement or argumentative)
Fluency
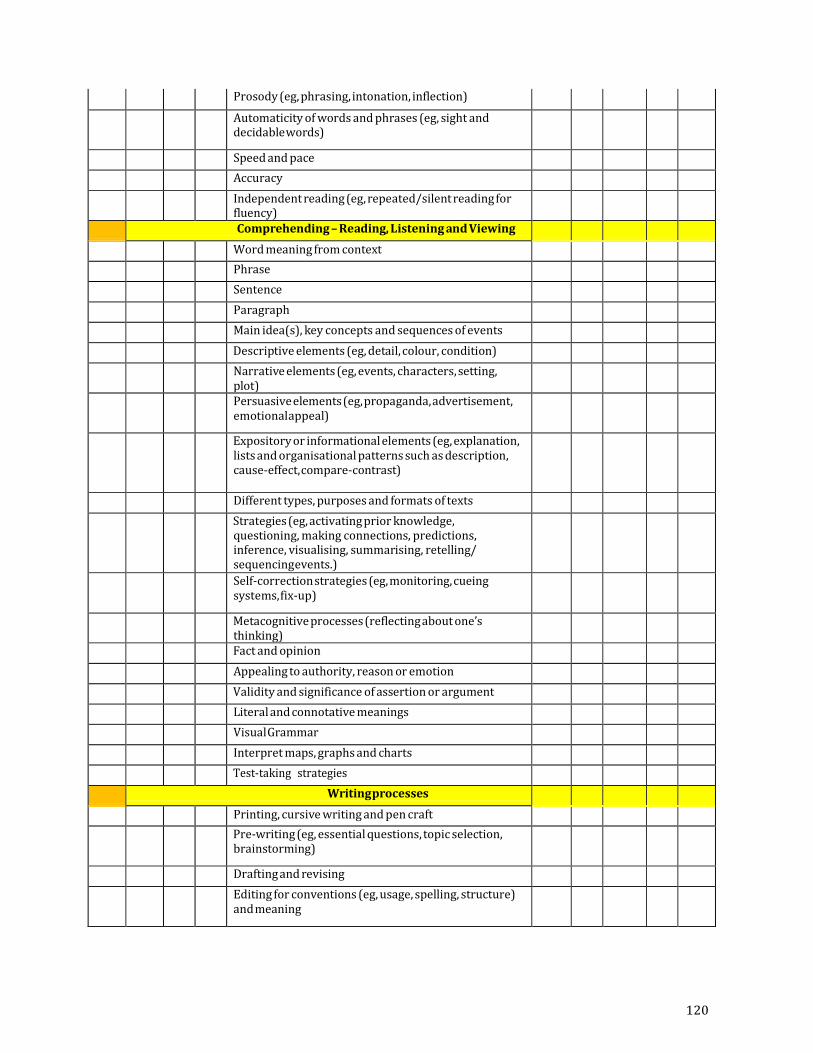
120
Prosody (eg, phrasing, intonation, inflection)
Automaticity of words and phrases (eg, sight and decidable words)
Speed and pace
Accuracy
Independent reading (eg, repeated/silent reading for fluency)
Comprehending – Reading, Listening and Viewing
Word meaning from context
Phrase
Sentence
Paragraph
Main idea(s), key concepts and sequences of events
Descriptive elements (eg, detail, colour, condition)
Narrative elements (eg, events, characters, setting, plot)
Persuasive elements (eg, propaganda, advertisement, emotional appeal)
Expository or informational elements (eg, explanation, lists and organisational patterns such as description, cause‐effect,compare‐contrast)
Different types, purposes and formats of texts
Strategies (eg, activating prior knowledge, questioning, making connections, predictions, inference, visualising, summarising, retelling/ sequencing events.)
Self‐correction strategies (eg, monitoring, cueing systems, fix‐up)
Metacognitive processes (reflecting about one’s thinking)
Fact and opinion
Appealing to authority, reason or emotion
Validity and significance of assertion or argument
Literal and connotative meanings
Visual Grammar
Interpret maps, graphs and charts
Test‐taking strategies
Writing processes
Printing, cursive writing and pen craft
Pre‐writing (eg, essential questions, topic selection, brainstorming)
Drafting and revising
Editing for conventions (eg, usage, spelling, structure) and meaning
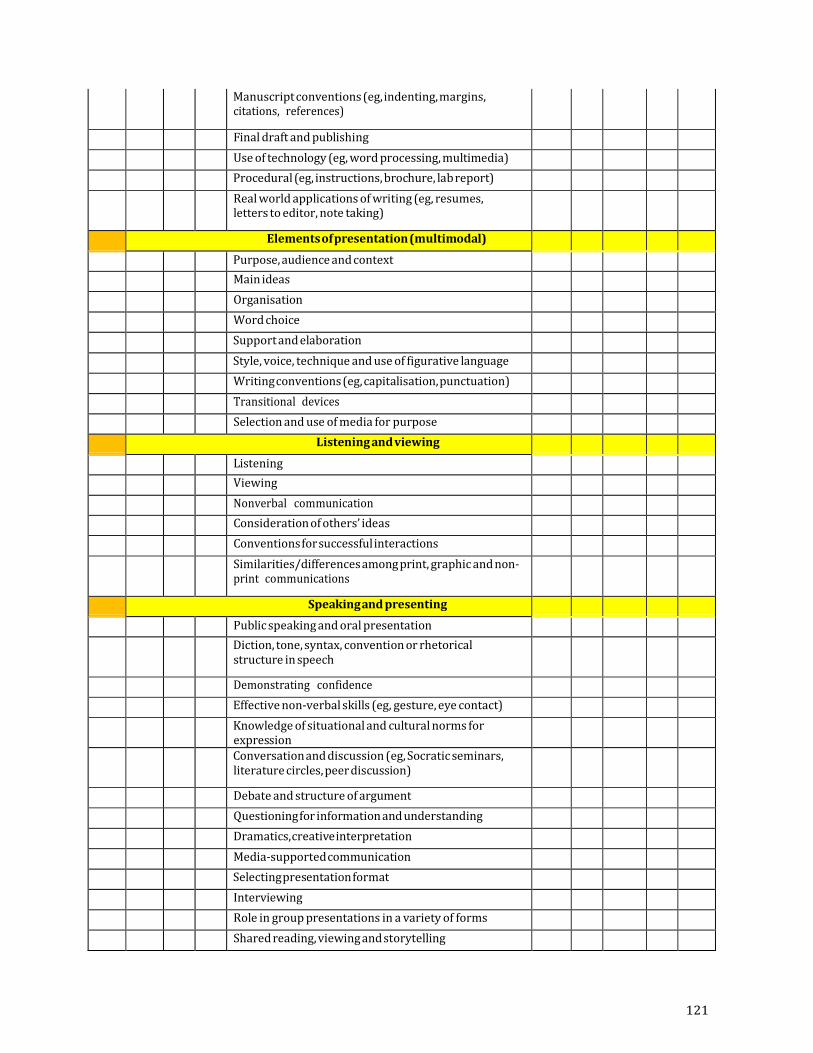
121
Manuscript conventions (eg, indenting, margins, citations, references)
Final draft and publishing
Use of technology (eg, word processing, multimedia)
Procedural (eg, instructions, brochure, lab report)
Real world applications of writing (eg, resumes, letters to editor, note taking)
Elements of presentation (multimodal)
Purpose, audience and context
Main ideas
Organisation
Word choice
Support and elaboration
Style, voice, technique and use of figurative language
Writing conventions (eg, capitalisation, punctuation)
Transitional devices
Selection and use of media for purpose
Listening and viewing
Listening
Viewing
Nonverbal communication
Consideration of others’ ideas
Conventions for successful interactions
Similarities/differences among print, graphic and non‐ print communications
Speaking and presenting
Public speaking and oral presentation
Diction, tone, syntax, convention or rhetorical structure in speech
Demonstrating confidence
Effective non‐verbal skills (eg, gesture, eye contact)
Knowledge of situational and cultural norms for expression
Conversation and discussion (eg, Socratic seminars, literature circles, peer discussion)
Debate and structure of argument
Questioning for information and understanding
Dramatics, creative interpretation
Media‐supportedcommunication
Selecting presentation format
Interviewing
Role in group presentations in a variety of forms
Shared reading, viewing and storytelling
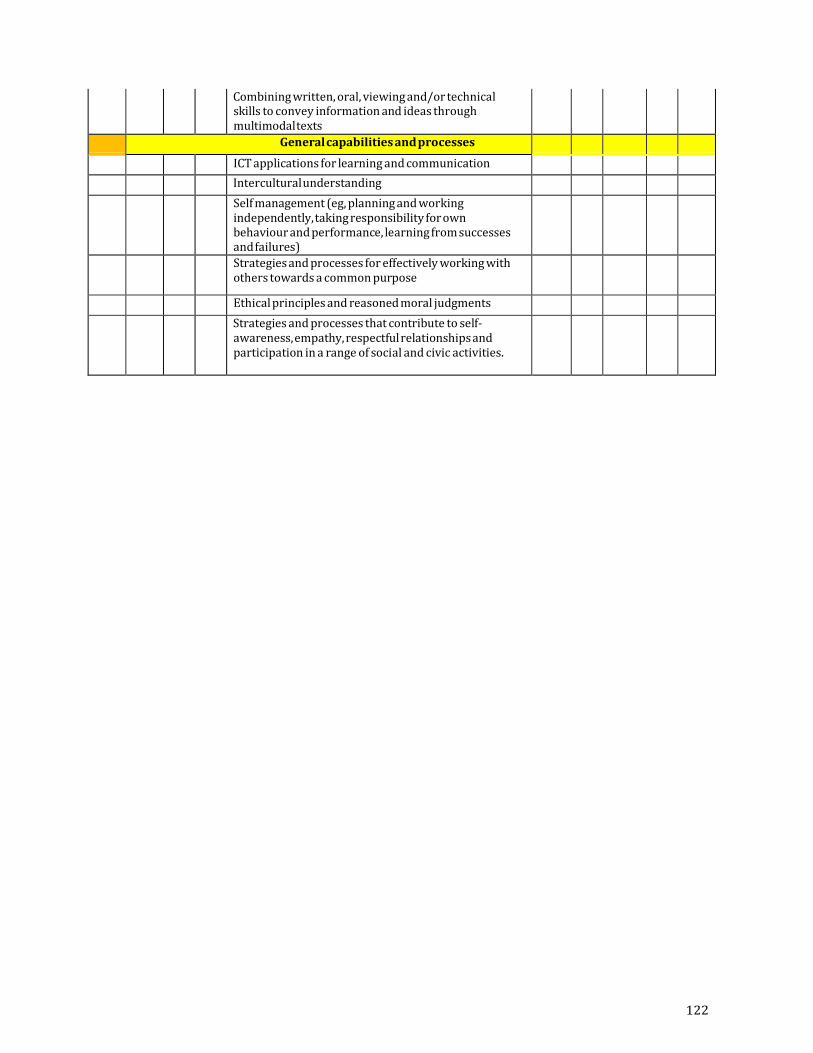
122
Combining written, oral, viewing and/or technical skills to convey information and ideas through multimodal texts
General capabilities and processes
ICT applications for learning and communication
Interculturalunderstanding
Self management (eg, planning and working independently, taking responsibility for own behaviour and performance, learning from successes and failures)
Strategies and processes for effectively working with others towards a common purpose
Ethical principles and reasoned moral judgments
Strategies and processes that contribute to self‐ awareness, empathy, respectful relationships and participation in a range of social and civic activities.
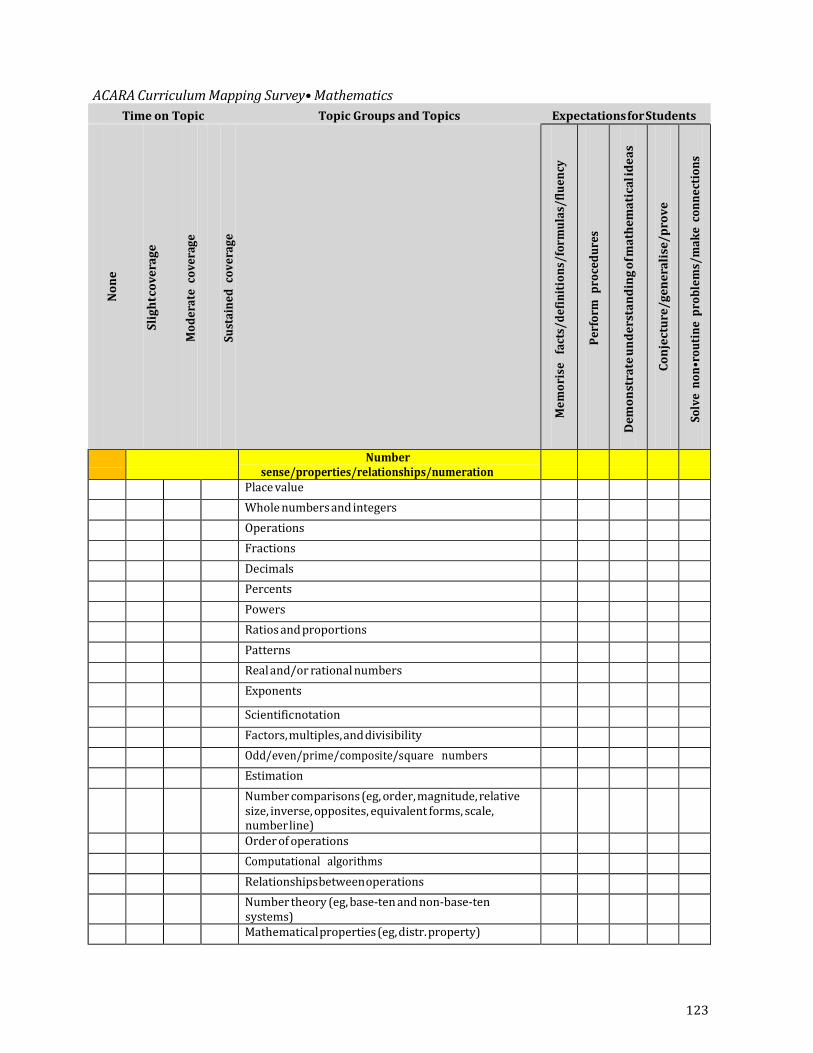
123
ACARA Curriculum Mapping Survey• Mathematics
Time on Topic Topic Groups and Topics Expectations for Students
N
on
e
Sli
gh
t co
ve
rag
e
Mo
de
rate
co
vera
ge
Su
stai
ne
d c
ov
era
ge
Me
mo
rise
fa
cts/
def
init
ion
s/fo
rmu
las/
flu
en
cy
Per
form
pro
ced
ure
s
De
mo
nst
rate
un
de
rsta
nd
ing
of m
ath
em
ati
cal i
de
as
Co
nje
ctu
re/g
en
era
lise
/p
rov
e
Solv
e n
on•r
ou
tin
e p
rob
lem
s/m
ak
e c
on
ne
ctio
ns
Number sense/properties/relationships/numeration
Place value
Whole numbers and integers
Operations
Fractions
Decimals
Percents
Powers
Ratios and proportions
Patterns
Real and/or rational numbers
Exponents
Scientific notation
Factors, multiples, and divisibility
Odd/even/prime/composite/square numbers
Estimation
Number comparisons (eg, order, magnitude, relative size, inverse, opposites, equivalent forms, scale, number line)
Order of operations
Computational algorithms
Relationships between operations
Number theory (eg, base‐ten and non‐base‐ten systems)
Mathematical properties (eg, distr. property)
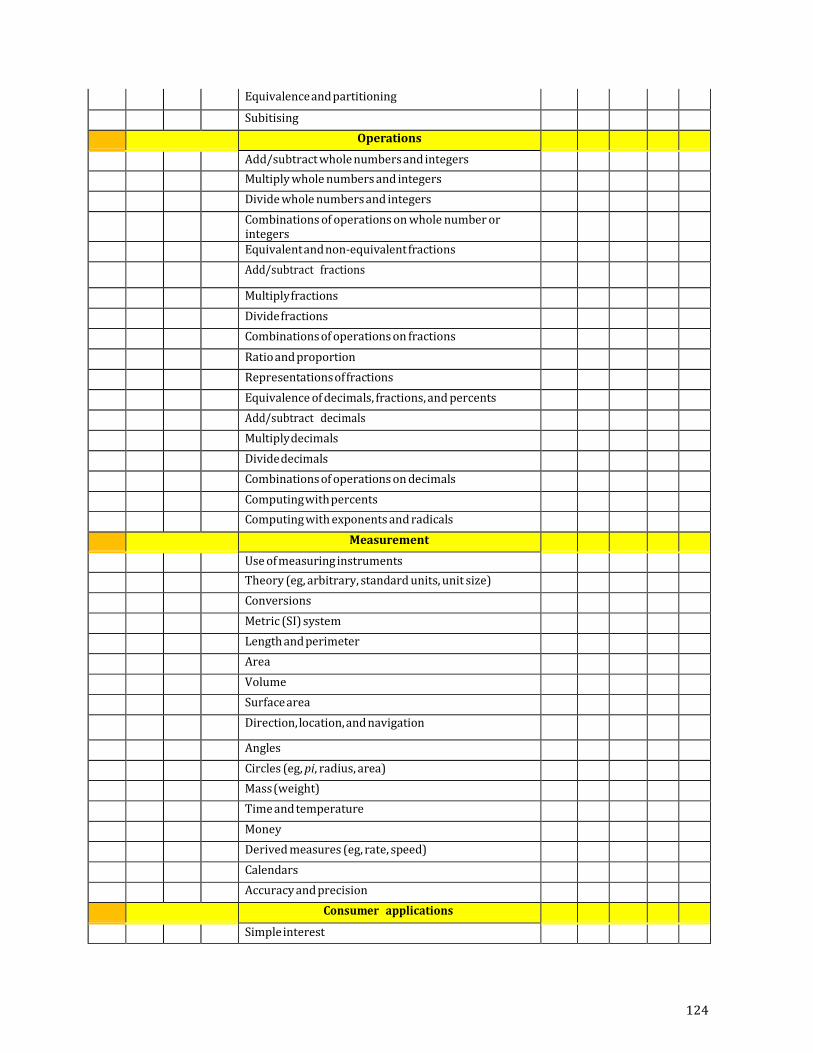
124
Equivalence and partitioning
Subitising
Operations
Add/subtract whole numbers and integers
Multiply whole numbers and integers
Divide whole numbers and integers
Combinations of operations on whole number or integers
Equivalent and non‐equivalent fractions
Add/subtract fractions
Multiply fractions
Divide fractions
Combinations of operations on fractions
Ratio and proportion
Representations of fractions
Equivalence of decimals, fractions, and percents
Add/subtract decimals
Multiply decimals
Divide decimals
Combinations of operations on decimals
Computing with percents
Computing with exponents and radicals
Measurement
Use of measuring instruments
Theory (eg, arbitrary, standard units, unit size)
Conversions
Metric (SI) system
Length and perimeter
Area
Volume
Surface area
Direction, location, and navigation
Angles
Circles (eg, pi, radius, area)
Mass (weight)
Time and temperature
Money
Derived measures (eg, rate, speed)
Calendars
Accuracy and precision
Consumer applications
Simple interest
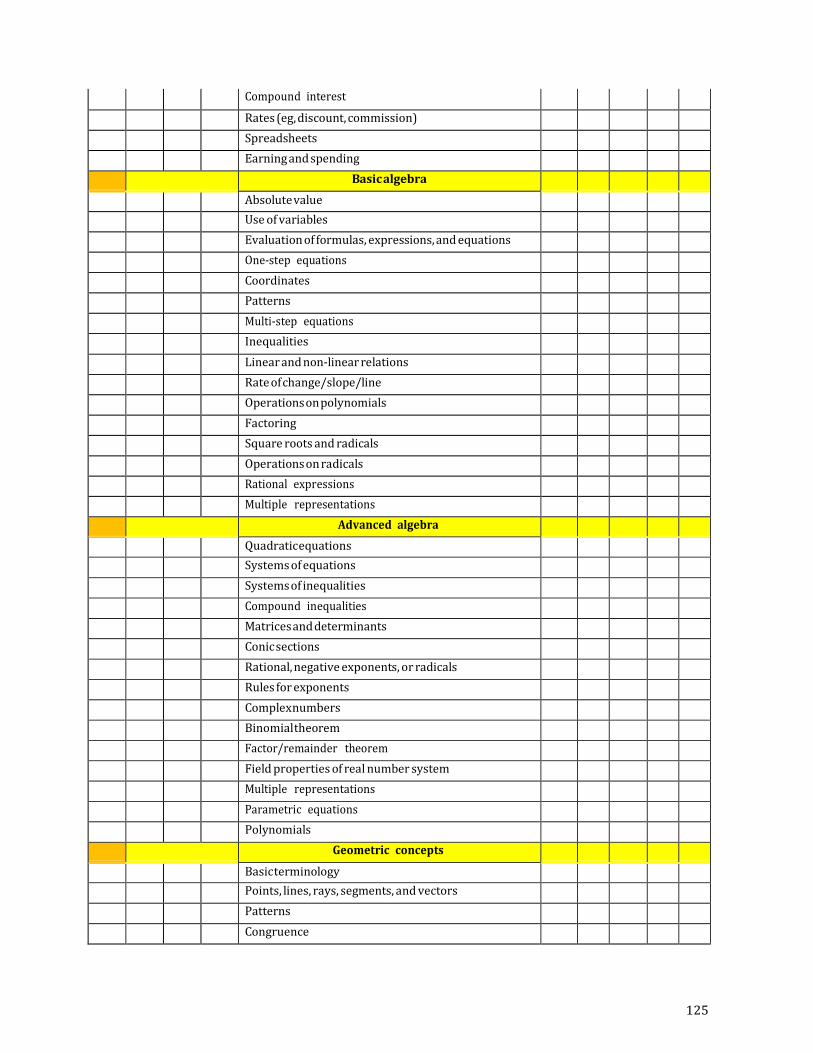
125
Compound interest
Rates (eg, discount, commission)
Spreadsheets
Earning and spending
Basic algebra
Absolute value
Use of variables
Evaluation of formulas, expressions, and equations
One‐step equations
Coordinates
Patterns
Multi‐step equations
Inequalities
Linear and non‐linear relations
Rate of change/slope/line
Operations on polynomials
Factoring
Square roots and radicals
Operations on radicals
Rational expressions
Multiple representations
Advanced algebra
Quadratic equations
Systems of equations
Systems of inequalities
Compound inequalities
Matrices and determinants
Conic sections
Rational, negative exponents, or radicals
Rules for exponents
Complex numbers
Binomial theorem
Factor/remainder theorem
Field properties of real number system
Multiple representations
Parametric equations
Polynomials
Geometric concepts
Basic terminology
Points, lines, rays, segments, and vectors
Patterns
Congruence
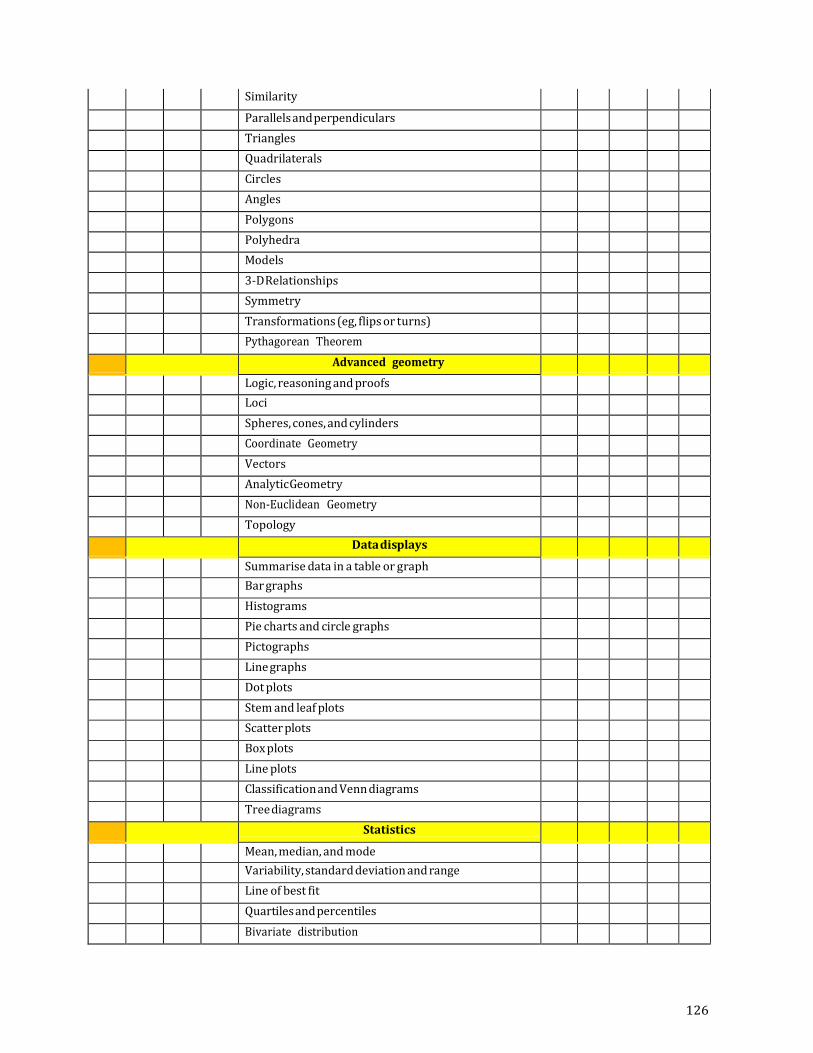
126
Similarity
Parallels and perpendiculars
Triangles
Quadrilaterals
Circles
Angles
Polygons
Polyhedra
Models
3‐D Relationships
Symmetry
Transformations (eg, flips or turns)
Pythagorean Theorem
Advanced geometry
Logic, reasoning and proofs
Loci
Spheres, cones, and cylinders
Coordinate Geometry
Vectors
Analytic Geometry
Non‐Euclidean Geometry
Topology
Data displays
Summarise data in a table or graph
Bar graphs
Histograms
Pie charts and circle graphs
Pictographs
Line graphs
Dot plots
Stem and leaf plots
Scatter plots
Box plots
Line plots
Classification and Venn diagrams
Tree diagrams
Statistics
Mean, median, and mode
Variability, standard deviation and range
Line of best fit
Quartiles and percentiles
Bivariate distribution
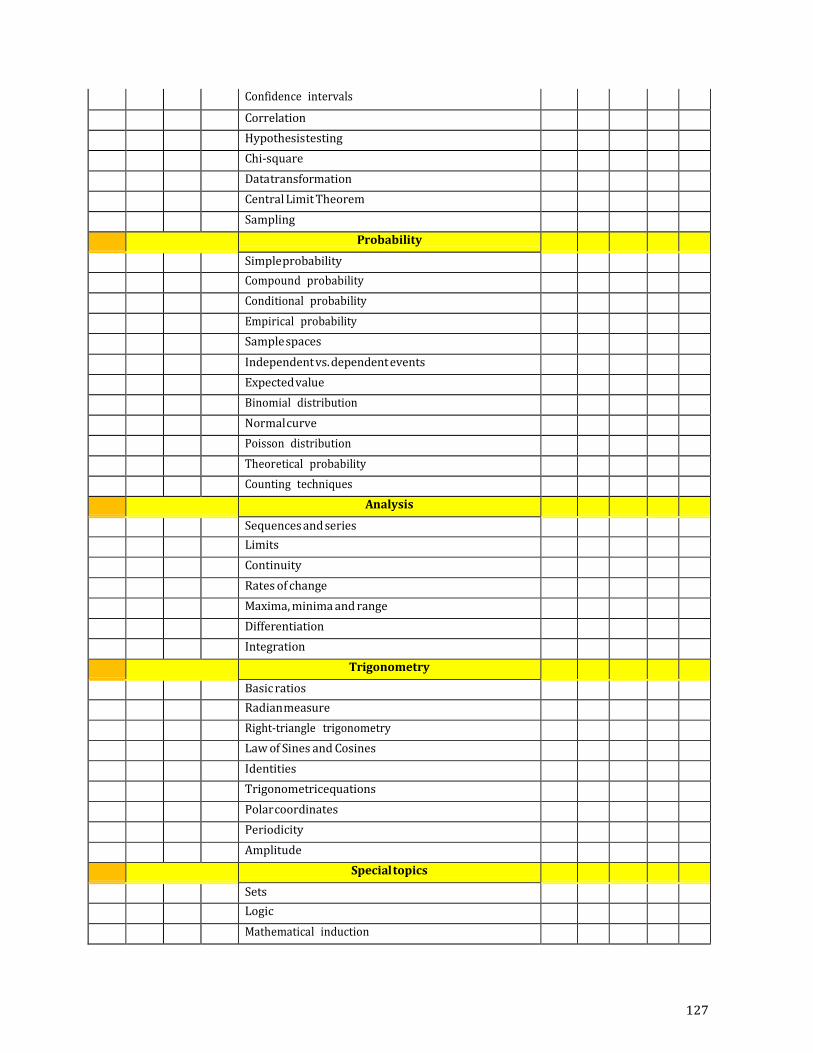
127
Confidence intervals
Correlation
Hypothesis testing
Chi‐square
Data transformation
Central Limit Theorem
Sampling
Probability
Simple probability
Compound probability
Conditional probability
Empirical probability
Sample spaces
Independent vs. dependent events
Expected value
Binomial distribution
Normal curve
Poisson distribution
Theoretical probability
Counting techniques
Analysis
Sequences and series
Limits
Continuity
Rates of change
Maxima, minima and range
Differentiation
Integration
Trigonometry
Basic ratios
Radian measure
Right‐triangle trigonometry
Law of Sines and Cosines
Identities
Trigonometricequations
Polar coordinates
Periodicity
Amplitude
Special topics
Sets
Logic
Mathematical induction
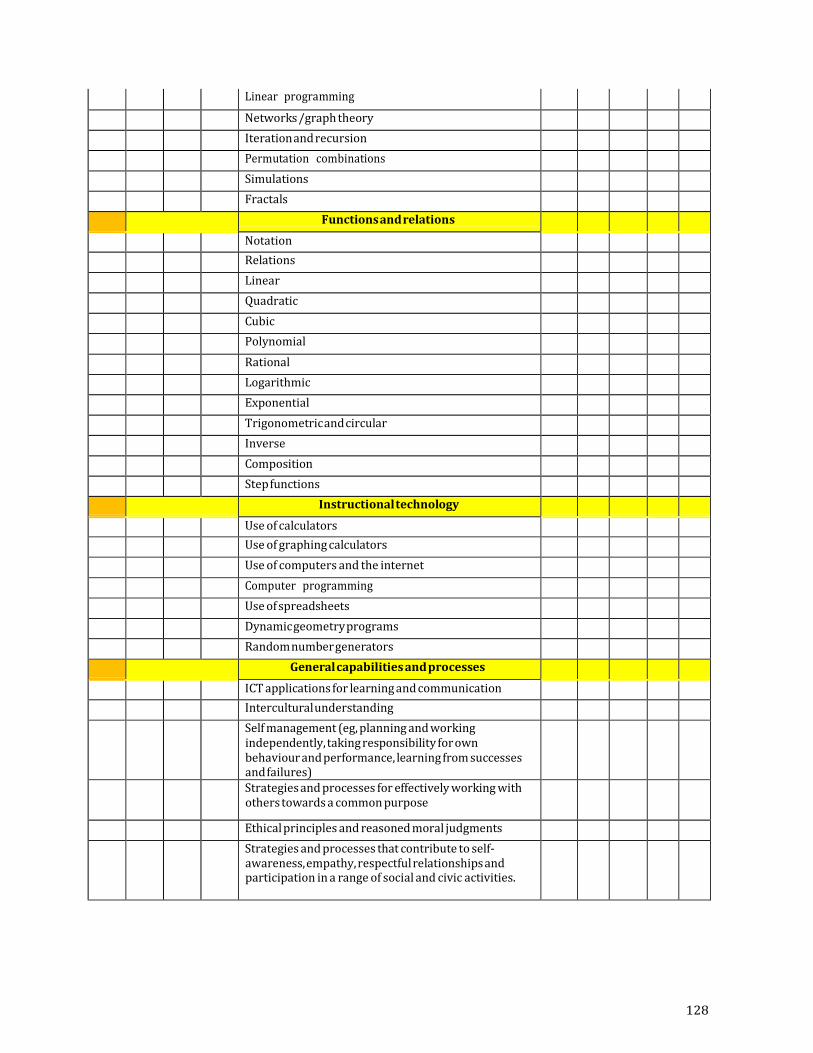
128
Linear programming
Networks /graph theory
Iteration and recursion
Permutation combinations
Simulations
Fractals
Functions and relations
Notation
Relations
Linear
Quadratic
Cubic
Polynomial
Rational
Logarithmic
Exponential
Trigonometric and circular
Inverse
Composition
Step functions
Instructionaltechnology
Use of calculators
Use of graphing calculators
Use of computers and the internet
Computer programming
Use of spreadsheets
Dynamic geometry programs
Random number generators
General capabilities and processes
ICT applications for learning and communication
Interculturalunderstanding
Self management (eg, planning and working independently, taking responsibility for own behaviour and performance, learning from successes and failures)
Strategies and processes for effectively working with others towards a common purpose
Ethical principles and reasoned moral judgments
Strategies and processes that contribute to self‐ awareness, empathy, respectful relationships and participation in a range of social and civic activities.
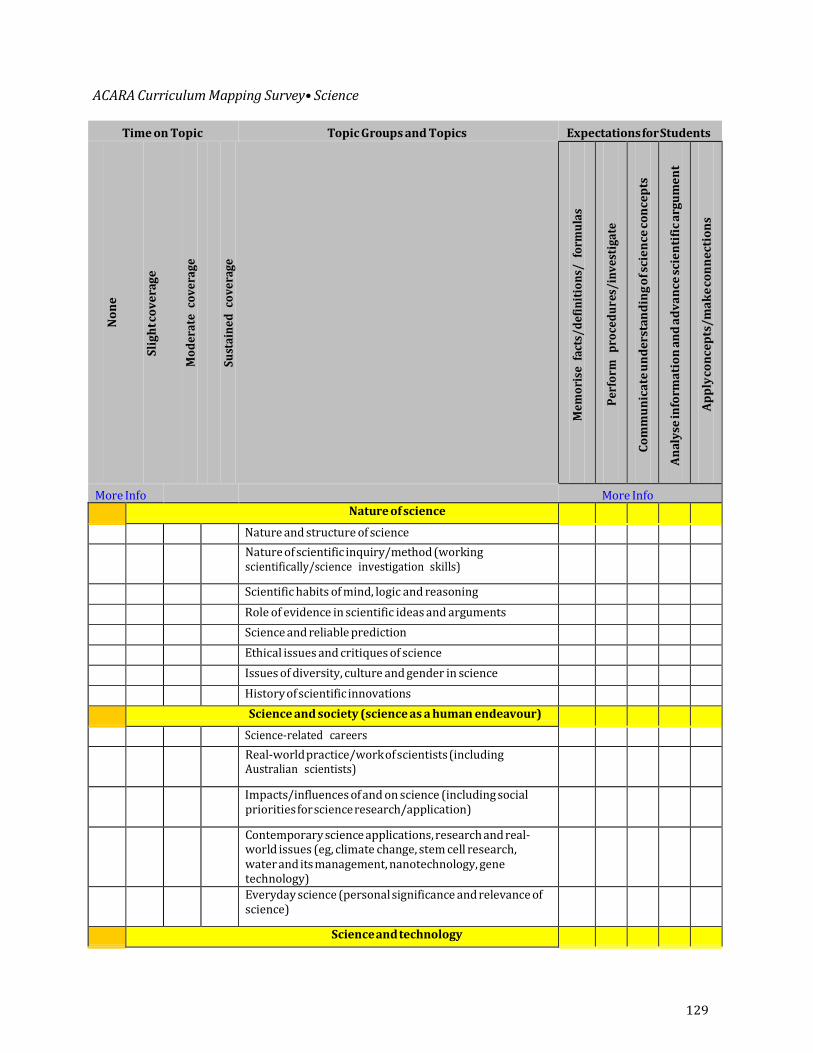
129
ACARA Curriculum Mapping Survey• Science
Time on Topic Topic Groups and Topics Expectations for Students
N
on
e
Sli
gh
t co
ve
rag
e
Mo
de
rate
co
ve
rage
Sust
ain
ed
co
vera
ge
Me
mo
rise
fac
ts/d
efin
itio
ns/
fo
rmu
las
Per
form
p
roce
du
res/
inv
esti
gate
Co
mm
un
ica
te u
nd
ers
tan
din
g o
f sci
en
ce c
on
cep
ts
An
aly
se in
form
ati
on
an
d a
dv
an
ce s
cie
nti
fic
arg
um
en
t
Ap
ply
co
nce
pts
/ma
ke
co
nn
ect
ion
s
More Info More Info
Nature of science
Nature and structure of science
Nature of scientific inquiry/method (working scientifically/science investigation skills)
Scientific habits of mind, logic and reasoning
Role of evidence in scientific ideas and arguments
Science and reliable prediction
Ethical issues and critiques of science
Issues of diversity, culture and gender in science
History of scientific innovations
Science and society (science as a human endeavour)
Science‐related careers
Real‐world practice/work of scientists (including Australian scientists)
Impacts/influences of and on science (including social priorities for science research/application)
Contemporary science applications, research and real‐ world issues (eg, climate change, stem cell research, water and its management, nanotechnology, gene technology)
Everyday science (personal significance and relevance of science)
Science and technology
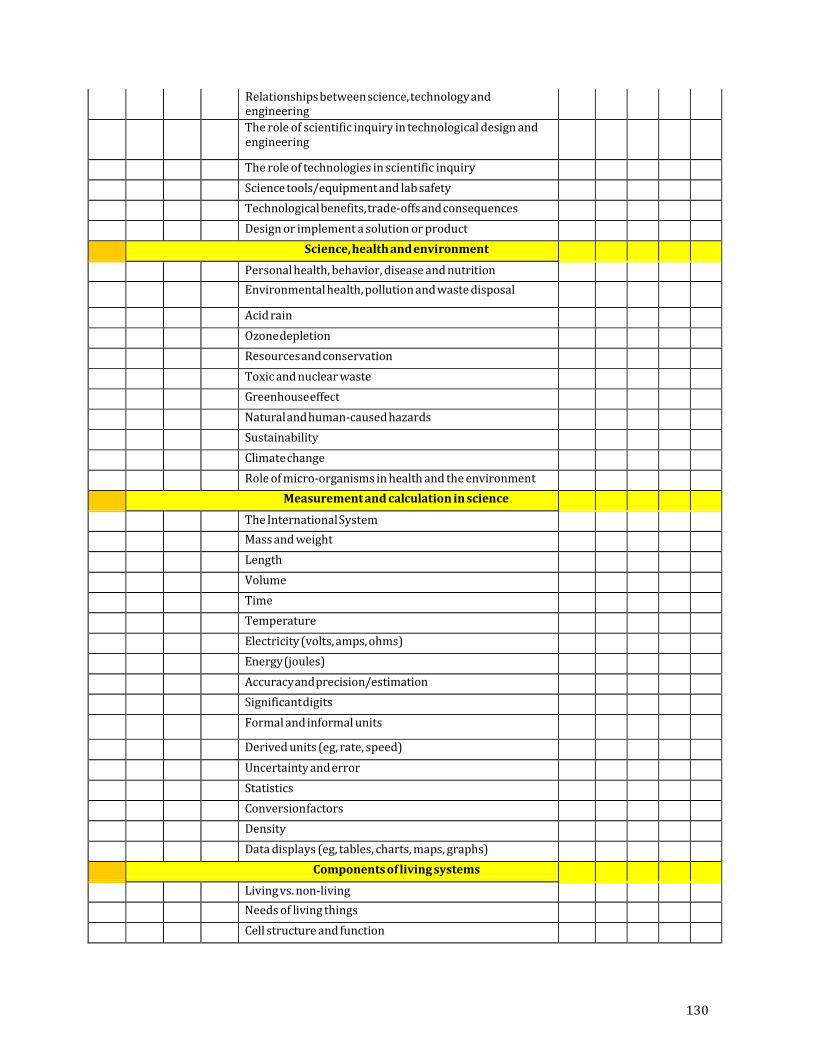
130
Relationships between science, technology and engineering
The role of scientific inquiry in technological design and engineering
The role of technologies in scientific inquiry
Science tools/equipment and lab safety
Technological benefits, trade‐offs and consequences
Design or implement a solution or product
Science, health and environment
Personal health, behavior, disease and nutrition
Environmental health, pollution and waste disposal
Acid rain
Ozone depletion
Resources and conservation
Toxic and nuclear waste
Greenhouse effect
Natural and human‐caused hazards
Sustainability
Climate change
Role of micro‐organisms in health and the environment
Measurement and calculation in science
The International System
Mass and weight
Length
Volume
Time
Temperature
Electricity (volts, amps, ohms)
Energy (joules)
Accuracy and precision/estimation
Significant digits
Formal and informal units
Derived units (eg, rate, speed)
Uncertainty and error
Statistics
Conversion factors
Density
Data displays (eg, tables, charts, maps, graphs)
Components of living systems
Living vs. non‐living
Needs of living things
Cell structure and function
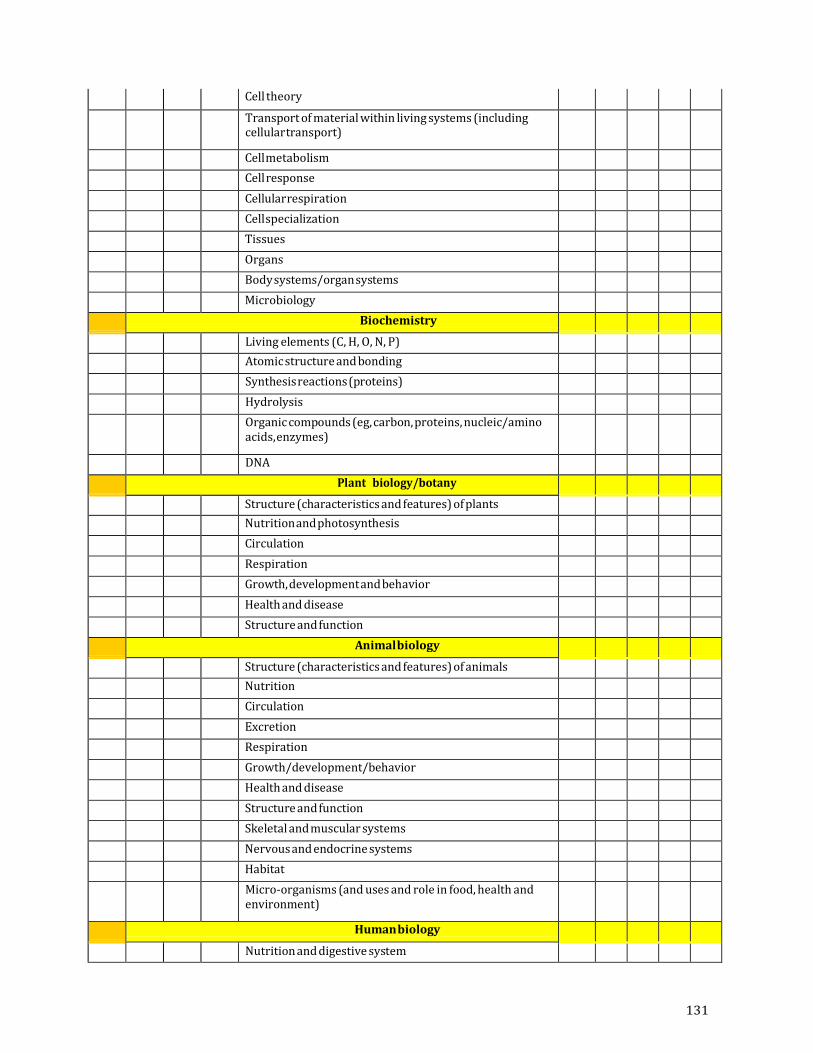
131
Cell theory
Transport of material within living systems (including cellular transport)
Cell metabolism
Cell response
Cellular respiration
Cell specialization
Tissues
Organs
Body systems/organ systems
Microbiology
Biochemistry
Living elements (C, H, O, N, P)
Atomic structure and bonding
Synthesis reactions (proteins)
Hydrolysis
Organic compounds (eg, carbon, proteins, nucleic/amino acids, enzymes)
DNA
Plant biology/botany
Structure (characteristics and features) of plants
Nutrition and photosynthesis
Circulation
Respiration
Growth, development and behavior
Health and disease
Structure and function
Animal biology
Structure (characteristics and features) of animals
Nutrition
Circulation
Excretion
Respiration
Growth/development/behavior
Health and disease
Structure and function
Skeletal and muscular systems
Nervous and endocrine systems
Habitat
Micro‐organisms (and uses and role in food, health and environment)
Human biology
Nutrition and digestive system
132
Circulatory system and blood
Excretory system
Respiration and respiratory system
Growth, development and behavior
Health and disease, immune system
Skeletal and muscular systems
Nervous and endocrine systems
Genetics
DNA, genes and chromosomes
Mendelian genetics
Modern genetics
Inherited diseases
Biotechnology
Human genetics
Transcription and translation
Mutation
Evolution
Adaptations
Evidence for evolution
Lamarckian theories
Modern evolutionary theory
Diversity
Life origin theories
Human evolution
Classification
Causes
Natural selection
Reproduction and development
Life cycles
Mitotic and meiotic cell division
Asexual reproduction
Inherited traits
Reproduction, growth and development in plants
Reproduction, growth and development in animals
Reproduction, growth and development in humans
Ecology
Food webs/chains
Competition and cooperation
Energy flow relationships
Biotic and abiotic factors
Ecological succession
Ecosystems
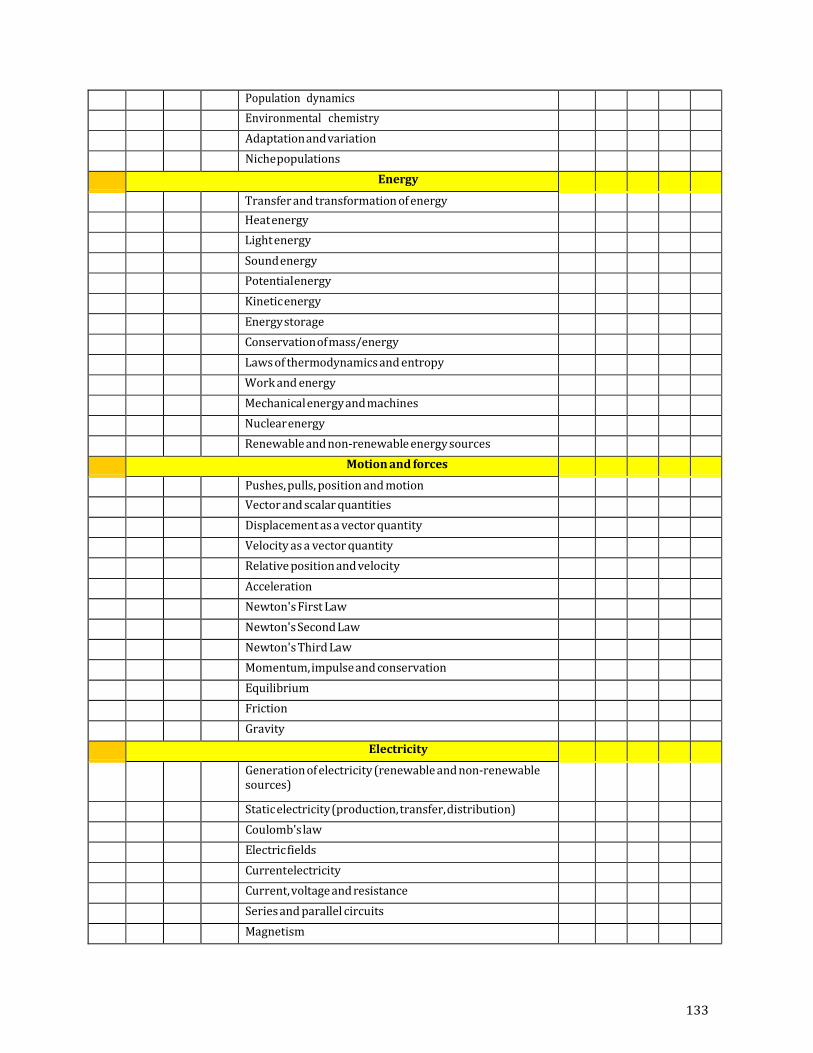
133
Population dynamics
Environmental chemistry
Adaptation and variation
Niche populations
Energy
Transfer and transformation of energy
Heat energy
Light energy
Sound energy
Potential energy
Kinetic energy
Energy storage
Conservation of mass/energy
Laws of thermodynamics and entropy
Work and energy
Mechanical energy and machines
Nuclear energy
Renewable and non‐renewable energy sources
Motion and forces
Pushes, pulls, position and motion
Vector and scalar quantities
Displacement as a vector quantity
Velocity as a vector quantity
Relative position and velocity
Acceleration
Newton's First Law
Newton's Second Law
Newton's Third Law
Momentum, impulse and conservation
Equilibrium
Friction
Gravity
Electricity
Generation of electricity (renewable and non‐renewable sources)
Static electricity (production, transfer, distribution)
Coulomb's law
Electric fields
Current electricity
Current, voltage and resistance
Series and parallel circuits
Magnetism
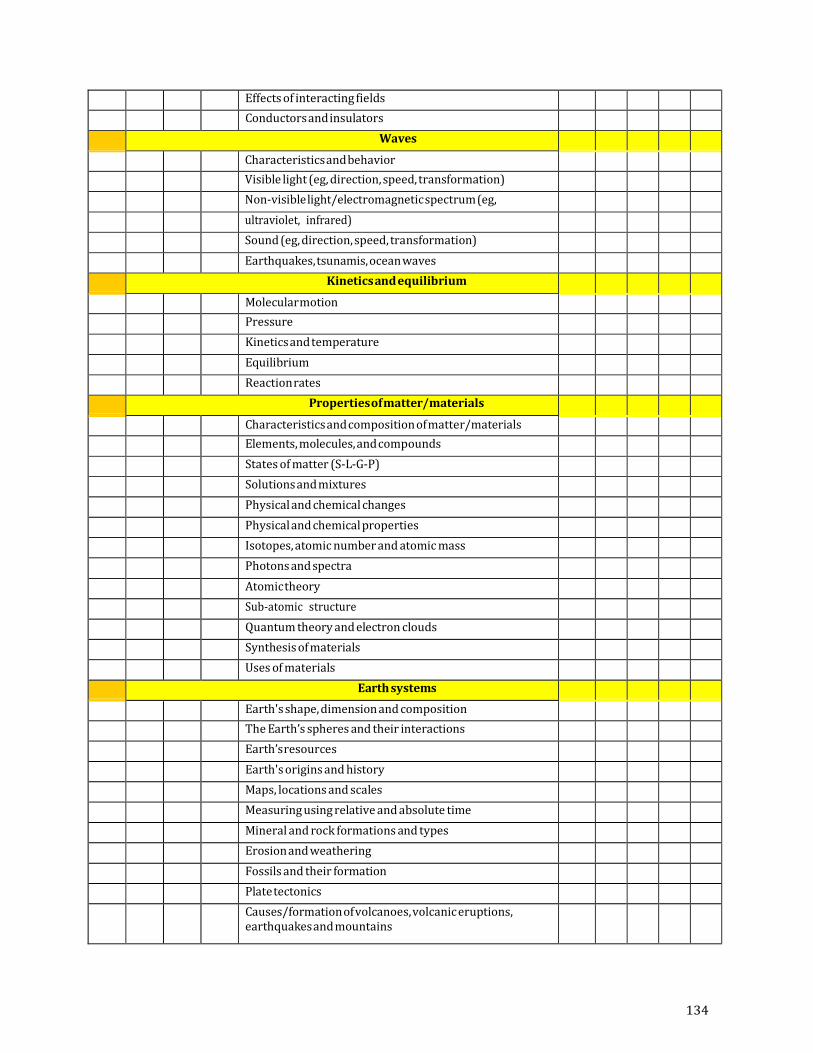
134
Effects of interacting fields
Conductors and insulators
Waves
Characteristics and behavior
Visible light (eg, direction, speed, transformation)
Non‐visible light/electromagnetic spectrum (eg,
ultraviolet, infrared)
Sound (eg, direction, speed, transformation)
Earthquakes, tsunamis, ocean waves
Kinetics and equilibrium
Molecular motion
Pressure
Kinetics and temperature
Equilibrium
Reaction rates
Properties of matter/materials
Characteristics and composition of matter/materials
Elements, molecules, and compounds
States of matter (S‐L‐G‐P)
Solutions and mixtures
Physical and chemical changes
Physical and chemical properties
Isotopes, atomic number and atomic mass
Photons and spectra
Atomic theory
Sub‐atomic structure
Quantum theory and electron clouds
Synthesis of materials
Uses of materials
Earth systems
Earth's shape, dimension and composition
The Earth’s spheres and their interactions
Earth’s resources
Earth's origins and history
Maps, locations and scales
Measuring using relative and absolute time
Mineral and rock formations and types
Erosion and weathering
Fossils and their formation
Plate tectonics
Causes/formation of volcanoes, volcanic eruptions, earthquakes and mountains
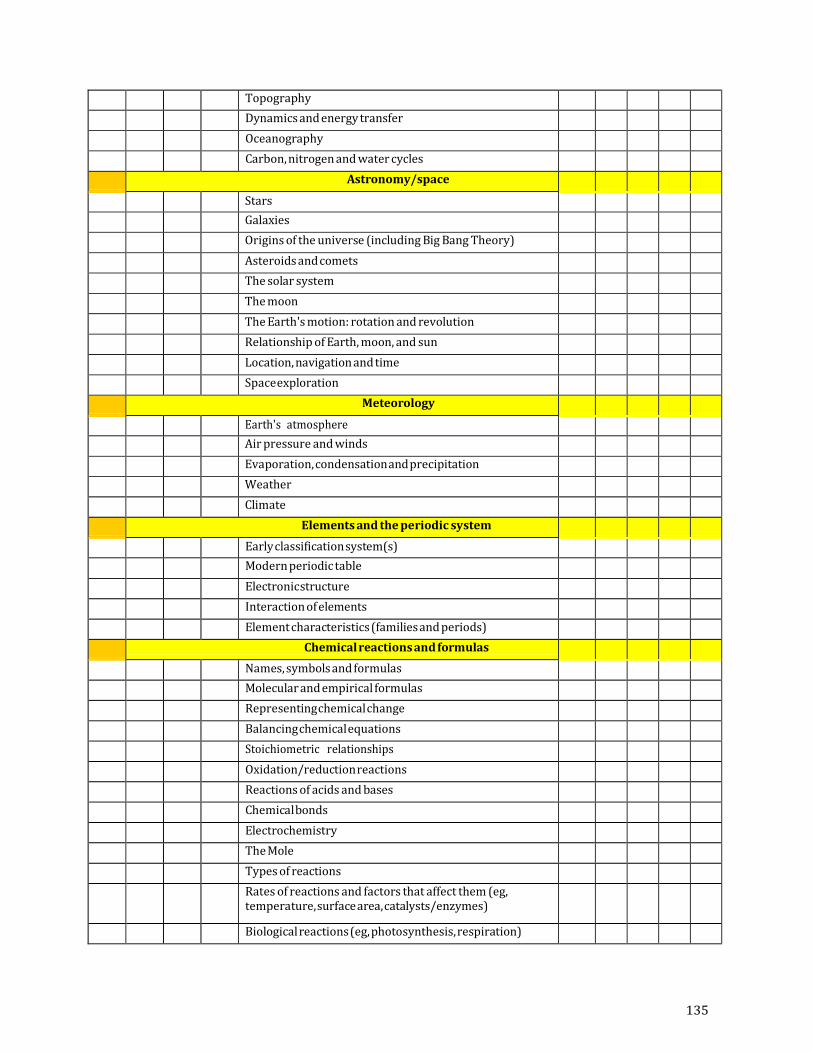
135
Topography
Dynamics and energy transfer
Oceanography
Carbon, nitrogen and water cycles
Astronomy/space
Stars
Galaxies
Origins of the universe (including Big Bang Theory)
Asteroids and comets
The solar system
The moon
The Earth's motion: rotation and revolution
Relationship of Earth, moon, and sun
Location, navigation and time
Space exploration
Meteorology
Earth's atmosphere
Air pressure and winds
Evaporation, condensation and precipitation
Weather
Climate
Elements and the periodic system
Early classification system(s)
Modern periodic table
Electronic structure
Interaction of elements
Element characteristics (families and periods)
Chemical reactions and formulas
Names, symbols and formulas
Molecular and empirical formulas
Representing chemical change
Balancing chemical equations
Stoichiometric relationships
Oxidation/reductionreactions
Reactions of acids and bases
Chemical bonds
Electrochemistry
The Mole
Types of reactions
Rates of reactions and factors that affect them (eg, temperature, surface area, catalysts/enzymes)
Biological reactions (eg, photosynthesis, respiration)
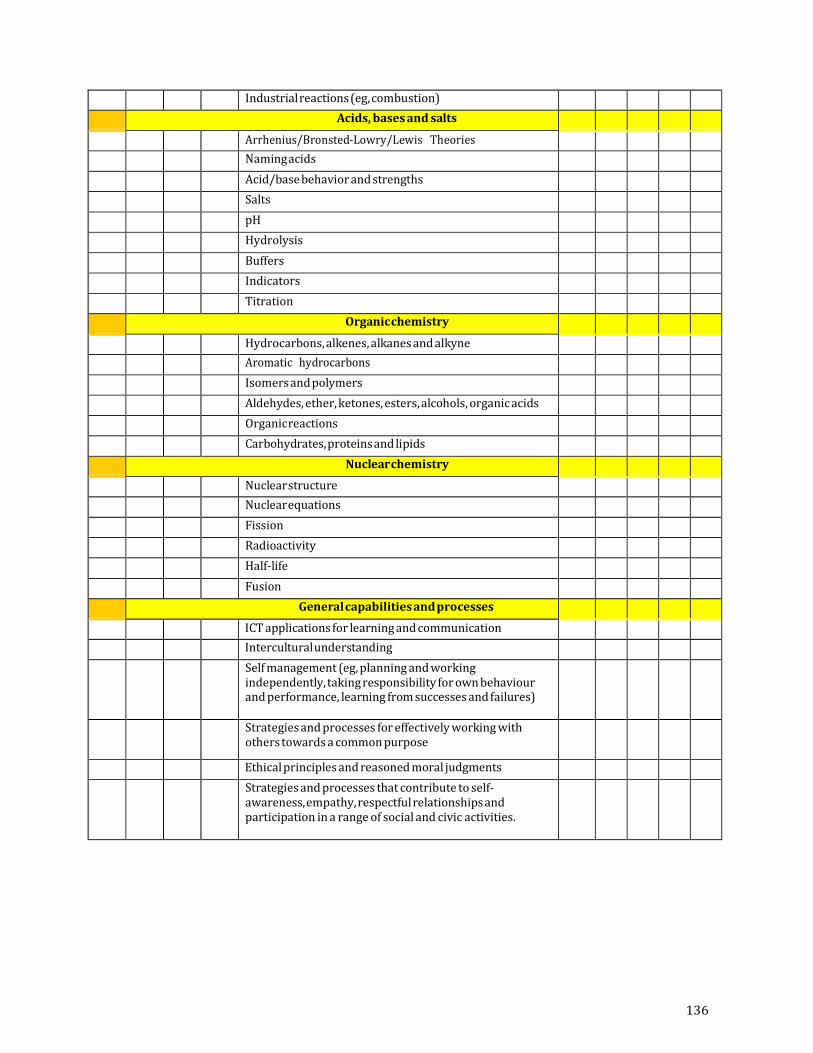
136
Industrial reactions (eg, combustion)
Acids, bases and salts
Arrhenius/Bronsted‐Lowry/Lewis Theories
Naming acids
Acid/base behavior and strengths
Salts
pH
Hydrolysis
Buffers
Indicators
Titration
Organic chemistry
Hydrocarbons, alkenes, alkanes and alkyne
Aromatic hydrocarbons
Isomers and polymers
Aldehydes, ether, ketones, esters, alcohols, organic acids
Organic reactions
Carbohydrates, proteins and lipids
Nuclear chemistry
Nuclear structure
Nuclear equations
Fission
Radioactivity
Half‐life
Fusion
General capabilities and processes
ICT applications for learning and communication
Interculturalunderstanding
Self management (eg, planning and working independently, taking responsibility for own behaviour and performance, learning from successes and failures)
Strategies and processes for effectively working with others towards a common purpose
Ethical principles and reasoned moral judgments
Strategies and processes that contribute to self‐ awareness, empathy, respectful relationships and participation in a range of social and civic activities.
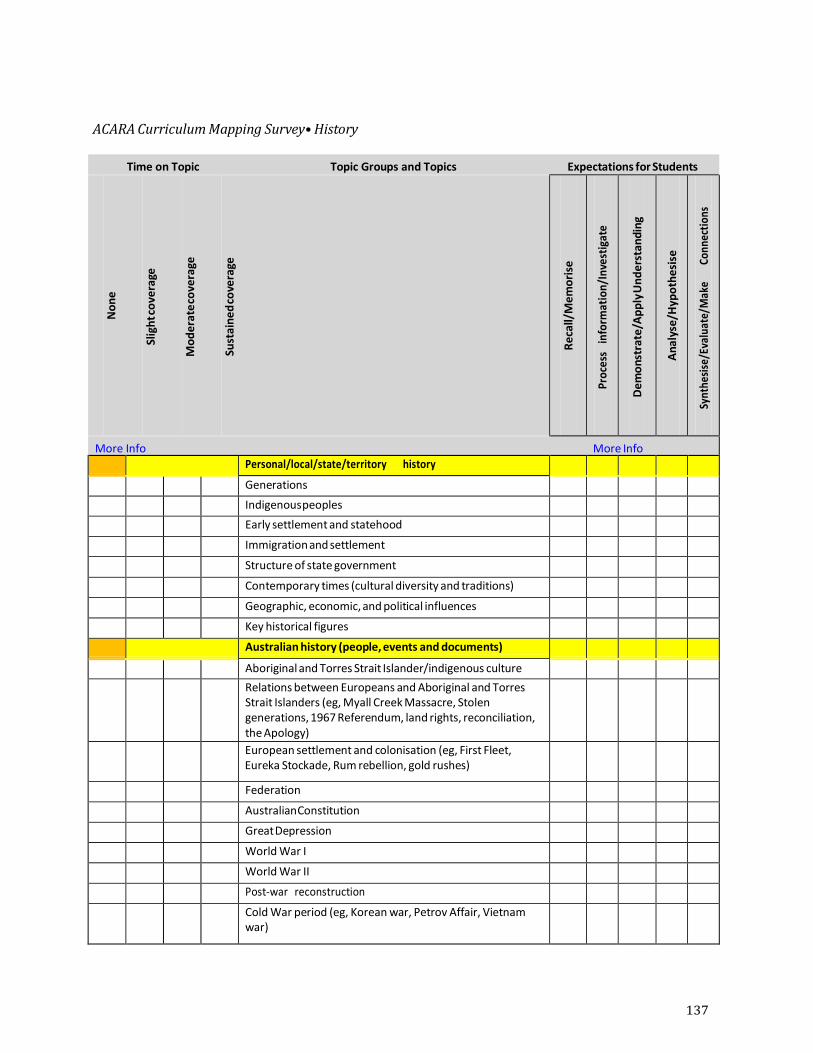
137
ACARA Curriculum Mapping Survey• History
Time on Topic Topic Groups and Topics Expectations for Students
N
on
e
Slig
ht c
ove
rage
Mo
de
rate
cove
rage
Sust
ain
ed
cove
rage
Re
call/
Me
mo
rise
Pro
cess
in
form
atio
n/I
nve
stig
ate
De
mo
nst
rate
/Ap
ply
Un
de
rsta
nd
ing
An
alys
e/H
ypo
the
sise
Synt
hesi
se/E
valu
ate/
Mak
e
Co
nnec
tion
s
More Info More Info
Personal/local/state/territory history
Generations
Indigenous peoples
Early settlement and statehood
Immigration and settlement
Structure of state government
Contemporary times (cultural diversity and traditions)
Geographic, economic, and political influences
Key historical figures
Australian history (people, events and documents)
Aboriginal and Torres Strait Islander/indigenous culture
Relations between Europeans and Aboriginal and Torres Strait Islanders (eg, Myall Creek Massacre, Stolen generations, 1967 Referendum, land rights, reconciliation, the Apology)
European settlement and colonisation (eg, First Fleet, Eureka Stockade, Rum rebellion, gold rushes)
Federation
Australian Constitution
Great Depression
World War I
World War II
Post‐war reconstruction
Cold War period (eg, Korean war, Petrov Affair, Vietnam war)
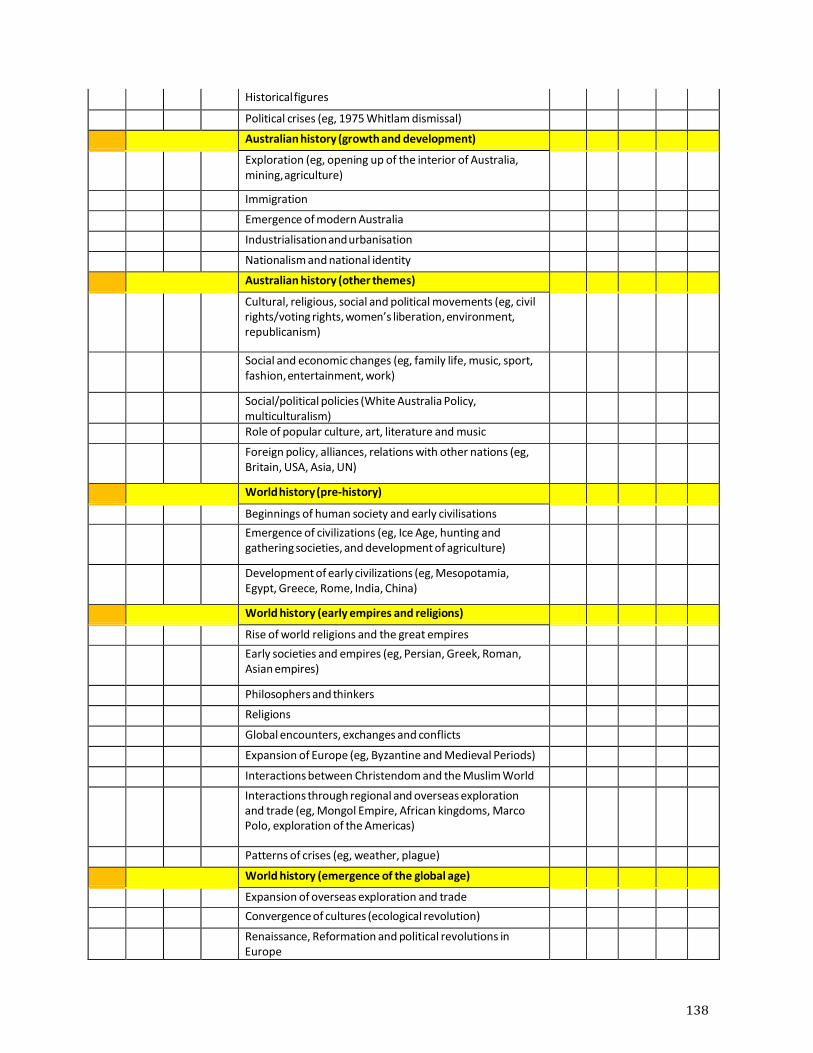
138
Historical figures
Political crises (eg, 1975 Whitlam dismissal)
Australian history (growth and development)
Exploration (eg, opening up of the interior of Australia, mining, agriculture)
Immigration
Emergence of modern Australia
Industrialisation and urbanisation
Nationalism and national identity
Australian history (other themes)
Cultural, religious, social and political movements (eg, civil rights/voting rights, women’s liberation, environment, republicanism)
Social and economic changes (eg, family life, music, sport, fashion, entertainment, work)
Social/political policies (White Australia Policy, multiculturalism)
Role of popular culture, art, literature and music
Foreign policy, alliances, relations with other nations (eg, Britain, USA, Asia, UN)
World history (pre‐history)
Beginnings of human society and early civilisations
Emergence of civilizations (eg, Ice Age, hunting and gathering societies, and development of agriculture)
Development of early civilizations (eg, Mesopotamia, Egypt, Greece, Rome, India, China)
World history (early empires and religions)
Rise of world religions and the great empires
Early societies and empires (eg, Persian, Greek, Roman, Asian empires)
Philosophers and thinkers
Religions
Global encounters, exchanges and conflicts
Expansion of Europe (eg, Byzantine and Medieval Periods)
Interactions between Christendom and the Muslim World
Interactions through regional and overseas exploration and trade (eg, Mongol Empire, African kingdoms, Marco Polo, exploration of the Americas)
Patterns of crises (eg, weather, plague)
World history (emergence of the global age)
Expansion of overseas exploration and trade
Convergence of cultures (ecological revolution)
Renaissance, Reformation and political revolutions in Europe
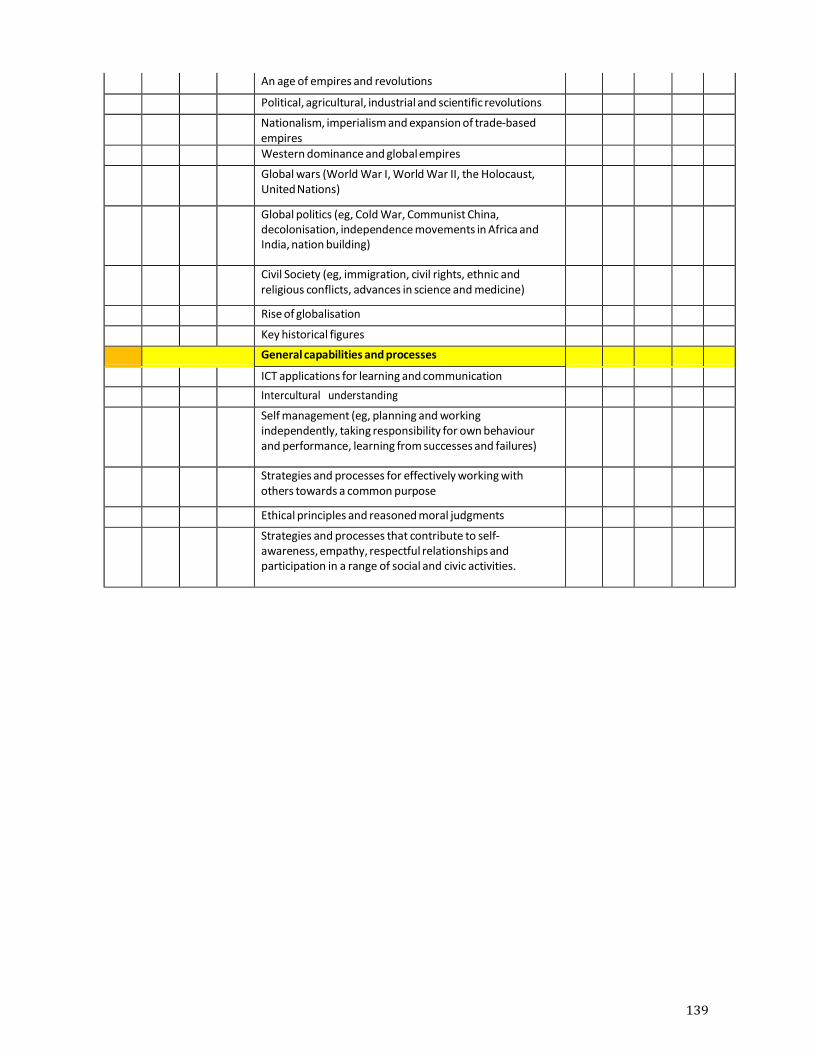
139
An age of empires and revolutions
Political, agricultural, industrial and scientific revolutions
Nationalism, imperialism and expansion of trade‐based empires
Western dominance and global empires
Global wars (World War I, World War II, the Holocaust, United Nations)
Global politics (eg, Cold War, Communist China, decolonisation, independence movements in Africa and India, nation building)
Civil Society (eg, immigration, civil rights, ethnic and religious conflicts, advances in science and medicine)
Rise of globalisation
Key historical figures
General capabilities and processes
ICT applications for learning and communication
Intercultural understanding
Self management (eg, planning and working independently, taking responsibility for own behaviour and performance, learning from successes and failures)
Strategies and processes for effectively working with others towards a common purpose
Ethical principles and reasoned moral judgments
Strategies and processes that contribute to self‐ awareness, empathy, respectful relationships and participation in a range of social and civic activities.


![AudioKarma Database · Created Date: @u� 9� 9� �$ n���]��W���"O�����ë �u� $��u](https://img.pdfslide.us/doc/110x75/60cff17d06f07b16c0377a9d/audiokarma-created-date-u-9-9-nwo.jpg)


![����-��Q�kTitle ����-��Q�k Author ï¿½ï¿½ï¿½Ý t�]�c Created Date �����-�](https://img.pdfslide.us/doc/110x75/60a3a35fc4ece70e851f9842/-qk-title-qk.jpg)


![29 Pieces - Collection of easy pieces [(1st and 2nd grade)] · PDF file3 4 Ï Ï Ï Ï Ï Ï Ï Ï Ï Ï Ï Ï Ï Ï Ï Ï Ï Ï Ï Ï Ï Ï Ï Ï Ï hh. . h. hh. . 3. 3 f 4 4 2 1](https://img.pdfslide.us/doc/110x75/5a74e1047f8b9ad22a8c2b1a/29-pieces-collection-of-easy-pieces-1st-and-2nd-grade-a-3-4-a-a.jpg)