Embed Size (px)
Citation preview

INTERNATIONAL KNOWLEDGE TRANSFER IN THE BIOTECHNOLOGY
INDUSTRY: THE CASE OF AMERICAN AND JAPANESE FIRMS
A DISSERTATION SUBMITTED TO THE GRADUATE DIVISION OF THE UNIVERSITY OF HAW AI'I IN PARTIAL FULFILLMENT OF
THE REQUIREMENTS FOR THE DEGREE OF
DOCTOR OF PHILOSOPHY
IN
INTERNATIONAL MANAGEMENT
MAY 2008
By
Amanda Erin Krueger Budde
Committee Members: Professor Kiyohiko Ito, Chairperson
Professor Dharm Bhawuk Professor Elaine Bailey Professor David Bess
Professor Shuqiang Zhang

We certifY that we have read this dissertation and that, in our opinion, it is satisfactory in
scope and quality as a dissertation for the degree of Doctor of Philosophy in International
Management.
DISSERTATION COMMITIEE
ii

© 2008, Amanda E. K. Budde
iii

ABSTRACT:
This research examines international knowledge transfer and organizational learning in
the biotechnology industries in Japan and the U.S. This study is one of the first to
consider the location of the knowledge resource and that location's relationship with
innovative output in the biotechnology industry. The paper also considers the differences
in industrial environments in which Japanese and U.S. biotech finns compete. Results
suggest that biotechnology finns that look to foreign competitors for knowledge
resources upon which to build have greater innovative outputs than finns that focus only
on knowledge from domestic sources. The findings also suggest that foreign knowledge
has a stronger relationship to overall innovation than does domestic knowledge for both
Japanese and U.S. firms.
iv

TABLE OF CONTENTS
~!;1r~C:1r ......................................................................................... 1"
LIST OF APPENDiCES .......................................................................... vll
LIST OF TABLES •.••••.•..••••••.•..•••.•••..•••••••••••••••....•.••••••••.•.•.•.••...•.••.•••• viii
CHAPTER 1: INTRODUCTION ................................................................. 1
CHAPTER 2: LITERATURE REViEW ........................................................ 5
2.1 The Resource-Based View of the Firm .............................................. 5
2.2 Towards a Knowledge-Based View of the Flrm ................................ 7
2.3 Theories of Knowledge Management ............................................. 9
2.4 Theories of Organizational Learning ............................................ 11
2.5 Theories of Cross-Cultural Management ....................................... 15
CHAPTER 3: HyPOTHESES ................................................................. 18
CHAPTER 4: INDUSTRY OVERVIEW ..................................................... 22
4.1 United States .................................................... ; ....................... 22
4.1.1 Description of Industry ........................................................... 22 4.1.2 State Initiatives to Attract Biotech ........................................... 24 4.1.3 Financing of Industry ............................................................. 26 4.1.4 A Brief History ofthe Biotech Industry In the U.S ...................... 31 4.1.5 Patent Protection .................................................................. 32
4.2 Japan ... I •• I •••••••••••••••••••••••••••••••••••••••••••••••••••••••••••••••••••••••••••••••• 33
4.2.1 Description of Industry .......................................................... 33 4.2.2 Growth in Japan's Industry .................................................... 36 4.2.3 Financing of Industry ............................................................ 37 4.2.4 A Brief History of the Biotech Industry in Japan ........................ 41
CHAPTER 5: PATENT SySTEMS .......................................................... 43
5.1 Development of International Patent Agreements: Europe .............. 44
v

5.1.1 The Paris Convention ............................................................. 45
5.2 Historical Development of Patent Systems: U.S .............................. 49
5.3 Historical Development of Patent Systems: Japan ......................... 51
CHAPTER 6: DATA .............................................................................. 57
CHAPTER 7: ftnETH()DS ••.••••.•....•.•...•.•..••.•••••••.•••..•.••••...•.•••...••.•.•.•.••••• 601
CHAPTER 8: RESULTS ........................................................................ 68
CHAPTER 9: QUALITATIVE EXPLANATI()N: INTERVIEWS ....................... 72
CHAPTER 10: LlftnITATI()NS AND FUTURE RESEARCH ........................... 78
CHAPTER 11: DISCUSSI()N AND C()NTRIBUTI()NS ................................ 84
APPENDiCES .•...•••••••.•...•....•....••..•..••......•.•.•..•....•••....•.•••.•...••••.•....•.•• 91
Appendix A: State Initiatives to Lure Biotech In the U.S ........................ 91
Appendix B: Data Table: Companies and Patents ............................... 106
1r~L.E:!; ................................................•.•.•..•.•....................•.•.•....•.•. 11()
Table 1 .......................................................................................... 110
Table 2 ........................................................................................... 111
Tallie :3 •••••••••••••••••••••••••••••••••••••••••••••••••••••••••••••••••••••••••••••••••••••••••• 112
Table 4 ............................................................................................ 113
Table 5 .......................................................................................... 114
Table 6 .......................................................................................... 115
Table 7 •............................................•••...•.•.•............................•..... 116
Table 8 •••.•••••.•..•.•••....•.•.•....•......•.••••••••••••••••••.••••.•..•..•.•••••.•..•••.••... 118
FtE:t=E:FtE: .. c:E:!; •...••.•.•....................................................••••••••••••.•.••••. 11St
VI

LIST OF APPENDICES
APPENDIX PAGE
A. State Initiatives to Lure Biotech in the U.S ........................................ 91
B. Data Table: Companies and Patents..... .. ... ............ . ... .. . ... .. ...... . .. .. 106
vii

LIST OF TABLES
TABLE PAGE
1. Correlations and Descriptive Statistics for Overall Innovation ............. .11 0
2. Regression Results for Overall Innovation ..................................... 111
3. Regression Results for Foreign Learning vs. Domestic Learning ........... 1l2
4. Descriptive Statistics for Independent Samples t-test ......................... 113
5. Logit Regression Results .......................................................... 114
6. Logit Regression Classification Table ........................................... 115
7. Correlations and Descriptive Statistics for Absorptive Capacity ............ 116
8. Regression Results for Absorptive Capacity ................................... .118
viii

CHAPTER 1: INTRODUCTION
Organizational theorists and scholars of corporate strategy have often occupied separate
domains, despite each area's focus on the organization and how it begins, evolves, learns,
and adapts to changing environments. Some organizational theories stem from a
sociological perspective on how organizations behave in changing environments, how
they come to exist, where they come to exist, and why they come to exist. Some strategy
researchers develop theories to predict and/or assess the activities of the fum, looking at
variables such as location, modes of entry, and fum-specific resources, among others. At
the international level. strategic management aims to look at how, why, where, and when
firms expand beyond their domestic markets, and how they perform when they do so.
Particularly at the international level, strategic management and organizational theory
begins to converge, with each looking at how firms behave and operate in uncertain and
changing global environments, although the two disciplines embed their arguments and
theories in different streams of research.
Scholars of cross-culturaI management have objectives that are interwoven with those of
the above disciplines. Cross-cultural management looks at, among other areas, how
organizations, and the people that comprise them, can best function in a global arena. In
an era in which the term 'globalization' is commonly bandied about in the business news,
cross-culturaI managers aim to understand how to meet challenges and opportunities
arising from the globalization of corporations (House et al., 2005).
I
In much of the scholarly literature, these three areas of study have historically remained
largely in separate domains, with each area often focused on its own history and its own
future development, and with little notice of its sibling areas, although that situation has
begun to change, with more literature including overlapping areas of study. The purpose
of this research is to develop insight into these areas of overlap in the international
transfer of technological knowledge in a relatively new industry, the global
biotechnology industry. Specifically, I argue that firms that are open to foreign
knowledge and that learn from foreign competitors have more overall innovative output
than those firms that make less use of foreign knowledge. This is because firms that
learn from foreign innovation need not waste resources 're-inventing the wheel,' but may
instead build upon existing knowledge to develop new innovations. Firms that are less
open to learning from foreign knowledge sources fail to make efficient use of the
resource of knowledge, and thus must waste resources creating innovations that have
already been developed elsewhere, which negatively impacts those firms' overall
innovation. This dissertation will combine areas of organizational theory with
international corporate strategy and cross-cultural management, looking at theories of
organizational learning, cross-cultural management, the resource-based view of the firm,
and the knowledge-based view of the firm in an effort to study organizational learning
and knowledge transfer within the global biotechnology industry.
This argument has some important implications for scholars of knowledge management
and organizational learning, particularly for those who focus on entrepreneurial industries.
First, the biotechnology (also called biotech) industry is largely an entrepreneurial and/or
2

intrapreneurial industry, characterized by many start-up organizations and entrapreneurial
ventures within larger, existing corporations (also called intrapreneurship). The industry
is still quite new, having begun in earnest in the 1970's, gaining momentum and prestige
in the late 1990's, and its newness presents an important phase of the industry lifecycle to
which to apply theories of knowledge transfer. Much has been written about knowledge
transfer within large multinational companies, which operate in mature industries, but far
less is known about knowledge transfer and organizationailearning in new, emerging
industries. This research attempts to add to the field of strategy's understanding of
knowledge as a resource, and the transfer and use of that resource, in a new and emerging
industry.
Secondly, much of the organizational learning and knowledge transfer literature has been
Ameri-centered, basing studies on American firms and creating theeries of knowledge
management and transfer based on those American firms. The same is true of much of
the existing literature that focuses on the biotech industry. Developing theories in the
U.S., and expecting them to apply to other countries' parallel industries, is a pseudo-etic
approach that should be avoided (Triandis & Marin, 1983). The Japanese biotech
industry, for example, operates with unique legal, social, and economic constraints
(Gassel & Pascha, 2000), and thus must be looked at from an ernic (culture-specific)
perspective, rather than imposing etics (culture-universal) upon this industry.
This dissertation will look at innovation and learning in the form of patent citations, and
will test hypotheses in both samples of American biotech firms as well as of Japanese
3

biotech firms, contributing to the field of international business by adding an
international element to the existing literature. Much of the existing literature on
technology transfer and knowledge flows has considered large firms in mature markets;
there is a lack of research on how knowledge flows operate in entrepreneurial industries.
The importance of knowledge as a resource is highlighted in high-technology industries,
and therefore, the biotech industry represents an ideal sample industry in which to test
our hypotheses.
4

CHAPTER 2: LITERATURE REVIEW
2.1 The Resource-Based View of the Firm
The resource-based view of the finn, first identified by Wernerfelt (1984), has roots in
Penrose (1959) and Rumelt (1962). The resource-based view of the finn emphasizes
capabilities (competencies) and assets that are specific to the finn, and regards those
competencies and assets as a fundamental determinant of finn perfonnance (e.g. Penrose,
1959; Wernerfe1t, 1984; Prahalad & Hamel, 1990; Teece et al., 1997). This view
assumes the heterogeneity of finns, in which the key to successful perfonnance is not
imitating other finns in one's strategic group, but rather, exploiting the differences
between those finns. In essence, the resource-based view of the finn regards the finn as
a pool of resources and capabilities, and looks to these resources and capabilities to
determine the finn's proper strategies (Prahalad & Hamel, 1990), and thus, try to predict
its perfonnance. Indeed, a large body of literature shows the importance of these pools of
resources in predicting perfonnance. Rumelt (1991) compared intra-industry profits to
inter-industry profits, and found that finn-specific resources within an industry were
more important than industry factors. Cool and Schendel (1988) found significant
differences among £inns belonging to the same strategic group, again suggesting the
importance of finn-specific resources. Defining the finn in tenns of its resources, rather
than in tenns of the market, may provide the finn with a stronger basis for strategy
fonnulation and implementation (Quinn, 1992; Grant, 2005). There are many companies
that exemplifY such a definition: ffiM is defined not as a computer company, but as
5

business-processes company; Microsoft defines itself not as a software company, but as a
company that helps people and businesses develop their potential; and Wal-Mart is
defined not as a large low-cost retailer, but as a large company with competencies in cost-
leadership, distribution, and supply-chain management.
It is difficult to look at the firm as a collection of resources without first defining what is
meant by the term 'resource.' For the purposes of this research, I will use Wernerfelt's
(1984) definition of a resource as:
"anything which could be thought of as a strength or weakness of a given finn. More fonnaIly, a finn's resources at a given time could be defined as those tangible and intangible assets which are tied serni-permanently to the finn. Examples of resources are: brand names, in-house knowledge of technology, employment of skilled personnel, trade contracts, machinery, efficient procedures, capital, etc." (Wernerfelt, 1984, p.I72).
Winter (1995) identified two challenges of using resources: the static and the dynamic
aspects. The static aspects involve using a resource to generate profits in the short-run,
whereas the dynamic aspects involve leveraging current resources into favorable future
positions (Stalk et ai., 1992; Nonaka, 1994; Teece et a!.. 1997). The value of those
resources is affected by their abilities to be used as 'stepping stones' to future resources,
and thus, future perfonnance (Wernerfelt, 1984; Winter, 1995). Rodriguez and
Rodriguez (2005) suggest that technological resources provide the finn with innovative
capacity, which is important in creating competitive advantages in international markets.
Lippman and Rumelt (2003) argue that a finn can exploit that advantage through
combinations with outside resources.
6

In the context of the biotechnology industry, these outside resources can be considered to
exist in the form of outside technological knowledge, seen in patents that other £inns hold.
In this patent citation study, we can see that firms can create and exploit competitive
advantages by combining existing internal resources (existing knowledge within a firm)
with outside resources (patented innovations of other firms) to create new resources, in
the form of new technologies and new innovations. The global biotechnology industry is
dependent upon innovation, which creates competitive advantages for firms. It therefore
stands to reason that the more a fum exploits its access to technological resources, the
more innovative and competitive that firm will be.
2.2 Towards a Knowledge-Based View of the Finn
The resource-based view of the fum regards the firm as a collection of assets and
capabilities, and it is the management of those assets and capabilities that gives the firm
its advantages in the marketplace. Some scholars have developed a complementary
theory of the resource-based view, called the knowledge-based view of the firm. While
the resource-based view deals with knowledge as an implicit resource, the knowledge
based view is explicitly concerned with knowledge as a resource of the firm (Nonaka &
Takeuchi, 1995). First specifically discussed by Grant (1996-b), the knowledge-based
view of the firm argues that core competencies that are knowledge-based are enhanced
and expanded as they are used and applied. Firms use knowledge to gain competitive
advantages through learning and knowledge integration (Stata, 1989; Kogut & Zander,
7

1992; Grant, 1996-b) as well as to develop competencies (Prahalad & Hamel, 1990;
Rebentisch & Ferretti, 1995; Alavi, 2001; Mason, 2003). The knowledge-based view of
the firm (Grant, 1996-b; Spender, 1996), which is an extension of the resource-based
view of the firm, posits that knowledge is the most strategically-important resource of the
firm, particularly in high-tech industries (Barney, 1986; Quinn, 1992; Grant, 1996-b).
For high-tech industries in particular, the most important thing is not necessarily that a
firm have proprietary knowledge, per se, but rather, that the firm has the capabilities of
generating new knowledge. Kogut and Zander (1992) discuss 'combinative
capabilities,' which consist of a firm's ability to use existing knowledge to create new
knowledge as well as the ability of a firm to exploit current knowledge. Grant (1996-a)
argues that "knowledge is the preeminent resource of the firm" (p.384). Liebeskind
(1996) concurs, arguing that knowledge is possibly the most important asset that a firm
possesses.
The knowledge-based view of the firm regards the firm as a pool of knowledge assets
that it can use to create additional value (Grant, 2005). The theory views knowledge as
the most important asset of the firm, the asset that contributes most directly to future
performance. As knowledge is the key to sustained competitive advantage, it is vital that
a firm possess not only current knowledge (the static aspect discussed earlier) but also
have the ability to create future knowledge out of the current knowledge (the dynamic
aspect discussed earlier). Moreover, if one firm is better able to develop and protect the
value of its knowledge than are its rival fIrms, that firm will have more incentives to
innovate (Liebeskind, 1996). Additionally, Galunic and Rodan (1998) look at firm
8

innovation as an outcome of the use of knowledge-based resources. The transfer and
absorption of knowledge plays a critical role in a firm's ability to generate high-impact
innovations (phene et aI., 2006).
The issue of developing the value of knowledge is an important one in the knowledge
based view of the firm. The resource-based view of the firm holds that resources are the
defining attributes of the firm. By Wernerfelt's (1984) own definition of resource,
knowledge is an intangible resource. The knowledge-based view of the firm extends the
resource-based view of the firm by focusing on the resource of knowledge specifically,
and argues that the acquisition, possession, and development of knowledge is one of the
most strategically important activities the firm can pursue for sustained competitive
advantage. This technological knowledge, however, is an "invisible asset" (Itami, 1987),
and acquiring it requires a commitment to organizationalleaming and knowledge
management. The knowledge-based view of the firm gives way to theories of knowledge
management, discussed here.
2.3 Theories of Knowledge Management
Kellaway (1999) noted that "companies that are good at sharing information have an
advantage over companies that are not" (p.13). The knowledge-based view of the firm
distinguishes between knowledge generation (creating new knowledge) and knowledge
application (applying the existing knowledge to strategic goals and current opportunities)
(Grant, 1996-b). Understandably, knowledge creation requires different skill sets and
9
organizational processes than does knowledge application, yet in order to achieve a
sustained competitive advantage, a firm must integrate both aspects of knowledge
management. To effectively conduct this integration, there must be some common
processes in the firm that allows people to interact; rules by which specialists can
translate their knowledge to guide the organization, and routines by which knowledge
specialists can combine their knowledge into an organizational process (Grant, 2005).
This view of the firm suggests that firms are "social communities in which individual and
social expertise is transferred into economically useful products and services" (Kogut &
Zander, 1992, p.389).
Nonaka's (1994) theory of knowledge creation highlights the processes of knowledge
conversion: translating tacit knowledge to explicit knowledge, from the individual to the
organization. For knowledge at the tacit, individual level to reach the explicit,
organizational level, knowledge must undergo conversion via four steps. The first step is
socialization, or the sharing oftacit individual knowledge with others in the organization.
The step of externalization involves translating the tacit knowledge of specialists into
useable forms for the organization. In the combination step, explicit knowledge is
converted into more complex forms and spread among members of the organization.
Finally, in the internalization step, the newly created explicit knowledge is now converted
back into an organization's tacit knowledge base for future use and development (Nonaka
& Konno, 1998; Takeuchi & Nonaka, 2004).
10

In his discussion of invisible assets and their impact on corporate strategy, ltami argued
that "an ideal strategy creates a dynamic cycle of corporate growth that is centered on
invisible assets" (Itami, 1987, p.31). Nonaka and Takeuchi (1995) agree that the
"essence of strategy lies in developing the organizational capability to acquire, create,
accumulate, and exploit the knowledge domain" (p.227). From a knowledge
management perspective in the context of the biotechnology industry, it follows that
knowledge is ''the most critical resource" (Nonaka & Takeuchi, 1995, p.227) for a
biotech firm to develop and sustain a competitive advantage, and that such knowledge
must be actively pursued and managed within the organization for improved perfonnance.
While the resource-based view of the firm, its extension in the knowledge-based view of
the firm, and the branch of knowledge management come from the strategy side of
management, the field of organizational theory has much insight to offer on the subject of
knowledge and learning.
2.4 Theories of Organizational Learning
The ability of organizations to learn from outside knowledge sources is an important
factor of internal innovation. Organizations can learn from experience and infonnation
within the organization by analyzing past successes and failures and incorporating that
knowledge into future decisions and developments. Organizations can learn, too, from
other organizations. Organizational theorists have long discussed the vicarious learning
of the organization. Vicarious learning occurs when an organization acquires new
II

knowledge vicariously by observing and copying the successes of other organizations
(Huber, 1991; Campbell, 1994; Levitt & March, 1988; Miner & Mezias, 1996; Lant &
Mezias, 1992). All organizations exist within a population of other organizations, and
through shared experience (tacit and explicit) and observed knowledge development,
organizations within a population can learn from each other. March and Simon (1958)
suggest that most innovation comes from borrowing ideas, which is the process of
vicarious learning, rather than actually inventing new ideas.
For the purposes of this research, I shall use Schwandt's (1993) definition of
organizational learning: "a system of actions, actors, symbols, and processes that enables
an organization to transform information into valued knowledge which in tum increases
its long-run adaptive capacity" (p.8). This definition is concurrent with the previously
discussed concept of using knowledge as a building block to create other knowledge.
Theorists have identified two main strategies of organizational learning: exploration and
exploitation (March, 1991). Exploration involves actively seeking new knowledge to add
to an organization's cache of core competencies or knowledge generation in the dynamic
aspect of the resource-based view (Teece et al .• 1997; Nonaka, 1994). Exploitation
involves seeking ways to improve existing organizational capabilities and leveraging
existing knowledge to increase organizational effectiveness (Jones, 2001). The notion of
exploitation is concurrent with the previously-mentioned concept of the static aspect
(Winter, 1995) of the resource-based view of the firm.
12

Mowery (1983) builds upon the idea of vicarious learning and finds that firms that are
already engaging in research and development (R&D) are better positioned to learn from
external information than are firms that are not actively involved in R&D. This ability to
learn from outside information based upon internal 'readiness' is termed absorptive
capacity. Based on Cohen and Levinthal (1990), this theory discusses the cumulative
nature of absorptive capacity in developing their model of sources of a firm's technical
knowledge, in which a firm's internal R&D, enhanced by the spillover effect of its
competitors' R&D (knOWledge learned vicariously from a firm's competitors) and extra
industry knowledge (technological knowledge learned vicariously from firms outside the
primary industry of a firm), contributes to the focal firm's absorptive capacity, which in
tum, affects the technical knowledge experienced by the focal firm. This model's major
assumption is that the ability to exploit competitors' R&D and extra-industry R&D is
achieved through the focal firm's absorptive capacity (Cohen & Levinthal, 1990). While
this means that a firm's 'readiness' in its own knowledge base affects its ability to both
acquire and use knowledge from its competitors. it also suggests that a firm regularly
scans its industry for outside knowledge. This tendency is higher in uncertain or rapidly
changing environments, and such scanning is critical to organizational performance aild
viability (Elenkov, 1997; May et al., 2000). The biotechnology industry is characterized
by high uncertainty and rapid technological change, so we might expect firms to engage
regularly in industry scanning for outside knowledge. However, in this process of
scanning the industry, Phene et al. (2006) suggest that firms generally limit their searches
for outside knowledge to technology areas that are familiar to them. Such behavior
indicates that firms are indeed limited in their ability to learn from external sources by
13

their absorptive capacity. Boari et al. (2003) found support for the argument that finns
first scan the local environment before looking to more distant environments for external
knowledge.
Combining this organizational learning stream of thought with Kedia & Bhagat's (1988)
and Merton's (1968) ideas that a more cosmopolitan outlook by a focal finn is positively
correlated with the adoption and implementation of new strategies, we can look at the
ability and willingness of the finn to leam from foreign finns as a capability contributing
to overall absorptive capacity.
Finns that have adaptive organizational cultures, those that value innovation and reward
experimentation and risk-taking, and thus, are more open to various fonns oflearning,
tend to have higher perfonnance than those finns whose organizational cultures are inert,
or cautious and conservative (Kotter & Heskett, 1992). Furthermore, research has
indicated that larger finns and higher-perfonnance finns tend to engage in scanning
behavior, searching the external environment for new knowledge, more than smaller
finns do (Aguilar, 1967; West, 1988).
The resource-based view of the finn and the knowledge-basi:d view of the finn suggest
that knowledge is a critical resource for finns. Theories of knowledge management posit
that finns need to actively manage the acquisition of knowledge, and that corporate
strategies need to be centered around the resource of knowledge in order to gain and
sustain a competitive advantage. Yet theories of organizational learning indicate that all
14

finns within an industry are not equally positioned to engage in knowledge acquisition;
intemal factors of the firm affect the ability of the firm to acquire and use information.
Thus, in one industry, such as the biotechnology industry, one would expect differences
among firms in their ability to absorb and use outside knowledge. National culture may
magnify these differences.
2.S Theories of Cross-Cultural Management
In addition to organizational culture determinants of technology transfer (absorptive
capacity, adaptive risk-embracing organizational cultures. cosmopolitan outlook),
researchers have also found that national culture can affect knowledge transfer (e.g:
Koizumi, 1982; Zaitman, 1983; Kedia & Bhagat, 1988; Michailova & Husted, 2003;
Awny, 2005; May, Puffer, & McCarthy, 2005). Zaltman (1983) identified an
organizational behavior called knowledge disavowal, a process of selectively ignoring
incoming information that might cause significant changes in the recipient organization.
Kedia and Bhagat (1988) suggested that culture can influence technology transfer across
nations, both in terms of a recipient organization's willingness to import the technology,
as well as in the absorptive capacity of the receiving organization. This notion of culture
affecting absorptive capacity suggests that cultural and/or national biases might impede
an organization's capacity to absorb new technological knowledge, thus adding an
additional variable to the theory of absorptive capacity. This variable suggests that a firm
that shows a willingness to accept outside technical knowledge would have a greater
absorptive capacity, and thus, a greater innovation record, than a firm that allowed
15

cultural biases to prevent that acceptance. Indeed, Chesbrough (2003) posits that
abandoning the 'not invented here' thinking patterns that dominate many industries, an
attitude which encourages finns to rely on internal resources rather than make use of
external innovation, is key to improved performance.
Almeida and Kogut (1997) looked at the diffusion of technological knowledge in the
semiconductor industry and found that technological knowledge tends to remain localized
byphysicallocation. Almeida (1996) stated:
"interviews held with executives of several foreign firms revealed that the primary reason for their plant's location in Silicon Valley was to keep track of advanced technological developments and expand the finn's knowledge base beyond that existing in their home country. Foreign finns can, therefore, be expected to source local knowledge even more than host country firms located in the same region." (p.157).
Stuart and Podolny (1996) found that organizations will usually use a local search when
looking for new knowledge, rather than branch out beyond their own areas. Other
scholars have found that nation.al culture shapes how new organizational knowledge is
created, used, and distributed (Bartholomew, 1997; DeLong & Fahey, 2000; Frost, 2001;
Tallman & Phene, 2002; Awny, 2005; Phene et al .. 2006).
Kedia and Bhagat (1988) speculate that "individualistic cultures are better able both to
generate and to import technological advances" (p.565). In Hofstede's 1980 study of
culture, as well as in the GLOBE project's 2004 study, the U.S. ranks much higher on the
construct of individualism than does Japan. (Hofstede, 2001; House et al .• 2004).
However, the authors also suggest that masculine cultures, defined as societal acceptance
16
of dominant gender roles of masculine aggressiveness and female nurturance (Hofestede,
2001), engage in more aggressive technology transfer than do less masculine cultures,
most likely because of the societal expectation of aggressiveness and competitiveness
present in masculine cultures. Japan ranks higher on a masculinity scale than does the
u.s. (Japan ranks first in masculinity in Hofstede's index, whereas the U.S. ranks 15th.)
All of this suggests that national culture is expected to impact cross-border knowledge
transfer in the biotechnology industry.
The above schools of thought have much to say about the importance of knowledge as a
resource for the firm, particularly for large and established firms. but gaps remain in the
literature that need to be addressed for a more comprehensive understanding of how
knowledge is acquired and used in new and emerging industries, such as the
biotechnology industry. Moreover, there are gaps in the literature regarding cross-border
vicarious learning and knowledge transfer in entrepreneurial industries. Furthermore,
there are gaps in the literature regarding our understanding of how the location of
knowledge affects high-tech industries. This research attempts to fill some of those gaps.
17

CHAPTER 3: HYPOTHESES
The discussed theoretical streams lead to several hypotheses. Combining the resource
based view of the firm, the knowledge-based view of the firm, the branch of knowledge
management. and the discussed theories of vicarious learning and absorptive capacity,
this research identifies international knowledge in the biotech industry as an important
resource for biotech firms. In this study, international knowledge is defined as patent
citations from countries other than a finn's home country. An organization that engages
in more learning will be more innovative than an organization that engages in less
learning. Companies that can absorb knowledge from competing companies, particularly
from foreign competitors, need not waste resources 're-inventing the wheel.' Those finns
can build upon innovations that their foreign counterparts have already achieved, and
thus expedite the 'stepping stone' process of knowledge creation that Wernerfelt (1984)
discusses.
The following hypotheses will look at the biotechnology industries in the United States
and Japan. While the U.S. holds the majority of the world's market share in
biotechnology innovation, Japan's government has recently taken action to encourage its
own biotech industry, identifying 'catching up with the United States' in the biotech
industry as a goal. The two countries' biotechnology industries have many differences.
including size, output, and entrepreneurial versus intrapreneurial perspectives. To test all
hypotheses, patent citation data will be used to track the global transfer of knowledge in
the industry, and will stand as a proxy for learning. A more detailed explanation of the
18

choice of patent citation data is included in the Data section of this dissertation. (See
Chapter 6).
As discussed earlier, the more open a firm is to using external knowledge resources, the
more innovative that firm will be, based upon the resource-based view of the firm, the
knowledge-based view of the firm, and theories of knowledge management. While
learning from one's domestic peers represents active knowledge search within an
industry, incorporating knowledge sourced from one's foreign competitors represents a
greater outward search for knowledge, thus giving a firm access to greater amounts of
external knOWledge. Therefore, I expect:
HIa: A higher number offoreign patent citations is positively assodated with total overall innovation for a Japanese biotech company.
HI b: A higher number of foreign patent dtations is positively assodated with total overall innovation for an American biotech company.
HIc: Foreign learning will have a stronger relationship with overall innovativeness than will domestic learningfor all biotechnology companies.
The knowledge-based view and resource-based view of the firm suggest that a firm will
rationally act to scan the industry for external innovation, as knowledge in the biotech
industry is highly based on the combination of knowledge from external sources,
including outside industries and geographic locations (Quere, 2003; Christensen, 2003;
Phene et al .. 2006). The biotechnology industry, with its rapid technological change,
relies upon external sources of knowledge to maintain competitive advantages. These
19

external sources are vital to innovation, which in tum, is vital to sustained profitability
(powell et al., 1996; Shan & Song, 1997; Roberts, 1999, Phene et al., 2006). The
resource-based view suggests that finns will avoid spending precious resources 're-
inventing the wheel,' so I expect finns to scan the industrial environment for external
knowledge upon which finns could continue to build.
It is at this point, however, that the cross-cultural management literature adds its input to
this line of thought. While the resource-based view suggests that finns will act to build
useful resources (defmed as knowledge in this case), cross-cultural management theories
suggest that learning and technology transfer may be limited by both national culture and
ethnocentrism (Durnell & Hinds, 2005). Ethnocentrism is defined as an outlook in which
one's own in-group is the center of everything, and other groups are measured against
that in-group (Sumner, 1906). If, indeed, biotech firms limit their industry scanning to
local searches, then they may overlook potential existing knowledge in other countries,
and must therefore spend additional resources creating knowledge that has already been
created elsewhere. A 'not invented here' ethnocentric perspective suggests that firms
would look to finns in their home country first to vicariously learn. Thus, the learning in
biotechnology might be ethnocentrically-biased. This leads to:
H2a: Japanese firms cite other Japanese innovations more than U.S. firms do.
H2b: Americanfirms cite other American innovations more than Japanese firms do.
20

Looking at absorptive capacity's role in learning and innovation, (the 'internal readiness'
factor), we see that new knowledge and experience build upon previous knowledge and
experience. Ifknowledge is a 'stepping stone' resource, as Wemerfelt (1984) posits, and
if scanning the global environment for useable innovations that a finn can build upon can
give a focal fIrm an innovative advantage, as Chesbrough (2003) suggests, and if fIrms
learn from previous experience, then I expect:
H3a: A higher number of foreign patent citations in one year is associated with a higher number of foreign patent citations in the following year for a Japanese biotech company.
H3b: A higher number offoreign patent citations in one year is associated with a higher number offoreign patent citations in the following year for an American biotech company.
H3c: A higher number of foreign patent citations in one year is associated with a higher number offoreign patent citations in the following year for all biotech companies.
21

CHAPTER 4: INDUSTRY OVERVIEW
4.1 UNITED STATES
4.1.1 Description ofIndustry
The global biotechnology industry produced revenues ofUS$73.5 billion in 2006. The
United States, the world's leader in the biotech industry, accounted for nearly 75% of
those revenues, with $55.5 billion. There are 4,275 biotechnology companies worldwide,
both publicly traded as well as privately held. of which 1,452 are located in the United
States (VanArnum, 2007), employing approximately 200,000 people (Zhang & Patel,
2005). The number of publicly traded biotechnology companies in the U.S. totaled 336
in 2006 (VanArnum, 2007). Most of these companies, both private as well as public, are
small, start-up companies, employing fewer than 150 people. The small size of the
companies notwithstanding, the biotech industry plays a small-but-mighty role in the
economy, working in partnership with phannaceutical companies to develop new drugs;
with the government, developing military, public health, and waste disposal products; and
with agriCUltural companies, helping to create greater crop yields and stronger crops.
These roles are in addition to other avenues of application for the industry's products,
which include marine and environmental science as well as medical processes and
devices, among others.
22

Despite posting such impressive revenues, the U.S. biotech industry still posted a net loss
of nearly $3.5 billion in 2006, a 150% increase over its net loss of$1.4 billion in 2005.
However, much of this loss can be attributed to a few important acquisition charges,
including Novartis's acquisition ofChiron, and Abbott Laboratories' acquisition ofKos
Pharmaceuticals, which reduced the industry's net profits. Absent those deal-related
charges, the subset of publicly traded biotech finns in the U.S. would have posted a net
profit for the first time in history. In fact, profitability is predicted in the U.S. before the
end of the decade by Mike Hildreth, a biotechnology leader for Ernst and Young
(VanArourn,2007).
There are four major biotechnology regions in the United States: Boston, Massachusetts;
San Francisco, California; San Diego, California; and Research Triangle Park, North
Carolina (Cohen, 2003). Boston, horne to nearly 300 biotech companies, has
approximately 5,000 scientists working in the biotechnology industry, the highest per
capita concentration of life scientists on the planet. San Francisco has 3,100 life
scientists working within its borders, followed by Research Triangle Park in North
Carolina, with 1,430 (Bergeron & Chan, 2004).
Many states are trying to attract more biotechnology business. A 2006 report on state
biotech initiatives indicates that all 50 states are involved in attempting to lure
biotechnology finns, and biotechnology money, to their respective state. The reason for
this activity is simple: biotechnology brings research money, and it also creates jobs. A
2006 report for the Biotechnology Industry Organization (BIO) found that each job in the
23

biosciences in the U.S. creates 5.7 more jobs in the overall economy (Battelle, 2006).
The average salary of employees in the biotechnology sector vastly exceeds that of the
average wage in the greater U.S. economy: the average annual salary of workers in the
biotechnology sector in 2004 was $65,775, which is $26,000 more than average U.S.
wages in the overall economy for the same year. As states wish to both increase their tax
base by luring higher paying jobs to their borders, as well as create more jobs·within
those borders and provide a better quality oflife for their citizens, state governments in
the U.S., as well as Puerto Rico, are attempting to attract biotechnology to their states via
governmental initiatives and development plans. These strategies include such things as
investing in R&D facilities, encouraging industry-university alliances by funding
collaborative projects, offering funding via direct investment programs, and providing
infrastructure for research, among other actions. The following section presents a brief
summary of those state initiatives. (For a more detailed state-by-state analysis, see
Appendix A.)
4.1.2 State Initiatives to Attract Biotech
All 50 states, plus Puerto Rico, are actively trying to lure biotechnology business to their
states, and to support and encourage the biotech business that already exists within their
states. Cornmon initiatives include state funding for buildings and facilities in
partnership with state universities, state-funded grants for biotech research projects, and
tax credits for firms that operate within the biotech industry, as well as for venture capital
funds that invest in biotechnology. In December of2oo5, New Jersey became the first
24

state to provide state funding for research on human embryonic stem cells. However,
many states still oppose human stem cell research, which is considered to limit the
attractiveness of those states for biotechnology. Florida is an example of such a state:
under former Governor Jeb Bush, the state brought forth many initiatives to stimulate
biotechnology research in Florida, as well as to attract biotechnology businesses to the
state. Unfortunately, the government's unwillingness to embrace human stem cell
research handicapped the effectiveness of those initiatives.
Many states restrict research on aborted embryos, although Louisiana is the only state
that specifically forbids research on all embryos. Arkansas. Indiana, Michigan. and
North and South Dakota all forbid research only on cloned embryos. New Jersey, New
York, California, Connecticut, nIinois, Iowa, Massachusetts, and Rhode Island, while
banning reproductive cloning, all allow cloning for research purposes. Many states,
including Missouri, Arizona, and Nebraska, limit the use of state funds for stem cell
research. However, several states have lifted bans on governmental funding of stem cell
research, and now appropriate state funds for such research. These states include two of
the three major "biotech cluster" areas--California and Massachusetts. The other states
that offer state funds for stem cell research include Connecticut, New Jersey, llIinois,
Indiana, Maryland, and New York.
Not all biotechnology research involves stem cells; in fact, the majority of this research
does not use human stem cells. However, an open and supportive legal environment for
all biotechnology research helps states to attract new biotechnology ventures to their
25

borders, which may offer one explanation for why New Jersey is quickly catching up to
the other three biotechnology clusters in the U.S. The subject of state funding is an
important one: biotechnology research success depends upon funding, and governments
provide some of that funding. The following section describes the fmancing of the
biotechnology industry in the U.S.
4.1.3 Financing ofIndustry
The biotech industry in the United States began in university and government laboratories,
and from its inception. the industry consisted of academic scientists working towards
technological breakthroughs as well as towards gaining financial rewards for their
discoveries (Owen-Smith et al .• 2002). Therefore, small biotech firms were originally
located close to universities and research institutions. Biotechnology requires a great
deal of capital, and the capital markets in the U.S. were ideal for financing biotech
ventures. First, the U.S. government funded (and continues to fund) biotech research and
development through various governmental departments and programs. Secondly, state
governments have been active at providing funding to biotech research, particularly by
supporting state universities and university-industry alliances. Thirdly, the profit
potential of biotechnology breakthroughs attracted (and continues to attract) venture
capitalists and private investors and institutions to the industry (Robbins-Roth, 2000;
Zhang & Patel, 2005). Additionally, the Bayh-Dole Act of 1980 allowed companies and
non-profit organizations, such as universities, to patent inventions that were financed
26

with government grants and contracts, which further helped to develop the U.S. biotech
industry by allowing university spin-off companies (powell & Owen-Smith, 1998).
The importance of venture capital to this industry cannot be overemphasized. Venture
capital plays an important role in this industry, especially in the U.S. It is estimated that
40% of the total employment in the biotechnology industry in the U.S. in 2006 was tied
to companies that began with venture capital funding. U.S. biotech companies backed by
venture capital in the U.S. increased their employment base by 9.2% between 2003 and
2006, far in excess of the overall industry employment growth rate of 4.3% during that
time period (Platzer. 2007). Biotechnology attracted more venture capital in the first
quarter of 2007 than did any other sector, including semiconductors, entertainment, and
telecommunications (Pricewaterhouse CooperslNational Venture Capital Association
MoneyTree report, 2007). This is good news for the biotechnology industry, as its capital
needs are so great for both start-up costs as well as ongoing research that the ability to
attract venture capital money is often a life-or-death battle. "Virtually the entire
biotechnology industry and most of the significant breakthroughs in the (U.S.) medical
devices industry would not exist without the support of the venture capital industry"
(platzer, 2007, p.3).
The percent of biotech-related venture capital investments rose from 10.3% in 1995 to
17.6% in the first quarter of2007, compared to 1.5% in the computing sector, 6.2% in
semiconductors, and 7.9% in telecommunications (Ante & Mehring, 2007). This
percentage translates to a real dollar amount of $1.5 billion during the first quarter of
27

2007, in 102 separate deals, to fund biotechnology companies. National Venture Capital
Association President Mark G. Heesen explained the rise, by pointing out that many
venture capital finns are responding to the needs of more mature biotech finns that are
beginning the regulatory process ("Biotech Garners Largest Share of V enture Capital,"
2007).
Excluding the medical devices segment from the overall biotech sector, more than 420
biotech deals received venture capital funding in 2006, totaling US$4.5 billion. This
level of funding is the highest in the industry's history, as evidenced by the following
chart:
fi!!!: Deals VC Investment
1998 280 $1.6 billion
2000 351 $4.3 billion
2002 302 $3.2 billion
2004 362 $4.3 billion
2006 423 $4.5 billion
(Pricewaterhouse CooperslNationai Venture CapItal AsSOCIation MoneyTree report, 2007)
Venture capital-backed biotech finns had a much greater tendency to launch successful
initial public offerings (IPO's) in 2006 than did non venture capital-backed (platzer,
2007). However, going public is still a difficult path in the U.S. Only 13 biotech finns
managed to go public in 2005, fewer than half the number (28) that went public in 2004
28

(Weintraub,2006-b). U.S. biotech companies often have larger amounts of venture
capital investment per venture capital firm, more venture capital firms investing in them,
as well as more venture capital firms with biotech experience than do Japanese biotech
firms (Ang, 2006).
Access to venture capital and public funding is essential for biotechnology firms to begin
in the U.S., but there are more financing issues to consider. Few firms can remain small,
privately-owned, and still have access to the huge amount of capital that is required for
ongoing research. Once a biotechnology firm begins to achieve success in the U.S., there
are generally two options for the firm to remain successful: 1) the firm can launch an IPO,
or 2) the firm can acquire or be acquired by another firm. For much of the history of the
industry in the U.S., the IPO was seen as the more successful option. "For biotech
entrepreneurs and the venture capitalists who back them, a public stock option has long
been the Holy Grail of financial success" (Behnke & Hultenschmidt, 2007, p.78).
However, in recent times, more firms are opting to go the second route, by being acquired
by other firms, either biotecl;! firms or pharmaceutical firms. Biotech firms hoping to
launch successful IPO's must have advanced developments in their pipelines to attract
willing investors. In years past, a product in a Phase I clinical trial might have been
sufficient to attract investors; now, investors expect revenues from existing products as
well as major partnerships and developments in Phase III clinical trials from firms going
public (Behnke & Huitenscmidt, 2007). Therefore, being acquired (called a 'trade sale')
by another firm offers in-flows of needed money without the stringent requirements
29

investors demand, perhaps years before the finn might be considered for a successful
public launch.
The established pharmaceutical industry, often called Big Pharma, has reasons to acquire
smaller biotech firms, as well. Big Pharma has many successful products coming off of
patent protection in the coming few years, and few of the Big Pharma companies have
enough products in their pipelines to replace those revenues. The pharmaceutical
industry's need for new drug launches has inspired the industry to turn to biotechnology
as a source of new innovation. This inspiration is evidenced by trends in biotech
acquisitions: the median value of biotech acquisitions has risen from $50 million in 2001
to $ I 70 million in 2005 (Behnke & Hultenscmidt, 2007). Recent (2006-2007) deals
include Pfizer's acquisition ofRinat, Merck's acquisition ofGlycoFi, Amgen's
acquisition of Avidia and Abgenix, Gilead's acquisition ofCorus, and Genentech's
acquisition of Tanox.
In countries other than the U.S., and especially in Japan, it can be difficult for a newly
formed biotech firm to attract investors. In the U.S., a favorable environment does exist
for biotech firms launching IPO's. However, being acquired by a larger finn is a viable
option for a start-up biotech, as well, and the U.S. has many large biotech and
pharmaceutical finns that are looking to enhance their product pipelines by acquiring
smaller biotech firms. Thus, there is a great deal of funding opportunity for the
biotechnology industry in the U.S. The combination ofiegislation, funding, and
university-industry alliances has made the business climate in the U.S. very favorable to
30

the biotechnology industry, and the U.S. has enjoyed a first-mover advantage in many
areas of biotechnology.
4.1.4 A Brief History of the Biotech Indnstry in the U.S.
The biotech industry in the U.S. truly began in 1976, with the founding of Genentech, the
first biotechnology company based on recombinant DNA technology. In 1980, the global
biotechnology industry had its first IPO, with the launch of Genentech. The stock opened
at $35 a share, and within one hour, had sprung to $89 a share, closing that day at $71.25.
In 1978, scientists at Genentech cloned human insulin, which allowed patients needing
insulin to take human insulin, rather than the pig protein previously used, thus lessening
the side effects and allergic reactions some patients had previously experienced. The
company licensed this technology to Eli Lilly, which received FDA approval to sell this
drug (the very first genetically engineered drug) in 1982. In 1980, the federal government
passed the Bayh-Dole Act, enabling non-profit organizations. such as universities, to
patent inventions that were financed with government grants and contracts. This allowed
university scientists to spin off companies based on research they had conducted at their
universities and to commercialize their research. This Act was a catalyst for the entire
industry, spawning many biotech companies in its wake, including Amgen, which was
founded in 1980.
In 1986, Cbiron received FDA approval for the first genetically engineered vaccine,
aimed at hepatitis B. In 1988, the Harvard Oncomouse, a mouse genetically engineered
31

to be a model of human cancer, became the first living mammal to receive patent
protection in the world. In 1990, the Human Genome Project was launched, which was an
international effort to sequence the entire human genetic library to create a map of all the
genes in the human body. This effort was funded by the international community as well
as the U.S. Department of Defense. The project had its first major success ten years later,
in 2000, with the completion of the first draft of the human genome sequence by the
Project and Celera Genomics.
4.1.5 Patent Protection
Biotechnology produces intellectual property as its product. This intellectual property
needs protection for commercialization. The U.S. is widely recognized to have the most
liberal protection for biotechnology products in the world. (For more on this topic, see
Chapter 5.) The United States Supreme Court has avoided ruling on patent issues in
recent decades, but once again considered questions of patents in 2007. On April 30,
2007, the U.S. Supreme Court ruled unanimously to change the standard of obviousness
for patents. (per U.S. law, for an innovation to receive patent protection, that innovation
must be non-obvious, be new, and have some utility.) Until recently, lower courts have
been fairly lax in assessing obviousness, allowing patents on innovations that many
people have argued should not have received patent protection due to the obviousness of
their nature. Justice Kennedy, writing the opinion of the Court, reasoned:
"If the combination results from nothing more than ordinary innovation and does no more than yield predictable results, it is not entitled to the exclusive rights that patent protection conveys. Were it otherwise, patents might stifle, rather than promote, the progress of useful arts ... Granting
32
patent protection to advances that would occur in the ordinary course without real innovation retards progress." (Greenhouse, 2007).
Patent lawyers, particularly lawyers involved in the field of biotechnology, have
expressed concern over this ruling, suggesting that the ruling may increase rejections of
biotechnology patent applications by patent examiners on the grounds that most
biotechnology innovation is a combination of known chemicals and techniques
(Morrissey, 2007). However, as the ruling is relatively new, the true impact of the
change on the U.S. biotechnology industry remains to be seen. In the meantime, the U.S.
is still regarded as the best, and first, place to file biotechnology patents ("Biotech
Warriors," 2007).
4.2 JAPAN
4.2.1 Description ofIndustry
What little that has been written about Japanese biotechnology in English has been
concerning international biotech alliances, and assumes that the Japanese biotech industry
operates in the same manner as does the American biotech industry. However, the
Japanese biotech industry operates in a unique organizational field, which is quite
different from that of its parallel industry in the U.S., and must work under different legal,
social, and economic constraints (Gassel & Pascha, 2000). One area of difference is the
network of firms involved in the industry. The American biotech sector, and to a lesser
extent, the European biotech sector, is generally made up of many small start-up firms
33
and university-industry alliances, whereas the Japanese biotech industry is less defined as
its own sector, and is made up of both start-up firms as well as large firms from different
areas of industry that have diversified into the biotechnology arena via intrapreneurship.
For example, Japan Tobacco entered the biotech arena in the 1980's, as did Kirin
Brewery, Japan's largest beer producer. In Japan, there are approximately 800 firms
related to biotechnology (Muller et a1., 2004), 464 of which are considered small-to
medium sized start-up firms (Japan Bio Industry Association, 2005). These firms stand
in contrast to large, diversified multinational corporations, such as Japan Tobacco, which
have roots outside of biotechnology, and entered into the industry via internal new
venturing. Of the 464 biotech start-up firms, only 12 firms were publicly traded as of
2004.
When Japanese firms interested in biotech choose to collaborate with international
parmers, they usually do so with American start-up biotech firms (Gassel & Pascha,
2000). International collaboration is becoming more common. In fact. Japan has
additional reasons for choosing to collaborate with American partners-Japanese biotech,
while ranking among the top biotech industries in the world, lags far behind the biotech
industry of the U.S., in terms of output, number of firms, and revenues generated. The
reasons for this lag are varied, but include the traditional arrangement of the keiretsu
system. the financial and legal impediments to start-ups, a lack of cooperation between
firms and universities, and a social climate that discourages risk (Gassel & Pascha, 2000;
Muller et a1., 2004; Rowen & Toyoda, 2002). The Japanese government has recognized
some of these problems, and is taking steps to try to make the Japanese entrepreneurial
34

environment more favorable to biotech. The Japanese government identified
bioteclmology as one ofthe IS key sectors for future development as part of its Action
Plan for Economic Structural Reform, which is a governmental initiative first unveiled in
1997, then revised again in 1999 and 2001, which identified goals and outlined necessary
steps for economic stimulation and reform. Additionally, Japan has recently developed a
favorable environment for biotech !POs, and biotech firms may consider opening up
businesses in Japan merely to take advantage of this favorable climate (Borrell, 2005).
The Japanese government has increased its investment in biotech research and
development in recent years, with amounts reaching US$4.3 billion in fiscal year 2002.
The government has identified a goal of having the biotech industry employ between
70,000 and 80,000 people by 2010. This goal further supports Hypothesis 180 that a
higher number of foreign patent citations is positively associated with total overall
innovation for Japanese biotech company, by suggesting that Japanese biotech firms will
make full use of existing knowledge so that they can avoid 're-inventing the wheel' and
instead, focus on "using a perfectly good wheel to build a better vehicle" (Chesbrough,
2003, p.4).
Additionally, the regulations controlling the biotech environment in Japan have changed
recently, with new regulations allowing professors from public universities to retain their
university positions while simultaneously becoming corporate executives. Prior to this
regulatory change, some universities were kept frozen out of the biotech arena in Japan
by rules preventing dual roles among publicly funded university facu1ty. This change is
expected to stimulate new biotech companies in Japan, with faculty branching out to start
35

and/or participate in biotechnology new ventures (Rosen, 2003). A 2004 study of 51
member companies of the Japan Bioindustry Association (JBA) asked member
companies why Japan lags behind the U.S. in biotech. Over half of the respondents listed
America's emphasis on active university-industry cooperative actions, the high number
of biotech venture firms in the U.S. compared to Japan. and greater research funding in
the U.S. compared to that of Japan (Lynskey, 2004). Japan's recent reforms in
encouraging university-industry cooperative projects and governmental funding
initiatives for the biotech industry may well stimulate Japan's biotech firms to achieve
greater innovative output. This expectation is consistent with both Hypotheses la and 3a.
If Japanese firms increase their levels of foreign learning, evidenced by their patent
citations, then overall innovation should increase (HI), which will increase each firm's
absorptive capacity, which will in turn encourage yet more foreign learning (H3).
4.2.2 Growth in Japan's Industry
Japan's biotechnology industry, while not as large or as well-funded as the U.S. biotech
industry, ranks as one of Japan's fastest-growing industries. According to a 2005 report
by the Japan External Trade Organization (JETRO), Japan's biotechnology market in
2003 was estimated at ¥1.66 trillion. Its 2006 total revenues are estimated at ¥1.8 trillion,
indicating steady growth. However, according to Japan's Bio Industry Basic Statistics
report released in March 2005, the bio market in Japan was estimated at ¥7. 724 trillion,
which shows the difficulty of accurately assessing the market value of this industry. This
2005 report suggested, however, that the overall market would remain at approximately
36

that ¥7.7 trillion level over the following five years, (through 2010), based upon a survey
conducted on biotech-related companies in Japan, conducted by MET! (Ministry of
Economy, Trade, and Industry). Additionally, the number of biotech start-up firms has
grown substantially in recent years, from 333 firms in 2002 to 464 frrms in 2005 (Japan
Bio Industry Association, 2005). This number may be partly due to govermnental
initiatives aimed at encouraging entrepreneurs to start companies, as well as changes in
the market system. However, in early 2005, some companies' initial public offerings in
Japan went awry, leading to some predictions of stagnant growth. Effector Cell Institute
Incorporated went public on March 29, 2005 on the Nagoya Stock Exchange's Centrex
market for start-ups, but the company's stock closed down ¥170,OOO the very next day, a
disappointing initial public offering.
4.2.3 Financing ofIndustry
Biotecbnology is' a capital-intensive industry, and returns on investment can be slow in
coming. Biotech companies often have long embryonic periods with little or no profits,
accompanied by high fixed costs, and therefore depend on venture capital companies to
provide financial backing. Investment in this industry could be characterized as being
'high risk, high return,' as many innovations fail to be successfully commercialized, and
those few that do succeed often take many years to become profitable. In the U.S.,
biotech firms rely on venture capital firms to fund their research and development.
However, access to venture capital, particularly in the area ofbiotecbnology, in Japan is
quite limited (Ang, 2006). Many Japanese venture capital companies (VC's) are
37

subsidiaries of banks or security companies, and the scale of funds available for life
sciences venturing is much smaller than in the U.S. Additionally, there are far fewer
VC's in Japan than in the U.S., and of those, a limited number focus on biotechnology.
There are six major biotech-focused VC companies in Japan. The first is Softbank
Investment Corp, with four funds. These four funds include Bio Vision Life Science
Fund Number I, established in Dec 2003, with ¥4.2 billion. This fund tends to invest in
mature biotech companies, with products already emerging from the product pipeline.
Bio Vision Life Science Fund Number 2, established in 2005, with ¥1.5 billion, leans
more heavily toward early-stage companies. Additionally, the firm has two other funds,
the SBI Bio Life Science Limited Liability Partnership, with ¥5.6 billion, and the SBI
Life Science Technology Investments, with ¥5.8 billion.
The second biotech-focused VC company in Japan is Bio Frontier Partners, with five
funds, and a total investment of¥12.37 billion. The firm's five funds include the
Biofrontier Global Investment Partnership, established in March 2000, with ¥5.5 billion;
the Summit Bio Technology Japan Investment Partnership, established in July 2001, with
¥3 billion; the Osaka Life Science Investment Limited Liability Partnership, established
September 2001, with ¥2.l billion; the Biofrontier Number i Global Biotechnology
Investment Business Association, established in April 2005; and the Okinawa
Development Venture Fund Investments Limited Liability Partnership, which was
established in March of2006. ReqMed Company has the oldest fund, the Life Science
Investment Partnership, established in February of 2000, with ¥3.4 billion. The firm has
a second fund, the Life Science Investment Limited Liability Partnership, established in
38

February of 2004, with ¥1.2 billion. Japan Asia Investment Corporation has three funds,
one of which was established in September of2000 (the JAIC Bio Number I Investment
Limited Partnership), with ¥1.5 billion; one established in August of2004 (the UDB Bio
Fund); and one established in April of2005 (the JAIC Bio Number 2 Fund, with¥2.1
billion.)
Biotech-Hea1thcare is the fifth biotech-focused VC in Japan, with its Biotech-Healthcare
Number I Investment Business Limited Partnership, established in January 2001, with ¥3
billion. The sixth biotech-focused VC in Japan is Pacific Rim Ventures, with its Akita
Academy Venture Investment Partnership Fund, established in April 2004, with ¥620
million.
With only six major VC firms focusing on biotechnology, funding of private research and
development in Japan is minimal. DECD Main Science and Technology Indicators show
that this level is around 0.8% as of2003, which has decreased from 1.8% in 1995
(Woolgar,2007). This trend encourages start-up firms to IPO as quickly as possible,
which may not be a successful strategy. Governmental initiatives also provide for
funding in this industry. The Ministry of Economy, Trade, and Industry (MET!) is
encouraging university spin-off venture companies in biotechnology. By the end of 2005,
there were 421 biotechnology university spin-off venture companies. To help promote
further growth, METI has been promoting two major programs, both of which cover
biotech start-ups. The first is an industrial technology application support program, with
39

¥6.5 billion, which is a competitive fund that provides subsidies to seed technologies that
are expected to be commercialized within three years.
The second is a regional consortium research and development program, with ¥13. 7
billion, which is a competitive fund that provides subsidies to develop seed technologies
of up to ¥30-100 million per year, for up to two years. Govermnent funding for science
and technology reached ¥3.8 trillion in 2006, as an implementation of the Third Science
and Technology Basic Plan. This plan, which covers the period of2006 to 2010,
provides for more funding of scientific research, emphasizing the importance of basic
research. The plan will cost ¥25 trillion over the five-year period, and focuses on four
primary fields: life sciences, nanotechnology, information and communications, and
environmental research. In 2006, the budget allocation for these four industries showed
life sciences receiving the most support, with ¥5 trillion, followed by information and
communications, with ¥2.l trillion, then environmental research, with ¥1. 7 trillion, and
lastly, nanotechnology, with ¥1.1 trillion. The Ministry of Education, Culture. Sports.
Science, and Technology (MEXT) provides the largest amount of funding for scientific
research, with 63% of the total science and technology budget, followed by the MET!,
with 16.4% of the budget, and the Self Defense Agency, with 5%. Also contributing are
the Ministry of Health, Labor, and Welfare; the Ministry of Agriculture, Fisheries, and
Food; and the Ministry of Land. Infrastructure. and Transport.
This Science and Technology Basic Plan emphasizes the importance of basic research,
but also notes the necessity of development of that research. Other govermnental efforts
40

at encouraging biotechnology include the 1998 legislation granting investors limited
liabilities, in an effort to boost investment in the life sciences by venture capitalists, and
the restructuring of the markets for emerging stocks, making it easier and faster for
companies to conduct IPO's. The application approval time for an IPO has been reduced
from several years to one or two months (Kandachi. 2003).
4.2.4 A Brief History of the Biotech Industry In Japan
Although many Japanese firms have conducted bioscience research, firms focusing on
biotechnology in its own right are relatively new in Japan. For example, Kikkoman has
done agricultural research for decades, perfecting the quality of the soybeans and wheat it
uses in its soy sauce, but only branched into biotechnology in the 1980's, establishing
laboratories to use biotechnology to create new seasonings and new foods and developing
food enzymes for industrial use. By the late 1990's, Kikkoman had also begun
developing soy-based pharmaceuticals, such as the estrogen product Isoflavon. and other
clinical diagnostic reagents using its knowledge of organic synthesis and genetic
engineering, gained in the company's experience in perfecting the brewing process of soy
sauce (Kikkoman company website).
The first university-based biotechnology firm to go public in Japan was AnGes MG.
AnGes was established in 1999 by Ryuichi Morishita, a professor at Osaka University.
The company's main business is gene therapy. The company went public on September
25,2002, listing on the Mothers markets of the Tokyo Stock Exchange. Shortly
41

thereafter, TransGenic, specializing in mouse and antibody production methods, went
public on December 10, 2002. In 2003, Japan had the IPO's ofMediBic, Medinet,
Soiken, and OncoTherapy Science. In 2004, companies going public included SOSEI,
DNA Chip Research, LTT Bio-pharma, and Takara Bio Incorporated. All of these were
listed on the Mothers·market. In 2005, two additional companies carried out IPO's:
MedicNova, on the Hercules market, and Effector Cell Institute, on the Centrex market
(Kandachi, 2003; Mitsumori, 2005).
42

CHAPTER 5: PATENT SYSTEMS
In studies of high technology industries, patent citatious are often used as data sets
(Cantwell et aI., 2004; Almeida & Phene, 2004; Phene et aI., 2006). Patents are useful
tools with which to analyze the innovative productivity of an industry. In much of the
management literature, however, patent studies are used without a discussion of the
historical and legal context of the patent systems. This chapter aims to fill that gap and
provide a historical context of the development of patentable subject matter across
countries. High technology companies, such as biotech companies, produce knowledge.
A great deal of energy and resources goes into the creation of this new knowledge, and
this knowledge must be protected for commercialization in order to create value and
achieve a profit. The ability to protect one's intellectual property interests in this industry
encourages the development of this industry, and this protective ability rests largely in the
realm of patents (Macblup & Penrose, 1950; Okada-Takagi, 1997). It appears self
evident that without a strong patent system, a country cannot hope to develop a strong
biotech industry. However, countries differ in the historical development of their patent
systems, resulting in differing levels of protection offered to biotechnology intellectual
property in each country. The next section includes a historical analysis of the
development of international patent agreements, which is helpful in understanding some
of those differences in patent protections.
43

5.1 Historical Development of International Patent Agreements: Europe
The first patent statute on record is the 1474 Patent Statute in Venice, Italy. This statute
was introduced in an effort to encourage industrial innovation by giving patentees
exclusive monopolies, lasting from ten to fifty years, to practice their arts. Early English
patent law was modeled after the Venetian system, giving exclusive monopolies, limited
by time, to innovators. The English Statute of Monopolies was enacted in 1624, in
response to the Crown's random system of granting monopolies to people who had won
the Monarch's favor. Prior to this time, in England as well as in other European countries,
monopolies, which were called 'letters patent,' were granted to friends of the Monarch
for unlimited and unspecified time periods. The first documented letter of this type was
granted in 1449 by Henry VI. This system led to abuse, with letters patents being granted
for existing commodities (non-inventions) such as salt and starch, to people who had won
the favor of the court andlor who were able to pay the Crown for these letters. The
English Statute of 1624 specifically outlawed these commercial monopolies, but did
allow for the granting of patents for specified time periods ''to the true and first inventor
or inventors" for the innovation, provided that the innovation ''be not contrary to the law
nor mischievous to the state, by raising prices of commodities at home, or hurt of trade,
or generally inconvenient" (Statute of Monopolies, 21 Jac. 1 c. 3, 1624, chapter 5). The
French system followed the same approach in 1791, and many other European countries
enacted similar patent laws during the years from 1810 to 1843, including Austria, Russia,
Belgium, the Netherlands, Spain, Sweden, Portugal, and Germany (Goldstein, 2001).
44

A reactionary anti-patent movement swept through Europe in the mid-1800's, until about
1875. Advocates of free trade attacked patents as protectionist tools, and many European
countries repealed their patent laws. The Netherlands repealed its patent law system in
1869, and England passed several pieces oflegislation to curtail the time period given to
patent holders, as well as to engender compulsory licensing requirements for all patents.
In the federation of German states, there came to be an anti-patent movement that
cu1minated in an announcement by Chancellor Bismark in December of 1868 against the
principle of patent protection. In Switzerland, a country which had never passed a patent·
statute, there came to be renewed vigor against patent systems, with patent system
proposals being rejected in 1849,1851,1854, and again in 1863. (Machlup & Penrose,
1950). The anti-patent movement pitted the interests of the innovators (engineers,
inventors, and industrialists) against the interests of the free-trade economists and large,
established businesses whose activities were restricted by others' ownership of these
patents.
5.1.1 The Paris Convention and International Patent System Harmonization
Once the anti-patent forces had quieted their voices in Europe, and patent laws sprung
anew across the European continent and Asia, countries became aware of the large
discrepancies that existed among patent laws around the world. During an international
exhibition of inventions in Vienna in 1873, the need to harmonize the patent systems of
the world's nations became clear, as many foreign (non-Viennese) inventors refused to
participate in the exhibition out of fear that their innovations would be put into jeopardy.
45

A move to harmonize the intellectual property laws of the world's countries followed,
resulting in the Paris Convention of 1883. This Convention was the first international
agreement on patents, and took effect on July 7, 1884. This Convention addressed
several areas of intellectual property, including patents, utility models, industrial designs,
trademarks, geographical indications, and compulsory licensing. It also defined the scope
of industrial property as "not only ... industry and commerce proper, but
likewise ... agricultural and extractive industries and to all manufactured or natural
products. "(paris Convention, Article 1, Paragraph 3).
While the Paris Convention attempted to bring into harmony the patent systems of the
world's countries, it left many gaps uncovered. Most importantly, the Paris Convention
laid out no minimum standards on patents, which means that it was left up to the member
nations to decide what areas to cover in patents, and which areas or categories of
technology to exclude from patent protection. In 1988, a survey of international patent
laws found this lack of specificity with regard to patentable subject matter had created a
situation in which 49 of the 92 member nations did not allow patents on pharmaceutical
products, 45 member nations did not allow patents on animal species, 44 did not allow
patents on plants, 42 did not allow patents on biological processes, and 22 did not allow
patents on chemical products (Straus, 1996).
In 1970, signatory nations adopted the Patent Cooperation Treaty (pCT) , which
attempted to harmonize not the patentable subject matter issue, but rather, the prior art
criteria for international search. The PCT, most recently modified in 1984, has 128
46

signatories. The European Patent Convention (EPC), passed in 1973, attempted to
hannonize the subject matter of patentable inventions. The EPC specifically excluded
computer software from patentability. It also specified that "methods for treatment of the
human or animal body by surgery or therapy and diagnostic methods practiced on the
human or animal body shall not be regarded as inventions"(European Patent Convention,
1973, Part II, Chapter I, Article 52, paragraph 4). The EPC also allowed exclusions of
inventions that would be considered contrary to public morality, and "plant or animal
varieties or essentially biological processes," although it does specify that
microbiological processes and products are patentable (European Patent Convention,
1973, Part II, Chapter I. Article 53). This exclusion strongly impacted the development
of the biotech industry in Europe. The EPC is signed by 18 European countries, and does
not include the U.S. or Asian countries.
The GATT Agreement on Trade-Related Aspects of Intellectual Property Rights (also
known as the TRIPS agreement) of 1994 recognized the issue of patentable subject
discrepancies in various countries' patent systems, and aimed to engender some hannony
among the world's nations' patent systems. This agreement includes intellectual property
areas of copyrights, trademarks, geographical indications, patents, and industrial designs.
The TRIPS Agreement sets some minimum standards for patentable subject matter.
Article 27.1 of the TRIPS Agreement defines what can be patented, while Articles 27.2
and 27.3 discuss allowable exclusions to the standards provided in 27.1. Article 27.1
specifies that "patents shall be available for any inventions, whether products or
processes, in all fields of technology, provided that they are new, involve an inventive
47

step, and are capable of industrial application ... Patents shall be available and patent
rights enjoyable without discrimination as to ... the field ofti:chnology." However, the
subsequent sections of Article 27 allow for exclusions to this standard: ''members may
exclude from patentability inventions ... to protect ordre public or morality" (TRIPS
Agreement, 1994, Section 5, Article 27.2). Article 27.3 also allows for exclusions of
patents for "diagnostic, therapeutic, and surgical methods," as well as "plants and animals
and biological processes for the production of plants or animals" (TRIPS Agreement,
1994, Section 5, Article 27.3). This list of allowable exceptions highlights the continuing
differences among the world's nations regarding patentable subject matter.
Despite these normative attempts, national differences in exclusions in patent systems
still persist. The major international agreements on the issue (paris Convention, PCT,
EPC, TRIPS) have not provided harmony in patent systems in the area of biotechnology.
In fact, it is the area of biotechnology that the international agreements have left most
open to national differences. Even the 1998 E.U. Directive on the Legal Protection of
Biotechnological Inventions, which was drafted for the purpose of protecting
biotechnological innovations, contains exceptions for inventions that run contrary to
public morality, for inventions that alter human genes or use human embryos, for
genetically modified animals or processes for genetically modifying animals (Correa,
1994). Overall, Europe is still somewhat hostile to biotechnological inventions,
particularly to those that involve genetically-engineered life forms or genetically
modified agricultural products.
48

S.2 Historical Development of Patent Systems: United States
The American patent system is modeled after the English patent system, but the United
States largely escaped the anti-patent movement of the European continent. The first
American patent law was signed by President George Washington in 1790, and granted
patents for "any useful art, manufacture, engine, machine, or device, or any improvement
therein not before known or used" (U.S. Patent Act of April 10, 1790, ch. 7,1 Stat. 109-
110). Originally, the Act called for patent examiners, but the patent board quickly
became overwhelmed with applications. Therefore, in 1793, an Act was passed requiring
mere registration, rather than review, for patents. It soon became obvious that some sort
of review system was indeed needed, though, and thus, in 1836, an Act was passed
reinstating the patent examination system of review, along with fixed terms of patent
duration (14 years) and a designated patent review board.
The patent laws in the U.S. evolved throughout the years. In 1850, the U.S. Supreme
Court ruled in Hotchkiss v. Greenwood that an invention must be non-obvious in order to
be considered patentable subject matter. The Patent Act of 1952 further elaborated on the
issue of the level of novelty required to be considered 'inventive' and required all patent
applications to disclose all prior art (the term used for previous inventions that the new
invention builds upon) for the invention (Baughn et aI., 1997). The U.S. patent system is
a first-ta-invent system, meaning that the priority of patent right lies with the person who
invented a patentable subject first, rather than with the person who first filed for a patent
on an innovation. The U.S. is the only industrialized country that uses a first-ta-invent
49
system; all other nations rely on a first-ta-file system. This emphasis on the priority of
invention, rather than the priority of filing, stems from the concept of the inherent right of
the inventor and the desire to protect an atmosphere of innovativeness (Baughn et al.,
1997). Indeed, it is argued that this first-to-invent system creates "a unique and creative
U.S. research and development resource that is admired and envied throughout the world
for its leadership in the advancement of science and technology" (Advisory Commission
on Patent Law Reform, 1992, Section C, subsection 1).
The U.S. Supreme Court case Diamond v. Chakrabarty (1980) was a landmark decision
for the biotechnology industry. This decision held that a live. genetically-engineered
microorganism, for use in oil spill treatment, was patentable subject matter. In delivering
the opinion of the Court, Chief Justice Burger referred to the report which accompanied
the 1952 U.S. Patent Act, which suggested that Congress had intended to extend
patentability to include "anything under the sun that is made by man" (Diamond v.
Chakrabarty, 1980). The following year, the U.S. Patent and Trademark Office issued its
first patent for a live, genetically-modified animal: the Harvard oncomouse, which was a
genetically-modified mouse developed by researchers at Harvard University to facilitate
research on cancer (Correa, 1994). At that time, no other country in the world had such a
liberal system of patents. Currently, the U.S. still has the world's most liberal patent
system, with no exclusions on what is considered patentable subject matter and the
broadest protection of biotechnological inventions (Chambers, 2002; Kowalski et aI.,
2003).
50

European nations vary in their standards on patentability, but all of those nations are
more restrictive on patentable subject matter than is the u.s. Patenting in the European
Union (EU) can occur either in individual nations' patent offices or through the European
Patent Office (EPO) in Munich, Germany. A patent granted by the EPO grants the
patentee the protection of all member nations of the EPC. The EU patent system allows
for many exclusions of patentable subject matter, and the patenting of life forms and
biological processes is one such exclusion. Historically, European nations have been far
less receptive to the overall idea of patents, and almost all of them have exclusions in
their national patents laws concerning inventions which are contrary to ordre public. The
U.s. has no such restrictions.
The European Patent Office initially rejected the patent application for the Harvard
oncomouse. In 1990, the Office's Technical Appeal Board reconsidered and granted the
patent, holding that the subject matter was not contrary to public morality and did not fall
under the EPC's exclusions of animal varieties. However, the matter is far from settled,
as 16 oppositions were filed in response to the EPO's granting of the patent for the
oncomouse; those oppositions have not all been resolved (Goldstein, 2001).
5.3 Historical Development of Patent Systems: Japan
Japan's patent system, which was built upon French and American patent systems, was
first established in 1885 with the Patent Monopoly Act, which was modified in 1888.
51

This Act provided a basic foundation of patent rights. When Japan became a party to the
Paris Convention in 1899, it modeled its system of patents after the German system
(Baughn et al., 1997). This system was enhanced by the 1900 New Utility Model Law
and the 1922 revised Patent Law, both of which addressed the application procedures and
switched Japan from being a "first to invent" country to a "first to file" country. The
first patent granted in Japan was in 1885 to Zuisho Rotta, for Rotta's method of creating
rust-stopping paint. In 1890, Sakichi Toyoda (the founder of the Toyota Group) was
granted a patent for a weaving machine.
The Japanese system of patents embraces a more collective approach than the
individualistic American approach to intellectual property-the Japanese legal system of
patents aims to facilitate cooperation and the diffusion oftechnology as a public good,
whereas the American system aims explicitly to protect the rights of the individual
inventor and to reward entrepreneurs (Baughn et aI., 1997). This attitude is evidenced, in
part, by Japan's grace period for public disclosure. A grace period is the amount of time
an inventor has between publicly disclosing the invention and filing a patent for said
invention. The idea behind a grace period, or lack thereof, is that a patent needs to be
granted only for subject matter that is new, which means that it was not previously known.
From a governmental perspective, the purpose of a patent, in essence, is to trade public
disclosure of an invention from the patentee in exchange for governmental protection of
the commercialization of that invention for a limited period of time. In this way, the
public ultimately benefits from the accumulation of new knowledge. If an invention has
been previously disclosed to the public, it is no longer unknown. Thus, most countries
52

have a clearly defined time period between when an invention is disclosed to the public
and when the 'cut-off date is for filing a patent application for that invention.
The U.S. has one of the most liberal grace periods in the world, giving an inventor one
full year from the time of public disclosure of the invention to file a patent application for
that invention. This grace period is "of critical importance to the scientific community in
facilitating early dissemination of research results, while preserving the patenting
opportunity of the inventor for a reasonable period" (Advisory Commission on Patent
Law Refonn, 1992, Section C, Subsection 2b). By contrast, Japan, in previous years, had
a requirement of 'absolute novelty,' meaning that the invention could not have had any
public disclosure prior to the filing of the application. The Japanese Patent Act of 1959,
in Article 30, added some exceptions to the requirement of absolute novelty by allowing
a six-month grace period, provided that the disclosure be made by the inventor in an
experiment or written presentation at a qualifying scientific academic meeting or
conference. Legal observers have noted that Japan's patent system appears to favor large
finns, whereas America's system favors smaller, entrepreneurial finns (Baughn et ai.,
1997).
In biotechnology patent allowances, Japan falls between the US and Europe with respect
to what can be patented. Japanese standards are more liberal than European standards,
but still allow exclusions on certain biotechnological innovations if they are "likely to
inure the public health" (Okada-Takagi, 1997). Neither Europe nor Japan allows patents
on methods ofmedica1 treatment, whereas the U.S. does allow such patents (Kowalski et
53

al.,2oo3). Also, Japan excludes patents on processes in the fields of medicine, diagnosis
therapy, treatment, and pharmacology in which the human body is an indispensable
element. (Okada-Takagi, 1997).
The Japanese Patent Act excludes from patentability any invention which is contrary to
public order, morality, or public health (Japan Patent Act, Section 32). It also excludes
medical treatment methods from patentability, as does the European Patent Office.
However, Japan will allow patenting of higher life forms, as long as the "invention is a
highly advanced creation oftechnical ideas utilizing a law of nature" (Shimanami, 2003,
p.238). In the 1990's, Japan granted a patent for Harvard's oncomouse, and since then,
has mostly followed the U.S. 's lead on patenting life forms. The exclusions mentioned
above, however, continue to deny patent protection on certain types of biotechnology
innovation. Furthermore, the Japanese Patent Office has historically taken 7 to 8 years
from the initial patent application to actually examine the application, leaving little time
on the patent once it does get approved (Enayati, 1993). Moreover, while the Japanese
patent system, like the American patent system, has requirements for usefulness or utility,
the Japanese requirements are far stricter than the American requirements for utility.
Biotechnology products are often diagnostic and/or treatment methods, rather than
physical products, which often do not meet the Japanese requirements of utility. Also,
utility claims may not be easily amended in a patent application in Japan, unlike in the
U.S. In Japan, claims can only be amended if the original examples support the changes.
"The narrow scope of Japanese patent claims remains a source of exasperation to U.S.
54

patent holders who did not comprehend this difference when they first filed" (Enayati,
1993, p.l056). An American patent grants the holder the right to exclude others from
copying and/or selling the patented invention, which is different from the Japanese
system. A Japanese patent grants the holder the exclusive right to use the patented
innovation. The important difference is that the American system requires no use of an
innovation in granting its patent, whereas the Japanese system does. If an innovation is
needed, but not being used, the Japanese system allows for compulsory licensing of that
innovation. This difference affects biotechnology by potentially forcing a firm that holds
a patent on an innovation, but which is not currently using that innovation, to license it to
other firms for their use. The potential problem is that a firm may be holding onto a
patented innovation in order to combine it with a new product that is currently in
development; compulsory licensing of patented innovations can harm a firm's
profitability by requiring it to alter its strategic plan regarding that innovation.
Critics of both the u.s. and Japanese patent system claim that each country discriminates
against foreign patent applicants (Kotabe, 1992). Those who argue that the U.S. system
discriminates against foreign applicants argue that the u.s. first-to-invent requirement, in
which patents are granted based upon the person who invented the innovation first, in fact
favors domestic applicants, as it is difficult for inventors working outside of the u.s. to
prove that they invented a product first (Kotabe, 1992). However, that has not seemed to
significantly limit the number of foreign companies receiving patent protection on their
products; in 2007, out of the 25 firms that were awarded the most U.S. patents on their
innovations, 13 were Japanese firms, whereas only 7 were U.S. firms ("mM Leads Patent
55

Recipients," 2008). Those who argue that the Japanese system discriminates against
foreign companies note that foreign applications for Japanese patents tend to take longer
than do domestic applications for Japanese patents. However, this pattern may not be a
function of the nationality of the company as much as it is the tendency oflarge Japanese
companies to flood the Japanese Patent Office with large numbers of applications,
making it necessary for both Japanese and non-Japanese competitors to do the same in
order to maintain competitiveness within Japan (Kotabe, 1992).
56
CHAPTER 6: DATA
The biotech industry is an entrepreneurial industry in the U.S., characterized by large
numbers of start-up firms and relatively short histories. In Japan, the industry has both
entrepreneurial and intrapreneurial characteristics. Many are small start-up companies,
but many others are subsidiaries or departments oflarge corporations that have
diversified into the biotech arena This study looked at both American biotech firms and
Japanese biotech firms.
This study uses patent citation data to analyze the biotechnology industry. Many
researchers have argued that patents are key indicators of technological resources as well
as proxies for levels of innovation (Acs et al., 2002; Grant, 2005; Phene et al., 2006).
Patent data provides information about the knowledge being created, including the
location of innovation, date of innovation, technology class, and patent citation list. All
patents must list their 'parent' patents, called prior art, in the patent application process,
giving rich information regarding the location of the original knowledge (geographic
location of patent), which yields an observable path of cross-border (and domestic)
technological learning. The patent citation method has been used previously to look at
technology transfer and sources of knowledge (e.g. Almeida, 1996; Phene & Almeida,
2003; Almeida & Phene, 2004; Cantwell et al., 2004; Phene et al., 2006;) and has been
found to be a good measure of technology flows (Duguet & MacGarvie, 2005).
57

Patent citation data was retrieved from the U.S. Patent and Trademark Office. American
and foreign firms file patent applications in the U.S., so this data will accurately represent
domestic citations as well as foreign citations. Almeida (1996) found that high
technology firms first patent in the country with the largest market share, which is the
United States in the case of biotechnology. Furthermore, Rausch (1999) found that the
United States is one of the first locations for patent application in the biotechnology
industry. This tendency was also supported by AusBiotech, the Australian
Biotechnology Organization. In an industry summary at the 2007 Australia and New
Zealand BioIndustry Review, AusBiotech noted that Australian biotech companies tend
to seek patents in the U.S .• as the U.S. is likely to be the main market for their products
and for potential partnerships. Thus, the organization concluded that the number ofU.S.
granted patents in biotechnology is a good indicator of the strength of a biotechnology
firm's portfolio of knowledge assets.
The U.S. laws on patentable subject matter make the U.S. the country with the most
protection afforded to biotechnology innovation, giving firms additional reasons to file
for patent protection first in the U.S., before filing elsewhere. While it is true that most
biotech companies will choose to patent their innovations in other countries as well as in
the U.S., we recognize that they will file for protection in the U.S. first. We thus wish to
avoid misrepresenting the data by including dual and triple patent applications, as some
companies file for patent protection for an innovation in several countries on the same
day. Therefore, we restricted the patent search to the U.S. Patent and Trademark Office.
This method follows the direction of Almeida (1996), Almeida and Phene (2004) and
58
Cantwell et al. (2004). Firms of all nationalities file patents in the U.S., and along with
their patent applications, list the location of the innovation. This study uses that location
to assess the direction of knowledge transfer.
As mentioned earlier, the biotech industries in Japan and the U.S. differ in many respects.
For a comparison, this study looks at both American biotech firms and Japanese biotech
firms. The top 50 biotechnology firms in both countries were selected for the data
sample, and their citations analyzed for four consecutive years, 2002 through 2005 (see
Appendix B).
The top 50 biotechnology firms in Japan were identified using the 2006 Nikkei Business
Publication's (Nikkei Biotechnology News) annual ranking of biotechnology firms by
revenue. This listing ranked Japanese biotech firms as of2005. The top 50
biotechnology firms in the U.S. were identified using Canon Communications
Pharmaceutical Media Group's publication, Med Ad News' 2005 annual report, "Top 100
Biotechnology Companies," which ranks biotechnology firms by revenue.
Originally, the plan was to use data from 2003 and 2004, but to better highlight trends in
the industry, the period was expanded to include data from 2002 to 2005. Patents can
take several years from the time of application to the time of granting. Applications are
not made public in the U.S. until 18 months after the date of application, so using data
from 2002 allowed us to accurately see innovations trends in the industry, and including
2005 data provided yet more patent applications that had been filed in 2003 and 2004.
The patent citation search was conducted from late 2006 to mid-2007, giving a snapshot
59

of the patent holdings of the companies during that time. The U.S. Patent database is
updated every Tuesday, the day when patents are issued, excepting federal holidays.
Therefore, it is possible that, particularly with regard to the 2004 and 2005 data, more
patents have been granted, and those patent applications made public. The potential for
yet more patents to observe does not alter the scope or findings of this research project, as
it is general trends in the industry that we are concerned with, rather than the specifics of
one individual patent.
In total, 50 Japanese companies and 52 U.S. companies were analyzed, giving 102 total
companies in the sample. In the U.S. sample, 52 firms had a total of913 biotech patents
that were applied for during the observation period of2002-2005. Those 913 patents had
20,646 prior art patent citations. Each of those 20,646 cited patents listed in the prior art
were analyzed to see the location of the innovation. The Japanese sample had 50 firms
with 703 biotech patent applications during the observation period. Those 703 patents
listed 8,738 prior art citations. Each of those 8,738 cited patents were analyzed for
location information. For the entire project, 1,616 patent applications and 29,684 patents
listed in citations for those patents were analyzed. (See Appendix·B.)
Many companies in the sample conduct research and development in areas other than
biotechnology. The dependent variable, overall innovation, was measured using the
number of patents applied for in the area of biotechnology only, as the goal of this
research is to look at innovation only in the biotechnology area. Patents at the U.S.
Patent and Trademark Office are organized into technology classifications, which are
three-digit numbers corresponding to the general field of the patent. There are five
60

technology classifications related to biotechnology, and these classifications were used to
detennine if an innovation was biotech-related. The classifications are: 424, 435, 436,
514, and 530. This follows the direction of previous research (Granstrand et al., 1997;
Lin er al., 2007).
Independent variables in this research include the amount of foreign learning, defined as
the number offoreign patent citations. For each company, this variable was calculated by
adding up all foreign (non-domestic) patent citations during the observation period. This
was done for all companies in the sample. Control variables included the age of the
company, measured as the year of establishment; the size of the company, measured as
the total number of employees; the technology class of the innovation, and the number of
self-citations in the prior an. The year of establishment information was obtained from
company websites and annual reports. The total number of employees was obtained from
annual reports, Compustat, company websites, and the Winter 2006 edition of the Japan
Company Handbook. This information was also supplemented by telephone calls and
emails to companies not listed in the Handbook. Self-citations were controlled for in the
models by subtracting self-citations from the number of prior an citations, as self
citations. defined as a firm citing its own patents in new innovation, would over-represent
the domestic citations for each firm. The technology class was taken from the patent
application form, which indicates the technology class of the innovation.
61

For the hypotheses concerning absorptive capacity, the dependent variable, the amount of
foreign learning in one year, was predicted by the explanatory variable, the amount of
foreign learning in the previous year.
The data yielded some interesting patterns. There was significant range in the age data
for the Japanese firms-325 years. The oldest firm was Tanabe Seiyaku, established in
1678, and two firms in the Japanese sample tied for the newest firms: both LIT Bio
Pharma Company and DNA VEC Corporation were established in 2003. There was
considerable less range in the age data for the U.S. sample-a mere 29 years, with Nabi
Biopharmaceuticals Corporation being established in 1969, and InterMune, Inc.
beginning in 1998. There were differences, and considerable skewness, in the total
number of biotech patents applied for during the observation period. For the U.S. sample,
the average number of patents applied for during the observation period was 17.54, with a
median of9.5, and a range from 1 to 96 (Genentech had 96; many firms had only I).
There was also a wide range in the overall number of patents. not limited only to
biotechnology, which the firms applied for during the observation period. That range, for
the U.S. sample, was from I to 240, again with Genentech applying for the most number
of patents, and several firms applying for only 1. The patterns in self-citations were
interesting, as well, with seven firms not citing their own patents at all in any of their
patents applications in the sample. and one firm, Vical Incorporated, citing its own
patents in 34.9% of its prior art citations.
62

The Japanese sample had a larger range in the number of biotech patents applied for
during the observation period, from 0 to 128, with Ajinomoto applying for 128 biotech
patents, and a few firms applying for no biotech patents. The median was five patents,
and the average was 13.9. The range in the Japanese sample in the number of overall
patents, in every technology class, applied for during the observation period was from 0
to 252, with Kao Corporation applying for the most number of patents, and several firms
applying for none or only one. The patterns in self-citations, or a firm citing itself and its
own patents as parent patents for the new patent for which it is applying, were also
interesting. 14 Japanese companies did not cite themselves at all in any of their patent
applications in the sample. A few, however, cited themselves a great deal, with Fuji Oil
citing itself in 67% of its prior art.
63

CHAPTER 7: METHODS
Hypothesis 1: Hla and BIb
The dependent variable in the model for Hypothesis 1 is a count variable. Models
involving dependent variables that are count variables are often estimated using Poisson
estimation or negative binomial regression. The Poisson regression assumes that the
dependent variable will follow a Poisson distribution, with equal mean and variance. If,
however, the sample means and variances display overdispersion, then a more
appropriate test of the models would use negative binomial regression. In the case of this
sample, the means and variances were not equal, so negative binomial regression was
used. Additionally, given the large range in the dependent variables, then an Ordinary
Least Squares (OLS) approach proved to be helpful. Therefore, we will estimate the
model using negative binomial regression as well as linear regression. Similar results
from both techniques would indicate evidence of robustness in the model.
The dependent variable, the total number of biotechnology patent applications, for the
first set of hypotheses, which argued that foreign learning would be positively associated
with overall innovative output, had a great deal of skewness, as did the total number of
foreign patent citations. The standard deviation of the total number of biotech patent
applications was 22.47, with a mean of 15.75, and a maximum of 128. The standard
deviation of the total number offoreign prior art was 258.05, with a mean of 159.46, with
a maximum of 1,532. Due to the non-normal distribution of the data, the natural
64

logarithm of the dependent variable, as well as the natura1logarithm of the independent
variables, was used to test Hypothesis 1 a and I b using linear regression. Because
negative binomial regression accounts for overdispersion in models using count variables
as the dependent variable, raw numbers were used when the model was tested using
negative binomial regression. The model tested by both methods was:
Overall Innovation = Po + ptForeign Learning + P2Size
Although the model initially included the control variable of age, due to multicollinearity
issues with age and size (Variance Inflation Factor of 2.30), the age variable was dropped.
A third regression test was run using Negative Binomial Regression, using the raw
number of biotech patents as the dependent variable and the log transformation of foreign
learning and size as the dependent variables. If the results are similar to the first two tests,
we will have further evidence of robustness of the model.
Hie
For Hie, which added the variable of domestic learning, two tests were used. First, in a
linear regression model, the model used was:
Overall Innovation =Po + PtForeign Learning + P2Domestic Learning + P3Size.
65

However, the multicollinearity (Variance Inflation Factor of 3.1 0) displayed between
foreign learning and domestic learning necessitated the reduction in variables; thus, two
models were tested:
Overall Innovation = ~o + ~lDomestic Learning + ~2Size
Overall Innovation = ~o + ~lForeign Learning + ~2Size:
To compare domestic learning and foreign learning, the coefficients of the learning
variables in each model were compared, and confidence intervals were constructed to test
the differences of the means.
Hypothesis 2
For IDa and IDb, regarding firms' tendencies to cite their own countries' patents, an
independent samples t-test was used to look at the differences in the patterns of Japanese
firms citing Japanese patents, and American firms citing American patents. Additionally,
a logit regression analysis was used to check to see if the nationality of the biotech
company could be predicted based upon the number of U.S. and Japanese prior art
citations. Logit regression is a useful statistical tool to use when the dependent variable
in an equation is a dichotomous variable. The logit regression model used to test this
hypothesis is:
Nationality of Company (Japanese/U.S.) = ~o + ~1 (U.S. patents) + ~2 (Japanese patents).
66

Hypothesis 3
For Hypotheses 3a, 3b, and 3c, regarding absorptive capacity's relationship with foreign
learning, a regression analysis was used to see if the amount of foreign learnmg in 2003
was positively associated with the amount of foreign learning in 2002. The model used
for this regression was:
Foreign Learning 2003 = ~o + ~1 Foreign Learning 2002 + ~2 Size.
67

CHAPTER 8: RESULTS
Hypothesis 1
For both Japanese and U.S. biotech finns, the amount of foreign learning is a strong and
positive predictor of overall innovation. The R-square value indicates that the model can
explain 80.8% of the variance in the dependent variable, the log transformation of the
number of biotech patents, for all companies, 90.1 % for Japanese firms, and 73.7% for
U.S. finns. The log-log model indicates that a 1 % increase in foreign learning is related
to a 0.7% increase in biotech innovation for Japanese finns, and for U.S. firms, a 1%
increase in foreign learning is related to a 0.46% increase in biotech innovation. This
model is significant at the p<.OI level. Individually, both the amount offoreign learning
as well as size are significant, at the p<.O 1 level. (See Tables I and 2). Results are
consistent with both the OLS regression analysis as well as with both negative binomial
regression analyses, suggesting robustness of the model. The variance inflation factors
are under 2, at 1.3 for the Japanese sample, and 1.2 for the U.S. sample, suggesting that
the model is not plagued with a multicollinearity problem.
Foreign learning appears to be a significant and strong variable impacting overall
innovation in the biotechnology industry. Size is significant for the U.S. companies, but
not for the Japanese companies. An explanation for this finding most likely lies in the
differences in the operating environments of each country's industry. Most of the firms
in the U.S. sample are only biotechnology companies, so the size of each company
68

reflects the number of people working in the biotechnology area. However, many of the
firms listed in the Japanese sample are large multinational conglomerates, with many
different areas of business, which means that each firm may have many more employees
than those who are actually employed in the area of biotechnology. Thus, the size of the
company may not be indicative of how many people are actually working in the area of
biotechnology in this data set. These results show support for both Hla and Hlb.
The method used to test Hlc involved running separate linear regression models, one for
domestic learning, and one for foreign learning, and then comparing the coefficients of
the learning variable in each model using 95% confidence intervals. The coefficients of
the log of domestic learning and the log of foreign learning were 0.430 and 0.655,
respectively. (See Table 3.) The confidence intervals for these two coefficients, shown
below, indicate that the coefficient for foreign learning does not overlap with the
coefficient for domestic learning, suggesting that there is, indeed. a difference in the
relationships that domestic learning and foreign learning have on overall innovation in
the biotechnology industry. Furthermore, the coefficient for foreign learning is larger
than that of domestic learning, suggesting that foreign learning has a stronger relationship
on overall innovation than does domestic learning, consistent with Hypothesis lc.
95% Confidence Intervals:
Coefficient Lower boundary Upper boundary
In Domestic Learning .430 .3575 .5025 (.037)
In Foreign Learning .655 .5962 .7138 (.030)
69
Hypothesis 2
American firms tend to cite U.S. patents more than do Japanese firms; and Japanese firms
tend to cite Japanese patents more than do American firms. An independent samples t
test was conducted on the difference in the number of U.S. patent citations between U.S.
and Japanese companies, and also on the difference in the number of Japanese patent
citations between those same companies. The independent samples t-test indicated a
significant difference in the means between American firms and Japanese firms citing
U.S. patents, and also a significant difference in the means between American firms and
Japanese firms citing Japanese patents. The difference in the tendency to cite U.S.
patents was significant at the p<.01 level, and the difference in the tendency to cite
Japanese patents was also significant at the p<.01 level (See Table 4). Because at-test
does not incorporate other factors that may be related to the citation patterns, a logit
regression analysis was used to test this hypothesis, as well. The logit regression
analysis, in which the number of Japanese patent citations and the number of U.S. patent
citations were used to predict the nationality of the firm, indicated that the nationality of
the firm could be correctly predicted 86.3% of the time. The model correctly predicted
Japanese firms 92% of the time, and U.S. firms 80.8% of the time, giving further support
to the notion of home -country bias in patent citations (See Tables 5 and 6). Hypotheses
2a and 2b are therefore supported.
70

Hypothesis 3
To test Hypothesis 3, an OLS regression model was used. Tables 8 and 9 show the
results of the regression analysis. The regression model indicated that the amount of
foreign learning in 2003 was positively and significantly related to the amount of foreign
learning in 2002 at the p<O.Ollevel, thus supporting H3a, 3b, and 3c (see Tables 7 and
8).
71

CHAPTER 9: QUALITATIVE EXPLANATION-INTERVIEWS
This research helped highlight the trends in international knowledge sourcing, but opened
additional questions. How should the trends highlighted in this study be interpreted? To
provide managerial insight into the issue of home -country orientation, foreign knowledge
as a resource for the firm, and absorptive capacity in foreign learning, balancing this
study's quantitative data with qualitative explanation and insight might be useful. This
project pursued that goal by following in the steps of Mintz berg (1975,1980,1990) and
taking this research's findings to three CEOs for explanation. Two CEOs were of U.S.
biotechnology companies and one was ofa U.S. software company; all of them have
applied for patents on innovations. One of the CEOs in the biotechnology industry has
actually been the CEO at two different biotech companies in the U.S. The goal in these
interviews was to get a practitioner perspective on the process of developing and
commercializing intellectual property. The interviews were conducted during the month
of November, 2007, at the offices of the individual interviewees. Interviews lasted
approximately 45 minutes. The CEOs included two men and one woman. Two were of
American nationality, and one was of Canadian nationality.
Questions posed to the CEOs included:
1.) Can you explain the findings of the home-country bias in patent citations?
2.) How do you choose countries to look at for new ideas upon which to build?
72

3.} Despite many governmental initiatives around the world, most of the world's
biotech companies are in the U.S. In your experience, what are the variables of
regional and national competitiveness in high tech industry?
4.} How do you determine the need for a new product?
5.) How do you make sure a new product idea has not been developed elsewhere?
6.} What role do lawyers play in the process of patenting innovations?
7.) What role does the legal system of patents play in the process of developing and
commercializing innovations?
The first question posed to all three CEOs was for an explanation of one of the findings
of this research-the tendency for American finns to cite U.S. patents and for Japanese
finns to cite Japanese patents. Interestingly enough, all three people suggested a cultural
element in this pattern. One said:
"America is the biggest market, so most of the valuable intellectual property is in the U.S.A. It's also just easier for the patent examiner ... each patent application tells a story, and the patent examiner is likely to be more familiar with an American 'story' than with a Japanese 'story.' So it's a shorter application process. It's different with the Japanese companies-with them, it's cultural. They probably want to make sure that no Japanese patents are left out of the prior art to save face with all of the companies that own the prior art patents. Eliminating Japanese patents might be rude."
The second biotech CEO echoed the cultural consideration, suggesting that the
differences in the citing patterns might be indicative of what each country's industry
values as important. He hypothesized that the American finn wants to get the patent as
quickly as possible, which means that the application will be constructed to allow the
73

patent examiner to be as efficient as possible in the review; whereas a Japanese finn
might value internationalism, defined as showing representation of knowledge from
diverse locations, over efficiency, and thus want to show a more international approach in
the patent application. One of the many points he made during our 45-minute-long
interview was that these patent applications are done by people, and people come from
cultures, which may shape what they feel is important. He also noted that the U.S.
education system may playa role in the process:
"We have a top education system ... people come to the United States to study from allover the world. The research that they do is sponsored by their universities, and the patent applications for that research will thus be filed in the U.S.A."
The CEO of the software company echoed the cultural considerations, and added the
element of local search to the explanation. She pointed out that when her company filed
for some of its patents in the 1990's, she would actually go to the patent office and search
for patents by hand, and she did not have the opportunity to fly to Tokyo to see what
patents were there. She said that money and the rush to market dictated a lot of the
process. Software engineers were coming up with new innovations, and everyone knew
that rival companies in the local area were working on the same exact technologies. Each
company wanted to file their patent applications first, so that they could be the one
company to commercialize the innovation. Because the San Francisco area was such a
hotbed of software innovation, especially in the 1990's, it did not even occur to anyone to
check what Japanese software engineers in Japan, for example, were doing. There was a
general attitude of "if they were dong anything important, I'd have heard about it by
now," thus reinforcing the concept of a 'not invented he,re' mentality.
74

One of the biotech CEO's explained a similar, but not identical, process. When asked
about choosing countries to look at for new innovation and how to determine a need for a
new product, his answer was clear. A scientist might do some preliminary work on a
project that heJshe thinks could be useful, and early on, heJshe will do their own search in
top medical or scientific journals, in English, as this is an American company, so that
necessarily excludes Japanese scientific journals. He explained that the process is not so
much geographically bound as it is hierarchical-top journals and top scientists can be
from anywhere, but if they are not in the perceived "elite" group, their work is perceived
to be less valid. So they will be more likely to cite the work of those "elites" in the
industry, which tend to be people working in the most successful companies or at the top
research universities, where they can get ample support; those companies and universities
tend to be in the U.S. Citing a perceived less prestigious scientist or organization,
whether it is in Japan or Sri Lanka, just does not buy you as much legitimacy.
In answering a question about competitiveness in a biotechnology, both biotech
company's CEOs had opinions, and they both ,agreed that money is important, but so are
other things---everything has to come together to create a favorable environment. One
CEO put it nicely: "scientific advancement and research is necessary, but not sufficient.
But money alone won't do the trick. Johns Hopkins University has lQts of money, but
hasn't been able to catch up to Boston or California as a leading region in biotech
research, due to a lack of successful biotech firms surrounding it." The other biotech
CEO said that creating a biotech success requires many elements: a strong education
7S

system, proper timing, and enough money to sustain a company until it has a big enough
success to attract IPO attention. Both biotech CEOs said that money is the most
important element, because it can often buy the other elements. The example of
Singapore was given. Singapore is a country that does not have an established reputation
for academic excellence in the biosciences, but which does have a great deal of money to
invest. This asset enables the nation's biotech firms the ability to buy academic
excellence (in the form oftop scholars) and fund the research from the inception phase
through the commercialization phase. The availability of money keeps a "cauldron of
bubbling ideas burning," and those ideas that come to the top get funding.
Culture was mentioned again regarding innovative entrepreneurship. Many products and
ideas that a biotech finn comes up with will not be successful, but hopefully, at least one
is, and that one success will provide enough money to cover the costs of the unsuccessful
prodUCts. This system requires a cultura1 appetite for risk: "people have to be ok to start a
company and have it not work."
"Innovation cannot be generated from the top down. No committees. All you can do is give out money, and you let the market decide. In the process of innovation, the most important process is a lack of process, a lack of bureaucracy. Biological systems must always adjust according to feedback loops. Most successful organizations in innovation understand this. But some companies have a military command-and-control system, which works when you have specific goals, but when you don't know exactly what the goal is, it can be completely disadvantageous to innovation. You cannot 'six sigma' newness. You will destroy innovation if you try to."
76
The CEO's point was that the U.S. clearly benefits from its own entrepreneurial culture
of embracing risk, and that some other countries may not have tolerance for ambiguity
and/or failure, which can impede success in high-tech innovation.
In all three interviews, the element of culture was mentioned as an influencer in the
competitive advantage of a region's biotech industry as well as an influencer in the
innovative process. This commonality suggests that a cultural component does indeed
affect the cross-border acquisition and utilization of knOWledge.
77

CHAPTER 10: LIMITATIONS AND FUTURE RESEARCH
All studies have limitations, and this research is no exception. First, this research looks
only at the relationship between foreign learning and overall innovation in an industry; it
does not purport to assess the value of that innovation, nor does it argue any relationship
between overall profitability.and the amount of foreign learning. Moreover, a country
comparison of the profitability of biotechnology companies would be an invalid
comparison, as many of Japan's biotech firms are internal ventures oflarge multinational
conglomerates that produce things other than biotechnology, which would thus cloud the
data. However. future research might do well to consider the relationship between
foreign learning and overall profitability.
The inclusion oflarge multinational companies in this sample provides additional
limitations. This study looks at the location of the knowledge being cited as 'parent'
knowledge. There are several ways one could define that location, including location of
the patent, the nationality of the company, the nationality of the inventors, or the location
of the inventors. This study opted for the first choice, using the location of the patent.
Defining the location of knowledge based upon the nationality of the company would be
misleading, particularly for multinational companies, as many companies have locations
in multiple countries. as well as have alliances with other companies of other nationalities.
Additionally, many biotech companies have personnel 00 differing nationalities, so an
American company such as Genentech may have scientists that are Japanese. Perhaps the
argument could be made that a new innovation developed by a Japanese scientist is a
78
Japanese invention. However, if that Japanese scientist is working for an American
corporation, at a location in Singa~ore, using money and resources provided by the
American corporation, with the American corporation retaining ownership of the
invention, it would be difficult to argue that the invention is Japanese. Moreover, in most
patented inventions, there is more than one inventor, and the many inventors often have
differing nationalities, and may in fact have differing locations. Therefore, defining the
location of knowledge by the nationality of the inventors, or by their physical location,
can be highly problematic.
The use of the location of the patent as the location of the knowledge is not without its
problems; however, it seemed to be the best option, as patent searches must be done
within individual patent systems. Hence, a firm looking for biotech patents registered
with the Japanese Patent Office would indeed be searching for Japanese patents, and
would not fmd, for example, Australian patents. Furthermore, in patent applications, the
speed of the examination is critical, as the faster an application is approved, the longer
the patent protection on the innovation exists. (The 20-year protection begins on the date
of filing, so if a patent takes 5 years to be approved, the firm will end up receiving only
IS years of patent protection for commercialization.) U.S. patents listed in the prior art
take less time than non-U.S. patents for the patent examiners to research and consider;
therefore, it behooves a company to list as many U.S. patents, and as few non-U.S.
patents, as possible in the application. The fact that an application lists a foreign patent
suggests that a parallel, or equivalent, patent does not exist within the U.S. patent system;
in other words, that one innovation was not filed for patent protection in multiple
79

countries. This was explained in a law class at the University of Hawaii Law School, and
was confirmed by observation of the data. Thus, listing a foreign patent in the prior art
of a patent application does indeed indicate a search for, and use of, foreign knowledge.
This sample is mainly comprised of publicly-held companies, which limits the
generalizability of its findings. The study does not look at many privately-held
companies, so the study's findings cannot be generaIized to apply to them.
The sample includes 102 of the top biotech firms in the U.S. and Japan. These firms
were ranked by revenue, and the sample does not include lower-revenue companies, so
the sample cannot be considered representative of the entire industry. An additional
limitation on the generalizability of the sample is age. The average year of establishment
of the U.S. sample is 1987, whereas the average year of establishment of the Japanese
sample is 1930. Biotechnology is a generally new industry, beginning in earnest in the
early 1980's, evidenced by a large number of biotech start-up firms in the 1980's and
1990's. Japan's biotech industry, as has been noted earlier, is largely intrapreneurial,
characterized by large companies branching out into the area of biotechnology via
intemaI new venturing. This intrapreneurship skews the age data, as the firm may have
been in operation for several decades, or even centuries, before venturing into the area of
biotechnology. There are approximately 800 firms in Japan related to biotechnology,
over half of which are relatively new start-up firms. The sample in this study includes SO
Japanese firms, very few of which are new companies. The U.S. sample includes more
start-up fIrmS, but as it, too, was created by ranking firms by revenue, it necessarily
80

excludes the newest start-up firms, which may not yet have reached the top levels of
revenue in the industry. Future research might do well to consider the differences
between brand new start-up firms and firms that have been in existence for a few years.
Another limitation is the nature of the data. AI; mentioned in the data section, this sample
provides a snapshot of the patent holdings of the sample companies at the time of inquiry,
from the end of 2006 through the middle of2007. While this may provide a
comprehensive picture of the patents each firm applied for in 2002, due to the lag time
between application and granting, it may not provide a complete record of all of the
patents each firm applied for in 2004, and even less so for 2005. Fortunately, this
potential lack of completeness does not affect our findings, as none of our hypotheses
deal specifically with individual patents. A limitation relating to the nature of the data is
the question of the role of attorneys. Patent applications are usnaIly filed by companies'
attorneys. This fact leads to a question of whether or not the choice oflaw firms affects
the amount of foreign learning cited in the application. Although interviews with CEO's
of biotech companies indicated that this was not the case, an empirical perspective might
yield additional information about that relationship, which should be considered in future
research.
This study measures knowledge that has been codified in the form of patents, which
means it necessarily excludes knowledge that has not been codified, such as 'know-how'
and persoual knowledge stores of company employees. This study does not aim to
suggest that the only knowledge a firm can have will be in the form of patents. Certainly
81

there are other fonns of knowledge, and this study does not include those fonns, which
limits its findings. The solace in this limitation is that previous research has indicated
that patented knowledge and tacit knowledge stores within a finn tend to be closely
linked and complementary (Mowery et al .• 1996; Phene et al .. 2006).
This study looks only at patents in the biotechnology sector. Many of the finns included
in the sample have innovations outside of the biotech area; some of these finns are very
active in innovation, filing many patent applications per year. A study looking at overall
innovation, regardless of industry, and its relationship to foreign learning would be highly
interesting in future research. but that is not within the scope of the present study.
While this research considers theories of cross-cultural management in developing
hypotheses regarding foreign learning, it does not consider national cultural differences in
the development of patent systems. Despite international pressure for patent
hannonization, as well as economic incentives to develop domestic biotechnology
industries, many countries still do not offer patent protection on biotechnology products.
National culture may offer insight into this situation. Future research might consider the
differences in national culture along Hofstede's (1980) cultural dimensions and the
impacts of those differences on national orientations toward patentable subject matter.
Lastly, this research does not consider any network effects within the biotechnology
industry. Previous research has suggested that industry network effects impact the
success, or lack thereof, of high-tech companies, and of biotechnology finns in particular.
82

Recognizing and respecting that previous research, this study endeavored to go in a
different direction, looking at the relationship between foreign knowledge and overall
biotech innovation. Future research might want to investigate whether or not there is a
moderating effect of network on the relationships between foreign learning and overall
biotech innovativeness.
83

CHAPTER 11: DISCUSSION AND CONTRIBUTIONS
The results highlight the importance of foreign learning upon overall innovation in the
biotechnology industry. Even when controlIing for the size of a finn, measured by the
number of employees, the impact offoreign learning on overall innovation is strongly
positive. Although this study does not consider the economic impact of that innovation,
other scholars have noted the positive correlation between innovative activity and profits
in this industry (e.g. Phene et aI., 2006; Roberts, 1999), suggesting that finns wishing to
achieve higher profits will wish to produce as much innovation as possible. This study
indicates one way (global industry scanning) that finns may begin to achieve that goal.
This study's results also indicate that a strong home-country bias persists in this industry.
The biotechnology industry is often touted as being global, but a global industry would
be expected to have fewer discernible national border effects than a regional or national
industry. The finding of the home-country bias suggests that this industry does not yet
live up to its global reputation. It also wams of a lack of efficient resource use, as finns
that do not scan the globe for innovations upon which to build risk duplicating efforts of
other finns, as well as missing important competitive elements affecting the industry,
which may impair a finn's ability to successfully differentiate itselfin the marketplace.
That ability to differentiate oneself, to be unique in an area of innovation, is necessary to
attract venture capital funds in this industry. Those funds, in tum, are vital to a finn
building, sustaining, and improving its research and development and, by extension, its
success in the marketplace. If a finn, for example, fails to effectively scan the globe for
84

new innovation, and ends up accidentally duplicating the work of a foreign competitor, or
pursuing the same end goal simultaneously with another foreign competitor, the firm
loses its special, unique differentiation, and must now be forced to compete for venture
capital funds, as well as for joint venture and acquisition deals, on the basis of something
other than differentiation. This industry is not yet mature enough to allow for
competition based on cost, so differentiation is the only way for biotech firms to position
themselves. In an industry that does not yet have room for cost leaders, losing one's
differentiation can be deadly.
This research contributes to the existing body ofiiterature on knowledge transfer and
organizationalleaming by looking at the location of the 'knowledge parent' of the
innovation in a relatively new industry. Biotechnology traces its roots to the early \ 970's
and the industry acquired international prestige in the 1990's (Robbins-Roth, 2000),
which suggests that the industry is at an embryonic or growth stage of the industry
Iifecycle. Much has been written on organizational learning and the knowledge resource
in mature, established industries, but there are still gaps in the literature regarding
knowledge resources in new industries, particularly with regard to international
knowledge resources. This dissertation attempts to address those gaps by showing how
global competitors in a high-tech industry make use of the knowledge of their current or
potential rivals. Furthermore, much of the existing literature on biotechnology focuses on
networks, and much of that research has been done at the domestic (American) level,
using commercial datasets. This study is one of the first to look at international
knowledge resources using a specially-developed patent citation dataset. This study is
85

also one of the first to integrate an understanding of the legal systems of patents around
the world, and their impact on where and how patents are filed, into international
business research on biotechnology. In this way, this dissertation contributes to the
overall knowledge of the workings of the biotechnology industry, as well as to overall
management theory regarding knowledge flows.
While previous research has used patent citation methods to study knowledge flows, and
there have been some seminal works on the issue, (e.g. Jaffe et al .. 1993; Frost, 2001;
Almeida & Phene, 2004; Cantwell & Vertova, 2004), this study differs from those studies
in a number of ways. Frost's (2004) study used a patent citation study to look at the
geographic sources of knowledge and the relationship between the home country of a
firm and the host country in which its subsidiary is located. The study considered
knowledge used by U.S.-based subsidiaries of multinational firms, and looked at the
influence of the home country versus that of the host country regarding knowledge
sources used by those subsidiaries. Almeida and Phene (2004) studied the influence of
the host country on knowledge creation using a patent citation study, looking at overseas
subsidiaries of U.S. firms in the semiconductor industry. As with Frost's (2004) study,
Almeida and Phene's (2004) research was concerned with the relationship between the
host country of the subsidiary and the home country of the multinational corporation.
Other studies have used patent citation studies to look at the technological diversification
of countries (e.g. Jaffe et al .• 1993; Cantwell & Vertova, 2004). By contrast, this study
takes a different direction, and does not consider the effect of foreign subsidiaries upon
the innovativeness of the parent firm. Indeed, many of the firms considered in this data
86
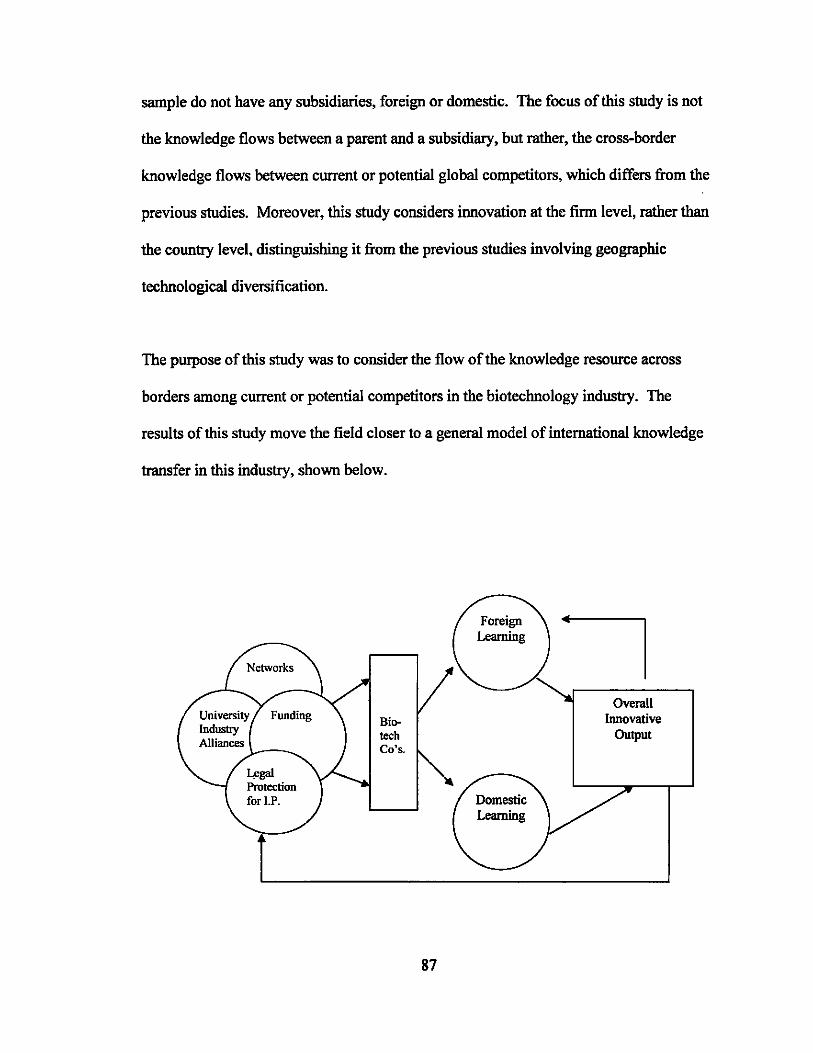
sample do not have any subsidiaries, foreign or domestic. The focus of this study is not
the knowledge flows between a parent and a subsidiary, but rather, the cross-border
knowledge flows between current or potential global competitors, which differs from the
previous studies. Moreover, this study considers innovation at the firm level, rather than
the country level. distinguishing it from the previous studies involving geographic
technological diversification.
The purpose of this study was to consider the flow of the knowledge resource across
borders among current or potential competitors in the biotechnology industry. The
results of this study move the field closer to a general model of international knowledge
transfer in this industry, shown below.
Biotech Co's.
87
Overall innovative
Output

Previous research has discussed the relationship between position in a network,
university-industry alliances, and funding opportunities in this industry (e.g. Powell &
Owen-Smith, 1998; Lynskey, 2004; Powell et aI., 2005). Other research has considered
the differing levels of protection countries offer the field of biotechnology (e.g. Nielsen,
2007). That research. taken together, suggested that there are more biotechnology firms
in locations that offer favomble positions in networks, opportunities for university
industry alliances, legal protection for biotechnology's products, and funding for the
industry. This study tested the relationship between foreign learning and overall
innovative output, and found that firms that engage in more foreign learning have greater
overall innovative output. which encoumges more foreign learning in the subsequent year.
Future research will attempt to tease out the relationship between domestic learning and
foreign learning, as well as to determine if there is an absorptive capacity effect upon
domestic learning, in which domestic learning in one year is followed by greater amounts
of domestic learning in subsequent years. These, as well as other relationships in the
model will be tested in future research.
The findings of this study raise a question regarding the global nature of the
biotechnology industry. Much of the business-related literature in the popular press
refers to this industry as the 'global biotechnology industry.' The findings of this
research, however, suggest a strong home country bias in knowledge sourcing still exists
in this industry, leading to the question of whether or not this industry is truly global. In
answering this question, the findings of this study support Rugman and Moore's (2001)
argument that globalization as it is tmditionally interpreted does not truly exist, and that
88

as the move towards international business continues, established existing business
patterns will be strengthened. This trend certainly seems to be true in the case of the
biotechnology industry, as there is a strong home-country bias in the patent citation
patterns of biotechnology finns, despite a steady growth in both the number of finns as
well as overall revenues worldwide.
This study further enhances our understanding of the vicarious learning of the finn: it
does, indeed, appear to be geographically limited, and yet, overcoming that geographical
limitation seems to be an important factor in increasing overall innovativeness.
Considering Grant's (1996) concept of the knowledge-based view of the finn, it is not
just overall knowledge that is important to finn perfonnance, but a willingness to
transcend national boundaries in acquiring and using that knowledge that is important in
increasing overall innovative output. Nonaka and Takeuchi's (1995) emphasis on
acquiring, creating, and exploiting knowledge as a capability of the organization also
appears to be strengthened, as those finns that used more foreign knowledge had greater
overall output than did finns that did not use foreign knowledge.
Additionally, this research offers contributions at the managerial level. Biotech is a
rapidly-changing and lucrative industry that has attracted the attention of venture
capitalists as well as oflocal and national governments. which hope to capture a larger
share of the global market share in biotechnology (e.g. Einhorn et al., 2005; Weintraub,
2006). With stakes as high as they are in this industry, managers cannot afford to waste
precious finn resources ore-inventing the wheel.' The results of this study suggest,
89

however, that those resources are, to some degree, currently being spent doing just that,
due to a lack of global industry scanning and over-emphasis on a firm's home country's
patents. Thus, the results of this study should serve to guide managers in their pursuit of
new innovation in the biotech industry.
90

APPENDICES
Appendix A: STATE BY STATE INITIATIVES TO LURE BIOTECH IN THE U.S.
Alabama: Governor Bob Riley recently announced a goal to develop biotechnology in
Alabama by committing $50 million to construct facilities for biotech research, and also
proposed an additional $50 million to support university-industry research at the
University of Alabama, Birmingham. In 2002, the legislature of Alabama passed
legislation providing $100 million in tax credits to insurance companies that
invest in venture capital funds that are related to biotechnology.
Arizona: In 2002, the government unveiled its Arizona Bioscience Roadmap,
delineating strategies to strengthen the state's biotechnology research power. Recent
activities include a 2003 authorization of $440 million for the construction of biotech
research facilities; a community college bond issue of $950, which includes $100 million
for bioscience training; and an angel investor tax credit. Additionally, Arizona has the
ASU (Arizona State University) Catalyst Fund, which invests in industry-university
collaborations, in amounts ranging from $25.000 to $50,000. This fund was seeded in
2004 with an initial investment of $425,000.
Arkansas: The state has a collaborative of five public and private institutions called the
Arkansas Bioscience Institute, which is funded by 22.8% of the payments made to
Arkansas's Tobacco Settlement Trust. This fund genera11ybrings in $12 to $13 million
dollars a year, which supported 115 bioscience projects in fiscal year 2005.
91

California: State votes approved Proposition 71 in 2004, creating the California Institute
of Regenerative Medicine (CIRM), which authorized $3 billion in bond fimding to
finance a yearly competitive grant program for biotechnology. The CIRM is
headquartered in an office building in San Francisco, which is paid for by the city
government of San Francisco. The many campuses of the University of California are
encouraging interdisciplinary research in biotechnology through the Institutes for Science
and Innovation. These institutes are financed by $100 million bond issues, and state
financing must be matched at a 2 to I ratio by private industry.
Connecticut: The state, in 1989, created the Connecticut Innovations to be a leading
investor in high-tech research, which focuses on R&D in bioscience, energy and
environmental issues, and information technology. Although Connecticut Innovations
was originally fimded through a state bond issue, the organization has financed
investments since 1995 entirely through its own investment returns. In 2005, Governor
M. Jodi Rell proposed a 2006 budget that included $20 rnillion over two years for stern
cell research. The Connecticut legislature agreed to that request, and actually expanded
the financial commitment to $10 million over 10 years to fimd stem cell research.
Delaware: The state has invested in research facilities, with $22.5 million for the
Delaware Biotechnology Institute at the University of Delaware. The state has also
benefited from private sector fimding, with DuPont pledging $80 million over five years
to create an Innovation Center in Wilmington, to incubate new science-related businesses
92

based upon DuPont's technology. Additionally, Governor Ruth Ann Minner proposed
and created a New Economy Initiative, which focuses on high-tech scientific businesses.
The Initiative provides funding for bioscience research at public universities in Delaware,
as well as providing $3 million for investment in venture capital funds that are looking to
support Delaware science business deals.
Florida: Governor Jeb Bush's 2006-2007 budget for the state of Florida included several
initiatives to lure biotechnology companies to Florida (Weintraub, 2006). These
initiatives included funds to expand university research centers, funds to recruit leading
scholars and researchers in the area, and incentives to encourage high-impact
biotechnology research in the field of medicine. New state-supported facilities include a
$40 million complex at the University of Southern Florida Research Park and a $26
million facility for the Space Life Sciences Lab at the Kennedy Space Center, with space
and money specifically earmarked for university science researchers. Additionally,
Florida allocates part ofits tobacco settlement to support biotechnological research. In
2005, this program gave $8 million to 16 different biotech projects.
Georgia: Georgia has the Georgia Research Alliance, a consortium to commercialize
university research. The Alliance has invested more than $400 million since its inception
in 1990 into Georgia research universities and their research commercialization
programs. Governor Perdue's 2007 budget included recommendations for support of
biotechnology, including $5 million to expand the state's Biosciences Seed Fund, another
$5 million to expand the state's Life Sciences Facilities Fund, an additional $5 million for
93

a marine bioscience building, $2.5 million to expand the Georgia Research Alliaqce
VentureLab program, $2 million to "eed research to develop alternative fuels, and
$200,000 to create a new research fund.
Hawaii: In 2005. several Hawaiian organizations, including the Hawaii Life Sciences
Council, Enterprise worked in collaboration to create the Hawaii Life Sciences Roadmap.
This roadmap builds upon bioscience research and aims to help Hawaii exploit its
geographic location to target agriculture and aquaculture research, and its multicultural
population to target Pan-Pacific infectious diseases. Hawaii is one of the leading states in
the U.S. in plant biotechnology Hawaii also provides venture capital tax credits for
funds focusing on biosciences. To facilitate commercialization of university research, the
University of Hawaii at Manoa's Shidler College of Business hosts an annual business
plan competition, and the University's Office of Technology Transfer and Economic
Development provides a supplemental award of $20,000 for winning plans that aim to
license university technology. To further help the commercialization of life sciences
research, Hawaii has the Hawaii Technology Development Venture, funded by the Office
of Naval Research, which provides funds for the commercialization of life sciences
technologies. Additionally, the state has the High Technology Development Corporation,
which provides state matching funds to federal awards, as well as a fund by the
University of Hawaii angels, which provides pre-seed investments from $25,000 to
$100,000 in the life sciences. To address labor shortages in high-tech research and attract
top scholars and researchers to the area, the Maui Economic Development Board has
implemented a "Kama'aina Come Home" program to entice people working in
94

biotechnology who were originally from Hawaii to return to the Islands to work. This
program is in response to a perceived "brain drain," where Hawaii's best and brightest
students tend to move to the mainland U.S.A. in search of better employment and
research opportunities.
Illinois: The lllinois Department of Commerce and Economic Opportunity has targeted
the life sciences as a key sector for development, and the state has added state monies to
the pre-seed fund operated by the University oflllinois which targets life sciences.
Additionally, Governor Blagojevich called for the Department of Public Health to
commit $10 million for stem cell research. The state has committed millions of dollars to
construct research centers across the state, and has many financing activities to support
bioscience commercialization. The lllinois Finance Authority makes investments of
$150,000-$300,000 in early-state companies. Other early-state investments are available
from the Illinois Emerging Technology Fund and from Bio-Angels of Lake Bluff, which
is a network of angel investors willing to invest up to $1 million in bioscience deals.
Additionally, the state's pension funds may invest up to one percent in bioscience-related
venture capital funds with exposure to Illinois Deals.
Iowa: Iowa has a "biotech outreach education program," aiming to attract biotechnology
research firms to its state (Iowa State University News Release, April, 2004). The Iowa
Board of Regents requested $20 million in 2006 and a total of$50 million over the
following
95

three years to fund research infrastructure, including facilities, faculty, and research
commercialization activities. Additionally, the state created the Grow Iowa Values Fund
in 2005 to provide funding to support biotechnology development initiatives. This fund
will provide $500 million over ten years to support biotechnology research and
commercialization of research.
Kansas: The Kansas Bioscience Authority, an organization responsible for developing
biotechnology business in Kansas, was established in 2005. Kansas' goal is to fund the
authority with tax revenues coming from the life sciences sector, with projection of$580
million over a decade. Kansas has introduced and reinforced tax credits for venture
investment in biotechnology. In 200 I, the Board of Regents floated $130 million in
revenue bonds for new research and development facilities. The University of Kansas
recently finished constructing a $55 million building at its Medical Center in Kansas
City, and Kansas State University recently finished construction on a $54 million Bic
Security Research Facility in Manhattan, Kansas. The Kansas Technology Enterprise
Corporation receives $6.5 million annually to support high-technology research, and
allocates $2.4 million of that to a fund that supports commercialization of research.
Additionally, the KTEC offers matching grants, from $5,000 to $125,000 to encourage
university-industry collaborative efforts.
Louisiana: The state continues to support bioscience clusters in New Orleans, Shreveport,
and Baton Rouge. In 2005, ~e legislature passed a bill creating the Greater
96

New Orleans Biosciences Economic Development District, which is designed to give
support to academic and private bioscience research and commercialization. In 2005,
BioSpacel opened in InterTech Science Park, a research park that is located near
Louisiana State University's Health Science Center. This was funded by the Louisiana
Higher Education Bioscience Initiative. Also in 2005, the Louisiana Emerging
Technology Center, a science business incubator, was opened in Baton Rouge and is
already full, requiring additional planning for a second building to provide space for
science businesses.
Massachusetts: Massachusetts already has an active and successful biotech industry,
with Boston being one of the top three biotech regions in the country. To continue in that
tradition, the state has implemented numerous policies to encourage and sustain its
vibrant life sciences industry. These initiatives include the Industry Development
Program, which works in close partnership with state agencies as the first point of contact
for biopharmaceutical companies to assist those companies on issues of site selection,
permitting, and financing. The 2003 Economic Stimulus Act established the Johns
Adams Innovation Institute, which gives the state the ability to make grants for
research-based initiatives, including a $20 million Research Center Matching Fund to
help in attracting federal and/or industrial support for biotechnology. Additionally the
University of Massachusetts recently began the Massachusetts Technology Transfer
Center, which provides funding to technology commercialization offices at all the state's
major public and private institutions.
97

Maryland: In Governor Ehrlich's 2007 budget, he proposed several new life sciences
initiatives, including $66 million for infrastructure and research funding. The budget
proposal also made changes in tax policy to encourage biosciences. A Biotechnology
Investment Incentive Act was passed in 2005, to create tax credits for those who invest in
qualified biotechnology firms within the state. The budge also allocated money to
continue to develop bioscience research parks in Baltimore at the University of
Maryland.
Michigan: The Granholm administration proposed the 21 st Century Jobs Fund in 2005,
which is a $2 billion economic development initiative that targets, among other areas, the
life sciences. This fund pledges the stat's tobacco revenues to support high-technology
initiatives through 2015. This funding is for basic and applied research as well as for
commercialization of that research. The fund also sets aside $100 million for capital
formation initiatives, including tools designed to encourage private-sector lending to the
life sciences. Additionally. between 2005 and 2006, MichBio, the state-level affiliate of
the National BID organization, began offering support for commercialization of research
to manufacturers, including the automotive supplier Delphi, who wish to diversifY into
the biotechnology area.
Minnesota: During the five years from 2000 to 2005, the Minnesota Legislature
approved $240 million in bond funding for bioscience-related research laboratories
throughout the state. Additionally, in 2005, a consortium ofhea\thcare institutions,
bioscience companies, universities, and state government departments called the
98

BioBusiness Alliance of Minnesota developed BioMinnesota 2025, the state's 20-year
plan to help shape the bioscience policy of Minnesota. The state provides support for
colIaborative research between the Mayo Clinic and the University of Minnesota in the
area of medical genomics applications, committing $70 million over five years for that
research.
Missouri: In an effort to bring the state's life science initiatives together, Governor Blunt,
in 2006, moved the Missouri Life Sciences Research Board operation to the Missouri
Department of Economic Development. In Governor Blunt's 2006 budget proposal, he
called for $38.5 million to be allocated to a fund administered by the Life Sciences
Research Board. In 2006, the Governor unveiled the Lewis and Clark Discovery
Initiative to support the state's·biosciences organizations.
Nebraska: The Nebraska Advantage initiative of2006 included many incentives to
encourage high-tech start-up and early-stage businesses that invest in Nebraska and hire
Nebraskans. These incentives include investment credits, wage credits, lowered or no
corporate taxes, research and development tax credits, as welI as other initiatives. The
University of Nebraska at Lincoln (UNL) has begun raising money for a $15 million
complex to house the Nebraska Center for Virology. The University of Nebraska
Medical Center recently moved into the $77 million Durham Research Center, which was
funded by both private and public monies. The Board of Regents funds an academic seed
fund initiative called the Nebraska Research Initiative to support bioscience and
biosecurity research.
99

New Hampshire: In 2002, a governmental study recommended developing bioscience
business incubator facilities that would capitalize upon the state's universities. The first
incubator, developed in collaboration with Dartmouth University, opened in 2006. In
2004, New Hampshire became a member state in the National Science Foundation's
Experimental Program to Stimulate Competitive Research.
New Jersey: In December of2005, New Jersey became the first state to provide state
funding for research on human embryonic stem cells. The New Jersey Commission on
Science and Technology earmarked $5 million in grants to establish the New Jersey Stem
Cell Institute (NJSCI). The state created the nation's first public umbilical cord and
placental blood bank. The NJSCI, in 2005, funded 17 stem cell research projects, with
each project receiving approximately $300,000. New Jersey also provides a great deal of
public monies for bioscience infrastructure; the most recent life sciences facility to be
funded by state monies was the Life Sciences Building, a $28 million building at Rutgers
in Piscataway. New Jersey has initiatives to provide bioscience incubators, research
parks, and top talent to New Jersey-based biotechnology firms. The talent initiatives take
the form of post-doctorate fellowships, offered by the NJSCI, which provides $55,000
technology fellowships to postdoctoral students, allowing them to spend time with early
state companies. Additionally, several of the state's largest pharmaceutical companies
partner with Rutgers Graduate School of Management to sponsor an MBA in
pharmaceutical management, to grow local talent in the biosciences. To further that end,
100

the New Jersey Association for Biomedical Research offers a research fellowship for
high school students to introduce promising young students to life science research.
New York: The state of New York has many programs for high-tech economic
development, all of which are operated by the New York State Office of Science,
Technology and Academic Research (NYST AR). The state offers a tax credit program,
which includes refundable tax credits of up to $250,000 per year per firm to cover both
direct and indirect costs of research, including actual research and development, as well
as costs for such things as training, fund-raising, and facilities. Governor Pataki has
proposed a $200 million Biotechnology and Biomedicine Research Initiative to
encourage faculty recruitment and infrastructure development. The Governor also has a
Centers of Excellence initiative, which provides matching state funding for the costs of
start-up firms. NYSTAR operates a program to match federal awards from such agencies
as the National Science Foundation (NSF). In 2005, it granted Cornell University $1.2
million to allow the University to leverage the NSF Nanobiotechnology Center. To
develop and lure talent, NYSTAR runs two programs. One is the Faculty Development
Program, which helps recruit top bioscience scholars by giving monetary awards to
bolster recruiting packages. In 2005, $4.4 million in total was given to assist Columbia,
the University at Buffalo, and Cornell University in their recruiting efforts. NYST AR
also runs the James D. Watson Investigator Initiative, which recognizes and supports
young researches. In 2005, the program awarded a total of$3.2 million to young faculty
researching in the biosciences in the state of New York.
101

North Carolina: The state has many partnerships to cultivate and sustain biotech clusters
in the Research Triangle region, which includes Raleigh. Durham, and Chapel Hill, as
well as the Piedmont-Triad region, which includes Winston-Salem, Greensboro, and the
High Point regions. In 2004, the state developed a New Jobs Across North Carolina
bioscience strategy to expand the state's biotechnology industry. As do many other
states, North Carolina allocates a portion of its tobacco settlement funds to fund
bioscience business within the state. North Carolina provides public monies for life
science research facilities, including the $35 million College of Veterinary Research
Building at North Carolina State University's Centennial Biomedical Campus, as well as
the $35 million Bioinformatics Research Center at UNC Charlotte, the new $180 million
research facility for UNC Chapel Hill's Cancer Center, and the $60 million
Cardiovascular Disease Institute at East Carolina University. The state-run
Biotechnology Center offers funding to universities to help with faculty recruitment and
offers grants for university-industry collaborative research projects.
Ohio: In 2002, Governor Taft unveiled a $1.6 billion project called the Third Frontier
Project to encourage the growth of the state's economy through high-tech research and
innovation activities. This project identified five focus areas for development, of which
one was biotechnology. The funding for this project comes mainly from state capital
funds, revenues for the tobacco settlement, and bond issues. As of the beginning of 2006,
more than $300 million of these funds had been awarded to research projects, with 60%
being applied to biotechnology activities.
102

Pennsylvania: In 2005, the Pennsylvania Department of Community and Economic
Development released its Biosciences Continuum strategy, emphasizing collaborative
efforts between the state's universities, new science-based companies, and mature
pharmaceutical companies. Public funding for various development programs comes
from the state's Tobacco Settlement Investment Board and is matched by local
communities. In 2006, this board committed $60 million in new capacity for loans to in
state venture partnerships in the life sciences. In Govemor Rendell's 2006 budget
proposal, he suggested that a portion of the 19% of the tobacco settlement monies that are
currently used to fund research initiatives be diverted to a $500 million bonding capacity
for a Jonas Salk Legacy Fund to support life science faculty recruitment and the
construction of research facilities.
Rhode Island: Voters in Rhode Island recently approved a $50 million bond issue to
support the construction of new biotechnology facilities at the University of Rhode
Island. In addition to this facility, the Governor announced support for $140 million in
additional bond funding for related facilities in pharmacy, nursing, and chemistry in an
effort to develop a large health science cluster.
South Carolina: The state, like other states, is offering public funding to assist with
faculty recruitment, putting $20 to $30 million per year into faculty endowments as well
as $220 million in discretionary bonding authority for facility construction. The faculty
development funds come largely from state lottery proceeds.
103
Tennessee: Governor Bredesen has stated a commitment to recruiting in high-tech
industries, in particular targeting research in alternative fuels. To that end, has fonned
the Governor's Interagency Alternative Fuels Working Group, which has representatives
from six different state agencies. Funding includes $1.6 billion in capital investments for
the Oak Ridge National Laboratory and a one billion dollar annual program budget for
the state's biotech effort. This amount includes $20 million for the recruiting oftop
faculty and an additional $8 million state investment in the Joint Institute for Biological
Sciences.
Texas: Governor Perry's Industry Cluster Initiative targets six technology sectors, and
biotechnology is among the six. Biotechnology is supported through the $200 million
Texas Emerging Technologies Fund, which the Perry administration created in 2005, to
support research and commerciaIization. In 2005, the Texas Enterprise Fund financed
$50 million of start-up costs for the Texas Institute of Genomic Medicine, a collaborative
effort involving Texas A&M and Lexicon Genetics, a private biotechnology firm.
Virginia: Virginia's 1996 economic plan included attracting biotechnology to the state.
The state launched the Virginia Biotechnology Association in 1992, a cooperative
between industry, govermnent, and universities to create and sustain a favorable business
environment for biotech research. Governor Kaine and fonner Governor Warner jointly
proposed a $520 million investment package for the major research universities in the
state, aiming to boost basic research as well as help recruit top research faculty in the
areas of biomedical science, biomaterials engineering, and nanotechnology. The
104

initiative also provides funding for research facilities at George Mason University,
Virginal Commonwealth University, Virginia Tech, and the University of Virginia.
Washington: The Gregoire administration recently created a $350 Life Sciences
Discovery Fund, which will begin allocating $35 million per year, beginning in 2008,
from the tobacco settlements to research proj ects with commercial potential, as well as to
facuIty recruiting efforts. The state hopes that this initiative will create 20,000 jobs
within 15 years for the citizens of Washington. The Bill and Melinda Gates Foundation
has contributed $20 million to the Department of Global Health at the University of
Washington to help fund start-up costs related to new health-related life sciences
research. Public financing initiatives include a $24 million joint project of Washington
State University and Battelle's Pacific Northwest National Laboratory, which will receive
$13 million from the state capital budget, as well as a $150 million facility at the
University of Washington for a Bioengineering-Genome Sciences Building, funded by
public monies as well as by a $70 million gift from the Gates Foundation.
105

Appendix B: Data Table
# Total Biotech Prior Domestic Foreign JapanlUS Company Patents Patents Art Citations Citations USA Abgenix, Inc 11 9 367 211 156 USA Amgen 111 73 2614 1082 1532 USA Anika Therapeutics 2 1 32 19 13
Arena Pharmaceuticals,
USA Inc 8 8 297 63 234 USA Blogen Idec 32 21 443 1 442
BioMarin Pharmaceuticals
USA Inc 1 1 1 0 0 Carrington
USA Laboratories 1 1 27 16 11 Celgene
USA Corporation 23 22 637 497 140 USA Celi Genesys, Inc. 19 18 351 212 139 USA Celi Therapeutics 12 9 246 172 74 USA Cephalon, Inc. 26 13 272 186 86 USA Cerus Corporation 7 1 63 62 1 USA Chiron Corp. 74 58 1475 741 734 USA Corlxa 21 19 302 81 221 USA CV Therapeutics 42 36 464 326 138
Cytogen USA Corporation 2 1 18 5 13 USA DyaxCorp 16 16 763 464 299
EncysiVe Pharmaceuticals,
USA Inc. 2 1 13 1 12 USA Enzo Biochem 4 4 218 186 32 USA Enzon, Inc. 10 9 129 95 34
Genencor USA International 60 51 1006 651 355
USA Genentech 240 96 1538 849 689 USA Genta Incorporated 5 3 33 28 5 USA GenVec, Inc. 6 6 124 60 64 USA Genzvrne 72 46 1820 1322 498 USA Gilead Sciences 22 13 285 176 109 USA lcos 31 28 272 117 155 USA ImmunoGen 17 12 90 62 28
Indevus USA Pharmaceuticals 7 5 26 6 20 USA InterMune, Inc. 2 1 10 7 3
Isis USA Pharmaceuticals 92 27 627 426 201
Kosan Biosciences USA Incorporated 37 20 482 304 178
Ligand Pharmaceuticals
USA Incorporated 22 22 1502 915 587
106

USA 10 11 648 363 . 285 USA , Inc. 8 288 201 87 USA
~ 19 1, 356 239 117
USA 7 5 64 43 21
USA 101 82 967 425 542 USA 21 19 146 116 30
Nabi USA ,,'I~lo 4 4 117 78 39
,y
USA 24 22 453 113 340 NPS Pharmaceuticals,
USA Inc. 11 10 260 109 151 Osi
USA 9 9 313 168 145 , ,y.y' ,n .... lnn
USA Labs 2 2 29 18 11 .u"
Pharmaceuticals, USA Inc. 25 22 101 44 57
USA 1 1 J7 11 6 USA Tanox 4 4 42 26 16
I • g, '~ng'lU"V
USA 2 2 75 41 34 ((nitAt!
USA .. I. 5 3 28 25 3 Vertex Pharmaceuticals
USA 77 42 339 147 192 USA Vical 1 1 43 28 15 USA 2 2 54 47 7 Jaoan Co. 183 128 1278 227 1051 Japan AG Inc 5 5 52 0 _f)~
Japan Japan Ltd':--J 0 0 0 0 0 Japan Asahi Beer Group 3 1 1 0 1
'. "g" "g Japan Inc. 62 60 588 59 529 Japan BML Inc. 2 2 13 0 13 Japan r.AI PI~ CO. Ltd. 1 1 27 1 26
Group I Dallchi Pharmaceutical
Japan Co" Ltd. 54 38 566 131 435
Japan ~g .. ,~ .... u,.
Pharma 11 10 116 10 106
Japan ;:::"~.-~
2 2 8 0 8 Japan Eisai Co., Ltd. 79 64 990 168 822
Japan ~ki Glico Co.
0 0 0 0 0 Japan Fuji au Co. Ltd. 8 4 20 7 13
107

Hamamatsu Japan Photonics Co. 187 5 82 16 66
Institute of Medicinal Molecular Design,
Japan Inc. (IMMD) 1 1 43 8 35 Japan Tissue Engineering Co.
Japan Ltd. 1 1 4 0 4 Japan Japan Tobacco Inc. 60 10 221 23 198
JCR Pharmaceuticals
Japan Co., Ltd. 4 3 2 0 2 Japan KAKETSUKEN 0 0 0 0 0 Japan Kao Corporation 252 62 963 336 627 Japan Klrin Beer Group 36 14 131 10 121
KyowaHakko Japan KOIlYO Co., Ltd. 54 48 569 74 495
L TT Bio-Pharma Japan Co. Ltd. 1 1 5 3 2
Medical & Biological Laboratories Co.,
Japan Ltd. 1 1 3 0 3 Japan MEDINET Co., Ltd. 0 0 0 0 0
Meiji Seika Kaisha, Japan Ltd. 33 26 245 27 218
Mlraca Holdings, Japan IncJSRUFuiirebio 4 2 6 0 6
Mltsublshl Japan Chemical 174 5 58 22 36
Mitsui Chemicals, Japan Inc. 164 21 176 90 86
NanoCarrler Co. Japan Ltd. 3 1 12 7 5
Nippon Kayaku Co. LtdJNlppon Kayaku Food Techno Co ..
Japan Ltd. 44 7 92 50 42 Nippon Shlnyaku
Japan Co. Ltd. 12 8 66 6 60 Ono Pharmceutical
Japan Co., Ltd. 0 0 0 0 0 Otsuka Pharmaceutical
Japan Co., Ltd. 36 15 123 50 73 Pharma Foods International Co.
Japan Ltd. 0 0 0 0 0 Shimadzu
Japan Corporation 180 5 32 15 17 Japan Shlseldo 42 11 113 52 61 Japan Sosel Co. Ltd. 3 1 0 0 0 Japan Sum Homo CorpJ 11 8 86 9 77
108

Sumitomo Pharmaceuticals Intematlonal
Japan Suntory 119 12 46 13 33 Sysmex
Japan Corporation 31 8 66 14 52 Japan Takara Bio, Inc. 19 19 155 17 138
Takeda Pharmaceutical
Japan Co., Ltd 54 41 986 46 940 Tanabe Seiyaku
Japan Co., Ltd. 17 15 231 33 198 TelJln Corp} Teijin
Japan Pharma Limited 3 2 93 21 72 The Nisshin OilliO
Japan Group, Ltd. 7 3 27 18 9 Toray Industries,
Japan Inc. 98 22 309 85 224 Toyo Shlnyaku Co.
Japan Ltd. 0 0 0 0 0 ToyoboCo. LtdJPacific
Japan Biologics 1 1 9 6 3 Yakult Honsha Co.,
Japan Ltd. 3 1 4 0 4
109

TABLES
Table 1.
Correlations and Descriptive Statistics for Overall Innovation: Japan (Hypothesis la)
RIa In Biotech In Foreign Learning Mean Standard Deviation
In Biotech 1.0 .94 2.62
In Foreign Learning .949 .... 1.0 2.43 3.55
In Size .493 .527 7.48 2.09
t<.10, "<.05, .... <.01
Correlations and Descriptive Statistics for Overall Innovation: USA (Hypothesis 1 b)
RIb In Biotech In Foreign Learning Mean Standard Deviation
In Biotech 1.0 2.12 1.35
In Foreign Learning .818"· 1.0 4.01 2.05
In Size .591"· .437 6.07 1.38
t<.10, "<.05, .... <.01
110
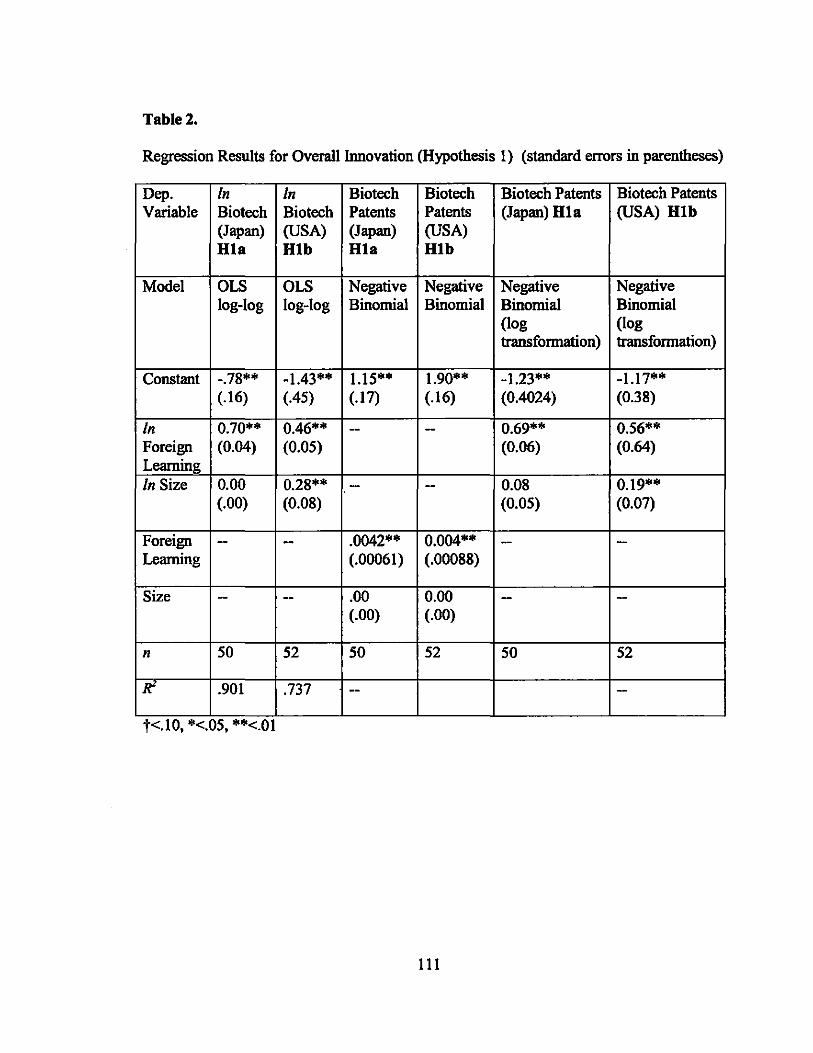
Table 2.
Regression Results for Overa\l Innovation (Hypothesis 1) (standard errors in parentheses)
Dep. In In Biotech Biotech Biotech Patents Biotech Patents Variable Biotech Biotech Patents Patents (Japan) RIa (USA) RIb
(Japan) (USA) (Japan) (USA) RIa RIb Bla BIb
Model OLS OLS Negative Negative Negative Negative log-log log-log Binomial Binomial Binomial Binomial
(log (log transformation) transformation)
Constant -.78** -1.43** 1.15** 1.90** -1.23** -1.17** (.16) (.45) (.17) (.16) (0.4024) (0.38)
In 0.70** 0.46** - - 0.69** 0.56** Foreign (0.04) (0.05) (0.06) (0.64) Learning In Size 0.00 0.28** - - 0.08 0.19**
(.00) (0.08) (0.05) (0.07)
Foreign - - .0042** 0.004** - -Learning (.00061) (.00088)
Size - -- .00 0.00 - -(.00) (.00)
n 50 52 50 52 50 52
If .901 .737 -- -t<.lO, *<.05, **<.01
111

Table 3.
Regression Results for Foreign Learning VS. Domestic Learning (standard errors in parentheses)
Dependent Variable In Biotech HIc In Biotech HIc (aU companies) (all companies)
Model OLS OLS log-log log-log
Constant -1.25** -0.89*" (0.48) (0.31)
In Foreign Learning -- 0.655** (0.03)
In Domestic Learning 0.430** -(0.04)
In Size 0.26** 0.05 (0.07) (0.05)
n 102 102
K .633 .854
t<.10, *<.05, **<.01
112
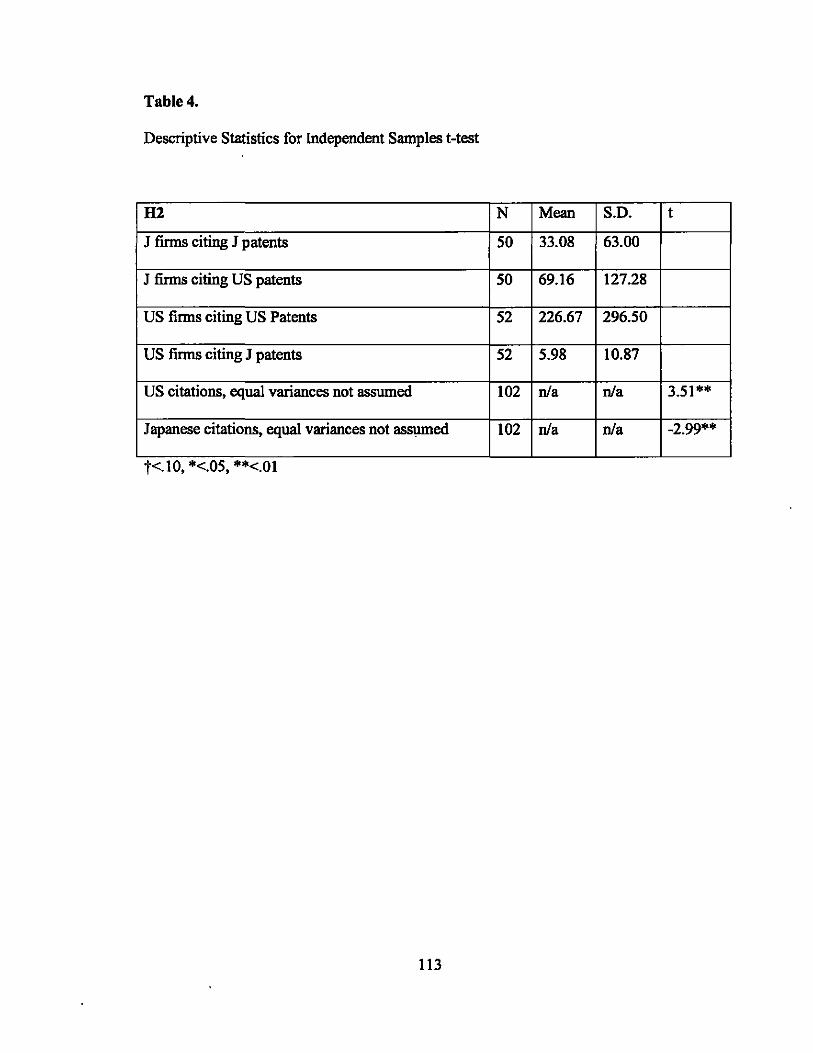
Table 4.
Descriptive Statistics for Independent Samples t-test
H2 N Mean S.D. t
J finns citing J patents 50 33.08 63.00
J finns citing US patents 50 69.16 127.28
US finns citing US Patents 52 226.67 296.50
US finns citing J patents 52 5.98 10.87
US citations, equal variances not assumed 102 nla nla 3.51**
Japanese citations, equal variances not assumed 102 nla nla -2.99**
t<.1 0, *<.05, **<.01
113

TableS.
Logit Regression results (standard errors in parentheses)
Dependent Variable H2 JapanlUSA (0/1)
Constant -.542 (.387)
#US citations .071"'''' (.022)
# Japanese citations -.626"'''' (.200)
n 102
Cox & Snell if .584
Nagelkerke if .779
t<.10, "'<.05, "'*<.0 I
114
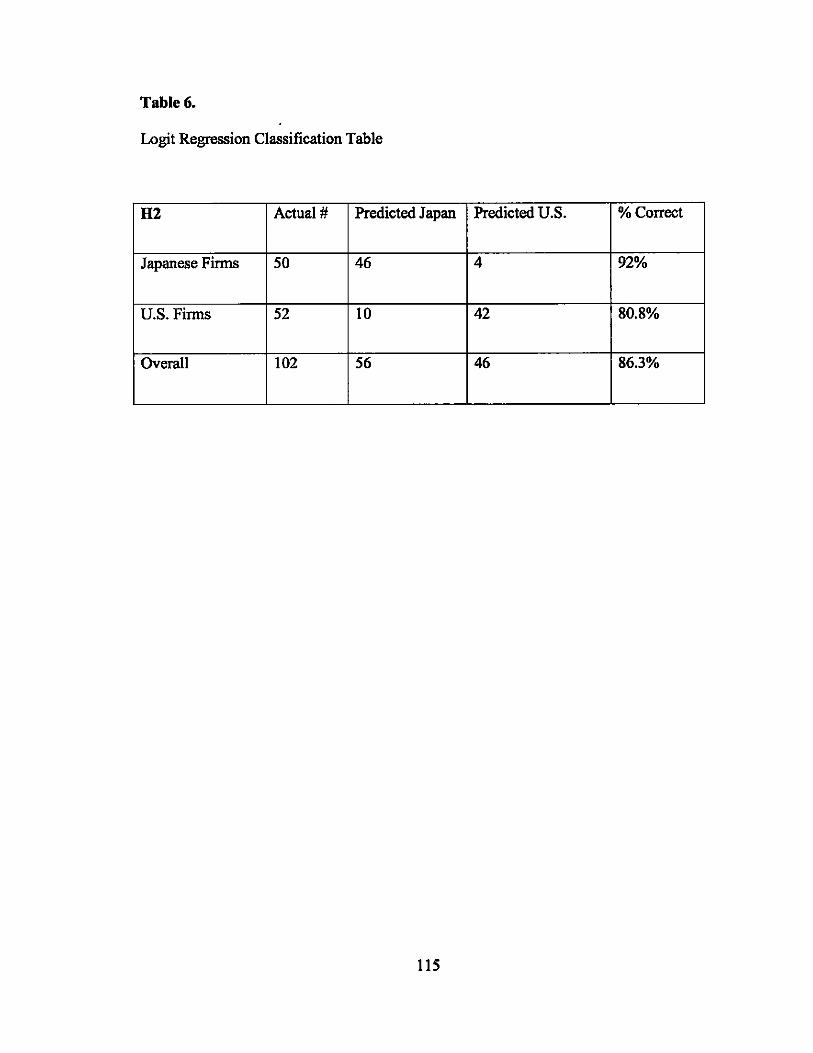
Table 6.
Logit Regression Classification Table
H2 Actual # Predicted Japan Predicted u.s. % Correct
Japanese Firms 50 46 4 92%
U.S. Firms 52 10 42 80.8%
Overall 102 56 46 86.3%
115

Table 7.
Correlations and Descriptive Statistics for Absorptive Capacity: All Companies
IDa Foreign Foreign Size Mean Standard Leaming'03 Leaming'02 Deviation
Foreign 1.0 45.65 91.74 Learning '03
Foreign 0.78 .... 1.0 74.18 114.49 Learning '02
Size 0.40" 0.41 1.0 3826.79 6687.68
Jap/U.S. 0.14t 0.09 -.37 0.51 0.50
n=102 t<.10, "<.05, .... <.01
Correlations and Descriptive Statistics for Absorptive Capacity: Japan
IDb Foreign Foreign Mean Standard Learning '03 Learning '02 Deviation
Foreign 1.0 32.98 58.75 Learning '03
Foreign 0.84** 1.0 63.16 104.oI Learning '02
Size 0.49 0.47 6338.0 8250.53
n=50 t<.10, *<.05, **<.01
116

Correlations and Descriptive Statistics for Absorptive Capacity: USA
H3c Foreign Foreign Mean Standard Learning '03 Learning '02 Deviation
Foreign 1.0 57.83 114.20 Learning '03
Foreign 0.77"'''' 1.0 84.77 123.83 Learning '02
Size 0.84"'''' 0.71 1412.17 3323.29
n=52 t<.10, "'<.05, "''''<.01
117

Table 8.
Regression Results for Absorptive Capacity: USA and Japan (standard errors in parentheses)
Dep. Foreign Learning Foreign Learning Foreign Learning Variable '03 '03 '03
(Japan) H3a (USA) H3b (All Companies) H3e
Constant -0.37 1.45 -16.31 (5.94) (9.37) (9.98)
For. 0.44** 0.33** 0.56"'* Learning (0.50) (0.09) (0.06) 2002 Size 0.00 0.02·* 0.00·
(0.00) (0.00) (0.00)
Japan! -- - 23.76t USA (12.77)
n 50 52 102
R" 0.709 0.774 0.788
t<.10, *<.05, **<.01
118

REFERENCES
Acs, Z.J., L. Anselin, and A. Varga, (2002). Patents and innovation counts as measures of regional production of new knowledge. Research Policy, 31: 1069-1085.
Advisory Commission on Patent Law Reform (1992). A Report to the Secretary of Commerce, in P. Goldstein (ed.) International Intellectual Property Law, (p. 313-326). New York: Foundation Press.
Aguilar, F.J., (1967). Scanning the Business Environment, Macmillan, New York.
Alavi, M. and Leidner, D.E. (2001). Review: KnOWledge Management and Knowledge Management Systems: Conceptual Foundations and Research Issues, MIS Quarterly, 25(1): 107-136.
Almeida, P., (1996). Knowledge sourcing by foreign multinationals: patent citation analysis in the U.S. semiconductor industry. Strategic Management Journal, 17(Special Winter Issue): 155-165.
Almeida, P., and A. Phene, (2004). Subsidiaries and knowledge creation: the influence of the MNC and host country on innovation. Strategic Management Journal, 25(8/9): 847-864.
Almeida, P., and B. Kogut, (1997). The.exploration ofteclmological diversity and the geographic localization of innovation. Small Business Economics, 9(1): 21-32.
Ang, S.H. (2006). Country-of-Origin Effect ofVC Investment in Bioteclmology Companies. Journal of Commercial Biotechnology, 13(1): 12-19.
Ante, S. and Mehring, J. (2007, December 31). Venture Capital Strengthens while Private Equity Slumps. Business Week. Page 17.
Awny, M.M., (2005). Teclmology transfer and implementation processes in developing countries. International Journal of Technology Management, 32 (112): 213-220.
Barney, J .B. (1986).Strategic factor markets: Expectations, luck, and business strategy. Management Science, 32(10): 1231-1241.
Barney, J.B. (1991) Firm resources and sustained competitive advantage. Journal of Management 17(1) 99-120.
Bartholomew, S., (1997). National systems ofbioteclmology innovation: complex interdependence in the global system. Journal of International Business Studies, 28: 241-266.
119

Battelle Technology Partnership Practice, SST!, PMP Public Affairs Consulting, Inc., and Biotechnology Industry Organiution, (2006, April). Growing the Nation 's Biosciences Sector: State Bioscience Initiatives 2006.
Baughn, C.C., Bixby, M., & Woods, L.S. (1997). Patent laws and the public good: IPR protection in Japan and the United States. Business HOrizons, 40(4): 59-65.
Behnke, N. and Hultenscbmidt, N. (2007). New path to profits in biotech: Taking the acquisition exit. Journal of Commercial Biotechnology, 13(2): 78-85.
Bergeron, B. and Chan, P. (2004). Biotech Industry: A Global. Economic. and Financing Overview. John Wiley & Sons: New Jersey
Biotech Deals On The Rise. (2007, April 2). Chemical & Engineering News, 85(14): 26.
Biotech Gamers Largest Share of Venture Capital. (2007, April 30). Chemical & Engineering News, 85(18): 18-19.
Biotech Warriors. (2007, June 28). Business Review Weekly. 29(5): 24-25.
Boari, C., V. Odorici, and M. Zamarian, (2003). Clusters and rivalry: Does localization really matter? Scandinavian Journal of Management, 19(4): 467-489.
Borrell, J. (2005). Asia has Strong Interest in Biotech, But No Infrastructure. Venture Capital Journal, January I, p.I-4.
Campbell, D.T. (1994) How individual and face-to-face group selection undermine firm selection in organizational evolution. In J.C. Baum and J.V. Singh (Eds.) Evolutionary Dynamics of Organizations, New York: Oxford University Press, 23-38.
Cantwell, J., and Vertova, G. (2004). Historical evolution of technological diversification. Research Policy, 33: 511-529.
Cantwell, J., J. Dunning, and O. Janne, (2004). Towards a technology-seeking explanation of U.S. direct investment in the United Kingdom. Journal of International Management. 10(1): 5-21.
Capell, K. (2007, December 6). The Logic of Biotech Bets. Business Week, page 9.
Chambers, J. (2002). Patent eligibility of biotechnological inventions in the United States, Europe, and Japan: How much patent policy is public policy? The George Washington International Law Review, 34(1): 223-247.
Chesbrough, H., (2003). The New Rules of R&D. Harvard Management Update, 8(5): 3-5.
120

Christensen, J.F., (2003). Introduction: the industrial dynamics of biotechnology: new insights and new agendas. Industry & Innovation. 10(3): 223-230.
Cohen, P. (2003). Sun, surf, and science. New Scientist. 177(2389): 54-58.
Cohen, W. M. and Levinthal, D. A. (1990) Absorptive Capactiy: A New Perspective on Learning and Innovation. Administrative Science Quarterly, 35: 128-152.
Cool, K. and D. Schendel (1988). Perfonnance differences among strategic group members. Strategic Management Journal, 9(3): 207-223.
Correa, C. (1994). The GATT Agreement on Trade-Related Aspects ofIntelJectua1 Property Rights: New Standards for Patent Protection. European Intellectual Property Review. 8: 327-329.
DeLong, D.W. and L. Fahey, (2000). Diagnosing cultural barriers to knowledge management. Academy of Management Executive. 14(4): 113-127.
Diamond v. Chakrabarty, 447 U.S. 303 (U.S. Supreme Court, 1980).
Duguet, E. and M. MacGarvie, (2005). How Well Do Patent Citations Measure Flows of Technology? Evidence from French Innovation Surveys. Economics of Innovation and New Technology. 14(5): 375-393.
Durnell Cramton, C., and P.J. Hinds, (2005). Subgroup Dynamics in Internationally Distributed Teams: Ethnocentrism or Cross-National Learning? Research in Organizational Behavior, 26: 231-263.
Einhorn, B., J. Veale, and M. Kripalani, (2005, January 10). Asia is Stem Cell Central. Business Week. p.48-49.
Elenkov, D.S., (1997). Strategic uncertainty and environmental scanning: the case for institutional influences on scanning behavior. Strategic Management Journal, 18(4): 287-302.
Enayati, E. F. (1993). Biotechnology Patent Protection in Japan. Bio/technology. 11: 1056-1058.
European Federation of Biotechnology. (1996). Patenting in Biotechnology. Briefing Paper #1. September:I-4.
European Patent Convention, October 5, 1973. Amended in 1978, 1991, 1994, 1995, 1996,1998.
121

Frost, T., (2001). The geographic sources of foreign subsidiaries innovations. Strategic Management Journal, 22(2): 101-123.
Galunic, D., and S. Rodan. (1998). Resource recombinations in the firm: knowledge structure and the potential for Schumpeterian innovation. Strategic Management Journal, 19(12): 1193-1201.
Gassel, Katrin, and Pascha, Werner. (2000) Milking partners or symbiotic know-how enhancement? International versus national alliances in Japan's biotech industry. International Business Review, 9: 62-640.
GATT Agreement on Trade-Related Aspects of Intellectual Property Rights, Including Trade in Counterfeit Goods (TRIPS), 1995.
Goldstein, P. (2001). International Intellectual Property Law. Foundation Press: New York.
Goodman, A. (2006). The origins of the modern patent in the doctrine of restraint of trade. Intellectual Property Journal. 19(2): 297-324.
Granstrand, 0., P. Patel, and K. Pavitt, (1997). Multi-technology Corporations: Why They Have Distributed Rather than Core Competencies? California Management Review, 39: 8-25.
Grant, R. (1996-a). Prospering in Dynamically-competitive environments: Organizational capability as knowledge integration. Organization Science, 7(4): 375-387.
Grant, R. (1996-b). Toward a Knowledge-Based Theory of the Firm. Strategic Management Journal, 17 (Winter Special Issue): 109-122.
Grant, R. (2005). Contemporary Strategic Analysis. Fifth Edition, Blackwell: Boston, p. 172-179.
Greenhouse. L. (2007. May 1). High Court Puts Limits on Patents. New York Times, p. AI.
Gulati, R., Nohria, N., & Zaheer, A. (2000). Strategic Networks. Strategic Management Journal, 21(3): 203-216.
Gupta, A. and V. Govindarajan, (2000). Knowledge flows within multinational corporations. Strategic Management Journal, 21: 473-496.
Henderson, R.M. and Cockburn, I.M. (1994). Measuring competence? Exploring firm effects in pharmaceutical research. Strategic Management Journal, Special Issue. 15: 63-84.
122

Hofstede, G., (2001). Culture's Consequences, Thousand Oaks, CA, Sage.
Hotchkiss v. Greenwood, 52 U.S. 248, (U.S. Supreme Court, 1850).
House, R., P.J. Hanges, M. Javidao, P. Dorfinan, and V. Gupta, (2005). Culture, Leadership, and Organizations: The GLOBE Study of62 Societies, Sage Publications. Huber, G.P. (1991). Orgaoizational learning: the contributing processes and the literatures. Organization Science, 2:88-115.
Huber, G.P. (1991). Orgaoizationalleaming: the contributing processes and the literatures. Organization Science, 2:88-115.
IBM Leads Patent Recipients, (2008, January 21). Chemical & Engineering News, 86(3): 33.
Itami, H. with T.W. Roehl, (1987). Mobilizing Invisible Assets, Harvard University Press: Cambridge.
Japan Company Handbook. First Edition. (2007. Winter). Tokyo: Toyo Keizai.
Japan Company Handbook, Second Edition. (2007, Winter). Tokyo: Toyo Keizai.
Japan Patent Act of1959, Act No. 121.
JETRO-Japan External Trade Organization. (2005). Attractive Sectors: Biotechnology. Jones, G.R., (2001). Organizational Theory, Third Edition, Prentice Hall: Upper Saddle River, New Jersey, p. 367-387.
Kaodachi, K. (2003). Japan's biotech sector shows signs oflife. Nature Biotechnology, 21(11): 1256-1257.
Katzman, S. (2001). What is patent worthy? European Molecular Biology Organization Report, 2(2): 88-90.
Kedia, B.L. and RS. Bhagat, (1988). Cultural Constraints on Transfer of Technology Across Nations: Implications for Research in International and Comparative Management. Academy of Management Review, 13(4): 559-571.
Kellaway, L. (1999). Lucy Kellaway Column. Financial Times, June 23,1999, p.13.
Kerin, RA., Varadarajan, P.R., & Peterson, R.A. (1992). First-mover advantage: A synthesis, conceptual framework, and research propositions, Journal of Marketing, 56(4): 33-53.
Kikkoman Company Website, Retrieved December 12,2007, www.kikkoman.co.jp.
123
Kogut, B., and U. Zander (1992). Knowledge of the firm, combinative capabilities, and the replication of technology. Organization Studies, 2:383-397.
Koizumi, T., (1982). Absorption and adaptation: Japanese inventiveness in technological development. In S.B. Lundstedt and E.W. Colglazier, Jr. (Eds.), Managing innovation: The social dimensions of creativity, invention, and technology pp.l90-206). New York: Pergamon Press.
Kotter, J.P. and J.L. Heskett (1992). Corporate Culture and Performance, Free Press: New York.
Kotabe, M. (1992). A comparative study of U.S. and Japanese Patent Systems. Journal of International Business Studies, 23(1): 147-168.
Kowalski, T.J., Maschio, A., and Megerdichian, S.H .. (2003). Dominating global intellectual property: Overview of patentability in the USA, Europe, and Japan. Journal of Commercial Biotechnology, 9(4): 305-331.
Lant, T.K. and Mezias, SJ. (1992) An organizationalleaming model of convergence and reorientation. Organization Science, 3: 47-71.
Levitt, Barbara. and March, James. (1988) Organizational Learning. Annual Review of Sociology, 14: 319-340.
Lieberman, M.B. & Montgomery, D.B. (1988). First-mover advantages, Strategic Management Journal, 9: 41-58.
Liebeskind, J.P. (1996). Knowledge, Strategy, and the Theory of the Firm. Strategic Management Journal. 17 (Winter Special Issue): 93-107.
Lin, B.W., Chen, C.J., and Wu, H.L. (2007). Predicting citations to biotechnologypatents based on the information from patent documents. International Journal of Technology Management, 40(1-3): 87-100).
Lippman, S.A. and R.P. Rumelt. (2003). A bargaining perspective on resource advantage, Strategic Management Journal, 24: 1 069-1 086.
Lynskey, M.J. (2004). Determinants of innovative activity in Japanese technology-based start-up firms. International Small Business Journal, 22(2): 159-194.
Lynskey, MJ., (2004). Bioentrepreneurship in Japan: Institutional Transformation and the Growth ofBioventures. Journal of Commercial Biotechnology, 11(1): 9-38.
Lynskey, M.J. (2004). The commercialization ofbiotechnoiogy in Japan: bio-ventures as a mechanism of knowledge transfer from universities. Intemational Journal of Biotechnology, 6(2-3): 155-185.
124

Machlup, F. & Penrose, E. (1950). The patent controversy in the nineteenth century. The Journal of Economic History, 10(1): 1-29.
March, J.G., (1991). Exploration and exploitation in organizationalleaming. Organizational Science, 2:71-87.
March, James G. and Simon, Herbert A. (1958) Organizations, New York: Wiley.
Mason, R.M., (2003). Culture-free or culture-bound? A boundary spanning perspective on learning in knowledge management systems. Journal of Global Information Management, 11(4): 20-37.
May, R.C., S.M. Puffer, and D.J. McCarthy, (2005). Transferring management knowledge to Russia: A culturally based approach. Academy of Management Executive, 19(2): 24-36.
May, R.C., W.H. Stewart, Jr., and R. Sweo, (2000). Environmental scanning behavior in a transitional economy: evidence from Russia. Academy of Management Journal, 43(3): 403-427.
Med Ad News. (2005). Top 100 Biotechnology Companies. July 14: 1.
Merton, R.K. (1968). Social Theory and Social Structure, New York Free Press. Michailova, S. and K. Husted, (2003). "Knowledge-Sharing Hostility in Russian Firms," California Management Review, 45(3): 59-78.
Michailova, S. and Husted, K. (2003). Knowledge-Sharing Hostility in Russian Firms. California Management Review, 45(3): 59-77.
Miner, Anne S. and Mezias, Stephen J. (1996) Ugly Duckling No More: Pasts and Futures of Organizational Learning Research. Organization Science, 7(1):88-99.
Mitsumori, Y. (2005, July). The Biotechnology Industry in Japan-an update on policies and programmes, British Embassy: Tokyo, Japan.
Morrissey, S. (2007, May 7). Supreme Court Rules on Patents. Chemical & Engineering News, 85(19): 13-14.
Mowery, D.C., Oxley, J.E., & Silverman, B.S. (1996). Strategic Alliances and Interfirm Knowledge Transfer, Strategic MaTUJgement Journal, 17: 77-91.
Mowery, David C. (1983) The relationship between intrafirm and contractual forms of industrial research in American manufacturing, 1900-1940. Explorations in Economic History, 20: 351-374.
125
Muller, Christian, Fujiwara, Takao, and Herstatt, Cornelius. (2004) Sources of Bioentrpreneurship: The Cases of Germany and Japan. Journal of Small Business Management, 42(1): 93-101.
Nielsen, J. (2007). Innovation in medical biotechnology: Mapping the intersection of intellectual property and competition law. Australian Business Law Review, 35(6): 407-433.
Nonaka, I. (1994). A Dynamic Theory of Organizational Knowledge Creation. Organization Science, 5(1): 14-37.
Nonaka, I. and N. Konno. (1998). The Concept of 'B': Building a Fonndation for Knowledge Creation. California Management Review, 40(3): 40-54).
Nonaka, I., and H. Takeuchi, (1995). The Knowledge-Creating Company: How Japanese Companies Create the Dynamics of Innovation, Oxford University Press: New York.
Okada-Takagi, M. (1997). Intellectual property law in Biotechnology. Medicine and Law. 16:9-16.
Owen-Smith, J. & Powell, W.W. (2003). The expanding role of university patenting in the life sciences: assessing the importance of experience and connectivity. Research Policy, 32: 1695-1711.
Owen-Smith, J., Riccaboni, M., Pammolli, F., and Powell, W., (2002). A Comparison of U.S. and European University-Industry Relations in the Life Sciences. Management Science, 48(1): 24-43.
Paris Convention for the Protection of Industrial Property. March 20. 1883. Revised in 1900,1911,1925,1934,1958, and 1967.
Patent Cooperation Treaty, 1970, modified in 1979 and 1984.
Penrose, E.G .• 1959. The Theory of the Growth of the Firm. Wiley, New York.
Peteraf, M.A. (1993). The cornerstones of competitive advantage: A resource-based view. Strategic Management Journal, 14: 179-191.
Peters, Pamela. (1993) What is biotechnology? Biotechnology: A guide to genetic engineering, William C. Brown Publishers, Inc.
Phene, A. and Tallman, S. (2002). Knowledge flows and geography in Biotechnology. International Journal of Medical Marketing, 2,3: 241-254.
Phene, A., and P. Almeida, (2003). How do firms evolve? The patterns oftechnological evolution of semiconductor subsidiaries. International Business Review, 12(3): 349-368.
126

Phene, A., K. Fladrnoe-Lindquist, and 1. Marsh, (2006). Breakthrough innovations in the U.S. biotechnology industry: the effects oftechnological space and geographic origin. Strategic Management Journal, 27: 369-388.
Platzer, M. (2007). Patient capital: how venture capital investment drives rovlutionary medical innovation. National Venture Capital Association, Arlington, Virginia. www.nvca.org.
Powell, W.W. & Owen-Smith, J., (1998). Universities and the market for intellectual property in the life sciences. Journal of Policy Analysis and Management, 17(2): 253-277.
Powell, W.W., K.W. Koput, 1. Smith-Doerr, (1996). lnterorganizational collaboration and the locus of innovation: networks ofleaming in biotechnology. Administrative Science Quarterly, 41: 116-145.
Powell, W.W., White, D.R., Koput, K.W., & Owen-Smith, J. 2005. Network dynamics and field evolution: the growth of interorganizational collaboration in the life sciences. American Journal of Sociology, 110:1132-1205.
Prahalad, C.K. and G. Hamel. (1990). The core competence of the corporation. Harvard Business Review, May-June, pp.79-91.
PricewaterhouseCoopers and National Venture Capital Association, (2007). MoneyTree Report, Full-Year 2007, p. 1-15.
Quere, M. (2003). Knowledge dynamics: biotechnology'S incursion into the pharmaceutical industry. Industry and Innovation, 10: 255-273.
Quinn, J.B., (1992). Intelligent Enterprise, New York: Free Press.
Rausch, 10M., (June 18, 1999). National Science Foundation Directorate for Social, Behavioral, and Economic Sciences, Division of Science Resources Studies Issue Brief, p.I-4.
Rebentisch E. S. and M. Ferretti, (1995), A knowledge asset-based view oftechnology transfer in international joint ventures. Journal of Engineering and Technology Management, 12:1-25.
Robbins-Roth, C., (2000). From Alchemy to IPO: The Business of Biotechnology, Perseus Publishing: Cambridge, Mass.
Roberts, P.W., (1999). Product innovation, product-market competition, and persistent profitability in the U.S. pharmaceutical industry. Strategic Management Journal, 20(7): 655-670.
127

Rodriquez, J.L. and R.M.G. Rodriquez, (2005). Technology and export behaviour: A resource-based view approach. International Business Review, 14: 539-557.
Rosen, M. (2003). Japanese Continue Relentless Biotech Stake in Midwest, Retrieved January 13, 2007, from Midwest Technology Business News. Website: www.eprairie.com/newsiviewnews.asp?newsletterID=4997.
Rosenkopf, L, and Nerkar, A. (2001). Beyond local search: boundary-spanning exploration. and impact in the optical disk industry, Strategic Management Journal, 22: 287-306.
Rothaermel, F.T. and Deeds, D.L. (2004). Exploration and exploitation alliances in biotechnology: a system of new product development. Strategic Management Journal, 25: 201-221.
Rowen, Henry and Toyoda, A. Maria. (2002) From Keiretsu to Startups: Japan's Push for High Tech Entrepreneurship (working paper). Published by AI AP ARC, October, 2002. Retrieved: October 12, 2006.· Link to article: http://aparc.stanford.edulpublicationsl20027.
Rugman, A. and Moore, K. (2001). The myths of globalization. Ivey Business Journal, 66(1): 64-68.
Rumelt, R.P., (1991). How much does industry matter? Strategic Management Journal, 12(3): 167-185.
Schwandt, D.R., Organizational Learning: A Dynamic Integrative Construct. unpublished manuscript, Human Resource Development, George Washington University, Washington. D.C .• 1993.
Shan, W. andJ. Song, (1997). Foreign direct investment and the sourcing of technological advantage: evidence from the biotechnology industry. Journal of International Business Studies, 28: 267-284.
Shimanami, R. 2003. The Harvard mouse case: A comment from the viewpoint of Japanese law. The Canadian Business Law Journal, 39(2): 238-241.
Spender, J. C., (1996). Making Knowledge the Basis of a Dynamic Theory of the Firm. Strategic Management Journal, 17 (Winter Special Issue): 45-62.
Stalk, G., P. Evans, and L.E. Shulman, (1992). Competing on Capabilities: The New Rules of Corporate Strategy. Harvard Business Review, March-April: 57-69.
Stata, R., (1989). Organizational Learning--The Key to Management Innovation. Sloan Management Review, 30(3): 63-74.
128

Statute of Monopolies, 21 Jac. 1 c.3, 1624, chapter 5.
Straus, J. (1996). Implications of the TRIPs agreement in the field of patent law, in F. Beier & G. Schricker (Eds.) From GATT to TRIPs: The Agreement on Trade-Related Aspects of Intellectual Property Rights, pages 170-175, Munich: Max Planck Institute.
Stuart, T. and J. Podolny, (1996). Local search and the evolution oftechnologica1 capabilities. Strategic Management Journal, 17 (Special Summer Issue): 21-38.
Stuart, T.E., Hoang, H., & Hybels, R.C., (1999). lnterorganizational Endorsements and the Performance of Entrepreneurial Ventures, Administrative Science Quarterly, 44(2): 315-349.
Sumner, W.G. (1906). Folkways, Boston, MA: Ginn.
Takeuchi, H. and Nonaka, I. (2004). Hitosubashi on Knawledge Management, Singapore: John Wiley & Sons.
Tallman, S., and A. Phene, (2002). The effects of regional clusters on knowledge stocks and flows: evidence from the biotechnology industry. Presented at the Annual Meeting, Academy of International Business, San Juan, Puerto Rico.
Teece, OJ., Pisano, G., and Shuen, A. (1997). Dynamic Capabilities and Strategic Management. Strategic Management Journal, (18) 7: 509-533.
Thornton, E., Weintraub, A., and Zegel, S. (2006, April 10). Biotech's Boon or Bane? Business Week, page 39.
Triandis, H.C., and Marin, G. (1983). Etic plus ernie versus pseudoetic: A test of basic assumption of contemporary cross-cultura1 psychology. Journal of Cross-Cultural Psychology, 14: 489-500.
United States Patent Statute of 1790, Ch. 7,1, Stat. 109-112 (1790).
United States. Patent Act of 1952, Pub. L, No. 82-593, 66 Stat. 792 (1950).
VanArnum, P., (2007, June). Fundamentals Favorable in Global Biotechnology Industry. Pharmaceutical Technology, pages 18-19.
Vance, C.M., and Y. Paik, (2005). Forms of host -country nationalleaming for enhanced MNC absorptive capacity. Journal of Managerial Psychology, 20(7): 590-606.
Weintraub, A. (2007, December 31). Can Pfizer Prime the Pipeline? Business Week. Page 90.
Weintraub, A., (2006-a, April 12). Jeb Bush's Big Biotech Push. Business Week, p. 9.
129

Weintraub, A., (2006-b, April 7). Corn, Cloning, and Clinton. Business Week Online, p. 2S.
Wernerfelt, B., (1984). A Resource-based View of the Firm. Strategic Management Journal, S:171-180.
West, Joseph John, (1988). Strategy, environmental scanning, and their effect uponjirm performance: an exploratory study of the food service industry. Blacksburg, VA: Virginia Polytechnic Institute and State University. (dissertation).
Winter, S.G., (199S). Four R's of profitability: Rents, resources, routines, and replication. In C.A. Montgomery Resource-Based and Evolutionary Theories of the Firm: 147-178, Kluwer: Boston.
W oolgar, L. (2007). Research Funding System. The ERA WATCH Research Inventory. Date Retrieved: January 1,2008. URL: http://cordis.europa.eulerawatchiindex.cfin?fuseaction=ri.content&topicID=329&country Code=JP&parentID=SO.
Zaheer, A. & Bell, G., (200S). Benefiting from Network Position: Firm Capabilities, Structural Holes, and Performance, Strategic Management Journal, 26(9): 809-82S.
Zaltman, G., (1983). Knowledge disavowal in organizations. In R. Kilman, K. Thomas, D. Slevin, R. Nath, & S. Jarrell (Eds.), Producing Useful Knowledge for Organizations, New York: Praeger, p.173-187.
Zhang, J., and N. Patel, (2OOS). The Dynamics of California 's Biotechnology Industry, Public Policy Institute of California, San Francisco, CA.
Zucker, L., M. Darby, J. Armstrong, (1998). Geographically localized knowledge: spillovers or markets? Economic Inquiry, 36: 6S-86.
130