Embed Size (px)
Citation preview

International Journal of Research in Finance and Marketing(IJRFM)
Available online at : http://euroasiapub.org/current.php?title=IJRFM
Vol. 7 Issue 1, January - 2017, pp. 63~76
ISSN(o): 2231-5985 | Impact Factor: 6.397| Thomson Reuters Researcher ID: L-5236-2015
International Journal of Research in Finance & Marketing
Email:- [email protected], http://www.euroasiapub.org
An open access scholarly, peer-reviewed, interdisciplinary, monthly, and fully refereed journal
63
A STUDY ON VOLATILITY OF STOCKS TRADED ON BSE SENSEX
Dr.Sandeep R Poddar
Assistant Professor
(S.P.D.T. Lions Juhu College of Commerce)
INTRODUCTION
As we know the need for Foreign capital arises due to shortage from domestic side and other reasons. Indian economy has experienced the problem of capital in many instances. While planning to start the steel companies under government control, due to shortage of resources it has taken the aid of foreign countries. It is observed that the Securities on Sensex has shown significant improvement in the liquidity of stock prices of both BSE and NSE.However, it is believed that there exists a high degree of positive correlation between Securities, Investments, Market capitalization and FII "Volatility" as is called in stock market parlance. This high volatility has given sleepless nights to a lot of investors as well as market regulators.
BOMBAY STOCK EXCHANGE
The Stock Exchange, Mumbai (BSE) came out with a stock index in 1986, which is known as BSE Sensex. The base year of BSE Sensex is 1978-79 and the base value is 100. The exchange is the largest (in terms of market capitalization) in South Asia. In terms of the number of companies traded on the exchange (approximately 4700), it is the largest in the world. The main index which tracks the performance of the exchange is the BSE Sensex.
Bombay Stock Exchange Sensitive Index
The 30 stocks are chosen at random times, whenever the market has significantly changed enough to warrant the changes, and are chosen by their value of free- float shares. Although the index only tracks a very small percentage of the total stocks traded at the BSE, the index typically comprises about one- fifth of the market capitalization of the entire stock exchange.
Overview of Capital market Meaning of Capital Market
Primary Market
Secondary Market
The secondary market known as stock market or stock exchange plays an equally important role in mobilizing long-term funds by providing the necessary liquidity to holdings in shares and debentures. It provides a place where these securities can be encased without any difficulty and delay. It is an organized market where shares, and debentures are traded regularly with high degree of transparency and security.
WHAT IS VOLATILITY?
Volatility is a statistical measure of the dispersion of returns for a given security or market index. Volatility can either be measured by using the standard deviation or variance between returns from that same security or market index. Commonly, the higher the volatility, the riskier the security.
Volatility of an asset is measured by the variability in the price over time measured as the variance or the standard deviation of the returns on the asset. The more the standard deviation the more

International Journal of Research in Finance and Marketing(IJRFM)
Available online at : http://euroasiapub.org/current.php?title=IJRFM
Vol. 7 Issue 1, January - 2017, pp. 63~76
ISSN(o): 2231-5985 | Impact Factor: 6.397| Thomson Reuters Researcher ID: L-5236-2015
International Journal of Research in Finance & Marketing
Email:- [email protected], http://www.euroasiapub.org
An open access scholarly, peer-reviewed, interdisciplinary, monthly, and fully refereed journal
64
volatile the asset is. This is also a measure of the riskiness of the asset since the more variation it has the more unpredictability associated with its returns. There are a lot of Market Models that measure the residual variances to measure volatility.
FACTORS RESPONSIBLE FOR VOLATILITY?
In a securities market, prices or returns show fluctuations for a variety of reasons: changes in fundamental factors of firms, like, investors endowments, tastes or alternatively the attitudes towards risk, correct or incorrect anticipations or expectations of investor and other market participants, differences in information and mode of evaluation, transient imbalances between demand for and supply of securities, and the nature and number of stabilizing forces, among others, cause prices to fluctuate either from one point of equilibrium to another or above and below an equilibrium point.
TYPES OF VOLATILITY?
Historical volatility
It refers to the movements, which have been observed in a particular stock price or index over a given period of time.
Implied volatility
Implied volatility is a key variable required for determining premium on option.
Projected volatility
This refer to the estimate of future volatility on the basis of past volatility, current market analysis and perception of the investor
NEED FOR STUDY
The temporal relation between stock Index and Index futures has been and continues to be of interest to regulators, academicians and practitioners alike for a number of reasons such as market efficiency, volatility and arbitrage. In perfectly efficient markets profitable arbitrage should not exist as prices adjust instantaneously and fully to new information. Hence, new information disseminating into the market place should be immediately reflected in demand and supply of Securities in Secondary Market.
One of the purpose of this paper to understand, examine and discover the Difference and volatility in securities traded on BSE Sensex using secondary data and Descriptive Method of Analysis which offers several advantages, like Measures the Extent to which securities have achieved long run equilibrium over the another in same industry or other, Here, in this paper the Analysis will be done one two to three industries. Finance, Information Technology and Banking sectors will be the main Area of interest forAnalysis
OBJECTIVE OF THE STUDY
To study the volatility of securities listed in the Bombay Stock Exchange (BSE) To find out the various factors which are responsible for volatility To suggest better investment decision based on calculated beta of6 Companies To suggest better investment decision based on calculated statistical tools of selected companies To understand Internal and External Factors that Explains Volatility To capture the trends, similarities and patterns in the activities and movements of the Indian Stock Market To analyze batter returns from these companies

International Journal of Research in Finance and Marketing(IJRFM)
Available online at : http://euroasiapub.org/current.php?title=IJRFM
Vol. 7 Issue 1, January - 2017, pp. 63~76
ISSN(o): 2231-5985 | Impact Factor: 6.397| Thomson Reuters Researcher ID: L-5236-2015
International Journal of Research in Finance & Marketing
Email:- [email protected], http://www.euroasiapub.org
An open access scholarly, peer-reviewed, interdisciplinary, monthly, and fully refereed journal
65
LITERATURE REVIEW
Choudhary and Choudhary (2008) studied 20 stock markets of the world using parametric as well as non-parametric tests. He reported that out of twenty, eighteen markets showed significant positive return on various day other than Monday. The scope of the study is restricted to days of- the week effect, weekend effect and monthly effect in stock returns of S&PCNX Nifty and select firms. The half month effect and holiday effect are not studied here. Kumari and Mahendra (2006) studied the day of the week effect using data from 1979 to 1998 on BSE and NSE. They reported negative returns on Tuesday in the Indian stock market. Moreover, they found returns on Monday were higher compared to the returns of other days in BSE and NSE Ajayi and Al. (2004) examined eleven major stock market indices on Eastern Europe using data from 1990 to2002. They found negative return on Monday in six stock markets and positive return on Monday in rest of them. suggestthat pricediscovery primarily originates from the Singapore futures market
RESEARCH METHODOLOGY
Research Design/Methodology
It covers the type of research used in this dissertation, sample size chosen, sample description, data collection. Each will be described separately under the following headings
Sample Size
For the study, 30 companies have been selected.
Sample technique
The current study requires no sampling techniques
Sample population
Listed Company on BSE Sensex
Sample description
Listed Company on BSE Sensex (Based on Capitalization)
Statistical tool used for Data Analysis
Beta (β)
Rate of return
Computation of Beta (β)
Standard Deviation
Coefficient of Correlation
Collection of Data
Basically the data used in this dissertation are secondary in nature, which is zublically available to all investor
Mainly we have used Bombay Stock Exchange official website for historical data, all stock price with Opening Price, Closing Price, High-Low Price of the current day, past 52 weeks, past 120 days is collected for analysis from bseindia.com

International Journal of Research in Finance and Marketing(IJRFM)
Available online at : http://euroasiapub.org/current.php?title=IJRFM
Vol. 7 Issue 1, January - 2017, pp. 63~76
ISSN(o): 2231-5985 | Impact Factor: 6.397| Thomson Reuters Researcher ID: L-5236-2015
International Journal of Research in Finance & Marketing
Email:- [email protected], http://www.euroasiapub.org
An open access scholarly, peer-reviewed, interdisciplinary, monthly, and fully refereed journal
66
We referred newspaper articles from Business Standard, Economic Times and Business Line for Report and company related news which can be useful for Factors that can influence analysis and volatility in Market We referred company’s official website for company profile, line ofbusiness, Directors view, Shareholder reports, upcoming events, management information etc. The method and Statistical tools are used as per Standard Mathematic and Accounting Guidelines We referred well known Technics of Analysis for the Study of this particular subject and the prediction and calculations are done in details
INDUSTRY AND COMPANY PROFILE(Returns)
BSE SENSEX
Date Open High Low Close Returns 05-Apr-16 25372.44 25372.44 24837.51 24883.59 (1.93)% 25-May-16 25432.1 25897.87 25430.59 25881.17 1.77% 29-Sep-16 28423.14 28475.57 27719.92 27827.53 (2.10)% 09-Nov-16 26251.38 27397.38 25902.45 27252.53 3.81%
Tata Consultancy Services Ltd.Sensex vs. TCS
(1.93)%
1.77%
(2.10)%
3.81%
01 A
pr
13 A
pr
25 A
pr
07 M
ay
19 M
ay
31 M
ay
12 J
un
24 J
un
06 J
ul
18 J
ul
30 J
ul
11 A
ug
23 A
ug
04 S
ep
16 S
ep
28 S
ep
10 O
ct
22 O
ct
03 N
ov
15 N
ov
(2.00)%
(1.50)%
(1.00)%
(0.50)%
0.00%
0.50%
1.00%
1.50%
2.00%
(5.00)%
(4.00)%
(3.00)%
(2.00)%
(1.00)%
0.00%
1.00%
2.00%
3.00%
4.00%
1-Apr 26-Apr 21-May 15-Jun 10-Jul 4-Aug 29-Aug 23-Sep
TCS Sensex

International Journal of Research in Finance and Marketing(IJRFM)
Available online at : http://euroasiapub.org/current.php?title=IJRFM
Vol. 7 Issue 1, January - 2017, pp. 63~76
ISSN(o): 2231-5985 | Impact Factor: 6.397| Thomson Reuters Researcher ID: L-5236-2015
International Journal of Research in Finance & Marketing
Email:- [email protected], http://www.euroasiapub.org
An open access scholarly, peer-reviewed, interdisciplinary, monthly, and fully refereed journal
67
Date Open High Low Close Returns
18-Apr-16 2449 2553.15 2449 2522.4 3.00% 20-Apr-16 2548 2548 2442 2451.9 (3.77)%
Calculation
Infosys Ltd.Sensex vs. Infosys
Date Open High Low Close Returns
18-Apr-16 2449 2553.15 2449 2522.4 3.00% 20-Apr-16 2548 2548 2442 2451.9 (3.77)%
Calculation
Wipro Ltd.Sensex vs. Wipro
Date Open High Low Close Returns
02-Jun-16 559.9 559.9 534.7 540.25 (3.51)% 20-Jul-16 511 542 511 538.6 5.40%
(2.00)%
(1.50)%
(1.00)%
(0.50)%
0.00%
0.50%
1.00%
1.50%
2.00%
(10.00)%
(8.00)%
(6.00)%
(4.00)%
(2.00)%
0.00%
2.00%
4.00%
6.00%
8.00%
10.00%
1-Apr 26-Apr 21-May 15-Jun 10-Jul 4-Aug 29-Aug 23-Sep
Infosys Sensex
(2.00)%
(1.50)%
(1.00)%
(0.50)%
0.00%
0.50%
1.00%
1.50%
2.00%
(6.00)%
(3.00)%
0.00%
3.00%
6.00%
1-Apr 26-Apr 21-May 15-Jun 10-Jul 4-Aug 29-Aug 23-Sep
Wipro Sensex
International Journal of Research in Finance and Marketing(IJRFM)
Available online at : http://euroasiapub.org/current.php?title=IJRFM
Vol. 7 Issue 1, January - 2017, pp. 63~76
ISSN(o): 2231-5985 | Impact Factor: 6.397| Thomson Reuters Researcher ID: L-5236-2015
International Journal of Research in Finance & Marketing
Email:- [email protected], http://www.euroasiapub.org
An open access scholarly, peer-reviewed, interdisciplinary, monthly, and fully refereed journal
68
Calculation
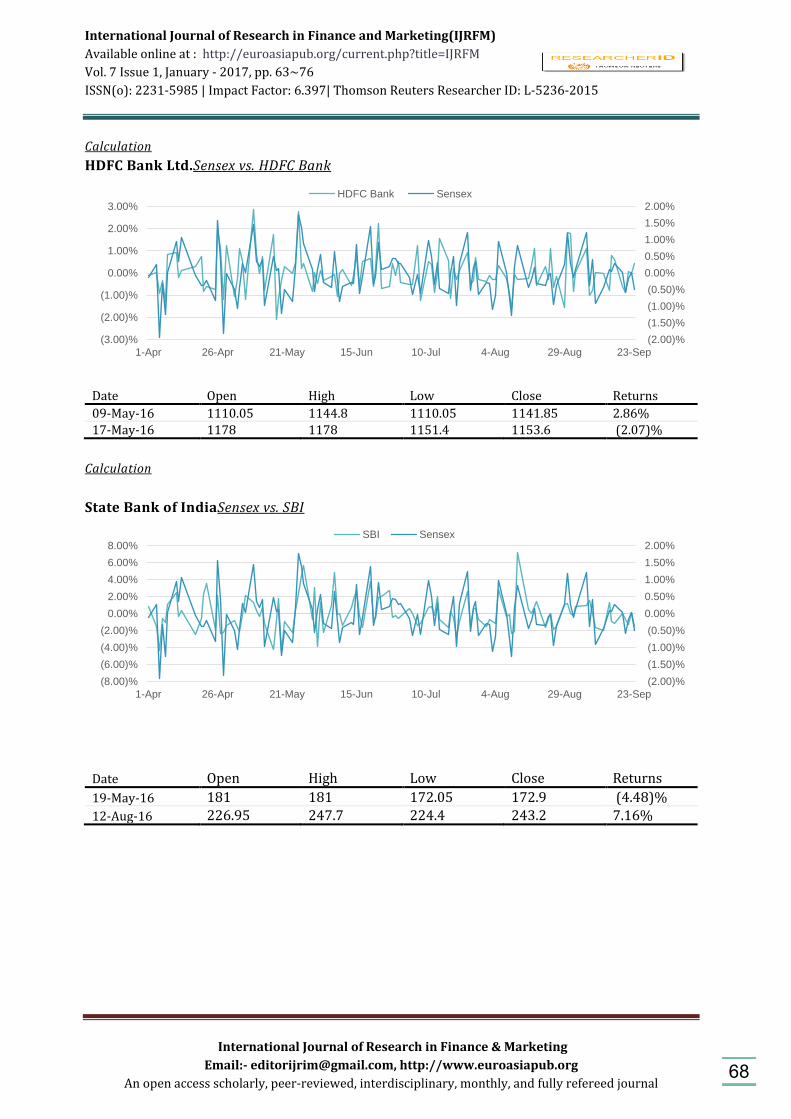
HDFC Bank Ltd.Sensex vs. HDFC Bank
Date Open High Low Close Returns
09-May-16 1110.05 1144.8 1110.05 1141.85 2.86% 17-May-16 1178 1178 1151.4 1153.6 (2.07)%
Calculation
State Bank of IndiaSensex vs. SBI
Date Open High Low Close Returns
19-May-16 181 181 172.05 172.9 (4.48)%
12-Aug-16 226.95 247.7 224.4 243.2 7.16%
(2.00)%
(1.50)%
(1.00)%
(0.50)%
0.00%
0.50%
1.00%
1.50%
2.00%
(3.00)%
(2.00)%
(1.00)%
0.00%
1.00%
2.00%
3.00%
1-Apr 26-Apr 21-May 15-Jun 10-Jul 4-Aug 29-Aug 23-Sep
HDFC Bank Sensex
(2.00)%
(1.50)%
(1.00)%
(0.50)%
0.00%
0.50%
1.00%
1.50%
2.00%
(8.00)%
(6.00)%
(4.00)%
(2.00)%
0.00%
2.00%
4.00%
6.00%
8.00%
1-Apr 26-Apr 21-May 15-Jun 10-Jul 4-Aug 29-Aug 23-Sep
SBI Sensex

International Journal of Research in Finance and Marketing(IJRFM)
Available online at : http://euroasiapub.org/current.php?title=IJRFM
Vol. 7 Issue 1, January - 2017, pp. 63~76
ISSN(o): 2231-5985 | Impact Factor: 6.397| Thomson Reuters Researcher ID: L-5236-2015
International Journal of Research in Finance & Marketing
Email:- [email protected], http://www.euroasiapub.org
An open access scholarly, peer-reviewed, interdisciplinary, monthly, and fully refereed journal
69
Calculation
ICICI Bank Ltd.Sensex vs. ICICI Bank
Date Open High Low Close Returns
05-Apr-16 236.95 237.4 224.5 225.5 (4.83)% 06-Sep-16 262 273.2 262 272.45 3.99%
Calculation
INTERNAL AND EXTERNAL FACTORS THATEXPLAINS VOLATILITY
When Market is volatile, only Market price is not the only factor that affects the movement of securities. Any News related to the company can change investors mind, the Biasness and Human tendency to make errors can also leads to Volatility of particular Stock Here are some facts that shows how these above six companies were facing their Share Market price, Similarly, here, we will see similar Trend in all the companies that when company announces their report or Quarter, YoY, QoQ no matter with positive Results or Negative it will affect their Share Market Price mostly the Positive result leads to higher returns but it gives high expectations to investor which causes the Drop in next Result
Tata Consultancy Services
Highest Returns on 18th April, 2016
Lowest Returns on 20th April, 2016
Infosys
Highest Returns on 04th April, 2016
Lowest Returns on 15th July, 2016
Wipro
Market Drops on 2 June, 2016
Highest Returns on 20th July, 2016
HDFC
Market went High on 9th May and Again went down on 19th May, 2016
SBI
Lowest Market Returns on 19th May 2016 Due to
Market moved up on 12 August, 2016
ICICI
Lowest Market Returns on 05thApril Due to
(2.00)%
(1.50)%
(1.00)%
(0.50)%
0.00%
0.50%
1.00%
1.50%
2.00%
(6.00)%
(4.00)%
(2.00)%
0.00%
2.00%
4.00%
6.00%
1-Apr 26-Apr 21-May 15-Jun 10-Jul 4-Aug 29-Aug 23-Sep
ICICI Bank Sensex

International Journal of Research in Finance and Marketing(IJRFM)
Available online at : http://euroasiapub.org/current.php?title=IJRFM
Vol. 7 Issue 1, January - 2017, pp. 63~76
ISSN(o): 2231-5985 | Impact Factor: 6.397| Thomson Reuters Researcher ID: L-5236-2015
International Journal of Research in Finance & Marketing
Email:- [email protected], http://www.euroasiapub.org
An open access scholarly, peer-reviewed, interdisciplinary, monthly, and fully refereed journal
70
Moved up with recovered loss to 3.99% returns on 06th September 2016
THE TRENDS, SIMILARITIES AND PATTERNS INTHE ACTIVITIES AND MOVEMENTS OF THE “INDIAN STOCK MARKET”
Announcing Quarter Report P&L Statement and AGM Announcement Foreign Market Currency Fluctuation Bullish Market and Industry Growth Any Industry related IPO Rational Decision in irrational growth, Wrong Judgment of Investor in Aggressive Market, Leads them to loss Biases Behavior and Traits Regret of Commission/Omission Representative Effect Herd Mentality
E.g., Mostly companies are coming up with an IPO in one industry, that Industry is in Growing
Stock prices moves as per demand supply chain, No. of Shares Traded, High and Low Volume Prices etc.
FINDINGS AND INTERPRETATIONS
Moving Average Method
Estimated Market Price
here, chart 100 DMA and 200 DMA are used to predict Market and as we cansee the trend line in Yellow and Red is Somewhere exact and somewhere nearto actual price
Same way TCS, Infosys, Wipro, HDFC Bank, SBI, and ICICI Bank was observed on their trend and the trend line that suits best is only 100 DMA and 200 DMA
0
5,000
10,000
15,000
20,000
25,000
30,000
35,000
Apr-07 Apr-08 Apr-09 Apr-10 Apr-11 Apr-12 Apr-13 Apr-14 Apr-15 Apr-16
Sensex
Adj Close
100-DMA
200-DMA

International Journal of Research in Finance and Marketing(IJRFM)
Available online at : http://euroasiapub.org/current.php?title=IJRFM
Vol. 7 Issue 1, January - 2017, pp. 63~76
ISSN(o): 2231-5985 | Impact Factor: 6.397| Thomson Reuters Researcher ID: L-5236-2015
International Journal of Research in Finance & Marketing
Email:- [email protected], http://www.euroasiapub.org
An open access scholarly, peer-reviewed, interdisciplinary, monthly, and fully refereed journal
71
LIMITATION
We have selected only IT Companies and Banking Companies based on their Capitalization Considers only companies listed in Bombay Stock Exchange. Generalization of findings and conclusions of the study are likely to be disputed as security prices are determined by so many factors. However, the findings and conclusions drawn upon the secondary data collected is expected to through some new light on volatility of share prices during public issues. Data not taken Based on Volume and No. of Shares traded for Other SENSEX listed Stocks Other Index also can be used and this would have resulted with detailed Analysis on volatility Financial and Mutual Funds companies were not taken due to Time Restriction
0
500
1,000
1,500
2,000
2,500
3,000
Apr-07 Apr-08 Apr-09 Apr-10 Apr-11 Apr-12 Apr-13 Apr-14 Apr-15 Apr-16
TCSAdj Close
100-DMA
200-DMA
0
500
1,000
1,500
2,000
2,500
3,000
3,500
4,000
4,500
5,000
Apr-07 Apr-08 Apr-09 Apr-10 Apr-11 Apr-12 Apr-13 Apr-14 Apr-15 Apr-16
InfosysAdj Close
100-DMA
200-DMA
0
100
200
300
400
500
600
700
800
Apr-07 Apr-08 Apr-09 Apr-10 Apr-11 Apr-12 Apr-13 Apr-14 Apr-15 Apr-16
Wipro
Adj Close
100-DMA
200-DMA
0
500
1,000
1,500
2,000
2,500
3,000
Apr-07 Apr-08 Apr-09 Apr-10 Apr-11 Apr-12 Apr-13 Apr-14 Apr-15 Apr-16
HDFC Bank
Adj Close
100-DMA
200-DMA
0
500
1,000
1,500
2,000
2,500
3,000
3,500
4,000
Apr-07 Apr-08 Apr-09 Apr-10 Apr-11 Apr-12 Apr-13 Apr-14 Apr-15 Apr-16
SBI
Adj Close
100-DMA
200-DMA
0
200
400
600
800
1,000
1,200
1,400
1,600
1,800
2,000
Apr-07 Apr-08 Apr-09 Apr-10 Apr-11 Apr-12 Apr-13 Apr-14 Apr-15 Apr-16
ICICI Bank
Adj Close
100-DMA
200-DMA
International Journal of Research in Finance and Marketing(IJRFM)
Available online at : http://euroasiapub.org/current.php?title=IJRFM
Vol. 7 Issue 1, January - 2017, pp. 63~76
ISSN(o): 2231-5985 | Impact Factor: 6.397| Thomson Reuters Researcher ID: L-5236-2015
International Journal of Research in Finance & Marketing
Email:- [email protected], http://www.euroasiapub.org
An open access scholarly, peer-reviewed, interdisciplinary, monthly, and fully refereed journal
72
Limited to 6 Companies out of 30 Stocks, Time Constraints (Data Taken only for 100 days)
RECOMMENDATION AND SUGGESTIONS IT Sector
Infosys is recommended if Investor wishes to invest in IT and has Long Term investment plan, Risk Taker can keep up with Wipro as currently Wipro has Less PE and Less Returns compare to TCS and Infosys
Study shows that Infosys has little better movement in Sensex compared to Wipro and Other IT Companies Except TCS, TCS is good Competition to Infosys and have equivalent EPS and PE Multiple
15% variations in Infosys is due to BSE Sensex and only 85% is depended on External Factors, where in, TCS and Wipro has more variation by Internal Factors
Banking Sector
Banking sector has tough completion among HDFC and ICICI, Risk Averse Investor may choose SBI as it Scheduled Bank as per RBI Regulations and has good Asset ratio but has Very High Number of NPAs with compared to HDFC and ICICI which might divert investors Mind and investor might have bias behavior for this
Risk Takers can choose between ICICI and HDFC as both are Non Schedule Bank as per RBI regulation and both have high Asset Value but has High NPAs but less in compare to SBI.
As per RBI Private and Public sectors bank regulation, SBI has Backup from RBI as Public Bank, and Can be trusted compared to HDFC and ICICI.
CONCLUSION
Indian Stock Exchange is the one of the fastest growing stock markets in the emerging economics. This thesis has characterized the behavior of Stock volatility at the market industry and firm levels. It was possible to use standard methods to understand and evaluate thevariation of volatility instead of the complex methods that are necessary when volatility is treated as an unobservable variable.
“IT sectors are more Volatile and their Investor exhibits Bias Behavior traits with regards to their Internal Movements, Where as in the Banking Sector the,
External Factors do not show much volatility even when Inflation or Other factors affect the market, investors are open to change”.
There are number of factors which have an influence on the price movements. The volatility depends on the internal and external factors. Some of them are controllable and others are non-controllable IT sector has more influence on volatility compared to external factors, IT Sectors securities
movementsfrom exchange and Equity demand is only 8% to 15%(Wipro: 9%, TCS: 11% and Infosys 15%)remaining 85% to 92% depends on Internal and External factors
Banking sector has Less influence on volatility compared to external factors, Banking Sectors securities movements from exchange and Equity demand is 30% to 45% (HDFC: 32%, SBI: 35% and ICICI 45%) remaining 55% to 60% depends on Internal and External factors.
Investor who are risk takers will see their internal and External volatility and will go for Wipro and HDFC Bank. And for Risk Averse Investor can invest in Banking Sector as their Beta (SBI: 1.69 and ICICI:1.62) is Preferable TCS and Infosys have tough competition in Market, as results shows their coefficient of correlation is
0.33 and 0.39 respectively. Where as, SBI and ICICI are on 0.59 and 0.56respectively, but not in competition as their Banking regulation differs from each other.
International Journal of Research in Finance and Marketing(IJRFM)
Available online at : http://euroasiapub.org/current.php?title=IJRFM
Vol. 7 Issue 1, January - 2017, pp. 63~76
ISSN(o): 2231-5985 | Impact Factor: 6.397| Thomson Reuters Researcher ID: L-5236-2015
International Journal of Research in Finance & Marketing
Email:- [email protected], http://www.euroasiapub.org
An open access scholarly, peer-reviewed, interdisciplinary, monthly, and fully refereed journal
73
Internal and external volatility Internal Volatility is when Market price of Equity fluctuates due to any decision that companies take and
that results in change in Market Price. For Example, Change in Management Policies, Report and Result Declaration, New Product
launch, Growth in sector etc.
External volatilityis when companies are doing their regular business and nothing special but due to some other factors their Market value changes that is volatility by External Factors
For example, due to Change in Government Policy, Inflation, and growth in other sector etc.
Trends shows that, Indian Markets have different trends during different periods, the data shows that market moves up and down during YoY and QoQ declaration which has 1 day before and 1 day after effects, 5 days before and after effects In this study we found that all six companies High returns and Low Returns were only before and after
their reports results.
TCSwith highest MPS of 2522.40 with 3% change in high returns with Beta of 0.66 on the day when the Results were announced but after 2 days whenresults were declaredit went down to 2451.9 with 3.77% change in returns
A Positive Result of Analysis Method 100 DMA and 200 DMA can be used for Investment Decision and also can be used to understand Variation from Sensex if Particular Stock is more volatile due to Variation derived from Sensex not the internal, External or any other factors Variations can be tracked using Daily Moving Average method with number of days for analysis as tool, which results 80 to 85% accuracy in price when it is used for more than or equal to 200 days, results may be vary due to external andinternal factors Internal and External Factors Plays Major Role in BSE SENSEX 30 as Investors have Rational and irrational decisions that can lead to high volatile market
SCOPE OF FURTHER STUDIES
The Stocks can be Analyzed with more Companies, Different Sectors The Scripts in This Study are Analyzed only for 120 Days, It can be Analyzed further by taking more No. of Days. The Daily Moving Average Method can be used for Further Study in order to Predict Future Values with More Number of Days Up to 365 Days as a 365 DMA In this Study, Companies were Selected based on High Capitalization Value, It can be Analyzed and Study Further by taking similar sector based on No. of Shares Traded, Total No. of Trades etc.

International Journal of Research in Finance and Marketing(IJRFM)
Available online at : http://euroasiapub.org/current.php?title=IJRFM
Vol. 7 Issue 1, January - 2017, pp. 63~76
ISSN(o): 2231-5985 | Impact Factor: 6.397| Thomson Reuters Researcher ID: L-5236-2015
International Journal of Research in Finance & Marketing
Email:- [email protected], http://www.euroasiapub.org
An open access scholarly, peer-reviewed, interdisciplinary, monthly, and fully refereed journal
74
References:
Articles and Definitions
http://www.apjslg.com/index.php?option=com_content&view=article&id=62&Itemid=68
https://in.finance.yahoo.com/q/hp?a=&b=&c=&d=2&e=28&f=2016&g=d&s=%5EBSESN%2C+&ql=1
http://www.moneycontrol.com/
https://en.wikipedia.org/wiki/BSE_SENSEX
http://www.investopedia.com/terms/b/beta.asp
Secondary Data
Stock
http://www.bseindia.com/markets/equity/EQReports/StockPrcHistori.aspx?scripcode=512289&flag=
sp&Submit=G
Index
http://www.bseindia.com/indices/IndexArchiveData.aspx
Websites
http://www.investopedia.com/articles/trading/11/higher-risk-higher
returns.asp?ad=dirN&qo=investopediaSiteSearch&qsrc=0&o=40186
http://www.investopedia.com/articles/04/021804.asp?ad=dirN&qo=investopediaSiteSearch&qsrc
=0&o=40186
http://www.investopedia.com/articles/financial-
theory/08/volatility.asp?ad=dirN&qo=investopediaSiteSearch&qsrc=0&o=40186
https://www.google.co.in/search?client=safari&rls=en&q=top+10+Blue+Chip+IT+Companies&spe
ll=1&sa=X&ved=0ahUKEwigjObu_J_PAhXBLSYKHeKECgwQvwUIGygA&biw=1240&bih=735&dpr=2#
q=Finance+companies+listed+on+BSE+Sensex
http://www.bseindia.com/markets/equity/EQReports/TopMarketCapitalization.aspx?expandable
=3

International Journal of Research in Finance and Marketing(IJRFM)
Available online at : http://euroasiapub.org/current.php?title=IJRFM
Vol. 7 Issue 1, January - 2017, pp. 63~76
ISSN(o): 2231-5985 | Impact Factor: 6.397| Thomson Reuters Researcher ID: L-5236-2015
International Journal of Research in Finance & Marketing
Email:- [email protected], http://www.euroasiapub.org
An open access scholarly, peer-reviewed, interdisciplinary, monthly, and fully refereed journal
75
Company Details
https://en.wikipedia.org/wiki/BSE_SENSEX
https://www.infosys.com/about/
http://www.itcportal.com/about-itc/profile/index.aspx
https://en.wikipedia.org/wiki/Tata_Steel
http://www.lupin.com/the-lupin-story.php
https://en.wikipedia.org/wiki/Reliance_Industries#cite_note-2
https://en.wikipedia.org/wiki/State_Bank_of_India
https://en.wikipedia.org/wiki/Tata_Motors
https://en.wikipedia.org/wiki/Tata_Consultancy_Services
https://en.wikipedia.org/wiki/Maruti_Suzuki
https://en.wikipedia.org/wiki/ICICI_Bank
https://en.wikipedia.org/wiki/Cipla
http://www.adaniports.com/about-us
http://www.larsentoubro.com/corporate/about-lt-group/overview/
http://www.heromotocorp.com/en-in/about-us.php
http://www.airtel.in/about-bharti/about-bharti-airtel/
https://en.wikipedia.org/wiki/Sun_Pharmaceutical
https://en.wikipedia.org/wiki/Oil_and_Natural_Gas_Corporation
https://en.wikipedia.org/wiki/Housing_Development_Finance_Corporation
https://www.hdfc.com/about-us
https://en.wikipedia.org/wiki/Hindustan_Unilever
https://en.wikipedia.org/wiki/HDFC_Bank
http://www.wipro.com/about-Wipro/
https://en.wikipedia.org/wiki/Mahindra_%26_Mahindra
https://en.wikipedia.org/wiki/Bajaj_Auto
https://en.wikipedia.org/wiki/Asian_Paints_Sharad_Shamman
https://en.wikipedia.org/wiki/Dr._Reddy%27s_Laboratories

International Journal of Research in Finance and Marketing(IJRFM)
Available online at : http://euroasiapub.org/current.php?title=IJRFM
Vol. 7 Issue 1, January - 2017, pp. 63~76
ISSN(o): 2231-5985 | Impact Factor: 6.397| Thomson Reuters Researcher ID: L-5236-2015
International Journal of Research in Finance & Marketing
Email:- [email protected], http://www.euroasiapub.org
An open access scholarly, peer-reviewed, interdisciplinary, monthly, and fully refereed journal
76
https://en.wikipedia.org/wiki/Power_Grid_Corporation_of_India
https://www.coalindia.in/en-us/company/aboutus.aspx
https://en.wikipedia.org/wiki/GAIL
https://en.wikipedia.org/wiki/NTPC_Limited