Embed Size (px)
Citation preview

IJPESYS ISSN: 2249-8575 Refereed Research Journal Volume 1 No. 1 November 2011
INTERNATIONAL JOURNAL OF PHYSICAL EDUCATION, SPORTS AND YOGIC SCIENCES E D I T O R I N C H I E F P R O F . S . K . Y A D A V D E P A R T M E N T O F P H Y S I C A L E D U C A T I O N D E V I A H I L Y A U N I V E R S I T Y I N D O R E

Special Features –•Qualified Staff
•Laboratory, Library, Internet, Bus
•Separate Hostels For Girls & Boys
•Free Help Line For B.P.Ed. Counseling
•*Scholarship as per M.P. Govt. Norms
Sendhwa Dist. Barwani (M.P.)
Sendhwa Sharirik Shiksha Sansthan,Chatli (Sendhwa)Niwali Road, Chatli Tehsil Niwali, Dist. Barwani (M.P.)
Phone – 07281-274251 to 55 , Telefax - 07281-274259Visit : www.sendhwsss.com, E-mail: [email protected]
(Recognized by NCTE New Delhi, Approved by M.P. Higher Edu. & Affiliated by D.A.V.V. Indore)
*Scholarship For ST, SC, OBC Candidates
Course Offered –•Bachelor of Physical Education
B.P.Ed. One Year (Two Sem)
•Master of Physical Education
M.P.Ed. Two Year (Four Sem)
B.P.Ed./M.P.Ed.
IJPESYS ISSN : 2249-8575 Refereed Research Journal
Volume 1 Issue 1 November 2011
International Journal of Physical Education, Sports and Yogic Sciences Editor in Chief Dr. S. K. Yadav, Professor Department of Physical Education Devi Ahilya University, Indore (M. P.) Mob - 09826535933 [email protected]
Editor Dr. Sunil Dudhale, Assistant Director Department of Sports Devi Ahilya University, Indore (M. P.) Mob - 09826908088 [email protected]
Associate Editors Dr. Satyendra Sharma, Sports Officer Gujrati Science College Devi Ahilya University, Indore (M. P) Dr. Pradeep Kumar Yadav, Sports Officer Gautam Buddh University, Near Kasna Gautam Buddh Nagar, Greater Noida - 201308 (U. P.) Mr. Manish Vats, Assistant Professor Department of Physical Education Ramjas College Delhi University, Delhi - 110007
Editorial Correspondence to: Editor in Chief Dr. S. K. Yadav, Professor Department of Physical Education Devi Ahilya University, Indore (M. P.) Mob - 09826535933 [email protected]

International Journal of Physical Education, Sports and Yogic Sciences (Quarterly Publication)
Editorial Advisory Board Dr. Maukam Singh Chouhan, Professor Department of Physical Education Kurukshetra University Kurukshetra (Haryana) Dr. G. S. Brar, Professor Department of Physical Education Punjab University, Chandigarh Dr. V. K. Dabas, Professor L. N. I. P. E. Shakti Nagar, Mela Road Gwalior (M. P.) Dr. Varghese C. Antony King Fateh University U. A. E
Chief Patron Dr. S. N. Sharma Department of Physical Education Punjab University, Chandigarh
Patrons Dr. R. K. Yadav, Professor and Director Department of Physical Education Rani Durgavati University, Jabalpur (M. P.) Dr. Rajender Singh, Professor and Dean Department of Physical Education Jiwaji University, Gwalior (M. P.)
Editor in Chief Dr. S. K. Yadav, Professor Department of Physical Education Devi Ahilya University, Indore (M. P.) Mob - 09826535933 [email protected]
Editor Dr. Sunil Dudhale, Assistant Director Department of Sports Devi Ahilya University, Indore (M. P.) Associate Editors Dr. Satyendra Sharma, Sports Officer Gujrati Science College Devi Ahilya University, Indore (M. P) Dr. Pradeep Kumar Yadav, Sports Officer Gautam Buddh University, Near kasna Gautam Buddh Nagar Greater Noida - 201308 (U. P.) Mr. Manish Vats, Assistant Professor Department of Physical Education Ramjas College Delhi University, Delhi - 110007

EDITORIAL
This journal is an attempt to provide a common platform to Physical educationists, sports
coaches, trainers and budding research scholars for presenting the findings of research under
taken by them.
The great response from all over the country has motivated us to undertake this difficult task of
bringing out this Journal. I extend my sincere thanks to the authors, reviewers and editorial board
members for their contribution in shaping this Journal.
Editor in Chief

Contents Title Page
Investigation of Effect of the Angle of Release of the Cricket Ball 1 on the Spin Deviation of the Ball on Dry, Matted and Concrete Surface
Dr. Ashish Phulkar, Jayu Ganesh and Mr. Vikas Saroha
Body Composition and Fitness of Junior National Hockey Players 5 Dr. Ajay Y. Karkare
Optimum Range of the Angle and Speed of Release for a Free Throw 8 Dr. Ashish Phulkar, Jayu Ganesh and Lobo Rohan Pinto
Self-perception Profile of Athletes and Non –athletes 14 Chandrika Singh
A Psychological and Anthropometric View of the Tribal 18 and Non Tribal Players Dr. Ajay Y. Karkare
Construction of Knowledge Test in Badminton for 21 Physical Education Students Dr. S. K. Yadav and Gyanendra Prajapati
Comparison of Arm Strength, Agility and Flexibility between 24 Attackers and Defenders in Field Hockey
Vikas Prajapati and Akansha Rajora
Assessment of Imagery Functions Used by Athletes of Different 27 Games and Sports
Dr. R. K. Yadav and Neha Khare
Construction of Jump Shot Test in Handball 30 Dr. S. K. Yadav, Dr. Sunil Dudhale and Bhawana Yadav
Hormonal (Estrogen) Regulation in Women and Factors Related 33 to Their Visiting Beauty Parlours
Dr. Arti Rupani
Relationship between Hardiness and Psychological Stress Response 36 Dr. Sanjay Singh Chauhan
Recent Trends in Doping: Gene Doping 41 Shyam Narayan Singh
Investigation of Motivational Factors Influencing 44 Participation in Badminton
Dr. S.K. Yadav, Honey Bhatia and Dr. Ranjeet Singh Pawar
Yoga and Exercise for Healthy Society 47 Dr. Jyoti Jungare and Ashish Billore
Comparative Differentials among Categorised University Players 50 as Related to General Motor Abilities and Psychological Variables
Dr. Naman Yadav and Mrs. Ruchi Yadav

1 International Journal of Physical Education, Sports and Yogic Sciences Vol. 1 No. 1 (November, 2011) : 1-4
Investigation of Effect of the Angle of Release of the Cricket Ball on the Spin Deviation of the Ball on Dry, Matted and Concrete Surface ASHISH PHULKAR, JAYU GANESH and VIKAS SAROHA
See end of the article for authors’ affiliations
Correspondence to: DR. ASHISH PHULKAR Symbiosis International University, Pune (M.S.) India
ABSTRACT The purpose of this study was to improve upon the techniques of spin bowling and to help today’s young cricketers. This was carried out with the help of the professional cricket coaches and players of Pune district. In this study the effect of the angle of release of the cricket ball on the spin deviation of the ball on dry, matted and concrete surface was investigated using the concepts of simple projectile motion. It was found that the angle of deviation after the ball pitches for angles of release in its different surface with the help of high speed camera and Logger Pro software. The software had slowed the video to the camera and helped in analyzing the relationship between angle of release by taking horizontal distance (x), vertical distance (y) and z deviation (along z axis after pitching) and substituting it into the equation θ= tan-1(x/y) for angle of release and α = sin-1(z/x) for the angle of deviation. It was concluded that a ball thrown at higher angle will achieve higher angle of deviation on dry surface than matting and concrete surface.
Key words: Projectile Motion, Drag Force, Bernoulli’s Principle, Magnus effect.
Spin is also an awesome art for determining the patience and technique of the batsman. Cricket is played in different surfaces, weather conditions and environment. Hence the purpose of this study was to investigate the effect of the angle of release on the spin deviation of a cricket ball on dry, matted and concrete surface. The movement imparted to the ball by a spinner is a direct result of the Magnus effect as the main aim of a spinner is to change the direction of the ball after pitching. It turns in the direction of spin on bouncing.
The actual behavior of the ball depends on the state of the airflow with respect to the boundary layer. It can be laminar or turbulent depending on the speed and smoothness of the ball. The boundary layer generally tends to become turbulent only at very high speed above 145kmph. Hence it can be assumed that under real conditions to the state is laminar. The seam in the ball also has an effect on this. However the white ball used these days for night matches with the polyurethane coating preserves the smoothness to ensure laminar flow.
Methodology: In this study the angle of deflection of the ball for off –spin and leg spin on 1.Matted Surface 2. Dry Surface 3. Concrete surface was investigated.
Apparatus Required: Cricket ball (Mass of the cricket ball – 159.9 to 163 grams), Mat, concrete and dry surfaces, One bowler (same leg and off spinner), Two High speed cameras, Logger pro software, Wickets, Marker (to mark good length spot), Wicket keeper(with keeping gloves) It was hypothesized that as the angle of the release (shoulder level, 00) increases (from shoulder level to vertically upward), the deviation the spin achieves also increase. The amount of spin will be depending on the type of surface. It was predicted that the spin deviation on the three surfaces will be: Spin on dry surface, Sd >Spin on mat surface, Sm> Spin on concrete surface, Sc In the experiment it was planned to use two cameras simultaneously one to capture the front view and the other the side view. The side camera gave the angle of release and the front on will give the angle of spin deviation. The video was the analyzed using logger pro whereby the graph of the two components of the velocity at the time of release along the x and y directions are graphed. Angle of release, θ= tan-1(x / y), where x is the horizontal distance and y is the vertical distance Angle of deviation, α= sin-1(z /x) where z is the distance in z axis and x is distance covered in x axis. In one of the analysis, in the graph below the initial point is at 21.3(horizontal, x) and 7.1(vertical, y) cm, so the angle of release is the tan-1(7.1/21.3) = 18o The velocity of the ball can be found by taking vertical (55.6) and horizontal (51.3) component of velocity as y and x axis respectively by V0 =√( VH) 2+( VV) 2
√ (55.6)2+ (51.3)2) Velocity =75 km/h or 208 m/sec
Independent Dependent Controlled Angle of release in three different surfaces- Mat, concrete and dry
Deflection of ball after pitching
Ball and Bowler
Phulkar, Ashish; Ganesh, Jayu and Saroha, Vikas (2011) Investigation of Effect of the Angle of Release of the Cricket Ball on the Spin Deviation of the Ball on Dry, Matted and Concrete Surface International Journal of Physical Education, Sports and Yogic Sciences 1(1): 1-4.

2 ASHISH PHULKAR, JAYU GANESH and VIKAS SAROHA
1. Measure the dimension of the cricket pitch (length, breadth, crease.) with the help of tape, chalk and measuring tape. Use a wet chalk to get more bright boundaries.
2. Place the wicket on both the sides and prepare crease on both the sides, the measurements should be equal to the standards.
3. Set up the cameras, set first camera on the sideways to take angle of release and another on the front of the wicket to measure the angle of spin simultaneously.
4. Mark the good length spot where the bowler will be aiming to ball, so that the front camera can capture the angle of spin.
5. Start with the off spinner, the bowler should be instructed to use colored bands in order to be easily recognizable by camera of the both the angle and then followed by leg spinner.
6. As the dry surface’s texture is reddish and cricket ball is also red, so because of the similar color it is very difficult to identify the angle of spin, therefore a white cricket ball should be used on the dry surface so that the ball can be visible.
7. Angle of release can be measured by assuming arm level as normal and measure the angle which are above the shoulder level.
8. The measurement of spin angle should be measured by taking a straight line directed towards wicket as normal and the variation across the line can be measured. The formula from vector analysis is used to calculate the angle.
9. Take the observations in video clip and import the video in logger pro, the software slows down the pace of the video, as soon as the ball is released and ball hits the surface, measure both the angle.
10. As soon as both the angles are obtained, tabulate the observations on the basis of surface and type off spin.
11. Plot a graph of angle of spin deviation versus angle of release for all three surfaces.
12. The graph will be a straight line as angle of deviation is directly proportional to angle of release.
Figure 1: Analysis of Video using Logger Pro
Below is the analysis of the spin ball on the concrete surface
Parabolic Motion Angle of deviation

3 International Journal of Physical Education, Sports and Yogic Sciences Vol. 1 No. 1 (November, 2011) : 1-4
Figure 2: Analysis on Matted Surface Angle of release Angle of deviation
Angle of deviation graph indicating amount of deviation Figure 3: Analysis on Dry Surface Angle of release Parabolic motion
Graph showing the amount of deviation Angle of deviation

4 ASHISH PHULKAR, JAYU GANESH and VIKAS SAROHA
Graphs 1: Release Angle vs. Deviation Angle of Off and Leg Spin on Matting Surface
Graph 2.Release Angle Vs. Deviation Angle of Off and Leg spin on Dry Surface
Graph 3: Release angle vs. deviation of off and leg spin angle on concrete surface
The three graphs show the relation between angle of release and angle of deviation on all three surfaces. It can be seen that the 1st and 3rd graph shows the steep line whereas the 2nd graph does not have the same slope throughout. Conclusions: It was concluded that a ball thrown at higher angle will achieve higher angle of deviation on dry surface than matting and concrete surface Through video analysis, observation and graphs enabled to relate the results to the hypothesis (Spin in dry surface, Sd > Spin in mat surface, Sm> Spin in concrete surface, Sc). REFERENCES:
Physics in the world Cricket http://www.wiziq.com/ tutorial/30955-physics-in-theworld-cricket Physics of Cricket The University of Sydney http:/www.physics.usyd.edu.au/cross/cricket.html Giancoli, Douglas Physics Principles with Applications Prentice hall Inc., New Jersey, 2005. Hay, James G. Biomechanics of Sports Techniques Prentice hall, Inc New Jersey, 2003.
Authors’ affiliations: Jayu Ganesh
Physics Deptt., SIS, Pune (M.S) India Vikas Saroha SIS, Pune (M.S) India

5 International Journal of Physical Education, Sports and Yogic Sciences Vol. 1 No. 1 (November, 2011): 5-7
Body Composition and Fitness of Junior National Hockey Players AJAY Y. KARKARE
See end of the article for authors’ affiliations
Correspondence to: Ajay Y. Karkare Rani Laxmibai Girls College Sawargaon Nagpur (MS)
ABSTRACT The purpose of the present study was to determine differences in body composition and physical fitness among junior national hockey players according to their playing positions. 210 junior national hockey players (16.21± 1.26) were selected from different states of India according to their playing positions (70 forward, 70 half and 70 back line). To evaluate body composition, height, weight, subcutaneous skinfold, diameter and girth were measured and using Matigka method, body mass index (BMI), percentage body fat (%BF), muscle mass (MM) and bone mass (BM) were calculated. To determine physical fitness Cooper’s JCR test was used. Significance difference was observed between forward line, half line and back line hockey players on %BF and bone mass (p<0.01). No significant difference in muscle mass was observed (p> 0.05) in physical fitness items, Significant differences were observed in shuttle run (p< 0.01) but no significant difference was found on chin-ups and vertical jump items among forward line, half line and back line hockey players
Key words: Body composition, Physical fitness, Subcutaneous Skinfold, Bone mass, Muscle mass.
Athletic performance cannot be accurately predicted based solely on body weight and composition given that many factors affect body composition. Some sports dictate that athletes make changes in body weight and composition that may not be best for the individual athlete. Athletes who participate in weight-class sports - such as wrestling or weight lifting - may be required to lose or gain weight to qualify for a specific weight category. Athletes who participate in body-conscious sports, such as dance, gymnastics, figure skating, or diving, may be pressured to lose weight and body fat to have a lean physique, although their current weight for health and performance is appropriate. With extreme energy restrictions, losses of both muscle and fat mass may adversely influence an athlete's performance.
Individualized assessment of an athlete's body composition and body weight or body image may be advantageous for the improvement of athletic performance. Age, sex, genetics, and the requirements of the sport are factors that impact the individual athlete's body composition. An optimal competitive body weight and relative body fatness should be determined when an athlete is healthy and performing at his or her best.
Optimal body dimensions are one of the most important pre-requisites of physical fitness and performance. Adaptation to exercise is manifested by changes in body weight, body build and body
composition, and by changes in the absolute and relative aerobic capacity. It would be interesting to observe trends in performance changes in different sporting/athletic events especially in those where the intensity and regimen of training program and achieved results were enhanced most profoundly. Body composition data of athletes are very scanty, and it would be useful to define these changes more precisely because their analysis could contribute in a significant way to the definition of the optimal morphological type and measures leading to desirable changes to improve athletic performance. Methodology:
Two hundred and ten (70 forward line, 70 half line and 70 back line) Junior National Hockey players w h o participated in Junior Hockey National competition were randomly selected as subjects for this study. The average age of the sample was 16.21 years.
Primary measurements of interest of present study were height, body mass, body mass index, subcutaneous skinfolds and physical fitness determined by Cooper’s JCR test (1965). Height and body mass were measured according to standard procedures. Body composition and weight are two of the many factors that contribute to optimal athletic performance. Taken together, these two factors may affect an athlete’s potential for success within a given sport.
The body mass index (BMI) was calculated from the equation: BMI= body mass (kg)/stature (m2). There are some limitations to BMI such that the index is based
Karkare, Ajay Y. (2011) Body Composition and Fitness of Junior National Hockey Players International Journal of Physical Education, Sports and Yogic Sciences 1(1): 5-7.

6 AJAY Y. KARKARE
solely on height and weight. Individuals who have significant lean tissue or skeletal mass may reveal high BMI values. Yet have a lower risk for obesity. Thus more direct measurement of body fat is considered to be more appropriate. (Cataldo 1999).
Percent Body fat (% BF) is an important component in training-induced adaptation, and may influence various physiological parameters resulting in an enhanced maximal work performance. (Ramana et al 2004). Skinfold thickness were used to estimate percent body fat (%BF), diameter and girth were used to estimate bone mass and muscle mass using Matiegka’s method (1921). The formula used to calculate body fat percent, bone mass and muscle mass were: 1. Weight of bones or Ossa = O2 × L × K1 Where L is the height of the subject, K1= 1.2 (constant) and O=sum of humorous bicondylar, femur bicondylar, wrist and ankle breadth. 2. Weight of fat or derma = d × S × K2 Where d= ½ (sum of biceps, forearm, thigh, calf,
thorax and abdomen skinfold). S = surface area in cm2
K2 = 0.13 (constant)
3. Weight of muscle mass M = r2 ×L × K3 Where L = Height, r = sum of upper arm, forearm, thigh and calf radius, K3 = 6.5 (constant.) The corrected radius can be calculated as follows: Circumference= 2 × (22/7) × r or r = c/2 (7/22) Corrected r = [(c/2), (7/22) - ½ skinfolds] The unit of skinfold is same as for circumference or radius while subtracting it.
Physical fitness was determined by using Cooper’s JCR test. This test consists with three items namely vertical jump, chin-ups and shuttle run.
Results and Discussion:
Descriptive characteristics are listed in Table - 1.The result is expressed as mean ± standard deviation (X ± SD). F test was used to examine differences between forward line, half line and back line hockey players on age, height, BMI, % BF, bone mass, muscle mass, vertical jump, chin ups and shuttle run.
Table - 1 Descriptive Characteristics (Mean ± standard deviation) of all the Participants Hockey Players
Variables Total N= 210
Mean ± SD
Forward Line N=70
Mean ± SD
Half Line N=70
Mean ± SD
Back Line N= 70
Mean ± SD Age Height Body Mass BMI % BF B M M M Vertical Jump Chin-ups Shuttle Run
16.21± 1.26 168.94 ± 7.05 55.34 ± 9.94 18.87± 2.81 8.80 ± 1.62 9.47 ± 1.27 25.25 ± 4.31 39.21± 14.32 16.62± 7.22 27.09 ± 2.98
16.05 ± 1.33 169.27 ± 6.50 53.44 ± 7.11 18.67 ± 2.38 7.61 ± 1.08 9.55 ± 1.01 25.63 ± 4.36 38.49 ± 13.16 15.34 ± 5.84 26.12 ± 3.39
16.31 ± 1.21 168.69± 7.71 52.67 ± 7.21 18.54 ± 2.61 8.69 ± 1.26 8.97 ± 1.34 25.61 ± 3.76 40.49 ± 14.75 16.85 ± 6.76 27.37 ± 1.97
16.28 ± 1.21 168.87 ± 6.98 55.34 ± 9.94 19.40 ± 3.31 10.10 ±2.52 9.89 ± 1.26 24.49 ± 4.72 42.69 ± 12.46 17.67 ± 8.68 27.79 ± 3.15
Comparison of BMI, %BF, bone mass and muscle mass between forward line, half line and back line Hockey players are listed in Table - 2. Comparison of
physical fitness between forward line, half line and back line hockey players are listed in Table - 3.
Table - 2 Comparison of BMI, % Fat, Bone Mass and Muscle Mass between Forward, Half and Back Line Hockey Players
Variables Forward Line Half Line Back Line F
BMI % Fat B M M M
18.67 ± 2.38 7.61 ± 1.08 9.55 ± 1.01 25.63 ± 4.36
18.54 ± 2.61 8.69 ± 1.26 8.97 ± 1.34 25.61 ± 3.76
19.40 ± 3.31 10.10 ±2.52 9.89 ± 1.26 24.49 ± 4.72
P > 0 .05 P < 0.01 P < 0.01 P > 0.05

7 International Journal of Physical Education, Sports and Yogic Sciences Vol. 1 No. 1 (November, 2011): 5-7
Table - 3 Comparison of Physical Fitness between Forward, Half and Back Line Hockey Players
Variables Forward Line Half Line Back Line F Vertical Jump
Chin Up Shuttle Run
38.49 ± 13.16 15.34 ± 5.84 26.12 ± 3.39
40.49 ± 14.75 16.85 ± 6.76 27.37 ± 1.97
42.69 ± 12.46 17.67 ± 8.68 27.79 ± 3.15
P > 0.05 P > 0.05 P < 0.01
Percentage fat mass significantly higher (p< 0.01) in back line players than forward line and half line players. Bone mass was significantly lower (p< 0.01) in half line players than forward line players and back line players. Forward line players were significantly faster (p< 0.01) than half and back line hockey players.
BMI and body composition have been known to be fundamental to excellence in athletic performance. Specific athletic events require different body types and weight for maximal performance. Today it has been widely accepted by the experts that top performance in sports is achieved if an athlete possesses the basic body composition suitable for the event. Analysis of research has shown that hockey players playing in different position have not shown differences on BMI and muscle mass. Singh et al (2010) found Indian, Pakistani and Sri Lankan hockey players also have not shown differences in BMI. The forward line players have significant low %BF compare to half line and back line player. Back line player having significantly more bone mass (p<0.01) than the forward and half line players. In view of these results it is evident that %BF is an important and influential factor in the determination of physical fitness, since taking % BF into account, the difference between shuttle - run of forward line, half line and back line groups becoming significant. No significant difference w a s observed between hockey players on vertical jump and chin ups item. Conclusions:
Hockey players playing in different position have shown significant difference in %BF and bone mass. No significant difference was found on BMI and muscle mass variables. In physical fitness forward line players were found significantly faster and agile than the back and half line players. No difference has been
observed on arm strength (chin ups) and explosive leg strength (vertical jump). There are many factors that may account for these difference, notably climate, diet and difference in aerobic and hockey specific training sessions. REFERENCES: Cataldo C. Nutrition and Diet Therapy, Principle and Practice west publishing company St. Paul, 1999: 232-238. Cooper Motor Fitness Test: Measurement in Physical Education Carlton R. Meyers, 2nd edition, The Ronald Press Company, New York, 1974. Houtkooper, L. Body Composition in Manore M, Thompson J. Editors Sport Nutrition for Health and Performance Champaign (IL): Human Kinetics; 2000. Heymsfield S, Lohman T, Wang Z, Going S. Human Body Composition 2nd ed. Champaign (IL): Human Kinetics, 2005. Marfell Jones M. Olds T. Stewart A, Carter L. International Standards for Anthropometric Assessment Potchefstroom: International Society for the Advancement of Kinanthropometry (ISAK); 2000. Nutrition and Hydration Guideline for Excellence in Sports Performance, International Life Science Institute India, December 2005. “Ramana Effect of Changes in Body Composition Profile on VO2 max and Maximal Work Performance in Athletes” An International Electronics Journal of American Society of Exercise Physiology Vol. 7, Feb 2004. Singh, Mandeep et al. Anthropometric measurements, body composition and physical parameters of Indian, Pakistani and Sri Lankan field hockey players Serbian Journal of Sports Science No. 2: 2010. Singh, S.P. and Malhotra, P. Kinanthropometry Patiala: Lunar Publications, 1989.

8 International Journal of Physical Education, Sports and Yogic Sciences Vol. 1 No. 1 (November, 2011) : 8-13
Optimum Range of the Angle and Speed of Release for a Free Throw in Basketball ASHISH PHULKAR, JAYU GANESH AND LOBO ROHAN PINTO
See end of the article for authors’ affiliations
Correspondence to: DR. ASHISH PHULKAR Symbiosis International University, Pune (M.S.) India
ABSTRACT The purpose of the study was to understand the physics behind this shot and find the ideal variables that will allow any person, of average height of 1.7m, to score a basket on every shot he takes from the free throw line. It started by understanding all the factors that affect basketball during its flight. Experiments were conducted to see that if hypothesized values matched the results got from the experiments. For investigation, video of a player of around 1.74m height was recorded taking shots at the basket from the free throw line and then selected only the shots that enter the basket directly without touching the rim and calculated the variables of those shots on logger Pro. It was Observed that range of angles (52.42 to 63.10) and velocity (4.6m/s to 9.5m/s) where the player was getting the basket. It was also checked to see if the relationship with the two variables matched the hypothesized relationship and if not, what the affecting variables were, with this known range and velocity, so that it can be used to teach a novice basketball player how to shoot.
Key words: Projectile, Newton’s Law of motion, Angle of Release, Speed of Release.
The type of shot that was focused on is called a perfect shot. This shot is like a direct pass from the player into the basket. The ball is thrown into the air and it enters the basket directly without touching the rim or rebounding off the back board. The study was restricted to a perfect shot and no variations were considered such as the jumping shots, the rebounds and the bounce given to the ball before shooting as they are all beyond the scope of this study.
Hence the researchers were interested in finding the optimum range of the angle of release and speed of the shot where the player, of average height (1.74 m) will get the ball into the basket on every attempt taken from the free throw line. Methodology: The factors that have to be considered were: 1. The distance of the shot taken from the basket (s1,s2) 2. The height of release (h) 3. The initial speed of release (V) 4. The angle of release (θ) 5. The angle of entry (β ) In this investigation, the distance from the basket and the
height of release were as controlled variables, the speed of release and angle of release as the Independent variables, and the angle of entry as the dependent variable. It was also determined that the angle of entry at various angles and speed of release. The distance between the player and the basket is important because based on the distance; the player chose the appropriate speed of release and angle of release. The distance from the basket was kept constant by taking all the readings from only two points, the free throw line (𝑠𝑠1) and half the distance between the free throw line and the basket (𝑠𝑠2). The height of release was also kept constant by having only one subject because, since the height of the
basket is constant, the players, of different heights, taking the shots will have to change the angle of release and the initial velocity to get a scored basket comfortably. The speed of release and angle of release are directly proportional, i.e. if the angle of release is greater, the player will have to increase the speed of the shot so that the ball reaches the basket, otherwise, the ball will land too short of the target.
The videos were analyzed using Logger Pro 3.8. With this software, the trajectory of the ball was graphed and vector analysis was applied to calculate the angle of release (𝜃𝜃).
The horizontal (𝑉𝑉𝑥𝑥) and vertical (𝑉𝑉𝑦𝑦) velocities are obtained while analyzing the video in Logger Pro with the help of which we calculate the magnitude of the initial velocity (V) by using the formula V= 𝑉𝑉𝑥𝑥
2+
𝑉𝑉𝑦𝑦2. (In the case of the diagram on the right, 𝑉𝑉𝑥𝑥
represents 𝑣𝑣 and represents 𝑣𝑣𝑣𝑣). The direction of this velocity is given by 𝜃𝜃 and can be calculated by tan𝜃𝜃= 𝑉𝑉𝑦𝑦 𝑉𝑉𝑥𝑥
Since the angle between 𝑉𝑉𝑥𝑥 and 𝑉𝑉𝑦𝑦 is 90 ̊, the equations are: V= 𝑉𝑉𝑥𝑥
2+ 𝑉𝑉𝑦𝑦
2 and tan𝜃𝜃= 𝑉𝑉𝑦𝑦 𝑉𝑉𝑥𝑥
The magnitude and direction of the resultant velocity is determined using the parallelogram addition of vectors.
Phulkar, Ashish; Ganesh, Jayu and Pinto, Lobo Rohan (2011) Optimum Range of the Angle and Speed of Release for a Free Throw International Journal of Physical Education, Sports and Yogic Sciences 1(1): 8-13.

9 ASHISH PHULKAR, JAYU GANESH AND LOBO ROHAN PINTO
The angle of entry is the dependant variable and is one main variable to be investigated in the experiment. It is the most important variable because depending on all the other factors, the angles of entry vary and it is controlling this angle that gives the certainty of getting the ball in the basket. If the ball enters the rim at 90 ̊, there will be 0 horizontal velocity. As the angle of entry decreases, the horizontal velocity will increase. The horizontal distance that the ball covers form the point of entry into the rim till the point of exit from the rim is used to calculate the apparent diameter of the basket. If the ball deviates too much, then it will hit the rim and bounce off it.
The apparent diameter of the basket when the ball is entering at a certain angle can be calculated using following formula: Apparent diameter = diameter of basket × sin (angle entry)
Below is a table of the relationship between the angles of entry to the apparent diameter of the basket
Here a chart of the apparent diameters of the basket
according to various angles of entries. If the standard basketball, the diameter of that ball is 24.7 cm and if compared to the chart, it can be seen that the ball won’t fit into the basket from 30 ̊ and below. The minimum angle of entry can be calculated by taking the apparent diameter of the basket as the diameter of the ball. The equation will be- 24.7= 45.7 sin θ Therefore θ= 𝑠𝑠 𝑛𝑛−1 24.7 = 32.7 ̊ This means that the lowest angle of entry of the ball is 32.7 ̊. The uncertainty error of an angle can be calculated by subtracting the diameter of the ball from the apparent radius of the basket . For example, at 90 ̊, the apparent diameter of the ball is 45.7 cm. By subtracting the radius of the ball, 24.7 cm, the remaining distance is 21 cm which gives the error uncertainty of + 10.5 cm.
When the ball is in the air, it is constantly being affected by other factors that determines trajectory. A few of these factors are: Buoyant force / Drag force/ Magnus force.
Experiment 1
If the speed of each shot is constant , there should be a uniform increase in the angle of entry when the angle of release increases. Since the range of the angle of release if 40 ̊ till 90 ̊, it is assumed that for a comfortable shot for the player of height 1.74 m, his angle of release should range between 50 ̊ to 70 ̊.
Apparatus Basketball, basketball court matching standard specifications, player of height 1.74 m,1video camera,1 still camera (not compulsory), Measuring tape, wind Gauge, Rope,1 bob, Chalk.
Method
1. To find the centre of the basketball rim, tie a bob to the end of a string, which is as long as the height of the basket from the ground. Attach the sting to the middle of a stick or scale more than 45.7 cm long (the diameter of the basket). Place the stick across the rim of the basket so that the point of attachment of the string to the stick is in the centre of the basket. Let the bob fall through the basket and hang close to the floor. Use chalk to mark this point. This point will be the reference point from where you set the scale for the distance in Logger Pro.
2. The ball that is being used should be of standard size 24.7 in diameter, weight of 595.3 g and pressure of 2 atp (atmospheric pressure).
3. Make sure that the background should be still because if there is a lot of movement in the background, analyzing the videos will be a problem.
4. The camera angle should be set up in the appropriate spot. It should be perpendicular to the point half way between the player and the basket.
5. The camera should be of adequate distance to capture the entire projectile motion path of the ball
Angle of entry Apparent Diameter of Basket (Cm)
90 45.70
80 45.00
70 42.94
60 39.58
50 35.00
40 29.37
30 22.85
20 15.63
10 07.94
0 0
Angle of Entry Error Uncertain y(cm)
90 ±10.5
80 ±10.2
70 ±9.1
60 ±7.4
50 ± 5.1
40 ± 2.3
32.7 0

10 International Journal of Physical Education, Sports and Yogic Sciences Vol. 1 No. 1 (November, 2011) : 8-13
from the release, to the maximum height reached by the ball, to the entry of the ball into the basket.
6. The camera shot should be captured before the time of release and till the entry of the ball into the basket.
7. When taking the shot, the players toe should be near the two point line with an uncertainty of + 5 cm.
8. To help get the video recordings done faster, the
player that you choose to shoot the ball into the basket should have some background in basketball.
9. Know the proper technique of shooting. As it is intended to only analyze the perfect shot, all other shots had to be discarded.
First video analysis:
Here is a screen shot of data collected using logger pro. This is one of the videos taken in day. Only a few videos were taken to terminate the experiment early because it was realized that there were certain factors that had been overlooked which were affecting the reading to a larger extent than expected. These factors were: Wind speed: the wind speed during the video collection was very high. The videos were taken in the afternoon and the wind was blowing in the south direction. Since the wind was blowing almost perpendicular to the trajectory of the ball, the effect was that the ball deviated towards the right almost up to 10 cm. The player had to adjust his position to get the ball in the basket and hence was shooting at an angle to the basket. This was making the readings collected inaccurate. To rectify this problem, the wind speed the next day at intervals of 3 hrs using a wind Gauge. It was observed that the wind speed was very low in the early morning and sometimes, almost negligible. With this information, it was decided that the next set of reading will be taken in the morning. Camera angle - height: the video was taken at an elevated angle. The camera was much higher than the shoulder level of the player. This was affecting the analysis in judging the maximum height that the ball reached. To rectify this problem, the camera was positioned at the shoulder level of the player. Camera angle – position: the camera shot was taken from the left hand side of the player. Since the player is
right handed, when taking the video, the left hand covers the right hand to some extent. This was not a problem when the player did not elevate his left hand when taking the shot however when he did elevate his left hand, due to the ghost effect of the video, the point of release was obscured. To rectify this problem the video was filmed from the right hand side of the Player, So that only the right hand is visible Experiment 2 Add-on to the method of Experiment 1 1. To get an accurate reading, the video must be shot
at a time of the day where the lighting conditions are good and when there is very little wind speed because the wind speed will change the trajectory of the ball. The lighting will give clear video images that make analyzing the readings easier.
2. The video shot should be taken from the shoulder level of the shooter. This is to ensure that when analyzing the video, the perception of the player’s height and trajectory does not get affected.
3. The video shot should be taken from the shooting hands side of the player so that during analysis of the data, there is no misinterpretation in the process of data collection. The entire extension of the shooting hand will be visible and there will be no interference by the other hand.
Second video analysis
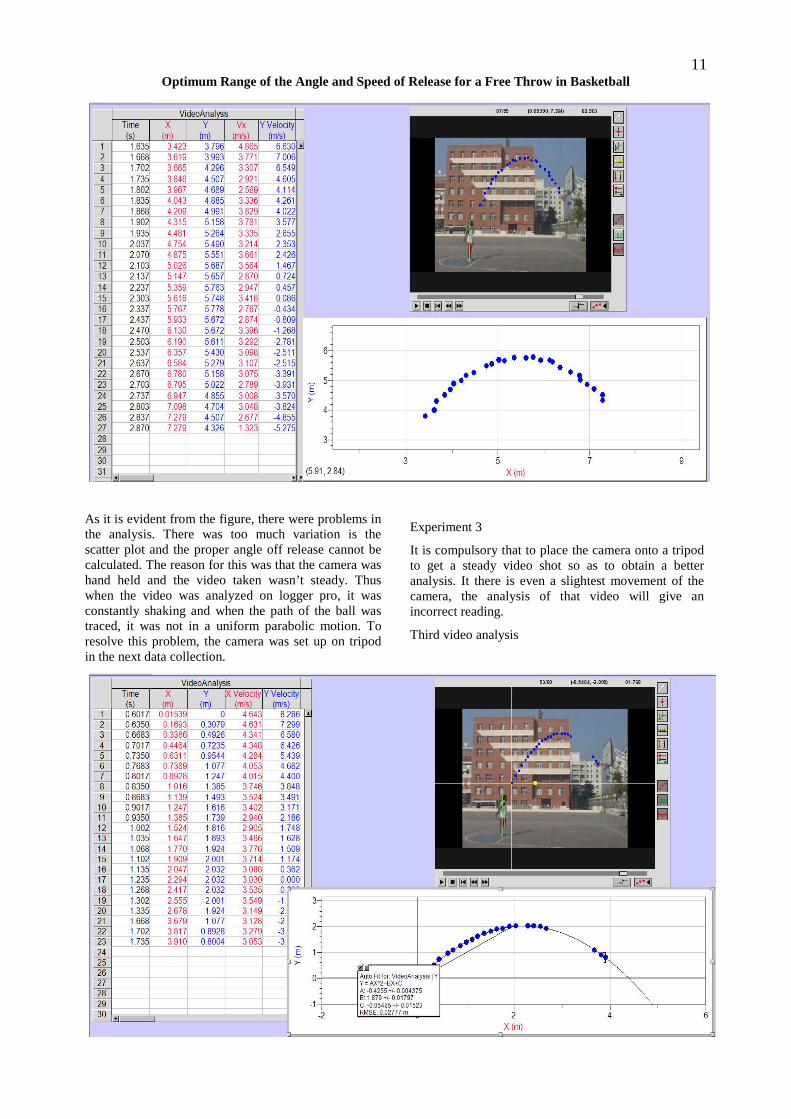
11 Optimum Range of the Angle and Speed of Release for a Free Throw in Basketball
As it is evident from the figure, there were problems in the analysis. There was too much variation is the scatter plot and the proper angle off release cannot be calculated. The reason for this was that the camera was hand held and the video taken wasn’t steady. Thus when the video was analyzed on logger pro, it was constantly shaking and when the path of the ball was traced, it was not in a uniform parabolic motion. To resolve this problem, the camera was set up on tripod in the next data collection.
Experiment 3
It is compulsory that to place the camera onto a tripod to get a steady video shot so as to obtain a better analysis. It there is even a slightest movement of the camera, the analysis of that video will give an incorrect reading.
Third video analysis

12 International Journal of Physical Education, Sports and Yogic Sciences Vol. 1 No. 1 (November, 2011) : 8-13
Graph 1: Relationship between Angle of Release and the Angle of Entry
Graph 2: Relationship between the Speed of Release and the Angle of Release
This is the analysis of 10 scored baskets. As it is seen, the maximum angle of release is 63.01 ̊ and the minimum angle of release is 52.42 ̊, which is within the hypothesized range . The maximum angle of entry is 56.47 ̊ and the minimum angle of entry is 46.26 ̊. The velocity of the shots ranges from 4.60 m/s to 9.5 m/s. As seen in the graph, it is evident that with the increase in the angle of release there is an increase in the angle of entry. This may not be uniform because the speed of each shot is not constantly increasing.
Discussion/ Conclusion The optimum range of the angle of release and speed of the shot where the player, of average height (1.74 m) will get the ball into the basket on every attempt taken from the free throw line, the optimum range of the angle of release is from 52.42 ̊up to 63.1 ̊, with a corresponding optimum range of the speed of release from 4.6 m/s to 9.5 m/s.
Graph 3: Trajectory of the Basketball (Highlighted is the optimum trajectory)

13 Optimum Range of the Angle and Speed of Release for a Free Throw in Basketball
The experiment conducted to gather this data was not perfect. There were many more variable that could be changed to get a better reading. The first thing is that the logger pro is not as accurate as it may seem. Even though is does slow down the video and allow you to graph the trajectory, the marking of the position of the ball still has to be done manually and here the factor of the human error comes into play. Secondly, it would be better if the experiment were conducted in an indoor court where the air resistance is negligible and thirdly, a uniform background can be made and set up to give better visibility of the ball. Due to the restriction of work, it was beyond the scope of this study to explore the other factors such as shots taken from different distances from the basket, players of different heights, rebound the ball off the back board and the effect of bouncing the ball before shooting. A further study can be done on all the forces that affect the ball during flight.
References: Giancoli, Douglas Giancoli, published by Pearson education, Inc. Upper saddle river, New Jersey The Biomechanics of Sports Techniques published by prentice-hall, inc., Englewood cliffs, N.J. http://www.basketball-goals.comimagesspaldingbasket ball -court- dimensions.gif http://www.ajdesigner.com/phpprojectilemotion/vertical_velocity_equation.php http://www.worsleyschool.net/science/files/physicsof/basketball.html Physics/rk/our%20webpage.html http://www.sciencedaily.com/releases/2009/11/091106201101.htm
Authors’ affiliations: Jayu Ganesh
Physics Deptt., SIS, Pune (M.S) India
Lobo Rohan Pinto SIS, Pune (M.S) India
14 International Journal of Physical Education, Sports and Yogic Sciences Vol. 1 No. 1 (November, 2011) : 14-17
Self - perception Profiles of Athletes and Non -athletes CHANDRIKA SINGH
See end of the article for authors’ affiliations
Correspondence to: CHANDRIKA SINGH H.O.D. Physical Education, Delhi Public School Surat, Opp. Airport, Surat (Gujarat)
ABSTRACT The purpose of this study was to prepare self-perception profile of school athletes and to compare the male and female athletes and athletes & non-athletes on self-perception sub scales. The subjects of the study were athletes (n=310) non- athletes (n=310) from same age group & class of Jabalpur city who volunteered to participate in the study. Self-perception profile for children (SPPC; Harter 1985) was used to prepare a self-perception profile of athletes. Results indicated that female athletes had higher scholastic competence, more socially accepted, better physical appearance, well behaved and like themselves more as a person than do males but female and male athletes did not differ significantly on athletic competence sub scale of self-perception and the male athletes were more athletic than non-athletes.
Key words: Self-perception, Profile, Scholastic Competence, Athletic Competence.
Self-perception refers to an important component of child’s psychological make-up and evaluation of the self which forms the basis of all his/her behaviors. Self-perception has consistently occupied a central position in the explanation of human behavior and indication of mental well being (Fox & Corbin, 1989). Thus self-perception has become increasingly valued within educational, clinical and community health programs (Page et al., 1993).
The purpose of this study was to assess the self-perception profile of male and female school athletes and asses the differences in the self-perception profile of athletes and non-athletes of both sexes.
Methodology:
Athletes (n=310) who were participated in different games and sports f rom their schools and the same number of Non- athletes (n=310) from the same age group & class of Jabalpur city who
volunteered to participate in this study were the subjects of the study. The age of subjects ranged from 13 to 19 years with mean age 16 years. The mean age of athletes was 15.4 years and of Non-athletes was 16.6 years.
Self-perception profile for children (SPPC; Harter 1985) was used to prepare a self-perception profile of athletes and non- athletes. The SPPC, a widely used instrument is a 36-item scale, subdivided into 6 subscales consisting six-items each. These subscales are scholastic competence, social acceptance, athletic competence, physical appearance, behavioural conduct and global self-worth.
Results and Discussion:
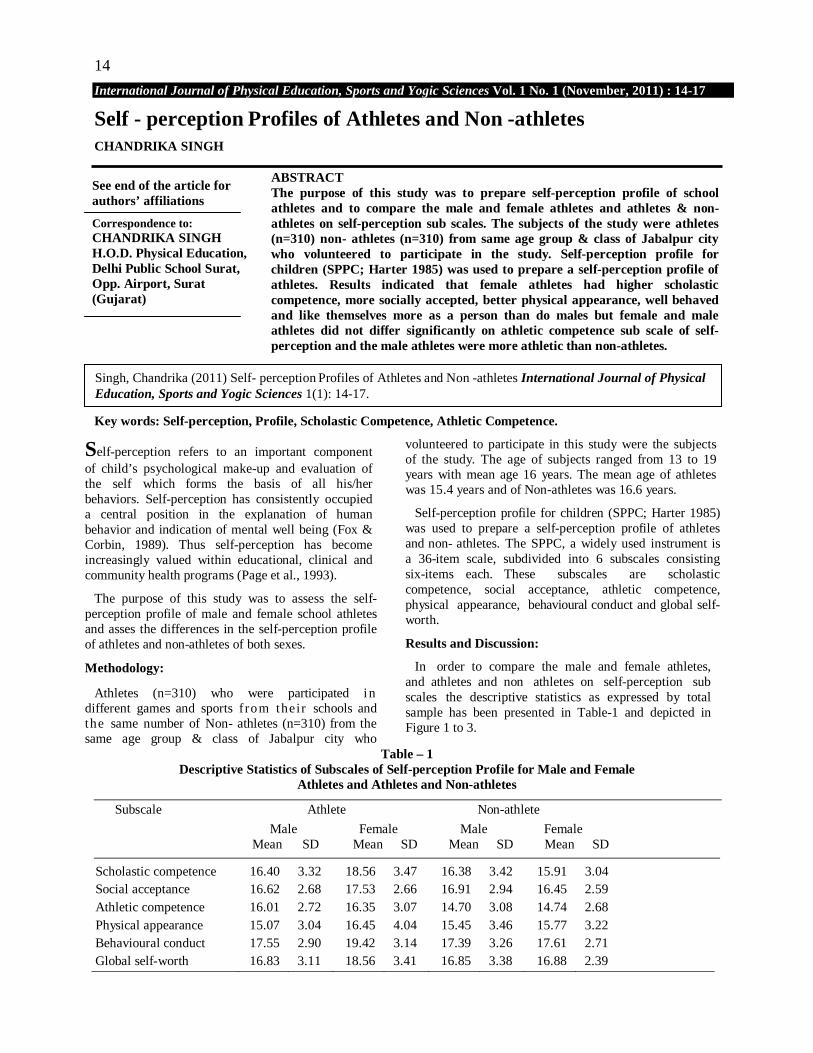
In order to compare the male and female athletes, and athletes and non athletes on self-perception sub scales the descriptive statistics as expressed by total sample has been presented in Table-1 and depicted in Figure 1 to 3.
Table – 1 Descriptive Statistics of Subscales of Self-perception Profile for Male and Female
Athletes and Athletes and Non-athletes
Subscale Athlete Non-athlete Male Female Male Female
Mean SD Mean SD Mean SD Mean SD
Scholastic competence 16.40 3.32 18.56 3.47 16.38 3.42 15.91 3.04 Social acceptance 16.62 2.68 17.53 2.66 16.91 2.94 16.45 2.59 Athletic competence 16.01 2.72 16.35 3.07 14.70 3.08 14.74 2.68 Physical appearance 15.07 3.04 16.45 4.04 15.45 3.46 15.77 3.22 Behavioural conduct 17.55 2.90 19.42 3.14 17.39 3.26 17.61 2.71 Global self-worth 16.83 3.11 18.56 3.41 16.85 3.38 16.88 2.39
Singh, Chandrika (2011) Self- perception Profiles of Athletes and Non -athletes International Journal of Physical Education, Sports and Yogic Sciences 1(1): 14-17.

15 CHANDRIKA SINGH
ME
AN
SC
OR
ES
MEA
N S
CO
RE
S
Descriptive statistics for the self-perception sub scales showed that female athletes scored higher than male on all the sub scales. Male athletes scored higher than Non-athletes on athletic competence (M=16.01, SD=2.72), scored approx equal on scholastic competence (M=16.40, SD=3.32) and global self-worth (M=16.83, SD=3.11) and scored lower on social acceptance (M=16.62, SD=2.68), physical appearance (M=15.07, SD=3.04) and behavioural conduct
(M=17.55, SD=2.90) sub scales. Female athletes scored higher than Non-athletes on all the sub scales.
t- test was computed to find out the significance of difference between male and female athletes; male athletes and Non- athletes; female athletes and non-athletes on sub scales of self-perception profile and data has been presented in Table-2, 3 and 4.
Table – 2 Significance of Difference between Male and Female Athletes on Various
Subscales of Self-Perception Profile Subscale Mean
Male
Mean Female
DM σDM t
Scholastic 16.40
18.56 2.159 0.476 4.54* competence Social 16.62 17.53 0.91 0.367 2.48* acceptance Athletic competence
16.01 16.35 0.337 0.416 0.81
Physical 15.07 16.45 1.387 0.533 2.60* appearance Behavioural 17.55 19.42 1.871 0.43 4.35* conduct Global 16.83 18.56 1.733 0.463 3.74* self-worth
* Significant at 0.05 level t 0 .05 (309) = 1.97
It is evident from table-2 that difference between mean scores of male and female athletes on sub scales of scholastic competence (4.54), social acceptance (2.48), physical appearance (2.60), behavioural conduct (4.35) and global self-worth (3.74) were significant as the mean differences on
these sub scales of self-perception profile were more than the ‘t’ value (1.97) required to be significant. The mean difference between male and female athletes on athletic competence was insignificant at 0.05 level as it was less than the required ‘t’ ratio of 1.97.
MALE FEMALE
25
20
15
10
5
0 SC SA AC PA BC GSW
SUB SCALES
18
17.5
17
16.5
16
15.5
15
14.5
14
13.5
13
MALE ATHLETES NONATHLETES
SC SA AC PA BC GSW
SUB SCALES
Fig. 1: Self-Perception Profile of Male & Female Athletes Fig.2: Self-Perception Profile of Male Athletes & Non-athletes

16 International Journal of Physical Education, Sports and Yogic Sciences Vol. 1 No. 1 (November, 2011) : 14-17
Table – 3 Significance of Difference between Male Athletes and Non-athletes on Various
Subscales of Self-Perception Profile
Subscale Category Mean DM σDM t Scholastic
Athlete
16.40
competence 0.020 0.305 0.07 Non-athlete 16.38 Social acceptance
Athlete 16.62 0.287
0.735
0.39
Non-athlete 16.91 Athletic Athlete 16.01 competence 1.312 0.259 5.07* Non-athlete 14.70 Physical Athlete 15.07 appearance 0.383 0.295 1.29 Non-athlete 15.45 Behavioural Athlete 17.55 conduct 0.163 0.279 0.58 Non-athlete 17.39 Global Athlete 16.83 self-worth 0.023 0.294 0.08 Non-athlete 16.85 * Significant at .05 level t 0 .05 (243) = 1.97
Table-3 reveled significant difference between male athletes and non-athletes on sub scale of athletic competence (5.07) but the mean differences between male athletes and non-athletes on sub scales of scholastic competence (0.07), social acceptance (0.39),
physical appearance (1.29), behavioural conduct (0.58) and global self-worth (0.08) were insignificant, as these were less than the ‘t’ value (1.97) required to be significant at 0.05 level.
Table – 4 Significance of Difference between Female Athletes and Non-athletes on Various
Subscales of Self-Perception Profile
Subscale
Category
Mean
DM
σDM
t Scholastic
Athlete
18.56
competence 2.650 0.566 4.68* Non-athlete 15.91 Social Athlete 17.53 acceptances 1.080 0.450 2.37* Non-athlete 16.45 Athletic Athlete 16.35 competence 1.710 0.492 3.48* Non-athlete 14.74 Physical appearance
Athlete 16.45 0.680
0.636
1.07
Non-athlete 15.77 Behavioural Athlete 19.42 conduct 1.810 0.509 3.56* Non-athlete 17.61 Global Athlete 18.56 self-worth 1.680 0.512 3.28* Non-athlete 16.88 * Significant at .05 level t 0 .05 (65) = 2.00

17 CHANDRIKA SINGH
ME
AN
SC
OR
ES
It is evident from table-4 that significant difference exist between mean scores of female athletes and non-athletes on sub scales of scholastic competence (4.68), social acceptance (2.37), athletic competence (3.48), behavioural conduct (3.56) and global self-worth (3.28) at .05 level. As the mean differences on these
sub scales of self-perception profile were more than the ‘t’ value (2.00) required to be significant at .05 level. The mean difference between female athletes and non- athletes on sub scales of physical appearance was insignificant at .05 level, as it was less than the required ‘t’ ratio of 2.00.
FEMALE ATHLETES NONATHLETES
25
20
15
10
5
0
SC SA AC PA BC GSW SUB SCALES
Fig. 3: Self-Perception Profile of Female Athletes and Non-athletes
The result of the study indicated that female athletes’ self-perception profile was better than the male athletes. Female athletes considered themselves to have better scholastic competence, more socially accepted, better physical appearance, well behaved and like themselves more as a person than do males. However, there was no significant difference between male and female athletes in terms of athletic competence. It was seen that male athletes scored higher than Non-athletes on athletic competence subscale and there were no significant difference on scholastic competence, social acceptance, physical appearance, behavioural conduct and global self-worth subscales. With respect to difference in female athletes and Non- athlete’s self-perception profiles, it was found that female athletes scored higher than Non-athletes on scholastic competence, social acceptance, athletic competence, behavioural conduct and global self-worth subscales and there was no significant difference between mean scores on physical appearance.
CONCLUSIONS:
Within the limitations of present study the following conclusions may be drawn: 1. Female athletes had higher scholastic competence,
more socially accepted, better physical appearance, well behaved and like themselves more as a person than do males.
2. The female and male athletes did not differ significantly on athletic competence sub scale of self- perception.
3. The male athletes were more athletic than do Non-athletes.
4. No significant differences were noted between male athletes and Non-athletes on scholastic competence, social acceptance, physical appearance, behavioural conduct and global self-worth.
5. Female athletes had higher scholastic competence, more socially accepted, stronger athletic competence, well behaved and like themselves more as a person than do Non-athletes.
6. No significant difference found between female athletes and Non-athletes on physical appearance.
References:
Fox, K. R. & Corbin, C. B., “The Physical Self-Perception Profile “Development and Preliminary Validation” Journal of Sports and Exercise Psychology 11 (1989):408-430.
Harter, S. Manual for the Self-perception Profile for Children Denver: University of Denver (1985).
Page, A.; Ashford, B.; Fox, K. & Biddle, S. “Evidence of Cross-cultural Validity for the Physical Self-Perception Profile” Personal Individual Differences 14:4 (1993): 329-337.
18 International Journal of Physical Education, Sports and Yogic Sciences Vol. 1 No. 1 (November, 2011): 18-20
A Psychological and Anthropometric View of the Tribal and Non Tribal Players AJAY Y. KARKARE
See end of the article for authors’ affiliations
Correspondence to: Ajay Y. Karkare Rani Laxmibai Girls College Sawargaon Nagpur (MS)
ABSTRACT The purpose of this study was to investigate psychological and anthropometric variables of tribal and non tribal players of Chhattisgarh state. Investigator decided to find out relationship between somatotyping and personality dimensions of tribal and non tribal players. Three hundred boys (150 tribal and 150 non tribal players) were selected from different areas of Chhattisgarh state. To determine somatotyping of subjects Heath Carter somatotyping method was adopted. To measure personality, Junior Eysenck Personality Inventory (JEPI) model was used. Results indicated significant differences between tribal and non tribal players on skinfold measurement and body diameters. Non tribal players were extrovert as compared to tribal players. Tribal players were found more neurotic compared to non tribal players. Significant relationship was found between extraversion, neuroticism and body types of tribal and non tribal players.
Key words: Somatotyping, Skinfold, Extraversion, Neuroticism.
Physique is the basis of human existence; it is the plinth of personality. A good personality must have a good physique, good appearance, good-bearing, good health, etc. A healthy body is a blessing while a weak one a curse. The layman's assessment of personality veers round the body structure, the physical appearance or has individual looks. Erroneous though it might be, an individual with good musculature has an edge over others at least in body beauty. A sound mind exists only in sound body.
A somatotype is a description of the present morphological confirmation. It is expressed in a three numeral rating, consisting of three sequential numerals, always recorded in the same order. Each numeral represents evaluation of one of the three primary components of physique which describe individual variations in human morphology and composition. It is expressed in a three numeral rating, consisting of three sequential numerals, always recorded in the same order. Each numeral represents evaluation of one of the three primary components of physique which describe individual variations in human morphology and composition. Methodology:
Three hundred boys (150 tribal and 150 non tribal) players from different sports are getting training in sports hostel of different centre of Chhattisgarh state was selected for the study. The age group of the players ranged between 13 to 18 years. All the subjected in the investigation participated in national level tournament.
Anthropometric Assessment: Information on the morphological status of the subjects was obtained by means of ten anthropometric variables. Measurements were carried out in accordance to the standard anthropometric techniques recommended by International Biological Programme (Wernier and Lourie, 1969). All the measurements were carried out by the same person, using the same equipments.
Harpendon skinfold calipers were employed to measure skinfold at four sites: biceps, triceps, sub-scapular and calf. Sliding calipers were employed to measure two diameters: humerous diameter and femur diameter. Steel tape was used to measure girth of bicep and calf muscle. Height (Stater) and body mass was calculated using standard technique.
To obtained somatotype of players Heath Carter somatotyping method was used. After taken of all ten measurements following equation prepared by Carter (1980) was adopted to determine endomorph, mesomorph and ectomorph.
1. Endomorph = - 0.7182 + 0.1451(X) - 0.00068 (X) 2+
0.0000014 (X) 3 Where X is the sum of triceps, sub scapular and supra spinal skinfolds 2. Mesomorph = 0.858 X HB + .601 X FB + 0.188 X CAC + 0.161 X CCC) - (Height X 0.131) + 4.50 Where HB denotes Humerus biecpicondylar diameter; FB denotes Femur biecpicondylar diameter CAC denotes Corrected Arm Circumference);
Karkare, Ajay Y. (2011) A Psychological and Anthropometric View of the Tribal and Non Tribal Players International Journal of Physical Education, Sports and Yogic Sciences 1(1): 18-20.

19 AJAY Y. KARKARE
CCC denotes Corrected Calf Circumference 3. Ectomorph = HWR X 0.732 — 28.58 Where HWR denotes Height Weight Ratio For the purpose of tapping extraversion, neuroticism and L dimension of Eysenck's personality theory, the J.E.P.I. inventory developed by B.J. Eysenck has been preferred. This inventory measures extraversion (E), neuroticism (N) along with an element of social desirability known as faking through its lie sub-scale by a questionnaire method. The original inventory is in
English and it is basically meant for junior population. It was decided to go for a Hindi version of Eysenck's J.E.P.I. inventory prepared by (Helode, 1985). This Hindi J.E.P.I. inventory comprises of in all 50 items of which 20 items are for tapping E, 20 items for measuring N, and 10 items are for measuring tendency to tell a lie (L). So as reliability and validity of this Hindi J.E.P.I. is concerned, it can be said that the inventory is highly reliable and valid.
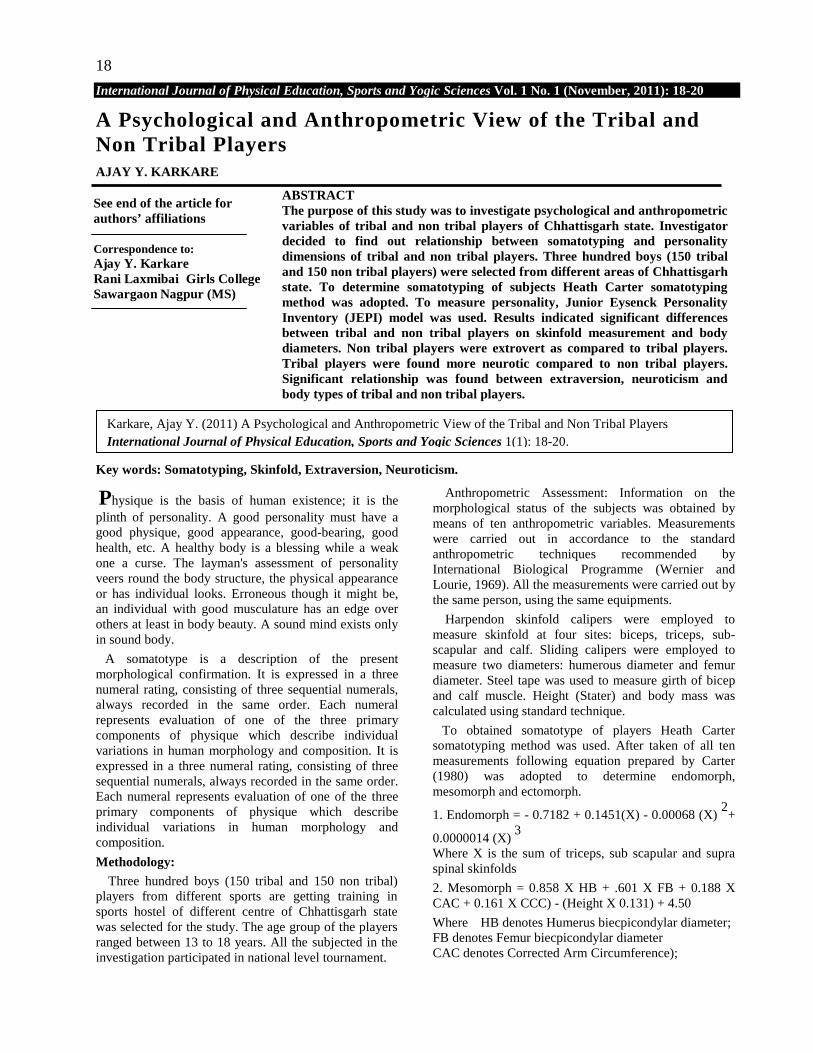
RESULTS AND DISCUSSION:
Table No. 1 Descriptive Characteristics of all the Participants
Variables Tribal Boys Mean ± SD
Non Tribal Boys Mean ± SD
t
Height Weight Triceps skinfold Sub scapular skinfold Supra spinal skinfold Calf skinfold Humerus biepicondylar diameter Femur biecondylar diameter Biceps girth Calf girth
161.39±8.89 46.59± 6.62 4.96 ± 1.28 5.88 ± 127 4.17 ± 0.98 7.30 ± 1.99 5.64 ± 0.40 8.19 ± 0.61
23.71 ± 3.25 30.76 ± 2.51
159.30 ± 10.60 46.72 ± 11.81 9.41 ± 4.47 8.56 ± 4.53 8.27 ± 4.68
13.39 ± 5.39 5.97 ± 0.52 8.73 ± 0.62
24.21 ± 3.75 30.27 ± 3.62
p>0.05 p>0.05 p<0.01 p<0.01 p<0.01 p<0.01 p<0.01 p<0.01 p>0.05 p>0.05
Table No. 2 Comparison of Somatotype among Tribal and Non Tribal Players
Variables Tribal Boys Mean ± SD
Non Tribal Boys Mean ± SD
Endomorph Mesomorph Ectomorph
1.40 ± 0.38 2.30 ± 1.08 4.32 ± 1.15
2.73 ± 1.37 3.02 ± 1.24 4.10 ± 1.59
P < 0.01 P < 0.01 P > 0.05
Table No. 3 Comparison of Personality Dimensions among Tribal and Non Tribal Players
Variables Tribal Boys
Mean ± SD Non Tribal Boys
Mean ± SD
Extraversion-Introversion Neuroticism L-score (Tendency to tell lie)
12.39 ± 2.49 9.38 ± 3.60 6.69 ± 1.86
15.60 ± 2.24 5.93 ± 3.17 6.32 ± 2.19
P < 0.01 P < 0.01 P > 0.05
Table No. 4 Regression Co-efficient for the Body type and Personality Dimensions
Endomorph Mesomorph Ectomorph
Extraversion 0.393** 0.313** -0.196** Neuroticism -0.275** -0.234** 0.089
L-Score -0.012 0.068 -0.081
** P < 0.01

20 International Journal of Physical Education, Sports and Yogic Sciences Vol. 1 No. 1 (November, 2011): 18-20
Table 1 presents a profile of the score on all the variables for selected tribal and non tribal players. Tribal and non tribal players demonstrated significant mean difference between skinfold of triceps, biceps, sub scapular and calf beyond .01 level. Significant difference also found between humerus and femur diameter beyond .01 level among tribal and non tribal players.
Table 2, shows that tribal and non tribal boys players have found to be significantly differ beyond .01 level on endomorph and mesomorph body type. No significant difference has been observed on ectomorph body type among tribal and non tribal players.
Table 3 revealed that tribal and non tribal players significantly differed on extraversion and neuroticism personality dimension. Correlation coefficient was generated by Pearson Product Movement Correlation method between somatotype and personality dimensions. Table 4 present the significant correlation ship (p<0.01) between extraversion and body type. Neuroticism personality dimension have shown negative relationship (p<0.01) with endomorph and mesomorph body type.
The finding of the study revealed that, non tribal players skinfold thickness was more than the tribal players. Tribal players were having fewer diameters than the non tribal players. In height and weight no significant difference has been found. The life style, living standard, food, and culture of tribal and non tribal players are different, that may be reason behind difference in anthropometric measurements.
Non tribal players rating in endomorph and mesomorph body type was greater than the tribal players. No significant difference was observed on ectomorph body type.
Non tribal players were found to be extrovert compared to tribal player. Tribal players showed more neurotic tendency than the non tribal players.
No difference was observed on L-score dimension. The tribal players were not getting opportunities to expose than the non tribal players. Thus they were found to be introvert. Tribal players were found to be emotional unstable than the non tribal players.
Extroversion personality dimension showed significant relationship with endomorph, mesomorph and ectomorph
body type. Neuroticism dimension showed significant negative relationship with endomorph and mesomorph body type. Sheldon (1942) found that the correlation between the parallel physique and temperament dimensions is significant and surprisingly high. While the correlation between all other combination of the physique and temperament variables is significantly negative.
CONCLUSIONS:
Tribal players showed significantly more skinfold thickness of triceps, biceps, sub scapular and calf compared to non tribal players. Non tribal players showed significantly more diameters of humerous and femur as compared to tribal players. Non tribal players showed significant difference on endomorph and mesomorph body types as compared to tribal players. Non tribal players were found to be more extroverts as compared to tribal players. Tribal players showed more neuroticism as compared to non tribal players. There was significant relationship between extraversion and neuroticism with body types of tribal and non tribal players.
REFERENCES: Jaski, A. & Bale, P. “The Physique and Body
Composition of Top Class Squash Players” Journal of Sports Medicine Vol. 27, 1987.
Livson, N. & McNeil, D. Physique and Maturation Rate in Male Adolescents Child Development 1962, 33, 145-152.
Sheldon, W. H. et al. The varieties of human physique an introduction to constitutional psychology, New York: Harper, 1940.
Sheldon, W. H. et al. The Varieties of Temperament – A Psychology of Constitutional Differences New York: Harper, 1942.
Sheldon, W. H. et al. Varieties of Delinquent Youth: An Introduction to Constitutional Psychiatry New York: Harper, 1949.
Sheldon, W. H. et al. Atlas of Men: A Guide for Somatotyping - The Adult Male at All Ages, New York: Harper, 1954.
Sodhi, H. S. “Physique of Top-Ranking Indian Wrestlers” Journal of Sports Medicine Vol.-23, 1983, 59-66.

21 International Journal of Physical Education, Sports and Yogic Sciences Vol. 1 No. 1 (November, 2011): 21-23
Construction of Knowledge Test in Badminton for Physical Education Students S. K. YADAV and GYANENDRA PRAJAPATI
See end of the article for authors’ affiliations
Correspondence to: S. K. YADAV School of Physical Education Devi Ahilya University INDORE (M. P.)
ABSTRACT Main objective of the study was to construct a knowledge test in Badminton. For this purpose forty students from the School of Physical Education, Devi Ahilya University, Indore, in the session 2007–08, were randomly selected to serve as subjects. A 105 items objective test was first administered to 10 subjects to determine the clarity of question items and on that basis question items were refined. Then the test was administered to all the subjects, which they answered in the allotted time of 90 minutes. These response sheets were then evaluated. 15 items were eliminated on the basis of difficulty rating and 25 items were discarded on the basis of index of discrimination. The final test therefore contained 80 questions.
Key words: Badminton, Knowledge test, Index of discrimination, Difficulty rating
Badminton is the one of the greatest games that can be played indoors. It distinguishes from other racket sports by two intriguing features: the use of a shuttlecock and the fact that the shuttlecock must not touch the ground during the rally. The flight characteristics of the shuttlecock and the pace created by constant volleying combine to make badminton one of the exciting sports to play and to watch. Evaluation in physical education cannot be complete without the use of knowledge tests. The measurement of knowledge of physical education activity classes is just as important as knowledge measurement in other subject areas.
Methodology: Main objective of the study was to construct a
knowledge test in Badminton. Forty students from the School of Physical Education, Devi Ahilya University, Indore in the session 2007–08, were randomly selected to serve as subjects.
The knowledge test consisted of 105 objective type questions from different aspect of the game in a definite proportion. Questions were selected covering various aspects of game i.e. History and Developments, the New Laws and their interpretations, skill and terminologies, strategy and modern trends in the game. Before administering the test intensive instructional classes were conducted for the subjects to cover various aspect of the game Badminton. This was to make the subject well acquainted with the subject matter. Each explanation was taught with due explanations with the help of diagrams (wherever necessary).
Objective knowledge test was first administered to ten subjects to determine the clarity of question items and on that basis question items were refined and the subjected to careful analysis. Then the test was administered to all the subjects, which they answered in the allotted time of 90 minutes. These response sheets were then evaluated. On the basis of the response scores, the question items were further subjected to careful item analysis. The items, which were found unsatisfactory after analyses, were either rejected or modified. Results and Discussion:
There were 105 objective type questions in the initial test. All the students were given ample directions before administrating the test. The answers to be written in blank were provided with each question. All questions carried equal marks and maximum marks were 105. One point was awarded for each correct response. The sum of the total number of correct responses was the final score of each subject. The range of scores for forty examinees was 22 to 99. The mean score was 61.35.
The findings of the study indicated that the degree of difficulty in rating for the knowledge test questions ranged from 0.02 to 1.00 and its mean difficulty was 0.583. Those questions, which were answered correctly by more than 80 percent of subjects, were judged to be too easy and answered correctly by less than 20 percent, were considered too difficult. A total of 15 items were eliminated from the test for this reason.
Index of discrimination indicated those questions in which poor students did well or better than the subjects of the upper group and the value is less than 0.30. Thus a total of 25 items were discarded. The items discarded due to various reasons are presented in Table – 1.
Yadav, S. K. and Prajapati, Gyanendra (2011) Construction of Knowledge Test in Badminton for Physical Education Students International Journal of Physical Education, Sports and Yogic Sciences 1(1): 21-23.

22 S. K. YADAV and GYANENDRA PRAJAPATI
TABLE - 1 ITEMS DISCARDED AFTER ITEM ANALYSIS
S. No. Q. No. D.R. I.D. Total S. No. Q. No. D.R. I.D. Total 1. 1 2. 2 3. 3 4. 4 5. 5 6. 6 X X X 7. 7 X X X 8. 8 9. 9 10. 10 X X X 11. 11 12. 12 13. 13 14. 14 X X X 15. 15 16. 16 17. 17 18. 18 19. 19 20. 20 21. 21 22. 22 23. 23 X X X 24. 24 25. 25 26. 26 27. 27 28. 28 X X 29. 29 30. 30 31. 31 32. 32 33. 33 34. 34 35. 35 36. 36 37. 37 38. 38 39. 39 40. 40 X X X 41. 41 42. 42 43. 43 44. 44 45. 45 X X 46. 46 47. 47 48. 48 49. 49 50. 50 51. 51 52. 52 X X 53. 53
54. 54 X X X 55. 55 X X X 56. 56 X X 57. 57 58. 58 59. 59 60. 60 X X X 61. 61 62. 62 X X 63. 63 64. 64 65. 65 66. 66 67. 67 68. 68 X X X 69. 69 X X X 70. 70 71. 71 72. 72 73. 73 74. 74 X X X 75. 75 76. 76 77. 77 78. 78 X X 79. 79 80. 80 X X X 81. 81 82. 82 83. 83 84. 84 X X X 85. 85 86. 86 X X 87. 87 88. 88 89. 89 90. 90 91. 91 92. 92 93. 93 X X X 94. 94 95. 95 96. 96 97. 97 X X 98. 98 99. 99 100. 100 X X 101. 101 X X 102. 102 103. 103 104. 104 105. 105
The final test therefore contained 80 questions.

23 International Journal of Physical Education, Sports and Yogic Sciences Vol. 1 No. 1 (November, 2011): 21-23
CONCLUSIONS:
1. Fifteen items were eliminated on the basis of difficulty rating, which contained items answered correctly by the students below 20 percent and above 80 percent.
2. Twenty-five items were discarded on the basis of index of discrimination in which poor students did well or better than upper group.
3. The revised test contained 80 objectives type questions in squash for college students of Physical Education.
REFERENCES: Bloss, Margaret Varner and Hales, R. Stanton
Badminton 5th Ed. Iowa: Wm. C. Brown Publishes, 1987.
Baumgartner, Ted A and Jackson, Andrew S. Measurement for Evaluation in Physical Education and Exercise Science, 4th Ed. Dubuque: Wm, C, Brown Publishers, 1991.
Barrow, Harold M.; McGee, Rosemary and Tritschler, Kathleen A. Practical Measurement in Physical Education and Sports, 4th ed., (Philadelphia: Lea and Febiger, 1989.
Authors’ affiliations:
GYANENDRA PRAJAPATI Physical Education Teacher Pathways World School, Aravali of Gurgaon Sohana Road, Haryana
24 International Journal of Physical Education, Sports and Yogic Sciences Vol. 1 No. 1 (November, 2011): 24-26
Comparison of Arm Strength, Agility and Flexibility between Attackers and Defenders in Field Hockey VIKAS PRAJAPATI and AKANSHA RAJORA
See end of the article for authors’ affiliations
Correspondence to: VIKAS PRAJAPATI Department of Physical Education M. S. University Baroda (Gujarat)
ABSTRACT The study was undertaken to compare the arm strength, agility, flexibility between attackers and defenders in Field Hockey. Twenty two national boys Field Hockey players who represented Gujarat state were selected as subjects for this study. For arm strength, the Rogers formula was employed in which height was measured in inches, weight in pounds and push-ups, pull-ups in numbers, agility (shuttle run 40 yards) in seconds, flexibility i.e. spine flexibility through Modified sit and reach test in inches and shoulder-wrist flexibility using shoulder and wrist elevation test in inches. To compare selected variables i.e. arm strength, agility and flexibility between attackers and defenders of Hockey t-test was employed. The results indicated that there were no significant differences between Arm strength (t-0.034, p>0.05), Agility (t-0.035, p>0.05), flexibility of spine (t- 0.182, p >0.05) and flexibility of shoulders and wrist (t- 0.230, p >0.05) of attackers and defenders.
Key words: Attackers, Defenders, Arm Strength, Agility, Flexibility.
Physical fitness is an inseparable part of sports performance and achievements. The quality of its utilization value is directly proportional to the level of performance. That means the greater the level of fitness, greater the ability of a person to attain higher level of performance. The continuous scientific advancement in sporting arena has made sports training more purposive, factual and very specific than ever. Sports scientists are leaving nothing to enhance in order to find out the performance enhancing and affecting factor as well as the best result oriented training systems for every sports.
An individual with high level of general motor ability possesses the basic motor qualities necessary to achieve excellence in a number of activities may still be unable to perform well in a particular sports unless he has developed a specific skill of that sports through long hour of practices, strength, speed, endurance, agility, reaction time and speed of movement are general components of performance in the field of sports and games. General motor ability assists a sportsman in learning the specific skills and forms a solid base, over which he can develop excellence in the particular game he is involved.
In modern competitive sports, Hockey has become one of the most popular games in the world. Today Hockey is essentially a team game and has developed into a fast and highly skillful one. In Hockey generally
players are divided into two categories, offensive-attackers and defensive-defenders. It is said that the dominants of defenders in matter of arm strength is very high as their hits and long passes are concern. In modern day’s hockey, the skill-slap shot is very used for passing, it must require massive power and strength of arm; same for the drag flick. In other way the same power and strength of arm is required for the attackers for the shooting and scoring.
Attackers must be agile in their moves. They should move quickly with the change of directions to pass the defenders. In same way defenders are required to move in any direction to tackle or to stop the attacker legitimately.
As the flexibility is greater range of the motion around joints, both attackers and defenders are required a wider range of motion particularly at spine to bend forward and twisting to get the better control over the skill, at shoulders and the wrist to execute the stroking technique with greater force and in accurate manner as well as to provide the direction to the ball.
Methodology: 22 National Level Boys Field Hockey Players (11
attackers and 11 defenders) of Gujarat State were selected for the purpose of this study. The selected subjects were from the age group of 17-19 years. To compare the subjects (attackers and defenders) of the
Prajapati, Vikas and Rajora, Akansha (2011) Comparison of Arm Strength, Agility and Flexibility between Attackers and Defenders in Field Hockey International Journal of Physical Education, Sports and Yogic Sciences 1(1): 24-26.

25 VIKAS PRAJAPATI and AKANSHA RAJORA
study the selected variables such as arm strength, agility, flexibility were taken as a criterion measures.
Arm strength of the subject was taken by this formula
−++ 6010
)( HwDipsupsPull
Where W = represent the weights in pounds H = Height in inches.
Agility is the time taken by the subject to perform 4x10 yards shuttle run was recorded to nearest 1/10th of a second with the help of stop watch which was properly calibrated and synchronized.
Spine and shoulder-wrist flexibility of the subjects was taken by flex measure with yard stick to the nearest
inches. Thus the lower the score the better was the performance.
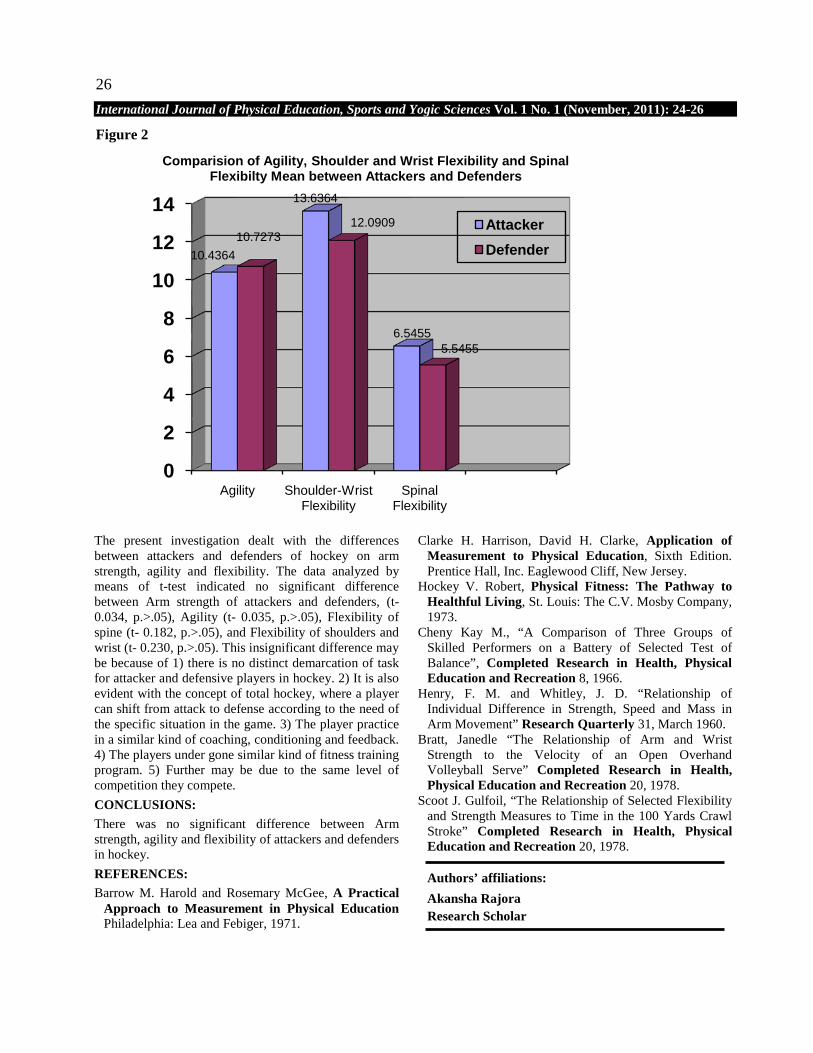
For determining the significant comparison of arm strength, agility and flexibility between the attackers and defenders of hockey, t-test was employed and calculated with the help of statistical packet 12.5. For testing the hypothesis of independent variables, the level of significance was set at 0.05 level of confidence. OBSERVATIONS AND DISCUSSION: In order to compare the Arm Strength, agility, shoulder-wrist flexibility and spinal flexibility of attackers and defenders in Field Hockey, the collected data was analyzed by using t-test for each component. The results of the statistical technique used on data are presented in given Table - 1.
Table - 1 Independent Samples Test
Variable Mean Attacker Mean Defender Mean
Difference Std. Error Difference t-ratio
Arm strength 778.3636 640.5455 137.81818 60.64152 0.034 Agility 10.4364 10.7273 -.29091 .12889 0.35
Shoulder-Wrist Flexibility 13.6364 12.0909 1.54545 1.24847 0.230
Spinal Flexibility 6.5455 5.5455 1.00 .72271 0.182
Figure 1
0
100
200
300
400
500
600
700
800
Arm Strength
778.3636
640.5455
Comparision of Arm Strength Mean between Attackers and Defenders
Attacker
Defender
26 International Journal of Physical Education, Sports and Yogic Sciences Vol. 1 No. 1 (November, 2011): 24-26
Figure 2
The present investigation dealt with the differences between attackers and defenders of hockey on arm strength, agility and flexibility. The data analyzed by means of t-test indicated no significant difference between Arm strength of attackers and defenders, (t- 0.034, p.>.05), Agility (t- 0.035, p.>.05), Flexibility of spine (t- 0.182, p.>.05), and Flexibility of shoulders and wrist (t- 0.230, p.>.05). This insignificant difference may be because of 1) there is no distinct demarcation of task for attacker and defensive players in hockey. 2) It is also evident with the concept of total hockey, where a player can shift from attack to defense according to the need of the specific situation in the game. 3) The player practice in a similar kind of coaching, conditioning and feedback. 4) The players under gone similar kind of fitness training program. 5) Further may be due to the same level of competition they compete. CONCLUSIONS: There was no significant difference between Arm strength, agility and flexibility of attackers and defenders in hockey. REFERENCES: Barrow M. Harold and Rosemary McGee, A Practical
Approach to Measurement in Physical Education Philadelphia: Lea and Febiger, 1971.
Clarke H. Harrison, David H. Clarke, Application of Measurement to Physical Education, Sixth Edition. Prentice Hall, Inc. Eaglewood Cliff, New Jersey.
Hockey V. Robert, Physical Fitness: The Pathway to Healthful Living, St. Louis: The C.V. Mosby Company, 1973.
Cheny Kay M., “A Comparison of Three Groups of Skilled Performers on a Battery of Selected Test of Balance”, Completed Research in Health, Physical Education and Recreation 8, 1966.
Henry, F. M. and Whitley, J. D. “Relationship of Individual Difference in Strength, Speed and Mass in Arm Movement” Research Quarterly 31, March 1960.
Bratt, Janedle “The Relationship of Arm and Wrist Strength to the Velocity of an Open Overhand Volleyball Serve” Completed Research in Health, Physical Education and Recreation 20, 1978.
Scoot J. Gulfoil, “The Relationship of Selected Flexibility and Strength Measures to Time in the 100 Yards Crawl Stroke” Completed Research in Health, Physical Education and Recreation 20, 1978.
Authors’ affiliations: Akansha Rajora Research Scholar
0
2
4
6
8
10
12
14
Agility Shoulder-Wrist Flexibility
Spinal Flexibility
10.4364
13.6364
6.5455
10.727312.0909
5.5455
Comparision of Agility, Shoulder and Wrist Flexibility and Spinal Flexibilty Mean between Attackers and Defenders
Attacker Defender

27 International Journal of Physical Education, Sports and Yogic Sciences Vol. 1 No. 1 (November, 2011): 27-29
Assessment of Imagery Functions Used by Athletes of Different Games and Sports R. K. YADAV and NEHA KHARE
See end of the article for authors’ affiliations
Correspondence to: R. K. YADAV Department of Physical Education R. D. University, Jabalpur (M. P.)
ABSTRACT The purpose of this study was to assess the use of different types of imagery functions by inter-University level male & female athletes. A total of 322 athletes completed. The Sport Imagery Questionnaire (SIQ, Craing R. Hall, 1998) that was designed to reflect an athlete's use of imagery. MANOVA’s indicated that gender-based difference in the use of imagery functions by male & female athletes of different game & sports & difference in the use of different imagery functions by different game categories. More specifically, the male & female athletes did not differ in use of different imagery functions. In addition, ANOVA indicated that the participants of individual sports are mostly used “Motivational general-Mastery” for staying focused & working through problems & participants of combative & team games are mostly use "Motivational specific imagery” to improve their specific goals & outcomes.
Key words: Sports Imagery, Motivation, Arousal, Cognitive.
Over the last 20 years, researchers have examined a number of theoretical frameworks to explain the mechanism underling the effects & use of imagery. Paivio (1985) has proposed a simple analytical framework to help explain why athletes use imagery. He suggested that imagery serves both cognitive & motivational functions & each operate at a specific or general level. One of the frameworks of imagery use in sports was provided by Hall, Mack, Paivio & Housemblas (1998), who classified 5 types of imagery used by athletes : Cognitive General (CG ; e.g. imaging strategies of play), Cognitive Specific (CS; e.g. imaging perfectly executed sport skill), Motivational General-Arousal (MG-A; e.g. imaging the anxiety & arousal that can accompany competition), Motivational General- Mastery(MG-M; e.g. imaging being mentally tough, focused & confident),& Motivational Specific(MS; e.g.; imaging specific goals & outcomes).Hall et al.(1998) proposed that the 5 types of imagery were functionally orthogonal. Therefore, athletes may use the different types of imagery independently, or in combination, to achieve a number of successful behavioural and cognitive outcomes.
Although the model proposed by Martin et al. (1999) has not been extensively tested, a number of consistent findings have emerged from research examining the cognitive & motivational functions of imagery. Generally, CS imagery has been shown to be the most effective types of imagery to facilitate the acquisition & performance of motor skills (Feltz & Landers, 1983;
Martin et al. 1999), mastery imagery (MG-M) has been found to be more effective in enhancing self confidence than imagery of specific sport skills (CS; Moritz , Hall , Martin , & Vadocz, 1996) , & MG-A has been most closely associated with regulating levels of anxiety & arousal (White & Hardy, 1998). Indeed , Vadocz ,Hall & Hardy , (1997) found that MG-A imagery predicted competitive anxiety , while CS & MG-M imagery failed to account for significant variance in athletes for significant variance in athletes anxiety. Less is known, however, about the CG function, despite case study reports of its merits for strategy development & execution (Fenker & Lambiotte, 1987). Although to date, athletes have been reported to use imagery more for its motivational function than its cognitive function (Barr & Hall, 1992; Moritz et al. 1996), athletes may use different types of imagery to achieve different types of outcomes (Munroe, Hall, Simms &Weinberg, 1998; White & Hardy, 1998). Indeed, Callow & Hardy (2001) reinforced the importance of distinguishing between the types of imagery an athlete uses & the functions it might serve, not because athletes may use the same type of imagery but for very different functions.
The main purpose of the present study was to examine the functions of imagery (i.e., cognitive Specific, Cognitive general, motivational specific, motivational general-arousal & motivational general-mastery) used by athletes of different game & sports. We predicted that athletes would report using all five functions of imagery
Khare, Neha and Yadav, R. K. (2011) Assessment of Imagery Functions Used by Athletes of Different Games and Sports International Journal of Physical Education, Sports and Yogic Sciences 1(1): 27-29.

28 R. K. YADAV and NEHA KHARE
but made no additional predictions as to which functions of imagery the athletes would use the most frequently.
The second purpose of the present study was to examine how gender & game categories influence imagery use. It was predicted that gender would not influence athlete's imagery use but game categories influence athlete's imagery use.
Methodology: 322 athletes (214 male & 108 female) who participated in 25 different sports, including Track and field (54), Hockey (17), Volleyball (20), Karate (10), Boxing (18), Judo (20), Wrestling (5), Skating (4), Squash (5), Softball (14), Kabaddi (6), Badminton (12), Yoga (6), Table Tennis (2), Fencing (8), Taekwondo-Do (7), Gymnastics (7), Weight lifting (2), Lawn Tennis (3), Shooting (10), Kho-Kho (19), Cricket (13), Football (15), Basketball (27) and Handball (21) and who volunteered to participate in the study were classified in to three groups i.e. team games, individual sports and combative sports. The age of subjects range from 18 to 28 years, with mean age of 22.19 years (S.D. = 3.65). On average, the athletes had at least 3 years competitive experience in their respective sports.
The Sports Imagery Questionnaire (SIQ) by Hall et al. (1998) was used to assess the motivational & cognitive functions of imagery of the subjects. This 30-item self-report questionnaire assesses athlete's use of five different types of imagery. Each subscale contains 6 items & athletes rate on a 7-point Likert scale (1=rarely & 7=often) how often they employ each type of
imagery. The five scales have been shown to have acceptable internal consistencies, with alpha coefficients ranging from .75 to .89.Interscale correlations that range from -.31 to .22 indicate that the scales represent different constructs (Hall et al.1998).
The researcher contacted the head coach from the various sport teams & obtained their permission to ask their athletes to participate in the study. All athletes, who were approached, agreed to participate in the study. The subjects were explained the purpose of the study. There is no time limit for the completion of the questionnaire but subjects were instructed not to ponder too long over any question. All the subjects were instructed to respond the questionnaire independently. As soon as a group of players completed the questionnaire, the questionnaires were collected from them. It was verified that no response was left without being answered.
Results and Discussion Descriptive statistics were calculated for each of the five subscales of the SIQ, and the means and standard deviations are presented in Table - 1 for the entire sample by gender and game categories. An ANOVA revealed that athletes used significantly different amounts of the imagery functions: F (4, 1605) = 13.118. Scheffe’s test of post-hoc analysis revealed that athletes reported using motivational specific imagery the most (M=5.36), followed by motivational general master imagery (M=5.35), cognitive general imagery (M=5.06), cognitive specific imagery (M=4.96), & motivational general arousal imagery (M=4.81).
Table-1 Descriptive Statistics for Mean Factor Scores for Imagery Functions of Inter-University
Level Athletes of Different Game and Sports
S.N Imagery Function Sex Total Sample Team Games Individual Sports Combative
M. S.D. M. S.D. M. S.D. M. S.D. 1. Motivational
Specific Male Female
5.34 5.40
1.33 1.30
5.43 5.21
1.31 1.41
4.73 5.52
1.41 1.23
6.01 5.73
0.83 1.08
2. Motivational General-Arousal
Male Female
4.79 4.84
1.16 1.05
4.74 4.67
1.12 1.10
4.45 4.85
1.21 1.04
5.33 5.33
0.96 0.78
3. Cognitive Specific
Male Female
5.00 4.89
1.19 1.20
4.97 4.97
1.14 1.24
4.62 4.78
1.37 1.26
5.60 4.88
0.71 1.02
4. Cognitive General
Male Female
5.11 4.95
1.07 1.14
5.15 4.85
1.10 1.25
4.76 5.03
1.13 1.08
5.52 5.11
0.71 0.89
5. Motivational General-Mastery
Male Female
5.37 5.30
1.26 1.29
5.40 5.19
1.22 1.30
4.92 5.44
1.44 1.28
5.94 5.38
0.70 1.32
In order to determine whether gender influences athlete's use of imagery, a multivariate analysis of variance (MANOVA) was conducted. Gender served as the independent variable, & the five subscales of the SIQ served as dependent variables. Pillai’s trace criterion was adopted, which is considered to be robust to violations of
assumptions of homogeneity of the variance co-variance matrices. An insignificant multivariate effect was found for gender. (Pillai's trace=. 022, f (5,314) =2.25).
In order to determine whether game categories influences athletes use of imagery, a MANOVA was

29 International Journal of Physical Education, Sports and Yogic Sciences Vol. 1 No. 1 (November, 2011): 27-29
conducted. Game categories served as the independent variable (i.e., team games, individual sports & combative sports), & the five subscales of the SIQ served as dependent variables. Pillai’s trace criterion was once again used and significant multivariate effect was observed for game categories. (Pillai’s trace=. 092, f (10,630) =1.77). The Scheffe's post hoc test revealed that the athletes of combative sports & team games use more motivational specific imagery regardless of the function, & athletes of individual sports used more motivational general mastery then the other imagery functions.
The main purpose of the study was to examine the functions of imagery used by inter-university level athletes of different games and sports. The result of the study indicated that inter-university level athletes of different games and sports use all five functions of imagery. Consistent with previous research examining imagery use, (Cumming & Hall, 2002; Hall et. al., 1998; Vodocz et. al., 1997) the inter-university level athletes of different games and sports, reported using motivational specific imagery most, followed by motivational general-mastery. These results suggest, therefore that athletes are using imagery predominantly for their specific goals and outcomes for their respective games and sports, for staying focused and working through problems.
When male and female athletes of different games and sports were examined separately on use of imagery functions it was found that male athletes use motivational general-mastery imagery most and female athletes use motivational specific imagery most than the other imagery functions. These results suggest that male athletes of different games and sports are using motivational general-mastery imagery for staying focused and working through problems and female athletes of different games and sports are using motivational specific imagery for their specific goals and outcomes.
To date only minor gender differences in imagery use have been reported in the literature for example, Barr and Hall (1992) found that female rowers practice imagery more regularly than men did. Ungerleiler and Golding (1991) found that males and females were equally likely to reports using imagery in their training routine most studies, however, report differences that are so minor that gender is not included as variable in any of the analysis (e.g., Munroe et. al., 1998; Salmonet al., 1994). Furthermore, a review of the imagery literature provides no evidence that imagery is more effective for one gender than the other (Hall, 2001).
In the present study, an insignificant gender difference was found for use of different imagery functions.
The second purpose of this study was to examine whether game categories in which the athletes participate
i.e. individual sports, team games and combative sports, would influence imagery use by athletes. One of the most consistent finding in the imagery literature has been that the individual sports like roller skating, slalom canoeing and gymnastics require less cognitive general imagery than particular team games such as football, basketball, or netball (Carron & Chelladurai, 1981). But in the present study inter-university level athletes of combative sports use more motivational specific imagery; of team games participants also used more motivational specific imagery and athletes of individual sports used more motivational general-mastery imagery than the other imagery functions. Inter-university level athletes of combative sports used all imagery functions more than the athletes of other game categories. The findings of the study highlight a number of areas that future research should address. In relation to athletes use of imagery, research needs to further inside may be found as to why athletes use imagery & where, when, & what athletes are imaging during different periods. In future research would be undertaken to understand how imagery use changes over the course and different phases of training & competition. REFERENCES:
Barr, Kathryn, and Hall, C. “The Use of Imagery by Rowers” International Journal of Sport Psychology, 23 (1992): 243 -261. Callow, N. and Hardy, L. “Types of Imagery Associated With Sport Confidence in Netball Players of Varying Skill Levels” Journal of Applied Sport Psychology 13(2001):1-17. Carron, A. V. and Chelladurai, P. “Cohesiveness as a Factor in Sport Performance” International Review of Sport Sociology 12(1981):49-60. Cumming, J. and Hall, C. “Deliberate Imagery Practice: Examining the Development of Imagery Skills in Competitive Athletes” Journal of Sports Sciences 20(2002):137-145. Feltz, D. J. and Landers, D. M. “The Effects of Mental Practice on Motor Skill Learning and Performance: Meta-Analysis” Journal of Sport Psychology 5(1983):25-57. Hall, C. R., Mack, D., Paivio, A. and Hausenblas, H. A. “Imagery Use by Athletes: Development of the Sport Imagery Questionnaire” International Journal of Sport Psychology 29(1998):73-89. Hall, C. “Imagery in Sport and Exercise in R. Singer, H. Hausenblas and C. Janelle (eds.) Hand Book of Sports Psychology New York: John Wiley & Sons (2001).
Authors’ affiliations: Neha Khare Major Dhyan Chand Institute of Physical Education Budelkhand Vishwavidyalya, Jhansi (U. P.)

30 International Journal of Physical Education, Sports and Yogic Sciences Vol. 1 No. 1 (November, 2011): 30-32
Construction of Jump Shot Test in Handball S. K. YADAV, SUNIL DUDHALE and BHAWANA YADAV
See end of the article for authors’ affiliations
Correspondence to: S. K. Yadav School of Physical Education Devi Ahilya University Indore (M. P.)
ABSTRACT The purpose of the study was to construct Jump Shot Test in Handball. One hundred male handball players from South-West Zone and North-East Zone Universities (four University teams from each Zone) who qualified for the All India Inter Zonal Varsity Handball Tournament held at Banaras Hindu University, Varanasi, Uttar Pradesh from 25th to 29th October 2002, were selected to serve as subjects for this study. The criterion measure was the average of the playing ability scores of the handball players assigned independently by three handball experts. It was concluded that the newly developed Jump Shot Test in handball meet the criterion of scientific authenticity i.e. the test was reliable, objective and valid.
Key words: Criterion, Reliability, Objectivity, Validity, Authenticity.
Handball is a rapid game of continuous action, requiring fitness and endurance as well as flexibility and balance. Good passing and catching skills enable a team to keep possession of the ball and thus go into the attack in order to score. Teams scores goals by getting the ball into their opponent’s goal.
A high technical skill level with the support of solid physical fitness base will often bring success for a team even if its strategies are weak. The key to success in handball, as in a great many sports, lies in good fundamental skills. Since very limited research in the area of skills in handball has been done, the researcher felt the need to take up this study.
The purpose of the study was to construct a Jump shot test in handball.
Methodology:
All the one hundred male handball players from South-West Zone and North-East Zone Universities (four University teams from each Zone) who qualified for the All India Inter Zonal Varsity Handball Tournament held at Banaras Hindu University, Varanasi, and Uttar Pradesh from 25th to 29th October 2002 were selected to serve as subjects for this study. The age of the subjects ranged between 17 to 25 years.
The criterion measure was the average of the playing ability scores of the handball players assigned independently by three handball experts.
Jump shot test was developed through objective methods. The data for this study was collected through administering the jump shot test on one hundred handball players who participated in the All India Inter-Zonal Inter-Varsity Handball Tournament.
The coaches and managers of the teams were consulted at personal level to conduct the test on handball players, and a rapport was established with them for the testing programme. All those coaches and managers were made fully conversant with the study. Tentative times were finalized with them. The researcher approached each player after giving proper and timely information before the test was conducted.
Before administering the tests, the subjects were briefed about the purpose of the study and details of the test were explained to them. The subjects were given a demonstration of the skill test by a trained helper. They were also given sufficient number of trials to enable them to become absolutely familiar with the test. To ensure uniform testing conditions, the subjects were tested in the morning and evening sessions after warming-up during practice sessions. The duration of test administration was set in a manner so that fatigue may not occur. Though no special technique was used to motivate the subjects, the subjects were very co-operative throughout the test.
The purpose of the test was to measure the ability of a player to shoot the hand all in goal using jump shot with accuracy. Test may be used with male college handball players.
A specific shooting zone was marked on the free throw line to provide the players to attempt the jump shot on the goal. The zone marking was in 60 degree angle area of the goal post. Goal post was also marked with the help of ropes. A rope was tied on both the uprights below the cross bar at 45 cm from the inner edge of crossbar. Two ropes were tied on the crossbar inside both the uprights at 45 cm from inner edge of both the uprights. Two more small pieces of ropes were tied with
Yadav, S. K.; Dudhale, Sunil and Yadav, Bhawana (2011) Construction of Jump Shot Test in Handball International Journal of Physical Education, Sports and Yogic Sciences 1(1): 30-32.

31 S. K. YADAV, SUNIL DUDHALE and BHAWANA YADAV
the uprights 45cm above the floor. A dotted line 45 cm away and in front of both the uprights and parallel to it was marked on the floor in the goal area. The player with a ball in hand stood in the shooting zone and on blowing the whistle the player moved quickly towards the free throw line and attempted the jump shot on the goal. Five attempts were given for each trial and three trials were given.
The points values allotted were 8 in all corner zones, 6 in remaining zone field up by ropes and 2 for rest of the zone in the goal post. 2 additional points for the zone dotted marked on the floor in front of goal post, determined on the basis of successful shots hitting crosses over the respective areas. However, no point was awarded when a ball went outside the goal post. The
score was the total points made in five attempts in each trails and the best of three trials was the score of the player. A maximum score of 50 was possible on this test.
Results and Discussion Test-retest method was used to establish the reliability of the jump shot test. All the players were given three trials administered by the same tester and inter-class correlation coefficient by analysis of variance method was employed to compute the reliability of the tests. Analysis of variance for reliability estimates and the obtained reliability coefficient (R) value for the Jump shot test has been presented in Table-1.
TABLE - 1 ANALYSIS OF VARIANCE FOR RELIABILITY ESTIMATE
OF JUMP SHOT TEST
Source of Variance
Sum of Squares
Degree of Freedom
Mean Squares
F - Ratio tab F Inter - Class Correlation (R)
Subjects
Trials
Interaction
18847.19
14.64
1022.69
99
2
198
190.38
7.32
5.19
1.417*
3.04
0.977**
Total 19884.52 299
*Insignificant at 0.05 level tab F 0.05 (198, 2) = 3.04 ** Significant at 0.05 level R 0 .05 (98) = 0.195 N = 100
The data obtained as a result of the administration of jump shot test and judged by three different handball experts who recorded the performance of the players independently was correlated in order to obtain
objectivity coefficient. Analysis of variance for objectivity estimate and the objectivity coefficient (R) value for the jump shot test has been presented in Table - 2.
TABLE - 2 ANALYSIS OF VARIANCE FOR OBJECTIVITY ESTIMATE
OF JUMP SHOT TEST
Source of Variance
Sum of Squares
Degree of Freedom
Mean Squares
F - Ratio tab F Inter - Class Correlation (R)
Subjects
Trials
Interaction
18259.88
14.59
988.08
99
2
198
184.44
7.29
4.99
1.462*
3.04
0.979**
Total 19262.55 299
*Insignificant at 0.05 level tab F 0.05 (198, 2) = 3.04 ** Significant at 0.05 level R 0 .05 (98) = 0.195 N = 100
Correlation coefficient of jump shot test and the criterion variable has been presented in Table - 3.

32
International Journal of Physical Education, Sports and Yogic Sciences Vol. 1 No. 1 (November, 2011): 30-32
TABLE – 3 RELATIONSHIP OF JUMP SHOT TEST TO THE CRITERION
(PLAYING ABILITY SCORES)
S. No. Test Coefficient of Correlation
1. Jump shot Test 0.773*
* Significant at 0.05 level r 0 .05 (98) = 0.195 N = 100
Discussion of Findings: Analysis of data on jump shot test indicated that the constructed test in handball was found to be reliable. The findings of the study further reveal that the jump shot test in handball was found to be objective. The significant values showed that the directions for administration of the test were specific and clear for performance as well as evaluation.
Conclusions:
Within the limitations of the present study, the following conclusions were drawn: - 1. The jump shot test showed highly significant
relationship with handball playing ability. 2. The newly developed jump shot test in handball
meet the criterion of scientific authenticity i.e. the test was reliable, objective and valid.
References: Bosco, James S. and Gustafson, William F.
Measurement and Evaluation in Physical
Education, Fitness and Sports Eagle wood Cliffs, N. J.: Prentice Hall, Inc., 1983.
Matthews, Donald K. Measurement in Physical Education 5th ed. Philadelphia: W.B Saunders Company, 1988.
Fleishman, Edwin A. “Abilities and Motor Skill”, The Structure and Measurement of Physical Fitness Englewood cliffs: N. J.: Prentice Hall, Inc., 1965.
Neil, Graham Modern Team Handball – Beginner to Expert Montreal, Canada: McGill University, 1978.
Authors’ affiliations: Sunil Dudhale Department of Physical Education and Sports Devi Ahilya University Indore (M. P.)
Bhawana Yadav Sendhwa College of Physical Education Post - Chatli, District - Badwani (M.P.)

33 International Journal of Physical Education, Sports and Yogic Sciences Vol. 1 No. 1 (November, 2011) : 33-35
Hormonal (Estrogen) Regulation in Women and Factors Related to Their Visiting Beauty Parlours ARTI RUPANI
See end of the article for authors’ affiliations
Correspondence to: ARTI RUPANI D. D. Dalmia College of Physical Education, Jaipur
ABSTRACT Beautification is a socio-psychological drive and for this to develop Aesthetic scene, now a day’s beauty-parlour, is one for the essential desk. To analyze the same and to know the hormonal regulation on beautification, survey was conducted among the women dwelling in a C category city of North-Eastern part of Rajasthan. The interesting observation claims the regulation of hormone-estrogen in beautification and it’s after effect, the rise of self-beautifying tendency found in unmarried women with the rise of estrogen concentration and incase of married women just opposite with some exception. The estrogen, a strange hormone has regulation on it and may inhibit the skin disease, resulting from beauty parlour due to the use of different cosmetics and chemicals.
Key words: Hormone, Estrogen, Aesthetic, Aggression.
Gender is the sense of being male or female. Sex typically refers to sexual anatomy and sexual behavior, while gender refers to the perception of maleness or femaleness related to our membership in a given society. The items what represent adjectives to apply to woman may be affected, affectionate, attractive, charming, curious, dependent, dreamy, emotional, fearful, feminine, gentle, mild, sensitive, sentimental, sexy, softhearted, submissive, superstitious are the bearer of culture, heritage, sense of living, attitude, identity of a particular, caste, creed, race and nation. In finding one self in asocial world, women are generally approaching questions-“who am I “? “How do I fit into the world”? “What is life all about”? Questions such as these assume particular significance during the teenage years, as adolescents; even in adulthood seek to find their place in the broader social world. Thus beautifying self, as if, the basic survival instinct for each and every woman stars from very early age that they want to be attractive in this beautiful world. Since the ancient age, the beautification was being a subject of interest & glory from homely atmosphere till this scientific era to market i.e. the modernized beauty parlour of present age. Before the beautification was describing the use of only the herbal products prepared at home, but now-a-days the trade centers, company are launching various type of herbal product and semi synthetic- synthetic products. The cheerful psychological development starts with the physical development and ends generally in the last phase of life or after the late adulthood. Therefore the beautification i.e. going to beauty parlour is generally found to be started from adolescence and continues till the 2nd phase of late adulthood. Beautification obviously develops personality towards various regards to show/ feel/ maintain/ overcome/ proof/approach social potency
(61%), traditionalism (60%), stress reaction (55%), absorption (55%), alienation (55%), well being (54%), harm avoidance (51%), aggression (48%), achievement (46%), control (43%), and social closeness (33%). In search of identity, based on psychological development, the Erickson’s stages of life may be described from adolescence as – adolescence (12-18 years), early adulthood (18-30 years), middle adulthood (30-45 years) and late adulthood (45-60 years), (Feldman, 2000).
Table -1: Estrogen excreted in urine in ug/24 hour vs. Age (years)
Age Concentration Age Concentration 12 25.0 37 315.0 13 349.0 38 313.1 14 352.2 39 311.2 15 359.0 40 307.5 16 366.0 41 290.0 17 370.5 42 250.2 18 379.0 43 231.1 19 379.35 44 210.0 20 383.43 45 200.25 21 387.5 46 170.25 22 388.87 47 139.50 23 390.25 48 122.00 24 395.65 49 100.0 25 390.0 50 68.0 26 384.35 51 52.0 27 380.2 52 42.25 28 377.7 53 37.75 29 367.7 54 30.00 30 363.6 55 26.25
Rupani, Arti (2011) Hormonal (Estrogen) Regulation in Women and Factors Related to Their Visiting Beauty Parlours International Journal of Physical Education, Sports and Yogic Sciences 1(1): 33-35.

34 ARTI RUPANI
31 359.5 56 22.25 32 352.5 57 20.00 33 335.0 58 18.00 34 331.25 59 17.7 35 327.5 60 17.2 36 321.25
In this compilation, the age groups were marked depending on the concentration of Estrogen secretion throughout female sexual life. Interpreting a graphical expression (Guyton, 1986) (as tabulated in table -1) of estrogen excreted in urine ug/24 hours vs. Age (years), the age were divides as (a) 13-19 (under adolescence period; where a rising estrogen constriction reaches to almost a constant limit and then further rising follows), (b) 20-24 (constriction reaches to a maximum limit), (c) 25-32 intermediate decaling phase in same ratio), (d) 33-41 (Rapid fall), (e) 42-47 (menopause; drastic fall) and (f) 48-58 (Old age, abrupt change, where after 55 the concentration as like as puberty). Estrogen, produced by ovaries, is in fact a strange hormone. It has two contradictory facets to its role in women’s body. On one hand it is a wonderful molecule, crucial for programming for a women’s body for childbirth. It prepares the womb nourishing the fetus and promotes the glands in breast to produce milk. Estrogen’s beneficial role does not end here. It influences regions in the brain whose function is to maintain stable body temperature and avoid hot flashes. Another vital role of estrogen is to regulate the production of cholesterol by the liver, thus avoiding the deposition of fatty cholesterol layer in the inner lining of blood vessels. Hence, estrogen safeguards the hurt and protects women from cardiovascular diseases. Estrogen even preserves bones by maintaining its required density and estrogen has frightening negative effects. It promotes both breast cancer and endometrial cancer. At menopause, a women’ risk for getting these cancers increases a by now it is about five decades that she has been exposed to her own estrogens. The cellular changes, which occur in these cancers, are however not initiated by estrogen. This hormone only stimulates the multiplication of cells, which have already taken to the path of uncontrolled growth (Chawla, 1999). The female attractiveness is generally due to their large eyes, small nose full lips, small chin, delicate jaw, firm symmetrical breasts, and smooth unblemished skin and waist hip ratio of 0.7 (De,1999). Modernized beauty parlour is generally well equipped to make attractive a female as her desire by applying various items. Women are very much conscious about their beauty and attractiveness and more over they are conscious about the various item of beauty parlour and their application.
Consciousness is nothing more than an evanescent by product of mundane, wholly psychical processes much as a rainbow is the product of interplay of light and
raindrops. Input from the senses certainly plays a part, as do chemicals within the brain and body whose ebb and flow we experience as feelings and emotions. Consciousness is what marks us human. It gives us the capacity for astonishing scientific and artistic creation. Most of the hundred thousand million nerve cells each of us processes are the cortex and deep nuclei of electrical impulses from our sense organs conveying data about events in the outside world. The information is processed by columns of cells in the cortex and is then transferred to the adjacent association areas so that information from other senses, from memory and other areas of the brain, can be linked together and analyzed. It is the combination of information from these different sources and their elaboration by the cortex, which produces the foundation of consciousness (Pandiya, 1997). Now the question arises, how much the women are aware of health in beautification? Chemical from cosmetic, adhesives and plastics can disrupt hormone function and cause birth defects. Us scientists say that chemical present in cosmetics e.g. phthalates in finger nail polish & other, Found in experiments on animal studies, may disrupt normal hormone function and benzyl (news, 2000). Other chemicals in cosmetics are generally available colorants, selenium sulfide, ammonia, hydrogen peroxide, lade, cadmium, chromium, polyvinyl- pyrrolidine, mercury, formaldehyde etc. may cause skin inflammation, breathing problem, restlessness, nephritis, anemia, blood cancer, breast cancer, brittleness of bone, cell destruction, tumor etc. (Sengupta, 2001). In this compilation, hormone regulation especially of estrogen was taken into account to discuss the tendency of women to beauty parlour along with the related matters and correlation with the skin diseases result from parlour. The main objective of the paper is to study the relationship between hormonal secretion and interest in beauty parlour visiting’s. The Second objective was whether the factors like marriage, age, job etc. have any bearing on their interest in beauty parlours. With the above objectives, the following hypotheses were framed: 1. Women groups with different estrogen concentration
do not differ in their interest to beauty parlour with regard to reasons( causes) for visits frequency of visits special occasions items of beauty parlour and satisfaction estrogen, ( constriction groups : 307.5 to 30095.65; 290.0 to 200.25; 170.25 to 100.0; 68.0 to 17.2.
2. Women groups with different age (such has 13-24 years, 25-41 years, 42-58 years) do not differ in their interest to beauty parlour with regard to different regions (causes).

35 International Journal of Physical Education, Sports and Yogic Sciences Vol. 1 No. 1 (November, 2011) : 33-35
3. women groups with different ages based upon estrogen construction (13-40 yrs, 41-45yrs,46-49yrs, 50-60yrs) do not differ in their interest to beauty parlour regard to different reasons (causes).
4. women with job and women home makers (irrespective of their age, marital status, employment status act etc). do not differ in their interest to beauty parlour regard to different reasons (causes).
5. married and unmarried women do not differ in their interest to beauty parlour regard to different reasons (causes).(irrespective of their age, employment etc.).
METHODOLOGY Analysis of women’s interest to beauty parlour was carried out through an extensive survey conducted among the women dwelling in a ’c - category city, Jaipur capital town of state Rajasthan. The survey was carried out randomly for three months in the year 2009 by door-to-door mission, daily from morning 9.00 a.m. to till 4.00 p.m. by engaging volunteers. The plan of work and procedure was formulated accordingly. The survey was conducted through an eventually prepared printed format related to the predicted factors considered for observation. In this regard we are reporting the same as per the result obtained from the survey discussed.
RESULTS AND DISCUSSION From table-1,the average value of estrogen exacted in urine in ug/24 hour may be presented as 365.01 for 13-19years,339.14for 20-24, 371.94 for 25-32,316 .87 for 33-41, 200.22 for 42-47 and 48.95 for 48-58 years. Table-2 describes the women’s interest to beauty parlour and subsequent events. Total numbers of sample were 718 and accordingly category wise distributed and was presented. Basically maximum were found non- vegetarian and taking rice as staple food. Maximum pointed out the cause for going parlour as they were supporting modern culture, then they felt to beautiful them i. e. self designing , and a significant number used to visit parlour for everybody felt that to support modern culture, as if it is a fashion.48-58years aged maximum married women interestingly indicated that for other they were visiting parlour. It is the stage of abrupt change in concentration of estrogen i.e. after menopause, when the beauty of youth starts to diminish, the past experience strikes every moment, a time of achieving the estrogen concentration like puberty and thus the sensation towards beautification may be accelerated by their husband or anybody. To beautify self is a basic instinct to every women and the rise of this tendency found in unmarried women with the rise of estrogen concentration and in case of married women just opposite, except the age groups 33-41&25-32. Skin sensitivity is varied one to another. Then also it was observed that married women were experienced less skin disease recorded in
the age group 25-32, 42-47 and 48-58.but, in the case of unmarried woman it has been found that the increase quantity of skin disease resulted in gradual fall of estrogen concentration. It can be marked that estrogen inhibits skin disease i.e. estrogen protects skin or resists from various undesirable reactions.
Married women generally are experiencing different type of works like cooking, sometimes marketing, looking after children etc. by which their skin gradually achieving resistance towards various type of reactions. Beautification in beauty parlour depends on economical status also. It was observed that women having no job were more interested to go beauty parlour than working women that might be to pass idle time or any personal causes, which might be supported by family members. Maximum preferred to visit parlour in one month interval. The demands of facial item in beauty parlour were found most. Face is the index of mind. Therefore, women might prefer facial along with other items. Hair cut is a fashion in this modern era. It has also been noticed that hair fall is a common complain and to manage this problem, the haircut may be one of the ways. Maximum percentage was found to response affirmative in own satisfaction, expect the married women of age group 48-58, in this last phase of life and as if they were following the estrogen concentration is also gradually declined.
Beauty parlour, now a days, is one of the essential desks of accelerating the beauty of women. The desire of beautification is a result of self-consciousness, which may be regulated by hormonal (estrogen) activity. The skin disease may be avoided by using herbal products or by avoiding the synthetic chemicals, and it has also been observed that estrogen plays a role to protect skin. Herbal products are constituents and thus provide skin very less or no side effects.
REFRENCES Chawla, P. “Cheer up Women” Science Reporter 1999, 36: 62. Samanta, A. and Begam, F. A. “Human sex: An overview” Health Action 1999 12,45. Feldman, R. S. Understanding Psychology 4th edition, New Delhi: Tata McGraw-hill, 2000. Guyton, A. C. Text Book of Medical Physiology 7th edition Philadelphia: W.B. Saunders Company, 1986. News “Sweet Smell of Death” Down to Earth 2000, 9: 51. Pandiya, S. K. Human Behavior 1st edition, New Delhi: National Book Trust, 1997. Sengupta, K. K. “Nirapatta Na Saundarya” (in Bengali version i.e. Safety or Beauty) Dainik Sambad 2001, 35:3.

36 International Journal of Physical Education, Sports and Yogic Sciences Vol. 1 No. 1 (November, 2011): 36-40
Relationship between Hardiness and Psychological Stress Response SANJAY SINGH CHAUHAN
See end of the article for authors’ affiliations
Correspondence to: Sanjay Singh Chauhan Shri Chitragupta PG College Department of Physical Education Naglajula Mainpuri - 205001 (U.P.)
ABSTRACT Keeping psychological health under stressful situation is important for effective performance. Psychological hardiness (a personality trait consists of commitment, control and challenge) is one of the indicator of psychological health based on existential personality theory. This study confirms the relationship between hardiness at time 1 and psychological stress response (PSRS) at time 2. Total score and sub scores of PSRS were compared by 8 categories of hardiness (created by median split of commitment, control and challenge). Result indicated that (1) Three components of hardiness have adequate reliability and have moderate inter-correlation, (2) Total score and sub scores of PSRS were negatively correlated with three components of hardiness, (3) Some sub scores and total score of PSRS were highest in category that all components of hardiness are in high, and lowest in category that all components of hardiness are in low.
Key words: Psychological stress response, Psychological hardiness, Commitment.
It is necessary to keep psychological health for performance as effective self-expression. Kobayashi defined neurosis patient group as "performance defective group". They adopted psychological health as a standard of performance. However, psychological health will have effect to performance even in non-clinical people or people who doesn't need psychotherapy.
For example, psychological stress has an effect to psychological health. Psychological stress is a process occurred in relationship between person and environment that is appraised by the person as exceeding his/her resources. Person will be confused by such psychological stress; he/she can't act as usual. Sometimes it has some effects to physical health.
However, not all people experiencing psychological stress confused or lose their health. Many studies indicate that stress inducing events (stressor) explain only 9% for variance of health status (Kosaka & Yoshida, 1992). In 1980's, many researchers looked for factors that mediate between psychological stress and health status, for example, social support, self-esteem, personality characteristics.
Hardiness is considered as the measure of one's tendency to make relationship to oneself and one's outside world. It is not a mere rigidness or stress "endurance”, but a power to cultivate one's way under difficult conditions and go through stressful events. It is
not like a reckless attack, but an ability to understand conditions around one, an ability to self-decision.
One need performance in daily life, when he/she have to communicate something important. Especially, it will be the case on the verge of changing one's value, social status, income, or one's total life. Such conditions are considered as stressful. It is necessary to have stress-overcoming personality trait for effective performance. In this study, performance is defined as "Psychological response on stressful situations”. The purpose of this study is to investigate the effect of hardiness to psychological stress response, confirming the hypotheses of "People high in hardiness express less psychological response on experiencing stressful situation." Methodology: 224 college students in two universities around Rajasthan area were randomly selected as subjects. Data were collected twice to fulfill one of the conditions for confirming causal relationship Few weeks before examination at the first semester were set as Time 1 and the days around three months after Time 1 was set as Time 2. At time 1, questionnaire of hardiness was distributed to all subjects. Questionnaire of psychological stress response was distributed at time 2. Details of each scale are explained below.
1. Hardiness Many scales to measure hardiness were established (Kosaka, 1992). However, early hardiness scales have
Chauhan, Sanjay Singh (2011) Relationship between Hardiness and Psychological Stress Response International Journal of Physical Education, Sports and Yogic Sciences 1(1): 36-40.

37 SANJAY SINGH CHAUHAN
some problems; changing hardiness sub scores to z-score, challenge scale didn't predict health.
Kobasa (1986) established 50-items hardiness scale (Personal Views Survey: PVS) and Bartone et al (1989) established 45-items hardiness scale (Dispositional Resilience Scale: DRS) to solve these problems. Though Funk (1992) recommends to use DRS to measure hardiness, DRS (faithfully translated) indicated moderate reliability (Cronbach's alpha) in total score (0.75) and commitment (0.70), and remarkably low in control (0.52) and challenge (0.52) for 212 college students (Kosaka, 1994).
In this study, PVS was translated in Hindi. This scale consists of 16 items for commitment, 17 items for both control and challenge. Scores of 39 items are reversed. Ratings of each item are 0 (not at all) to 3 (definitely yes) in 4 escalations. Scores of each component are calculated, dividing total low score by each high score (commitment: 48, control and challenge: 51) and multiply by 100. Each score indicates positive value of hardiness.
2. Psychological stress response
So many kinds of variables were adopted for an index of stress response. However, emotional response as anxiety or depression is selected by each researcher, supposed to represent psychological stress, and such response doesn't always a response in experiencing stressors or just a part of psychological stress.
Psychological Stress Response Scale (PSRS: Niina et al., 1990) is adopted for this study. PSRS is established for measure all-round response in experiencing stressors. This 53-items scale aimed to measure two aspects of response, emotional response and cognitive
behavioral response. Emotional response consists of four factors (depressive mood, anxiety, displeasure, Anger) and cognitive behavioral response consists of nine factors (losing confidence, distrust, despair, worry, hard to consider, impractical wish, inactiveness, withdrawal, and impatience). Ratings of each item are 0(not at all) to 3(definitely yes) in 4 escalations and total score indicates positive value of psychological stress response.
Results and Discussion
There were no significant differences in each variable between colleges and genders. Table 1 indicates basic statistics and correlation of commitment, control, challenge, and age. Reliability of each component of hardiness was in high level and inner-correlation was moderately high.
According to preceding studies, discrimination of high and low groups of hardiness should be done by combination of high and low discriminations in commitment, control, and challenge.
In this study, subjects were discriminated in high and low groups by using median split as for three components of hardiness and they were categorized into eight groups; all components in high group, commitment and control are in high group, commitment and challenge are in high group, control and challenge are in high group, commitment is in high group, control is in high group, challenge is in high group, all components are in low group. An analysis of variance was performed with this category of hardiness as the independent variable and sub scores and total score of PSRS as the dependent variables. The results of ANOVA with related statistics are indicated in Table 2.
Table 1 Means, standard deviations, medians, reliabilities, and correlations
of the three components of hardiness and age (N=164)
Cronbach’s (Correlations) M SD Median alpha commitment control challenge
commitment 70.44 8.85 70.83 .95 - - -
control 63.83 7.89 64.71 .94 .60** - -
challenge 63.15 10.34 62.75 .91 .44** .35** -
age 20.27 .99 - - .12 .13 .16*
*p<.05, **p<.01

38 International Journal of Physical Education, Sports and Yogic Sciences Vol. 1 No. 1 (November, 2011): 36-40
Table 2 Means, standard deviations, medians, reliabilities of subscales of PSRS,
correlation with hardiness components, and results of ANOVA by 8 categories of hardiness components (N=164)
Cronbach’s (Correlation with hardiness) ANOVA PSRS subscale M SD alpha commitment control challenge df F
(Emotive response)
Depressive mood
5.36 5.69 .92 -.30** -.28** -.24** 162 2.29*
Anxiety 4.91 5.17 .89 -.21** -.33** -.14 162 1.93
Displeasure 4.16 3.81 .85 -.22** -.27** -.16* 162 1.96
Anger 2.31 2.98 .82 -.18* -.22** -.20* 162 2.01
Total score 16.74 15.52 .95 -.27** -.32** -.21** 162 2.49*
(Cognitive behavioral response)
Losing confidence
1.82 2.22 .77 -.38** -.29** -.25** 162 2.75*
Distrust 1.29 1.79 .67 -.35** -.26** -.20** 162 1.51
Despair .98 1.59 .74 -.38** -.28** -.15 162 1.51
Worry 2.22 2.35 .76 -.23** -.26** -.19** 162 1.72
Hard to consider 1.74 2.30 .84 -.33** -.26** -.25** 162 3.10**
Impractical wish 2.76 2.45 .72 -.22** -.24** -.28** 162 1.74
Inactiveness 1.63 2.16 .78 -.42** -.29** -.15 162 3.10**
Withdrawal 1.30 1.88 .81 -.33** -.31** -.24** 162 3.41**
Impatience 1.04 1.56 .69 -.18* -.22** -.11 162 .98
Total score 14.78 14.59 .95 -.39** -.34** -.26** 162 3.10**
PSRS total score 31.52 29.05 .97 -.34** -.34** -.24** 162 2.92**
Most coefficients of reliability of sub scores and total scores of PSRS are above .80, reached moderate internal consistency. The correlations with three components of hardiness were all negative and most of them were statistically significant. As for the result of ANOVA, category of hardiness was statistically significant with depressive mood, total score of emotional response, losing confidence, hard to
consider, inactiveness, withdrawal, total score of cognitive behavioral response, and PSRS total score. Table 3 shows the results of HSD test about these variables. All PSRS scores in Table 3 indicated 5 percent of significance of difference between means of "All in high group" and "All in low group". In most of them, "All in high group" got lowest score of stress response and "All in low group" got highest score.

39 Relationship between Hardiness and Psychological Stress Response
Table 3 Means of PSRS total and sub scores by 8 categories of hardiness
(Emotive response) (Cognitive behavioral response) PSRS
Categories(High in hardiness)
N Depressive mood
Total score
Losing confidence
Hard to consider
Inactiveness
Withdrawal
Total score
Total score
(1) All in high group
35 3.11 10.94 .94 1.14 .69 .49 8.43 19.37
(2)Commitment & Control
18 5.79 19.05 1.68 1.26 1.53 1.37 13.42 21.11
(3)Commitment & Challenge
19 5.71 18.14 2.43 2.29 2.57 1.71 18.86 32.47
(4) Control & Challenge
7 4.12 11.35 1.24 1.00 .82 .88 10.18 37.0
(5) Commitment 17 3.71 11.71 1.29 .79 1.79 .64 12.36 38.94 (6) Control 10 6.24 21.82 1.88 2.06 1.76 1.35 17.12 28.90 (7) Challenge 14 5.50 15.70 2.0 1.20 1.30 .90 13.20 24.07 (8) All in low group
44 7.66 22.32 2.86 2.91 2.61 2.27 21.84 44.25
P<.05 combinations in Tukey’s HSD test
(1)-(8)
(1)-(8) (1)-(8)
(1)-(8) (1)-(8) (1)-(8) (1)-(8) (1)-(8)
(1)-(8)
Discussion of Findings:
According to Table 2, the higher three components of hardiness (commitment, control, and challenge) are, the lower sub scores and total score of PSRS are. As for total score of PSRS, when commitment, control, and challenge are all in high group, effects of stressors are weakest.
When all are in low group, effects of stressors are strongest. Hence, the relation between hardiness and stress response were clarified in the context of original hardiness theory by Kobasa (1979), and hypothesis of this study was almost proved. All hardiness studies itself confirm the validity of hardiness (Funk, 1992) and this result will be beneficial for further hardiness research. Relationship between hardiness and some of the sub scores of PSRS were not clarified. Most of the reasons are that the reliability was low and the numbers of items were few. These result indicated possibility that hardiness has influence to individual's effective performance or self-expressions.
However, some problems that are needed to discuss in this study are listed below.
(1) Measuring stressors
There were two major ways to measure stressor, one is Social Readjustment Rating Scale (Holmes & Rahe,1967), that measure life change in experiencing major life events, and the other is Daily Hassles(Kanner et al.,1981), that measure cognitive appraisal about
troublesome in daily life. However, it is difficult to select items of events that are suitable to each subject. According to Ganellen & Blaney (1984), evaluative ratings of events and memory for distant events might be influenced by hardiness. In this study, questionnaire was distributed just before examination at the first semester and stressors were not measured, because the examination was seemed to be a common stressor for all subjects. Influences of stressor except the examination need to be controlled in further studies.
(2) Characteristics of subjects
Relatively comparing, college students might not be exposed to psychological stress than office workers. Though psychological stress is subjective and it is not clear that there are differences in the ways of response in stressful situation, It is considered that office workers are in situations that require more performances than college students are. Especially, further research on members of society is needed to clarify more about the relationship between hardiness and performance.
(3) Relations with actual performance
Actually expressed performances were not measured in this study. One of the ways to make clear the relationship between hardiness and performance may be to study differences of actual performance between hardy and non-hardy in a specific situation that may require performance.

40 International Journal of Physical Education, Sports and Yogic Sciences Vol. 1 No. 1 (November, 2011): 36-40
At present, the standard to measure performance is not established yet. An attempt to measure performance is "AS Performance Sheet", established by Sato (1995). This is in a style of self-report and it does not always reflect subjects' performance when they have distorted cognition. It is necessary to establish subjective perspective of performance for studying performance in any field.
(4) Personality disorders and performance
This study adopted a self-report response in stressful situation as an index of performance in the relationship between psychological health and performance. However, every personality theory has different standard of psychological health. It is desirable to research relationships with performance in wider area of science.
Though some people value individual's expressions that have some impacts to others or active relating to others, such estimations of performance need cautions. Over-expression of oneself or personal relationship with no psychological distance to others are included in the diagnostic standards of some personality disorders (Borderline Personality Disorder, Histrionic Personality Disorder, Narcissistic Personality Disorder, etc.) on DSM-IV(American Psychiatric Association, 1994), that is one of the manuals for diagnostic criteria of psychiatric disease. Recent psychoanalytic theories, such as "Separation-Individuation theory" (Mahler, Pine, & Bergman, 1975) or "Neurotic Personality Organization, Borderline Personality Organization, and Psychotic Personality Organization" (Kernberg, 1976), have strong effects to the diagnostic standards in DSM-IV. These theories are valuable to be focused as a part of further researches on performance.
References:
American Psychiatric Association (1994) Quick Reference to the Diagnostic Criteria from DSM-IV American Psychiatric Association Asher, H. B. (1976) Causal Modeling London: SAGE.
Bartone, P. T.; Ursano, R. J.; Wright, K. M. & Ingraham, L. H. (1989) Impact of a Military Air Disaster on the Health of Assistance Workers: A Prospective Study Journal of Nervous and Mental Disease 177, 317-328. Funk, S. C. (1992) Hardiness: A review of Theory and Research Health Psychology 11, 335-345. Ganellen, R. J. & Blaney, P. H. (1984) Hardiness and Social Support as Moderators of the Effects of Life Stress Journal of Personality and Social Psychology 47, 156-163. Holmes, T. H. & Rahe, R. H. (1967) The Social Readjustment Rating Scale Journal of Psychosomatic Research 11, 213-218. Hull, J. G.; Van Treuren, R. R. & Virnelli, S. (1987) Hardiness and Health: A critique and alternative Approach Journal of Personality and Social Psychology 53, 518-530. Kanner, A.; Coyne, J. C.; Schaefer, C. & Lazarus, R. S. (1981) Comparison of Two Models of Stress Measurement: Daily Hassles and Uplifts Versus Major Life Events Journal of Behavior Medicine 4, 1-39. Kernberg, O. (1976) Object Relations Theory and Clinical Psychoanalysis New York: Jason Aronson. Kobasa, S. C. (1979) Stressful Life Events, Personality, and Health: An Inquiry into Hardiness Journal of Personality and Social Psychology 37, 1-11. Kobasa, S. C. (1986) Personal Views Survey The Graduate School and University Center of The City University of New York. Kobasa, S. C., & Maddi, S. R. (1977) Existential Personality Theory in R. Corsini (Ed.) Current Personality Theories Illinois: Peacock, 243-276. Kobayashi, S., Shirakura, K., & Kitanishi, K. (1994) Meaning of Performance in Terms of Psychiatry (1): Relation between Performance and Desire Journal of Performance Studies 1, 39-44(in Japanese). Kosaka, M. (1992) Existential Personality Trait as a Resource for Stress Resistance: A Review on Hardiness Scales Studies in Sociology, Psychology, and Education Keio University No.35, 29-36(in Japanese).
41 International Journal of Physical Education, Sports and Yogic Sciences Vol. 1 No. 1 (November, 2011): 41-43
Recent Trends in Doping: Gene Doping SHYAM NARAYAN SINGH
Correspondence to:
Shyam Narayan Singh Department of Physical Education S.D.(P.G.) College, Muzaffarnagar
ABSTRACT Now a day’s sports authority’s fears about a new form of doping that will be undetectable and therefore less preventable is gene doping. Gene doping is the non therapeutic use of gene, genetic elements or artificially changing gene expression to enhance athletic performance. Advantages of gene doping to athletes are in two folds (i) Chemicals are indistinguishable from their natural counterparts, and (ii) They are generated locally in the muscle tissue. Nothing enters in the blood stream or urine. The most relevant genes which were used as a gene doping are (a) AAV- IGF-1 (Adeno- associated virus- Insulin growth factor-1) (b) EPO (Erythropoetin) (c) Repoxygen (d) Myostatin (e) Endorphins and (f) MGF (Mechno – growth factor one of the ISO forms of Insulin like growth factor-1).The world anti doping agency has already asked scientists to help find ways to prevent gene therapy from being used as the latest means of doping. The WADA president Richard W. Pound said regarding gene doping that “we need to start fighting this threat now, before it becomes a reality”.
Key words: Gene Doping, AAV-IGF-1, Erythropoietin, Repoxygen, Myostatin, Endorphin
The widespread use of drugs in sport however began in the 1960’s consequently in the Rome Olympics first cause of the use of drugs was found in a cyclist of Denmark, whose name was Nudejinson. Nudejinson won the gold medal in the event but died after completing the event because he took overdose of Ronical (A stimulant). The misuses of drugs in sport were widespread particularly at the time of the 1964 Olympic game at Tokyo. Pressure for action at national and International level became intense. The first legislation to combat drug abuse in sport was introduced, but the French, in 1963 followed by the Belgian government two year later. The International Olympic Commission Medical Commission was established in 1967 with drug misuse as one of its primary responsibilities. Drug testing of Olympic athletes began in the 1968 Olympic Games in Mexico City.
The use of performance enhancing drugs is banned in sports. However, physical exercise and exertion impose upon the body an increase demand of nutrients and oxygen. The body can meet the demand only up to a certain level beyond which exhaustion sets in. A sportsperson needs to keep himself vigorous, energetic, and full of vitality and endurance. To achieve all the some sports persons resort to pills and injections as shortcut to success, as they don’t understand that good genes, scientific coaching, proper nutrition and dedication to the task are what ultimately brings them success. According to International Olympic Committee (IOC), Doping is the ‘administration of or use by a competing
athlete of any substance foreign to the body or any physiological substance taken in abnormal quantity or taken by an abnormal route of entry into the body with the sole purpose of increasing in an artificial and unfair manner his/her performance in competition’. To check such practices, the IOC has devised a list of substances banned for use by sports persons in competition / training. During 1983 Pan American Games in Caracus, Professor Donike of Cologne set the stage for the present sophisticated drug testing in sport by introducing gas chromatography and mass spectrometry (GC-MS) in the analytical process.
The IOC established World Anti Doping Agency (WADA) in the year 1999 at Switzerland to check doping in sports. The general ethical justifications for the prohibition of doping by WADA are in two arguments: A. The use of the substance or method is causing an
actual or potential health risk to the athlete. The underlying ethical principal is to protect individuals against harm or risk to health.
B. The use of doping violets the spirit of sport. The spirit of sport is described in the introduction to the code with reference to a rather miscellaneous set of values such as ethics, fair play, honesty, health, fun and joy and respect for rules.
Gene Doping Now a day’s sports authority’s fears about a new form of doping that will be undetectable and therefore less preventable is gene doping. Gene doping is an outgrowth
Singh, Shyam Narayan (2011) Recent Trends in Doping: Gene Doping International Journal of Physical Education, Sports and Yogic Sciences 1(1): 41-43.

42 SHYAM NARAYAN SINGH
of gene therapy. However, instead of injecting DNA into a person’s body for the purpose of restoring some function related to a damaged or missing gene, as in gene therapy, gene doping involves inserting DNA for the purpose of enhancing athletic performance.
The World Anti Doping Agency (2008) defines gene doping as the “non therapeutic use of cells, genes, genetic elements, or modulation of gene expression, having the capacity to enhance athletic performance”. We can say that gene doping is the non therapeutic use of gene, genetic elements or artificially changing gene expression to enhance athletic performance. Gene or DNA used to increase the muscle strength and capacity of athletes is known as gene doping. The world anti doping agency has already asked scientists to help find ways to prevent gene therapy from being used as the latest means of doping.
Advantages of gene doping to athletes 1. Chemicals are indistinguishable from their natural
counterparts, and 2. They are generated locally in the muscle tissue.
Nothing enters in the blood stream or urine. Jim Wilson(2004) a professor of medicine at the university of Pennsylvania in Philadelphia preserved over a clinical trial in which 18 year old Jesse Gelsinger died1999 after suffering a massive immune reaction to the virus used to deliver a target gene. Wilson said that we need to pay attention to these kinds of immune responses. Athletes who try gene doping could find themselves dead before they win any gold medal. Gene therapy has substantial potential to treat diseases but we cannot over look the risk involved with this therapy. WADA president Richard W. Pound said regarding gene doping that “we need to start fighting this threat now, before it becomes a reality”. In fact the agency’s fight against gene doping began in March 2002, when they held a meeting to discuss the issue at the Banbury conference centre Long Island, New York, USA. In 2003 WADA decided to include a prohibition of gene doping, which was formalized in 2004 World Anti Doping code. The first product to be associated with genetic doping emerged on the approach to the Torino 2006 Olympic winter Games, where repoxygen was discussed as a potential threat in use at the games. WADA and International Olympic Committee (IOC) have conservatively guessed that some athletes may use gene therapy at the 2008 Olympics Beijing. One of the several researches being funded by WADA to develop a test for gene doping is Geoffery Goldspink from University College London in the UK. Goldspink has shown that mice injected with the gene for normal growth factor have 30% increases in muscle mass within 3 weeks. Genes Used For Gene Doping The most relevant genes which were used as a gene doping are (a) AAV- IGF-1 (Adeno- associated virus-
Insulin growth factor-1) (b) EPO (Erythropoetin) (c) Repoxygen (d) Myostatin (e) Endorphins and (f) MGF (Mechno – growth factor one of the ISO forms of Insulin like growth factor-1). The Science behind Gene Doping H. Lee Sweeny (2004), a professor and chairman of physiology at the University of Pennsylvania school of Medicine is working on treatments that introduce a synthetic gene that regenerates muscle, increases its strength and protect it from degradation. They selected adeno- associated virus (AAV) as a vector, because infects human muscle readily but does not cause any disease. It was modified with a synthetic gene that would produce IGF-1 only in skeletal muscle began by trying out in normal mice. On injecting his AAV- IGF-1 combination into young sedentary mice, they saw that the muscles overall size and the rate at which they grew were 15 to 30 percent greater than normal. H. Lee Sweeny (2004), another recent approach to cause muscle hypertrophy may come from drugs designed to block myostatin. Myostatin seems to inhibit muscle growth throughout embryonic development and adult life. Experiments on genetically engineered mice indicate that the absence of this growth factor results in muscle fiber hypertrophy and hyperplasia. Nature has already provided examples of the effects of Myostatin blockade in the Belgian blue and fied montse cattle breeds, both of which have an inherited genetic mutation that produce an in effective version of myostatin. The first myostatin blocking drugs have been developed are antibodies bagains myostatin.
Repoxygen, developed by UK firm Oxford Biomedica (2005) delivers the gene for erythropoietin to muscle cells in a vector configuration that brings the gene under the control of oxygen –sensitive genes awitch. Repoxygen is still in preclinical development according to the oxford Biomedica website.
In 1997 Leiden et al., used an adenovirus to deliver the EPO gene in mice and monkeys. This raised the hematocrit from 49% to 81% in the mice and from 40% to 70% in the monkeys. The effect lasted for over a year in the mice and for 12 weeks in the monkeys.
Another set of experiments, were carried out at the Salk Institute in San Diego, by Ronald Evans and his colleagues (2004) producing mouse muscles that would be of help to long distance swimmer and runners. The change produced the “marathon mouse” (insertion of a fat burning protein called PPAR- delta) and runners. The researchers inserted genes that code for a fat burning protein called PPAR – delta. Such mice stayed trim and also developed a large number of slow – twitch muscle fibers required during extended exertion. Detection of gene doping

43 International Journal of Physical Education, Sports and Yogic Sciences Vol. 1 No. 1 (November, 2011): 41-43
Detection of gene doping is very difficult. Gene therapy vectors may be measurable only shortly after administration and in many cases would require tissue sampling. Taking muscle biopsies from athletes is no option, thus eliminating this form of detection. In addition, many forms of genetic doping do not require the direct injection of genes in the desired target organ. Finding the site of injection will be like looking for a needle in a hay stack. The protein resulting from gene transfer is not different from the endogenously produced protein and as such detection of the protein itself is no indication for doping. It will therefore only be possible to monitor the use of gene doping by repeated physiological protein profiling of athletes, allowing changes in protein levels to be perceived. These assays, which require the simultaneous measurement of many (possibly up to one thousand) different proteins and establishing ranges of normal values, need to be developed.
Preventive measures
Most athletes will not have enough background knowledge to fully understand the potential health hazards imposed by gene doping. Therefore, it is of utmost importance that athletes and their supporting staff will be educated on this subject in order to prevent the use of gene doping. The pharmaceutical industry produces most currently used gene therapy vectors which may be applied for gene doping. To prevent these materials from entering the doping circuit, the industry should endorse a code of conduct stating it will not produce or sell products for gene doping. On the other hand, researchers throughout the world have easy access to genetic materials, including genes that may be used for sports doping. The research community, with the help of the different Gene Therapy Societies, should be encouraged to underwrite a similar code. In order to develop an effective strategy for the prevention of gene doping, national as well as international coordination is required. The World Anti-Doping Agency should play a leading role. Coordination is necessary to set-up an educational programme for athletes and their supporting staff, as well as the general public. Also, research needs
to be coordinated in order to investigate the development of methods to detect gene doping. CONCLUSIONS: In lieu of conclusion various doping techniques have become so complex but so early available and so numerous, that doping has become more and more dangerous for top athletes. Since their positive effects manifest well before their negative effects, it is difficult to convince athletes and coaches not to use them. Objective education and information should be provided not only to the athletes but also to the parents, educators, officials, and the general public for better handling of this problem. Scientists predict that the gene doping will be a big issue during 2012 Olympics. Scientists believe that right now no athletes are using gene doping but the truth is that we still don't have the techniques to detect the gene doping. But the good news is that research is going on to find the techniques to detect the gene doping. Now, the above matter under the topic of gene doping in sports may be beneficial for sports related persons and it may be informative to those who are willing to know about Gene Doping. References: Beotra, Alka ‘Drug Abuse in Sports’ New Delhi: Sports Authority of India, 2004. Christen Brownlee, ‘Gene Doping. Will Athletes go for the Ultimate high?’ Science News 2004; 166(18):280. Lee Sweeney H., ‘Gene Doping’ Scientific American. July 2004: 63-64. www.sciam.com. Mottram, D. R. ‘Drug in Sport’ St. Edmundsbury Press Ltd. Bury St. Edmunds, Suffolk, London: Great Britain, 1988. Sevenson, E.; Black, H. and Dugge D. Long Term Erythropoietin Expression in Rodents and Non Human Primates following intra Muscular Ingestion of a Replication Defective Adeno Viral Vector Hum Gene 1997: 8: 1797 -1806. Stephen Pincock, ‘Feature Gene Doping’ Lancet 2005: 366: 579. http://www.oxfordbiomedica.co.uk/repoxygen.htm2/2/2005 http://en.wikipedia.org/wiki/gene_doping.

44 International Journal of Physical Education, Sports and Yogic Sciences Vol. 1 No. 1 (November, 2011): 44-46
Investigation of Motivational Factors Influencing Participation in Badminton S. K. YADAV, HONEY BHATIA and RANJEET SINGH PAWAR
See end of the article for authors’ affiliations
Correspondence to: S. K. Yadav School of Physical Education Devi Ahilya University Indore (M. P.)
ABSTRACT The purpose of the study was to investigate the Motivational Factors Influencing Participation in Badminton. Seventy-six (48 male and 28 female) players from the different universities, who participated in Madhya Pradesh state university badminton tournament, were selected as subjects for study. The Motives for Competition Scale (MCS) by Young Blood and Suinn (1980) was administered to the subjects to find out the motivational factor preferences of the subjects. Descriptive statistics (i.e. Mean and Standard Deviation) and t - ratio was employed to compare male and female players on 19 different categories of motivation. It was concluded that there is no significant difference between male and female players on their motivational factors relating to Social approval, Competition, Self mastery, Life style, Fear of failure, Physical fitness and health, Friendship, Success and achievement, Tangible pay offs, Recognition, Intimidation / control, Heterosexuality, Competing condition, Independence / individuality, Family, Emotional release, Status, Self – direction / awareness and Understanding reasons. It means both male and female are equally dominated towards all these 19 dimensions.
Key words: Motivation, Badminton, Emotional release, Intimidation, Life style.
The root for motivation is the word motive. Motive is a concept often discussed, but rarely understood by those who use the term. A motive concerns the reasons for a course of action. In other words, what will be the result of a chosen course of action? What are the individual motives for performance? Why does he or she continue to make personal sacrifices in order to perform? Receiving and enjoying the consequences of a particular action may be the motive for that action. It is literally the desire to fulfill a need. Each motive that moves the person to behave in a particular way and when a motive becomes active is called motivated. The process by which these motives are activated is called motivation
In the field of physical education and sports, no sportsman can win or even show better performance without motivation. It is a wonder drug which works miracles with the sports man on the ground and even off the field. It is a sort of warm-up before the final plunge. In the absence of proper motivation not only the learning process but also the life itself becomes an un-interesting and un-uphill task. An un-motivated person would not involve himself in learning, competing against others and achieving higher goals in life.
The purpose of the study was to investigate the motivational factors influencing participation in
Badminton. For this purpose seventy-six (48 male and 28 female) players from the different universities, who participated in Madhya Pradesh State University Badminton Tournament held at Bhopal from 8-10th September 2008 were selected to serve as subjects. It was hypothesized that there would be no significant difference between the male and female badminton players on their perception of motivational factors for competition.
Methodology:
The Motives for Competition Scale (MCS) by Young Blood and Suinn (1980) was administered to the subjects to find out the motivational factor preferences of the subjects. The 95 - items Motives for Competition Scale measures 19 dimensions of motives namely: Social approval, Competition, Self mastery, Life style, Fear of failure, Physical fitness and health, Friendship, Success and achievement, Tangible pay offs, Recognition, Intimidation / control, Heterosexuality, Competing condition, Independence / individuality, Family, Emotional release, Status, Self – direction / awareness and Understanding reasons, was first administered to students. Each dimension has five statements or questions. A sample statement read “My parents showing an interest in my sports activities.” Each of the statement describes specific motives that
Yadav, S. K.; Bhatia, Honey and Pawar, Ranjeet Singh (2011) Investigation of Motivational Factors Influencing Participation in Badminton International Journal of Physical Education, Sports and Yogic Sciences 1(1): 44-46.

45 S. K. YADAV, HONEY BHATIA and RANJEET SINGH PAWAR
influence the athletes. For each statement there are five alternatives i.e. 0 = very detrimental to me, 1 = somewhat detrimental to me, 2 = neither detrimental nor beneficial to me, 3 = somewhat beneficial to me, and 4 = very beneficial to me. Subjects were asked to indicate their preferences by placing on “” in the appropriate space. The sum of the scores on the items in a dimension
was divided by the number of items in that dimension to derive the score for that subject. Results and Discussion For analyzing the data collected from this study the descriptive statistics (i.e. Mean and Standard Deviation) and t - ratio was employed to compare male and female players on 19 different categories of motivation.
TABLE – 2 SIGNIFICANCE OF DIFFERENCE BETWEEN MEAN FACTOR SCORES OF MOTIVATIONAL
FACTORS FOR COMPETITION OF INTER-UNIVERSITY LEVEL BADMINTON PLAYERS
S. No. Motivational Factors
Sex Mean S. D. DM σDM t
1. Social Approval Male Female
2.375 2.421
1.329 1.347 0.046 0.139 0.33*
2. Competition Male Female
2.2333 2.071
1.3736 1.472 0.162 0.15 1.079*
3. Self Mastery Male Female
2.346 2.329
1.281 1.338 0.017 0.136 0.125*
4. Life Style Male Female
2.288 2.15
1.431 1.507 0.138 0.155 0.785*
5. Fear of Failure Male Female
2.2 2.1
1.415 1.436 0.1 0.151 0.66*
6. Physical Fitness and Health Male Female
2.479 2.436
1.354 1.342 0.043 0.143 0.302*
7. Friendship Male Female
2.317 2.436
1.344 1.315 0.119 0.141 0.839*
8. Success and Achievement Male Female
2.417 2.221
1.373 1.389 0.196 0.146 1.331*
9. Tangible Payoffs Male Female
2.229 2.114
1.265 1.253 0.115 0.134 0.857*
10. Recognition Male Female
2.242 2.221
1.344 1.389 0.021 0.063 0.139*
11. Intimidation / Control
Male Female
2.188 2.271
1.332 1.351 0.083 0.142 0.583*
12. Heterosexuality Male Female
2.308 2.136
1.356 1.45 0.172 0.147 1.166*
13. Competing Condition Male Female
2.2 2.193
1.345 1.33 0.007 0.142 0.501*
14. Independence / Individuality
Male Female
2.329 2.45
1.31 1.34 0.121 0.141 0.854*
15. Family Male Female
2.442 2.443
1.422 1.416 0.001 0.150 0.007*
16. Emotional Release Male Female
2.288 2.4
1.383 1.438 0.112 0.149 0.753*
17. Status Male Female
2.375 2.386
1.418 1.381 0.011 0.149 0.071*
18. Self Direction / Awareness
Male Female
2.363 2.2143
1.35 1.4384 0.148 0.147 0.007*
19. Understanding Reasons Male Female
2.15 2.007
1.352 1.344 0.143 0.143 0.996*
*Insignificant at 0.05 level tab t .05 (74) = 1.65

46 International Journal of Physical Education, Sports and Yogic Sciences Vol. 1 No. 1 (November, 2011): 44-46
CONCLUSIONS: Within the limitation of present study it was concluded that there was no significant difference between male and female badminton players on their motivational factors relating to Social approval, Competition, Self mastery, Life style, Fear of failure, Physical fitness and health, Friendship, Success and achievement, Tangible pay offs, Recognition, Intimidation / control, Heterosexuality, Competing condition, Independence / individuality, Family, Emotional release, Status, Self – direction / awareness and Understanding reasons. It means both male and female players were equally dominated towards all these 19 dimensions.
REFERENCES: Carron, A.V. Motivation: Implications for Coaching and Teaching Sports Dynamics London: Canada, 1984. Growney, Lawrence Edward “Motivational Factors Influencing the Participation and Improvement of
Performance in Athletes of NCAA Division I Track and Field Athletes” Dissertation Abstracts International 54, 1 (July 1993): 124. Richard, Jack Robert “An Assessment of Personality and Motivation Factors of Black and White Athletes Competing in Inter Scholastic Sports” Dissertation Abstracts International 35:11 (1974): 7108-A.
Authors’ affiliations: Honey Bhatia P.E.T, Lancers International School, Gurgaon, Haryana, India
RANJEET SINGH PAWAR Department of Physical Education Dr. C. V. Raman University Kota, Bilaspur (C.G.)
47 International Journal of Physical Education, Sports and Yogic Sciences Vol. 1 No. 1 (November, 2011): 47-49
Yoga and Exercise for Healthy Society JYOTI JUNGARE and ASHISH BILLORE
Correspondence to: JYOTI JUNGARE Govt. Home Science College Hoshangabad (M.P.)
ABSTRACT Sports and games have importance in life at all levels of civilization. Primitive rock paintings show swimmers, ball throwers, spear throwers, as well as persons in obvious combat in hunting. Both prayers and dances were used for ceremonial functions and religious rites in primitive and early civilization. Sports require great strength and relatively good amount of flexibility, endurance, agility and quick reflexes. Modern techniques teach muscles and body development but neglect building concentration and confidence. By combining yoga with other physical exercises these faults can be corrected. In the field of sports, sports persons who require heavy muscular activities are not aware of relaxation techniques, which can be easily availed of by practicing Asanas such as Padmasana, Savasana etc. as defined in yoga. These Asanas energize nervous system and improve muscle strength. Therefore it is beneficial for the sports community to learn and practice yoga.
Key words: Yama, Niyam, Asana, Pranayam, Pratyahar, Dhyan, Dharna Samadhi.
In ancient India the persons with disabilities were given education in the communities in which they lived. Education was given in the mainstream schools alongside gurukuls. Individualised instructions were given according to the individual child's need and age (Jeyachandran, 1968). A few residential institutions were established by the members of the royalty at different locations as an act of dharma, a duty (Miles, 1994). During the colonial period and after, special schools were established mostly in urban areas and were expensive. They covered only 2% of the population in need (Rangasayee 1995). In the post-independence era India had around 100 special schools for the persons with disabilities. The special schools were run by the government as well as non government organizations. These special schools were inadequate considering the mammoth population in need of special education.
Yoga is all about feeling good; feel the blood surging through your veins, the energy pulsating through your nerves, the bliss coursing through your whole being. Best of all, Yoga is apt for all, regardless of age, color, caste, creed or religion: from the healthiest to the sickest, from the richest to the poorest, from the whitest to the blackest. And here are some of the specific - and immense - benefits of yoga.
Benefits of Yoga • Brings down stress and enhances powers of
relaxation. • Boosts physical strength, stamina and flexibility. • Bestows greater powers of concentration and self
control which inculcates impulse control. • Helps in rehabilitation of old and new injuries.
• Intensifies tolerance to pain and enhancing mental clarity.
• Boosts functioning of the immune system. • Enhances posture and muscle tone. • Improves blood circulation. • Results in healthy, glowing skin. • Cleanses and improves overall organ functioning. Yoga is one of the most ancient cultural heritages of
India. The word yoga in Sanskrit means "to unite" and so yoga can be said to connote a unificatory discipline. In this sense it is an exercise in moral and mental cultivation that generates good health (arogya), contributes to longevity (chirayu), and the total intrinsic discipline culminates into positive and perennial happiness and peace. Therefore, yoga is thus said to be indispensable for the ultimate accomplishment in life. It is not constant. In each and every village of the country life style of human beings changes according to their religion and literature. Today's modern life style is completely changed from ancient life style. Society is facing problems because of unemployment, tension, false offers, etc. and the eating and working culture of human beings is badly affected.
Yoga has several benefits like it provides mental peace, prevents and controls disease, promotes spiritual development, helps in overcoming mental tension and helps in mental treatment.
Today yoga is not only popular in our country but is also making headway in foreign countries. In our country the expansion of yoga occurred quite late - in the decade of 1970 and 1980. A study reveals that America had adopted yoga as it is the base of positive thinking and healthy lifestyle of an individual. Today yoga is practiced
Jungare, Jyoti and Billore, Ashish (2011) Yoga and Exercise for Healthy Society International Journal of Physical Education, Sports and Yogic Sciences 1(1): 47-49.

48 JYOTI JUNGARE and ASHISH BILLORE
through two styles, one is ancient and the second one is modern. Today many changes have been made in the names of asanas, their methods of performing etc, due to which the number of asanas has increased. According to the interest of people many changes have been made in yoga asanas and pranayam and due to which people are making maximum use of yoga.
Effect of Media: Today there are lots of books, C.D., videos, films etc. are available in the market. By practicing yoga we can not only make anybody able to face all the challenges of life and he can enhance the real physical power to achieve the topmost level of self awareness. By practicing yoga people are not only getting good health but it is also helping in the treatment of various kinds of diseases. By regular practice of yoga a person can get rid of high blood pressure, diabetes, back ache, headache, tension, breathing problems etc. Types of Yoga: There are eight parts of practicing yoga; (Yama, Niyam, Asana, Pranayam, Pratyahar, Dhyan, Dharna Samadhi). But today two of these parts are very popular (Asana and Pranayam). Much time and money is not required for yoga practice. Due to less time, less money and more benefits today yoga has assumed great importance.
Effect on the body: 1. Reduced stress 2. Sound sleep 3. Reduced cholesterol level 4. Improvement in several medical conditions 5. Relief in Allergy and asthma related symptoms 6. Reduces blood pressure 7. Smoking cessation help 8. Reduces heart rate 9. Spiritual growth 10. Sense of well-being 11. Reduced anxiety and muscle tension 12. Increased strength and flexibility 13. Yoga develops man's toleration 14. Yoga develops positive world-view 15. Yoga develops healthy and happy behavior 16. Yoga develops ability to plan and set goals 17. Yoga develops ability to conflict-resolution 18. Yoga develops honesty and integrity or character
and moral qualities.
The popularity and spread of Yoga has allowed most people to have access in one form of yoga or another. Additionally one can learn more through books or online articles before one goes in-person to a yoga studio, research more online, take a video out from your public library or watch a class on television. For the beginner with no experience at all with yoga, this is a great thing because your resources are now limitless, as opposed to the struggles some exercise enthusiasts found only twenty years ago.
Despite all of these shifts in popularity, the actual practice of yoga hasn't changed in centuries. The exercises, postures, meditation, breathing techniques and mindset are still the same, as are the goals : to create the yoke between mind, body and spirit.
The inexorable rise of yoga fusion classes shows no sign of tailing away, with hybrids such as Yoga Dance, Acro Yoga, Body Balance, and Yogalites, still creating a storm.
Yoga is soon becoming one of the preferred forms of exercise for overall good health and even to lose weight along with mental and spiritual well being all over the world. Even individuals who have just started practicing the various yoga poses can reap the benefits of yoga as the various yoga asanas or postures depending on their intensity levels are extremely useful in strengthening one's lower back, legs, hands, feet, spine, shoulders and so on.
The basic idea of yoga is to unite the atma or individual soul with the paramatma or the Universal Soul. According to Yoga philosophy, by cleansing one's mind and controlling one's thought processes one can return to that primeval state, when the individual self was nothing but a part of the Divine Self. This is the sense encapsulated in the term samadhi. The aim of the yogi is to be able to perceive the world in its true light and to accept that truth in its entirety.
The regular practice of yoga can prove very beneficial for women. Yoga can provide innumerable benefits to women like improving reproductive system, helping in natural child birth, giving complete workout to the body. Women's body is fragile and soft. This is a general view and fact. Exceptions can be everywhere and in every field. Women are designed by nature to nurture and take care and so all women are sensitive and soft at heart. On the other hand, she has to be strong from within because she has to undergo the strenuous activity of bearing a child and going through the childbirth. So, every woman has to be strong not only outwardly, she should have a strong system inside also. Yoga asanas prove to be very beneficial for women provided they do the right asanas in the right way. The yogic asanas, in fact, work in such a way that they support the basic systems of the body and boost the immune system as well.
Yoga is a set of theories and practices with origins in ancient India. Literally, the word yoga comes from a Sanskrit work meaning "to yoke" to "to unite." it focuses on unifying the mind, body, and sprit, and fostering a greater feeling connection between the individual and his/her surroundings. Yoga has spiritual roots, with the main goal of helping individuals to realize true happiness, freedom, or enlightenment. Beyond this, however, yoga has several secondary goals, such as improving physical health and enhancing mental well-being and emotional balance.

49 International Journal of Physical Education, Sports and Yogic Sciences Vol. 1 No. 1 (November, 2011): 47-49
As interest in yoga has increased in western countries over the last few decades, yoga postures are increasingly practiced devoid of their original spiritual context, solely for physical health benefits. This physical practice of yoga, often called Hatha Yoga, sometimes overlaps or includes references to the other aspects of yoga. A popular misconception is that yoga focuses merely on increasing flexibility. The practice of Hatha Yoga also emphasizes postural alignment, strength, endurance and balance.
Yoga and exercise are necessary for busy life style. Yoga is a journey toward your physical and spiritual wellness. You will experience the health, energy, and vibrancy that yoga can bring into your life. With the enriching your mind, body and soul with the power of yoga package, yoga covers every aspect of life style, including relaxation, exercise, breathing, and meditation. Whether you are using the package in conjunction with a class or on your own, enriching your mind, body and soul with the power of yoga can help you.
MODERN YOGA Modern yoga is based on five basic principles 1. Proper relaxation 2. Proper exercise 3. Proper breathing 4. Proper diet 5. Positive thinking and meditation.
BENEFITS OF YOGA Yoga is a science that has been practiced for thousands
of years. It consists of ancient theories, observations and principles about the mind and body connection which is now being proven by modern medicine. Substantial research has been conducted to look at the Health Benefits of yoga - from the Yoga Postures (Asanas), Yoga Breathing (Pranayama), and meditation. The information on yoga poses and benefits are grouped into three categories – Physiological, Psychological, Biochemical effects. Furthermore, Scientists have laid these results against the benefits of regular exercise. PSYCHOLOGICAL BENEFITS
Hence the practice of yoga makes the body strong and flexible. It also improves the functioning of the respiratory, circulatory, digestive and hormonal systems.
1. Mood improves and subjective well-being increases. 2. Self-acceptance and self- actualization increases. 3. Social adjustment increases. 4. Anxiety and depression decrease. 5. Concentration improves. 6. Memory improves. 7. Attention improves . 8. Learning efficiency improves. 9. Depth perception improves.
HEALTH AWARENESS
Health is disturbed day by day due to modern life style. Many new diseases can be seen in our society due to disturbances of life. Some people start their day with medicines. Mental and physical health both have changed.
"Those who are physically and mentally fit" are healthy. To keep themselves fit, they are changing or their life style. Many of them are adopting different kinds of exercises like Suryanamaskar, Walking, Running, Dancing or different kind of games and yoga.
Health – "An individual who is even all the conditions if life is called healthy". "One who is balanced in body, mind and emotions is healthy". Today people are inclined towards physical education exercises. Exercise makes the body light and burns fat and muscles become stronger. The physical health gets an advantage but yoga gives advantage to both physical and mental health.
References:
Ralston, Patricia A.; Caroline Smart Yoga New York: Harper Torch, 1999. Dash B. N. Theories of Education and Education in the Emerging Indian Society New Delhi: Dominant Publishers and Distributors, 2004. Chaube, S. P. and Chaube, Akhilesh Philosophical and Sociological Foundations of Education Agra: Vinod Pustak Mandir, 2008. Authors’ affiliations: Ashish Billore Scholar, Bhoj Open University Bhopal (M. P.)

50 International Journal of Physical Education, Sports and Yogic Sciences Vol. 1 No. 1 (November, 2011) : 50-53
Comparative Differentials among Categorized University Players as Related to General Motor Abilities and Psychological Variables NAMAN YADAV and RUCHI YADAV
See end of the article for authors’ affiliations
Correspondence to: Naman Yadav V. S. S. D. P. G. College Kanpur (U. P.)
ABSTRACT The purpose of this study was to compare the General Motor Ability and Psychological Variables of different categories of university players (Single discipline and Multi-discipline players). The subjects were 100 male university players, who represented All India or Zonal Inter-University level tournaments in one sport as well as two or more than two universities in different sports from the academic year 2003-04 to 2008-09. Fifty students were those, who had represented university only in one game and fifty students were those, who had represented university in two or more than two games. General Motor Ability variables were compared among categorized university players through Barrow Motor Ability Test. The selected Psychological Variables were Self-concept questionnaire of R. K. Saraswat, Sport Competition Anxiety Test of Rainer Marten, Sports Aggression Inventory of Anand Kumar and P. S. Shukla and Sports Achievement Motivation Test of Dr. M. L. Kamlesh. All the tests of General Motor Ability and Psychological Variables were administered in the play fields as well as in the classrooms of V.S.S.D. P.G. College and C.S.J.M. University, Kanpur (U.P.). The data collected on the tests was statistically analyzed by ‘t’ ratio. Statistical analysis of data revealed that there was significant difference in all the variables of General Motor Ability and the Composite General Motor Ability score. Similarly, in Psychological Variables significant difference was found in Self-concept and in Aggression whereas in Anxiety and Achievement Motivation, no significant difference was observed.
Key words: Psychological Variables, Motor Ability, Sport Competition Anxiety, Achievement Motivation.
Today performance in sports not only demands systematic training to develop physical, physiological variable and technical aspects of sports but also demands training and consideration of psychological characteristics for success in this field. All sports are psychological as well as physical because, it is led by mental images and thought patterns. It will, however allow you to draw the most from the conditioning you have. If you have trained more and better, your present capacity will be higher than if you have trained less, your performance will be less well. However, regardless of what your physical capacity might be at moment, you have to look at your psyche in order to get the most from what you have. You have to rely on your head and your thoughts, images and mental patterns to act as the controlled mechanism. Negative thoughts are particularly effective for destroying skilled performance. It has been observed that there are vast majority of physical educators studying in various universities/institutions who excel in only one sport where as there are few others who are above average in two or more sports. The scholar wanted to find out what
makes the individuals excel in few sports where as others confine them to one sport. Hence, the scholar had chosen this study to find out the differences among different categories of university players with regard to general motor abilities and psychological variables. The purpose of the study was to compare the general motor ability and psychological variables of different categories of university players. METHODOLOGY: The subjects for this study were male university players, who represented All-India or Zonal Inter-University level tournaments. One hundred subjects were selected for the study, who represented Inter-University tournaments in one sport and two or more than two sports. Fifty students were those, who had represented university only in one sport and fifty students were those, who had represented university in two or more than two sports. Barrow General Motor Ability test was chosen to measure General Motor Ability because the test was designed for college men of the same age group as that of the subjects for the study. The test had only three items and from an
Yadav, Naman and Yadav, Ruchi (2011) Comparative Differentials among Categorized University Players as Related to General Motor Abilities and Psychological Variables International Journal of Physical Education, Sports and Yogic Sciences 1(1): 50-53.

51 NAMAN YADAV and RUCHI YADAV
administrative angle it was considered feasible keeping time, money and personnel to administer test in mind so as to get the maximum co-operation from the subjects. To find out the psychological characteristics of different categories of university players, the research scholar selected the questionnaires namely self- concept, sports aggression inventory, sports achievement motivation and sports competition anxiety questionnaire for the purpose of the study. RESULTS AND DICUSSION:
To determine the significance of mean in General Motor Abilities and Psychological Variables between categorized university players ‘t’ test was applied. To find out the General Motor Abilities of different categories of university players, Barrow Motor Ability test was used consisting of standing broad jump, medicine ball put and zigzag run. The mean difference and test of significance on General Motor Ability variables and a combined single score of general motor ability between different categories of university players has been presented in Table 1 to 5.
Table – 1 SIGNIFICANCE OF DIFFERENCE BETWEEN CATEGORISED UNIVERSITY PLAYERS
(Single & Multi-Discipline) ON STANDING BROAD JUMP
Variable Standing Broad Jump
Mean ± SD ‘t’ ratio
Single Discipline 5.87 0.85 7.31*
Multi Discipline 7.033 0.73
t 0.05 (98) = 1.98 From the above table 1, it is revealed that there was significant difference in case of standing broad jump as calculated ‘t’ value (7.31) was greater than tabulated ‘t’ value (1.980) at 0.05 level of significance with 98 degree of freedom. Thus, it may be concluded that there was significant difference among categorized (single
and multi-discipline) university players related to standing broad jump, in which mean standing broad jump is significantly higher for multi-discipline university players than single discipline university players at 0.05 level of significance.
Table – 2 SIGNIFICANCE OF DIFFERENCE BETWEEN CATEGORISED UNIVERSITY PLAYERS
(Single and Multi-Discipline) ON MEDICINE BALL PUT
Variable Medicine Ball Put
Mean ± SD ‘t’ ratio
Single Discipline 32.54 3.29 4.36*
Multi-Discipline 35.69 3.90
t 0.05 (98) = 1.98 It can be learned from table 2 that there was significant difference as calculated ‘t’ value (4.36) is greater than the tabulated ‘t’ value (1.980) at 0.05 level of significance. Hence, it may be concluded from the data
that mean of medicine ball put is significantly higher for multi-discipline university players in comparison to single discipline university players at 0.05 level of significance.
Table – 3 SIGNIFICANCE OF DIFFERENCE BETWEEN CATEGORISED UNIVERSITY PLAYERS
(Single & Multi-Discipline) ON ZIGZAG RUN
Variable Zigzag Run
Mean ± SD ‘t’ ratio
Single Discipline 24 3.06 2.50*
Multi Discipline 22.73 1.87 t 0.05 (98) = 1.98

52 International Journal of Physical Education, Sports and Yogic Sciences Vol. 1 No. 1 (November, 2011) : 50-53
It is evident from the table 3 that there was significant difference in case of zigzag run as the calculated ‘t’ value (2.50) was greater than the tabulated ‘t’ value (1.980) at 0.05 level of significance. This data provide sufficient evidence that the mean zigzag run performance was significantly better for multi-discipline university players at 0.05 level of significance because lower values of time in running events are considered better.
To find out the psychological characteristics of different categories of university players; self concept questionnaire, sports competition anxiety test, sports aggression inventory and sports achievement motivation questionnaires were used. The mean difference and test of significance on Psychological Variables has been presented in Table 4 to 7.
Table – 4 SIGNIFICANCE OF DIFFERENCE BETWEEN CATEGORISED UNIVERSITY PLAYERS
(Single and Multi-Discipline) ON SELF CONCEPT
Variable Self Concept
Mean ± SD ‘t’ ratio
Single Discipline 180.18 15.62 1.985*
Multi Discipline 186 13.62
t 0.05 (98) = 1.98
From the above table 4, it is learned that there was significant difference in case of self concept as the calculated ‘t’ value (1.985) was more than tabulated ‘t’ value (1.980) at 0.05 level of significance. Hence, data
provide sufficient evidence that the mean self concept is significantly higher for multi-discipline university players in comparison to single discipline university players at 0.05 level of significance.
Table – 5 SIGNIFICANCE OF DIFFERENCE BETWEEN CATEGORISED UNIVERSITY PLAYERS
(Single and Multi-Discipline) ON ANXIETY
Variable Anxiety
Mean ± SD ‘t’ ratio
Single Discipline 19.84 2.87 1.10
Multi Discipline 20.46 2.73
t 0.05 (98) = 1.98
The above table 5 reveals that there was no significant difference as calculated ‘t’ value (1.10) was less than the tabulated ‘t’ value (1.980) at 0.05 level of
significance. Thus it may be concluded that there was no difference in anxiety level between of single and multi-discipline university players.
Table – 6 SIGNIFICANCE OF DIFFERENCE BETWEEN CATEGORISED UNIVERSITY PLAYERS
(Single and Multi-Discipline) ON AGGRESSION
Variable Aggression
Mean ± SD ‘t’ ratio
Single Discipline 9.74 2.03 2.59* Multi Discipline 11.06 2.97
t 0.05 (98) = 1.98
It can be interpreted from table 6 that there was significant difference in relation to aggression as calculated ‘t’ value (2.59) was more than the tabulated ‘t’ value (1.980). Thus data provide sufficient evidence
to ensure that mean aggression was significantly higher for multi-discipline university players in comparison to single discipline players at 0.05 level of significance.

53 NAMAN YADAV and RUCHI YADAV
Table – 7 SIGNIFICANCE OF DIFFERENCE BETWEEN CATEGORISED UNIVERSITY PLAYERS
(Single and Multi-Discipline) ON ACHIEVEMENT MOTIVATION
Variable Achievement Motivation
Mean ± SD ‘t’ ratio
Single Discipline 26.7 4.62 .91
Multi Discipline 25.8 5.85
t 0.05 (98) = 1.98 It is evident from the table 7 that there was no significant difference found in case of achievement motivation as calculated ‘t’ value (.91) was less than the tabulated ‘t’ value (1.980) at 0.05 level of significance. Thus, it may be concluded that achievement motivation of both single and multi-discipline university players was almost the same.
Discussion of Findings: The results of the study showed significant difference in General Motor Ability variables at 0.05 level of significance between players having represented university in one sport and players having represented university in two or more sports. The players having represented university in two or more sports were significantly better than players having represented university in one sport. The findings may be due to reason that their strength, agility, power of legs as well as power of arms and shoulder girdle muscles were better than those players who had represented university in one sport The analysis of data revealed significant differences in case of self-concept and aggression where multi-discipline players exhibited better self-concept and aggression in comparison with the single discipline players. It may be due to the greater awareness of multi-discipline players towards physical, social, temperamental, educational, moral and intellectual ability. Significant difference in aggression may be due to the nature of the game they played like judo, boxing, wrestling etc. The insignificant difference in sports competition anxiety test between players having represented university in two or more games/sports and players having represented university in one sport may be due to the reason that the players were almost of the same standard with a similar kind of experience which must have been a probable cause. The insignificant difference in achievement motivation between sportsmen having represented university in two or more
sports and sportsmen having represented university only in one sport may be due to a similar confidence level with regard to wining a competition. Similarity of motive to succeed in a competition as well as approaching a competitive situation with a motive to avoid failure may be the probable causes.
Conclusions: Within the limitations of the study and on the basis of the results of the study, the following conclusions may be drawn: 1) Multi-discipline players (Players having represented university in two or more sports) were better than the single discipline players (Players having represented university in only one sport) in all the variables of General Motor Ability, that is power, strength and agility when each of them was considered in isolation. 2) Multi-discipline players were better than the single discipline players in self concept. 3)Multi-discipline players were better than single discipline players in aggression.4)There was no significant difference in anxiety level of different categories of university players. 5) There was no significant difference in the achievement motivation of different categories of university players. References: 1). M. L. Kamlesh and M.S. Sangral, Principles and History of Physical Education Ludhiana: Prakash Brothers Education Publishers, 1980. 2). John D. Brock, Walter A. Cox and Erestus W. Pennock, “Motor Fitness” Research Quarterly Vol. 12, No.2, May 1941. 3). H. Harrison Clarke, Application of measurement to Health and Physical Education 5th ed., Englewood Cliffs, 1976.
Authors’ affiliations: Ruchi Yadav M. P. Ed., M. Phil.

54 International Journal of Physical Education, Sports and Yogic Sciences Vol. 1 No. 1 (November, 2011)
Guidelines for Authors The International Journal of Physical Education, Sports and Yogic Sciences is a quarterly journal, publishes scientific research and review articles on sports and sports science disciplines and other such subjects having inter-disciplinary perspective with specific application to sports.
Manuscripts are accepted for publication with the understanding that they have not been published, simultaneously submitted, or already accepted for publication, elsewhere.
Manuscripts deemed suitable are acknowledged and critically reviewed by a qualified, independent, expert evaluator, through a secret evaluation system. The evaluator’s comments may be communicated to the principal author along with the comments of Editor.
All the manuscripts are to be submitted by the principal author to the Editor-in-Chief/ Editor, Indian Journal of Physical Education, Sports and Yogic Sciences by e-mail as well as on mailing address along with a letter of intent for publication. This covering letter should also contain the following certificate:
“It is certified that this article is my/our own original research work which has not been published, simultaneously submitted, or already accepted for publication elsewhere.
“I have the consent of the co-authors for this submission and I/we transfer the ownership of the copyright to the publisher, in the event of publication of this article.”
The covering letter should contain a complete mailing address of the principal author. The Editor-in-Chief/Editor may acknowledge the receipt of the same, as well as, handle all future correspondence.
Manuscript Preparation
All parts of the manuscript should be typewritten, single spaced page 8½´ × 11´, with margins of at least 2.5 cm on all sides. Number of manuscript pages should be consecutively throughout the paper. Each manuscript should include title page, the second title page and text, and may contain up to 6 pages. Authors should also supply a shortened version of the title suitable for the running head, not exceeding 30 characters with spaces. Each article should be summarized in an abstract. Abstracts should be accompanied by three to five keywords that will facilitate indexing and data retrieval purposes.
The title page should contain the title of the study and the names, qualifications, employment status, the employing institution and the place and state, of all the authors. The title being brief should not contain the words like ‘A Study of or ‘A Probe into’ etc.
The second title, the page following the title page should contain the title of the study, abstract and key words. The numbering of pages should begin here. The third pages should contain the text including introduction, methodology, results, discussion conclusion, and references. All these heads are to be typed on the left hand in upper lower type, in case there are no subheads like purpose of the study, review of literature, hypotheses, and limitations of the study and its implications. When there are sub-heads, the heads are to be typed in all capitals and the sub-heads in upper-lower type letters. Abbreviations must be spelt.
Abstract
The abstract should be self-explanatory, of about 150 words; suitable for use by the abstracting journals, without rewording and should state what was aimed, what was done, what was found and what was concluded. For the review article, the abstract should be a concise summary.
Keywords
Following the abstract, the author should list not more than six key words that do not appear in the title, that represent the content of the manuscript.
Introduction
This describes the present state of knowledge of the subject or the review of the literature, the concise statement of the problem, the aim of the research, and the development of the research hypotheses. It should include the practical and applied questions around which the study was developed.
55
International Journal of Physical Education, Sports and Yogic Sciences Vol. 1 No. 1 (November, 2011)
Methodology
This section should include a complete description of subjects, materials, equipments, procedures and experimental techniques. It should also include the description of the statistical methods used to analyze the data. The methods and the statistical procedures published in detail beforehand should be cited. Units of measurement, symbols and abbreviations must conform to the international standards. Metrics system is preferred.
Results and Discussion
This section should include a concise presentation of the data. Figures, tables and photographs may be used to show the results of the study. Tables and figures should not be used for the presentation of the same data. The subjects must not be identified by name or any other recognizable label.
The discussion part should contain the interpretation of the results with possible comparisons with other relevant studies. The discussion must be rigorous and correspond to the data and the hypothesis New-hypothesis, if any, may be stated. Recommendations, if any, question of practical application, consistent with the limitations of the study, may be included.
Conclusions
This should briefly state the conclusions drawn from the study. Conclusions should not be drawn without any supporting data.
References
All sources, cited in the text, must be also cited in the reference list. The reference list includes circulated material, i.e., books, journal, proceedings, films, etc.
Tables
Each table should be typed on separate sheets, numbered consecutively in Roman numerals at the top centre, and given collectively after the references. Each table should have a brief but meaningful title which should start next to the Table Number after colon. Explanatory matter and non-standard abbreviations should be given in the footnote, and not below the title. Tables should be referred in the text.
Illustrations
All figures and illustrations should be either artwork in black ink on Art Card or 5” x 7” glossy prints. The photographs should be glossy black and white having good contrast. The letters used in the illustrations and photographs should be of sufficient size to withstand reduction to single column size. Figures should be numbered in Arabic numerals. Captions of photos and illustrations and the legends should be typed on a separate sheet. All illustrations must be identified on the back by gently writing in ink or pencil, indicating illustration number and the author.
Art work should be done professionally, Art work carried out by the publishers, out of necessity, would be charged to the authors.
Compact Disk (CD)
The authors must send a Compact disk (CD) containing the material meant for publication, to facilitate printing.

56
International Journal of Physical Education, Sports and Yogic Sciences (Quarterly Publication)
Board of Referees
Dr. T. S. Brar
Dr. G. P. Gautam
Dr. M. I. Quraishi
Dr. Javed Ali Khan, Professor
Dr. R. C. Kapil, Professor
Dr. Gopal Krishan Dubey
Dr. Jagtar Singh Gill
Dr. Anil Karwande
Dr. S. Mukherjee, Professor
Dr. Bhupinder Singh, Professor
Dr. Dilip Dureha, Professor
Dr. Vijay Shrivastva, Professor
Dr. Govindarajulu, Professor
Dr. A. S. Sajwan, Professor
Dr. Anil Karwande, Professor
Dr. Reeta Venugopal, Professor
Dr. Vivek Pandey, Professor
Dr. (Mrs) Alka Nayak, Professor
Dr. (Mrs) Sushma Ghidyal, Professor
Dr. Guru Dutt Ghai, Professor
Dr. Ikram Hussain, Professor
Dr. Rajesh Tripathi, Professor
Dr. Ajay Kumar, Professor
Dr. B. C. Kapri, Professor
Dr. Shailendra Sinha
Dr. K. K. Khare
Dr. Kalpna Sharma
Dr. Jai Shree Acharya
Dr. Sophy Titus
Dr. C. D. Agashe
Dr. Rajender Singh
Dr. Brij Kishore
Dr. Brij Bhushan Singh
Dr. Ajay Karkare
Dr. Harsh Yadav
Dr. Raj Kumar Sharma
Dr. Aman Singh Sisodiya
Dr. C. P. S. Bhatti
Dr. K. M. Valsraj
Dr. Pramod Shastri
Dr. H. S. Athwal
Dr. Shyam Narayan Singh
Dr. Ranjeet Singh Pawar
Dr. Rajesh Yohan

57
SUBSCRIPTION FORM 1. Name :- Individual _ _ _ _ _ _ _ _ _ _ _ _ _ _ _ _ _ _ _ _ _ _ _ _ _ _ _ _ _ Institution _ _ _ _ _ _ _ _ _ _ _ _ _ _ _ _ _ _ _ _ _ _ _ _ _ _ _ _ _ _ _ _ _ _ _ _ _ _ _ _ _ _ _ _ _ _ _ _ _ _ _ _ _ _ _ _ _ _ _ _ _ _ _ _ _ _ _ _ _ _ _ _ _ _ _ _ _ _ _ _ _ _ _ _ _ _ _ 2. Mailing address of the subscriber _ _ _ _ _ _ _ _ _ _ _ _ _ _ _ _ _ _ _ _ _ _ _ _ _ _ _ _ _ _ _ _ _ _ _ _ _ _ _ _ _ _ _ _ _ _ _ _ _ _ _ _ _ _ _ _ _ _ _ _ _ _ _ _ _ _ _ _ _ _ _ _ _ _ _ _ _ _ _ _ _ _ _ _ _ _ _ District _ _ _ _ _ _ ___ State _ _ _ _ _ _ Country _ _ _ _ _ _ 3. e-mail _ _ _ _ _ _ _ _ _ _ _ _ _ _ _ _ _ _ _ _ _ _ _ _ _ _ _ _ _ _ 4. Telephone No. _ _ _ _ _ _ _ _ _ _ Mobile _ _ _ _ _ _ _ _ _ _ _ _ _ _ 5. Mode of Payment (DD/Bank Transfer) Amount _ _ _ _ _ _ _ _ _ _ date _ _ _ _ _ _ _ _ _ _ Payment in favor of :-
International Journal of Physical Education, Sports and Yogic Sciences Bank A/c No: 32021296564 Branch: DAVV Indore Branch Code: 30389 IFS Code: sbi 30389 (Signature)
Note Subscription amount Individual Rs. 1200/- Institutional Rs. 2000/-