Embed Size (px)
Citation preview

International Journal of Multidisciplinary and Current Research ISSN: 2321-3124
Research Article Available at: http://ijmcr.com
1190|Int. J. of Multidisciplinary and Current research, Vol.4 (Nov/Dec 2016)
Morphometric Analysis of a Kosi River Basin, Uttarakhand using Geographical Information System Parvaiz Ahmad Ganie, Ravindra Posti, Prem Kumar and A K Singh ICAR- Directorate of Cold Water Fisheries Research, Bhimtal, Uttarakhand – 263136, India
Accepted 05 Dec 2016, Available online 11 Dec 2016, Vol.4 (Nov/Dec 2016 issue)
Abstract Geographical Information System (GIS) tools can be used for morphometric analysis for characterizing the hydrological response behavior of the watershed. The Kosi river in Uttarakhand, India is an important tributary of the Ganga River system that provides a water supply for irrigation, power generation, and public supply. The river also harbors a wide range of fish biodiversity and support livelihood to inhabitants through fishing, sports fishing, and aqua-tourism. Keeping the view of its importance, River Kosi was thus selected for morphometric analysis using Advanced Spaceborne Thermal Emission and Reflection (ASTER) data and toposheets of Survey of India. Morphometric parameters such as linear, aerial and relief characteristics were computed. The river basin length was measured as 116.14Km with a drainage area of 2101.83Km
2. The stream order designated as seventh order basin with dendritic drainage pattern
having drainage density value of 1.89 Km/Km2. The present hydrological investigation is inevitable in development and
management of drainage basin. Moreover, the study can also be referred as a benchmark for studies on temporal change in geomorphology due to climate change. Keywords: Morphometric parameters, Kosi river basin, Drainage area, ASTER, GIS 1. Introduction
Morphometry is the measurement and mathematical analysis of the configuration of the earth’s surface, form and dimension of its landforms [1], [2], [3].Morphometric analysis is a valuable technique to evaluate and understand the behavior of the hydrological system. Morphometric examination of a river basin offers a quantitative account of the drainage system, which is an essential aspect of the characterization of basins [4] . The morphometric analysis is done successfully by measuring of linear, aerial, relief, gradient of channel network and contributing ground slope of the basin [5], [6], [7], [8]. A widely acknowledged principle of morphometry is that drainage basin morphology reflect various geological and geomorphological processes over time, as revealed by various morphometric studies [9], [10,4], [11], [12], [13,14], [15], [16], [17], [18], [19], [20], [21]. It is very well documented that the influence of drainage morphometry is very substantial in deducing the landform processes, soil physical properties, and erosional characteristics. Drainage network provides basics to be aware of the initial gradient, the disparity in rock resistance, structural control, geological and geomorphologic history of the drainage basin or watershed. Assessment of morphometric parameters requires the analysis of various drainage parameters such as the ordering of several
streams, measurement of basin area and perimeter, drainage channel length, bifurcation ratio (Rb) drainage density (Dd), relief ratio (Rh) and stream length ratio (RL). Also, the quantitative analysis of drainage system is a fundamental aspect of a characteristic of watershed [4] . It is vital for any hydrological investigation like an assessment of groundwater potential, groundwater management, basin management and environmental assessment. Drainage basins are the elementary units to
comprehend geometric characteristics of fluvial
landscape, such as topology of stream networks, and
quantitative picture of drainage texture, pattern, shape
and relief features [22], [23]. Conventional methods have
been used in different parts of the globe for studying the
drainage characteristics of many river basins and sub-
basins [9], [24,4], [25]. For morphometric analysis of river
basins, the remote sensing technique is the convenient
method as the satellite images provide an overall view of
a large area and are thus subastantial in analysing
drainage basin morphometry. Most of the complications
of land and water resources planning and management
can be overcome with the help of useful tools of spatial
information technology, remote sensing, GIS, and GPS in
comparison to conventional methods of data process
[26].

Parvaiz Ahmad Ganie et al Morphometric Analysis of a Kosi River Basin, Uttarakhand using Geographical Information System
1191 | Int. J. of Multidisciplinary and Current research, Vol.4 (Nov/Dec 2016)
Assesment with Shuttle Radar Topographic Mission (SRTM) and Advanced Spaceborne Thermal Emission and Reflection Radiometer (ASTER) data has given a clear-cut, fast, and an economical way for analyzing hydrological systems in GIS environment [27], [28]. The processed DEM can be used successfully for generating the stream network and other supporting layers [29], [30]. Remote sensing satellite data in combination with the hydrological and spatial analysis is made easy to identify and discriminate the drainage area in GIS environment [31]. For hydrological investigations involving the assessment of groundwater potential, etc. the geographic and geomorphic characteristics of a drainage basin are very much essential. The present study targets to compute various parameters of morphometric characteristics of the Kosi River basin using the remote sensing and GIS technology.
This is inconcinnity with the latest developments and researches as cited above. 2. Materials and Methods 2.1 Study area The Kosi River (79°30'52.216" E 29°51'43.363"N to 79°6'0.94"E 29°13'33.517"N) is an important tributary of the River Ganga. The total geographical area of the basin is 2101.83 km2.It flows through the Indian state of Uttarakhand (Fig.1).It originates from the Dharpanidhar in the baramandal region of Almora district in Kumaon, Uttarakhand, India. After arising out of dharpanidhar, it flows through the valleys and towns of Ramnagar, carries with it a reasonable amount of Kumaon’s abundant monsoons, and finally leaves at Ram Nagar.
Fig. 1 Location map of study site

Parvaiz Ahmad Ganie et al Morphometric Analysis of a Kosi River Basin, Uttarakhand using Geographical Information System
1192 | Int. J. of Multidisciplinary and Current research, Vol.4 (Nov/Dec 2016)
Fig.2 Automatic extraction of Streams through ASTER data
Table: 1 Stream order, Stream number and Bifurcation ratios in Kosi river basin
U Nu Rb Nu - r Rb * Nu - r Rbwm
I 7363
II 3302 2.22 10665 23781.46
III 1670 1.97 4972 9830.86
IV 52 32.11 1722 55302.69 7.92
V 14 3.71 66 245.14
VI 4 3.50 18 63
VII 1 4.00 5 20
Total 12406 47.53
Mean 7.92
U: stream order; Nu: Number of streams; Rb: Bifurcation ratios; Rbm: Mean bifurcation ratio Nu-r: Number of stream s used in the ratio; Rbwm: Weighted mean bifurcation ratio
Table: 2 Stream length and Stream length ratio in Kosi river basin
U LU Lsm RL LU+LU LU* RL RLw
I 1867.6 0.25
II 1026.3 0.31 .54 2893.9 1590.28
III 525.3 0.31 .51 1551.6 794.16
IV 250.1 4.80 .47 775.4 369.17
V 144.8 10.34 .57 394.9 228.63 .68
VI 57.5 14.37 .39 202.3 80.33
VII 90.6 90.6 1.57 148.1 233.35
Total 3962.2 121.00 4.05
Mean .675
U: Stream order; LU: Stream length; Lsm: Mean stream length; RL: Stream length ratio; RLw: Weighted Mean stream length Ratio*, LU+LU: Stream length used in the ratio.

Parvaiz Ahmad Ganie et al Morphometric Analysis of a Kosi River Basin, Uttarakhand using Geographical Information System
1193 | Int. J. of Multidisciplinary and Current research, Vol.4 (Nov/Dec 2016)
Table: 3 Results of Kosi river basin characteristics
Sr.no Morphometric parameter Formula Reference Result
1 Stream Order (U) Hierarchical Rank Strahler (1952) 1 to 7
2 1st Order Stream (Suf) Suf = N1 Strahler (1952) Strahler (1952) 7363
3 Stream Number (Nu) Nu = N1+N2+…Nn Horton (1945) 12406
4 Stream Length (LU) Lu = L1+L2 …… Strahler (1964) 3962.2
5 Stream Length Ratio (RL) see Table Strahler (1964) .47 to 1.57
6 Mean Stream Length Ratio (RLm) see Table Horton (1945) .675
7 Weighted Mean Stream Length Ratio (RLwm) see Table Horton (1945) .68
8 Bifurcation Ratio (Rb) see Table Strahler (1964) 1.97 to 32.11
9 Mean Bifurcation Ratio (Rbm) see Table Strahler (1964) 7.92
10 Weighted Mean Bifurcation Ratio (Rbwm) see Table Strahler (1952) 7.92
B Basin Geometry
11 Basin Length (Lb) Km 1.312*A 0.568 Schumm(1956) 116.14
12 Mean Basin Width (Wb) Wb = A / Lb Horton (1932) 18.10
13 Basin Area (A) Sq Km GIS Software Analysis Schumm(1956) 2101.83
14 Basin Perimeter (P) Km GIS Software Analysis Schumm(1956) 332.69
15 Relative Perimeter (Pr) Pr = A / P Schumm(1956) 6.32
16 Length Area Relation (Lar) Lar = 1.4 * A 0.6 Hack (1957) 137.94
17 Lemniscate’s (k) k = Lb2/4A Chorley (1957) 5.04
18 Form Factor Ratio (Rf) Ff = A / Lb2 Horton (1932) 0.015
19 Shape Factor Ratio (Rs) Sf = Lb2/4A Horton (1945) 5.04
20 Elongation Ratio (Re) Re=D/L=1.128A/L Schumm (1956) 0.44
21 Texture Ratio (Rt) Rt = N1 / P Schumm(1956) 22.13
22 Circularity Ratio (Rc) Rc = 12.57 * (A /p2) Miller (1953) 0.24
23 Circularity Ration (Rcn) Rcn = A / P Strahler (1964) 6.31
24 Drainage Texture (Dt) Dt = Nu / P Horton (1945) 37.28
C Drainage Texture Analysis
26 Stream Frequency (Fs) Fs = Nu / A Horton (1932) 5.90
27 Drainage Density (Dd) Km / Km2 Dd = Lu / A Horton (1932) 1.89
28 Constant of Channel Maintenance (Km2 / Km) C = 1 / Dd Schumm(1956) 0.53
29 Drainage Intensity (Di) Di = Fs / Dd Faniran (1968) 3.12
30 Infiltration Number (If) If = Fs * Dd Faniran (1968) 11.15
31 Drainage Pattern Horton (1932)
32 Length of Overland Flow (Lg) Lg = 1/2Dd Horton (1945) 0.265
D Relief Characteristics
33 Height of Basin Mouth(z) m GIS Analysis / DEM 238
34 Maximum Height of the Basin (Z) m GIS Analysis / DEM 2714
35 Total Basin Relief (H) m H = Z - z Strahler (1952) 2476
36 Relief Ratio (Rhl) Rhl = H / Lb Schumm (1956) .021
37 Relative Relief Ratio (Rhp) Rhp = H * 100 / P Melton (1957) .74
38 Gradient Ratio (Rg) Rg = (Z - z) / Lb Sreedevi (2004) .021
39 Watershed Slope Sw = H / Lb .021
40 Ruggedness Number (Rn) Rn = Dd * (H /1000) Patton & Baker (1976) 4.67
41 Melton Ruggedness Number (MRn) MRn = H / A0.5 Melton (1965) 54.007
2.2 Methodology and Data Source Automatic extraction techniques were used to evaluate the morphometric parameters of a basin, i.e. extraction of River basin boundary and extraction of drainage/stream network from the Kosi River basin using ASTER DEM in conjunction with georeferenced Survey of India (SOI)toposheets of 1963-64 (53-O/9,53-O/10, 53-O/6,53-O/7,53-O/2,53-O/3,53-O/4 having 1:50,000 scale) using ARC GIS-10.1. The extracted basin and stream networks were projected to the regional projection (WGS-1984, UTM Zone 43 N).The different morphometric parameters determined are shown in Table 3. 2.3 Extraction of Kosi river drainage network
The drainage network of the Kosi River basin was extracted from a series of geoprocessing tools in ARC GIS-10.1(Fig. 1).The result of this method is a basis for generating a stream/ drainage network grid with stream
order based on Strahler [4]. The highest stream order in the Kosi river basin was identified as seventh. For creating a stream psegment by employing such procedure two input model parameters are involved, DEM and a minimum upstream area in hectares [31]. Smooth line tool in ArcGIS-10.1. was used for smoothening the output of drainage network.For evaluating the drainage basin morphometry, a number of parameters like linear aspects were calculated by means of the methods of Horton [9], Strahler [10], Chorley[33], the aerial aspects by employing those of Horton [34] , Miller [35], Schumm [36], Strahler [37,38] and the relief aspects by using the techniques of Horton [9], Melton [39] ,Schumm [40], Strahler [10] and Pareta [41]. The Drainage density and frequency distribution investigation of the basin area were done using the spatial analyst tool in ArcGIS-10.1 software. Besides, the aspect and slope map of the study area were also derived from the ASTER DEM with the help of the aspect and slope tool in ArcGIS-10.1 spatial analyst module (Fig.3).

Parvaiz Ahmad Ganie et al Morphometric Analysis of a Kosi River Basin, Uttarakhand using Geographical Information System
1194 | Int. J. of Multidisciplinary and Current research, Vol.4 (Nov/Dec 2016)
Fig.3 Aspect map (a), slope map (b), relief map (c) and stream order (d) of Kosi River basin
Fig.4 Triangular Irregular Network model (a), drainage density map (b) and perspective views of digital terrain model (DTM) at different angles (c) of Kosi River basin

Parvaiz Ahmad Ganie et al Morphometric Analysis of a Kosi River Basin, Uttarakhand using Geographical Information System
1195 | Int. J. of Multidisciplinary and Current research, Vol.4 (Nov/Dec 2016)
3. Results and Discussion The consequent subsections elucidate the substantial significance of several morphometric parameters. Further values of these parameters are obtained as per methods proposed by various researchers for the study area and indicated in respective descriptions. The morphometric parameters of Kosi River basin have been calculated and the results are given in the Table1, 2 and 3. The total drainage area of the Kosi River basin is 2101.83 km
2.The drainage pattern is dendritic in nature and it is
influenced by the general topography, geology and rainfall condition of the area. Aster DEM was used to prepare slope, aspect and contour maps. Based on the stream order, the Kosi river basin is classified as 7
thorder
basin to interpret the morphodynamic parameters as listed in Table 3. 3.1 Linear aspects 3.1.1 Stream Order (Su) The labelling of stream orders is the first step in drainage basin analysis. Basically there are four different systems of ordering streams [42], [9], [10], [43]. In the currentt study, ranking of streams is based on the method proposed by Strahler [4] because of its simplicity. Actually it is a slight modification of Hortons system. The stream orders are classified up to seven orders in the Kosi river basin. Details of stream order of numerous tributaries of Kosi Rivera are shown in the Table1. Kosi river could be designated as a 7
th order stream (Fig.2 and Table 1). The
maximum stream order frequency is witnessed in case of first-order streams and then for second order. Hence, it is perceived that there is a decrease in stream frequency as the stream order increases and vice versa. 3.1.2 Stream length (LU) Streams lengths demarcate the total lengths of stream segment of each of the sequential orders in a basin tend to approximate a direct geometric series in which the first term is the average length of the stream of the first order[9]. The stream length is a measure of the hydrological characteristics of the bed-rock and the drainage magnitude. Sethupathi et al. [44] stated that length and frequency of streams in an area depends on the bed rock and formation permeability i.e, higher permeable areas will have more and length stream network and vice-versa.The result of order-wise stream length in kosi river basin is shown in Table 2. It is clearly evident that the cumulative stream length is highest in first-order streams and decreases as the stream order tends to increase.The change may designate flowing of streams from high altitude, lithological variation and moderately steep slopes [45]. The investigation of stream order corroborates the Horton’s law of stream number i.e.
there exists an inverse relationship between stream order with stream number.The highest stream order (7
th ), i.e.,
for Kosi River has a length of 90.6 Km.Stream length of different orders under Kosi River basin is given in Table2. 3.1.3 Mean Stream Length (Lsm) Mean stream length (Lsm) reveals the characteristic size of components of a drainage network and its contributing surface [4]. It has been calculated by dividing the total stream length of order ‘SU’ by the number of stream segments in the order (Table 2). The Lsm values for the Kosi River basin range from 0.47 to 1.57 (Table 2) with a mean Lsm value of .675. It is to be noted that Lsm value of any stream order is higher than that of its lower order and lower than that of successive higher orders in the basin. The Lsm values also differs with respect to different basins, as it is directly proportional to the size and topography of the basin. Strahler [4] designated that the Lsm is a characteristic property connected to the size of drainage network and surfaces associated. Mean stream length (km) of Kosi river basin based on stream order is shown in the Table 2. 3.1.4 Stream Length Ratio (RL) Horton’s law *9 +of stream length illustrates that mean stream length of each of the sequential orders of a basin inclines to approximate a direct geometric series with stream length increasing towards higher order of streams. The stream length ratio of Kosi River basin showed an increasing trend Table 2. The stream length ratio between the streams of different orders of the Kosi river basin shows a change (Table 2). This difference might be credited to variation in slope and topography, thus representing the later geomorphic developmental stages in the streams of the Kosi basin [45], [46]. 3.1.5 Bifurcation Ratio (Rb) Schumn [36] defined bifurcation ratio (Rb) as, the ratio of the number of the stream segments of specified order to the number of segments of the next higher orders. Horton [9] considered Rb as an index of relief and dissection while Strahler [4] revealed that the bifurcation ratio shows a small degree of variation for different regions or various environmental conditions, except where the geology dominates. It is a dimensionless property and displays the level of integration existing between streams of different orders in a drainage basin. The Rb for the Kosi river basin varies from 1.97 to 32.11(Table 1). The values of bifurcation ratio characteristically range between 3.0 and 5.0 for drainage basin in which the geological structures do not disturb the drainage pattern [4]. The mean bifurcation ratio (Rbm) typically ranges between 3.0 and 5.0 for a basin when there is the negligible influence of geological structures on the drainage network [47]. Thus, Verstappen [47]

Parvaiz Ahmad Ganie et al Morphometric Analysis of a Kosi River Basin, Uttarakhand using Geographical Information System
1196 | Int. J. of Multidisciplinary and Current research, Vol.4 (Nov/Dec 2016)
favours the opinion of Strahler [4] . In the Kosi River basin, the lower values of Rb indicate that the sub-basins are less affected by structural disturbances, whereas the higher values indicate an active structural control in the drainage pattern [4] [46], [48]. 3.1.6 Weighted Mean Bifurcation Ratio (Rbwm) Weighted mean Bifurcation ratio was used by Strahler [10] so as to arrive at a more typical bifurcation number. It is achieved by multiplying the bifurcation ratio for each sequential pair of orders by the cumulative numbers of streams involved in the ratio and taking the mean of the sum of these values. The mean bifurcation ratio of 2.12 of the drainage of Perth Amboy, N.J.was obtained by Schumm [36] by using this method.The values of the weighted mean bifurcation ratio thus determined are very close to each other Table 1. 3.2 Basin Geometry 3.2.1 Length of the Basin (Lb) Schumm [36] defined the basin length as the longest dimension of the basin parallel to the major drainage line while Gardiner [49] determined it, the length of the line from a basin mouth to a point on the perimeter in between from the basin mouth in either direction around the perimeter. The basin length of Kosi River basin by the definition of Schumm [36] was estimated to be about 116.14 Km. 3.2.2 Basin Area (A) Basin area forms an important parameter in the delineation of basin geometry. Schumm [36] established an interesting relation between the total watershed areas and the total stream lengths, which are sustained by the contributing areas. The basin area computed was 2101.83 Km
2.
3.2.3 Basin Perimeter (P) Basin perimeter is estimated along the divides between watersheds and is used as an indicator of basin size and shape. It is the outer boundary of the basin of the area enclosed. The basin perimeter was measured to be 332.69 Km.
3.2.4 Length Area Relation (Lar)
Hack [50] identified that for various basins, the basin area and stream length are related by a simple power function as follows: Lar = 1.4 * A
0.6.The Lar value computed was
137.94. 3.2.5 Lemniscates (k) Lemniscate’s value is used to determine the shape and slope of the basin. It is estimated by using the formula k =
Lb2/4A [33]. Where, Lb is the basin length (Km) and A is
the area of the basin (km2).The ideal Lemniscate’s value
of elongated basins varies from 0.50 to 1.80and the Lemniscates (k) value for the Kosi River basin is 5.04 which shows that the watershed occupies the maximum area in its regions of inception with large number of streams of higher order. 3.2.6 Form factor (Rf) Form factor is defined as the ratio of the area of the basin and square of the basin length [34]. For perfectly circular basin its value would always be greater than 0.78. Smaller the value of form factor, more elongated will be the basin and vice versa. Rf value of the Kosi River basin is 0.015 (Table 3). Thus, the Kosi river basin is more elongated in nature. 3.2.7 Circularity ratio (Rc) The circularity ratio is mainly influenced by geological structures, land use/land cover, the length, and frequency of streams, climate, relief and slope of the basin [48]. Miller [35] stated circularity ratio as the ratio of the area of the basins to the area of circle having the same circumference as the perimeter of the basin. This is mainly due to the diversity of slope and relief pattern of the basin. It is a significant ratio that shows the dendritic stage of a watershed [35]. Low, medium and high values of Rc designate the young, mature, and old stages respectively of the lifespan of the tributary watershed [51]. Rc value of Kosi river basin is 0.24 thereby reflecting the Kosi river basin to be of young nature [34], [46] . 3.2.8 Texture Ratio (Rt) Texture ratio is the significant factor in the drainage morphometric analysis.The texture ratio is stated as the ratio of the first order streams and perimeter of the basin (Rt = Nl / P), and it hinge on the underlying lithology, infiltration capacity and relief aspects of the terrain [36]. The texture ratio of Kosi River basin was computed to be about 22.13. 3.2.9 Elongation Ratio (Re) Schumm [36] defined elongation ratio (Re) as, the ratio of diameter of a circle having the same area as that of the basin and maximum basin length. Strahler [4] stated that this ratio ranges between 0.6 and 1.0 over varied climatic and geologic kinds. The changing slopes of watershed/basins can be classified by the index of elongation ratio, i.e. circular (0.9-0.10), oval (0.8-0.9), less elongated (0.7-0.8), elongated (0.5-0.7), and more elongated (<0.5). An elongated basin is less efficient in runoff discharge than a circular basin basin [45]. Re value of the study area was computed to be 0.44 thus indicating it to be of more elongated nature. Higher values of Re
Parvaiz Ahmad Ganie et al Morphometric Analysis of a Kosi River Basin, Uttarakhand using Geographical Information System
1197 | Int. J. of Multidisciplinary and Current research, Vol.4 (Nov/Dec 2016)
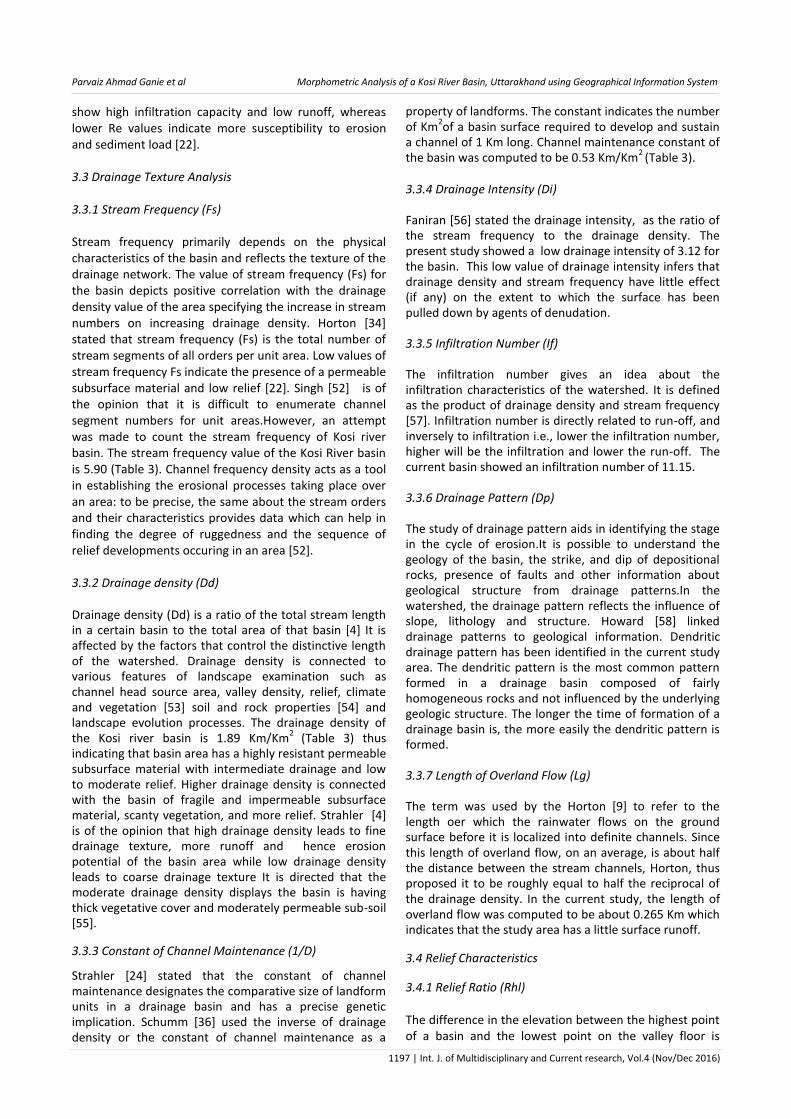
show high infiltration capacity and low runoff, whereas lower Re values indicate more susceptibility to erosion and sediment load [22]. 3.3 Drainage Texture Analysis 3.3.1 Stream Frequency (Fs) Stream frequency primarily depends on the physical characteristics of the basin and reflects the texture of the drainage network. The value of stream frequency (Fs) for the basin depicts positive correlation with the drainage density value of the area specifying the increase in stream numbers on increasing drainage density. Horton [34] stated that stream frequency (Fs) is the total number of stream segments of all orders per unit area. Low values of stream frequency Fs indicate the presence of a permeable subsurface material and low relief [22]. Singh [52] is of the opinion that it is difficult to enumerate channel segment numbers for unit areas.However, an attempt was made to count the stream frequency of Kosi river basin. The stream frequency value of the Kosi River basin is 5.90 (Table 3). Channel frequency density acts as a tool in establishing the erosional processes taking place over an area: to be precise, the same about the stream orders and their characteristics provides data which can help in finding the degree of ruggedness and the sequence of relief developments occuring in an area [52]. 3.3.2 Drainage density (Dd) Drainage density (Dd) is a ratio of the total stream length in a certain basin to the total area of that basin [4] It is affected by the factors that control the distinctive length of the watershed. Drainage density is connected to various features of landscape examination such as channel head source area, valley density, relief, climate and vegetation [53] soil and rock properties [54] and landscape evolution processes. The drainage density of the Kosi river basin is 1.89 Km/Km
2 (Table 3) thus
indicating that basin area has a highly resistant permeable subsurface material with intermediate drainage and low to moderate relief. Higher drainage density is connected with the basin of fragile and impermeable subsurface material, scanty vegetation, and more relief. Strahler [4] is of the opinion that high drainage density leads to fine drainage texture, more runoff and hence erosion potential of the basin area while low drainage density leads to coarse drainage texture It is directed that the moderate drainage density displays the basin is having thick vegetative cover and moderately permeable sub-soil [55].
3.3.3 Constant of Channel Maintenance (1/D)
Strahler [24] stated that the constant of channel maintenance designates the comparative size of landform units in a drainage basin and has a precise genetic implication. Schumm [36] used the inverse of drainage density or the constant of channel maintenance as a
property of landforms. The constant indicates the number of Km
2of a basin surface required to develop and sustain
a channel of 1 Km long. Channel maintenance constant of the basin was computed to be 0.53 Km/Km
2 (Table 3).
3.3.4 Drainage Intensity (Di) Faniran [56] stated the drainage intensity, as the ratio of the stream frequency to the drainage density. The present study showed a low drainage intensity of 3.12 for the basin. This low value of drainage intensity infers that drainage density and stream frequency have little effect (if any) on the extent to which the surface has been pulled down by agents of denudation. 3.3.5 Infiltration Number (If) The infiltration number gives an idea about the infiltration characteristics of the watershed. It is defined as the product of drainage density and stream frequency [57]. Infiltration number is directly related to run-off, and inversely to infiltration i.e., lower the infiltration number, higher will be the infiltration and lower the run-off. The current basin showed an infiltration number of 11.15. 3.3.6 Drainage Pattern (Dp) The study of drainage pattern aids in identifying the stage in the cycle of erosion.It is possible to understand the geology of the basin, the strike, and dip of depositional rocks, presence of faults and other information about geological structure from drainage patterns.In the watershed, the drainage pattern reflects the influence of slope, lithology and structure. Howard [58] linked drainage patterns to geological information. Dendritic drainage pattern has been identified in the current study area. The dendritic pattern is the most common pattern formed in a drainage basin composed of fairly homogeneous rocks and not influenced by the underlying geologic structure. The longer the time of formation of a drainage basin is, the more easily the dendritic pattern is formed. 3.3.7 Length of Overland Flow (Lg) The term was used by the Horton [9] to refer to the length oer which the rainwater flows on the ground surface before it is localized into definite channels. Since this length of overland flow, on an average, is about half the distance between the stream channels, Horton, thus proposed it to be roughly equal to half the reciprocal of the drainage density. In the current study, the length of overland flow was computed to be about 0.265 Km which indicates that the study area has a little surface runoff.
3.4 Relief Characteristics
3.4.1 Relief Ratio (Rhl) The difference in the elevation between the highest point of a basin and the lowest point on the valley floor is

Parvaiz Ahmad Ganie et al Morphometric Analysis of a Kosi River Basin, Uttarakhand using Geographical Information System
1198 | Int. J. of Multidisciplinary and Current research, Vol.4 (Nov/Dec 2016)
known as the total relief of the river basin. Schumm [36] defined relief ratio as the ratio between the total relief of a basin and the longest dimension of the basin parallel to the main drainage line. Schumm [59] also stated that it is a dimensionless height-length ratio being equal to the tangent of the angle formed by two planes traversing at the mouth of the basin, one showing the horizontal and another crossing through the highest point of the basin.In the study area, the relief ratio computed was 0.021. Low relief ratios are because of resistant basement rocks of the basin and lower degree of slope[60]. The Rhl usually increases with decreasing drainage area and size of a given drainage basin [61]. 3.4.2 Relative Relief (Rhp) Gayen et al. [62] stated that relative relief is an important morphometric variable used for the assessment of morphological characteristics of any topography. The highest relative relief is calculated as 2476 m, while the lowest value is recorded as 238m (Fig. 3). Melton’s *39+ relative relief was also calculated by: Rhp = (H*100) / P, where P is perimeter in meters. The low Rhp designates that the northern area under Kosi river basin is having flat to gentle slope. Thus, the area could be basically used for agricultural activities around stream sides due to being flat in nature and also because of water accessibility. 3.4.3 Ruggedness Number (Rn) Strahler’s *38+ ruggedness number is the product of the basin relief and the drainage density and usefully combines slope steepness with its length. The ruggedness number of the Kosi River basin thus calculated was 4.67.The low Rn of the basin implies that area is less disposed to soil erosion and is having intrinsic structural complexity in association with relief and drainage density. 3.4.4 Melton Ruggedness Number (MRn) The MRn is a slope index that provides specialized picture of relief ruggedness within the watershed [63]. Kosi River basin has has an MRn of 54.007. As per the Wilford et al. [64] classification, this watershed is debris flood watersheds, where bed load component dominated sediment under transport. 3.4.5 Gradient Ratio (Rg) Gradient ratio implies channel slope thus allows to assess the runoff volume [65]. Kosi river basin is having Rg of .021 thus reflecting the mountainous nature of the terrain. Conclusion For any hydrological study the morphometric analysis of its drainage system is prerequisite. So, determination of stream networks’ behaviour and their interrelation with
each other is of utmost importance in majority of aquatic resources studies. Remote sensing satellite data together with GIS techniques have proved to be a effective tool in drainage delineation. Their update in combination with old datasets brings an encouraging picture thus facilitating geomorphologist to deduce solid conclusion about the drainage basin.In the present study, morphometric analysis of the Kosi River basin has been delineated, based on several drainage parameters using SOI toposheets, remote sensing satellite data and latest GIS tools for drainage analysis.The kosi River basin is well drained with the stream order varying from 1 to 7. The basin is having large number oflower order streams and thecumulative length of stream segments is maximum in first order streams. Kosi river basin is an elongated basin with moderate relief and steep slope due to the lower elongation ratio 0.44. Stream frequency and drainage density are the key criterion for the morphometric grouping of drainage basins, which certainly regulate the runoff pattern, sediment yield, and other hydrological parameters of the drainage basin. The Dd appears to be lower in kosi river basin area, which indicates the existence of impermeable rocks and moderate relief, triggering more infiltration and great groundwater prospects. The quantifiable analysis of linear, relief and aerial parameters using GIS is found to be of enormous utility in river basin evaluation, basin prioritization for soil and water conservation and natural resource management. The geo-processing techniques employed in this study will assist the planners and decision makers in basin development and management studies. Acknowledgement The authors are very thankful to the Survey of India (SOI) for creating and distributing toposheets of the study area: Obviously, this analysis could have been more hectic and time taking if they have not carried such kind of work. Moreover, the authors are also thankful to the ICAR-DCFR, for creating and establishing such facility in the Institute which enabled us to undertake such endeavors.
References
[1] J.I. Clarke, (1996), Morphometry from Maps. Essays in geomorphology.Elsevier publication. Co., New York, pp 235–274. [2] C.S. Agarwal, (1998), Study of drainage pattern through aerial data in Naugarh area of Varanasi district, U.P. J Indian Soc Remote Sens 26:169–175. [3 ] G. P. Obi Reddy, A. K. Maji, and K. S. Gajbhiye, (2002) GIS lndia, (11), 4: pp 9-14. [4] A.N. Strahler, (1964), Quantitative Geomorphology of Drainage Basin and Channel Network. Handbook of Applied Hydrology.39-76. [5] S.A. Ali, (1988), Morphometric Analysis of the Hiyunl River Basin at Rishikesh, Garhwal Himalayas, India.Proceedings of the IX Asian Conference on Remote Sensing, Bangkok, 23-29 November, B-9-1-B-9-8. [6] M.D. Nautiyal, (1994), Morphometric analysis of a drainage basin, district Dehradun, Uttar Pradesh. J Indian Soc Remote Sens 22(4):251–261.

Parvaiz Ahmad Ganie et al Morphometric Analysis of a Kosi River Basin, Uttarakhand using Geographical Information System
1199 | Int. J. of Multidisciplinary and Current research, Vol.4 (Nov/Dec 2016)
[7] S.K. Nag, S. Chakraborty, (2003), Influence of rock types and structures in the development of drainage network in hard rock area. J Indian Soc Remote Sens 31(1):25–35. [8] N.S. Magesh, K.V. Jitheshlal, N. Chandrasekar K.V. Jini, (2012b), GIS based morphometric evaluation of Chimmini and Mupily watersheds, parts of Western Ghats, Thrissur District, Kerala, India. Earth Sci Inform 5(2):111–121. [9] R.E. Horton, (1945), Erosional development of streams and their drainage basins;hydrophysical approach to quantitative morphology. Bull Geol Soc Am 56:275–370. [10] A.N. Strahler, (1952), Hypsometric (area-altitude) analysis of erosional topography. Bull Geol, Soc Am 63. [11] J.E. Muller, (1968), An introduction to the hydraulic and topographic sinuosity indexes. Ann Assoc Am Geogr 58:371–385. [12] R.W. Shreve, (1969), Stream lengths and basin areas in topologically random channel networks. J Geol 77:397–414. [13] I.S. Evans, (1972), General geomorphometry, derivatives of altitude and descriptive statistics. In: Chorley RJ (ed) Spatial analysis in geomorphology. Harper and Row, New York, pp 17–90. [14] I.S. Evans, (1984), Correlation structures and factor analysis in the investigation of data dimensionality:statistical properties of the Wessex land surface, England. In: Proceedings of the Int. Symposium on Spatial Data Handling, Zurich., v 1. Geographisches Institut, Universitat Zurich-Irchel. pp 98–116. [15] R.J. Chorley, S.A. Schumm, D.E. Sugden, (1984), Geomorphology.Methuen, London Clarke JI (1996) Morphometry from Maps.Essays in geomorphology.Elsevier publication. Co., New York, pp 235–274. [16] D. Merritts, K.R. Vincent, (1989), Geomorphic response of coastal streams to low, intermediate, and high rates of uplift, Mendocino junction region, northern California.Geol Soc Am Bull 101:1373–1388. [17] H. Ohmori, (1993), Changes in the hypsometric curve through mountain building resulting from concurrent tectonics and denudation. Geomorphology 8:263–277. [18] R.T. Cox, (1994), Analysis of drainage-basin symmetry as a rapid technique to identify areas of possible quaternary tilt-block tectonics: an example from the Mississippi embayment. Geol Soc Am Bull 106:571–58. [19] T. Oguchi, (1997), Drainage density and relative relief in humid steep mountains with frequent slope failure. Earth Surf Process Landf 22:107–120. [20] P.A. Burrough, R.A. McDonnell, (1998), Principles of geographical information systems. Oxford University Press Inc., New York. [21] J.E. Hurtrez, C. Sol, F. Lucazeau, (1999), Effect of drainage area on hypsometry from an analysis of small-scale drainage basins in the Siwalik hills (central Nepal). Earth Surf Process Landform 24:799–808. [22] G.P. Obi Reddy, A.K. Maji, and K.S. Gajbhiye, (2004), Drainage Morphometry and its Influence on Landform Characteristics in a Basaltic Terrain, Central India- A Remote Sensing and GIS approach. Int J Appl Earth Obs Geoinfo. 6:1-16. [23] SubbaRao, (2009), A Numerical Scheme for Groundwater Development in a Watershed Basin of Basement Terrain: A Case Study from India. Hydrogeology Journal 17:379-396. [24] A.N. Strahler, (1957), Quantitative analysis of watershed geomorphology. Trans Am Geophys Union 38:913–920. [25] J. Krishnamurthy, G. Srinivas, V. Jayaram, M.G. Chandrasekhar, (1996), Influence of rock type and structure in the development of drainage networks in typical hard rock terrain. ITC J 4 (3):252–259. [26] N.K. Rao, L.P. Swarna, A.P. Kumar, H.M. Krishna, (2010), Morphometric analysis of Gostani River Basin in Andhra Pradesh
State, Indian using spatial information technology.Int J Geomat Geosci 1(2):179–187. [27] B. Smith, D. Sandwell, (2003), Accuracy and resolution of shuttle radar topography mission data. Geophys Res Lett 30(9):20–21. [28] C.H. Grohmann, (2004), Morphometric analysis of geographic information systems: applications of free software GRASS and R. Comput Geosci 30:1055–1067. [29] L.M. Mesa, (2006), Morphometric analysis of a subtropical Andean basin (Tucuman, Argentina). J Environ Geol 50(8):1235–1242. [30] N.S. Magesh, N. Chandrasekar, J.P. Soundranayagamm, (2011), Morphometric evaluation of Papanasam and Manimuthar watersheds, parts of Western Ghats, Tirunelveli district, Tamil Nadu, India: a GIS approach. Environ Earth Sci 64(2):373–381. [31] S. Pirasteh, H.O. Safari, B. Pradhan, I. Attarzadeh, (2010), Lithomorphotectonics analysis using Landsat ETM data and GIS techniques: Zagros Fold Belt (ZFB), SW Iran. [32] N.S. Magesh, K.V. Jitheshal, N. Chandrasekar K.V. Jini, (2013), Geographical information system based morphometric analysisof Bharathapuzha River Basin, Kerla, India. Appl Water Sci:1–11. doi:10.1007/s13201-013-0095-0. [33] R.J. Chorley, D.E.G. MaIm, and H.A. Pogorzelski, (1957), A New Standard for Estimating Drainage Basin Shape: Amer. 1. Sci. 255: 138-141. [34] R.E. Horton, (1932), Drainage Basin Characteristics. Transactions of American Geophysical Union. 13:350-361. [35] V.C. Miller, (1953), A quantitative geomorphologic study of drainage basin characteristics in the Clinch Mountain area, Virginia andTennessee, Project NR 389042, Tech Report 3. ColumbiaUniversity Department of Geology, ONR Geography Branch, New York. [36] S.A. Schumm, (1956), Evolution of drainage systems and slopes in badlands at Perth Amboy, New Jersey. Geol Soc Am Bull 67:597–646. [37] A.N. Strahler, ( 1956), Quantitative Slope Analysis. Bull Geol Soc Am, 67; 571-596. [38] A.N. Strahler, (1968), Quantitaive geomorphology in fairbridge, R. W. Ed (1968). The encyclopedia of geomorphology, Reinhold Book Corp. New York. [39] M.A. Melton, (1957), An Analysis of the Relations among the Elements of Climate, Surface Properties and Geomorphology. Technical Report 11, Department of Geology, Columbia University, New York. [40] S.A. Schumm, (1954), The Relation of Drainage Basin Relief to Sediment Loss. International Association of Scientific Hydrology, 36:216-219. [41] K.. Pareta, (2004), Hydro-Geomorphology of Sagar District (M.P.): A Study through Remote Sensing Technique. Proceeding in XIX M. P. Young Scientist Congress. Madhya Pradesh Council of Science & Technology (MAPCOST), Bhopal. [42] H. Gravelius, (1914). Grundrifi der gesamten Gewcisserkunde. B and I: Flufikunde (Compendium of Hydrology, Vol. I. Rivers, in German), Goschen, Berlin, Germany. [43] A.E. Schidggar, (1970), Theoretical Geomorphology. 2nd edn. Berlin-Heidelberg New York: Springer. [44] A.S. Sethupathi, C. Lakshmi Narasimhan, V. Vasanthamohan, S.P. Mohan, (2011), Prioritization of mini watersheds based on morphometric analysis using remote sensing and GIS in a drought proneBargur Mathur sub watersheds, Ponnaiyar River basin, India. IntJ Geomat Geosci 2(2):403–414. [45] S. Singh, M.B. Singh, (1997), Morphometric analysis of Kanhar river basin.Natl Geogr J India 43(1):31–43.
Parvaiz Ahmad Ganie et al Morphometric Analysis of a Kosi River Basin, Uttarakhand using Geographical Information System
1200 | Int. J. of Multidisciplinary and Current research, Vol.4 (Nov/Dec 2016)
[46] S.S. Vittala, S. Govindiah, H. Honne gowda, (2004), Morphometric analysis of sub-watersheds in the pawagada area of Tumkur district, South India, using remote sensing and GIS techniques. J Indian Soc Remote Sens 32 (4):351–362. [47] H. Verstappen, (1983), The applied geomorphology. In: International Institute for Aerial Survey and Earth Science (ITC). Enschede. [48] R. Chopra, D.D. Raman, P.K. Sharma, (2005), Morphometric analysis of sub-watersheds in Gurdaspur district, Punjab using remote sensingand GIS techniques. J Indian Soc Remote Sens 33(4):531–539. [49] V. Gardiner, (1975), Drainage Basin Morphometry. British Geomorphological Group, Technical Bulletin. 14; 48. [50] J.T. Hack, (1957), Studies of Longitudinal Profiles in Virginia and Maryland. US Geological Survey Professional Paper, 294 (B) 45-97. [51] J.S. John Wilson, N. Chandrasekar, N.S. Magesh, (2012), Morphometricanalysis of major Sub Watersheds in Aiyar & Karai PottanarBasin, Central Tamil Nadu, India using Remote Sensing & GIS Techniques. Bonfring Int J Ind Eng Manag Sci 2(special issue1):8–15. [52] K..N. Singh, (1980), Quantitative analysis of landfroms and settlement distribution in southern uplands of eastern Uttar Pradesh (India).Vimal Prakashan, Varanasi. [53] G.E. Moglen, E.A. Eltahir, R.L. Bras, (1998), On the sensitivity of drainage density to climate change. Water Resour Res 34:855–862. [54] K.I. Kelson, S.G. Wells, (1989), Geologic influences on fluvial hydrology and bedload transport in small mountainous watersheds, northern New Mexico, US. Earth Surf Process 14:671–690. [55] S.K. Nag, (1998), Morphometric Analysis using Remote Sensing Techniques in the Chaka Sub-Basin, Purulia District, West Bengal. J Indian Soc Remote Sens 26 (1&2):69-76.
[56] A. Faniran, (1968), The Index of Drainage Intensity - A Provisional New Drainage Factor. Australian J Sci. 31; 328-330. [57] A. Subyani, M. Qar, and M. Matsah, (2010), Digital Elevation Model and Multivariate Statistical Analysis of Morphometric Parameters of Some Wadis, Western Saudi Arabia. Arab J Geosci. 5 (1) 147-157. [58] A.D. Howard, (1967), Drainage Analysis in Geologic
Interpretation: A Summation. Bulletin of American
Association of Petroleum Geology.21; 2246-2259.
[59] S.A. Schumm, (1963), Sinuosity of alluvial rivers in the
Great Plains.Bull Geol Soc Am 74:1089–1100.
[60] G. Mahadevaswamy, D. Nagaraju, S. Siddalingamurthy,
M.S.L. Lakshmamma, P.C. Nagesh, K. Rao, (2011), Morphometric
analysis of Nanjangudtaluk, Mysore District, Karnataka, India,
using GIS Techniques.Int J Geomat Geosci 1:179–187.
[61 L.C. Gottschalk, (1964), Reservoir sedimentation in the
handbook of applied hydrology. McGraw-Hill Book Company,
New York (Section 7-1).
[62] S. Gayen, G.S. Bhunia, P.K. Shi, (2013), Morphometric
analysis ofKangshabati-Darkeswar Interfluves area in West
Bengal, Indiausing ASTER DEM and GIS techniques. Geol Geosci
2(4):1–10.
[63] M. A. Melton, (1965), The Geomorphic and Paleoclimatic
Significance of Alluvial Deposits in Southern Arizona. Journal of
geology, 73:1,1-38.
[64] D.J. Wilford, M.E. Sakals, J.L. Innes, R.C. Sidle, and W.A.
Bergerud, (2004), Recognition of Debris Flow, Debris Flood and
Flood Hazard through Watershed Morphometrics. Landslide. 1
(1) 61-66.
[65] P.D. Sreedevi, K. Subrahmanyam, A. Shakeel, (2005). The
significanceof morphometric analysis for obtaining groundwater
potentialzones in a structurally controlled terrain. J Environ Geol
47(3):412–420.