Embed Size (px)
Citation preview

International Journal of Mass Spectrometry 319– 320 (2012) 17– 24
Contents lists available at SciVerse ScienceDirect
International Journal of Mass Spectrometry
j our na l ho me page: www.elsev ier .com/ locate / i jms
Comparing the performance of hyperbolic and circular rod quadrupole mass
spectrometers with applied higher order auxiliary excitation
D.J. Gershmana,∗, B.P. Blocka, M. Rubina, M. Bennab, P.R. Mahaffyb, T.H. Zurbuchena
a Department of Atmospheric, Oceanic and Space Sciences, University of Michigan, Ann Arbor, MI, USAb Solar Systems Exploration Division, NASA Goddard Space Flight Center, Greenbelt, MD, USA
a r t i c l e i n f o
Article history:
Received 21 February 2012
Received in revised form 24 March 2012
Accepted 24 March 2012
Available online 2 April 2012
Keywords:
Quadrupole mass spectrometer
Auxiliary excitation
Spaceborne mass spectrometry
a b s t r a c t
This work applies higher order auxiliary excitation techniques to two types of quadrupole mass spec-
trometers (QMSs): commercial systems and spaceborne instruments. The operational settings of a circular
rod geometry commercial system and an engineering test-bed for a hyperbolic rod geometry spaceborne
instrument were matched, with the relative performance of each sensor characterized with and without
applied excitation using isotopic measurements of Kr+. Each instrument was operated at the limit of the
test electronics to determine the effect of auxiliary excitation on extending instrument capabilities. For
the circular rod sensor, with applied excitation, a doubling of the mass resolution at 1% of peak trans-
mission resulted from the elimination of the low-mass side peak tail typical of such rod geometries. The
mass peak stability and ion rejection efficiency were also increased by factors of 2 and 10, respectively,
with voltage scan lines passing through the center of stability islands formed from auxiliary excitation.
Auxiliary excitation also resulted in factors of 6 and 2 in peak stability and ion rejection efficiency, respec-
tively, for the hyperbolic rod sensor. These results not only have significant implications for the use of
circular rod quadrupoles with applied excitation as a suitable replacement for traditional hyperbolic rod
sensors, but also for extending the capabilities of existing hyperbolic rod QMSs for the next generation
of spaceborne instruments and low-mass commercial systems.
© 2012 Elsevier B.V. All rights reserved.
1. Introduction
For the past 50 years, the quadrupole mass spectrometer (QMS)
has been the instrument of choice for high quality neutral gas
composition measurements in both the commercial realm [1] and
for spaceborne applications [2–5]. Commercial sensors typically
employ more easily manufactured circular rods, but can suffer from
degraded peak shapes and difficulties in attaining high resolution
measurements [6], though proper sizing of circular rods can help
to minimize these effects [7].
Spaceborne instruments, on the other hand, have relied on
hyperbolic geometry, as these rods provide a near-ideal quadrupole
electric field. However, it can be extremely challenging and expen-
sive to manufacture and align such rod sets. In their traditional
mode of operation, these sensors are perhaps at the limits of their
capabilities, as newly developed ion sources with optimal beam
design virtually eliminate affects of fringing fields, yet the highest
attained mass range for modern space instruments extends only to
500 Da [8]. However, for mass spectrometers that are part of future
planetary and cometary missions, mass ranges beyond 1000 Da will
∗ Corresponding author.
E-mail address: [email protected] (D.J. Gershman).
be required in order to measure complex organics and volatiles that
are currently at the center of scientific interest, as they relate to the
investigation of sources and processes of life in space [9]. In order to
use well-proven QMS technology for the next generation of space-
borne mass spectrometers, new techniques that improve overall
instrument performance must be developed and tested. Auxiliary
excitation techniques will be shown here to accomplish such an
improvement.
Stable ion trajectories in a QMS are created by applying two
voltages to the quadrupole rods: an RF waveform at a frequency
typically in the MHz range, and a DC potential. A subset of the pos-
sible RF and DC amplitudes results in stable trajectories for a given
species of ion. Mass peaks corresponding to increasing ion mass-to-
charge (m/z) ratios can be produced by increasing the RF/DC voltage
amplitudes while keeping their ratio constant, forming a voltage
scan line. The slope of this scan line will determine the width, i.e.,
the resolution, of the mass peak [6]. In order to maximize the sen-
sitivity of the instrument, quadrupoles are often tuned to unity
mass resolution such that the scan line slope is set to increase with
increasing m/z ratios [10]. However, for a measurement confined
to a small mass range, a constant scan line slope is appropriate.
Auxiliary excitation techniques apply an additional RF compo-
nent Cting resonances in the system that split the original solid
RF/DC stability region into small islands of stability. Operation
1387-3806/$ – see front matter © 2012 Elsevier B.V. All rights reserved.http://dx.doi.org/10.1016/j.ijms.2012.03.008
https://ntrs.nasa.gov/search.jsp?R=20140010172 2019-12-30T12:36:22+00:00Z

18 D.J. Gershman et al. / International Journal of Mass Spectrometry 319– 320 (2012) 17– 24
with voltage scan lines through the tips of these islands has
been shown through experimental work [11–15] to significantly
improve the performance of circular rod quadrupole mass spec-
trometers by improving peak shapes, abundance sensitivity, and
mass resolution. Auxiliary frequencies are typically set to be very
low [14,15], or near to, but not identical to that of the fundamental
RF signal [13]. These techniques cannot easily be applied to space
instrumentation due to the high degree of precision required
to drive and control such a small auxiliary signal amplitude.
Furthermore, since the quadrupole rods typically act as part of a
resonant tank circuit that enables more power efficient operation,
inserting a signal off-resonance, even at small amplitudes, requires
large amounts of driving current, a key resource on spacecraft [16].
Even for terrestrial applications, large required driving currents
can prohibit the creation of very small islands of stability such that
it has been easier to create larger islands of stability and operate
scan lines through their tips.
Higher order auxiliary excitation techniques [16,17] drive the
quadrupole rods at a frequency nearly twice that of the funda-
mental frequency. These higher order techniques provide the same
advantages of previously demonstrated auxiliary excitation driven
at lower frequencies, but allow improved dynamic range of the
sensed auxiliary signal amplitude. When used in conjunction with a
multi-resonant tank circuit [16], the quadrupole rods can be driven
efficiently at both the fundamental RF and auxiliary frequencies,
enabling auxiliary excitation for power-limited applications such as
space-flight. Furthermore, larger excitation amplitudes permitted
by this circuit enables operation of voltage scan lines through the
center of small upper stability islands, providing more stable peak
shapes than voltage scan lines passing through the island tips [16],
an improvement important for space and commercial applications
alike.
The advantages of higher order auxiliary excitation techniques
when applied to circular rod QMSs at lower resolution (∼100) have
recently been experimentally verified using measurements of Ar+
[16]. Numerical simulations have mapped out the set of practical
instrument operating points [17] as well as predicted that these
techniques should improve the performance of sensors with ideal
hyperbolic rod geometry [17,18], but these advantages have yet
to be experimentally verified. This work will serve as the first
experimental demonstration of higher order auxiliary excitation
techniques in a hyperbolic geometry QMS. Here, higher order aux-
iliary excitation is applied to two sets of rod sets (Section 2) with
circular and hyperbolic rod geometry respectively, whose operat-
ing characteristics have been well matched. Isotopic measurements
of Kr+ (Section 3) are used as a baseline for gauging sensor perfor-
mance.
2. Experimental setup
A Field Programmable Gate Array (FPGA)-based QMS voltage
control system and multiresonant tank circuit described in detail
by Gershman et al. [16] were modularized and interfaced with two
existing quadrupoles as drop-in replacements for their respective
drive electronics. The first, a commercial Pfeiffer QMG422 circu-
lar rod system, was previously used to demonstrate the improved
performance using high order auxiliary excitation with measure-
ments of Ar+ [16]. For this sensor, with a rod radius to spacing ratio
of 1.20, a significant low-mass peak tail is expected [8] and in fact
observed in nominal sensor operation [16]. The second quadrupole
was a space-flight quality hyperbolic rod system, the engineering
test bed for the Sample Analysis at Mars (SAM) instrument [9] on
the Mars Science Laboratory (MSL) mission. The physical character-
istics as well as timing and operating parameters for each sensor
are summarized in Table 1 with details on their selection described
throughout this section.
Table 1Characteristics of QMS sensors used in this study.
Hyperbolic Circular
Physical characteristics
Rod length (l) (mm) 150 300
Rod spacing (ro) (mm) 5.08 6.7
Rod radius (mm) N/A 8
Operating point
Fundamental frequency (˝/2�) (MHz) 1.40 1.06
Excitation frequency (ω/2�) (MHz) 2.6834 2.0317
RF amplitude per amu/e (V/(m/z)) (V/(amu/e)) 3.68 3.67
Nominal rod bias potential (ϕb) (V) −2 +70
Nominal source exit potential (ϕs) (V) 0 0
Nominal ion energy from source Ei,s (V) 1 ± 0.5 +80 ± 5
Accumulations
Steps per amu/e 20 64
Step dwell time (ms) 100 0
Step accumulation time (ms) 50 16
In order to obtain a meaningful comparison between differ-
ent QMS sensors, the operating characteristics of each must be
matched as well as possible, though there will inevitably be
some discrepancy between their observed performances due to
differences in test setups. Nevertheless, matching the important
non-dimensional numbers across systems ensures maximum con-
sistency. The dimensionless numbers of a quadrupole sensor, a,
q, and �, arise from the equations of motion of an ion in an ideal
quadrupole field with added auxiliary excitation [18],
d2x
d�2+ (a − 2q cos(2�))x − 2q′ cos
(2�
ω
˝
)x = 0 and
d2y
d�2− (a − 2q cos(2�))y + 2q′ cos
(2�
ω
˝
)y = 0, (1)
with
a ≡ 8eU
(m/z)r2o ˝2
, q ≡ 4eV
(m/z)r2o ˝2
, and � ≡ ˝t
2. (2)
Here, x and y are the transverse position coordinates of an ion
in a 2D quadrupole field, U and V are the DC and RF voltage ampli-
tudes pole to ground, respectively, ro is the rod spacing, ̋ is the
fundamental operating frequency, ω is the auxiliary frequency, e is
the unit of an electric charge, m/z is the mass-to-charge ratio, and
t is the time. q′ is the relative strength of the excitation defined by
q′ ≡ qVex/V where Vex is the excitation voltage amplitude.
The matching of a and q will be accomplished through appropri-
ate frequency selection and the use of identical drive electronics for
each sensor. � will be matched across sensors through proper selec-
tion of ion axial energies. Finally, the dynamic range of the detected
ion signal will be adjusted to ensure similar counting statistics for
each QMS.
The experimental setup here has the same characteristics and
limitations as those described in Gershman et al. [16]. Conse-
quently, we will focus on low-resolution ((m/z)/�(m/q)∼100)
measurements. However, these measurements will be sufficient
to show good agreement with previous numerical simulations and
illustrate the advantages of auxiliary excitation for both rod geome-
tries. For each sensor, the multiresonant tank circuit was tuned
to obtain a ratio of auxiliary to fundamental frequencies (ω/˝) of
1.9167. Such precise frequency selection is enabled through use of
digitally synthesized signals by an FPGA. This excitation frequency
will create an upper stability island that will produce a mass peak
with resolution on the order of 100 when a voltage scan line, whose
required precision is at the limit of the developed electronics, is
swept through the island center. Only by examining the operation
at this limit can the effectiveness of auxiliary excitation techniques
on extending the capabilities of QMS sensors be determined.

D.J. Gershman et al. / International Journal of Mass Spectrometry 319– 320 (2012) 17– 24 19
2.1.1. Matching of a and q
For a typical high-resolution measurement, operation of scan
lines through the tip of the stability region requires voltages such
that a ≈ 0.237 and q ≈ 0.706. While it might make intuitive sense
to operate each quadrupole at identical frequencies, the differing
physical dimensions of each sensor will result in different required
voltages to achieve stable trajectories for a particular ion. The
driving electronics will control the accuracy and precision of the
instrument operating point, and consequently, the trajectories of
analyzed ions. Following Eq. (2), if the U/(m/z) and V/(m/z) ratios
are matched across rod sets, noise in the voltage-control system
will have similar effects on ion trajectories for each sensor, and dif-
ferences in performance should be dominated by differences in the
physical properties of the rods, rather than electronic effects since
these voltages scale as r2o ˝2.
Since all frequency components are digitally generated using
an FPGA, a change in operating frequency is readily accom-
plished. Therefore, given the field radius, ro, of a rod set, the
operating frequencies can be adjusted to obtain the same V/(m/z)
ratios. For ˝/2� = 1.06 MHz and ro = 6.7 mm for the circular rod
set, and ˝/2� = 1.4 MHz and ro = 5.08 mm for the hyperbolic rod
set, the V/(m/z) values are well matched at 3.67 V/(amu/e) and
3.68 V/(amu/e) respectively, as shown in Table 1. Although tuning
adjustments were made to the multiresonant tank circuit to accom-
modate each sensor’s rod capacitance, the overall drive electronics
were identical for each quadrupole.
2.1.2. Matching of the number of RF cycles in the field
Assuming constant ion axial energy E, � from Section 2 can be
written as a function of the rod length, ion energy, and ion m/z ratio,
as,
� = ˝l
2√
2eE/(m/z). (3)
The number of RF cycles (n) experienced by an ion traversing
the length of the quadrupole rods is commonly used instead of �to describe instrument behavior [6]. The two quantities are related
to one another by � = �n. The ideal quadrupole, which is infinitely
long, has an infinite number of RF cycles to filter out unwanted
ions, creating perfectly sharp stability boundaries. This filtering
process results in high-resolution mass peaks obtained with scan
lines passing near the tip of the stability region. However, all prac-
tical instruments have finite length rods, and consequently, only a
finite number of RF cycles to reject unwanted ions. If n is too low,
a significant number of unwanted ions remain unfiltered, contam-
inating adjacent mass peaks. When the resolution is limited by the
number of RF cycles, rather than rod quality or other factors, the
maximum attainable mass resolution of a QMS scales as n2 [6].
In order to compare the performance of different rod sets, the
n-values of ions should be well matched. For a given quadrupole, l
is fixed, and the operating frequency ̋ is set as described in Sec-
tion 2.1.1. Therefore, from Eq. (3) the ion axial energy (E) must be
adjusted in order to obtain a given n-value. The available range of
ion axial energies is typically set by the design of the ion source.
However, the quadrupole rods themselves can be biased with a
potential with respect to the ion source exit aperture. The final
ion axial energy (E) is approximated by the potential difference
between the rods (ϕb) and the exit aperture of the source (ϕs)
subtracted from the ion energy produced by the source (Ei,s), such
that,
E ≈ Ei,s − (�b − �s). (4)
The approximation of Eq. (4) neglects fringing field and field
penetration effects between the rods and the exit aperture of the
source, as well as the spread of produced ion energies.
For the circular rod set, ions were created with energies approx-
imately 80 ± 5 eV. A +70 V to +40 V rod bias range is used to obtain
ions between n ≈ 35 and n ≈ 70 RF cycles. For the hyperbolic rod
set, ions were created at approximately 1 ± 0.5 eV. Therefore, a rod
bias between −2 V and −16 V is used to obtain ions between n ≈ 35
and n ≈ 80 RF cycles. The best results are expected for energies that
yield the maximum available n, leading to nominal rod biases of
+70 V and −2 V for the circular and hyperbolic QMSs respectively,
as indicated in Table 1.
2.1.3. Matching of dynamic range
Although not directly related to any of the dimensionless
quantities, a, q, or �, the instrument sensitivity is an important char-
acteristic of QMS sensors that determines the effective dynamic
range of the measured mass spectra signal. Determination of the
total instrument sensitivity is a complex task as it will be a function
of detector type, efficiency, accumulation time, ion source design,
and the partial pressures of measured gases [6]. Therefore, although
the measurement timing (Table 1) for each sensor differs slightly
due to the various requirements of each instrument’s interface soft-
ware, the pressure of the krypton gas inside the ion source was
adjusted to obtain similar counting statistics. For the circular rod
QMS, the source pressure was set to 1 × 10⁻⁵ mbar. For the hyper-
bolic rod sensor, the source pressure was set to 1 × 10⁻⁷ mbar.
These pressures resulted in measurements of Kr+ isotopes rang-
ing over approximately 4 orders of magnitude in detected particle
flux for both instruments.
3. Results and discussion
With these well-matched systems, isotopes of Kr+ in the (m/z)
range 78–86 amu/e were measured by each sensor with and with-
out applied higher order auxiliary excitation. These measurements
were analyzed in terms of mass resolution, peak variability, and
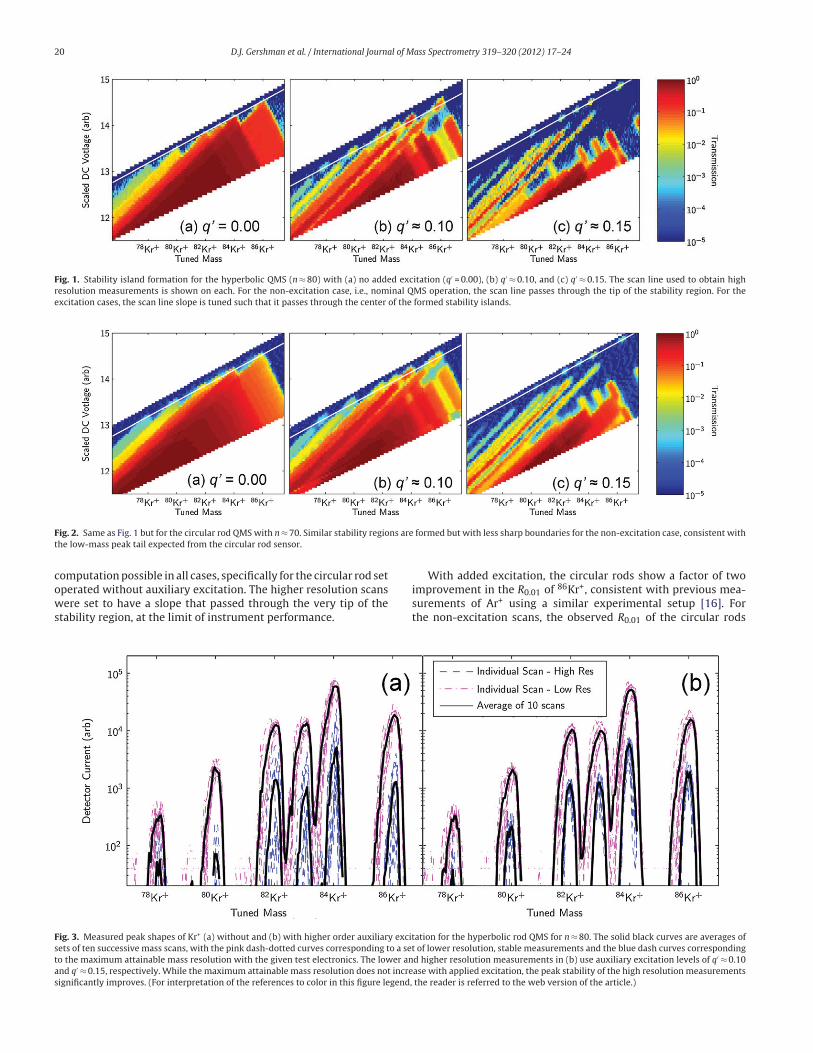
variation with ion energy. Figs. 1 and 2 show the stability regions
formed from using q′ = 0.00 (i.e., no excitation), q′ ≈ 0.10, and
q′ ≈ 0.15 for the hyperbolic and circular rod sensors, respectively
with corresponding voltage scan lines. The voltage scan line of the
non-excitation measurements was set such that it passed through
the tip of the stability region for a given ion. The voltage scan line of
the excitation measurements was set such that it passed through
the center of a formed upper stability island. Similar island split-
ting is shown for both sensors. The hyperbolic rod measurements
without excitation created sharper stability boundaries than those
of the circular rod sensor, as expected.
The scalar conversion from RF voltage to m/z will change
depending on instrument operating point. The appropriate conver-
sion from RF voltage to m/z is selected as the factor that aligns the
maximum transmission for 86Kr+ between m/z = 85.75 amu/e and
m/z = 86.25 amu/e for the lowest ion energy setting for each sensor.
3.1. Mass resolution
Figs. 3 and 4 show 10 mass scans of the krypton mass range
for each QMS with and without applied excitation. The mean of
each set of scans is indicated as the solid black line. The 1% mass
resolution (R0.01) for mass peak 86Kr+ is indicated for each case,
where R0.01 is defined as (m/z)/�(m/z) where m/z is the measured
mass per charge ratio and �(m/z) is the width of the mass peak
that is within 1% of its maximum transmission value. This value
is not computed for all mass peaks as their relative proximity to
one another and measured dynamic ranges may not make such a
20 D.J. Gershman et al. / International Journal of Mass Spectrometry 319– 320 (2012) 17– 24
Fig. 1. Stability island formation for the hyperbolic QMS (n ≈ 80) with (a) no added excitation (q′ = 0.00), (b) q′ ≈ 0.10, and (c) q′ ≈ 0.15. The scan line used to obtain high
resolution measurements is shown on each. For the non-excitation case, i.e., nominal QMS operation, the scan line passes through the tip of the stability region. For the
excitation cases, the scan line slope is tuned such that it passes through the center of the formed stability islands.
Fig. 2. Same as Fig. 1 but for the circular rod QMS with n ≈ 70. Similar stability regions are formed but with less sharp boundaries for the non-excitation case, consistent with
the low-mass peak tail expected from the circular rod sensor.
computation possible in all cases, specifically for the circular rod set
operated without auxiliary excitation. The higher resolution scans
were set to have a slope that passed through the very tip of the
stability region, at the limit of instrument performance.
With added excitation, the circular rods show a factor of two
improvement in the R0.01 of 86Kr+, consistent with previous mea-
surements of Ar+ using a similar experimental setup [16]. For
the non-excitation scans, the observed R0.01 of the circular rods
Fig. 3. Measured peak shapes of Kr+ (a) without and (b) with higher order auxiliary excitation for the hyperbolic rod QMS for n ≈ 80. The solid black curves are averages of
sets of ten successive mass scans, with the pink dash-dotted curves corresponding to a set of lower resolution, stable measurements and the blue dash curves corresponding
to the maximum attainable mass resolution with the given test electronics. The lower and higher resolution measurements in (b) use auxiliary excitation levels of q′ ≈ 0.10
and q′ ≈ 0.15, respectively. While the maximum attainable mass resolution does not increase with applied excitation, the peak stability of the high resolution measurements
significantly improves. (For interpretation of the references to color in this figure legend, the reader is referred to the web version of the article.)

D.J. Gershman et al. / International Journal of Mass Spectrometry 319– 320 (2012) 17– 24 21
Fig. 4. Same as Fig. 3 but for the circular rod QMS with n ≈ 70. Here, not only does the peak stability significantly improve with applied excitation, but also the low-mass peak
tail characteristic of circular rod sensors is removed, effectively doubling the maximum attainable mass resolution of the instrument. (For interpretation of the references to
color in this figure legend, the reader is referred to the web version of the article.)
is reduced by the low mass peak tail, which arises as a conse-
quence of imperfections in the quadrupole electric field resulting
from non-ideal rod geometry. Auxiliary excitation techniques
increase rejection efficiency of unwanted ions near these bound-
aries, removing this peak tail. However, this tailing effect is not
observed in the hyperbolic QMS measured peaks, even for the non-
excitation case. Consequently, the R0.01 value for the hyperbolic rod
set remains unchanged with added excitation, though the highest
possible mass resolution for the hyperbolic rod system was slightly
larger than that of the circular rod system. These results are con-
sistent with predictions from numerical simulations [17,18] that
show for ideal quadrupole geometry the overall mass resolution
for a particular ion transmission is only expected to improve for
higher (R ∼ 1000) resolution measurements.
3.2. Peak variability and stability
Electronics noise causes small shifts in operating point dur-
ing a mass scan. In the traditional mode of quadrupole operation,
for lower resolution scans, these shifts will not create large
changes in mass peak shapes. However, for higher resolution
scans, when operating scan lines through the tip of stability
regions, the mass peak shapes become very sensitive to small
changes in operating point. This effect can be observed in the
non-excitation peaks of both the hyperbolic and circular rod sys-
tems, which become increasingly variable and unstable at high
resolution. Scan line operation through the center of an upper
stability island, however, mitigates this effect. These islands rep-
resent large, symmetric areas of almost constant transmission
and resolution. Therefore, small shifts in operating point do not
result in significant changes to the mass peak shapes, resulting
in more stable peak shapes for both rod geometries, as shown
in Figs. 3 and 4.
The accuracy of recovered isotopic ratios of krypton is used to
quantify this variability. The 10% transmission, T0.1, is the average
transmission between the two points defining the 10% resolution of
a mass peak. This value was determined for each of the mass peaks
corresponding to singly charged krypton isotopes, 78Kr+, 80Kr+,82Kr+, 83Kr+, 84Kr+, and 86Kr+, and was normalized by the total T0.1
for all measured masses, giving the measured relative abundance of
each isotope for each scan. The mean of the derived relative abun-
dances of the 10 scans are shown in Fig. 5 and are compared to
the standard literature values [19]. The error bars in Fig. 5 indicate
the standard deviation of the 10 scans, a proxy for the variability of
the mass peak shapes. The measurements of 78Kr+ had a very low
signal to noise ratio for both the circular rod and hyperbolic rod
higher resolution scans, resulting in misleadingly high calculations
of variability. For other peaks, counting statistics result in point-
wise errors on the order of 10% of the peak value. The transmission
for both the excitation and non-excitation curves are similar, so
counting statistical error would have a similar effect on both sets
of peaks, indicating that the increase in stability is due to the use
of auxiliary excitation. The 1% transmission, T0.01, was not used for
this analysis due to insufficient separation of mass peaks for the
case of circular rods operated without excitation.
The extremely high variability of the non-excitation high reso-
lution hyperbolic rod mass scans is likely a result of operation at
a sharp tip of the stability region, where small changes in operat-
ing point create drastic changes in transmission combined with the
limitations of our interfaced electronics as listed above. This effect
is likely less pronounced in the circular rod system since the tip of
this region is ‘blunted’ by non-linear resonant effects [20].
While the average measured abundances do not significantly
change with excitation, the variability of each scan is significantly
reduced for high-resolution operation with applied excitation. This
reduction in variability directly translates into a shorter required
scanning time for instrument high resolution scans. For example,
the average high resolution variability of the hyperbolic rods with
applied excitation was 6 times lower than the non-excitation case,
leading to a 6 times shorter required scan time. Likewise, the circu-
lar rod high resolution scanning time could be reduced by a factor of
2. This increased peak stability is consistent with previous exper-
imental work, as well as predictions from numerical simulations
[16,17].
3.3. Ion rejection efficiency
From both numerical simulations [18] and previous experi-
mental work [13], the number of RF cycles required for sufficient
rejection of undesired ions is expected to decrease when operating
with applied excitation, i.e., the rejection efficiency should increase,
and consequently the attainable resolution for a given ion energy
[6]. This improvement is likely the reason for the improved maxi-
mum attainable mass resolution in Section 3.1 for the circular rod

22 D.J. Gershman et al. / International Journal of Mass Spectrometry 319– 320 (2012) 17– 24
Fig. 5. (a) Measured relative abundances of krypton isotopes averaged over 10 scans of the hyperbolic rod QMS compared with accepted literature values [19]. The average
T0.1 of each mass scan is indicated by the shaped marker. The standard deviation, i.e., variability, of T0.1 is represented by the error bars around each marker. (b) same as (a)
but for the circular rod QMS. For all cases, the peak variability at the limit of the test electronics (high resolution modes) significantly improves with applied excitation.
quadrupole. The maximum attainable resolution was achieved at
the limit of the test electronics. In order to characterize the effect
of excitation on mass peaks independent of electronics precision
effects, the rejection efficiency is measured using the lower resolu-
tion instrument settings from Section 3.1 (i.e., the pink dash-dotted
curves from Figs. 3 and 4).
As discussed in Section 2.1.2, the number of RF cycles an ion
spends traversing the rods can be adjusted by changing the QMS
rod bias. The ranges of rod biases from Section 2.1.2 were scanned
for each system with and without applied excitation. Figs. 6 and 7
show the effect of changing the rod bias on mass peak shapes for
each sensor. For reduced n, for both the hyperbolic and circular
rod systems, significant peak tailing occurs on the low mass side
of the Kr+ mass peaks. However, this effect is less pronounced for
operation with applied excitation.
Because of insufficient separation between adjacent mass peaks,
it is difficult to directly calculate the changes in mass resolution
of Kr+ without fitting models of the mass peaks to the observed
spectra. Instead, to quantify these effects, the crosstalk of 85Kr+
relative to the transmission of the true 86Kr+ peak is calculated.85Kr+ does not correspond to any known naturally occurring sta-
ble isotope of krypton [19]. Therefore any transmission between
m/z = 84.75 amu/e and m/z = 85.25 amu/e is considered to be mass
crosstalk. This transmission, T85, is normalized by the trans-
mission of the adjacent peak, 86Kr+, between m/z = 85.75 amu/e
and m/z = 86.25 amu/e, and plotted in Fig. 8 for both rod
sets.
The 85Kr+ mass crosstalk in the non-excitation circular rod mea-
surements is high due to the significant low mass peak tail that
is present even for large values of n. This tail is eliminated with
the use of auxiliary excitation for all ion energies. Consequently,
the relative reduction of mass crosstalk due to auxiliary excitation
(about an order of magnitude for all n) is highest for the circular
rod system. However, even for the hyperbolic rod set, the relative
reduction when using auxiliary excitation is at least a factor of two
and up to a factor of 20.
Fig. 6. Peak shapes for Kr+ measured with the hyperbolic rod QMS for various separation times for (a) no applied excitation and (b) q′ ≈ 0.10 as in Fig. 1. With decreasing
number of RF cycles, n, the measured mass peaks exhibit tailing on both the low-mass and high-mass sides. Such tailing is mitigated with applied excitation.

D.J. Gershman et al. / International Journal of Mass Spectrometry 319– 320 (2012) 17– 24 23
Fig. 7. Same as Fig. 6 but for circular rod QMS using operating points from Fig. 2. Just as for the hyperbolic rod QMS, the increased peak tailing as a result of reduced n is
mitigated with applied excitation, including the peak tail that appears at all n-values as a consequence of circular rod geometry.
Fig. 8. Crosstalk of 85Kr+ as a function of separation time for (a) hyperbolic and (b) circular rod QMS sensors with and without applied excitation for the measured mass
peaks from Figs. 6 and 7. The crosstalk is reduced by factors of 2–20 for both measurement geometries.
As seen in Fig. 8, with added excitation, both QMS sensors
require only approximately 67% of the n-value to obtain perfor-
mance comparable to the non-excitation cases. Lowering n has
two major implications for QMS sensors: (1) the quadrupole rods
themselves can be shortened to create a smaller, lighter instru-
ment without sacrificing performance and (2) higher energy ions
may be analyzed, simultaneously relaxing design constraints on the
ion source and creating an increased flux of particles at the detec-
tor, thereby increasing instrument sensitivity and enabling shorter
measurement times.
4. Conclusions
High order auxiliary excitation significantly improved the
performance of the Pfeiffer QMG422 commercial circular rod
quadrupole in all areas, doubling the maximum attainable R0.01 for
the given test electronics, providing a two-fold increase in peak
stability and variability, and improving ion rejection efficiency by
an order of magnitude. Although the maximum attainable R0.01
of the MSL/SAM hyperbolic QMS system did not improve with
applied auxiliary excitation, six and two-fold improvements were
obtained for peak stability and ion rejection efficiency, respectively.
These results are all consistent with previous experimental work
and numerical simulations related to auxiliary excitation tech-
niques. Consequently, the results of these simulations, specifically
the improved predicted performance of hyperbolic rod sensors for
high resolution modes are expected to hold for sensors employing
higher precision electronics than those used in this study. One of the
most significant improvements for ideal geometry sensors is that
of enhanced peak stability obtained from operating voltage scan
lines through the center of formed upper stability islands. As of this
work, the only power efficient way of implementing such a tech-
nique at high resolutions is to use higher order auxiliary excitation
in conjunction with a multiresonant tank circuit.
Based on the derived resolution of these measurements, it is dif-
ficult to distinguish between mass peaks obtained from different
rod geometries when auxiliary excitation is applied. This similarity
in observed performance is even more remarkable when consider-
ing the quality of the respective ion sources used for each sensor.
The hyperbolic rod ion source is one of the most precise and stable

24 D.J. Gershman et al. / International Journal of Mass Spectrometry 319– 320 (2012) 17– 24
of its kind, with the circular rod QMS using a standard, commer-
cially available ion source with a comparatively wide entrance
aperture and ion beam size, factors that significantly affect the
performance of the sensor in its traditional mode of operation.
Higher order auxiliary excitation techniques are clearly a powerful
tool for mitigating effects of imperfections in a quadrupole system,
whether they arise from fringing fields, non-linear resonances, or
wide ion energy ranges. These potential improvements to circular
rod systems could have tremendous impact on the next generation
of quadrupole sensors, as circular rod QMS sensors could be cre-
ated that are suitable for high resolution spaceborne or laboratory
applications. We note, however, that the highest attainable mass
resolution was measured on the hyperbolic rods operating with
auxiliary excitation. We therefore suggest that these techniques
could be used to improve the stability and performance of exist-
ing hyperbolic sensors, extending their practical mass ranges, and
enabling their use for future planetary and cometary missions.
Acknowledgments
The authors would like to acknowledge Eric Raaen, Heather
Franz, and Mike Barciniak for their assistance and support with
interfacing to and operating the MSL/SAM test bed system. This
work was supported by the NASA Planetary Instrument Defini-
tion and Development NNX08AO05G and NASA Graduate Student
Research Program NNX09AL50H grants. The University of Michigan
is pursuing patent protection for the presented intellectual prop-
erty and is seeking commercialization partners to help bring the
technology to market.
References
[1] R.E. March, J.F.J. Todd, Quadrupole Ion Trap Mass Spectrometry, John Wiley,and Sons, Inc., Hoboken, NJ, 2005.
[2] J.H. Waite, W.S. Lewis, W.T. Kasprzak, V.G. Anicich, B.P. Block, T.E. Cravens, G.G.Fletcher, W.H. Ip, J.G. Luhmann, R.L. Mcnutt, H.B. Niemann, J.K. Parejko, J.E.Richards, R.L. Thorpe, E.M. Walter, R.V. Yelle, The Cassini Ion and Neutral MassSpectrometer (INMS) investigation, Space Sci. Rev. 114 (2004) 113.
[3] H.B. Niemann, D.N. Harpold, S.K. Atreya, G.R. Carignan, D.M. Hunten, T.C. Owen,Galileo probe mass spectrometer experiment, Space Sci. Rev. 60 (1992) 111.
[4] H.B. Niemann, J.R. Booth, J.E. Cooley, R.E. Hartle, W.T. Kasprzak, N.W.Spencer, S.H. Way, D.M. Hunten, G.R. Carignan, Pioneer Venus orbiter neu-tral gas mass spectrometer experiment, IEEE Trans. Geosci. Remote Sens.18 (1980) 60.
[5] H.B. Niemann, S. Atreya, S.J. Bauer, K. Biemann, B. Block, G. Carignan, T. Donahue,L. Frost, D. Gautier, D. Harpold, D. Hunten, G. Israel, J. Lunine, K. Mauersberger, T.Owen, F. Raulin, J. Richards, S. Way, The gas chromatograph mass spectrometeraboard Huygens, in: A. Wilson (Ed.), Huygens: Science, Payload and Mission,ESA, Paris, 1997, p. 85.
[6] P.H. Dawson, in: H. Peter, Dawson (Eds.), Quadrupole Mass Spectrometry andits Applications, Elsevier, New York, 1976.
[7] D.J. Douglas, N.V. Konenkov, Influence of the 6th and 10th spatial harmonicson, the peak shape of a quadrupole mass filter with round rods, Rapid Commun.Mass Spectrom. 16 (2002) 1425.
[8] P.R. Mahaffy, C.R. Webster, M. Cabane, P.G. Conrad, P. Coll, S.K. Atreya, et al. Thesample analysis at MARS investigation and instrument suite, Space Sci Rev.,submitted for publication.
[9] M.J.S. Belton, New Frontiers in the Solar System – An Integrated Exploration,Strategy, The National Academies, Washington, DC, 2003.
[10] P. Marchard, P. Marmet, Opération D’un Filtre de Masse Quadrupolaire en,Condition Optimum, Can. J. Phys. 42 (1964).
[11] G. Devant, P. Fercocq, G. Lepetit, O. Maulat, Procede d’alimentation en ten-sion, des spectrographs de mass du type quadripolaire, French patent 2,620,568(1989).
[12] K. Miseki, Quadrupole mass spectrometer, US patent 5,227,629 (1993).[13] N.V. Konenkov, L.M. Cousins, V.I. Baranov, M. Yu Sudakov, Quadrupole, mass
filter operation with operation with auxiliary quadrupolar excitation: theoryand experiment, Int. J. Mass Spectrom. 208 (2001) 17.
[14] X. Zhao, Z. Xiao, D.J. Douglas, Overcoming field imperfections of quadrupolemass filters with mass filters with mass analysis in islands of stability, Anal.Chem. 81 (2009) 5806.
[15] X. Zhao, Z. Xiao, D.J. Douglas, Mass analysis with islands of stability with lin-ear quadrupole incorporating higher order multipole fields, J. Am. Soc. MassSpectrom. 21 (3) (2010) 393.
[16] D.J. Gershman, B.P. Block, M. Rubin, M. Benna, P.R. Mahaffy, T.H. Zurbuchen,Higher order parametric excitation modes for spaceborne mass spectrometers,Rev. Sci. Instrum. 82 (2011) 125109, http://dx.doi.org/10.1063/1.3669781.
[17] D.J. Gershman, M. Rubin, B.P. Block, M. Benna, P.R. Mahaffy, T.H. Zurbuchen,Enabling the next generation of spaceborne quadrupole mass spectrome-ters, in: ASCE Conf. Proc. Earth and Space, in press, http://content.asce.org/conferences/earthspace2012/index.html.
[18] N.V. Konenkov, A. Korolkov, M. Machmudov, Upper stability island of the,quadrupole mass filter with amplitude modulation of the applied voltages, J.Am. Soc. Mass Spectrom. 16 (2005) 379.
[19] N.E. Holden, Table of the isotopes, in: D.R. Lide (Ed.), CRC Handbook of Chem-istry and Physics, 85th ed., CRC Press, 2004, ISBN 978-0849304859, Section11.
[20] J. Schulte, P.V. Shevchenko, A.V. Radchik, Nonlinear field effectsin quadrupole mass filters, Rev. Sci. Instrum. 70 (1999) 3566,http://dx.doi.org/10.1063/1.1149960.