Embed Size (px)
Citation preview

Tm
RC
a
ARRAA
KTPVTHP
1
matrapticdtipa
oB
1d
International Journal of Mass Spectrometry 300 (2011) 130–142
Contents lists available at ScienceDirect
International Journal of Mass Spectrometry
journa l homepage: www.e lsev ier .com/ locate / i jms
op-down analysis of small plasma proteins using an LTQ-Orbitrap. Potential forass spectrometry-based clinical assays for transthyretin and hemoglobin
oger Théberge, Giuseppe Infusini, Weiwei Tong, Mark E. McComb, Catherine E. Costello ∗
enter for Biomedical Mass Spectrometry, Boston University School of Medicine, Boston, MA 02118, USA
r t i c l e i n f o
rticle history:eceived 20 April 2010eceived in revised form 10 August 2010ccepted 17 August 2010vailable online 24 August 2010
eywords:op-downroteinariantransthyretin
a b s t r a c t
Transthyretin (TTR) amyloidosis and hemoglobinopathies are the archetypes of molecular diseases wherepoint mutation characterization is diagnostically critical. We have developed a top-down analyticalplatform for variant and/or modified protein sequencing and are examining the feasibility of usingthis platform for the analysis of hemoglobin/TTR patient samples and evaluating the potential clinicalapplications. The platform is based on a commercial high resolution hybrid orbitrap mass spectrometer(LTQ-OrbitrapTM) with automated sample introduction; automated data analysis is performed by ourown software algorithm (BUPID top-down).
The analytical strategy consists of iterative data capture, first recording a mass profile of the protein(s).The presence of a variant is revealed by a mass shift consistent with the amino acid substitution. Nozzle-skimmer dissociation (NSD) of the protein(s) yields a wide variety of sequence-defining fragment ions.
emoglobinost-translational modification
The fragment ion containing the amino acid substitution or modification can be identified by searchingfor a peak exhibiting the mass shift observed in the protein mass profile. This fragment ion can then beselected for MS/MS analysis in the ion trap to yield sequence information permitting the identificationof the variant. Substantial sequence coverage has been obtained in this manner. This strategy allows fora stepwise MS/MS analysis of the protein structure. The sequence information obtained can be supple-mented with whole protein NSD fragmentation and MS/MS analysis of specific protein charge states. The
of TT
analyses of variant forms. Introduction
Current approaches to protein structure determination byass spectrometry center on so-called bottom-up and top-down
pproaches. Bottom-up methods [1,2] utilize proteolytic digestionso break down the protein into constituent peptides that can beeadily analyzed by LC–MS/MS whereby separation and dissoci-tion of the peptides provides structural information for manyeptides in a single experiment. The disadvantages associated withhe bottom-up approach are: labor intensive and time consum-ng sample preparation, together with less than 100% sequenceoverage, as well as the potential for introduction of artifactsuring digestion. Furthermore, molecular weight information lost
hrough proteolysis hinders the search for post-translational mod-fications and information on the relationship(s) among multipleost-translational modifications (PTMs) to a single protein is usu-lly sacrificed.∗ Corresponding author at: Center for Biomedical Mass Spectrometry, Departmentf Biochemistry, Boston University School of Medicine, 670 Albany Street, Room 511,oston, MA 02118-2646, USA. Tel.: +1 61 7 638 6490; fax: +1 61 7 638 6491.
E-mail address: [email protected] (C.E. Costello).
387-3806/$ – see front matter © 2010 Elsevier B.V. All rights reserved.oi:10.1016/j.ijms.2010.08.012
R and hemoglobin are presented to illustrate the potential of the method.© 2010 Elsevier B.V. All rights reserved.
For the top-down approach, proteins are directly introducedinto the mass spectrometer and individual components can bemass-selected and dissociated in the instrument, yielding productions containing structural information. Top-down [3,4] is also moreefficient in its use of mass spectrometer system time because sepa-rations can be performed off-line if necessary. The methodology oftop-down analysis circumvents the drawbacks listed above by ana-lyzing intact protein molecular weights and fragments ions directlywithin the mass spectrometer. Although bottom-up remains theworkhorse of proteomics, the characterization of point mutationsby LC–MS/MS can be made difficult by the higher false positiverate that is observed when sequence variations are allowed in thedatabase search.
Peptide mapping was demonstrated to be useful for hemoglobinvariant determination by fast atom bombardment mass spectrom-etry [5]. The use of targeted analysis for common hemoglobinvariants through multiple reaction monitoring (MRM) acquisitionmode MS of whole blood tryptic digests was proposed recently as a
population screening methodology [6]. The idea of generating pri-mary structural information from intact proteins through MS/MSon a Fourier transform ion cyclotron resonance (FT-ICR) mass spec-trometer [7,8] originated soon after the introduction electrosprayionization mass spectrometry. McLuckey et al. [9] have adapted
l of M
iMTdugiaca(tlt
taddtiolm
Oaoaiatph[vamhTeflfrpwM
w[tThsstmtt[
tasr
R. Théberge et al. / International Journa
on traps for the purpose of top-down protein sequencing. PseudoS3 analyses using quadrupole orthogonal time-of-flight (Q-o-
OF) instruments were reported by Thevis et al. [10] for top-downeterminations on transferrins. A triple quadrupole instrument wassed by Witkowska et al. to characterize a genetic mutation thatave rise to a variant human �-globin [11]. Whilst a variety ofnstrumental configurations have thus been used for the top-downnalysis of proteins, the high resolution, mass accuracy and MSn
apacity of FTICR MS [12,13], as well as the availability of multiplectivation techniques, including infrared multiphoton dissociationIRMPD) [14], electron capture dissociation (ECD) [15], electronransfer dissociation (ETD) [16], and sustained off-resonance col-isionally activated dissociation (SORI-CAD) [17], continue to favorhese instruments for top-down analysis.
The recent introduction of the LTQ-Orbitrap mass spectrome-er [18] offers many of the high resolution, mass accuracy and MSn
dvantages of FTICR-MS at a more affordable price. Macek et al. [19]emonstrated the ability of the LTQ-Orbitrap to generate top-downata using protein standards ranging from 10 to 25 kDa. However,heir tandem analysis was performed exclusively within the linearon trap portion of the system. The multistage MS/MS capabilityf the system was not investigated. The LTQ-Orbitrap has simi-arly been used in a top-down mode to characterize recombinant
onoclonal antibodies [20,21].Whilst these examples highlight the potential of the LTQ-
rbitrap for the top-down analysis of proteins, a comprehensivepproach that fully exploits the high performance capabilitiesf this hybrid mass spectrometer has not been presented. Thispproach could be particularly useful in the case of small and easilysolated plasma proteins of clinical relevance such as transthyretinnd hemoglobins, where characterization of amino acid substi-utions that can define genetic point mutations integral to theathogenesis of the diseases is necessary for precise diagnosis ofereditary transthyretin amyloidosis [22] and hemoglobinopathies23], respectively. The use of mass spectrometry to characterizeariants of these proteins has traditionally relied on bottom-uppproaches [5,24–26]. A protocol that combines intact proteinolecular weight profiling by FT-ICR MS with DNA sequencing
as been implemented for the detection and characterization ofTR variants [27,28] in a clinical setting. The relatively small size,ase of isolation in abundant quantities, and absence of structuraleatures refractory to collisional activation (e.g., no intramolecu-ar disulfide bonds) make TTR and hemoglobins ideal candidatesor top-down analysis. However, to our knowledge, transthyretin-elated proteins have only been analyzed using top-down in ourublished study of TTR fragments ranging from 7 to 10 kDa thatere extracted from amyloid fibrils and sequenced with a Q-o-TOFS [29].Top-down MS/MS has been used for hemoglobins; indeed, they
ere among the first proteins to be analyzed in this manner7,8,30]. Nevertheless, top-down MS/MS has only been appliedo hemoglobin variant characterization in very few instances.he potential of top-down MS/MS for the characterization ofemoglobinopathies was recognized in 1996 but the complexity ofpectra, unresolved charge state ambiguities and the lack of suitableoftware tools for spectra interpretation were cited as obstacles forhe routine application of the method. In their review on the use of
ass spectrometry in the hemoglobinopathy field published at thisime, these researchers pointed out the desirability of developingop-down methods for the sequencing of intact hemoglobin chains31].
The preliminary study whose results are reported herein aimedo explore the applicability of a simple top-down method to TTRnd hemoglobin variant characterization. By combining automatedample introduction, LTQ-Orbitrap and customized software algo-ithms written in-house, an analytical platform was assembled
ass Spectrometry 300 (2011) 130–142 131
and tested. The results presented in this preliminary study high-light the feasibility of this approach for characterizing variants oftransthyretin and hemoglobins. The potential for this method to beapplied in a clinical setting seems promising. Given that the LTQ-Orbitrap system is becoming quite widely available, it is importantto raise the awareness of the clinical community to the potential ofthese instruments for straightforward top-down analyses.
2. Experimental
2.1. Samples
Transthyretin was obtained by immunoprecipitation fromhuman serum, using the method outlined by Lim et al. [32] withthe difference that a smaller volume of serum was used (50 �L vs.200 �L). Hemoglobin was obtained from whole blood by diluting1 �L of whole blood in 500 �L of ESI buffer. Use of de-identifiedpatient samples was approved by BUSM. All samples were analyzedin ESI buffer composed of 50% water, 50% acetonitrile contain-ing 0.2% formic acid. Sample concentration was approximately1 pmol/�L.
2.2. Mass spectrometry
The samples were introduced into a “Classic” LTQ-Orbitrap massspectrometer (Thermo-Fisher Corp., Waltham, MA) using a TriVersaNanoMate system (Advion Biosciences, Ithaca, NY). A low-flowESI chip was used as a static emitter to deliver the sample at20–40 nL/min. The LTQ-Orbitrap MS was operated in the nanospraypositive-ion mode. The top-down analyses were performed in anumber of different activation modes in order to explore ion dis-tribution and completeness of information on sequence and PTMs.Nozzle-skimmer dissociation was produced by varying the “sourcefragmentation” voltage between 60 and 100 V. For MS/MS analy-sis, peaks with the m/z values of interest were selected within anisolation window width of m/z 4–8. Helium was employed as thecollision gas for CID in the LTQ; analyses were performed at nor-malized collision energies of 25–35%. HCD (higher energy C-trapdissociation) was also evaluated, using energies in the range of15–23%. For all experiments, the data acquisition parameters weresimilar to default values (activation q = 0.25, FT automatic gain con-trol (AGC) 2 × 10⁵ for the MS and 1 × 10⁵ for the MSn mode. All massspectra measured for ions detected in the Orbitrap were recordedwith 60,000 resolution @ m/z 400. Mass spectra were generated byaveraging scans over a period of 1–2 min. Fragment ion mass spec-tra were generated by averaging scans over a period of 2–4 min,each scan including three microscans.
2.3. Data analysis
Fragment ion mass spectra were deconvoluted using the Xtractsoftware from Thermo Fisher Scientific. The resulting fragmentmass lists were analyzed using customized software algorithmswritten in-house, including BUPID top-down [33] (Boston Univer-sity Protein Identifier). BUPID is capable of identifying b-, y-, c-,and z-ions as well as internal ions arising from the relevant activa-tion techniques. This software will shortly be made available to thecommunity for download.
3. Results and discussion
3.1. General comments
The basic analytical strategy consists in gathering a maximum ofstructural information by obtaining molecular weight data on the

1 l of M
ieaIf(fiacofarOrwmatre
oCFscsimu
taTmftoagtpias
sogftpatiimptN
tse
32 R. Théberge et al. / International Journa
ntact protein(s) and then dissociating the molecular species to gen-rate complementary ion pairs that have sufficient abundances andppropriate masses for subsequent further stages of tandem MS.n theory, given that the LTQ-Orbitrap offers three potential sitesor ion activation (the nozzle-skimmer region, the linear ion trapLTQ) and C-trap), multiple sequential MSn experiments should beeasible (see supplementary information). However, this scenarios not fully realizable in practice due to the significant losses in ionbundance that occur during each MS/MS step. For the Orbitrap Dis-overy, we have found the most practical approach to be the usef nozzle-skimmer dissociation (NSD) to yield a rich array of MS2
ragment ions that can be subsequently sampled by mass selectionnd collision-induced decomposition in the LTQ, followed by highesolution, accurate mass determinations of the fragments in therbitrap. Although the C-trap can be used for MS/MS with HCD, our
esults have so far demonstrated a significant loss in signal intensityhen using this activation method. (Upgrade to Velos-type opticsay partially or fully address this loss of sensitivity. Furthermore,
lthough ETD can also be carried out on the LTQ-Orbitrap [34],his option had not yet been installed on our instrument when theeported analyses were carried out. It will be evaluated in futurexperiments.)
The sequence information obtained by NSD followed by LTQ-CIDf the resulting fragment ions can be extended or confirmed by LTQ-ID of mass-selected individual charge states of the intact protein.or the two proteins that are the subject of this study, only minimalample preparation was needed to achieve adequate sensitivity forlinically relevant sample amounts in analyses based on nozzle-kimmer dissociation. TTR can easily be isolated in a pure state bymmunoprecipitation from serum; hemoglobins consist of a simple
ixture of two proteins that can both be clearly observed by ESI-MSpon 500-fold dilution of whole blood.
A preliminary mass profile of each sample was first generatedo determine the precise mass shift that could be attributed to anmino acid substitution or post-translational modification (PTM).his information enabled identification of the NSD-generated frag-ent(s) that bear an amino acid substitution or PTM. The relevant
ragment ion(s) could, individually, be selected for MS3 analysiso provide more detailed structural information. In the applicationf this method, it should be noted that, even in the absence of anpparent mass shift the NSD spectrum should always be acquired,iven the possibility of variant mass shifts too small to be noted inhe mass profile or of double sequence variations that could com-ensate one another, thus giving rise to small net mass shifts. The
nspection of sequence-defining complementary ion pairs shouldssure the detection of all mass shifts, even those that are small orerve to compensate one another.
In development of the method, the next step was to mass-selectpecific intact protein charge states to map out the fragmentationf the analyte(s). It is of paramount importance to ascertain the ori-in of the NSD fragment ions if NSD/LTQ-CID MS/MS is to be usedor sequence analysis. In the case of hereditary disorders, unlesshe sample donor is a homozygote, both wild-type and variantroteins can be detected. Furthermore, extensive PTMs are usu-lly present in TTR and these give rise to multiple isoforms of bothhe wild-type and variant protein [24]. The fragmentation behav-or of each of the major post-translationally modified forms wasnvestigated to assure that these modifications could be deter-
ined. The hemoglobin samples, although much less subject toost-translational modification, consist of both � and � chains andhis system offers its own challenges in the implementation of the
SD/LTQ-CID MS/MS analytical scheme.It is well known that the fragmentation of proteins varies overhe different charge state isoforms selected for top-down analy-is (charge state-dependent dissociation behavior) and Mekechat al. [35] have used this observation to generate extensive
ass Spectrometry 300 (2011) 130–142
�-hemoglobin sequence coverage by recording the fragmenta-tion of the full range of the protein charge states from 4+ to20+ using a modified ion trap. However, this approach is notconsistent with the methodology for higher throughput analy-sis of variant sequences developed herein for use in a clinicalsetting.
3.2. Top-down analysis of transthyretin
As noted above, there is no previous report of a top-downanalysis of transthyretin, apart from our published study of TTRfragments that ranged from 7 to 10 kDa that were extracted fromamyloid fibrils. Of the two analytical challenges considered inthis paper, the characterization of TTR variants presents the sim-pler case, despite the presence of extensive PTMs. Fig. 1 showsthe nano-ESI mass spectrum of a wild-type TTR sample; theinset provides an expansion of the region that includes the 14+charge state of the molecular-weight related species. The TTRpost-translational modifications overwhelmingly center on Cys10, the only cysteine residue of the protein, and generate theS-thiolated (cysteine, CysGly and glutathione) and S-sulfonatedforms [24,32]. The ratio between the two most abundant post-translationally modified forms, S-cysteinylated and S-sulfonatedTTR, can vary widely from sample to sample. A higher abun-dance of S-sulfonation with respect to S-cysteinylation has beenspeculated to reflect disease states [36,37]. The S-CysGly and S-glutathionylated forms of TTR are present in low abundance. Theunmodified form of the protein typically represents less than 15%of the total TTR-related isoforms observed in the mass spectra ofTTR immunoprecipitated from human serum. One factor of note isthe difference in the stabilities of these post-translational modifica-tions under collisional activation conditions typically employed forNSD and CID. The S-thiolated forms are quite stable and generallyremain intact. On the other hand, the modification in S-sulfonatedTTR is very labile; the S-sulfonate group on a cysteine residueis easily cleaved [38,39] and the released protein appears in theNSD mass spectrum as unmodified TTR. However although thispost-translational modification is lost as a result of the activa-tion method, the capability of the method to obtain the completeamino acid sequence information for variant characterization is notadversely affected.
As discussed above, the most common approach to top-downMS/MS analysis of proteins is to mass select individual charge statesof intact protein ions for MS/MS. The LTQ-CID MS/MS spectrumof the most abundant charge state, [M+14H]14+ m/z 992.43, of apost-translationally modified wild-type TTR is shown in Fig. 2. Thision corresponds to the S-cysteinylated form of TTR. This mode offragmentation does not yield extensive sequence coverage. Thecore section of the sequence and the N-terminal region are notvery well covered. Fragmentation is dominated by the sequence-defining complementary ion pair b42 and y85, as well as a seriesof low mass y-ions describing the C-terminus that cover positions117–125 and tend to be ubiquitous features of top-down spectraof TTR-derived proteins using CID [29]. The high abundance of theC-terminal fragments is well illustrated by the expansion factor(X3) necessary to visualize the other fragments in Fig. 2. Highercollision energies favor the appearance of this ion series above allothers.
More complete initial coverage can be obtained by interrogat-ing several different charge states (data not shown). It should benoted that the use of higher skimmer potentials in NSD can lead
to proton stripping. This can be advantageous for the top-downapproach, as it gives the analyst access to lower charge statesin significant abundance, enabling further probing of the chargestate-dependent dissociation behavior. For example, an abundantTTR8+ charge state is generated at higher skimmer voltages and can
R. Théberge et al. / International Journal of Mass Spectrometry 300 (2011) 130–142 133
F m. Th9
bswmspmPammt
Fm
ig. 1. Nano-ESI mass spectrum of a wild-type TTR immunoprecipitated from seru80–1010) and the various post-translationally modified forms of TTR.
e subjected to MS/MS. Dissociation of this charge state showeduppression of the extensive C-terminal low mass fragmentationhich, as noted above, tends to dominate the MS/MS spectrum ofost charge states of the TTR isoforms and thus yielded broader
equence coverage (supplementary data). This observation canrobably rationalized on the basis of the proton mobility frag-entation model as the TTR sequence contains 10 basic sites.
resumably, in the lower charge states, a proton is less likely to be inposition to initiate fragmentation of the C-terminal region than inore highly charged isoform of the protein. In other words, chargeight be sequestered away from the C-terminal activation site in
he TTR8+ isoform. Important questions remain to be explored in
ig. 2. (a) Deconvoluted LTQ-CID MS2 spectrum of m/z 992.43 corresponding to the [M+1odification is eliminated immediately upon CID, the sequence coverage generated by B
e inset provides an expansion of the region that includes the 14+ charge state (m/z
the study of protein CID mechanisms [40,41] but it is beyond thescope of this paper to address them.
MS3 analysis of the very abundant b42/y85 pair generated byCID of a selected charge state is possible and could be used forvariant analysis. Nevertheless, despite the potential illustrated byprecursor ion selection and fragmentation in the LTQ, our furtherinvestigations indicated that nozzle-skimmer dissociation offered
greater advantages, in terms of both experimental simplicity andobserved sensitivity, as the first step in the top-down analysis ofTTR. The fact that the immunoprecipitation step used as the isola-tion procedure for transthyretin yields the protein in a very purestate, whereby no interference is present upon MS analysis, allows4H]14+ of S-cysteinylated wild type TTR. (b) Since the S-cysteinyl post-translationalUPID corresponds to unmodified TTR.

134 R. Théberge et al. / International Journal of Mass Spectrometry 300 (2011) 130–142
nopre
tt
cmtbanaitFcbpfpiywfsuamsppwasties
f
Fig. 3. (a) Deconvoluted NSD MS2 spectrum of wild type TTR immu
he direct use of NSD. A representative NSD MS2 fragment ion spec-rum of immunoprecipitated TTR is presented in Fig. 3.
The mass spectrum of this sample indicated that S-ysteinylation was the most abundant post-translationalodification. The most notable feature of this spectrum is
he presence of the sequence-defining complementary ion pair,42/y85. These two fragment ions capture the complete 127-aminocid TTR sequence. The genesis of this pair can easily be ratio-alized as it arises via the highly favored cleavage of a glutamiccid/proline (Glu42-Pro43) peptide bond. Of note is the dimin-shed abundance of the low mass y-ion series, as compared tohat found in the LTQ-CID of the [M+14H]14+ m/z 992.43 shown inig. 2. For this type of experiment, a lower fragmentation voltageould be selected in order to favor the formation of an abundant42/y85 complementary ion pair for subsequent LTQ-CID MS3. Theresence of a relatively abundant internal ion I43–63, resultingrom cleavages of both the Glu42-Pro43 and Glu63-Phe64 bondsrobably results from secondary fragmentation of the y85 fragment
on. Such internal ions can arise from secondary cleavages of b- or-ions. These species can be identified by BUPID. (Although theyere not needed for interpretation of the data presented herein,
ailure to properly assign them could introduce ambiguity to theequence analysis.) At this point, the reliability of the assignmentsing b- and y-ions is the most important factor to be considerednd, for that reason, we have chosen not to discuss internal frag-ent ions save for exceptional cases. As indicated in the spectrum
hown in Fig. 3, the [y85+9H]9+ fragment ion (m/z 1039.861) isroduced in high abundance even at relatively low “fragmentation”otential. The MS3 spectrum of this NSD-generated fragment ionas produced by CID of the selected precursor in the LTQ and mass
nalysis of the products in the Orbitrap, which yielded a substantialet of accurate mass values for the b-, y- and internal fragments;he most abundant of these are labeled on the spectrum shown
n Fig. 4a. The coverage obtained in this manner was specific andxtensive, as indicated in the scheme that is presented above thepectrum.For TTR, we have determined that the [y33+3H]3+ (m/z 1198.279or wild-type TTR) and [y45+4H]4+ (m/z 1224.619 for wild-type TTR)
cipitated from serum. (b) Sequence coverage generated by BUPID.
fragment ions also yield detailed structural information on the C-terminal portion of the protein. Only positions 100–110 did notexhibit definitive fragments in any of the modes utilized to gathersequence information on this region of the protein. Using an FT-ICR instrument, we have recently determined that coverage of thisregion of the sequence can be improved by the use of electron trans-fer dissociation (ETD) or electron capture dissociation (ECD). Theseadditional approaches will be explored further and the results willbe reported in a subsequent contribution.
Obtaining an informative MS3 spectrum for the cysteinylated[b42+5H]5+ fragment ion observed at m/z 906.060 (Fig. 4b) was morechallenging, given the heterogeneity introduced by the Cys10-based PTMs [24] that distributed the signal over multiple species,and the lower absolute yield of this fragment ion. The coverageobtained in the MS3 spectrum for the cysteinylated [b42+5H]5+
fragment ion was extensive, with a conspicuous b18/y24 ion pairresulting from a cleavage on the C-terminal side of an aspartic acidresidue.
Although the abundance of fragment ions could be moderatelyincreased by varying the skimmer potential, the abundance of theb42 species remained lower than that of the y85 ion at any givenvalue of this parameter. Nevertheless, these factors did not signif-icantly hinder obtaining N-terminal sequence coverage from MS3
of the [b42+5H]5+ ion, even though they decreased the numbers ofions available for that purpose.
For an unknown or partially known protein, subjecting eachmember of a complementary ion pair, such as this b42/y85 exam-ple, to further tandem MSn analysis can quickly yield substantialsequence information. As shown here in the case of variant sampleanalysis, the full sequence of the wild-type protein has already beenestablished and, thus, the selection of the proper member of thecomplementary ion pair for further dissociation depends solely onthe determination of which of the two fragments exhibits the same
mass shift as that observed in the previously recorded mass profileof the intact protein sample. The variant fragment ion can then bemass selected for MS3 analysis to obtain sequence information.The usefulness of the approach presented here can be appre-ciated if one considers the case of a Cis double mutation of Ser6

R. Théberge et al. / International Journal of Mass Spectrometry 300 (2011) 130–142 135
F taininf m. (b)a imma
amyatiagdtdw
Ft
ig. 4. (a) Deconvoluted LTQ-CID MS3 spectrum of the [y85+9H]9+ fragment ion, conrom serum. The sequence coverage generated by BUPID is shown above the spectrut m/z 906.060, containing residues 1–42, generated from the NSD of wild type TTRbove the spectrum.
nd Ala30 reported to have been detected by the combination ofolecular weight profiling by mass spectrometry and DNA anal-
sis [28]. Using the method we describe here, mass spectrometrylone would be sufficient to detect this combination of changes inhe protein structure. Examination of the b42/y85 complementaryon pair in the expected NSD spectrum would reveal the presence of+2-Da shift in the b42
5+ ion. No single amino acid substitution canive rise to a mass shift of +2 Da, so this data would indicate that a
ouble mutation is likely present. Hence, the NSD data can increasehe ability of the analyst to accurately measure small mass shiftsue to single or multiple sequence variations. The MS3 analysisould include LTQ-CID of the of the b425+ ion, providing the added
ig. 5. Nano-ESI mass spectrum of an unknown TTR variant immunoprecipitated from sehat includes the 14+ charge state (m/z 980–1010) showing the peaks representing the w
g residues 43–127, generated from the NSD of wild-type TTR immunoprecipitatedDeconvoluted LTQ-CID MS3 spectrum of the cysteinylated [b42+5H]5+ fragment ion
unoprecipitated from serum. The sequence coverage generated by BUPID is shown
structural information needed to fully define the variant positions.The approach described above was applied to a TTR sam-
ple immunoprecipitated from patient serum. The nanospray massspectrum indicated the presence of an unknown variant with a +30-Da mass shift (Fig. 5). The NSD spectrum showed a peak having a5+ charge at m/z 912.546 that corresponded to a shift of +30 Da forthe cysteinylated b42 fragment of the variant vs. that of the cys-teinylated wild-type protein, and thus indicated that the variant
was present within the first 42 positions of the sequence (Fig. 6a).No ion corresponding to (y85 + 30) Da was observed. The positionof the mutation could actually be narrowed somewhat by carefulexamination of the NSD data, following the b-ion series until the
rum exhibiting a +30-Da mass shift. The inset provides an expansion of the regionild-type and variant TTR appearing mostly in their S-cysteinylated form.
136 R. Théberge et al. / International Journal of Mass Spectrometry 300 (2011) 130–142
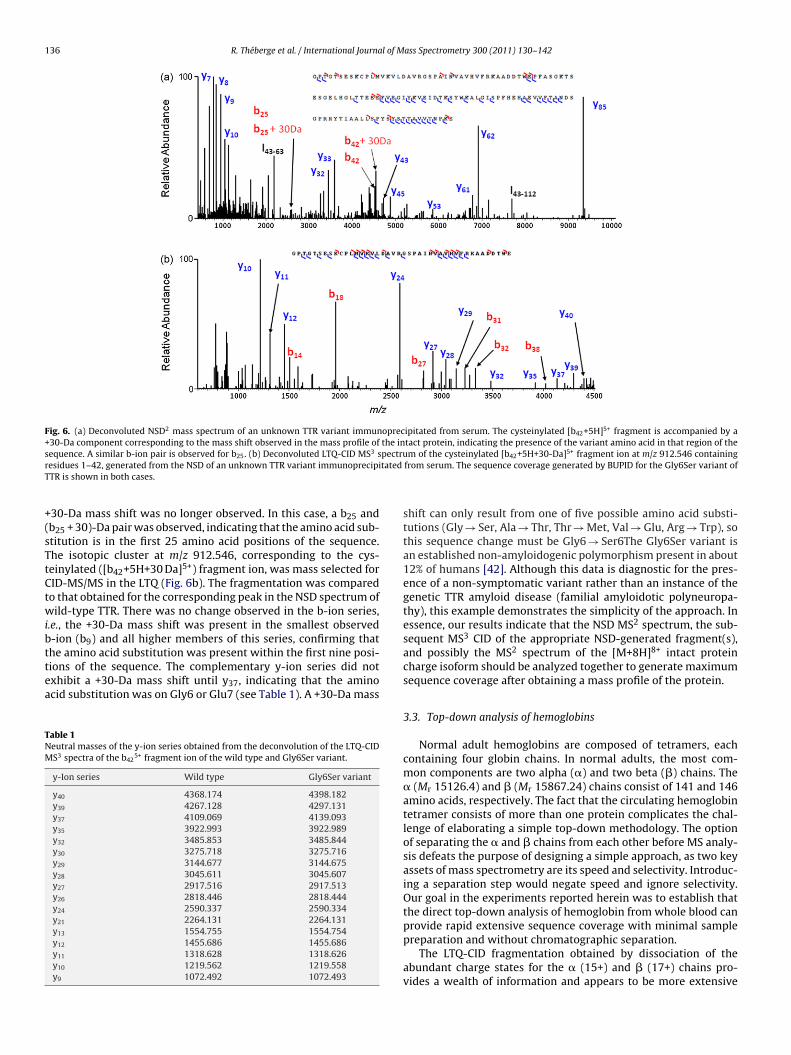
Fig. 6. (a) Deconvoluted NSD2 mass spectrum of an unknown TTR variant immunoprecipitated from serum. The cysteinylated [b42+5H]5+ fragment is accompanied by a+30-Da component corresponding to the mass shift observed in the mass profile of the intact protein, indicating the presence of the variant amino acid in that region of thes pectrur tatedT
+(sTtCtwibttea
TNM
equence. A similar b-ion pair is observed for b25. (b) Deconvoluted LTQ-CID MS3 sesidues 1–42, generated from the NSD of an unknown TTR variant immunoprecipiTR is shown in both cases.
30-Da mass shift was no longer observed. In this case, a b25 andb25 + 30)-Da pair was observed, indicating that the amino acid sub-titution is in the first 25 amino acid positions of the sequence.he isotopic cluster at m/z 912.546, corresponding to the cys-einylated ([b42+5H+30 Da]5+) fragment ion, was mass selected forID-MS/MS in the LTQ (Fig. 6b). The fragmentation was comparedo that obtained for the corresponding peak in the NSD spectrum ofild-type TTR. There was no change observed in the b-ion series,
.e., the +30-Da mass shift was present in the smallest observed-ion (b9) and all higher members of this series, confirming that
he amino acid substitution was present within the first nine posi-ions of the sequence. The complementary y-ion series did notxhibit a +30-Da mass shift until y37, indicating that the aminocid substitution was on Gly6 or Glu7 (see Table 1). A +30-Da massable 1eutral masses of the y-ion series obtained from the deconvolution of the LTQ-CIDS3 spectra of the b42
5+ fragment ion of the wild type and Gly6Ser variant.
y-Ion series Wild type Gly6Ser variant
y40 4368.174 4398.182y39 4267.128 4297.131y37 4109.069 4139.093y35 3922.993 3922.989y32 3485.853 3485.844y30 3275.718 3275.716y29 3144.677 3144.675y28 3045.611 3045.607y27 2917.516 2917.513y26 2818.446 2818.444y24 2590.337 2590.334y21 2264.131 2264.131y13 1554.755 1554.754y12 1455.686 1455.686y11 1318.628 1318.626y10 1219.562 1219.558y9 1072.492 1072.493
m of the cysteinylated [b42+5H+30-Da]5+ fragment ion at m/z 912.546 containingfrom serum. The sequence coverage generated by BUPID for the Gly6Ser variant of
shift can only result from one of five possible amino acid substi-tutions (Gly → Ser, Ala → Thr, Thr → Met, Val → Glu, Arg → Trp), sothis sequence change must be Gly6 → Ser6The Gly6Ser variant isan established non-amyloidogenic polymorphism present in about12% of humans [42]. Although this data is diagnostic for the pres-ence of a non-symptomatic variant rather than an instance of thegenetic TTR amyloid disease (familial amyloidotic polyneuropa-thy), this example demonstrates the simplicity of the approach. Inessence, our results indicate that the NSD MS2 spectrum, the sub-sequent MS3 CID of the appropriate NSD-generated fragment(s),and possibly the MS2 spectrum of the [M+8H]8+ intact proteincharge isoform should be analyzed together to generate maximumsequence coverage after obtaining a mass profile of the protein.
3.3. Top-down analysis of hemoglobins
Normal adult hemoglobins are composed of tetramers, eachcontaining four globin chains. In normal adults, the most com-mon components are two alpha (�) and two beta (�) chains. The� (Mr 15126.4) and � (Mr 15867.24) chains consist of 141 and 146amino acids, respectively. The fact that the circulating hemoglobintetramer consists of more than one protein complicates the chal-lenge of elaborating a simple top-down methodology. The optionof separating the � and � chains from each other before MS analy-sis defeats the purpose of designing a simple approach, as two keyassets of mass spectrometry are its speed and selectivity. Introduc-ing a separation step would negate speed and ignore selectivity.Our goal in the experiments reported herein was to establish thatthe direct top-down analysis of hemoglobin from whole blood can
provide rapid extensive sequence coverage with minimal samplepreparation and without chromatographic separation.The LTQ-CID fragmentation obtained by dissociation of theabundant charge states for the � (15+) and � (17+) chains pro-vides a wealth of information and appears to be more extensive

R. Théberge et al. / International Journal of Mass Spectrometry 300 (2011) 130–142 137
F hemo
tc[otoisyawttmatsfraF
[tmbpeobactfTc�e
ig. 7. (a) Deconvoluted LTQ-CID MS3 spectrum of [M+15H]15+ m/z 1009.408 from
han that obtained for TTR. The fragmentation of intact hemoglobinhains under collisional activation conditions has been described8,35,43,44] and our results are in broad agreement with reportedbservations. The fragmentation exhibited by the � chain is par-icularly rich and plentiful, as exemplified by the MS/MS spectrumf [M+15H]15+ m/z 1009.408 (Fig. 7). The most abundant productons are derived from facile cleavage at sites on the C-terminalide of acidic residues (b75) and the N-terminal side of Pro (y28,47). The fragment ion b75 results from the Asp75-Met76 cleav-ge C-terminal to aspartic acid. Interestingly, the y66 fragmenthich forms a complementary ion pair with b75 is reported [35]
o be abundant but is only observed with low signal intensity inhis spectrum, with b61 being the closest-in-mass abundant frag-
ent. The most dominant fragmentation channel is the cleavaget Leu113-Pro114 that gives rise to the y28 fragment. Similarly,he complementary ion in this pair, b113, is only observed at lowignal intensity, with b111 being the closest-in-mass abundantragment. Many observed peaks could be assigned to productsesulting from fragmentation in the “core” region of the proteinnd good overall sequence coverage was obtained, as shown inig. 7b.
In the LTQ-CID MS2 data obtained for dissociation of theM+17H]17+ of the � chain that was observed at m/z 934.324 (Fig. 8),he main feature of the MS/MS spectrum is the [y96+11H]11+ frag-
ent arising from the facile cleavage of the Thr50-Pro51 peptideond. The high mass y-ions y98 and y111 form complementary ionairs with the b50 and b35 ions, respectively. Of note is the pres-nce of a long series of b-ions, from b4 to b49, describing mostf the N-terminal sequence of the � chain, with the series from30 to b36 being particularly prominent. These general observationsre in qualitative agreement with those of Schaaff et al. [44]. Theore sequence information obtained from the LTQ-CID MS2 spec-rum of the [M+17H]17+ of the � chain is less extensive than was
ound for dissociation of the intact �-chain [M+15H]15+ ion (Fig. 8b).hese preliminary LTQ-CID MS2 spectra provided a preview of whatould be expected from nozzle-skimmer dissociation of the � andchains, and established the provenance of the fragment ions gen-rated by NSD.
globin � chain in diluted whole blood. (b) Sequence coverage generated by BUPID.
The NSD spectrum of diluted whole blood is shown in Fig. 9.Many fragment ions can be observed. It proved possible to select anumber of fragment ions from each chain that could be used toimplement the strategy presented above for TTR, whereby MS3
analysis of complementary ion pairs is used to obtain completesequence information.
All the candidate fragment ion assignments were confirmed byMS/MS. In the case of the � chain, the prominent [y96+11H]11+ m/z940.42 and [b47+5H]5+ m/z 1047.56, covering 143 of 146 aminoacid positions, were determined to be suitable, as both fragmentions have reasonable abundance and are amenable to further MSn
analysis (i.e., they provide good sequence coverage/information).The [y96+11H]11+ fragment ion could be efficiently generated inhigh abundance by NSD of the diluted blood sample and massselected to undergo MS3 in the LTQ (Fig. 10a). The sequence cov-erage thus obtained (Fig. 11b) provided information from the“core region” not available from the LTQ-CID mass spectrumobtained for the 17+ charge state of the � chain. This region ofthe �-chain sequence (residues 58–111) has been reported to bedifficult to sequence using CID of the intact � chain [45], but theapproach presented here offers a simple and elegant solution to thisproblem.
The NSD spectrum exhibited peaks that could be assigned as�-chain fragments [b75+9H]9+ and [y61+8H]8+ at m/z 884.148 and832.424, respectively, covering 136 of the 141 amino acids. Whilethese pairs are not as complementary as of the pair selected forsequence analysis of TTR, they nevertheless cover close to 95% ofthe sequence. To some extent, the abundance of each of the chosenfragment ions can be increased by varying the fragmentation poten-tial (by raising the skimmer voltage). To date, we have observedthat implementation of the strategy using NSD to generate frag-ment ions which can be subsequently submitted to MS3 analysis ismuch more difficult for hemoglobins than for TTR.
This state of affairs is likely due to the fact that isolating andperforming MS3 on some of the NSD-generated fragments is mademore difficult when the peaks of interest have relatively lowabundances and/or many other components are detected in thespectrum. This increases the possibility that NSD-generated frag-

138 R. Théberge et al. / International Journal of Mass Spectrometry 300 (2011) 130–142
F emogc
mtpmSaaim
Fc
ig. 8. (a) Deconvoluted LTQ-CID MS2 spectrum obtained for the [M+17H]17+ of the hoverage generated by BUPID.
ent ions corresponding to the variant will appear at an m/z valueshat are overlapped by interfering fragment ions. Furthermore, theresence of two proteins instead of one complicates the NSD frag-ent ion spectrum by simply increasing the number of fragments.
uch overlap is not a problem when the intact protein charge statesre chosen for MS2 analysis. The peaks due to wild-type and vari-nts can be mass-selected together, without hindering the datanterpretation, since all the sequence information obtained is com-
on to wild-type and variant, except for those fragments that
ig. 9. Deconvoluted NSD MS2 spectrum of diluted whole blood. Most of the abundantonstituting complementary ion pairs that could be used for subsequent LTQ-CID MS3 are
lobin � chain in diluted whole blood that was observed at m/z 934.324. (b) Sequence
contain the amino acid substitution. In fact, it may not be neces-sary to apply, in all cases, the strategy based on the MS3 analysis ofNSD-generated fragment ions that was found necessary and provensuccessful for TTR. Contrary to TTR, the intact protein MS/MS of
some charge states of the intact � chain (particularly 14+ and 15+)show that it undergoes CID readily, yielding rich fragmentation andextensive sequence coverage. This is less true for the � chain wherethe “core” of the sequence was reported to be difficult to determinewhen CID was performed on the intact � chain [45]. This report ispeaks can be assigned as fragments of � or � hemoglobin. The key fragment ionslabeled.

R. Théberge et al. / International Journal of Mass Spectrometry 300 (2011) 130–142 139
F at m/S
ctHpayv
F−
ig. 10. (a) Deconvoluted LTQ-CID MS3 spectrum of the Hb� [y96+11H]11+ fragmentequence coverage generated by BUPID.
onsistent with our own observations. However, we have foundhat use of the NSD-generated �-y96 for MS3 can resolve this issue.ence, the best strategy in the case where the hemoglobin mass
rofile exhibits a �-chain variant, is to obtain the NSD spectrumnd ascertain if the amino acid substitution is present within the96 portion of the sequence. If so, the LTQ-CID MS3 spectrum of theariant y96 can be acquired. If not, MS/MS of intact protein fromig. 11. (a) Deconvoluted LTQ-CID MS2 spectrum obtained for the [M+17H]17+ ion observ30-Da mass shift. (b) Sequence coverage generated by BUPID.
z 940.42, containing residues 51–146, generated by NSD of diluted whole blood. (b)
one of the charge states 14+ to 17+ can be used to gain sequenceinformation.
On the basis of the results presented here, we can summarize
the top-down strategy for the analysis of hemoglobin variants asfollows. First, a mass profile is obtained. If an �-chain variant ispresent, then LTQ-CID of the 15+ or 14+ charge state of the intactprotein variant should be obtained. If a �-chain variant is founded at m/z 932.632 that corresponds to the hemoglobin �-chain variant exhibiting a

140 R. Théberge et al. / International Journal of Mass Spectrometry 300 (2011) 130–142
F e ion8 D MS2
m ified r
tif(
idvDeassrtowttoG
TLsda
ig. 12. (a) Nanospray mass spectrum showing the expanded region containing th52.08019+). (b) Sequence coverage generated by BUPID top-down from the LTQ-CIarked with circles. The top-down MS/MS results indicated that Cys 93 is the mod
o be present, the NSD profile is acquired. If a variant �-chain y96s detected, it can be analyzed by LTQ-CID MS3. Otherwise, NSDragmentation and MS2 of the intact �-chain variant charge state14+ to 17+) serves to characterize the variant.
The results obtained for a sickle cell variant (Hb� Glu6 → Val)llustrate the amount of information that can be extracted from theata. The mass profile of diluted whole blood known to contain aariant was obtained and an apparent �-chain variant with a −30-a shift was observed (data not shown). The NSD spectrum did notxhibit a �-y96 variant peak; this result suggested that the aminocid substitution was present within positions 1–50. The � b-ioneries revealed the presence of b-ion pairs (e.g., b13, b22 and b33)eparated in each case by 30 Da. As noted earlier, the N-terminalegion of the �-chain sequence may be determined by using MS2 ofhe intact protein charge states 14+ to 17+. In the MS/MS spectrumf the variant [M+17H]17+ (Fig. 11), the −30-Da shift of the b-ionsas observed down to b6, whereas the b4 mass corresponded to
hat of the wild-type sequence (Table 2). This data indicated thathe amino acid substitution was at Pro5 or Glu6. In this case, thenly possible amino acid substitution yielding a −30-Da shift islu6 → Val6.
able 2ist of neutral masses from the b-ion series of the deconvoluted LTQ-CID MS2 masspectra of the [M+17H]17+ of the wild type and Glu6Val hemoglobin � chain. Thisata indicated that the amino acid substitution was at Pro5 or Glu6. The only possiblemino acid substitution yielding a −30 Da shift is a Glu-to-Val substitution.
b-Ionseries
Wild type Glu6Val variant Sequence
b4 450.259 450.259 VHLTb6 676.341 646.362 VHLTP(E → V)b13 1362.683 1332.738 VHLTP(E → V)EKSAVTAb14 1475.771 1445.822 VHLTP(E → V)EKSAVTALb15 1661.848 1631.902 VHLTP(E → V)EKSAVTALWb20 2159.135 2129.198 VHLTP(E → V)EKSAVTALWGKVNVb21 2274.159 2244.224 VHLTP(E → V)EKSAVTALWGKVNVDb22 2403.200 2373.267 VHLTP(E → V)EKSAVTALWGKVNVDE
corresponding to [M+19H]19+ of the S-glutathionylated hemoglobin � chain (m/zof m/z 852.08019+. The potential sites of glutathionylation, Cys93 and Cys112, are
esidue.
An added feature of the top-down analysis of hemoglobins isthe ability to characterize PTMs. The mass profile of a hemoglobinsample was recorded and the deconvoluted data indicated the pres-ence of a minor component (10% abundance relative to the basepeak series) corresponding to the molecular weight of the �-chain+305 Da. This mass shift is usually indicative of S-glutathionylationat cysteine, a modification that is believed to be an indicator ofoxidative stress [46]. The low abundance [M+19H]19+ peak at m/z852.083 (Fig. 12a) (corresponding to glutathionylated �-chain)was subjected to LTQ-CID. The fragmentation information obtained(Fig. 12b) from this experiment was incomplete but was sufficientto place the modification on Cys93, and to exclude modificationat Cys112. This method of locating the post-translational mod-ification is considerably less cumbersome than the bottom-upapproach.
4. Conclusions
The combination of automated sample introduction, the highresolution and high mass accuracy of the hybrid LTQ-Orbitrapand customized software algorithms written in-house (BUPIDtop-down) provides an integrated analytical platform amenableto the analysis of TTR and hemoglobin variants and their post-translational modifications. The method easily lend itself toautomation for use in clinical laboratories. Two limitations shouldbe noted: (1) the method achieves high sequence coverage butdoes not provide specific information for every amino acid posi-tion. (2) Variants that produce isobaric molecular (and primaryfragment ions) cannot be detected by measurement of the molecu-lar weights of the proteins (and/or their primary fragments) andtherefore will be fully characterized only through MS3or higher
stage measurements. However, TTR and hemoglobin variant char-acterizations by MS in a clinical context are usually preceded bymore conventional tests [47]. These tests and the clinical definitionof a phenotype may narrow the options that need to be consideredduring the MS analysis and may lead one to carry out MSn analy-
l of M
sststacrctltif
atni
A
aTTh
A
t
R
[
[
[
[
[
[
[
[
[
[
[
[
[
[[
[
[
[
[
[
[
[
[
[
[
[
[
[
[
[
[
R. Théberge et al. / International Journa
is in the absence of a detectable mass shift. The ease of use andimplicity of the method and its ability to yield substantial struc-ural information without labor-intensive and time-consumingample preparation are remarkable. Furthermore, the instrumentime is efficiently used, given that lengthy chromatographic sep-rations are avoided. The data necessary for top-down analysisan be acquired in about 5 min. A typical LCMS experiment willun 30–60 min, plus the time required for re-equilibration of thehromatographic system. The results shown here indicate that CIDechniques are very effective when judiciously used. Neverthe-ess, the use of ETD or ECD could generate data complementaryo that obtained by NSD of the proteins of interest in these stud-es. Our preliminary FT-ICR data indicates that this approach iseasible.
The top-down approach described herein is ideal for small,bundant, easily isolated and clinically relevant proteins such asransthyretin and hemoglobins. The LTQ-Orbitrap offers a conve-ient means of generating top-down data in a routine manner and
ts capabilities in this domain are ready to be more fully exploited.
cknowledgements
This research is supported by NIH-NCRR grants P41 RR010888nd S10 RR020946 and by NIH-NHLBI contract N01 HV028178.ransthyretin samples were supplied by the BUSM Amyloidreatment and Research Program. Samples containing variantemoglobins were provided by the BUSM Sickle Cell Center.
ppendix A. Supplementary data
Supplementary data associated with this article can be found, inhe online version, at doi:10.1016/j.ijms.2010.08.012.
eferences
[1] R. Aebersold, M. Mann, Mass spectrometry-based proteomics, Nature 422(2003) 198–207.
[2] B.T. Chait, Mass spectrometry: bottom-up or top-down? Science 314 (2006)65–66.
[3] N.L. Kelleher, H.Y. Lin, G.A. Valaskovic, D.J. Aaserud, E.K. Fridriksson, F.W. McLaf-ferty, Top down versus bottom up protein characterization by tandem highresolution mass spectrometry, J. Am. Chem. Soc. 121 (1999) 806–812.
[4] N. Siuti, N.L. Kelleher, Decoding protein modifications using top-down massspectrometry, Nat. Methods 4 (2007) 817–821.
[5] Y. Wada, T. Matsuo, I.A. Papayannopoulos, C.E. Costello, K. Biemann, Fastatom bombardment and tandem mass spectrometry for the characterizationof hemoglobin variants including a new variant, Int. J. Mass Spectrom. IonProcesses 122 (1992) 219–229.
[6] Y.A. Daniel, C. Turner, R.M. Haynes, B.J. Hunt, R. Neil Dalton, Rapid and spe-cific detection of clinically significant haemoglobinopathies using electrospraymass spectrometry–mass spectrometry, Br. J. Haematol. 130 (2005) 635–643.
[7] J.A. Loo, C.G. Edmonds, R.D. Smith, Primary sequence information from intactproteins by electrospray ionization tandem mass spectrometry, Science 248(1990) 201–204.
[8] K.J. Lightwahl, J.A. Loo, C.G. Edmonds, R.D. Smith, H.E. Witkowska, C.H.L.Shackleton, C.S.C. Wu, Collisionally activated dissociation and tandemmass-spectrometry of intact hemoglobin beta-chain variant proteins with elec-trospray ionization, Biol. Mass Spectrom. 22 (1993) 112–120.
[9] G.E. Reid, S.A. McLuckey, ‘Top down’ protein characterization via tandem massspectrometry, J. Mass Spectrom. 37 (2002) 663–675.
10] M. Thevis, R.R.O. Loo, J.A. Loo, Mass spectrometric characterization of transfer-rins and their fragments derived by reduction of disulfide bonds, J. Am. Soc.Mass Spectrom. 14 (2003) 635–647.
11] H.E. Witkowska, B.N. Green, M. Morris, C.H.L. Shackleton, Intact protein electro-spray ionization tandem mass spectrometry can be the sole technique used forconfirming the structure of a variant hemoglobin, J. Mass Spectrom. 30 (1995)S111–S115.
12] J.A. Loo, J.P. Quinn, S.I. Ryu, K.D. Henry, M.W. Senko, F.W. McLafferty, High-resolution tandem mass spectrometry of large biomolecules, Proc. Natl. Acad.
Sci. U.S.A. 89 (1992) 286–289.13] F.W. McLafferty, High-resolution tandem FT mass-spectrometry above 10-kDa,Acc. Chem. Res. 27 (1994) 379–386.
14] D.P. Little, J.P. Speir, M.W. Senko, P.B. O’Connor, F.W. McLafferty, Infrared multi-photon dissociation of large multiply-charged ions for biomolecule sequencing,Anal. Chem. 66 (1994) 2809–2815.
[
[
ass Spectrometry 300 (2011) 130–142 141
15] R.A. Zubarev, N.L. Kelleher, F.W. McLafferty, Electron capture dissociation ofmultiply charged protein cations. A nonergodic process, J. Am. Chem. Soc. 120(1998) 3265–3266.
16] J.E.P. Syka, J.J. Coon, M.J. Schroeder, J. Shabanowitz, D.F. Hunt, Peptide and pro-tein sequence analysis by electron transfer dissociation mass spectrometry,Proc. Natl. Acad. Sci. U.S.A. 101 (2004) 9528–9533.
17] J.W. Gauthier, T.R. Trautman, D.B. Jacobson, Sustained off-resonanceirradiation for collision-activated dissociationiinvolving Fourier-transformmass spectrometry—collision-activated dissociation technique that emulatesinfrared multiphoton dissociation, Anal. Chim. Acta 246 (1991) 211–225.
18] M. Hardman, A.A. Makarov, Interfacing the orbitrap mass analyzer to an elec-trospray ion source, Anal. Chem. 75 (2003) 1699–1705.
19] B. Macek, L.F. Waanders, J.V. Olsen, M. Mann, Top-down protein sequencingand MS3 on a hybrid linear quadrupole ion trap-orbitrap mass spectrometer,Mol. Cell. Proteomics 5 (2006) 949–958.
20] Z.Q. Zhang, B. Shah, Characterization of variable regions of monoclonal anti-bodies by top-down mass spectrometry, Anal. Chem. 79 (2007) 5723–5729.
21] P.V. Bondarenko, T.P. Second, V. Zabrouskov, A.A. Makarov, Z.Q. Zhang, Massmeasurement and top-down HPLC/MS analysis of intact monoclonal antibodieson a hybrid Linear Quadrupole Ion Trap-Orbitrap mass spectrometer, J. Am. Soc.Mass Spectrom. 20 (2009) 1415–1424.
22] M.D. Benson, T. Uemichi, Transthyretin amyloidosis, Amyloid-Int. J. Exp. Clin.Invest. 3 (1996) 44–56.
23] http://globin.cse.psu.edu.24] R. Theberge, L. Connors, M. Skinner, J. Skare, C.E. Costello, Characteri-
zation of transthyretin mutants from serum using immunoprecipitation,HPLC/electrospray ionization and matrix-assisted laser desorption/ionizationmass spectrometry, Anal. Chem. 71 (1999) 452–459.
25] C.H.L. Shackleton, A.M. Falick, B.N. Green, H.E. Witkowska, Electrospray massspectrometry in the clinical diagnosis of variant hemoglobins, J. Chromatogr.-Biomed. Appl. 562 (1991) 175–190.
26] A. Shimizu, T. Nakanishi, A. Miyazaki, Detection and characterization of variantand modified structures of proteins in blood and tissues by mass spectrometry,Mass Spectrom. Rev. 25 (2006) 686–712.
27] H.R. Bergen, S.R. Zeldenrust, M.L. Butz, D.S. Snow, P.J. Dyck, P.J.B. Dyck, C.J. Klein,J.F. O’Brien, S.N. Thibodeau, D.C. Muddiman, Identification of transthyretin vari-ants by sequential proteomic and genomic analysis, Clin. Chem. 50 (2004)1544–1552.
28] A.I. Nepomuceno, C.J. Mason, D.C. Muddiman, H.R. Bergen, S.R. Zeldenrust,Detection of genetic variants of transthyretin by liquid chromatography-dualelectrospray ionization Fourier-transform ion-cyclotron-resonance mass spec-trometry, Clin. Chem. 50 (2004) 1535–1543.
29] J.S. Kingsbury, R. Theberge, J.A. Karbassi, A. Lim, C.E. Costello, L.H. Connors,Detailed structural analysis of amyloidogenic wild-type transthyretin usinga novel purification strategy and mass spectrometry, Anal. Chem. 79 (2007)1990–1998.
30] G.E. Reid, J. Wu, P.A. Chrisman, J.M. Wells, S.A. McLuckey, Charge-state-dependent sequence analysis of protonated ubiquitin ions via ion trap tandemmass spectrometry, Anal. Chem. 73 (2001) 3274–3281.
31] C.H.L. Shackleton, H.E. Witkowska, Characterizing abnormal hemoglobin byMS, Anal. Chem. 68 (1996) A29–A33.
32] A. Lim, T. Prokaeva, M.E. McComb, P.B. O’Connor, R. Theberge, L.H. Connors,M. Skinner, C.E. Costello, Characterization of transthyretin variants in familialtransthyretin amyloidosis by mass spectrometric peptide mapping and DNAsequence analysis, Anal. Chem. 74 (2002) 741–751.
33] R.T.W. Tong, G. Infusini, W. Cui, D.H. Perlman, C. Lin, M.E. Mccomb, C.E. Costello,BUPID-top-down: database search and assignment of top-down MS/MS data,in: Proceedings of the 57th American Society Conference on Mass Spectrometryand Allied Topics, Philadelphia, PA, 2009.
34] G.C. McAlister, W.T. Berggren, J. Griep-Raming, S. Horning, A. Makarov, D.Phanstiel, G. Stafford, D.L. Swaney, J.E.P. Syka, V. Zabrouskov, J.J. Coon, Aproteomics grade electron transfer dissociation-enabled hybrid linear ion trap-orbitrap mass spectrometer, J. Proteome Res. 7 (2008) 3127–3136.
35] T.T. Mekecha, R. Amunugama, S.A. McLuckey, Ion trap collision-induced disso-ciation of human hemoglobin alpha-chain cations, J. Am. Soc. Mass Spectrom.17 (2006) 923–931.
36] G.L. Nelsestuen, Y. Zhang, M.B. Martinez, N.S. Key, B. Jilma, M. Verneris, A.Sinaiko, R.S. Kasthuri, Plasma protein profiling: unique and stable features ofindividuals, Proteomics 5 (2005) 4012–4024.
37] U.A. Kiernan, D. Nedelkov, R.W. Nelson, Multiplexed mass spectrometricimmunoassay in biomarker research: a novel approach to the determinationof a myocardial infarct, J. Proteome Res. 5 (2006) 2928–2934.
38] M.J. Raftery, Selective detection of thiosulfate-containing peptides using tan-dem mass spectrometry, Rapid Commun. Mass Spectrom. 19 (2005) 674–682.
39] R. Theberge, Y. Jiang, M.E. McComb, T. Prokaeva, L.H. Connors, M. Skinner, D.C.Seldin, C.E. Costello, Detection and Characterization of Immunoglobulin LightChain Post-translational Modifications Using LC/MS–MS/MS, CRC Press-Taylor& Francis Group, Boca Raton, 2008.
40] H. Zhai, X.M. Han, K. Breuker, F.W. McLafferty, Consecutive ion activation for topdown mass spectrometry: improved protein sequencing by nozzle-skimmer
dissociation, Anal. Chem. 77 (2005) 5777–5784.41] E.R. Badman, C.S. Hoaglund-Hyzer, D.E. Clemmer, Dissociation of different con-formations of ubiquitin ions, J. Am. Soc. Mass Spectrom. 13 (2002) 719–723.
42] D.R. Jacobson, I.L. Alves, M.J. Saraiva, S.N. Thibodeau, J.N. Buxbaum,Transthyretin Ser-6 gene frequency in individuals without amyloidosis, Hum.Genet. 95 (1995) 308–312.

1 l of M
[
[
[
42 R. Théberge et al. / International Journa
43] R. Bakhtiar, Q. Wu, S.A. Hofstadler, R.D. Smith, Charge-state specific facile gas-
phase cleavage of Asp-75 Met-76 peptide bond in the alpha-chain of humanapohemoglobin probed by electrospray-ionization mass spectrometry, Biol.Mass Spectrom. 23 (1994) 707–710.44] T.G. Schaaff, B.J. Cargile, J.L. Stephenson, S.A. McLuckey, Ion trap collisionalactivation of the (M+2H)(2+)–(M+17H)(17+) ions of human hemoglobin beta-chain, Anal. Chem. 72 (2000) 899–907.
[
[
ass Spectrometry 300 (2011) 130–142
45] D.K. Rai, B. Landin, G. Alvelius, W.J. Griffiths, Electrospray tandem mass spec-
trometry of intact beta-chain hemoglobin variants, Anal. Chem. 74 (2002)2097–2102.46] T. Niwa, Protein glutathionylation and oxidative stress, J. Chromatogr. B 855(2007) 59–65.
47] B.J. Wild, B.J. Bain, Detection and quantitation of normal and varianthaemoglobins: an analytical review, Ann. Clin. Biochem. 41 (2004) 355–369.