Embed Size (px)
Citation preview
International Journal of Mass Spectrometry 370 (2014) 114–124
Optimization of the discrete pulse sequence for two-dimensionalFT-ICR mass spectrometry using infrared multiphoton dissociation
Maria A. van Agthoven a,1, Lionel Chiron b, Marie-Aude Coutouly c,Akansha Ashvani Sehgal d, Philippe Pelupessy d, Marc-André Delsuc b,c,Christian Rolando a,*aMiniaturisation pour la Synthèse, l'Analyse & la Protéomique (MSAP), USR CNRS 3290, and Protéomique, Modifications Post-traductionnelles etGlycobiologie, IFR 147 and Institut Eugène-Michel Chevreul, FR CNRS 2638, Université de Lille 1 Sciences et Technologies,59655 Villeneuve d'Ascq Cedex, Franceb Institut de Génétique et de Biologie Moléculaire et Cellulaire, U 964 INSERM, UMR 7104 CNRS, Université de Strasbourg, 1 rue Laurent Fries,67404 Illkirch-Graffenstaden, FrancecNMRTEC, Boulevard Sébastien Brandt, Bioparc, Batiment B, 67400 Illkirch-Graffenstaden, Franced Laboratoire des Biomolécules (LMB), Département de Chimie, UMR 7203, Ecole Normale Supérieure, 24, rue Lhomond, 75231 Paris cedex 05, France
A R T I C L E I N F O
Article history:Received 15 March 2014Received in revised form 9 June 2014Accepted 23 June 2014Available online 24 June 2014
Keywords:FT-ICR2-dimensionalIRMPDFTMSPulse sequenceOptimization
A B S T R A C T
2D FT-ICR MS, introduced by Pfändler et al. (Chem. Phys. Lett. 138 (1987) 195), allows one to correlateprecursor and fragment ions in complex samples without requiring ion isolation. Recent advances inelectronics, computer capacities, and gas-free in-cell fragmentation techniques open up newperspectives for 2D FT-ICR MS as an analytical technique. The pulse sequence consists of two encodingpulses separated by an incremental delay, followed by an observe pulse. In our previous 2D FT-ICR MSwork we used three pulses of equal duration and amplitude. However, signal intensity was low because itwas distributed over a series of intense harmonics. Using a simple theoretical model to analyticallyexpress ion fragmentation and 2D FT-ICR MS ion trajectories, we obtained a nearly pure signal when themaximum radius of the ions during the encoding pulses is within the laser beam. By adjusting theexperimental parameters of the encoding pulses according to the calculation on the same cyclotronradius, we strongly decrease the intensity of harmonic peaks. We also discuss the effect of increasing theamplitude of the observe pulse, which affects precursor and fragment ion peaks differently in terms ofsignal-to-noise ratio. The 2D mass spectra obtained with the optimized pulse sequence show a muchhigher signal-to-noise ratio, even without using denoising algorithms.
ã 2014 Elsevier B.V. All rights reserved.
Contents lists available at ScienceDirect
International Journal of Mass Spectrometry
journa l homepage : www.e l sev ier .com/ loca te / i jms
1. Introduction
Two-dimensional Fourier transform ion cyclotron resonancemass spectrometry (2D FT-ICR MS) is a technique that uses an FT-ICR mass analyzer to reveal correlations between precursor andfragment ions without requiring ion isolation [1]. By modulatingthe radii of precursor ions in the ICR cell, 2D FT-ICR MS yields two-
* Corresponding author at: Miniaturisation pour la Synthèse, l'Analyse & laProtéomique (MSAP), USR CNRS 3290, bât C4, Université de Lille 1 Sciences etTechnologies, 59655 Villeneuve d'Ascq Cedex, France.Tel.: +33 3 20 43 49 77; fax: +33 3 20 33 61 36.
E-mail addresses: [email protected],[email protected] (C. Rolando).
1 Current address: Department of Chemistry, University of Warwick, Gibbet HillRoad, CV4 7AL Coventry, United Kingdom.
http://dx.doi.org/10.1016/j.ijms.2014.06.0191387-3806/ã 2014 Elsevier B.V. All rights reserved.
dimensional maps that show correlated signals of precursor andfragment ions. Fragment ion spectra (corresponding to MS/MS) areshown horizontally and precursor ion spectra are shown vertically.
In 1987, Pfändler et al. developed a pulse sequence for two-dimensional FT-ICR MS inspired by two-dimensional exchangeNMR spectroscopy (EXSY) [2,3] and that uses the idea of the “de-excitation” of ions in the ICR cell [4–6]. Ion radii are determined bytwo identical radiofrequency pulses separated by an evolutioninterval t1. During t1, the ion packet acquires a phase ’ ¼ vICRt1, inwhich vICR is the reduced cyclotron frequency of the ion. At thestart of the second pulse, there is a phase difference between theion packet and the pulse, so that the radius at the end of the secondpulse is a periodic function of f, i.e., of the product of the reducedcyclotron frequency and the duration t1. Any radius-dependentfragmentation method applied after the second pulse of thesequence (ion-molecule reactions, collision induced dissociation,
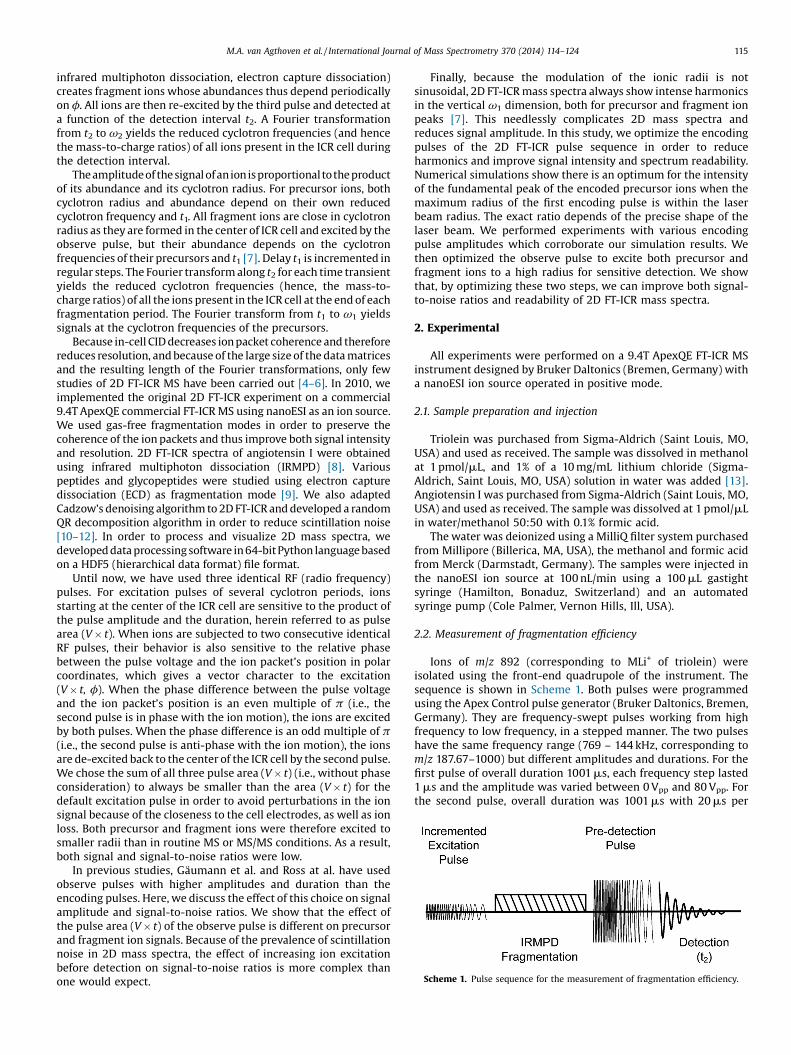
Scheme 1. Pulse sequence for the measurement of fragmentation efficiency.
M.A. van Agthoven et al. / International Journal of Mass Spectrometry 370 (2014) 114–124 115
infrared multiphoton dissociation, electron capture dissociation)creates fragment ions whose abundances thus depend periodicallyon f. All ions are then re-excited by the third pulse and detected ata function of the detection interval t2. A Fourier transformationfrom t2 to v2 yields the reduced cyclotron frequencies (and hencethe mass-to-charge ratios) of all ions present in the ICR cell duringthe detection interval.
Theamplitudeof thesignal ofanion isproportional tothe productof its abundance and its cyclotron radius. For precursor ions, bothcyclotron radius and abundance depend on their own reducedcyclotron frequency and t1. All fragment ions are close in cyclotronradius as they are formed in the center of ICR cell and excited by theobserve pulse, but their abundance depends on the cyclotronfrequencies of their precursors and t1 [7]. Delay t1 is incremented inregular steps. The Fourier transform along t2 for each time transientyields the reduced cyclotron frequencies (hence, the mass-to-charge ratios) of all the ions present in the ICR cell at the end of eachfragmentation period. The Fourier transform from t1 to v1 yieldssignals at the cyclotron frequencies of the precursors.
Because in-cell CID decreases ion packet coherence and thereforereduces resolution, and because of the large size of the data matricesand the resulting length of the Fourier transformations, only fewstudies of 2D FT-ICR MS have been carried out [4–6]. In 2010, weimplemented the original 2D FT-ICR experiment on a commercial9.4T ApexQE commercial FT-ICR MS using nanoESI as an ion source.We used gas-free fragmentation modes in order to preserve thecoherence of the ion packets and thus improve both signal intensityand resolution. 2D FT-ICR spectra of angiotensin I were obtainedusing infrared multiphoton dissociation (IRMPD) [8]. Variouspeptides and glycopeptides were studied using electron capturedissociation (ECD) as fragmentation mode [9]. We also adaptedCadzow’s denoising algorithm to 2D FT-ICR and developed a randomQR decomposition algorithm in order to reduce scintillation noise[10–12]. In order to process and visualize 2D mass spectra, wedeveloped data processing software in 64-bit Python language basedon a HDF5 (hierarchical data format) file format.
Until now, we have used three identical RF (radio frequency)pulses. For excitation pulses of several cyclotron periods, ionsstarting at the center of the ICR cell are sensitive to the product ofthe pulse amplitude and the duration, herein referred to as pulsearea (V � t). When ions are subjected to two consecutive identicalRF pulses, their behavior is also sensitive to the relative phasebetween the pulse voltage and the ion packet’s position in polarcoordinates, which gives a vector character to the excitation(V � t, f). When the phase difference between the pulse voltageand the ion packet’s position is an even multiple of p (i.e., thesecond pulse is in phase with the ion motion), the ions are excitedby both pulses. When the phase difference is an odd multiple of p(i.e., the second pulse is anti-phase with the ion motion), the ionsare de-excited back to the center of the ICR cell by the second pulse.We chose the sum of all three pulse area (V � t) (i.e., without phaseconsideration) to always be smaller than the area (V � t) for thedefault excitation pulse in order to avoid perturbations in the ionsignal because of the closeness to the cell electrodes, as well as ionloss. Both precursor and fragment ions were therefore excited tosmaller radii than in routine MS or MS/MS conditions. As a result,both signal and signal-to-noise ratios were low.
In previous studies, Gäumann et al. and Ross at al. have usedobserve pulses with higher amplitudes and duration than theencoding pulses. Here, we discuss the effect of this choice on signalamplitude and signal-to-noise ratios. We show that the effect ofthe pulse area (V � t) of the observe pulse is different on precursorand fragment ion signals. Because of the prevalence of scintillationnoise in 2D mass spectra, the effect of increasing ion excitationbefore detection on signal-to-noise ratios is more complex thanone would expect.
Finally, because the modulation of the ionic radii is notsinusoidal, 2D FT-ICR mass spectra always show intense harmonicsin the vertical v1 dimension, both for precursor and fragment ionpeaks [7]. This needlessly complicates 2D mass spectra andreduces signal amplitude. In this study, we optimize the encodingpulses of the 2D FT-ICR pulse sequence in order to reduceharmonics and improve signal intensity and spectrum readability.Numerical simulations show there is an optimum for the intensityof the fundamental peak of the encoded precursor ions when themaximum radius of the first encoding pulse is within the laserbeam radius. The exact ratio depends of the precise shape of thelaser beam. We performed experiments with various encodingpulse amplitudes which corroborate our simulation results. Wethen optimized the observe pulse to excite both precursor andfragment ions to a high radius for sensitive detection. We showthat, by optimizing these two steps, we can improve both signal-to-noise ratios and readability of 2D FT-ICR mass spectra.
2. Experimental
All experiments were performed on a 9.4T ApexQE FT-ICR MSinstrument designed by Bruker Daltonics (Bremen, Germany) witha nanoESI ion source operated in positive mode.
2.1. Sample preparation and injection
Triolein was purchased from Sigma-Aldrich (Saint Louis, MO,USA) and used as received. The sample was dissolved in methanolat 1 pmol/mL, and 1% of a 10 mg/mL lithium chloride (Sigma-Aldrich, Saint Louis, MO, USA) solution in water was added [13].Angiotensin I was purchased from Sigma-Aldrich (Saint Louis, MO,USA) and used as received. The sample was dissolved at 1 pmol/mLin water/methanol 50:50 with 0.1% formic acid.
The water was deionized using a MilliQ filter system purchasedfrom Millipore (Billerica, MA, USA), the methanol and formic acidfrom Merck (Darmstadt, Germany). The samples were injected inthe nanoESI ion source at 100 nL/min using a 100 mL gastightsyringe (Hamilton, Bonaduz, Switzerland) and an automatedsyringe pump (Cole Palmer, Vernon Hills, Ill, USA).
2.2. Measurement of fragmentation efficiency
Ions of m/z 892 (corresponding to MLi+ of triolein) wereisolated using the front-end quadrupole of the instrument. Thesequence is shown in Scheme 1. Both pulses were programmedusing the Apex Control pulse generator (Bruker Daltonics, Bremen,Germany). They are frequency-swept pulses working from highfrequency to low frequency, in a stepped manner. The two pulseshave the same frequency range (769 – 144 kHz, corresponding tom/z 187.67–1000) but different amplitudes and durations. For thefirst pulse of overall duration 1001 ms, each frequency step lasted1 ms and the amplitude was varied between 0 Vpp and 80 Vpp. Forthe second pulse, overall duration was 1001 ms with 20 ms per
116 M.A. van Agthoven et al. / International Journal of Mass Spectrometry 370 (2014) 114–124
frequency step and an amplitude of 100 Vpp (default conditions forthe excitation voltage in Apex Control).
IRMPD was performed using a Synrad 48–2 25 W CO2 laser witha 10.6 mm wavelength (Mukilteo, Washington, USA). The powerlevel was set to 50% over a 2 s period. Data processing wasperformed using the Apex Control 2.0.0 and Data Analysis 3.4software provided by Bruker Daltonics (Bremen, Germany). Thefragmentation efficiency for each excitation amplitude wascalculated by dividing the sum of the intensities of all fragmentpeaks by the sum of the intensities of all peaks.
2.3. 2D FT-ICR mass spectra
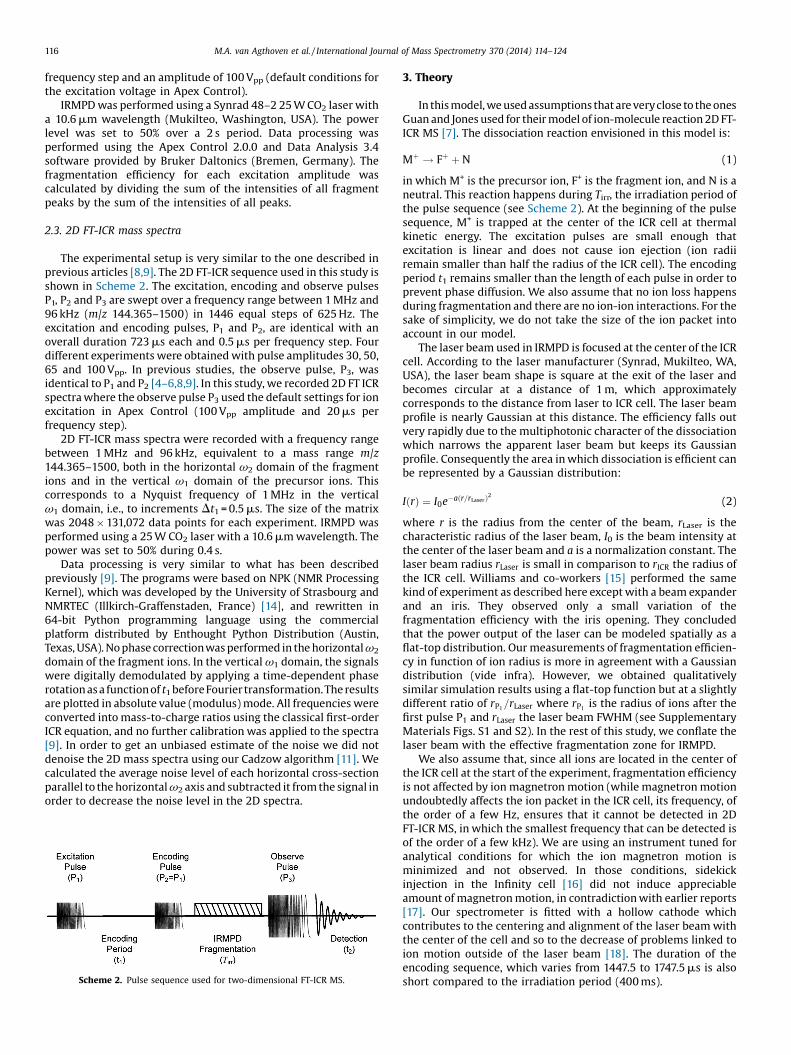
The experimental setup is very similar to the one described inprevious articles [8,9]. The 2D FT-ICR sequence used in this study isshown in Scheme 2. The excitation, encoding and observe pulsesP1, P2 and P3 are swept over a frequency range between 1 MHz and96 kHz (m/z 144.365–1500) in 1446 equal steps of 625 Hz. Theexcitation and encoding pulses, P1 and P2, are identical with anoverall duration 723 ms each and 0.5 ms per frequency step. Fourdifferent experiments were obtained with pulse amplitudes 30, 50,65 and 100 Vpp. In previous studies, the observe pulse, P3, wasidentical to P1 and P2 [4–6,8,9]. In this study, we recorded 2D FT ICRspectra where the observe pulse P3 used the default settings for ionexcitation in Apex Control (100 Vpp amplitude and 20 ms perfrequency step).
2D FT-ICR mass spectra were recorded with a frequency rangebetween 1 MHz and 96 kHz, equivalent to a mass range m/z144.365–1500, both in the horizontal v2 domain of the fragmentions and in the vertical v1 domain of the precursor ions. Thiscorresponds to a Nyquist frequency of 1 MHz in the verticalv1 domain, i.e., to increments Dt1 = 0.5 ms. The size of the matrixwas 2048 � 131,072 data points for each experiment. IRMPD wasperformed using a 25 W CO2 laser with a 10.6 mm wavelength. Thepower was set to 50% during 0.4 s.
Data processing is very similar to what has been describedpreviously [9]. The programs were based on NPK (NMR ProcessingKernel), which was developed by the University of Strasbourg andNMRTEC (Illkirch-Graffenstaden, France) [14], and rewritten in64-bit Python programming language using the commercialplatform distributed by Enthought Python Distribution (Austin,Texas, USA). No phase correctionwas performed in the horizontal v2
domain of the fragment ions. In the vertical v1 domain, the signalswere digitally demodulated by applying a time-dependent phaserotation as a function of t1beforeFourier transformation.The resultsare plotted in absolute value (modulus) mode. All frequencies wereconverted into mass-to-charge ratios using the classical first-orderICR equation, and no further calibration was applied to the spectra[9]. In order to get an unbiased estimate of the noise we did notdenoise the 2D mass spectra using our Cadzow algorithm [11]. Wecalculated the average noise level of each horizontal cross-sectionparallel to the horizontal v2 axis and subtracted it from the signal inorder to decrease the noise level in the 2D spectra.
Scheme 2. Pulse sequence used for two-dimensional FT-ICR MS.
3. Theory
In this model, we used assumptions that are veryclose to the onesGuan and Jones used for their model of ion-molecule reaction 2D FT-ICR MS [7]. The dissociation reaction envisioned in this model is:
Mþ ! Fþ þ N (1)
in which M+ is the precursor ion, F+ is the fragment ion, and N is aneutral. This reaction happens during Tirr, the irradiation period ofthe pulse sequence (see Scheme 2). At the beginning of the pulsesequence, M+ is trapped at the center of the ICR cell at thermalkinetic energy. The excitation pulses are small enough thatexcitation is linear and does not cause ion ejection (ion radiiremain smaller than half the radius of the ICR cell). The encodingperiod t1 remains smaller than the length of each pulse in order toprevent phase diffusion. We also assume that no ion loss happensduring fragmentation and there are no ion-ion interactions. For thesake of simplicity, we do not take the size of the ion packet intoaccount in our model.
The laser beam used in IRMPD is focused at the center of the ICRcell. According to the laser manufacturer (Synrad, Mukilteo, WA,USA), the laser beam shape is square at the exit of the laser andbecomes circular at a distance of 1 m, which approximatelycorresponds to the distance from laser to ICR cell. The laser beamprofile is nearly Gaussian at this distance. The efficiency falls outvery rapidly due to the multiphotonic character of the dissociationwhich narrows the apparent laser beam but keeps its Gaussianprofile. Consequently the area in which dissociation is efficient canbe represented by a Gaussian distribution:
IðrÞ ¼ I0e�a r=rLaserð Þ2 (2)
where r is the radius from the center of the beam, rLaser is thecharacteristic radius of the laser beam, I0 is the beam intensity atthe center of the laser beam and a is a normalization constant. Thelaser beam radius rLaser is small in comparison to rICR the radius ofthe ICR cell. Williams and co-workers [15] performed the samekind of experiment as described here except with a beam expanderand an iris. They observed only a small variation of thefragmentation efficiency with the iris opening. They concludedthat the power output of the laser can be modeled spatially as aflat-top distribution. Our measurements of fragmentation efficien-cy in function of ion radius is more in agreement with a Gaussiandistribution (vide infra). However, we obtained qualitativelysimilar simulation results using a flat-top function but at a slightlydifferent ratio of rP1=rLaser where rP1 is the radius of ions after thefirst pulse P1 and rLaser the laser beam FWHM (see SupplementaryMaterials Figs. S1 and S2). In the rest of this study, we conflate thelaser beam with the effective fragmentation zone for IRMPD.
We also assume that, since all ions are located in the center ofthe ICR cell at the start of the experiment, fragmentation efficiencyis not affected by ion magnetron motion (while magnetron motionundoubtedly affects the ion packet in the ICR cell, its frequency, ofthe order of a few Hz, ensures that it cannot be detected in 2DFT-ICR MS, in which the smallest frequency that can be detected isof the order of a few kHz). We are using an instrument tuned foranalytical conditions for which the ion magnetron motion isminimized and not observed. In those conditions, sidekickinjection in the Infinity cell [16] did not induce appreciableamount of magnetron motion, in contradiction with earlier reports[17]. Our spectrometer is fitted with a hollow cathode whichcontributes to the centering and alignment of the laser beam withthe center of the cell and so to the decrease of problems linked toion motion outside of the laser beam [18]. The duration of theencoding sequence, which varies from 1447.5 to 1747.5 ms is alsoshort compared to the irradiation period (400 ms).
M.A. van Agthoven et al. / International Journal of Mass Spectrometry 370 (2014) 114–124 117
In IRMPD, fragmentation has been shown to obey first-orderkinetics with a rate constant that is proportional to the intensityof the laser beam [19]. If there is no radiative transfer loss whenthe ions are outside the laser beam as the characteristics time fordissociation (several hundredth of ms) is at least three orders ofmagnitude larger than the ions outside of the laser beam time(ca 100 ms) then the fragmentation efficiency F can beexpressed as:
FðT irr; IÞ ¼ 1 � e�I�T irr=Tr (3)
where I is the intensity of the laser beam, Tirr the irradiation periodand Tr the characteristic time at maximum beam intensity [15]. Inthis study, we chose Tirr so that a fragmentation at the center of thebeam is performed at 98% yield.
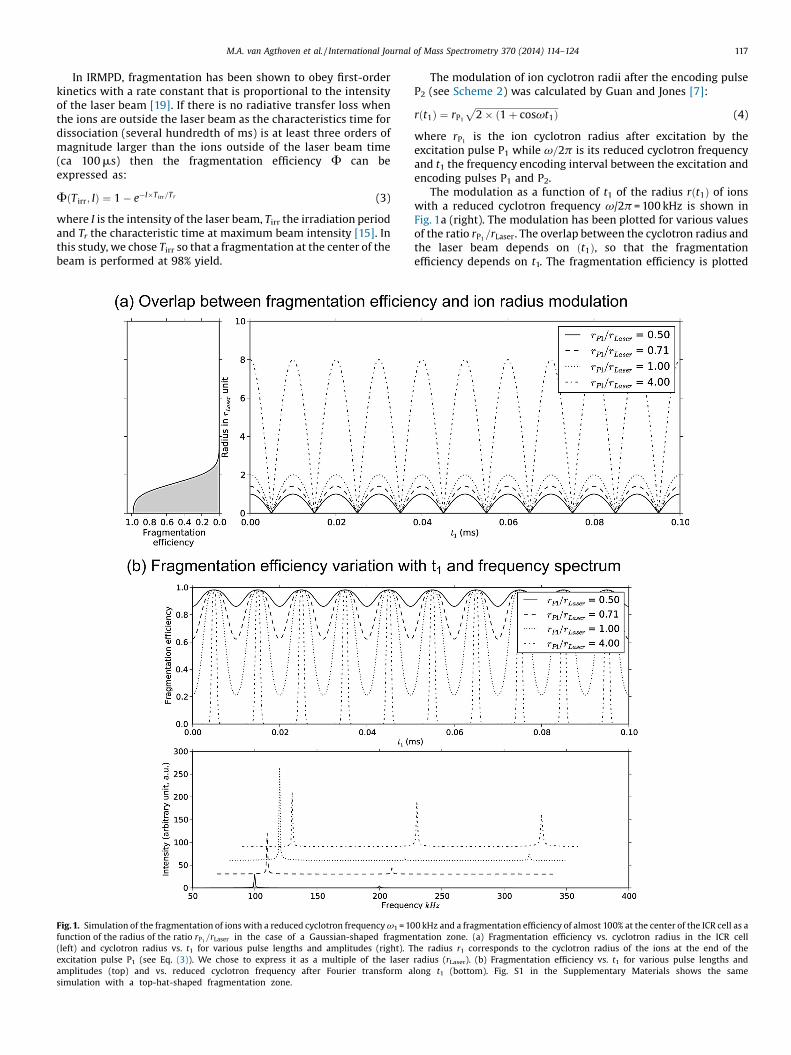
Fig. 1. Simulation of the fragmentation of ions with a reduced cyclotron frequency v1 = 10function of the radius of the ratio rP1=rLaser in the case of a Gaussian-shaped fragme(left) and cyclotron radius vs. t1 for various pulse lengths and amplitudes (right). Texcitation pulse P1 (see Eq. (3)). We chose to express it as a multiple of the laser
amplitudes (top) and vs. reduced cyclotron frequency after Fourier transform asimulation with a top-hat-shaped fragmentation zone.
The modulation of ion cyclotron radii after the encoding pulseP2 (see Scheme 2) was calculated by Guan and Jones [7]:
rðt1Þ ¼ rP1ffiffiffiffiffiffiffiffiffiffiffiffiffiffiffiffiffiffiffiffiffiffiffiffiffiffiffiffiffiffiffiffiffiffiffiffi2 � ð1 þ cosvt1Þ
p(4)
where rP1 is the ion cyclotron radius after excitation by theexcitation pulse P1 while v=2p is its reduced cyclotron frequencyand t1 the frequency encoding interval between the excitation andencoding pulses P1 and P2.
The modulation as a function of t1 of the radius rðt1Þ of ionswith a reduced cyclotron frequency v/2p = 100 kHz is shown inFig. 1a (right). The modulation has been plotted for various valuesof the ratio rP1=rLaser. The overlap between the cyclotron radius andthe laser beam depends on ðt1Þ, so that the fragmentationefficiency depends on t1. The fragmentation efficiency is plotted
0 kHz and a fragmentation efficiency of almost 100% at the center of the ICR cell as antation zone. (a) Fragmentation efficiency vs. cyclotron radius in the ICR cellhe radius r1 corresponds to the cyclotron radius of the ions at the end of theradius (rLaser). (b) Fragmentation efficiency vs. t1 for various pulse lengths andlong t1 (bottom). Fig. S1 in the Supplementary Materials shows the same
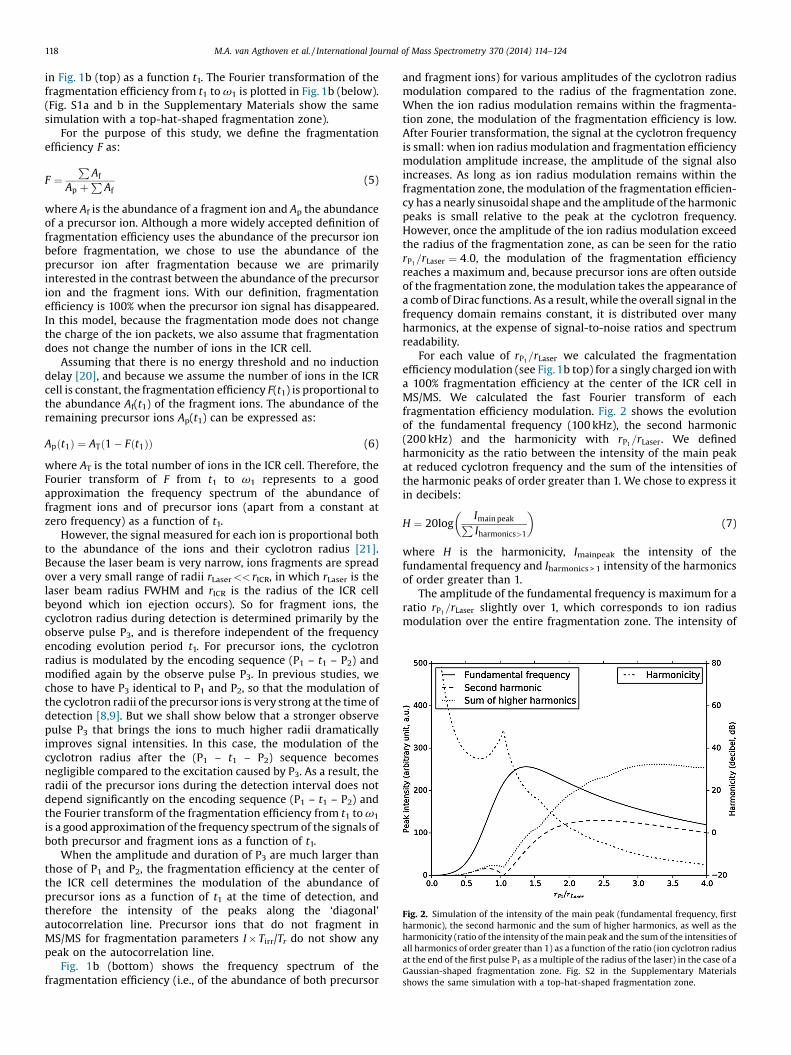
Fig. 2. Simulation of the intensity of the main peak (fundamental frequency, firstharmonic), the second harmonic and the sum of higher harmonics, as well as theharmonicity (ratio of the intensity of the main peak and the sum of the intensities ofall harmonics of order greater than 1) as a function of the ratio (ion cyclotron radiusat the end of the first pulse P1 as a multiple of the radius of the laser) in the case of aGaussian-shaped fragmentation zone. Fig. S2 in the Supplementary Materialsshows the same simulation with a top-hat-shaped fragmentation zone.
118 M.A. van Agthoven et al. / International Journal of Mass Spectrometry 370 (2014) 114–124
in Fig. 1b (top) as a function t1. The Fourier transformation of thefragmentation efficiency from t1 to v1 is plotted in Fig. 1b (below).(Fig. S1a and b in the Supplementary Materials show the samesimulation with a top-hat-shaped fragmentation zone).
For the purpose of this study, we define the fragmentationefficiency F as:
F ¼P
Af
Ap þP
Af(5)
where Af is the abundance of a fragment ion and Ap the abundanceof a precursor ion. Although a more widely accepted definition offragmentation efficiency uses the abundance of the precursor ionbefore fragmentation, we chose to use the abundance of theprecursor ion after fragmentation because we are primarilyinterested in the contrast between the abundance of the precursorion and the fragment ions. With our definition, fragmentationefficiency is 100% when the precursor ion signal has disappeared.In this model, because the fragmentation mode does not changethe charge of the ion packets, we also assume that fragmentationdoes not change the number of ions in the ICR cell.
Assuming that there is no energy threshold and no inductiondelay [20], and because we assume the number of ions in the ICRcell is constant, the fragmentation efficiency F(t1) is proportional tothe abundance Af(t1) of the fragment ions. The abundance of theremaining precursor ions Ap(t1) can be expressed as:
Apðt1Þ ¼ ATð1 � Fðt1ÞÞ (6)
where AT is the total number of ions in the ICR cell. Therefore, theFourier transform of F from t1 to v1 represents to a goodapproximation the frequency spectrum of the abundance offragment ions and of precursor ions (apart from a constant atzero frequency) as a function of t1.
However, the signal measured for each ion is proportional bothto the abundance of the ions and their cyclotron radius [21].Because the laser beam is very narrow, ions fragments are spreadover a very small range of radii rLaser<< rICR, in which rLaser is thelaser beam radius FWHM and rICR is the radius of the ICR cellbeyond which ion ejection occurs). So for fragment ions, thecyclotron radius during detection is determined primarily by theobserve pulse P3, and is therefore independent of the frequencyencoding evolution period t1. For precursor ions, the cyclotronradius is modulated by the encoding sequence (P1 – t1 – P2) andmodified again by the observe pulse P3. In previous studies, wechose to have P3 identical to P1 and P2, so that the modulation ofthe cyclotron radii of the precursor ions is very strong at the time ofdetection [8,9]. But we shall show below that a stronger observepulse P3 that brings the ions to much higher radii dramaticallyimproves signal intensities. In this case, the modulation of thecyclotron radius after the (P1 – t1 – P2) sequence becomesnegligible compared to the excitation caused by P3. As a result, theradii of the precursor ions during the detection interval does notdepend significantly on the encoding sequence (P1 – t1 – P2) andthe Fourier transform of the fragmentation efficiency from t1 to v1
is a good approximation of the frequency spectrum of the signals ofboth precursor and fragment ions as a function of t1.
When the amplitude and duration of P3 are much larger thanthose of P1 and P2, the fragmentation efficiency at the center ofthe ICR cell determines the modulation of the abundance ofprecursor ions as a function of t1 at the time of detection, andtherefore the intensity of the peaks along the ‘diagonal’autocorrelation line. Precursor ions that do not fragment inMS/MS for fragmentation parameters I � Tirr/Tr do not show anypeak on the autocorrelation line.
Fig. 1b (bottom) shows the frequency spectrum of thefragmentation efficiency (i.e., of the abundance of both precursor
and fragment ions) for various amplitudes of the cyclotron radiusmodulation compared to the radius of the fragmentation zone.When the ion radius modulation remains within the fragmenta-tion zone, the modulation of the fragmentation efficiency is low.After Fourier transformation, the signal at the cyclotron frequencyis small: when ion radius modulation and fragmentation efficiencymodulation amplitude increase, the amplitude of the signal alsoincreases. As long as ion radius modulation remains within thefragmentation zone, the modulation of the fragmentation efficien-cy has a nearly sinusoidal shape and the amplitude of the harmonicpeaks is small relative to the peak at the cyclotron frequency.However, once the amplitude of the ion radius modulation exceedthe radius of the fragmentation zone, as can be seen for the ratiorP1=rLaser ¼ 4:0, the modulation of the fragmentation efficiencyreaches a maximum and, because precursor ions are often outsideof the fragmentation zone, the modulation takes the appearance ofa comb of Dirac functions. As a result, while the overall signal in thefrequency domain remains constant, it is distributed over manyharmonics, at the expense of signal-to-noise ratios and spectrumreadability.
For each value of rP1=rLaser we calculated the fragmentationefficiency modulation (see Fig. 1b top) for a singly charged ion witha 100% fragmentation efficiency at the center of the ICR cell inMS/MS. We calculated the fast Fourier transform of eachfragmentation efficiency modulation. Fig. 2 shows the evolutionof the fundamental frequency (100 kHz), the second harmonic(200 kHz) and the harmonicity with rP1=rLaser. We definedharmonicity as the ratio between the intensity of the main peakat reduced cyclotron frequency and the sum of the intensities ofthe harmonic peaks of order greater than 1. We chose to express itin decibels:
H ¼ 20logImain peakPIharmonics>1
� �(7)
where H is the harmonicity, Imainpeak the intensity of thefundamental frequency and Iharmonics > 1 intensity of the harmonicsof order greater than 1.
The amplitude of the fundamental frequency is maximum for aratio rP1=rLaser slightly over 1, which corresponds to ion radiusmodulation over the entire fragmentation zone. The intensity of
M.A. van Agthoven et al. / International Journal of Mass Spectrometry 370 (2014) 114–124 119
the second harmonic peaks also shows a minimum for r1 slightlybelow 1, which corresponds to the fragmentation modulationwhich is closest to a sinusoid. We see that harmonicity ismaximum when harmonics are minimum. A compromise betweenthe intensity of the main peak and harmonicity can therefore befound around a ratio rP1=rLaser ffi 1.
4. Results and discussion
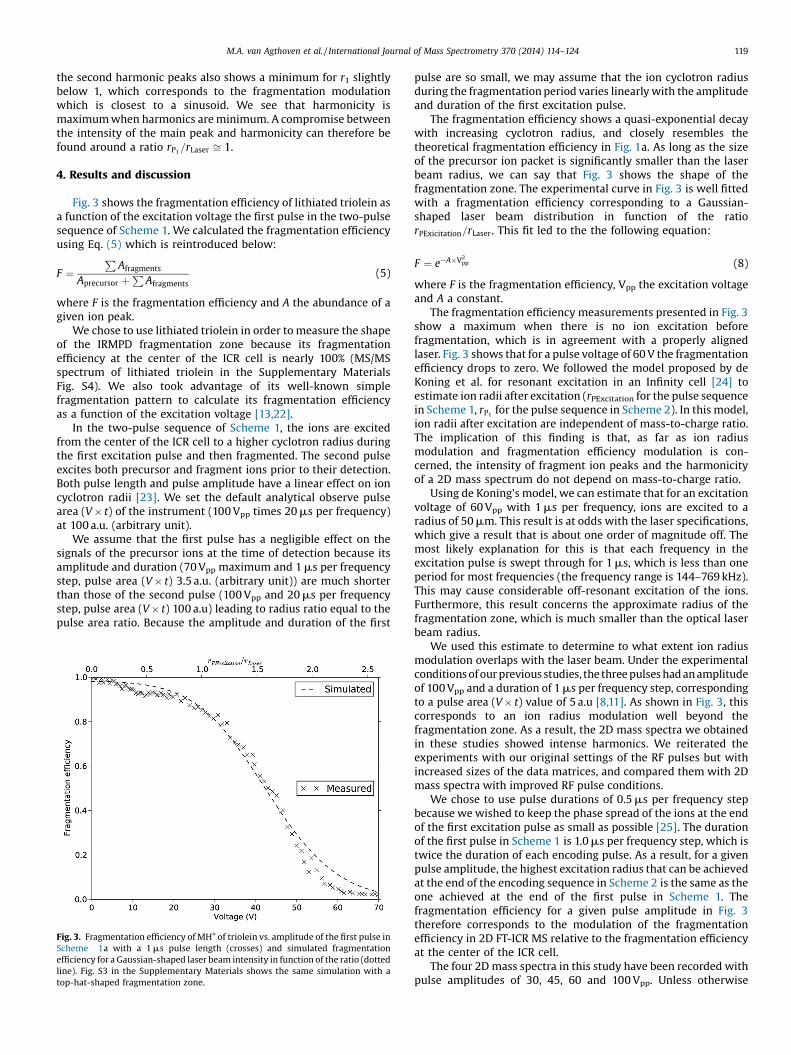
Fig. 3 shows the fragmentation efficiency of lithiated triolein asa function of the excitation voltage the first pulse in the two-pulsesequence of Scheme 1. We calculated the fragmentation efficiencyusing Eq. (5) which is reintroduced below:
F ¼P
Afragments
Aprecursor þP
Afragments(5)
where F is the fragmentation efficiency and A the abundance of agiven ion peak.
We chose to use lithiated triolein in order to measure the shapeof the IRMPD fragmentation zone because its fragmentationefficiency at the center of the ICR cell is nearly 100% (MS/MSspectrum of lithiated triolein in the Supplementary MaterialsFig. S4). We also took advantage of its well-known simplefragmentation pattern to calculate its fragmentation efficiencyas a function of the excitation voltage [13,22].
In the two-pulse sequence of Scheme 1, the ions are excitedfrom the center of the ICR cell to a higher cyclotron radius duringthe first excitation pulse and then fragmented. The second pulseexcites both precursor and fragment ions prior to their detection.Both pulse length and pulse amplitude have a linear effect on ioncyclotron radii [23]. We set the default analytical observe pulsearea (V � t) of the instrument (100 Vpp times 20 ms per frequency)at 100 a.u. (arbitrary unit).
We assume that the first pulse has a negligible effect on thesignals of the precursor ions at the time of detection because itsamplitude and duration (70 Vpp maximum and 1 ms per frequencystep, pulse area (V � t) 3.5 a.u. (arbitrary unit)) are much shorterthan those of the second pulse (100 Vpp and 20 ms per frequencystep, pulse area (V � t) 100 a.u) leading to radius ratio equal to thepulse area ratio. Because the amplitude and duration of the first
Fig. 3. Fragmentation efficiency of MH+ of triolein vs. amplitude of the first pulse inScheme 1a with a 1 ms pulse length (crosses) and simulated fragmentationefficiency for a Gaussian-shaped laser beam intensity in function of the ratio (dottedline). Fig. S3 in the Supplementary Materials shows the same simulation with atop-hat-shaped fragmentation zone.
pulse are so small, we may assume that the ion cyclotron radiusduring the fragmentation period varies linearly with the amplitudeand duration of the first excitation pulse.
The fragmentation efficiency shows a quasi-exponential decaywith increasing cyclotron radius, and closely resembles thetheoretical fragmentation efficiency in Fig. 1a. As long as the sizeof the precursor ion packet is significantly smaller than the laserbeam radius, we can say that Fig. 3 shows the shape of thefragmentation zone. The experimental curve in Fig. 3 is well fittedwith a fragmentation efficiency corresponding to a Gaussian-shaped laser beam distribution in function of the ratiorPExicitation=rLaser. This fit led to the the following equation:
F ¼ e�A�V2pp (8)
where F is the fragmentation efficiency, Vpp the excitation voltageand A a constant.
The fragmentation efficiency measurements presented in Fig. 3show a maximum when there is no ion excitation beforefragmentation, which is in agreement with a properly alignedlaser. Fig. 3 shows that for a pulse voltage of 60 V the fragmentationefficiency drops to zero. We followed the model proposed by deKoning et al. for resonant excitation in an Infinity cell [24] toestimate ion radii after excitation (rPExcitation for the pulse sequencein Scheme 1, rP1 for the pulse sequence in Scheme 2). In this model,ion radii after excitation are independent of mass-to-charge ratio.The implication of this finding is that, as far as ion radiusmodulation and fragmentation efficiency modulation is con-cerned, the intensity of fragment ion peaks and the harmonicityof a 2D mass spectrum do not depend on mass-to-charge ratio.
Using de Koning’s model, we can estimate that for an excitationvoltage of 60 Vpp with 1 ms per frequency, ions are excited to aradius of 50 mm. This result is at odds with the laser specifications,which give a result that is about one order of magnitude off. Themost likely explanation for this is that each frequency in theexcitation pulse is swept through for 1 ms, which is less than oneperiod for most frequencies (the frequency range is 144–769 kHz).This may cause considerable off-resonant excitation of the ions.Furthermore, this result concerns the approximate radius of thefragmentation zone, which is much smaller than the optical laserbeam radius.
We used this estimate to determine to what extent ion radiusmodulation overlaps with the laser beam. Under the experimentalconditions of our previous studies, the three pulses had an amplitudeof 100 Vpp and a duration of 1 ms per frequency step, correspondingto a pulse area (V � t) value of 5 a.u [8,11]. As shown in Fig. 3, thiscorresponds to an ion radius modulation well beyond thefragmentation zone. As a result, the 2D mass spectra we obtainedin these studies showed intense harmonics. We reiterated theexperiments with our original settings of the RF pulses but withincreased sizes of the data matrices, and compared them with 2Dmass spectra with improved RF pulse conditions.
We chose to use pulse durations of 0.5 ms per frequency stepbecause we wished to keep the phase spread of the ions at the endof the first excitation pulse as small as possible [25]. The durationof the first pulse in Scheme 1 is 1.0 ms per frequency step, which istwice the duration of each encoding pulse. As a result, for a givenpulse amplitude, the highest excitation radius that can be achievedat the end of the encoding sequence in Scheme 2 is the same as theone achieved at the end of the first pulse in Scheme 1. Thefragmentation efficiency for a given pulse amplitude in Fig. 3therefore corresponds to the modulation of the fragmentationefficiency in 2D FT-ICR MS relative to the fragmentation efficiencyat the center of the ICR cell.
The four 2D mass spectra in this study have been recorded withpulse amplitudes of 30, 45, 60 and 100 Vpp. Unless otherwise
120 M.A. van Agthoven et al. / International Journal of Mass Spectrometry 370 (2014) 114–124
specified, the pulse length was 0.5 ms per frequency, correspondingto pulse areas (V � t) of 0.75, 1.1, 1.5 and 2.5 a.u. respectively foreach pulse in the encoding sequence. At 30 Vpp, the modulation ofthe fragmentation efficiency at the end of the encoding sequence isapproximately 25% according to Fig. 3. At 45 Vpp, it is approxi-mately 57%. At 60 Vpp, it is approximately 95%. At 100 Vpp, themodulation of the ion radius extends far outside of thefragmentation zone.
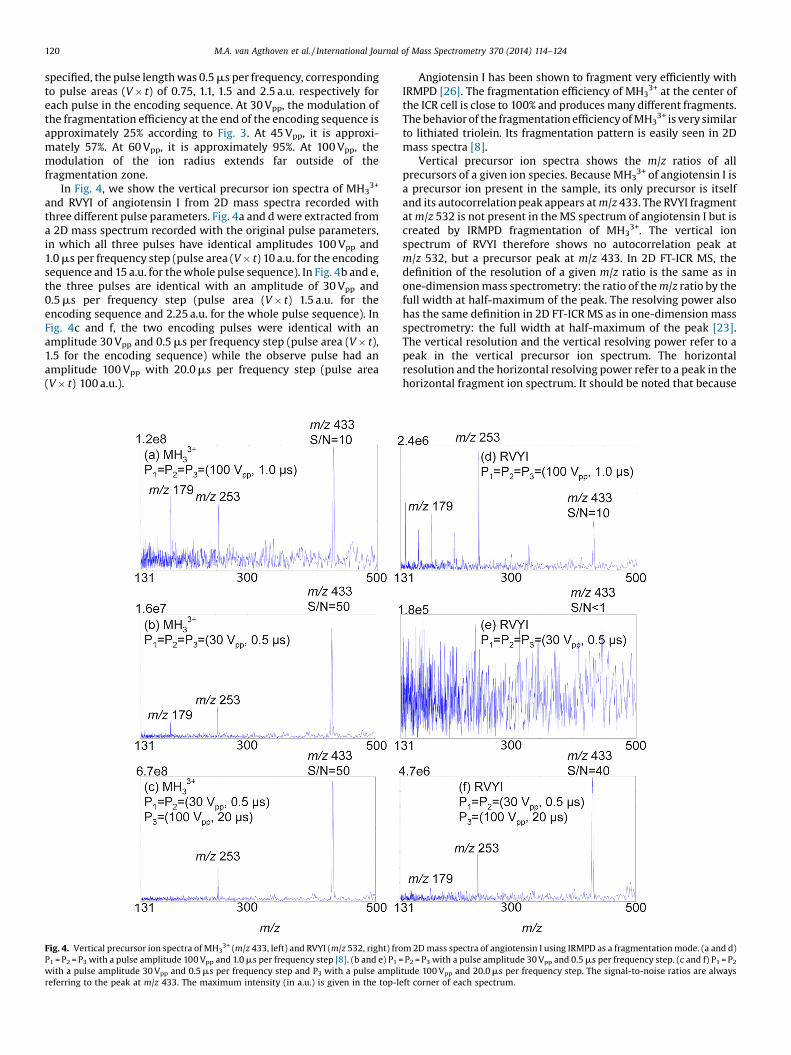
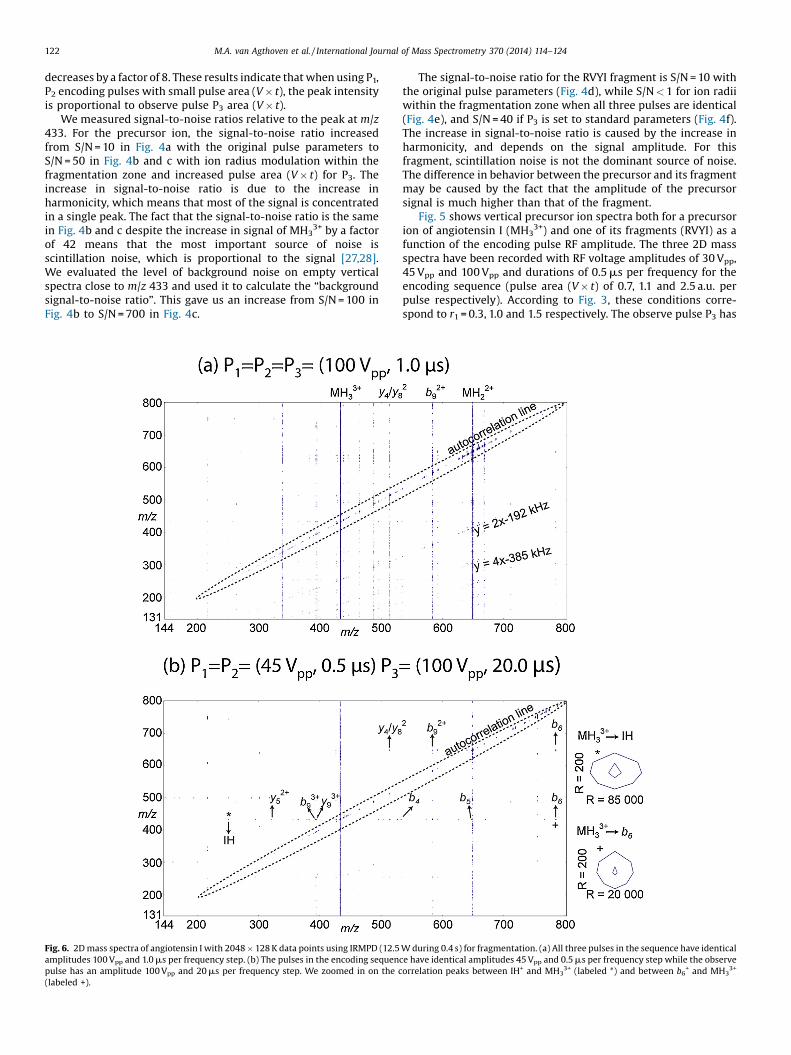
In Fig. 4, we show the vertical precursor ion spectra of MH33+
and RVYI of angiotensin I from 2D mass spectra recorded withthree different pulse parameters. Fig. 4a and d were extracted froma 2D mass spectrum recorded with the original pulse parameters,in which all three pulses have identical amplitudes 100 Vpp and1.0 ms per frequency step (pulse area (V � t) 10 a.u. for the encodingsequence and 15 a.u. for the whole pulse sequence). In Fig. 4b and e,the three pulses are identical with an amplitude of 30 Vpp and0.5 ms per frequency step (pulse area (V � t) 1.5 a.u. for theencoding sequence and 2.25 a.u. for the whole pulse sequence). InFig. 4c and f, the two encoding pulses were identical with anamplitude 30 Vpp and 0.5 ms per frequency step (pulse area (V � t),1.5 for the encoding sequence) while the observe pulse had anamplitude 100 Vpp with 20.0 ms per frequency step (pulse area(V � t) 100 a.u.).
Fig. 4. Vertical precursor ion spectra of MH33+ (m/z 433, left) and RVYI (m/z 532, right) fro
P1 = P2 = P3 with a pulse amplitude 100 Vpp and 1.0 ms per frequency step [8]. (b and e) P1 =with a pulse amplitude 30 Vpp and 0.5 ms per frequency step and P3 with a pulse amplireferring to the peak at m/z 433. The maximum intensity (in a.u.) is given in the top-l
Angiotensin I has been shown to fragment very efficiently withIRMPD [26]. The fragmentation efficiency of MH3
3+ at the center ofthe ICR cell is close to 100% and produces many different fragments.The behavior of the fragmentation efficiency of MH3
3+ is very similarto lithiated triolein. Its fragmentation pattern is easily seen in 2Dmass spectra [8].
Vertical precursor ion spectra shows the m/z ratios of allprecursors of a given ion species. Because MH3
3+ of angiotensin I isa precursor ion present in the sample, its only precursor is itselfand its autocorrelation peak appears at m/z 433. The RVYI fragmentat m/z 532 is not present in the MS spectrum of angiotensin I but iscreated by IRMPD fragmentation of MH3
3+. The vertical ionspectrum of RVYI therefore shows no autocorrelation peak atm/z 532, but a precursor peak at m/z 433. In 2D FT-ICR MS, thedefinition of the resolution of a given m/z ratio is the same as inone-dimension mass spectrometry: the ratio of the m/z ratio by thefull width at half-maximum of the peak. The resolving power alsohas the same definition in 2D FT-ICR MS as in one-dimension massspectrometry: the full width at half-maximum of the peak [23].The vertical resolution and the vertical resolving power refer to apeak in the vertical precursor ion spectrum. The horizontalresolution and the horizontal resolving power refer to a peak in thehorizontal fragment ion spectrum. It should be noted that because
m 2D mass spectra of angiotensin I using IRMPD as a fragmentation mode. (a and d) P2 = P3 with a pulse amplitude 30 Vpp and 0.5 ms per frequency step. (c and f) P1 = P2tude 100 Vpp and 20.0 ms per frequency step. The signal-to-noise ratios are alwayseft corner of each spectrum.
M.A. van Agthoven et al. / International Journal of Mass Spectrometry 370 (2014) 114–124 121
2D mass spectra have 2048 data points in the vertical v1
dimension and 131,072 data points in the horizontal v2 dimension,the resolving power and mass accuracy are much lower in thevertical than in the horizontal dimension.
There are two more peaks present in the vertical precursor ionspectra, at m/z 179 and m/z 253. They do not correspond to anyprecursor ions, but rather to artifacts combining harmonics and acarrier frequency phase shift from the pulse generator. In thefrequency domain, they are part of secondary autocorrelation linesdescribed by the equation y = 2x � 2 � 96 kHz (peak showing at m/z253) and y = 4x � 4 � 96 kHz (m/z 179). The value of 96 kHz is thelowest frequency of the excitation pulse, i.e., the carrier frequencyof the generator, and corresponds to the highest m/z ratio detectedin the mass spectrum (m/z 1500). We have observed in all our datathat this shift is always a multiple of the lowest frequency in theexcitation pulse. These peaks are therefore real harmonics offset bythe carrier frequency of the pulse generator.
In Fig. 4a and d, with the original parameters, the intensities ofthe harmonic peaks are very high because the modulation of theion radii extends far outside the fragmentation zone. In Fig. 4b ande, the ion radii remain within the fragmentation zone. As a result,the intensity of the harmonics is much lower. However, the threepulses have smaller V � t, so that the intensity of the peaks ofinterest at m/z 433 is also lower. In the vertical precursor ionspectrum of MH3
3+ (Fig. 4b), the signal intensity is still high enough
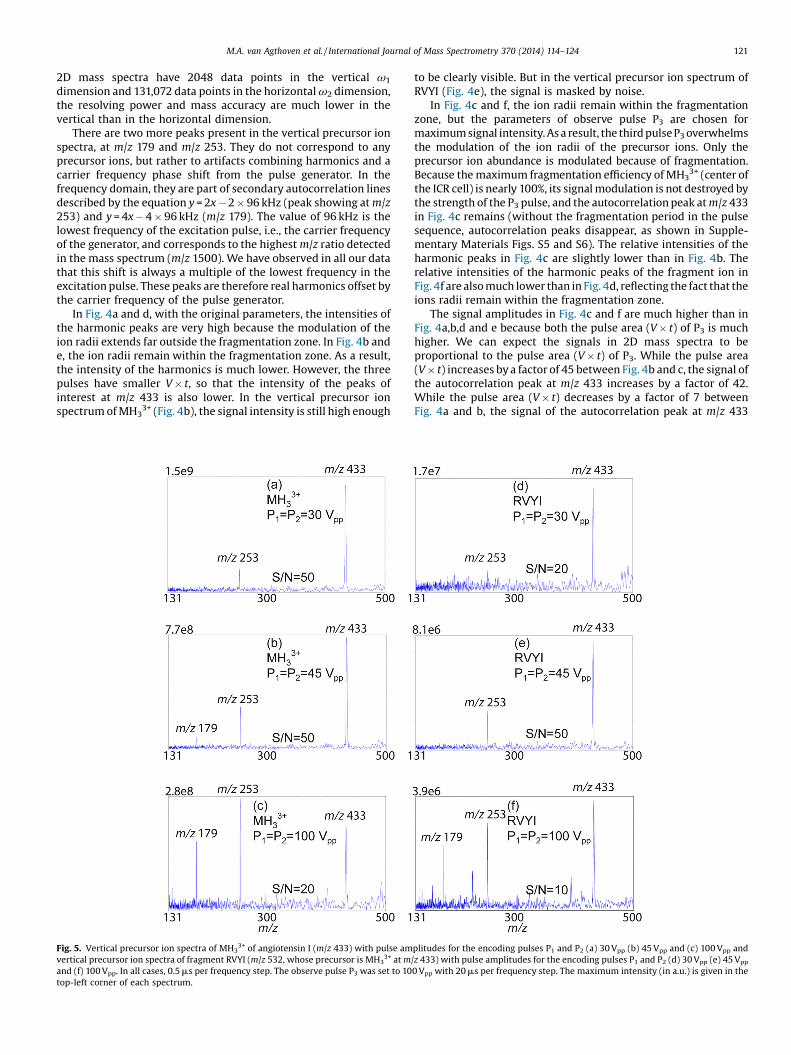
Fig. 5. Vertical precursor ion spectra of MH33+ of angiotensin I (m/z 433) with pulse am
vertical precursor ion spectra of fragment RVYI (m/z 532, whose precursor is MH33+ at m/
and (f) 100 Vpp. In all cases, 0.5 ms per frequency step. The observe pulse P3 was set to 10top-left corner of each spectrum.
to be clearly visible. But in the vertical precursor ion spectrum ofRVYI (Fig. 4e), the signal is masked by noise.
In Fig. 4c and f, the ion radii remain within the fragmentationzone, but the parameters of observe pulse P3 are chosen formaximum signal intensity. As a result, the third pulse P3overwhelmsthe modulation of the ion radii of the precursor ions. Only theprecursor ion abundance is modulated because of fragmentation.Because the maximum fragmentation efficiency of MH3
3+ (center ofthe ICR cell) is nearly 100%, its signal modulation is not destroyed bythe strength of the P3 pulse, and the autocorrelation peak at m/z 433in Fig. 4c remains (without the fragmentation period in the pulsesequence, autocorrelation peaks disappear, as shown in Supple-mentary Materials Figs. S5 and S6). The relative intensities of theharmonic peaks in Fig. 4c are slightly lower than in Fig. 4b. Therelative intensities of the harmonic peaks of the fragment ion inFig. 4f are also much lower than in Fig. 4d, reflecting the fact that theions radii remain within the fragmentation zone.
The signal amplitudes in Fig. 4c and f are much higher than inFig. 4a,b,d and e because both the pulse area (V � t) of P3 is muchhigher. We can expect the signals in 2D mass spectra to beproportional to the pulse area (V � t) of P3. While the pulse area(V � t) increases by a factor of 45 between Fig. 4b and c, the signal ofthe autocorrelation peak at m/z 433 increases by a factor of 42.While the pulse area (V � t) decreases by a factor of 7 betweenFig. 4a and b, the signal of the autocorrelation peak at m/z 433
plitudes for the encoding pulses P1 and P2 (a) 30 Vpp (b) 45 Vpp and (c) 100 Vpp andz 433) with pulse amplitudes for the encoding pulses P1 and P2 (d) 30 Vpp (e) 45 Vpp
0 Vpp with 20 ms per frequency step. The maximum intensity (in a.u.) is given in the
122 M.A. van Agthoven et al. / International Journal of Mass Spectrometry 370 (2014) 114–124
decreases by a factor of 8. These results indicate that when using P1,P2 encoding pulses with small pulse area (V � t), the peak intensityis proportional to observe pulse P3 area (V � t).
We measured signal-to-noise ratios relative to the peak at m/z433. For the precursor ion, the signal-to-noise ratio increasedfrom S/N = 10 in Fig. 4a with the original pulse parameters toS/N = 50 in Fig. 4b and c with ion radius modulation within thefragmentation zone and increased pulse area (V � t) for P3. Theincrease in signal-to-noise ratio is due to the increase inharmonicity, which means that most of the signal is concentratedin a single peak. The fact that the signal-to-noise ratio is the samein Fig. 4b and c despite the increase in signal of MH3
3+ by a factorof 42 means that the most important source of noise isscintillation noise, which is proportional to the signal [27,28].We evaluated the level of background noise on empty verticalspectra close to m/z 433 and used it to calculate the “backgroundsignal-to-noise ratio”. This gave us an increase from S/N = 100 inFig. 4b to S/N = 700 in Fig. 4c.
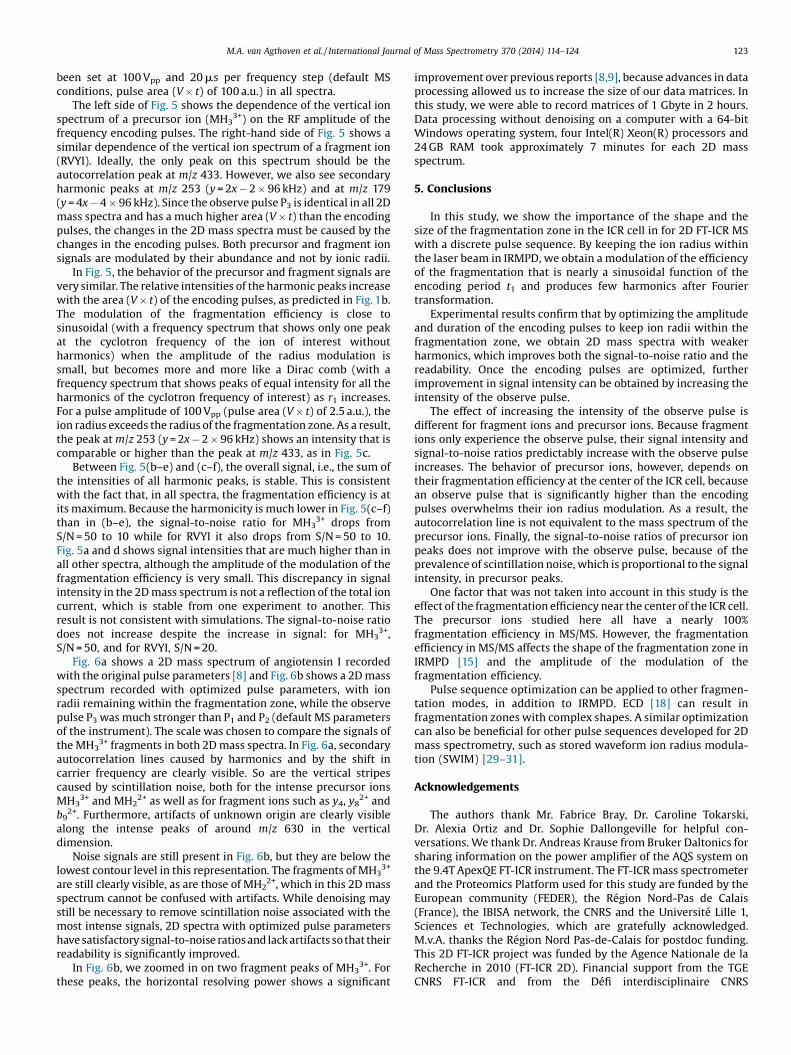
Fig. 6. 2D mass spectra of angiotensin I with 2048 � 128 K data points using IRMPD (12.5amplitudes 100 Vpp and 1.0 ms per frequency step. (b) The pulses in the encoding sequenpulse has an amplitude 100 Vpp and 20 ms per frequency step. We zoomed in on the c(labeled +).
The signal-to-noise ratio for the RVYI fragment is S/N = 10 withthe original pulse parameters (Fig. 4d), while S/N < 1 for ion radiiwithin the fragmentation zone when all three pulses are identical(Fig. 4e), and S/N = 40 if P3 is set to standard parameters (Fig. 4f).The increase in signal-to-noise ratio is caused by the increase inharmonicity, and depends on the signal amplitude. For thisfragment, scintillation noise is not the dominant source of noise.The difference in behavior between the precursor and its fragmentmay be caused by the fact that the amplitude of the precursorsignal is much higher than that of the fragment.
Fig. 5 shows vertical precursor ion spectra both for a precursorion of angiotensin I (MH3
3+) and one of its fragments (RVYI) as afunction of the encoding pulse RF amplitude. The three 2D massspectra have been recorded with RF voltage amplitudes of 30 Vpp,45 Vpp and 100 Vpp and durations of 0.5 ms per frequency for theencoding sequence (pulse area (V � t) of 0.7, 1.1 and 2.5 a.u. perpulse respectively). According to Fig. 3, these conditions corre-spond to r1 = 0.3, 1.0 and 1.5 respectively. The observe pulse P3 has
W during 0.4 s) for fragmentation. (a) All three pulses in the sequence have identicalce have identical amplitudes 45 Vpp and 0.5 ms per frequency step while the observeorrelation peaks between IH+ and MH3
3+ (labeled *) and between b6+ and MH3
3+
M.A. van Agthoven et al. / International Journal of Mass Spectrometry 370 (2014) 114–124 123
been set at 100 Vpp and 20 ms per frequency step (default MSconditions, pulse area (V � t) of 100 a.u.) in all spectra.
The left side of Fig. 5 shows the dependence of the vertical ionspectrum of a precursor ion (MH3
3+) on the RF amplitude of thefrequency encoding pulses. The right-hand side of Fig. 5 shows asimilar dependence of the vertical ion spectrum of a fragment ion(RVYI). Ideally, the only peak on this spectrum should be theautocorrelation peak at m/z 433. However, we also see secondaryharmonic peaks at m/z 253 (y = 2x � 2 � 96 kHz) and at m/z 179(y = 4x � 4 � 96 kHz). Since the observe pulse P3 is identical in all 2Dmass spectra and has a much higher area (V � t) than the encodingpulses, the changes in the 2D mass spectra must be caused by thechanges in the encoding pulses. Both precursor and fragment ionsignals are modulated by their abundance and not by ionic radii.
In Fig. 5, the behavior of the precursor and fragment signals arevery similar. The relative intensities of the harmonic peaks increasewith the area (V � t) of the encoding pulses, as predicted in Fig. 1b.The modulation of the fragmentation efficiency is close tosinusoidal (with a frequency spectrum that shows only one peakat the cyclotron frequency of the ion of interest withoutharmonics) when the amplitude of the radius modulation issmall, but becomes more and more like a Dirac comb (with afrequency spectrum that shows peaks of equal intensity for all theharmonics of the cyclotron frequency of interest) as r1 increases.For a pulse amplitude of 100 Vpp (pulse area (V � t) of 2.5 a.u.), theion radius exceeds the radius of the fragmentation zone. As a result,the peak at m/z 253 (y = 2x � 2 � 96 kHz) shows an intensity that iscomparable or higher than the peak at m/z 433, as in Fig. 5c.
Between Fig. 5(b–e) and (c–f), the overall signal, i.e., the sum ofthe intensities of all harmonic peaks, is stable. This is consistentwith the fact that, in all spectra, the fragmentation efficiency is atits maximum. Because the harmonicity is much lower in Fig. 5(c–f)than in (b–e), the signal-to-noise ratio for MH3
3+ drops fromS/N = 50 to 10 while for RVYI it also drops from S/N = 50 to 10.Fig. 5a and d shows signal intensities that are much higher than inall other spectra, although the amplitude of the modulation of thefragmentation efficiency is very small. This discrepancy in signalintensity in the 2D mass spectrum is not a reflection of the total ioncurrent, which is stable from one experiment to another. Thisresult is not consistent with simulations. The signal-to-noise ratiodoes not increase despite the increase in signal: for MH3
3+,S/N = 50, and for RVYI, S/N = 20.
Fig. 6a shows a 2D mass spectrum of angiotensin I recordedwith the original pulse parameters [8] and Fig. 6b shows a 2D massspectrum recorded with optimized pulse parameters, with ionradii remaining within the fragmentation zone, while the observepulse P3 was much stronger than P1 and P2 (default MS parametersof the instrument). The scale was chosen to compare the signals ofthe MH3
3+ fragments in both 2D mass spectra. In Fig. 6a, secondaryautocorrelation lines caused by harmonics and by the shift incarrier frequency are clearly visible. So are the vertical stripescaused by scintillation noise, both for the intense precursor ionsMH3
3+ and MH22+ as well as for fragment ions such as y4, y8
2+ andb9
2+. Furthermore, artifacts of unknown origin are clearly visiblealong the intense peaks of around m/z 630 in the verticaldimension.
Noise signals are still present in Fig. 6b, but they are below thelowest contour level in this representation. The fragments of MH3
3+
are still clearly visible, as are those of MH22+, which in this 2D mass
spectrum cannot be confused with artifacts. While denoising maystill be necessary to remove scintillation noise associated with themost intense signals, 2D spectra with optimized pulse parametershave satisfactory signal-to-noise ratios and lack artifacts so that theirreadability is significantly improved.
In Fig. 6b, we zoomed in on two fragment peaks of MH33+. For
these peaks, the horizontal resolving power shows a significant
improvement over previous reports [8,9], because advances in dataprocessing allowed us to increase the size of our data matrices. Inthis study, we were able to record matrices of 1 Gbyte in 2 hours.Data processing without denoising on a computer with a 64-bitWindows operating system, four Intel(R) Xeon(R) processors and24 GB RAM took approximately 7 minutes for each 2D massspectrum.
5. Conclusions
In this study, we show the importance of the shape and thesize of the fragmentation zone in the ICR cell in for 2D FT-ICR MSwith a discrete pulse sequence. By keeping the ion radius withinthe laser beam in IRMPD, we obtain a modulation of the efficiencyof the fragmentation that is nearly a sinusoidal function of theencoding period t1 and produces few harmonics after Fouriertransformation.
Experimental results confirm that by optimizing the amplitudeand duration of the encoding pulses to keep ion radii within thefragmentation zone, we obtain 2D mass spectra with weakerharmonics, which improves both the signal-to-noise ratio and thereadability. Once the encoding pulses are optimized, furtherimprovement in signal intensity can be obtained by increasing theintensity of the observe pulse.
The effect of increasing the intensity of the observe pulse isdifferent for fragment ions and precursor ions. Because fragmentions only experience the observe pulse, their signal intensity andsignal-to-noise ratios predictably increase with the observe pulseincreases. The behavior of precursor ions, however, depends ontheir fragmentation efficiency at the center of the ICR cell, becausean observe pulse that is significantly higher than the encodingpulses overwhelms their ion radius modulation. As a result, theautocorrelation line is not equivalent to the mass spectrum of theprecursor ions. Finally, the signal-to-noise ratios of precursor ionpeaks does not improve with the observe pulse, because of theprevalence of scintillation noise, which is proportional to the signalintensity, in precursor peaks.
One factor that was not taken into account in this study is theeffect of the fragmentation efficiency near the center of the ICR cell.The precursor ions studied here all have a nearly 100%fragmentation efficiency in MS/MS. However, the fragmentationefficiency in MS/MS affects the shape of the fragmentation zone inIRMPD [15] and the amplitude of the modulation of thefragmentation efficiency.
Pulse sequence optimization can be applied to other fragmen-tation modes, in addition to IRMPD. ECD [18] can result infragmentation zones with complex shapes. A similar optimizationcan also be beneficial for other pulse sequences developed for 2Dmass spectrometry, such as stored waveform ion radius modula-tion (SWIM) [29–31].
Acknowledgements
The authors thank Mr. Fabrice Bray, Dr. Caroline Tokarski,Dr. Alexia Ortiz and Dr. Sophie Dallongeville for helpful con-versations. We thank Dr. Andreas Krause from Bruker Daltonics forsharing information on the power amplifier of the AQS system onthe 9.4T ApexQE FT-ICR instrument. The FT-ICR mass spectrometerand the Proteomics Platform used for this study are funded by theEuropean community (FEDER), the Région Nord-Pas de Calais(France), the IBISA network, the CNRS and the Université Lille 1,Sciences et Technologies, which are gratefully acknowledged.M.v.A. thanks the Région Nord Pas-de-Calais for postdoc funding.This 2D FT-ICR project was funded by the Agence Nationale de laRecherche in 2010 (FT-ICR 2D). Financial support from the TGECNRS FT-ICR and from the Défi interdisciplinaire CNRS
124 M.A. van Agthoven et al. / International Journal of Mass Spectrometry 370 (2014) 114–124
Instrumentation aux limites for conducting the research is alsogratefully acknowledged.
Appendix A. Supplementary data
Supplementary data associated with this article can be found, inthe online version, at http://dx.doi.org/10.1016/j.ijms.2014.06.019.
References
[1] M.A. van Agthoven, M.-A. Delsuc, G. Bodenhausen, C. Rolando, Towardsanalytically useful two-dimensional Fourier transform ion cyclotron resonancemass spectrometry, Anal. Bioanal. Chem. 405 (2013) 51–61.
[2] J. Jeener, B.H. Meier, P. Bachmann, R.R. Ernst, Investigation of exchangeprocesses by two-dimensional NMR spectroscopy, J. Chem. Phys. 71 (1979)4546–4553.
[3] R.R. Ernst, G. Bodenhausen, A. Wokaun, Principles of Nuclear MagneticResonance in One and Two Dimensions, Oxford University Press, Oxford, 1990.
[4] P. Pfaendler, G. Bodenhausen, J. Rapin, R. Houriet, T. Gäumann, Two-dimensional Fourier transform ion cyclotron resonance mass spectrometry,Chem. Phys. Lett. 138 (1987) 195–200.
[5] P. Pfaendler, G. Bodenhausen, J. Rapin, M.E. Walser, T. Gäumann, Broad-bandtwo-dimensional Fourier transform ion cyclotron resonance, J. Am. Chem. Soc.110 (1988) 5625–5628.
[6] M. Bensimon, G. Zhao, T. Gäumann, A method to generate phase continuity intwo-dimensional Fourier transform ion cyclotron resonance mass spectrom-etry, Chem. Phys. Lett. 157 (1989) 97–100.
[7] S. Guan, P.R. Jones, A theory for two-dimensional Fourier-transform ioncyclotron resonance mass spectrometry, J. Chem. Phys. 91 (1989) 5291–5295.
[8] M.A. van Agthoven, M.-A. Delsuc, C. Rolando, Two-dimensional FT-ICR/MS withIRMPD as fragmentation mode, Int. J. Mass Spectrom. 306 (2011) 196–203.
[9] M.A. van Agthoven, L. Chiron, M.-A. Coutouly, M.-A. Delsuc, C. Rolando, Two-dimensional ECD FT-ICR mass spectrometry of peptides and glycopeptides,Anal. Chem. 84 (2012) 5589–5595.
[10] J.A. Cadzow, M.-M. Wu, Analysis of transient data in noise, IEE Proc. Part F 134(1987) 69–78.
[11] M.A. van Agthoven, M.-A. Coutouly, C. Rolando, M.-A. Delsuc, Two-dimensional Fourier transform ion cyclotron resonance mass spectrometry:reduction of scintillation noise using Cadzow data processing, Rapid Commun.Mass Spectrom. 25 (2011) 1609–1616.
[12] L. Chiron, M.A. van Agthoven, B. Kieffer, C. Rolando, M.-A. Delsuc, Efficientdenoising algorithms for large experimental datasets and their applications inFourier transform ion cyclotron resonance mass spectrometry, Proc. Natl.Acad. Sci. U. S. A. 111 (2014) 1385–1390.
[13] F.-F. Hsu, J. Turk, Structural characterization of triacylglycerols as lithiatedadducts by electrospray ionization mass spectrometry using low-energycollisionally activated dissociation on a triple stage quadrupole instrument,J. Am. Soc. Mass Spectrom. 10 (1999) 587–599.
[14] D. Tramesel, V. Catherinot, M.-A. Delsuc, Modeling of NMR processing, towardefficient unattended processing of NMR experiments, J. Magn. Reson. 188(2007) 56–67.
[15] R.A. Jockusch, K. Paech, E.R. Williams, Energetics from slow infraredmultiphoton dissociation of biomolecules, J. Phys. Chem. A 104 (2000)3188–3196.
[16] P. Caravatti, M. Allemann, The ‘infinity cell’: a new trapped-ion cell withradiofrequency covered trapping electrodes for Fourier transform ioncyclotron resonance mass spectrometry, Org. Mass Spectrom. 26 (1991)514–518.
[17] S.A. Hofstadler, K.A. Sannes-Lowery, R.H. Griffey, m/z-Selective infraredmultiphoton dissociation in a penning trap using sidekick trapping and anrf-tickle pulse, Rapid Commun. Mass Spectrom. 15 (2001) 945–951.
[18] Y.O. Tsybin, J.P. Quinn, O.Y. Tsybin, C.L. Hendrickson, A.G. Marshall, Electroncapture dissociation implementation progress in Fourier transform ioncyclotron resonance mass spectrometry, J. Am. Soc. Mass Spectrom. 19(2008) 762–771.
[19] D.S. Bomse, R.L. Woodin, J.L. Beauchamp, Molecular activation with low-intensity CW infrared laser radiation. Multiphoton dissociation of ions derivedfrom diethyl ether, J. Am. Chem. Soc. 101 (1979) 5503–5512.
[20] M.A. Freitas, C.L. Hendrickson, A.G. Marshall, Determination of relativeordering of activation energies for gas-phase ion unimolecular dissociation byinfrared radiation for gaseous multiphoton energy transfer, J. Am. Chem. Soc.122 (2000) 7768–7775.
[21] M.V. Gorshkov, E.N. Nikolaev, Optimal cyclotron radius for high resolutionFT-ICR spectrometry, Int. J. Mass Spectrom. Ion Process. 125 (1993) 1–8.
[22] N. Garnier, C. Rolando, J.M. Hotje, C. Tokarski, Analysis of archaeologicaltriacylglycerols by high resolution nanoESI, FT-ICR MS and IRMPD MS/MS:application to 5th century BC-4th century AD oil lamps from Olbia (Ukraine),Int. J. Mass Spectrom. 284 (2009) 47–56.
[23] A.G. Marshall, C.L. Hendrickson, G.S. Jackson, Fourier transform ion cyclotronresonance mass spectrometry: a primer, Mass Spectrom. Rev. 17 (1998) 1–35.
[24] L.J. de Koning, N.M.M. Nibbering, S.L. van Orden, F.H. Laukien, Mass selection ofions in a Fourier transform ion cyclotron resonance trap using correlatedharmonic excitation fields (CHEF), Int. J. Mass Spectrom. Ion Process. 165–166(1997) 209–219.
[25] Y. Qi, C.J. Thompson, S.L. van Orden, P.B. O’Connor, Phase correction of Fouriertransform ion cyclotron resonance mass spectra using MatLab, J. Am. Soc. MassSpectrom. 22 (2011) 138–147.
[26] M.C. Crowe, J.S. Brodbelt, Infrared multiphoton dissociation (IRMPD) andcollisionally activated dissociation of peptides in a quadrupole ion trap withselective IRMPD of phosphopeptides, J. Am. Soc. Mass Spectrom. 15 (2004)1581–1592.
[27] S.H. Reiger, Starlight scintillation and atmospheric turbulence, Astron. J. 68(1963) 395–406.
[28] A.T. Young, Photometric error analysis VI. Confirmation of Reiger’s theory ofscintillation, Astron. J. 72 (1967) 747–753.
[29] C.W. Ross, III, S. Guan, P.B. Grosshans, T.L. Ricca, A.G. Marshall, Two-dimensional Fourier transform ion cyclotron resonance mass spectrometry/mass spectrometry with stored-waveform ion radius modulation, J. Am. Chem.Soc. 115 (1993) 7854–7861.
[30] C.W. Ross, W.J. Simonsick Jr., D.J. Aaserud, Application of stored waveform ionmodulation 2D-FT-ICR MS/MS to the analysis of complex mixtures,Anal. Chem. 74 (2002) 4625–4633.
[31] G. van der Rest, A.G. Marshall, Noise analysis for 2D tandem Fourier transformion cyclotron resonance mass spectrometry, Int. J. Mass Spectrom. 210–211(2001) 101–111.


![International Journal of Mass Spectrometry Journal of Mass Spectrometry 287 ... [12,13], laser ablation/vaporization [2,14,15], ... ESI is a gentle ionization](https://img.pdfslide.us/doc/110x75/5b077db27f8b9a79538dfe58/international-journal-of-mass-spectrometry-journal-of-mass-spectrometry-287-.jpg)


![International Journal of Mass Spectrometry - - [email protected]](https://img.pdfslide.us/doc/110x75/61fb44082e268c58cd5c211e/international-journal-of-mass-spectrometry-emailprotected.jpg)