Embed Size (px)
Citation preview
Title: Vertical Shortening Considerations in the 1 km Tall Jeddah Tower
Authors: John Peronto, Thornton TomasettiRobert Sinn, Thornton TomasettiMatthew Huizinga, Thornton Tomasetti
Subjects: Architectural/DesignBuilding Case Study
Keywords: MegatallSupertallVerticality
Publication Date: 2017
Original Publication: International Journal of High-Rise Buildings Volume 6 Number 1
Paper Type: 1. Book chapter/Part chapter2. Journal paper3. Conference proceeding4. Unpublished conference paper5. Magazine article6. Unpublished
© Council on Tall Buildings and Urban Habitat / John Peronto; Robert Sinn; Matthew Huizinga
ctbuh.org/papers
International Journal of High-Rise Buildings
March 2017, Vol 6, No 1, 21-31
https://doi.org/10.21022/IJHRB.2017.6.1.21
International Journal of
High-Rise Buildingswww.ctbuh-korea.org/ijhrb/index.php
Vertical Shortening Considerations
in the 1 km Tall Jeddah Tower
John Peronto†, Robert Sinn, and Matthew Huizinga
Thornton Tomasetti, Inc., 330 N. Wabash Avenue, Suite 1500, Chicago, IL 60611
Abstract
Jeddah Tower will be the first man-made structure to reach a kilometer in height upon its completion in 2019. Fromconception, it was clear that an all-concrete superstructure would present many advantages for a building of such unprecedentedheight and slenderness. An all-concrete structure, however, did present many challenges that needed to be addressed in thesystem arrangement and through comprehensive analysis and design, among them vertical shortening effects due to the time-dependent creep and shrinkage of concrete. This paper outlines and presents the engineering solutions developed by the authorsregarding this complex concrete material phenomenon, while addressing the construction and regional challenges associatedwith realizing a concrete tower of this unprecedented scale.
Keywords: Ultratall, High-rise, Creep and shrinkage, Vertical shortening
1. Introduction
The origin of the Jeddah Tower project was the
aspiration of HRH Prince Alwaleed bin Talal to construct
the tallest building in the world, which would serve as a
symbol for the country and for the world in Jeddah, Saudi
Arabia. Jeddah Tower is a catalyst and also the anchor to
future regional development in the northern portion of
Jeddah. Thornton Tomasetti (TT) was a partner in the
Adrian Smith + Gordon Gill Architecture team during the
project’s competition phase, who were awarded the
project in 2009 (Sinn, 2016).
2. Structural System Overview
The reinforced concrete bearing wall system of Jeddah
Tower was developed to maximize concrete material
efficiency for the resistance of the large lateral load dem-
ands that a one-kilometer tall tower requires. By nature of
this system, every piece of concrete in the tower is
utilized in resisting both vertical gravity and lateral (wind
and seismic) loads. The overall slenderness of the tower’s
form (12:1 - height:width) demanded this level of struc-
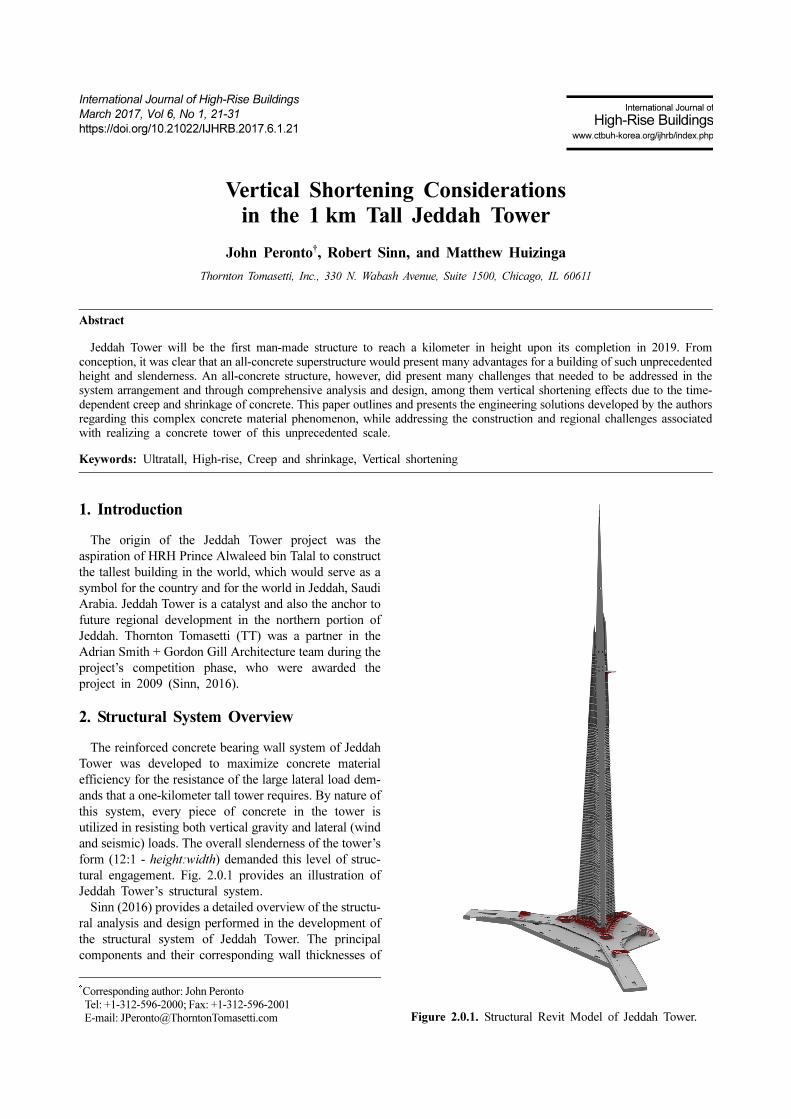
tural engagement. Fig. 2.0.1 provides an illustration of
Jeddah Tower’s structural system.
Sinn (2016) provides a detailed overview of the structu-
ral analysis and design performed in the development of
the structural system of Jeddah Tower. The principal
components and their corresponding wall thicknesses of
†Corresponding author: John PerontoTel: +1-312-596-2000; Fax: +1-312-596-2001E-mail: [email protected] Figure 2.0.1. Structural Revit Model of Jeddah Tower.
22 John Peronto et al. | International Journal of High-Rise Buildings
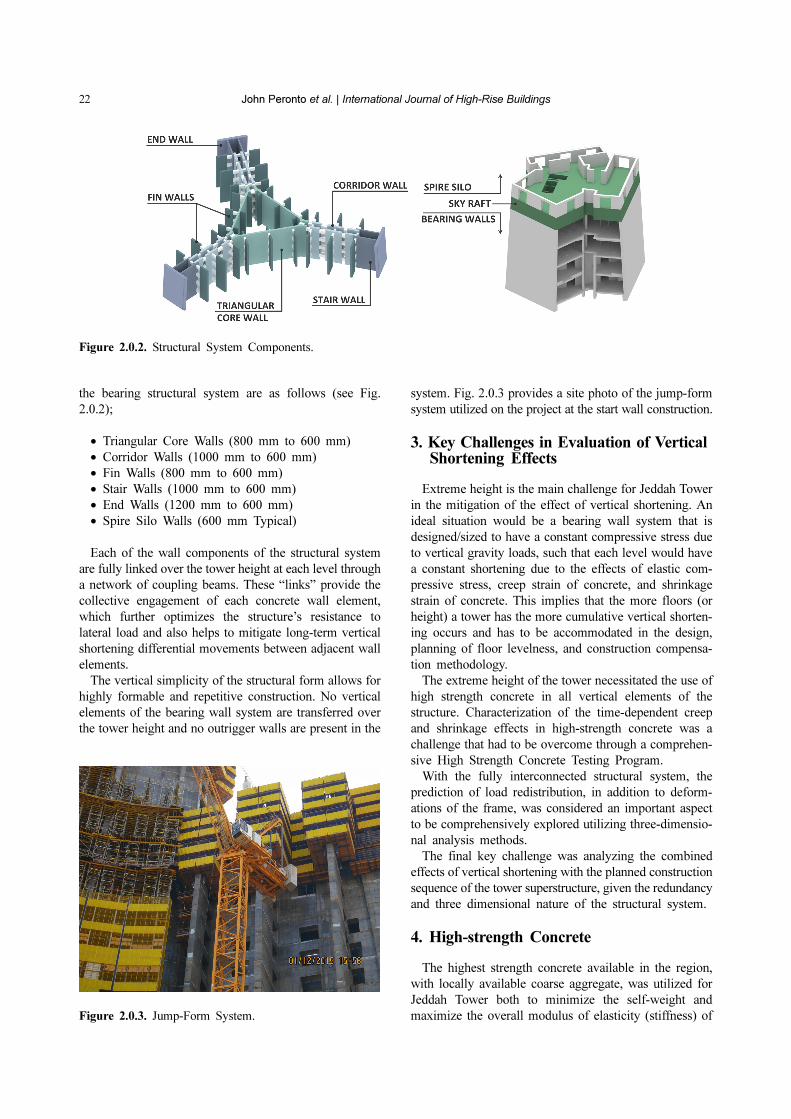
the bearing structural system are as follows (see Fig.
2.0.2);
• Triangular Core Walls (800 mm to 600 mm)
• Corridor Walls (1000 mm to 600 mm)
• Fin Walls (800 mm to 600 mm)
• Stair Walls (1000 mm to 600 mm)
• End Walls (1200 mm to 600 mm)
• Spire Silo Walls (600 mm Typical)
Each of the wall components of the structural system
are fully linked over the tower height at each level through
a network of coupling beams. These “links” provide the
collective engagement of each concrete wall element,
which further optimizes the structure’s resistance to
lateral load and also helps to mitigate long-term vertical
shortening differential movements between adjacent wall
elements.
The vertical simplicity of the structural form allows for
highly formable and repetitive construction. No vertical
elements of the bearing wall system are transferred over
the tower height and no outrigger walls are present in the
system. Fig. 2.0.3 provides a site photo of the jump-form
system utilized on the project at the start wall construction.
3. Key Challenges in Evaluation of Vertical Shortening Effects
Extreme height is the main challenge for Jeddah Tower
in the mitigation of the effect of vertical shortening. An
ideal situation would be a bearing wall system that is
designed/sized to have a constant compressive stress due
to vertical gravity loads, such that each level would have
a constant shortening due to the effects of elastic com-
pressive stress, creep strain of concrete, and shrinkage
strain of concrete. This implies that the more floors (or
height) a tower has the more cumulative vertical shorten-
ing occurs and has to be accommodated in the design,
planning of floor levelness, and construction compensa-
tion methodology.
The extreme height of the tower necessitated the use of
high strength concrete in all vertical elements of the
structure. Characterization of the time-dependent creep
and shrinkage effects in high-strength concrete was a
challenge that had to be overcome through a comprehen-
sive High Strength Concrete Testing Program.
With the fully interconnected structural system, the
prediction of load redistribution, in addition to deform-
ations of the frame, was considered an important aspect
to be comprehensively explored utilizing three-dimensio-
nal analysis methods.
The final key challenge was analyzing the combined
effects of vertical shortening with the planned construction
sequence of the tower superstructure, given the redundancy
and three dimensional nature of the structural system.
4. High-strength Concrete
The highest strength concrete available in the region,
with locally available coarse aggregate, was utilized for
Jeddah Tower both to minimize the self-weight and
maximize the overall modulus of elasticity (stiffness) of
Figure 2.0.2. Structural System Components.
Figure 2.0.3. Jump-Form System.
Vertical Shortening Considerations in the 1 km Tall Jeddah Tower 23
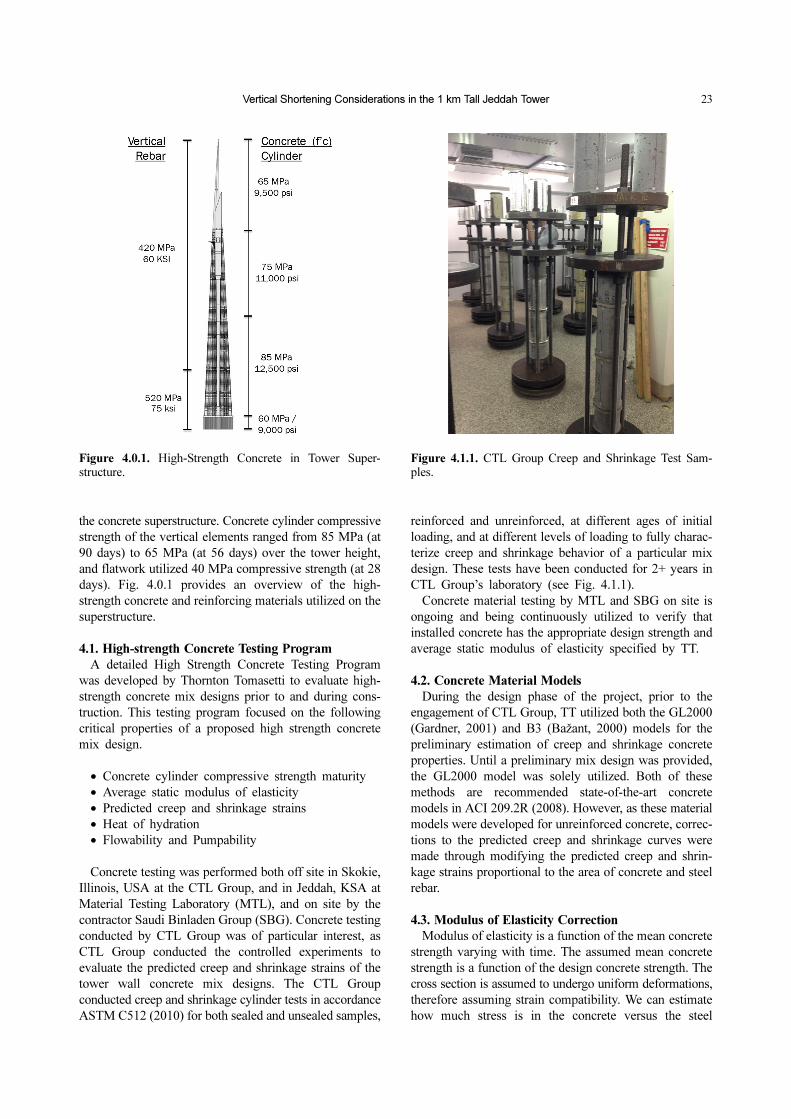
the concrete superstructure. Concrete cylinder compressive
strength of the vertical elements ranged from 85 MPa (at
90 days) to 65 MPa (at 56 days) over the tower height,
and flatwork utilized 40 MPa compressive strength (at 28
days). Fig. 4.0.1 provides an overview of the high-
strength concrete and reinforcing materials utilized on the
superstructure.
4.1. High-strength Concrete Testing Program
A detailed High Strength Concrete Testing Program
was developed by Thornton Tomasetti to evaluate high-
strength concrete mix designs prior to and during cons-
truction. This testing program focused on the following
critical properties of a proposed high strength concrete
mix design.
• Concrete cylinder compressive strength maturity
• Average static modulus of elasticity
• Predicted creep and shrinkage strains
• Heat of hydration
• Flowability and Pumpability
Concrete testing was performed both off site in Skokie,
Illinois, USA at the CTL Group, and in Jeddah, KSA at
Material Testing Laboratory (MTL), and on site by the
contractor Saudi Binladen Group (SBG). Concrete testing
conducted by CTL Group was of particular interest, as
CTL Group conducted the controlled experiments to
evaluate the predicted creep and shrinkage strains of the
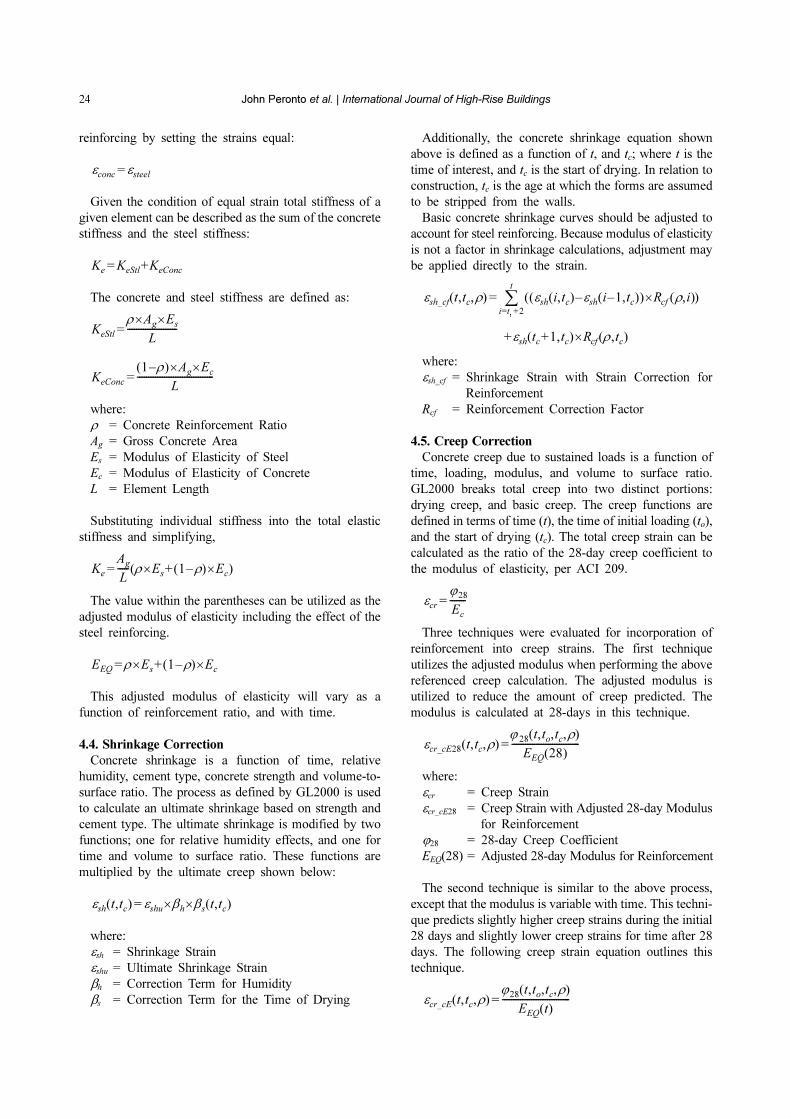
tower wall concrete mix designs. The CTL Group
conducted creep and shrinkage cylinder tests in accordance
ASTM C512 (2010) for both sealed and unsealed samples,
reinforced and unreinforced, at different ages of initial
loading, and at different levels of loading to fully charac-
terize creep and shrinkage behavior of a particular mix
design. These tests have been conducted for 2+ years in
CTL Group’s laboratory (see Fig. 4.1.1).
Concrete material testing by MTL and SBG on site is
ongoing and being continuously utilized to verify that
installed concrete has the appropriate design strength and
average static modulus of elasticity specified by TT.
4.2. Concrete Material Models
During the design phase of the project, prior to the
engagement of CTL Group, TT utilized both the GL2000
(Gardner, 2001) and B3 (Bažant, 2000) models for the
preliminary estimation of creep and shrinkage concrete
properties. Until a preliminary mix design was provided,
the GL2000 model was solely utilized. Both of these
methods are recommended state-of-the-art concrete
models in ACI 209.2R (2008). However, as these material
models were developed for unreinforced concrete, correc-
tions to the predicted creep and shrinkage curves were
made through modifying the predicted creep and shrin-
kage strains proportional to the area of concrete and steel
rebar.
4.3. Modulus of Elasticity Correction
Modulus of elasticity is a function of the mean concrete
strength varying with time. The assumed mean concrete
strength is a function of the design concrete strength. The
cross section is assumed to undergo uniform deformations,
therefore assuming strain compatibility. We can estimate
how much stress is in the concrete versus the steel
Figure 4.0.1. High-Strength Concrete in Tower Super-structure.
Figure 4.1.1. CTL Group Creep and Shrinkage Test Sam-ples.
24 John Peronto et al. | International Journal of High-Rise Buildings
reinforcing by setting the strains equal:
Given the condition of equal strain total stiffness of a
given element can be described as the sum of the concrete
stiffness and the steel stiffness:
The concrete and steel stiffness are defined as:
where:
ρ = Concrete Reinforcement Ratio
Ag = Gross Concrete Area
Es = Modulus of Elasticity of Steel
Ec = Modulus of Elasticity of Concrete
L = Element Length
Substituting individual stiffness into the total elastic
stiffness and simplifying,
The value within the parentheses can be utilized as the
adjusted modulus of elasticity including the effect of the
steel reinforcing.
This adjusted modulus of elasticity will vary as a
function of reinforcement ratio, and with time.
4.4. Shrinkage Correction
Concrete shrinkage is a function of time, relative
humidity, cement type, concrete strength and volume-to-
surface ratio. The process as defined by GL2000 is used
to calculate an ultimate shrinkage based on strength and
cement type. The ultimate shrinkage is modified by two
functions; one for relative humidity effects, and one for
time and volume to surface ratio. These functions are
multiplied by the ultimate creep shown below:
where:
εsh = Shrinkage Strain
εshu = Ultimate Shrinkage Strain
βh = Correction Term for Humidity
βs = Correction Term for the Time of Drying
Additionally, the concrete shrinkage equation shown
above is defined as a function of t, and tc; where t is the
time of interest, and tc is the start of drying. In relation to
construction, tc is the age at which the forms are assumed
to be stripped from the walls.
Basic concrete shrinkage curves should be adjusted to
account for steel reinforcing. Because modulus of elasticity
is not a factor in shrinkage calculations, adjustment may
be applied directly to the strain.
where:
εsh_cf = Shrinkage Strain with Strain Correction for
Reinforcement
Rcf = Reinforcement Correction Factor
4.5. Creep Correction
Concrete creep due to sustained loads is a function of
time, loading, modulus, and volume to surface ratio.
GL2000 breaks total creep into two distinct portions:
drying creep, and basic creep. The creep functions are
defined in terms of time (t), the time of initial loading (to),
and the start of drying (tc). The total creep strain can be
calculated as the ratio of the 28-day creep coefficient to
the modulus of elasticity, per ACI 209.
Three techniques were evaluated for incorporation of
reinforcement into creep strains. The first technique
utilizes the adjusted modulus when performing the above
referenced creep calculation. The adjusted modulus is
utilized to reduce the amount of creep predicted. The
modulus is calculated at 28-days in this technique.
where:
εcr = Creep Strain
εcr_cE28 = Creep Strain with Adjusted 28-day Modulus
for Reinforcement
ϕ28 = 28-day Creep Coefficient
EEQ(28) = Adjusted 28-day Modulus for Reinforcement
The second technique is similar to the above process,
except that the modulus is variable with time. This techni-
que predicts slightly higher creep strains during the initial
28 days and slightly lower creep strains for time after 28
days. The following creep strain equation outlines this
technique.
εconc εsteel=
Ke KeStl KeConc+=
KeStl
ρ Ag× Es×
L----------------------=
KeConc
1 ρ–( ) Ag× Ec×
L----------------------------------=
Ke
Ag
L----- ρ Es× 1 ρ–( )+ Ec×( )=
EEQ ρ Es× 1 ρ–( )+ Ec×=
εsh t tc,( ) εshu βh× βs t tc,( )×=
εsh_cf t tc ρ, ,( ) εsh i tc,( ) εsh i 1– tc,( )–( ) Rcf ρ i,( )×( )i=t
c2+
t
∑=
εsh tc 1+ tc,( )+ Rcf ρ tc,( )×
εcrϕ
28
Ec
-------=
εcr_cE28 t tc ρ, ,( )ϕ
28t to tc ρ, , ,( )
EEQ 28( )------------------------------=
εcr_cE t tc ρ, ,( )ϕ
28t to tc ρ, , ,( )
EEQ t( )------------------------------=
Vertical Shortening Considerations in the 1 km Tall Jeddah Tower 25
where:
εcr_cE = Creep Strain with Adjusted Modulus for Rein-
forcement
EEQ(t) = Adjusted Modulus for Reinforcement at time, t
The third technique is to modify the predicted strains
directly in a manner similar to shrinkage.
where:
εcr_cf = Creep Strain with Strain Correction for Rein-
forcement
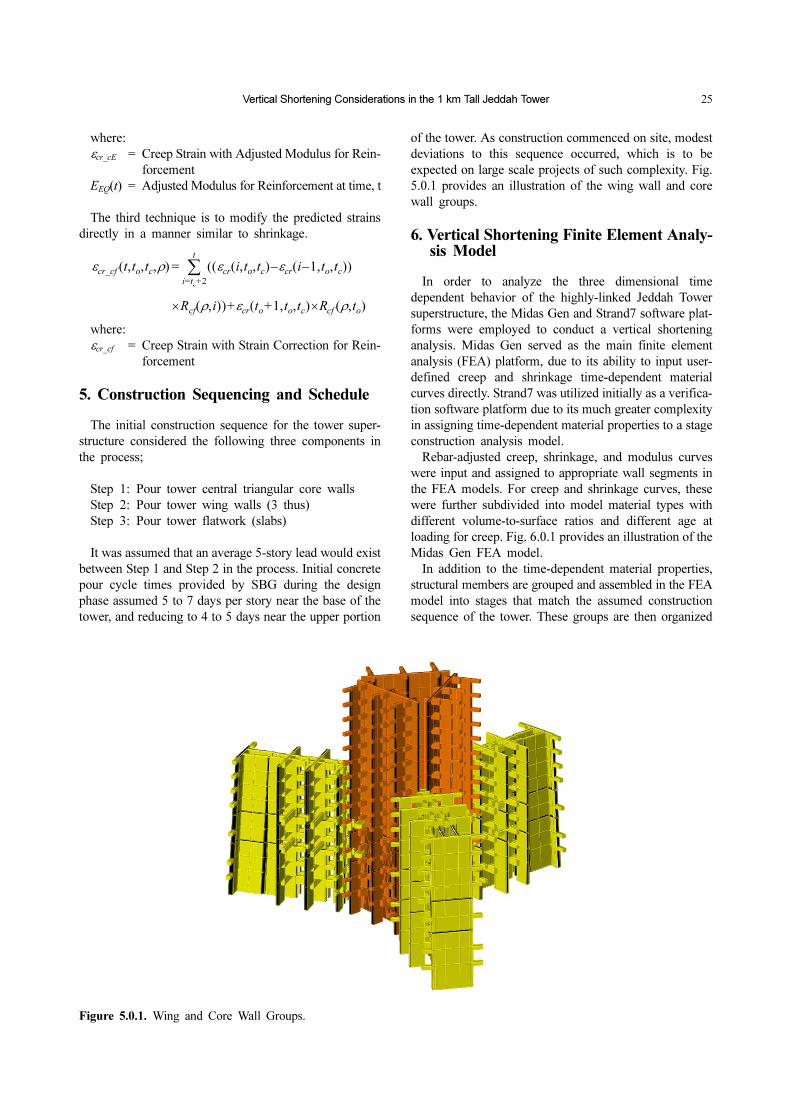
5. Construction Sequencing and Schedule
The initial construction sequence for the tower super-
structure considered the following three components in
the process;
Step 1: Pour tower central triangular core walls
Step 2: Pour tower wing walls (3 thus)
Step 3: Pour tower flatwork (slabs)
It was assumed that an average 5-story lead would exist
between Step 1 and Step 2 in the process. Initial concrete
pour cycle times provided by SBG during the design
phase assumed 5 to 7 days per story near the base of the
tower, and reducing to 4 to 5 days near the upper portion
of the tower. As construction commenced on site, modest
deviations to this sequence occurred, which is to be
expected on large scale projects of such complexity. Fig.
5.0.1 provides an illustration of the wing wall and core
wall groups.
6. Vertical Shortening Finite Element Analy-sis Model
In order to analyze the three dimensional time
dependent behavior of the highly-linked Jeddah Tower
superstructure, the Midas Gen and Strand7 software plat-
forms were employed to conduct a vertical shortening
analysis. Midas Gen served as the main finite element
analysis (FEA) platform, due to its ability to input user-
defined creep and shrinkage time-dependent material
curves directly. Strand7 was utilized initially as a verifica-
tion software platform due to its much greater complexity
in assigning time-dependent material properties to a stage
construction analysis model.
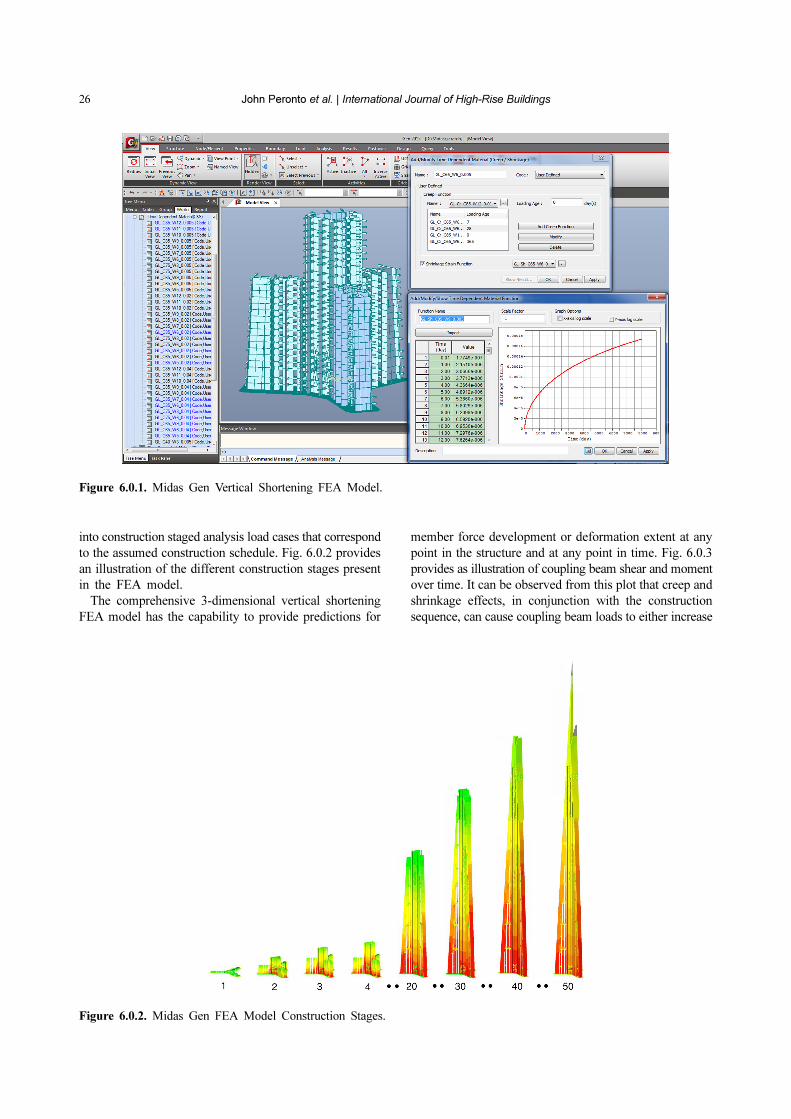
Rebar-adjusted creep, shrinkage, and modulus curves
were input and assigned to appropriate wall segments in
the FEA models. For creep and shrinkage curves, these
were further subdivided into model material types with
different volume-to-surface ratios and different age at
loading for creep. Fig. 6.0.1 provides an illustration of the
Midas Gen FEA model.
In addition to the time-dependent material properties,
structural members are grouped and assembled in the FEA
model into stages that match the assumed construction
sequence of the tower. These groups are then organized
εcr_cf t to tc ρ, , ,( ) εcr i to tc, ,( ) εcr i 1– to tc, ,( )–( )(i=t
o2+
t
∑=
Rcf ρ i,( ))× εcr to 1+ to tc, ,( )+ Rcf ρ to,( )×
Figure 5.0.1. Wing and Core Wall Groups.
26 John Peronto et al. | International Journal of High-Rise Buildings
into construction staged analysis load cases that correspond
to the assumed construction schedule. Fig. 6.0.2 provides
an illustration of the different construction stages present
in the FEA model.
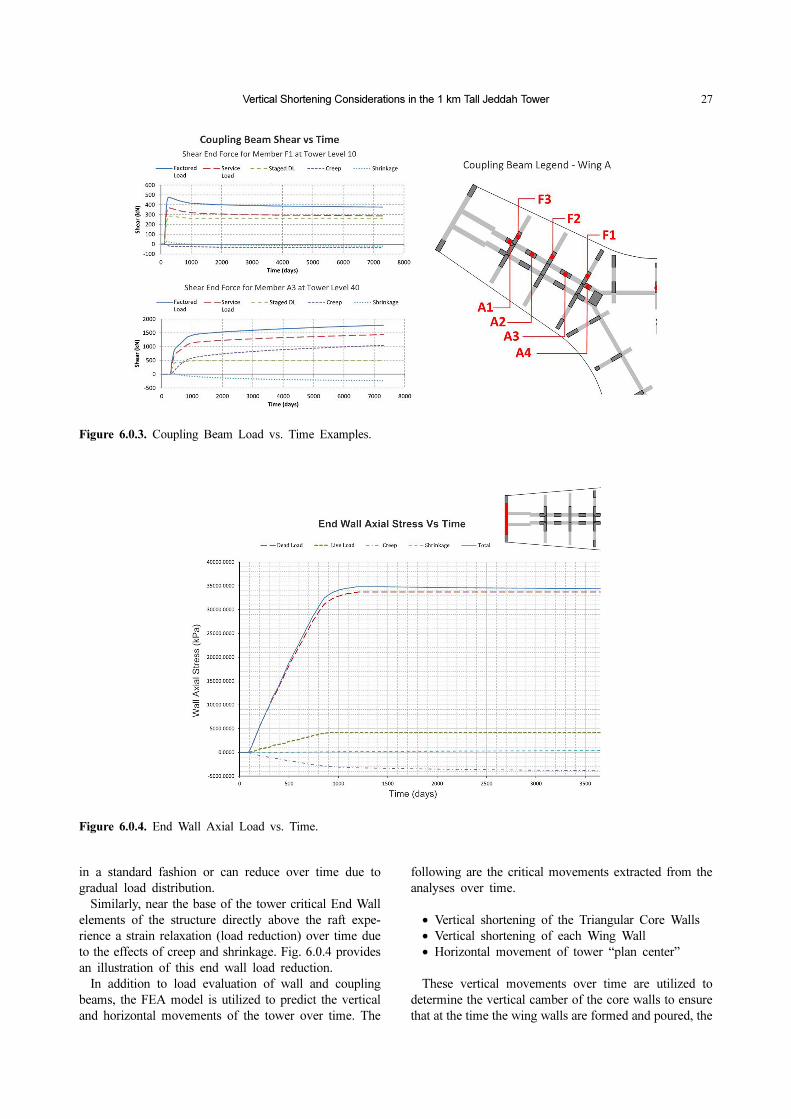
The comprehensive 3-dimensional vertical shortening
FEA model has the capability to provide predictions for
member force development or deformation extent at any
point in the structure and at any point in time. Fig. 6.0.3
provides as illustration of coupling beam shear and moment
over time. It can be observed from this plot that creep and
shrinkage effects, in conjunction with the construction
sequence, can cause coupling beam loads to either increase
Figure 6.0.1. Midas Gen Vertical Shortening FEA Model.
Figure 6.0.2. Midas Gen FEA Model Construction Stages.
Vertical Shortening Considerations in the 1 km Tall Jeddah Tower 27
in a standard fashion or can reduce over time due to
gradual load distribution.
Similarly, near the base of the tower critical End Wall
elements of the structure directly above the raft expe-
rience a strain relaxation (load reduction) over time due
to the effects of creep and shrinkage. Fig. 6.0.4 provides
an illustration of this end wall load reduction.
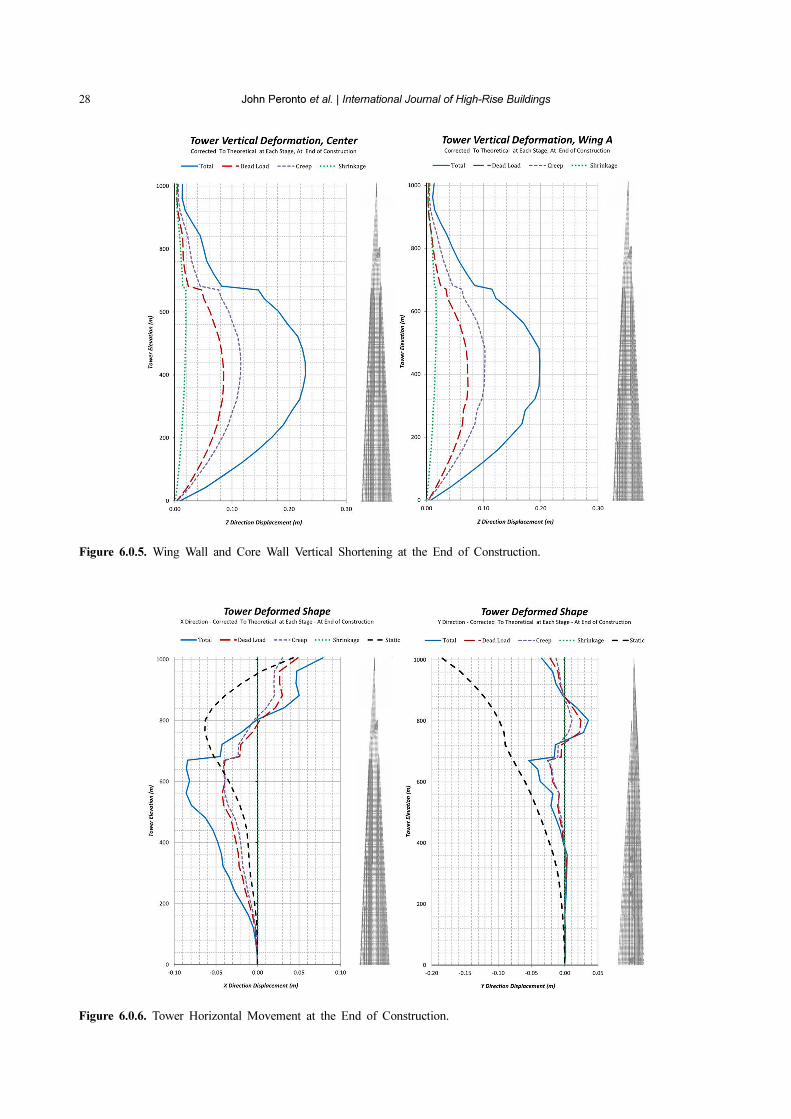
In addition to load evaluation of wall and coupling
beams, the FEA model is utilized to predict the vertical
and horizontal movements of the tower over time. The
following are the critical movements extracted from the
analyses over time.
• Vertical shortening of the Triangular Core Walls
• Vertical shortening of each Wing Wall
• Horizontal movement of tower “plan center”
These vertical movements over time are utilized to
determine the vertical camber of the core walls to ensure
that at the time the wing walls are formed and poured, the
Figure 6.0.3. Coupling Beam Load vs. Time Examples.
Figure 6.0.4. End Wall Axial Load vs. Time.
28 John Peronto et al. | International Journal of High-Rise Buildings
Figure 6.0.5. Wing Wall and Core Wall Vertical Shortening at the End of Construction.
Figure 6.0.6. Tower Horizontal Movement at the End of Construction.
Vertical Shortening Considerations in the 1 km Tall Jeddah Tower 29
core walls are elevationally at or very near theoretical
elevation of the connecting wing wall. The horizontal
movements of the tower are also utilized to inform the
contractor of the predicted lateral movements anticipated
during construction in order to plan for formwork re-
centering as the triangular core walls are being poured.
Fig. 6.0.5 provides the vertical shortening of the tower
wing and core walls at the end of construction. Fig. 6.0.6
provides the horizontal movements of the tower at the
end of construction assuming plan re-centering of the
triangular core throughout construction.
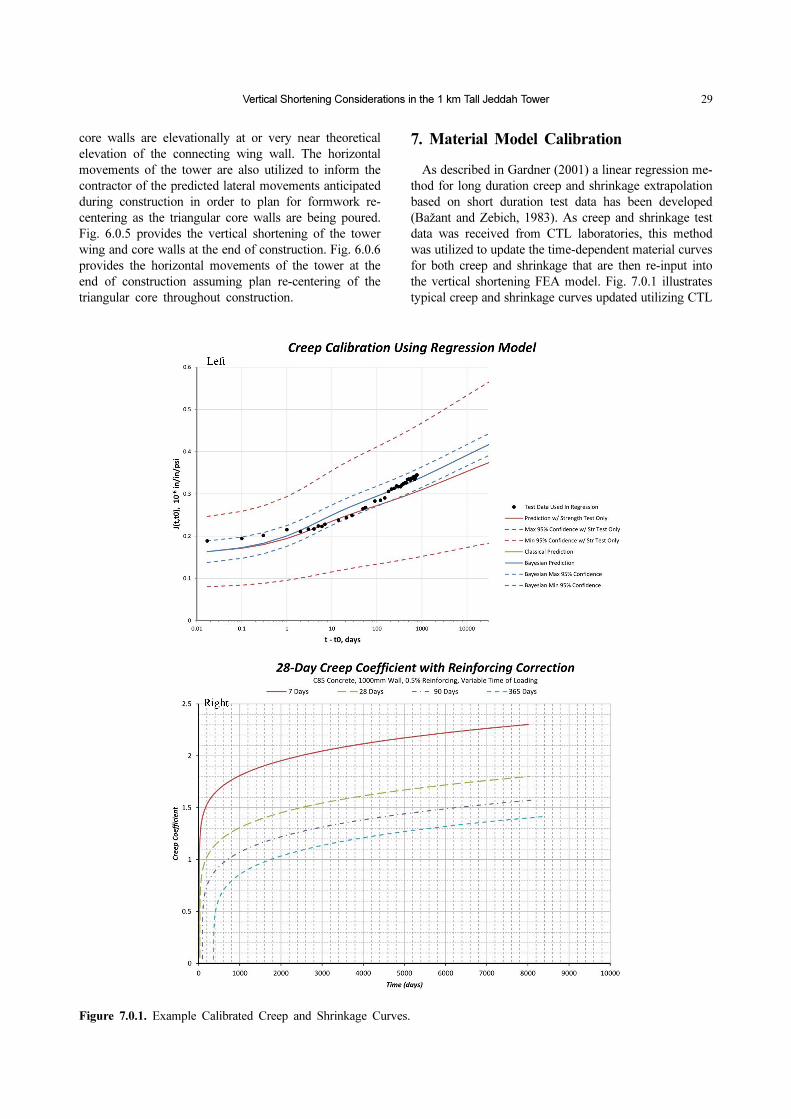
7. Material Model Calibration
As described in Gardner (2001) a linear regression me-
thod for long duration creep and shrinkage extrapolation
based on short duration test data has been developed
(Bažant and Zebich, 1983). As creep and shrinkage test
data was received from CTL laboratories, this method
was utilized to update the time-dependent material curves
for both creep and shrinkage that are then re-input into
the vertical shortening FEA model. Fig. 7.0.1 illustrates
typical creep and shrinkage curves updated utilizing CTL
Figure 7.0.1. Example Calibrated Creep and Shrinkage Curves.
30 John Peronto et al. | International Journal of High-Rise Buildings
test data.
8. Construction Guidelines, Compensation and Reanalysis
Utilizing the findings of the vertical shortening analy-
sis, Thornton Tomasetti informed the contractor of the
anticipated tower behavior during construction. These
predictions were outlined in a series of Construction
Guidelines in the Construction Documents that included
the following.
• Required High-Strength Concrete Preconstruction
and Onsite Construction Testing
• Required Construction Surveying and Monitoring of
the Structure
• Assumed Construction Sequence and Schedule
• Anticipated Tower Movements
• Recommended Wall Camber and Horizontal Plan
Correction
Onsite and during construction of the walls, the cont-
ractor has been continuously collecting cylinder samples
to evaluate and confirm material conformance of the
concrete with the design requirements outlined in the
Construction Documents. This not only includes comp-
ressive strength testing programs to evaluate the strength
maturity of the as-placed concrete, but also average static
modulus of elasticity testing programs to ensure the
concrete is meeting the required stiffness. This data is
then regularly reported back to Thornton Tomasetti for
evaluation. Similar to the inclusion of the Creep and
Shrinkage test data from CTL, this onsite strength and
modulus of elasticity data is included in updated vertical
shortening analyses and construction recommendations
moving forward.
As-built and continuous onsite surveying is conducted
by the contractor and also reported back to Thornton
Tomasetti. This elevational and horizontal positional data
is utilized to determine if the tower is moving as predic-
ted, as well as providing data that corresponds to the
actual as-built construction schedule. This onsite survey
data, along with regularly provided construction schedule
updates, are also included with concrete material updates
in vertical shortening analysis updates performed by
Thornton Tomasetti periodically throughout construction.
An updated vertical shortening analysis has been con-
ducted on an annual basis by Thornton Tomasetti to reg-
ularly confirm the tower behavior and provide the cont-
ractor refined movement predictions with updated wall
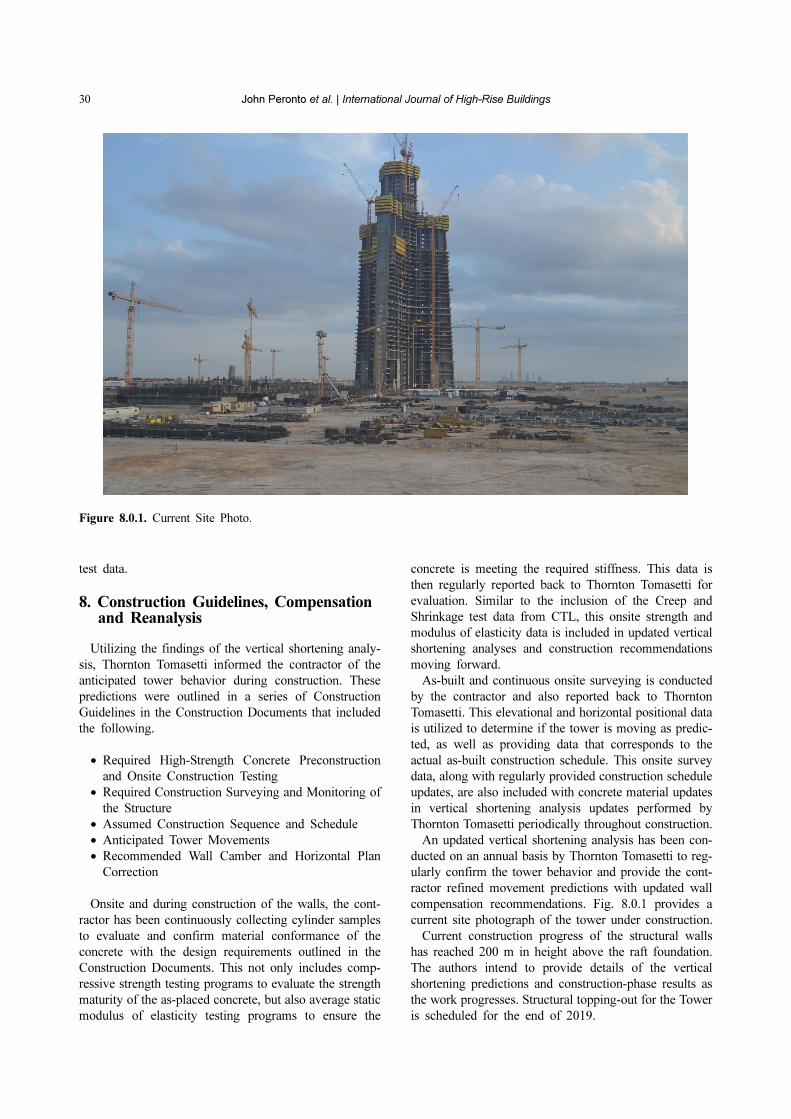
compensation recommendations. Fig. 8.0.1 provides a
current site photograph of the tower under construction.
Current construction progress of the structural walls
has reached 200 m in height above the raft foundation.
The authors intend to provide details of the vertical
shortening predictions and construction-phase results as
the work progresses. Structural topping-out for the Tower
is scheduled for the end of 2019.
Figure 8.0.1. Current Site Photo.
Vertical Shortening Considerations in the 1 km Tall Jeddah Tower 31
References
ACI Committee 209, “Guide for Modeling and Calculating
Shrinkage and Creep in Hardened Concrete (209.2R-
08),” American Concrete Institute, Farmington Hills, MI,
2008, 45 pp.
ASTM C512/C512M, Standard Test Method for Creep of
Concrete. Annual Book of ASTM Standards (American
Society for Testing and Materials, West Conshohocken,
2010)
Bažant, Z. P., and Baweja, S., “Creep and Shrinkage
Prediction Model for Analysis and Design of Concrete
Structures: Model B3,” The Adam Neville Symposium:
Creep and Shrinkage-Structural Design Effects, ACI SP-
194, A. Al-Manaseer, ed., American Concrete Institute,
Farmington Hills, MI, 2000, pp. 1-83.
Bažant, Z. P., & Zebich, S. (1983). “Statistical Linear
Regression Analysis of Prediction Models for Creep and
Shrinkage,” Cement and Concrete Research, 13(6), 869-
876.
Gardner, N. J., and Lockman, M. J., 2001, “Design
Provisions for Drying Shrinkage and Creep of Normal
Strength Concrete,” ACI Materials Journal, V. 98, No. 2,
Mar.-Apr., pp. 159-167.
Sinn, R., Peronto, J., Huizinga, M., “Engineering Jeddah
Tower,” Concrete International, November 2016, pp. 23-
29.