Embed Size (px)
Citation preview
Title: Relationship between Natural Vibration Periods and Structural Heights forHigh-rise Buildings in China
Authors: Peifu Xu, China Academy of Building ResearchCongzhen Xiao, China Academy of Building ResearchJianhui Li, China Academy of Building Research
Subject: Structural Engineering
Keyword: Vibrations
Publication Date: 2014
Original Publication: International Journal of High-Rise Buildings Volume 3 Number 1
Paper Type: 1. Book chapter/Part chapter2. Journal paper3. Conference proceeding4. Unpublished conference paper5. Magazine article6. Unpublished
© Council on Tall Buildings and Urban Habitat / Peifu Xu; Congzhen Xiao; Jianhui Li
ctbuh.org/papers

International Journal of High-Rise Buildings
March 2014, Vol 3, No 1, 49-64International Journal of
High-Rise Buildingswww.ctbuh-korea.org/ijhrb/index.php
Research on Relationship between Natural Vibration Periods
and Structural Heights for High-rise Buildings
and Its Reference Range in China
Peifu Xu, Congzhen Xiao†, and Jianhui Li
China Academy of Building Research, Beijing 100013, China
Abstract
Natural vibration period is an important parameter for high-rise building, Based on 414 high-rise buildings completed orpassed over-limit approval in China, the distribution law of natural vibration periods is analyzied. In order to satisfy the designrequirements, such as global stability, story drift limit and minimum shear-gravity ratio, the reference ranges of fundamentalperiods T1 are 0.3 ~0.4 when the structural heights H ≥ 250 m, when 150 m ≤ H < 250 m, T1 = 0.25 ~0.4 , when100 m ≤ H < 150 m, T1 = 0.2 ~0.35 , when 50 m ≤ H < 100 m, T1 = 0.15 ~0.3 . These can provide reference datafor controlling mass and rigidity of high-rise buildings.
Keywords: High-rise building, Natural vibration period, Reference range
1. Introduction
Natural vibration period is an intrinsic property of high-
rise building, and it is determined by the mass and rigidity
of the structure (Xu et al., 2006; CABR, 1985; Li et al.,
2003; Bao, 2001; Hong et al., 2012). The period will re-
flect the characteristics of the structure and determine
whether the structure can satisfy the requirements of codes
on high-rise buildings, such as stability, story drift limit,
shear-gravity ratio, etc. (JGJ3, 2010; GB5011, 2010). The
reference range of natural vibration period can help engi-
neers to evaluate the suitability for mass and rigidity of
high-rise buildings. Based on 414 high-rise buildings com-
pleted or passed over-limit approval in China, the distri-
bution law and reference range of natural vibration periods
are analyzed and presented in this paper,which could be
reference data for engineers.
2. Previous Research on Reference Range of Fundamental Period for High-rise Building
The reference range of fundamental period for high-rise
building was presented from the 1960s. It was derived
from statistics on results of measurement and calculation
for existing high-rise buildings. However, the structural
heights of most high-rise buildings were below 50 m, and
few of the structural heights were 50~100 m (CABR, 1985).
The results of Chile were presented in 2010, but the heights
of buildings were less than 135 m (Lagos et al., 2012).
2.1. China
Frame structure:
T1 = 0.1n (1a)
Shear wall structure:
T1 = 0.04n~0.06n (1b)
Frame-shear wall structure:
T1 = 0.014H (1c)
where n is the story number of high-rise building and
H is the structural height of the building.
2.2. The United States
Frame structure:
T1 = 0.1n (2a)
Shear wall structure:
T1=0.04 (2b)
Frame-shear wall structure:
T1 = 0.09 ~0.108 (2c)
where B is the width of structure.
Meantime, the approximate fundamental period Ta for
high-rise building shall be determined from the following
equation in American Society of Civil Engineers (ASCE)
H H H HH H H H
H
B
-------
H
B
-------H
B
-------
†Corresponding author: Congzhen XiaoTel: +86-10-8429-0389; Fax: +86-10-8427-9246E-mail: [email protected]
50 Peifu Xu et al. | International Journal of High-Rise Buildings
Standard ASCE/SEI 7-10 (ASCE/SEI 7, 2010):
Td = ctHx (2d)
For concrete moment-resisting frames, the parameter ctand x is respectively 0.0466 and 0.9, for other structural
systems except steel moment-resisting frames and concrete
moment-resisting frames, the parameter ct and x is respec-
tively 0.0488 and 0.75. The fundamental period T1 shall
not exceed the product of the coefficient for upper limit
on calculated period cu and the approximate fundamental
period Ta, the coefficient cu is between 1.4 and 1.7. When
the calculated fundamental period T1 exceeds cuTa, then
cuTa shall be used in lieu of T1 to calculate the base shear
force, but the elastic drifts is computed using seismic
design forces based on the calculated fundamental period
without the upper limit cuTa.
2.3. Romania
Frame structure:
T1 = 0.08n~0.12n (3a)
Shear wall structure:
T1 = 0.04n~0.045n (3b)
Frame-shear wall structure:
T1 = 0.045n~0.075n (3c)
2.4. Japan
Frame structure:
T1 = 0.02H~0.03H (4a)
Frame-shear wall structure:
T1 = 0.07 ~0.13 (4b)
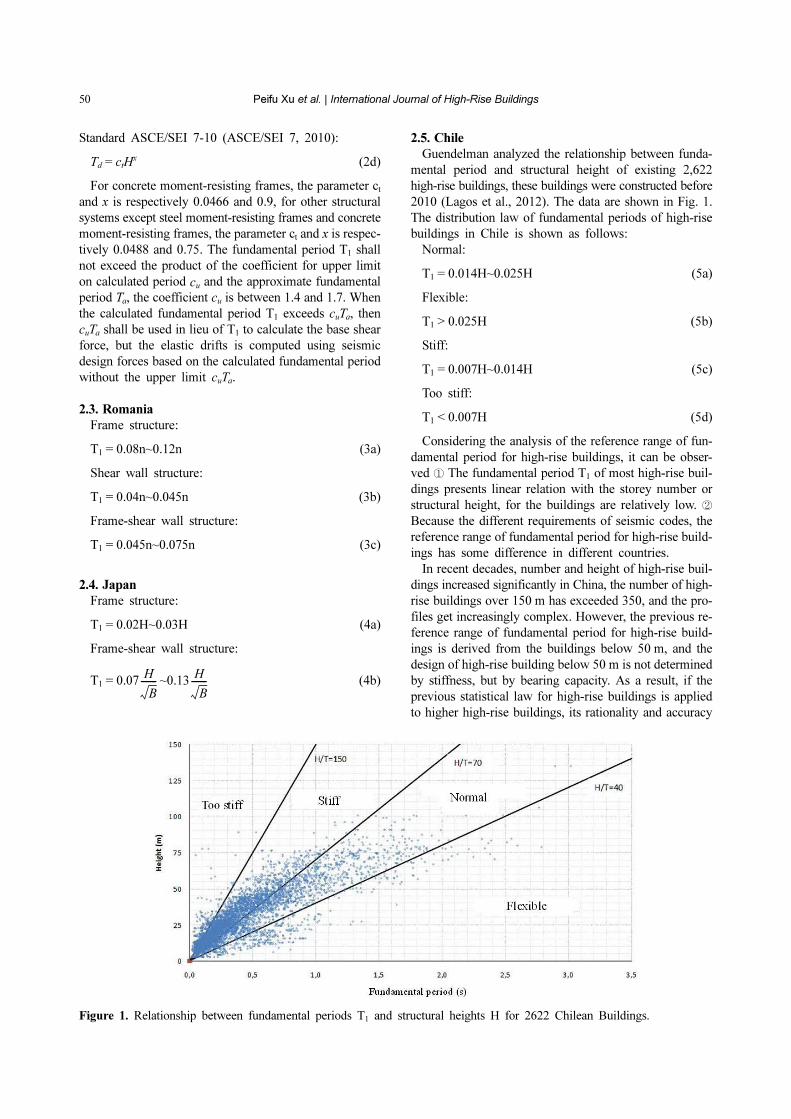
2.5. Chile
Guendelman analyzed the relationship between funda-
mental period and structural height of existing 2,622
high-rise buildings, these buildings were constructed before
2010 (Lagos et al., 2012). The data are shown in Fig. 1.
The distribution law of fundamental periods of high-rise
buildings in Chile is shown as follows:
Normal:
T1 = 0.014H~0.025H (5a)
Flexible:
T1 > 0.025H (5b)
Stiff:
T1 = 0.007H~0.014H (5c)
Too stiff:
T1 < 0.007H (5d)
Considering the analysis of the reference range of fun-
damental period for high-rise buildings, it can be obser-
ved ① The fundamental period T1 of most high-rise buil-
dings presents linear relation with the storey number or
structural height, for the buildings are relatively low. ②
Because the different requirements of seismic codes, the
reference range of fundamental period for high-rise build-
ings has some difference in different countries.
In recent decades, number and height of high-rise buil-
dings increased significantly in China, the number of high-
rise buildings over 150 m has exceeded 350, and the pro-
files get increasingly complex. However, the previous re-
ference range of fundamental period for high-rise build-
ings is derived from the buildings below 50 m, and the
design of high-rise building below 50 m is not determined
by stiffness, but by bearing capacity. As a result, if the
previous statistical law for high-rise buildings is applied
to higher high-rise buildings, its rationality and accuracy
H
B
-------H
B
-------
Figure 1. Relationship between fundamental periods T1 and structural heights H for 2622 Chilean Buildings.

Relationship between Periods and Heights for High-rise Buildings in China 51
will decrease significantly. Therefore, it is necessary to
statistically analyze distribution law and reference range
of natural vibration periods for current high-rise build-
ings.
3. Distribution Law and Reference Range of Natural Vibration Periods for High-rise Buildings in China
The analysis in this paper employs 414 high-rise build-
ings completed or passed over-limit approval in China.
The structural heights of all the buildings exceed 50 m,
and most of the high-rise buildings above 300 m are in-
cluded in the analysis. The data are from reinforced con-
crete structures or composite structures. Pure steel structures
are not included. The structure types are shear wall struc-
ture, frame-shear wall structure and frame-core tube struc-
ture. The specific data is described in Table 1.
3.1. Fundamental period T1
Fig. 2 shows the relation between the fundamental pe-
riod T1 and the structural height of high-rise building
based on the data presented in Table 1. It can be figured
out that the relationship of structural height and the fun-
damental period do not follow the linear relationship.
Based on characteristic of the data and classification rules
for story drift limitation in Technical specification for
concrete structures of tall building JGJ3-2010 (JGJ3,
2010), the distribution law and reference range of high-
rise buildings in China are described in as follows:
(1) When the structural heights H ≥ 250 m, the reference
range of fundamental periods T1 is 0.3 ~0.4 , for
T1 < 0.3 , the structure is stiff, and for T1 > 0.4 , the
structure is flexible.
(2) When 150 m ≤ H < 250 m, the reference range of T1
is 0.25 ~0.40 , for T1 < 0.25 , the structure is
stiff, and for T1 > 0.4 , the structure is flexible.
(3) When 100 m ≤ H < 150 m, the reference range of T1
is 0.2 ~0.35 , for T1 < 0.2 , the structure is stiff
and for T1 > 0.35 , the structure is flexible.
(4) When 50 m ≤ H < 100 m, the reference range of T1
is 0.15 ~0.3 , for T1 < 0.15 , the structure is stiff,
and for T1 > 0.3 , the structure is flexible.
3.2 Second-order period T2
Utilizing analysis model of ideal bending and shear
cantilever structures (mass and stiffness uniformly distri-
buted) and employing dynamics theory of structures:
(1) Bending structure
T1=1.786H2 =1.786 =1.612
=1.612 (6)
T2=0.285H2 =0.257 (7)
T3 = 0.102H2 =0.092 (8)
where T1, T2, T3 are the fundamental, second-order and
third-order periods; Gi is gravity load per unit length along
the height; g is gravitational acceleration; EI is the bend-
ing stiffness of structure; uT is imaginary horizontal dis-
placement on the top of structure.
H H
H H
H H H
H
H H H
H
H H H
H
Gi
gEI--------
8GiH
4
8gEI---------------
8GiH
4
8gEI---------------
uT
Gi
gEI-------- u
T
Gi
gEI-------- u
T
Figure 2. Relationship between fundamental periods T1 and structural heights H.

52 Peifu Xu et al. | International Journal of High-Rise Buildings
Table 1. Statistic data of natural vibration periods for high-rise buildings in China
numberproject
sitestructure
typeH/m T1/s T2/s T3/s number
project site
structure type
H/m T1/s T2/s T3/s
1 Tianjinframe-
core tube597 9.06 2.93 1.51 208
Shen-yang
frame-core tube
157 3.61 0.99 0.5
2Shen-zhen
frame-core tube
588 8.85 2.5 1.26 209Shang-
haiframe-
core tube157 3.98 0.93
3Shang-
haiframe-
core tube580 9.05 3.06 210 Nanjing
frame-shear wall
155 4.01 0.99
4 Wuhanframe-
core tube575 8.62 2.72 211 Zhujiang
frame-shear wall
155 3.51
5 Beijingframe-
core tube524 7.33 2.26 1.18 212 Tianjin
frame-shear wall
154 3.91 1.25
6Guang-
zhouframe-
core tube518 8.08 2.4 213
Shen-zhen
frame-core tube
154 3.43 0.74
7Shang-
haiframe-
core tube492 6.52 2.09 214 Tianjin
frame-core tube
154 3.35
8Shen-yang
frame-core tube
456 7.31 2.2 1.13 215 Foshanframe-
core tube154 2.84
9 Suzhouframe-
core tube450 8.37 2.67 1.41 216
Chang-sha
frame-shear wall
153 4.13
10 Tianjinframe-
core tube443 7.93 2.64 1.28 217
Shen-yang
shearwall
152 3.9 1.18
11Shen-zhen
frame-core tube
442 7.6 218 Beijingframe-
core tube151 3.23
12Chong-
qingframe-
core tube440 7.92 2.53 1.09 219
Guang-zhou
frame-shearwall
150 4.32 1.18 0.57
13Guang-
zhouframe-
core tube438 7.57 2.2 1.18 220 Nanjing
frame-core tube
150 3.1 0.9
14 Dalianframe-
core tube433 8.19 2.41 1.32 221 Beijing
frame-core tube
150 4.27 1.33 0.78
15Shang-
haiframe-
core tube420 6.52 1.68 0.77 222 Dalian
frame-shear wall
150 3.5 0.8
16 Tianjinframe-
core tube388 7.2 2.42 223
Hang-zhou
frame-shear wall
150 4.7
17 Nanjingframe-
core tube381 6.6 1.82 224 Zhujiang
frame-shear wall
150 3.41
18 Tianjinframe-
core tube358 5.98 1.6 225 Nanjing
frame-core tube
150 4.21
19 Nanningframe-
core tube354 7.75 2.23 226 Nanjing
frame-shearwall
149 3.86
20 Nanjingframe-
core tube352 7.56 2.38 1.17 227
Shang-hai
frame-core tube
149 4.06 1.17 0.62
21 Dalianframe-
core tube351 6.65 1.89 1.23 228
Shen-yang
shear wall
148 3.44 0.85 0.45
22Shen-yang
frame-core tube
343 7.27 2.29 229Shen-yang
shear wall
148 3.31 0.87 0.46
23 Tianjinframe-shear-wall
337 7.48 2.45 1.53 230Shen-yang
shear wall
148 3.15 0.71 0.34

Relationship between Periods and Heights for High-rise Buildings in China 53
24 Tianjinframe-
core tube332 5.63 1.63 231
Shen-yang
shear wall
148 3.25 0.86 0.46
25Shen-zhen
frame-core tube
325 5.62 1.86 0.78 232 Taicuangframe-
core tube148 3.87
26Guang-
zhouframe-
core tube323 6.02 1.61 233
Shang-hai
frame-core tube
148 3.6 1.05 0.54
27 Beijingframe-
core tube317 6.96 234
Shen-zhen
frame-core tube
147 3.9 1.03
28 Jiangyinframe-
core tube317 6.21 1.69 235 Xiamen
frame-core tube
147 3.34
29 Nanjingframe-
core tube314 7.18 1.94 1.06 236 Foshan
shearwall
146 3.83
30 Tianjinframe-
core tube305 6.49 237 Sanya
frame-shearwall
144 2.77
31Shen-yang
frame-core tube
305 6.5 2.16 238 Nanjingframe-
core tube141 2.94
32Chang-zhou
frame-core tube
300 6.4 239Shang-
hiaframe-
core tube140 3.27 0.97
33 Tianjinframe-
core tube299 5.18 1.37 240
Shang-hai
frame-shearwall
140 3.55
34 Wuxiframe-
core tube292 7.14 241
Shang-hai
frame-core tube
140 4.12
35Dong-guan
frame-core tube
289 6.3 1.43 242 Wuhanframe-shearwall
140 3.23
36 Dlianframe-
core tube289 6.39 2.02 243
Shen-yang
frame-core tube
139 4 1.2
37 Dlianframe-shearwall
288 4.45 1.39 244 Lanzhouframe-
core tube138 2.22
38 Nanjingframe-
core tube284 6.96 1.78 1.05 245 Beijing
frame-core tube
138 2.86 0.8 0.43
39Shen-yang
frame-core tube
284 6.63 1.78 246 Beijingframe-
core tube137 2.6
40Shen-yang
frame-core tube
283 6.3 2.11 247 Zhujiangframe-
core tube137 2.3
41Shang-
haiframe-
core tube282 6.56 248
Shen-yang
shearwall
136 3.68 0.99
42 Nanjingframe-
core tube281 6.44 1.98 1.12 249
Xiang-gang
frame-core tube
136 3.14
43 Suzhouframe-
core tube278 5.72 1.81 250 Chengdu
frame-core tube
135 3.36
44 Dalianframe-
core tube269 4.86 1.44 0.75 251
Shen-zhen
frame-core tube
135 3.18 0.83 0.26
45 Beijingframe-
core tube269 4.43 1.41 252 Nanjing
frame-core tube
134 3.41
46Nan-chang
frame-core tube
268 5.72 253Shang-
hai
frame-shear wall
134 3.71 0.86
47 Beijingframe-shearwall
265 5.3 1.68 254 Wuhanframe-shear wall
133 3.16
48Guang-
zhouframe-
core tube265 6.55 255
Shen-zhen
frame-core tube
122 3.24
49 Beijingframe-
core tube260 5.52 1.65 0.74 256
Shang-hai
frame-core tube
122 2.48
Table 1. Statistic data of natural vibration periods for high-rise buildings in China (CONT.)

54 Peifu Xu et al. | International Journal of High-Rise Buildings
50 Huizhouframe-
core tube260 6.79 257 Beijing
frame-core tube
120 2.31 0.62 0.34
51Shen-zhen
frame-core tube
260 5.89 2.07 0.8 258 Nanjingframe-shear wall
120 3.47
52 Dalianframe-
core tube258 5.12 1.39 259 Foshan
frame-shear wall
119 3.63 1.07
53 Beijingframe-
core tube256 5.5 1.55 0.91 260 Chengdu
frame-shear wall
119 2.77 0.69
54Shang-
haiframe-
core tube250 5.25 261 Chengdu
frame-shear wall
119 2.43 0.65
55 Wuxiframe-
core tube250 6.2 1.14 262 Nanjing
frame-core tube
119 4.13 1.02 0.47
56Kun-ming
frame-core tube
250 4.88 0.69 263 zhaoqingframe-
core tube118 1.58
57 Dalianframe-
core tube249 5.56 1.57 0.87 264 Chengdu
frame-shear wall
118 2.46 0.73
58 Dalianframe-
core tube248 4.74 1.33 265
Shen-zhen
frame-shear wall
118 3.29
59 Dalianframe-
core tube247 5.44 1.61 266
Zhao-qing
frame-core tube
117 1.58
60Shang-
haiframe-
core tube246 4.92 267 Dalian
frame-shearwall
117 3.09 0.75
61 Lanzhouframe-
core tube246 5.16 1.49 268
Shang-hai
frame-core tube
115 1.13
62Shen-zhen
frame-core tube
245 5.08 269Zheng-zhou
frame-core tube
112 2.81 0.76
63 Beijingframe-
core tube244 5.81 1.85 270 Beijing
frame-shear wall
111 2.23 0.61 0.28
64Shijiaz-huang
frame-core tube
242 6.58 271 Fujianframe-shear wall
111 2.61 0.7 0.34
65 Dalianframe-
core tube241 5.64 272 Nanjing
frame-shear wall
111 1.47
66 Beijingframe-shearwall
240 5.5 1.48 273Shang-
haiframe-
core tube110 2.37 0.6 0.29
67Shen-zhen
frame-core tube
240 5.12 1.3 274Guang-
zhou
frame-shear wall
110 2.72
68Shen-zhen
frame-core tube
239 5.12 1.61 275 Chengduframe-shear wall
109 2.88 0.73
69 Eerduosiframe-
core tube238 5.54 276
Guang-zhou
shearwall
108 1.44
70 Nanjingframe-
core tube236 5.48 1.3 0.99 277 Beijing
frame-core tube
108 3.04 0.77 0.5
71 Beijingframe-
core tube234 3.93 1.24 278 Qingdao
frame-shear wall
108 2.39
Table 1. Statistic data of natural vibration periods for high-rise buildings in China (CONT.)

Relationship between Periods and Heights for High-rise Buildings in China 55
72 Nanjingframe-
core tube232 5.51 1.82 279
Chang-sha
frame-shear wall
108 2.64 0.61 0.29
73 Nanjingframe-
core tube232 5.2 280 Tianjin
frame-core tube
107 1.54
74 Dalianframe-shearwall
231 4.16 1.18 0.69 281Shen-zhen
frame-core tube
107 2.23 0.5 0.2
75Shang-
haiframe-
core tube230 4.53 1.12 0.87 282 Beijing
frame-core tube
106 2.2
76 Beijingframe-
core tube230 4.07 1.34 283 Beijing
frame-shear wall
105 2.24 0.61
77Shang-
haiframe-
core tube230 4.22 1.14 284 Fuzhou
frame-shear wall
105 1.44 0.42 0.22
78Shen-yang
frame-core tube
229 5.73 1.48 0.51 285 Beijingframe-shear wall
105 2.2
79 Qingdaoframe-shear wall
228 3.8 1.32 286 Beijingframe-
core tube104 1.1
80Shen-yang
frame-shear wall
223 4.94 1.43 287 Beijingframe-
core tube103 2.4
81 Hefeiframe-
core tube223 5.6 1.51 0.75 288
Shen-zhen
frame-shearwall
103 1.53
82 Hefeiframe-
core tube223 5.14 1.42 289 Beijing
frame-core tube
102 1.46 0.38 0.21
83 Beijingframe-
core tube221 5.02 1.64 0.96 290 Xiamen
frame-core tube
101 2.04
84 Wuhanframe-
core tube220 6.06 291 Beijing
frame-core tube
101 2.4 0.59 0.25
85 Nanjingframe-
core tube218 4.54 1.25 0.62 292 Suzhou
frame-core tube
100 3.3
86 Wuxiframe-shearwall
218 5.47 293Tangs-
hanshearwall
100 1.69 0.4
87Shen-zhen
frame-core tube
218 3.8 1.34 0.7 294 Suzhouframe-shearwall
100 3.55
88 Tianjinframe-
core tube214 5.66 295 Dalian
frame-core tube
100 2.84 0.63
89 Wuhanframe-
core tube210 5.92 296
Chang-shu
shearwall
100 2.56
90Shang-
haiframe-
core tube207 5.69 297 Tianjin
frame-core tube
100 1.55 0.42
91 Ningboframe-
core tube207 4.45 298 Tianjin
frame-shear wall
100 1.72
92 Dalianframe-
core tube206 4.61 299 Suzhou
frame-shear wall
100 3.47
93Chong-
qingframe-
core tube205 5.28 1.77 0.99 300
Zheng-zhou
frame-shear wall
100 2.34 0.7
Table 1. Statistic data of natural vibration periods for high-rise buildings in China (CONT.)

56 Peifu Xu et al. | International Journal of High-Rise Buildings
94 Dalianframe-
core tube205 4.79 1.27 301 Lanzhou
frame-shear wall
100 2.1
95 Beijingframe-
core tube204 4.44 1.16 302
Wen-zhou
frame-core tube
100 2.31
96Shen-zhen
frame-shearwall
203 4.24 303Chang-zhou
frame-shear wall
100 2.7
97 Tianjinframe-
core tube202 4.74 304
Shang-hai
shear-wall
100 2.4
98Shang-
haiframe-
core tube202 4.35 305 Wuxi
frame-shear wall
100 3.2 0.74
99 Dalianframe-
core tube202 4.08 1.19 0.64 306
Guang-zhou
frame-shear wall
100 3.41
100 Beijingframe-
core tube202 4.72 1.47 0.74 307 Taicuang
frame-core tube
100 2.68
101 Wuxiframe-
core tube201 3.61 308
Shen-zhen
frame-core tube
100 2.8
102 Dalianframe-
core tube201 5.37 309
Shen-zhen
frame-shear wall
100 2.5
103 Haikouframe-
core tube201 3.33 310
Chang-shu
shearwall
100 2.46
104 Dalianframe-
core tube200 4.75 1.4 311
Wulu-muqi
frame-core tube
100 2.5 0.82
105 Tianjinframe-
core tube200 4.65 1.21 312 Nanjing
frame-shear wall
100 2.73
106Chong-
qingframe-
core tube200 5.17 313 Wuhan
frame-shear wall
100 2.7
107Shang-
haiframe-
core tube200 4.29 314 Beijing
shearwall
100 1.68
108Guang-
zhouframe-
core tube200 3.51 0.92 0.42 315
Wulu-muqi
frame-core tube
100 2.16
109Shen-yang
frame-core tube
200 5.49 1.6 0.87 316Chang-
shu
frame-shear wall
99 2.9
110Chong-
qingframe-
core tube199 5.84 1.54 317 Haerbin
frame-shear wall
99 2.73 0.78 0.38
111Shen-zhen
frame-core tube
199 5.24 1.57 318 Beijingframe-
core tube99 2.46
112 Dalianframe-shearwall
199 5.11 1.28 0.59 319 Beijingshearwall
99 2.54
113 Beijingframe-
core tube198 4.09 1.31 0.71 320
Wuzhong
frame-core tube
99 2.86
114Guang-
zhouframe-
core tube197 4.07 321 Beijking
frame-core tube
99 2.49
115Shen-yang
frame-shearwall
197 4.52 1.21 322Shang-
haishear wall
99 2.32
116 Suzhouframe-
core tube197 4.44 323 Nanjing
shear wall
98 3.6
Table 1. Statistic data of natural vibration periods for high-rise buildings in China (CONT.)

Relationship between Periods and Heights for High-rise Buildings in China 57
117 Nanjingframe-
core tube197 4.52 1.32 0.78 324
Shen-zhen
frame-shear wall
98 3 0.84 0.4
118 Dalianframe-
core tube197 5.01 1.33 0.64 325 Beijing
frame-core tube
98 1.44
119 Wuxiframe-
core tube196 5.02 326 Beijing
frame-shear wall
98 1.8
120 Dalianframe-
core tube196 3.42 0.92 0.48 327 Lanzhou
shear wall
97 2.22 0.66 0.34
121Shang-
haiframe-
core tube196 4.93 328
Shen-zhen
frame-core tube
97 3.37
122Shen-yang
frame-core tube
196 4.6 1.29 0.68 329 Beijingshear wall
96 1.37
123 Dalianframe-
core tube196 4.84 330
Shen-zhen
frame-shear wall
96 3.12
124Shen-yang
frame-core tube
195 5.48 1.5 0.8 331 Xianframe-shear wall
96 2.07
125 Dalianframe-
core tube194 4.23 1.2 0.71 332
Wulu-muqi
frame-shear wall
95 2.63 0.71
126Nan-chang
frame-core tube
194 4.06 1.1 0.55 333Shang-
hai
frame-shear wall
94 2.31
127Shen-yang
frame-core tube
194 4.71 1.38 334 Beijingframe-shear wall
94 1.37 0.32 0.15
128Dong-guan
frame-core tube
192 4.95 1.46 335 Hefeiframe-shear wall
93 2.52
129 Wuxiframe-
core tube190 5.06 1.53 336 Foshan
frame-core tube
92 2.17
130 Wuxiframe-
core tube190 5.3 1.52 337 Beijing
frame-core tube
92 1.61
131Shen-yang
frame-core tube
190 5.06 1.44 338 Chengduframe-
core tube92 3
132 Xianframe-
core tube189 3.53 0.94 339
Shang-hai
frame-shear wall
92 1.57 0.51
133Guang-
zhouframe-
core tube189 5.42 1.63 340
Shang-hai
frame-shear wall
92 1.8
134 Nanjingframe-
core tube189 4.44 1.26 341
Guang-zhou
shear wall
90 1.61
135 Weifangframe-shearwall
188 3.55 342 Beijingframe-shear wall
90 2.23
136 Suzhouframe-
core tube188 5.73 343
Shen-yang
frame-shear wall
89 2.65
137 Dalianframe-shearwall
187 5.13 1.51 344Guang-
zhou
frame-shear wall
89 2.88 0.96
138Shen-zhen
frame-core tube
187 4.21 1.06 345 Beijingshear wall
88 2
Table 1. Statistic data of natural vibration periods for high-rise buildings in China (CONT.)

58 Peifu Xu et al. | International Journal of High-Rise Buildings
139 Dalianshearwall
186 3.87 0.97 346 Beijingframe-shear wall
88 1.82
140 Dalianshearwall
186 3.89 0.99 347 Fuzhouframe-shear wall
88 2.52 0.81 0.35
141 Zhuhaiframe-shearwall
185 4.65 348Shen-yang
frame-shear wall
88 2.03
142Shen-zhen
frame-core tube
185 4.26 349Shang-
haishear wall
87 1.93
143Guang-
zhou
frame-shearwall
185 4.9 1.35 350Shen-zhen
shear wall
87 2.91 0.9
144Shang-
haiframe-
core tube185 3.67 351
Shang-hai
frame-core tube
87 2.02
145Guang-
zhouframe-
core tube184 5.62 352 Beijing
frame-core tube
87 1.5
146Chang-zhou
shear wall
184 4.16 1.2 353 Qingdaoframe-shear wall
85 1.31
147Shen-yang
shear wall
184 4.3 1.3 354 Longkouframe-shear wall
85 1.46
148Shen-yang
shear wall
184 4.45 1.15 355 Suzhouframe-shear wall
84 2.64
149Shen-yang
frame-core tube
183 5.71 1.69 356 Suzhouframe-shear wall
84 2.58
150 Dalianshear wall
183 3.72 1.03 357 Beijingframe-shear wall
83 2.21
151 Dalianshear wall
182 3.64 1.12 358Wulu-muqi
frame-shear wall
82 1.45
152 Dalianshear wall
182 3.61 1.01 359 Beijingshear-wall
82 1.53 0.44
153 Suzhouframe-
core tube182 5.53 360
Shen-yang
frame-shear wall
82 2.43
154Shen-yang
frame-shearwall
180 5.07 1.52 361Zhous-
han
frame-shear wall
81 2.11 0.59
155Shen-yang
shear wall
180 5.1 1.34 362Wulu-muqi
frame-shear wall
81 1.78
156 Beijingframe-
core tube180 3.79 1.14 0.59 363 Nanjing
frame-shear wall
80 2.28
157Shen-zhen
frame-core tube
180 4.39 364 Beijingframe-
core tube79 1.82 0.44
158 Nanjingframe-
core tube180 4.63 365
Zheng-zhou
shearwall
79 1.73
159 Nanjingframe-
core tube180 4.53 366 Suzhou
frame-shear wall
78 2.21
Table 1. Statistic data of natural vibration periods for high-rise buildings in China (CONT.)
Relationship between Periods and Heights for High-rise Buildings in China 59
160Hang-zhou
frame-core tube
180 4.01 367Guang-
zhou
frame-shear wall
78 1.66
161 Nanjingframe-
core tube179 4.03 0.9 0.45 368 Nanjing
frame-shear wall
78 2.47 0.67
162Shen-yang
frame-core tube
178 4.94 1.19 369 Beijingframe-shear wall
77 1.26
163Shen-zhen
frame-core tube
178 3.94 1.11 370 Dalianframe-shear wall
73 1.38 0.35 0.16
164Wulu-muqi
frame-core tube
175 3.72 0.97 371 Tianjinframe-shear wall
73 1.92 0.45 0.2
165 Nanjingframe-
core tube175 4.44 372 Tianjin
frame-shear wall
72 1.89
166 Nanjingframe-
core tube175 3.44 373 Beijing
frame-shear wall
72 1.79 0.46 0.22
167Shen-zhen
frame-core tube
174 4.48 1.19 374 Beijingframe-shear wall
72 2.19 0.52 0.26
168 Nanjingframe-
core tube172 4.1 375 Haerbin
frame-shear wall
71 2.12
169Shen-yang
frame-shearwall
172 3.9 1.1 376Shen-zhen
frame-shear wall
70 1.56
170 Beijingframe-
core tube172 3.71 1.06 377
Hang-zhou
frame-shear wall
70 1.55
171Shen-yang
frame-core tube
172 4.15 1.26 378Kun-ming
frame-core tube
69 1.68
172 Dalianshearwall
172 4.1 379Shen-yang
frame-shear wall
68 1.95
173 Nanningframe-shearwall
171 5.25 1.48 380 Beijingframe-shear wall
67 1.97 0.61 0.3
174 Nantongframe-
core tube171 4.05 381 Beijing
frame-shear wall
67 1.43
175Guang-
zhouframe-
core tube170 5.53 382 Tianjin
frame-shear wall
66 1.77
176Shen-zhen
frame-core tube
170 4.16 1.14 0.53 383Shang-
hai
frame-shear wall
66 1.51
177 Nanjingframe-
core tube170 4.5 384
Shen-yang
frame-shear wall
66 1.48 0.39 0.18
178 Chengdushearwall
170 4.26 385 Tianjinframe-shear wall
65 1.71 0.5 0.26
179Hang-zhou
frame-core tube
170 4.19 1.11 0.55 386 Taiyuanframe-shear wall
65 1.09
Table 1. Statistic data of natural vibration periods for high-rise buildings in China (CONT.)

60 Peifu Xu et al. | International Journal of High-Rise Buildings
180Guang-
zhouframe-
core tube169 4.76 387
Zheng-zhou
frame-shear wall
64 1.28 0.3 0.17
181Guang-
zhoushearwall
169 4.84 388 Beijingframe-shear wall
64 1.12
182Guang-
zhou
frame-shearwall
168 4.99 1.6 0.78 389 Chengduframe-shear wall
62 1.87
183 Nanjingframe-
core tube168 4.59 390 Beijing
shear wall
62 1.27
184 Dalianshearwall
168 3.49 0.95 391Shen-yang
frame-shear wall
62 1.56
185Shen-yang
shearwall
167 3.23 0.82 0.43 392 Beijingshear wall
60 1.37
186Zheng-zhou
frame-core tube
167 4.06 393 Chengduframe-shear wall
60 1.65
187Shang-
haiframe-
core tube167 3.96 394 Beijing
frame-shear wall
60 1.11
188 Nanjingframe-
core tube166 4.38 1.04 395 Beijing
frame-shear wall
59 1.87 0.5 0.26
189 Beijingframe-
core tube166 3.63 1.12 0.75 396 Nanjing
frame-shear wall
59 1.13
190 Suzhoushearwall
166 3.2 397 Zhuhaiframe-shear wall
59 1.88
191 Nanjingframe-
core tube166 3.54 0.87 398 Beijing
frame-core tube
58 1.74
192Guang-
zhouframe-
core tube165 4.42 1.06 0.54 399 Beijing
frame-shear wall
58 1.66
193Shen-yang
frame-shearwall
165 3.83 1.03 400 Chengduframe-shear wall
57 1.53
194Sheng-zhen
frame-core tube
165 4.43 401 Nanjingframe-shear wall
57 1.8
195 Chengduframe-
core tube163 4.22 402
Shen-yang
frame-shear wall
57 1.61
196Guang-
zhouframe-
core tube162 2.84 0.79 0.4 403
Guang-zhou
shear wall
56 1.19
197 Dalianshear wall
161 3.72 0.82 404Shen-yang
shear wall
56 1
198 Dalianshear wall
161 3.5 0.74 405 Xianframe-shear wall
56 1.37
199 Nanjingframe-
core tube160 3.56 0.96 406 Lanzhou
frame-shear wall
55 1.48
200 Nanjingframe-
core tube160 3.56 407 Lanzhou
shear wall
54 1.06
Table 1. Statistic data of natural vibration periods for high-rise buildings in China (CONT.)
61 Peifu Xu et al. | International Journal of High-Rise Buildings
201 Fuzhoushear wall
160 3.51 0.95 408 Chengduframe-shear wall
54 1.56
202 Dalianshear wall
160 3.85 1.08 409Guang-
zhou
frame-shear wall
52 1.4
203Shen-zhen
frame-core tube
159 3.7 410 Beijingshear wall
51 1.28
204Shen-zhen
shear wall
158 3.04 411 Beijingframe-shear wall
51 1.24
205 Dalianshear wall
158 3.26 0.84 0.45 412 Hefeiframe-shear wall
50 1.57
206 Dalianshear wall
157 3.41 1.01 0.5 413 Nanjingframe-shear wall
50 1.58
207 Dalianshear wall
157 3.99 1.15 0.57 414 Chengduframe-shear wall
50 1.49
Note: The natural vibration periods are periodsof structures in weak axis. The data are according to the data presented when the stucuturespassing over-limit approval in China, and may be adjusted in actual construction.
Table 1. Statistic data of natural vibration periods for high-rise buildings in China
(2) Shear structure
T1=3.997H =3.997 =1.805
=1.805 (9)
T2=1.333H =0.602 (10)
T3=0.800H =0.361 (11)
where GA is the shear stiffness of structure.
It can be seen from Fig.3:
(1) When the structural heights H ≥ 250 m, the reference
range of ratio between the second-order period and the
fundamental period T2/T1 is 0.26~0.34.
(2) When 50 m ≤ H < 250 m, the reference range of the
ratio T2/T1 is 0.23~0.31.
(3) The total average value of the ratio T2/T1 is 0.28 and
the dispersion coefficient of the ratio T2/T1 is 7.0%.
The analysis result conforms to the fundamental princi-
ples of mechanics of high-rise buildings. It can be derived
from above theoretical equations: the ratio T2/T1 is 0.16
for pure bending structure (shear wall structures), the ratio
T2/T1 is 0.33 for pure shear structure (frame structures),
and the ratios T2/T1 for frame-shear wall structure and
frame-core tube structure locate between the ratios of the
above two types of structures.
The relationship between the second-order period and
the structural height of high-rise buildings is shown in
Fig. 4. It can be found:
(1) When the structural heights H ≥ 250 m, the reference
range of the second-order period T2 is 0.08 ~0.12 .
(2) When 150 m ≤ H < 250 m, the reference range of T2
is 0.065 ~0.10 .
(3) When 100 m ≤ H < 150 m, the reference range of T2
is 0.05 ~0.1 .
(4) When 50 m ≤ H < 100 m, the reference range of T2
is 0.035 ~0.08 .
The relationship with the corresponding reference range
of the fundamental period T1 is about 0.28.
3.3 Third-order period T3
Due to data listed in Table 1, there is small sample for
the third-order period. However, it can be found from Table
1 and Fig. 5.
(1) When the structural height H ≥ 250 m, the reference
range of ratio between the third-order period and the fun-
damental period T3/T1 is 0.14~0.20.
(2) When 50 m ≤ H < 250 m, the reference range of the
ratio T3/T1 is 0.10~0.19.
(3) The total average value of the ratio T3/T1 is 0.15 and
the dispersion coefficient of the ratio T3/T1 is 21.1%.
The analysis result confirms to the analyze model of
high-rise buildings. The ratio T3/T1 is 0.06 for pure bend-
ing structure, the ratio T3/T1 is 0.2 for pure shear structure,
and the ratios T3/T1 for frame-shear wall structure and
frame-core tube structure locate between the ratios of the
above two types of structures.
4. The Relationship between Natural Vibration Period and Structural Heights of High-rise Buildings
Based on the definition of the natural vibration period,
Gi
gGA-----------
2GiH
2
2gGA---------------
GiH
2
2GA------------
uT
Gi
gGA----------- u
T
Gi
gGA----------- u
T
H H
H H
H H
H H
(CONT.)

62 Peifu Xu et al. | International Journal of High-Rise Buildings
the natural vibration period and the structural height fol-
lowing relationship:
T = C (12)
where C is a coefficient.
The statistical data and distribution law in Table 1 show
that the relationship between the natural vibration period
and the structural height of high-rise buildings conforms
to the following equations, and the high-rise buildings
described above (excluding pure steel structures and frame
structures) should satisfy the requirements of Chinese
codes and standards on global stability, story drift limit,
shear-gravity ratio and so on.
(1) Fundamental period T1
H ≥ 250m:
H
Figure 3. Relationship between T2/T1 and structural heights H.
Figure 4. Relationship between second-order periods T2 and structural heights H.

Relationship between Periods and Heights for High-rise Buildings in China 63
T1 = 0.3 ~0.4 (13)
150 m ≤ H < 250 m:
T1 = 0.25 ~0.4 (14)
100 m ≤ H < 150 m:
T1 = 0.2 ~0.35 (15)
50 m ≤ H < 100 m:
T1 = 0.15 ~0.3 (16)
For the structural heights H < 50 m, the previous linear
relationship between the natural vibration period and the
structural height satisfies the accuracy required in engi-
neering. It is suggested to use the previous reference range
for fundamental period, that is T1 = 0.014H~0.025H or T1
= 0.04n~0.075n. It can also use T1 = 0.08 ~0.15 .
(2) Second-order period T2
H ≥ 250 m:
T2 = 0.26T1~0.34T1 (17)
50 m ≤ H < 250 m:
T2 = 0.23T1~0.33T1 (18)
Total average value:
T2 = 0.28T1 (19)
(3) Third-order period T3
H ≥ 250 m:
T3 = 0.14T1~0.20T1 (20)
50 m ≤ H < 250 m:
T3 = 0.12T1~0.19T1 (21)
Total average value:
T3 = 0.15T1 (22)
Fig. 2 shows that ① If the fundamental period T1 of
high-rise building is larger than 0.4 , the structure is
flexible. ② If the fundamental period T1 of high-rise buil-
ding approaches 0.45 , the structure is too flexible.
5. Conclusions
Based on the data and analysis above, the main achie-
vements of this paper are described as follows:
(1) Based on 414 high-rise buildings completed or
passed over-limit approval in China, the distribution law
of natural vibration periods for high-rise buildings over
50 m follows subduplicate curve along the structural
heights.
(2) The reference ranges of fundamental period for high-
rise buildings (excluding pure steel structures and frame
structures) in China are described as follows ① when the
structural height H ≥ 250 m, fundamental period T1 = 0.3
~0.4 . ② When 150 m ≤ H < 250 m, T1 = 0.25
~0.40 . ③ When 100 m ≤ H < 150 m, T1 = 0.2 ~
0.35 . ④ When 50 m ≤ H < 100 m, T1 = 0.15 ~0.3
. ⑤ For H < 50 m, the linear relationship between the
natural vibration period and the structural height satisfies
the accuracy required in engineering. It is suggested that
T1 = 0.014H~0.025H or T1 = 0.04n~0.075n. It can also use
T1 = 0.08 ~0.15 .
H H
H H
H H
H H
H H
H
H
H H H
H H
H H
H
H H
Figure 5. Relationship between T3/T1 and structural heights H.

64 Peifu Xu et al. | International Journal of High-Rise Buildings
(3) The relationships for the first three order periods are
described as follows ① when H ≥ 250 m, the ratio between
the second-order and the fundamental period T2/T1 is 0.26
~0.34, and the ratio between the third-order and the fun-
damental period T3/T1 is 0.14~0.20. ② When 50 m ≤ H
< 250 m, the ratio T2/T1 is 0.23~0.33, and the ratio T3/T1
is 0.12~0.19.
(4) If the fundamental period T1 of high-rise building is
larger than 0.4 , the structure is flexible, and if the
fundamental period T1 of high-rise building approaches
0.45 , the structure is too flexible.
References
Xu, P. F., Fu, X. Y., Wang, C. K., and Xiao, C. Z. (2005).
Structural design of complex high-rise building. China
Architecture & Building Press, Beijing, China. (in chinese)
China Academy of Building Research (CABR). (1985).
Structural design of high-rise building. Science Press,
Beijing, China. (in Chinese)
Li, H. T. and Zhang, F. Q. (2003). “Approaches to computing
natural vibration period of tall building.” Journal of the
Hebei Institute of Architectural Engineering, 21, pp.
67~68. (in Chinese)
Bao, S. H. (2001). New high-rise building structures. China
Water & Power Press, Beijing, China. (in Chinese)
Hong, H. CH., Peng, X. B., and Bi, X. M., et all. (2012).
“Discussion on estimation measures of fundamental vib-
ration period of major construction projects.” Technology
for Earthquake Disaster Prevention, 7, pp. 227~237. (in
Chinese)
JGJ3-2010. (2010). “Technical specification for concrete struc-
tures of tall building.” China Architecture & Building
Press, Beijing, China. (in Chinese)
GB 5011-2010. (2010). “Code for seismic design of build-
ings.” China Architecture & Building Press, Beijing,
China. (in Chinese)
Lagos, R. and Kupeer, M. (2012). “Performance of high-rise
buildings under the February 27th 2010 Chilean earthquake.”
Proceedings of the International Symposium on Enginee-
ring Lessons Learned from the 2011 Great East Japan
Earthquake. Tokyo, Japan, pp. 1754~1765.
ASCE/SEI 7-10. (2010). “Minimum design loads for build-
ings and other structures.” the American Society of Civil
Engineers,Washington, USA.
H
H