Embed Size (px)
Citation preview
International Journal of Heat and Mass Transfer 55 (2012) 2953–2964
Contents lists available at SciVerse ScienceDirect
International Journal of Heat and Mass Transfer
journal homepage: www.elsevier .com/locate / i jhmt
Methodology for predicting spray quenching of thick-walled metal alloy tubes
Nikhin Mascarenhas, Issam Mudawar ⇑Boiling and Two-Phase Flow Laboratory, School of Mechanical Engineering, Purdue University, West Lafayette, IN 47907, USA
a r t i c l e i n f o
Article history:Received 17 August 2011Received in revised form 3 February 2012Accepted 3 February 2012Available online 22 March 2012
Keywords:Spray coolingQuenchingBoiling curve
0017-9310/$ - see front matter � 2012 Elsevier Ltd. Adoi:10.1016/j.ijheatmasstransfer.2012.02.018
⇑ Corresponding author. Tel.: +1 765 494 5705; faxE-mail address: [email protected] (I. MudURL: https://engineering.purdue.edu/BTPFL (I. Mu
a b s t r a c t
This paper explores the parametric influences of spray quenching for thick-walled metal alloy tubes.Using the point-source depiction of a spray, an analytical model is derived to determine the shape andsize of the spray impact zone, as well as the distribution of volumetric flux across the same zone. Thisdistribution is incorporated into heat transfer correlations for all spray boiling regimes to generate a com-plete boiling curve for every location across the impact zone. By setting boundary conditions for both thesprayed and unsprayed portions of the tube surface, a heat diffusion model is constructed for a unit cell ofthe tube for both aluminum alloy and steel. This model is used to construct spray quench curves for everypoint along the sprayed surface and within the wall. Increasing nozzle pressure drop or decreasing ori-fice-to-surface distance are shown to increase the magnitude of volumetric flux, which hastens the onsetof the rapid cooling stages of the quench as well as improves overall cooling effectiveness. The sprayedsurface is characterized by fast thermal response to the spray, while regions within the wall display moregradual response due to heat diffusion delays. With their superior thermal diffusivity, aluminum alloytubes transmit the cooling effect through the wall faster than steel tubes. For steel, the cooling effectis more concentrated near the sprayed surface, causing the sprayed surface to cool much faster and loca-tions within the wall much slower than for aluminum alloy. The predictive approach presented in thispaper facilitates the determination of surface temperature gradients in the quenched part to guardagainst stress concentration. Also, when combined with metallurgical transformation models for thealloy, it may be possible to predict material properties such as hardness and strength.
� 2012 Elsevier Ltd. All rights reserved.
1. Introduction
Intense heat dissipation from surfaces is a common concern inmany industries. High-flux cooling solutions include pool boiling[1,2], parallel forced convection boiling [3,4], jet impingement[5,6] and spray cooling. Also, both coolant additives [7] and surfaceaugmentation techniques [8–10] are commonly used to enhancethe rate of heat removal. The present study concerns the use ofsprays to cool un-augmented surfaces.
Tubes constitute a common shape that is found in a high per-centage of processed alloy components. They are used in a varietyof applications that include hydraulic cylinders, pivot pin cham-bers, gun barrels and plumbing conduits. These applications placeprimary emphasis on the strength, hardness and scratch resistanceof their constituent alloy tubes. It is therefore of vital importance tosubject these tubes to a controlled heat treatment process that en-sures optimal mechanical properties. While bath quenching iscommonly used in most heat treatment operations, absence of spa-tial control of the cooling process in a bath often results in a myriad
ll rights reserved.
: +1 765 494 0539.awar).dawar).
of local imperfections such as distortion, soft spots and regions ofpoor hardness and poor strength. These problems can be alleviatedby the use of sprays in the quenching stage of heat treatment.
A spray consists of a multitude of droplets with controlled sizes,speeds and trajectories, and is popular in many cooling applica-tions [11]. Two primary cooling advantages of sprays comparedto competing cooling schemes are their ability to increase heattransfer effectiveness and spread the cooling over a broad surfacearea. Their heat transfer effectiveness is a result of the large liquidsurface area-to-volume ratio achieved by liquid breakup into finedroplets.
The present study concerns the use of plain-orifice sprays thatachieve the liquid breakup by forcing the incoming liquid flowthrough a small orifice. Breakup can also be achieved with theaid of a tangential air stream in so-called air-assist sprays, whichare beyond the scope of the present study.
The complex interaction between the spray and hot alloy sur-face can be understood by breaking it down into its dominant pro-cess variables, namely, the hydrodynamic structure of the sprayitself, the placement of the spray nozzle relative to the surface,and the geometry and heat diffusion characteristics of the alloyitself. The spray parameters that have the strongest influence oncooling performance are volumetric flux, Q00, Sauter mean
Nomenclature
a half-length of major diameter of elliptical impact areaA area formed by projecting spherical surface A0 on inner
surface of tubeA0 area of spherical surface bound by spray’s cone angle
and centered at spray orifice, and whose radius is equalto distance from orifice to inner surface of tube
b half-length of minor diameter of elliptical impact areaCHF critical heat fluxcp specific heat at constant pressureD inside diameter of tubedo diameter of nozzle’s orificed32 Sauter mean diameterh heat transfer coefficientH distance from orifice to inner surface of tubehfg latent heat of vaporizationk thermal conductivityK nozzle’s flow coefficientNud32
Nusselt number based on d32; hd32/kf
DP pressure drop across spray nozzlePr Prandtl numberQ total volumetric flow rate of sprayQ00 local volumetric flux across sprayed surfaceQ 00sp uniform volumetric flux along spherical surface bound
by spray’s cone angle and centered at spray nozzle’s ori-fice, and whose radius is equal to distance form orificeto inner surface of tube
q00 heat fluxq00m;p local (point-based) critical heat fluxr coordinate defined in Fig. 3Redo
Reynolds number based on nozzle’s orifice diameterRed32 Reynolds number based on d32; qfQ00d32/lf
T temperature
Tf spray liquid temperatureTs surface temperatureTsat saturation temperatureDT difference between surface and liquid temperatures,
Ts � Tf
DTsub subcooling of spray liquid, Tsat � Tf
um mean droplet velocityWedo
Weber number based on nozzle’s orifice diameterx coordinate defined in Fig. 3z coordinate defined in Fig. 3
Greek Symbolsb angle defined in Fig. 4c angle defined in Fig. 4h cone angle of sprayl viscosityq densityr surface tensionu half-angle defined in Fig. 4
Subscriptsa ambient airCHF critical heat fluxDFB departure from film boilingf liquidg vaporMIN minimum heat flux (Leidenfrost point)OSP onset of single-phase liquid coolings tube’s surfacesat saturationsub subcooling
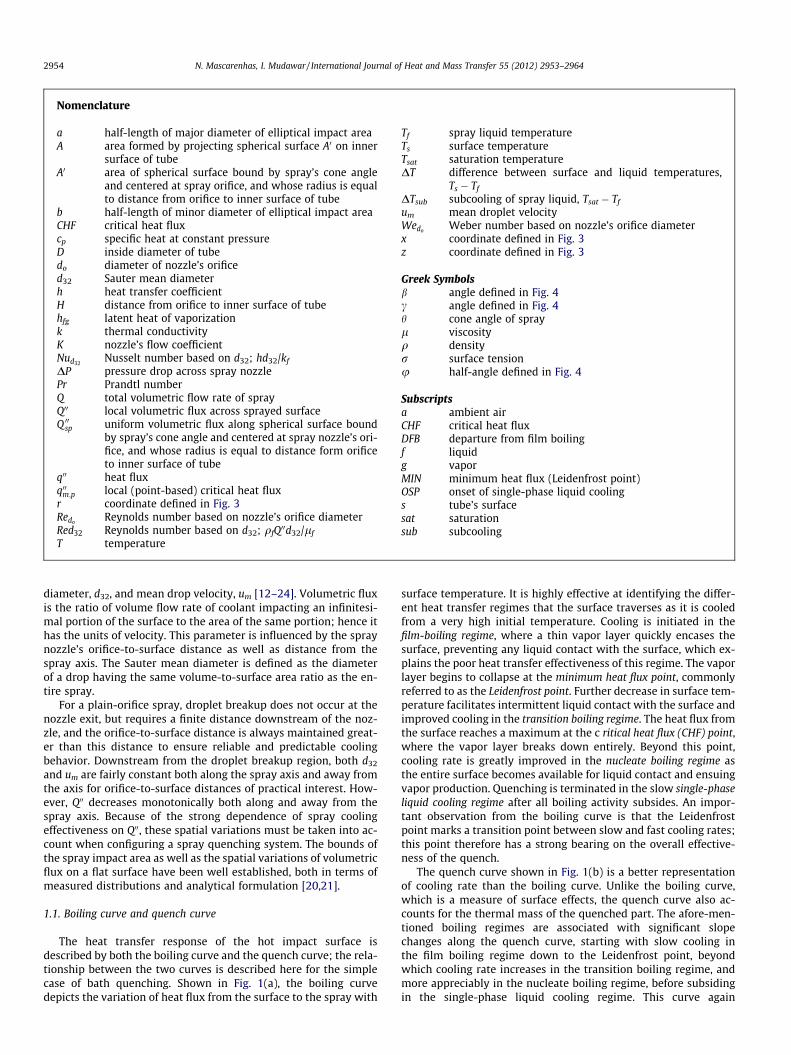
2954 N. Mascarenhas, I. Mudawar / International Journal of Heat and Mass Transfer 55 (2012) 2953–2964
diameter, d32, and mean drop velocity, um [12–24]. Volumetric fluxis the ratio of volume flow rate of coolant impacting an infinitesi-mal portion of the surface to the area of the same portion; hence ithas the units of velocity. This parameter is influenced by the spraynozzle’s orifice-to-surface distance as well as distance from thespray axis. The Sauter mean diameter is defined as the diameterof a drop having the same volume-to-surface area ratio as the en-tire spray.
For a plain-orifice spray, droplet breakup does not occur at thenozzle exit, but requires a finite distance downstream of the noz-zle, and the orifice-to-surface distance is always maintained great-er than this distance to ensure reliable and predictable coolingbehavior. Downstream from the droplet breakup region, both d32
and um are fairly constant both along the spray axis and away fromthe axis for orifice-to-surface distances of practical interest. How-ever, Q00 decreases monotonically both along and away from thespray axis. Because of the strong dependence of spray coolingeffectiveness on Q00, these spatial variations must be taken into ac-count when configuring a spray quenching system. The bounds ofthe spray impact area as well as the spatial variations of volumetricflux on a flat surface have been well established, both in terms ofmeasured distributions and analytical formulation [20,21].
1.1. Boiling curve and quench curve
The heat transfer response of the hot impact surface isdescribed by both the boiling curve and the quench curve; the rela-tionship between the two curves is described here for the simplecase of bath quenching. Shown in Fig. 1(a), the boiling curvedepicts the variation of heat flux from the surface to the spray with
surface temperature. It is highly effective at identifying the differ-ent heat transfer regimes that the surface traverses as it is cooledfrom a very high initial temperature. Cooling is initiated in thefilm-boiling regime, where a thin vapor layer quickly encases thesurface, preventing any liquid contact with the surface, which ex-plains the poor heat transfer effectiveness of this regime. The vaporlayer begins to collapse at the minimum heat flux point, commonlyreferred to as the Leidenfrost point. Further decrease in surface tem-perature facilitates intermittent liquid contact with the surface andimproved cooling in the transition boiling regime. The heat flux fromthe surface reaches a maximum at the c ritical heat flux (CHF) point,where the vapor layer breaks down entirely. Beyond this point,cooling rate is greatly improved in the nucleate boiling regime asthe entire surface becomes available for liquid contact and ensuingvapor production. Quenching is terminated in the slow single-phaseliquid cooling regime after all boiling activity subsides. An impor-tant observation from the boiling curve is that the Leidenfrostpoint marks a transition point between slow and fast cooling rates;this point therefore has a strong bearing on the overall effective-ness of the quench.
The quench curve shown in Fig. 1(b) is a better representationof cooling rate than the boiling curve. Unlike the boiling curve,which is a measure of surface effects, the quench curve also ac-counts for the thermal mass of the quenched part. The afore-men-tioned boiling regimes are associated with significant slopechanges along the quench curve, starting with slow cooling inthe film boiling regime down to the Leidenfrost point, beyondwhich cooling rate increases in the transition boiling regime, andmore appreciably in the nucleate boiling regime, before subsidingin the single-phase liquid cooling regime. This curve again
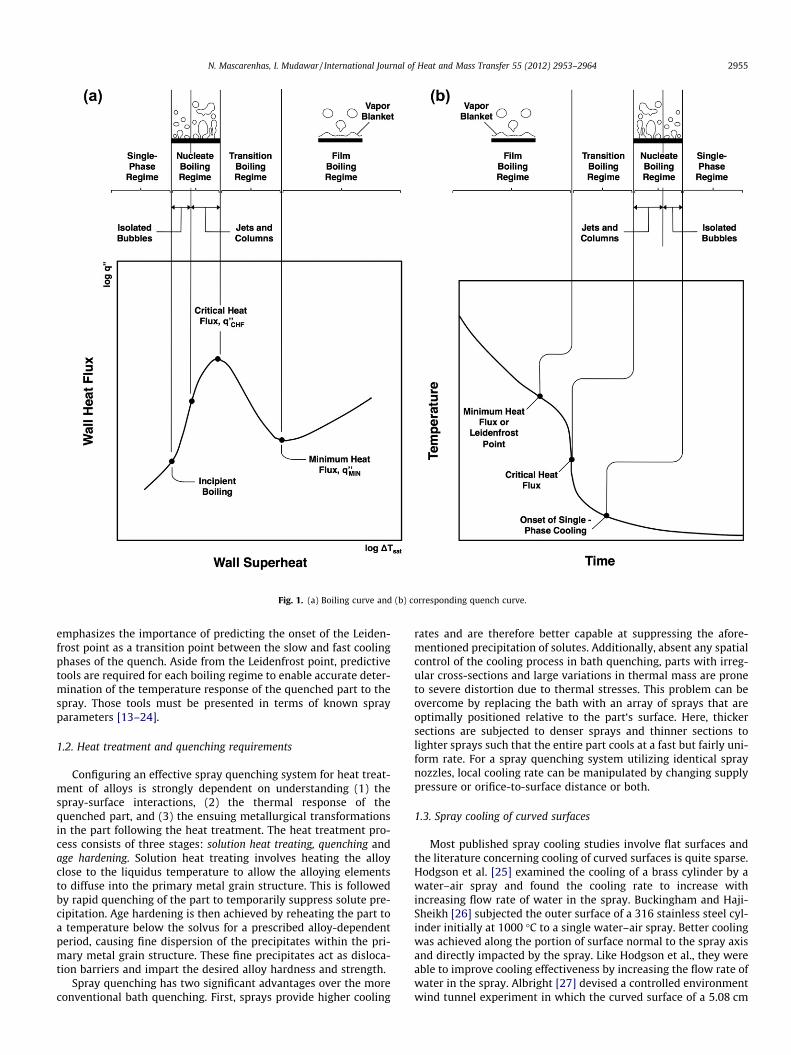
Fig. 1. (a) Boiling curve and (b) corresponding quench curve.
N. Mascarenhas, I. Mudawar / International Journal of Heat and Mass Transfer 55 (2012) 2953–2964 2955
emphasizes the importance of predicting the onset of the Leiden-frost point as a transition point between the slow and fast coolingphases of the quench. Aside from the Leidenfrost point, predictivetools are required for each boiling regime to enable accurate deter-mination of the temperature response of the quenched part to thespray. Those tools must be presented in terms of known sprayparameters [13–24].
1.2. Heat treatment and quenching requirements
Configuring an effective spray quenching system for heat treat-ment of alloys is strongly dependent on understanding (1) thespray-surface interactions, (2) the thermal response of thequenched part, and (3) the ensuing metallurgical transformationsin the part following the heat treatment. The heat treatment pro-cess consists of three stages: solution heat treating, quenching andage hardening. Solution heat treating involves heating the alloyclose to the liquidus temperature to allow the alloying elementsto diffuse into the primary metal grain structure. This is followedby rapid quenching of the part to temporarily suppress solute pre-cipitation. Age hardening is then achieved by reheating the part toa temperature below the solvus for a prescribed alloy-dependentperiod, causing fine dispersion of the precipitates within the pri-mary metal grain structure. These fine precipitates act as disloca-tion barriers and impart the desired alloy hardness and strength.
Spray quenching has two significant advantages over the moreconventional bath quenching. First, sprays provide higher cooling
rates and are therefore better capable at suppressing the afore-mentioned precipitation of solutes. Additionally, absent any spatialcontrol of the cooling process in bath quenching, parts with irreg-ular cross-sections and large variations in thermal mass are proneto severe distortion due to thermal stresses. This problem can beovercome by replacing the bath with an array of sprays that areoptimally positioned relative to the part‘s surface. Here, thickersections are subjected to denser sprays and thinner sections tolighter sprays such that the entire part cools at a fast but fairly uni-form rate. For a spray quenching system utilizing identical spraynozzles, local cooling rate can be manipulated by changing supplypressure or orifice-to-surface distance or both.
1.3. Spray cooling of curved surfaces
Most published spray cooling studies involve flat surfaces andthe literature concerning cooling of curved surfaces is quite sparse.Hodgson et al. [25] examined the cooling of a brass cylinder by awater–air spray and found the cooling rate to increase withincreasing flow rate of water in the spray. Buckingham and Haji-Sheikh [26] subjected the outer surface of a 316 stainless steel cyl-inder initially at 1000 �C to a single water–air spray. Better coolingwas achieved along the portion of surface normal to the spray axisand directly impacted by the spray. Like Hodgson et al., they wereable to improve cooling effectiveness by increasing the flow rate ofwater in the spray. Albright [27] devised a controlled environmentwind tunnel experiment in which the curved surface of a 5.08 cm
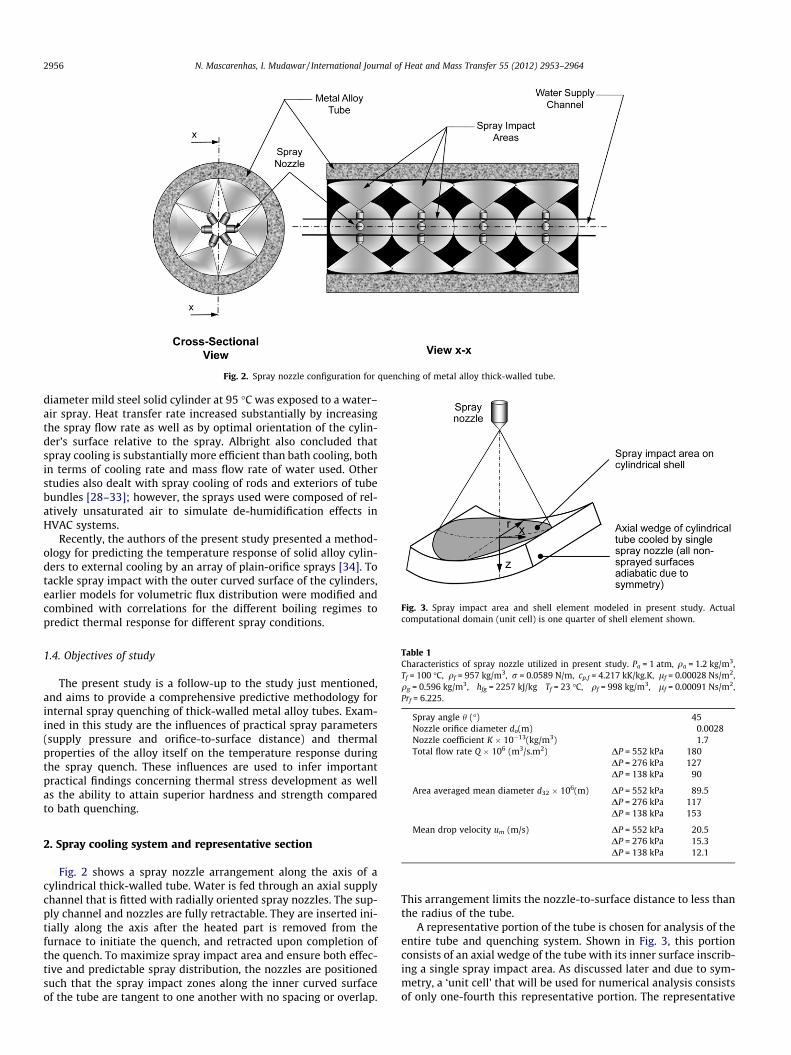
Fig. 2. Spray nozzle configuration for quenching of metal alloy thick-walled tube.
Fig. 3. Spray impact area and shell element modeled in present study. Actualcomputational domain (unit cell) is one quarter of shell element shown.
2956 N. Mascarenhas, I. Mudawar / International Journal of Heat and Mass Transfer 55 (2012) 2953–2964
diameter mild steel solid cylinder at 95 �C was exposed to a water–air spray. Heat transfer rate increased substantially by increasingthe spray flow rate as well as by optimal orientation of the cylin-der’s surface relative to the spray. Albright also concluded thatspray cooling is substantially more efficient than bath cooling, bothin terms of cooling rate and mass flow rate of water used. Otherstudies also dealt with spray cooling of rods and exteriors of tubebundles [28–33]; however, the sprays used were composed of rel-atively unsaturated air to simulate de-humidification effects inHVAC systems.
Recently, the authors of the present study presented a method-ology for predicting the temperature response of solid alloy cylin-ders to external cooling by an array of plain-orifice sprays [34]. Totackle spray impact with the outer curved surface of the cylinders,earlier models for volumetric flux distribution were modified andcombined with correlations for the different boiling regimes topredict thermal response for different spray conditions.
Table 1Characteristics of spray nozzle utilized in present study. Pa = 1 atm, qa = 1.2 kg/m3,Tf = 100 �C, qf = 957 kg/m3, r = 0.0589 N/m, cp.f = 4.217 kK/kg.K, lf = 0.00028 Ns/m2,qg = 0.596 kg/m3, hfg = 2257 kJ/kg Tf = 23 �C, qf = 998 kg/m3, lf = 0.00091 Ns/m2,Prf = 6.225.
Spray angle h (�) 45Nozzle orifice diameter do(m) 0.0028Nozzle coefficient K � 10�13(kg/m3) 1.7Total flow rate Q � 106 (m3/s.m2) DP = 552 kPa 180
DP = 276 kPa 127DP = 138 kPa 90
Area averaged mean diameter d32 � 106(m) DP = 552 kPa 89.5DP = 276 kPa 117DP = 138 kPa 153
1.4. Objectives of study
The present study is a follow-up to the study just mentioned,and aims to provide a comprehensive predictive methodology forinternal spray quenching of thick-walled metal alloy tubes. Exam-ined in this study are the influences of practical spray parameters(supply pressure and orifice-to-surface distance) and thermalproperties of the alloy itself on the temperature response duringthe spray quench. These influences are used to infer importantpractical findings concerning thermal stress development as wellas the ability to attain superior hardness and strength comparedto bath quenching.
Mean drop velocity um (m/s) DP = 552 kPa 20.5DP = 276 kPa 15.3DP = 138 kPa 12.1
2. Spray cooling system and representative section
Fig. 2 shows a spray nozzle arrangement along the axis of acylindrical thick-walled tube. Water is fed through an axial supplychannel that is fitted with radially oriented spray nozzles. The sup-ply channel and nozzles are fully retractable. They are inserted ini-tially along the axis after the heated part is removed from thefurnace to initiate the quench, and retracted upon completion ofthe quench. To maximize spray impact area and ensure both effec-tive and predictable spray distribution, the nozzles are positionedsuch that the spray impact zones along the inner curved surfaceof the tube are tangent to one another with no spacing or overlap.
This arrangement limits the nozzle-to-surface distance to less thanthe radius of the tube.
A representative portion of the tube is chosen for analysis of theentire tube and quenching system. Shown in Fig. 3, this portionconsists of an axial wedge of the tube with its inner surface inscrib-ing a single spray impact area. As discussed later and due to sym-metry, a ‘unit cell’ that will be used for numerical analysis consistsof only one-fourth this representative portion. The representative
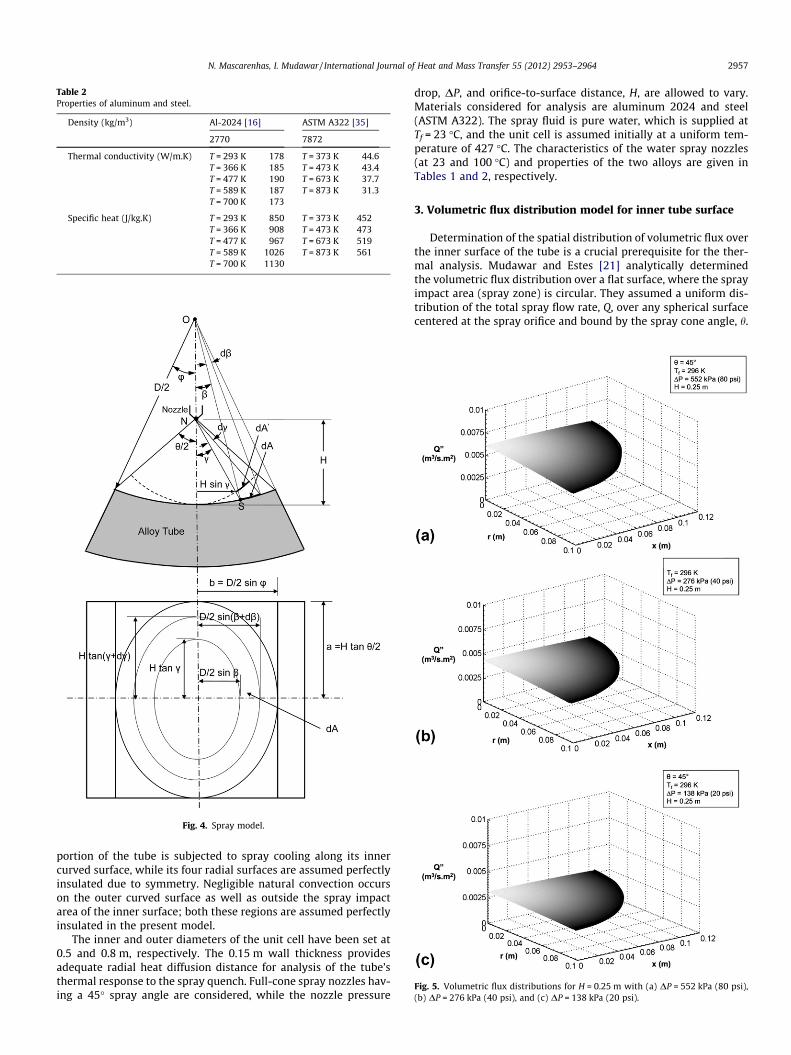
Fig. 4. Spray model.
Table 2Properties of aluminum and steel.
Density (kg/m3) Al-2024 [16] ASTM A322 [35]
2770 7872
Thermal conductivity (W/m.K) T = 293 K 178 T = 373 K 44.6T = 366 K 185 T = 473 K 43.4T = 477 K 190 T = 673 K 37.7T = 589 K 187 T = 873 K 31.3T = 700 K 173
Specific heat (J/kg.K) T = 293 K 850 T = 373 K 452T = 366 K 908 T = 473 K 473T = 477 K 967 T = 673 K 519T = 589 K 1026 T = 873 K 561T = 700 K 1130
Fig. 5. Volumetric flux distributions for H = 0.25 m with (a) DP = 552 kPa (80 psi),(b) DP = 276 kPa (40 psi), and (c) DP = 138 kPa (20 psi).
N. Mascarenhas, I. Mudawar / International Journal of Heat and Mass Transfer 55 (2012) 2953–2964 2957
portion of the tube is subjected to spray cooling along its innercurved surface, while its four radial surfaces are assumed perfectlyinsulated due to symmetry. Negligible natural convection occurson the outer curved surface as well as outside the spray impactarea of the inner surface; both these regions are assumed perfectlyinsulated in the present model.
The inner and outer diameters of the unit cell have been set at0.5 and 0.8 m, respectively. The 0.15 m wall thickness providesadequate radial heat diffusion distance for analysis of the tube’sthermal response to the spray quench. Full-cone spray nozzles hav-ing a 45� spray angle are considered, while the nozzle pressure
drop, DP, and orifice-to-surface distance, H, are allowed to vary.Materials considered for analysis are aluminum 2024 and steel(ASTM A322). The spray fluid is pure water, which is supplied atTf = 23 �C, and the unit cell is assumed initially at a uniform tem-perature of 427 �C. The characteristics of the water spray nozzles(at 23 and 100 �C) and properties of the two alloys are given inTables 1 and 2, respectively.
3. Volumetric flux distribution model for inner tube surface
Determination of the spatial distribution of volumetric flux overthe inner surface of the tube is a crucial prerequisite for the ther-mal analysis. Mudawar and Estes [21] analytically determinedthe volumetric flux distribution over a flat surface, where the sprayimpact area (spray zone) is circular. They assumed a uniform dis-tribution of the total spray flow rate, Q, over any spherical surfacecentered at the spray orifice and bound by the spray cone angle, h.

Fig. 6. Volumetric flux distribution for H = 0.197 m with DP = 552 kPa (80 psi).
2958 N. Mascarenhas, I. Mudawar / International Journal of Heat and Mass Transfer 55 (2012) 2953–2964
For the inner curved wall of the representative section, Fig. 3 showsthat the projection of the spray zone onto any flat surface normalto the spray axis is elliptic. This is a consequence of the shorter dis-tance that the spray has to travel before impacting the curved sur-face, which reduces the spray zone axis along the curved surface.The spray zone axis along the length of the tube remains un-changed. Fig. 4 shows the detailed geometry of the volumetric dis-tribution model. The model developed in this study can be appliedto nozzle-to-surface heights that are greater or smaller than thetube radius, despite the fact that the nozzle arrangement in thisstudy requires the latter.
As discussed by Mudawar and Estes [21], the differential area,dA0 of a spherical surface of radius H, equal to the distance betweenthe orifice and the tube’s surface, is given by
dA0 ¼ 2pH2 sin cdc: ð1Þ
Based on the point-source depiction of the spray by Mudawarand Estes, a uniform volumetric flux over the spherical surface isdefined as
Q 00sp ¼Q
2pH2½1� cosðh=2Þ�: ð2Þ
The oval passing through point S on the surface in Fig. 4 has thearea
Table 3Spray quenching heat transfer correlations.
Boiling regime Correlation
Single phase [13,24]:TOSP ¼ 13:43Re0:167
32 Pr
Nud32¼ 4:7Re0:61
d32Pr0:32
f
Nucleate boiling [24]:q00d32lf hfg
¼ 0:00479 cp;f ðTs�hfg
nCritical Heat Flux [24]: q00m;p
qg hfg Q 00 ¼ 2:3 qf
qg
� �0:3 qf
�Transition boiling [15]: q00 ¼ q00CHF �
q00CHF�q00MIN
ðDTCHF�DTMIN
Minimum heat flux [15]: q00MIN ¼ 3:324� 106Q 0
DTMIN ¼ 2:049� 102QFilm wetting [22]: q00 ¼ q00MIN þ
q00DFB�q00MIN
ðDTDFB�DTMIN
þ @q00
@DT
DFB
1ðDTDFB�DTMIN Þ2
h@q00
@DT
DFB¼ 1:164� 104
q00DFB ¼ 6:1� 106Q 000:58
DTDFB ¼ 886:2Q 000:192UFilm boiling [15] q00 ¼ 63:25DT1:691Q 000:
Units: q00 [W m�2], DT = Ts – Tf [�C], Q00 [m3 s�1 m�2], Um[m s�1], d32 [m], h [W m�2K�1],(Ts + Tf)/2 is used in single-phase regime and saturation temperature in other regimes to
A ¼ pðH tan cÞ D2
sin b
� �: ð3Þ
The projection of dA0 on the tube’s surface is another differentialarea, dA, which can be obtained by differentiating Eq. (3).
dA ¼ 2pH2 sin cD
4H
� �cosbcosc
tan bsin c cos c
þ dbdc
� �� �dc: ð4Þ
Applying the sine rule to triangle NOS in Fig. 4,
H � D=2sinfp� ðp� bþ cÞg ¼
D=2sinc
; ð5Þ
which yields
b ¼ sin�1 2HD� 1
� �sin c
� �þ c: ð6Þ
Differentiating Eq. (6) yields
dbdc¼ 2H
D� 1
� �cos c
cos b cos cþ sin b sin cþ 1: ð7Þ
Combining Eqs. (6) and (7) into Eq. (4) gives
dA ¼ 2pH2 sin ccos3 c
D4H
sin b cot cþ cos b cos2 cþ cos2 c2HD� 1
� ���
� 11þ tan b tan c
�dc: ð8Þ
The spray volumetric flux along the curved impact surface can beobtained by combining Eqs. (1), (2) and (8).
Q 00 ¼ Q 00spdA0
dA
¼ Q
2pH2½1� cosðh=2Þ�cos3 c
D4H
sin b cot cþ cos b cos2 c�
þ cos2 c2HD� 1
� �1
1þ tan b tan c
��1
: ð9Þ
Fig. 4 shows that the half-angle of the tube’s representative sec-tion is related to the spray’s cone angle by the relation (obtainedusing the sine rule)
0:123f
kf
d32
� �0:22þ Tf
Tf Þo5:75 qf
qg
� �2:5 qf Q 002 d32
r
� �0:35
Q 002d32
r
��0:35
1þ 0:0019 qf cp;f DTsub
qg hfg
� �
Þ3DT3
CHF � 3DT2CHFDTMIN þ 6DTCHFDTMINDT � 3ðDTCHF þ DTMINÞDT2 þ 2DT3
h i00:544U0:324
m000:066U0:138
m d�0:03532
Þ3ð3DTDFB � DTMINÞDT2
MIN � 6DTDFBDTMINDT þ 3ðDTDFB þ DTMINÞDT2 � 2DT3h i�DTDFBDT2
MIN þ ð2DTDFBþ DTMINÞDTMINDT � ðDTDFB þ 2DTMINÞDT2 þ DT3i
Q 000:397U0:0995m d�0:0366
32
9U0:244m
0:144m d0:0367
32264d�0:062
32
qf[kg m�3], hfg [J kg�1], cp,f [J kg�1K�1], kf [W m�1 K�1], lf[N s m�2], r [N m�1].evaluate fluid properties.
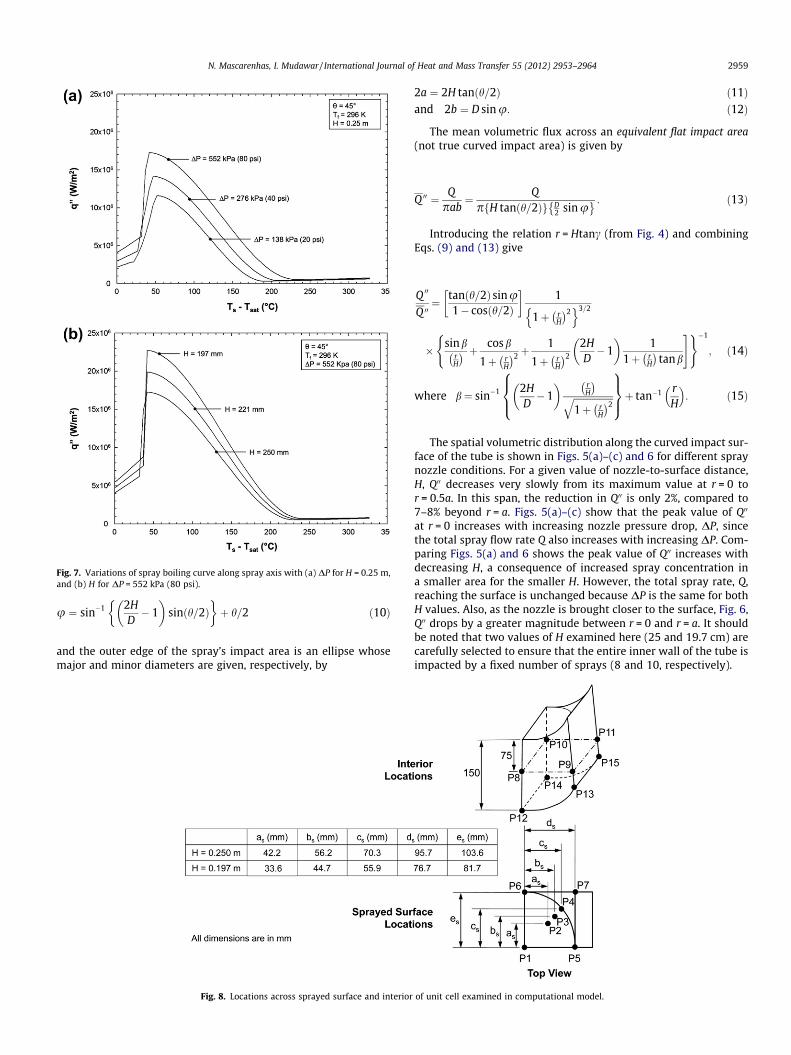
Fig. 7. Variations of spray boiling curve along spray axis with (a) DP for H = 0.25 m,and (b) H for DP = 552 kPa (80 psi).
N. Mascarenhas, I. Mudawar / International Journal of Heat and Mass Transfer 55 (2012) 2953–2964 2959
u ¼ sin�1 2HD� 1
� �sinðh=2Þ
� �þ h=2 ð10Þ
and the outer edge of the spray’s impact area is an ellipse whosemajor and minor diameters are given, respectively, by
Fig. 8. Locations across sprayed surface and interior
2a ¼ 2H tanðh=2Þ ð11Þand 2b ¼ D sin u: ð12Þ
The mean volumetric flux across an equivalent flat impact area(not true curved impact area) is given by
Q 00 ¼ Qpab
¼ QpfH tanðh=2Þg D
2 sinu � : ð13Þ
Introducing the relation r = Htanc (from Fig. 4) and combiningEqs. (9) and (13) give
Q 00
Q 00¼ tanðh=2Þsinu
1� cosðh=2Þ
� 1
1þ rH
� �2n o3=2
� sinbrH
� � þ cosb
1þ rH
� �2 þ1
1þ rH
� �2
2HD�1
� �1
1þ rH
� �tanb
( #)�1
; ð14Þ
where b¼ sin�1 2HD�1
� � rH
� �ffiffiffiffiffiffiffiffiffiffiffiffiffiffiffiffiffi1þ r
H
� �2q
8><>:
9>=>;þ tan�1 r
H
� �: ð15Þ
The spatial volumetric distribution along the curved impact sur-face of the tube is shown in Figs. 5(a)–(c) and 6 for different spraynozzle conditions. For a given value of nozzle-to-surface distance,H, Q00 decreases very slowly from its maximum value at r = 0 tor = 0.5a. In this span, the reduction in Q00 is only 2%, compared to7–8% beyond r = a. Figs. 5(a)–(c) show that the peak value of Q00
at r = 0 increases with increasing nozzle pressure drop, DP, sincethe total spray flow rate Q also increases with increasing DP. Com-paring Figs. 5(a) and 6 shows the peak value of Q00 increases withdecreasing H, a consequence of increased spray concentration ina smaller area for the smaller H. However, the total spray rate, Q,reaching the surface is unchanged because DP is the same for bothH values. Also, as the nozzle is brought closer to the surface, Fig. 6,Q00 drops by a greater magnitude between r = 0 and r = a. It shouldbe noted that two values of H examined here (25 and 19.7 cm) arecarefully selected to ensure that the entire inner wall of the tube isimpacted by a fixed number of sprays (8 and 10, respectively).
of unit cell examined in computational model.
2960 N. Mascarenhas, I. Mudawar / International Journal of Heat and Mass Transfer 55 (2012) 2953–2964
4. Determination of boiling curves for sprayed surface
Another spray parameter important to predicting the spray heattransfer relations corresponding to the different regimes is Sautermean diameter, d32. This parameter is determined from the nozzlepressure drop, DP, and orifice diameter, do, based on the followingcorrelation for full cone spray nozzles [20],
d32
do¼ 3:67 We1=2
d0Redo
h i�0:259: ð16Þ
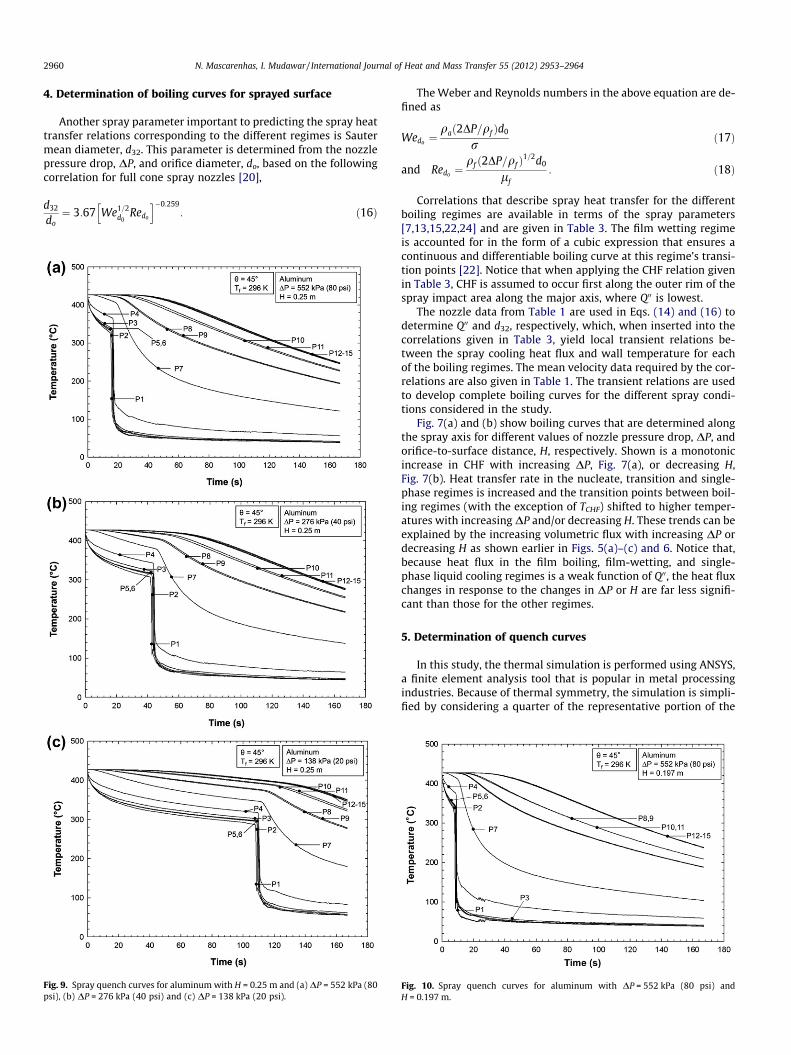
Fig. 9. Spray quench curves for aluminum with H = 0.25 m and (a) DP = 552 kPa (80psi), (b) DP = 276 kPa (40 psi) and (c) DP = 138 kPa (20 psi).
The Weber and Reynolds numbers in the above equation are de-fined as
Wedo ¼qað2DP=qf Þd0
rð17Þ
and Redo ¼qf ð2DP=qf Þ
1=2d0
lf: ð18Þ
Correlations that describe spray heat transfer for the differentboiling regimes are available in terms of the spray parameters[7,13,15,22,24] and are given in Table 3. The film wetting regimeis accounted for in the form of a cubic expression that ensures acontinuous and differentiable boiling curve at this regime’s transi-tion points [22]. Notice that when applying the CHF relation givenin Table 3, CHF is assumed to occur first along the outer rim of thespray impact area along the major axis, where Q00 is lowest.
The nozzle data from Table 1 are used in Eqs. (14) and (16) todetermine Q00 and d32, respectively, which, when inserted into thecorrelations given in Table 3, yield local transient relations be-tween the spray cooling heat flux and wall temperature for eachof the boiling regimes. The mean velocity data required by the cor-relations are also given in Table 1. The transient relations are usedto develop complete boiling curves for the different spray condi-tions considered in the study.
Fig. 7(a) and (b) show boiling curves that are determined alongthe spray axis for different values of nozzle pressure drop, DP, andorifice-to-surface distance, H, respectively. Shown is a monotonicincrease in CHF with increasing DP, Fig. 7(a), or decreasing H,Fig. 7(b). Heat transfer rate in the nucleate, transition and single-phase regimes is increased and the transition points between boil-ing regimes (with the exception of TCHF) shifted to higher temper-atures with increasing DP and/or decreasing H. These trends can beexplained by the increasing volumetric flux with increasing DP ordecreasing H as shown earlier in Figs. 5(a)–(c) and 6. Notice that,because heat flux in the film boiling, film-wetting, and single-phase liquid cooling regimes is a weak function of Q00, the heat fluxchanges in response to the changes in DP or H are far less signifi-cant than those for the other regimes.
5. Determination of quench curves
In this study, the thermal simulation is performed using ANSYS,a finite element analysis tool that is popular in metal processingindustries. Because of thermal symmetry, the simulation is simpli-fied by considering a quarter of the representative portion of the
Fig. 10. Spray quench curves for aluminum with DP = 552 kPa (80 psi) andH = 0.197 m.
N. Mascarenhas, I. Mudawar / International Journal of Heat and Mass Transfer 55 (2012) 2953–2964 2961
tube impacted by a single spray and depicted in Fig. 3. ANSYS anal-ysis is comprised of three stages: pre-processing, solution andpost-processing. Pre-processing is the input stage, where all inputsrequired for analysis are supplied to the software including themodel dimensions, material properties and boundary conditions.The boundary conditions in this case are the spray heat flux withinthe impact area along the inner wall of the unit cell, and perfectinsulation on all the other surfaces. Solution stage is the internalcomputation phase of ANSYS, subject to the constraints set bythe user, such as convergence requirements and solution method-
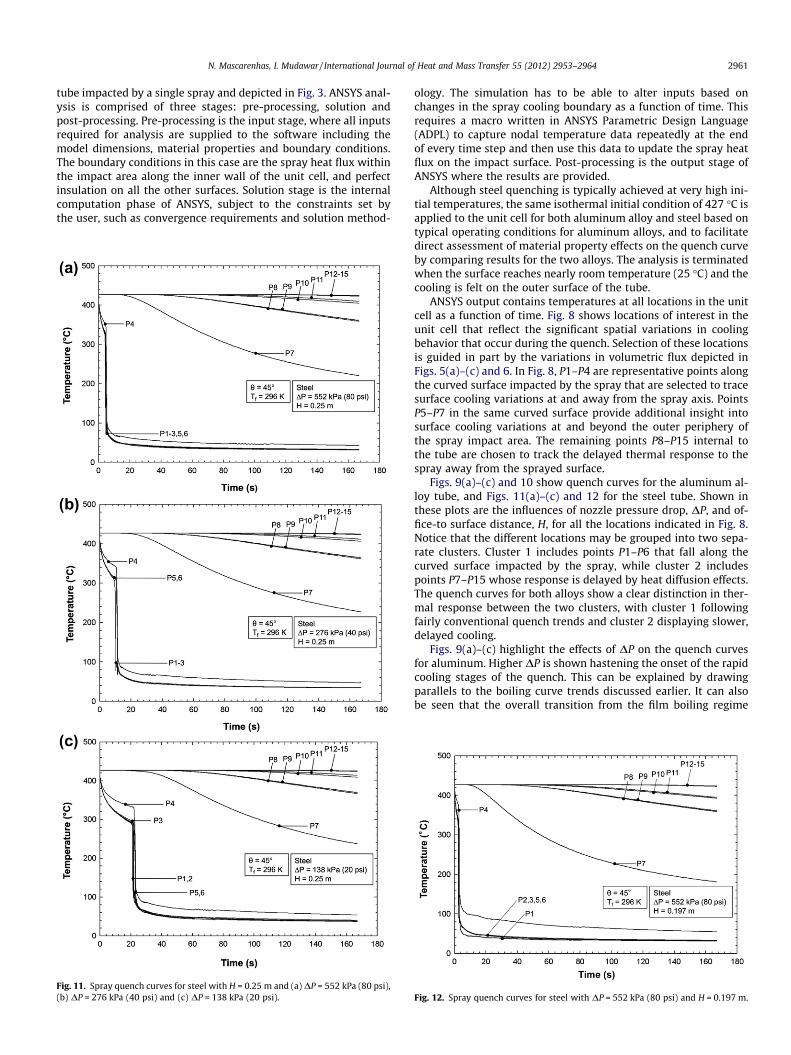
Fig. 11. Spray quench curves for steel with H = 0.25 m and (a) DP = 552 kPa (80 psi),(b) DP = 276 kPa (40 psi) and (c) DP = 138 kPa (20 psi).
ology. The simulation has to be able to alter inputs based onchanges in the spray cooling boundary as a function of time. Thisrequires a macro written in ANSYS Parametric Design Language(ADPL) to capture nodal temperature data repeatedly at the endof every time step and then use this data to update the spray heatflux on the impact surface. Post-processing is the output stage ofANSYS where the results are provided.
Although steel quenching is typically achieved at very high ini-tial temperatures, the same isothermal initial condition of 427 �C isapplied to the unit cell for both aluminum alloy and steel based ontypical operating conditions for aluminum alloys, and to facilitatedirect assessment of material property effects on the quench curveby comparing results for the two alloys. The analysis is terminatedwhen the surface reaches nearly room temperature (25 �C) and thecooling is felt on the outer surface of the tube.
ANSYS output contains temperatures at all locations in the unitcell as a function of time. Fig. 8 shows locations of interest in theunit cell that reflect the significant spatial variations in coolingbehavior that occur during the quench. Selection of these locationsis guided in part by the variations in volumetric flux depicted inFigs. 5(a)–(c) and 6. In Fig. 8, P1–P4 are representative points alongthe curved surface impacted by the spray that are selected to tracesurface cooling variations at and away from the spray axis. PointsP5–P7 in the same curved surface provide additional insight intosurface cooling variations at and beyond the outer periphery ofthe spray impact area. The remaining points P8–P15 internal tothe tube are chosen to track the delayed thermal response to thespray away from the sprayed surface.
Figs. 9(a)–(c) and 10 show quench curves for the aluminum al-loy tube, and Figs. 11(a)–(c) and 12 for the steel tube. Shown inthese plots are the influences of nozzle pressure drop, DP, and of-fice-to surface distance, H, for all the locations indicated in Fig. 8.Notice that the different locations may be grouped into two sepa-rate clusters. Cluster 1 includes points P1–P6 that fall along thecurved surface impacted by the spray, while cluster 2 includespoints P7–P15 whose response is delayed by heat diffusion effects.The quench curves for both alloys show a clear distinction in ther-mal response between the two clusters, with cluster 1 followingfairly conventional quench trends and cluster 2 displaying slower,delayed cooling.
Figs. 9(a)–(c) highlight the effects of DP on the quench curvesfor aluminum. Higher DP is shown hastening the onset of the rapidcooling stages of the quench. This can be explained by drawingparallels to the boiling curve trends discussed earlier. It can alsobe seen that the overall transition from the film boiling regime
Fig. 12. Spray quench curves for steel with DP = 552 kPa (80 psi) and H = 0.197 m.
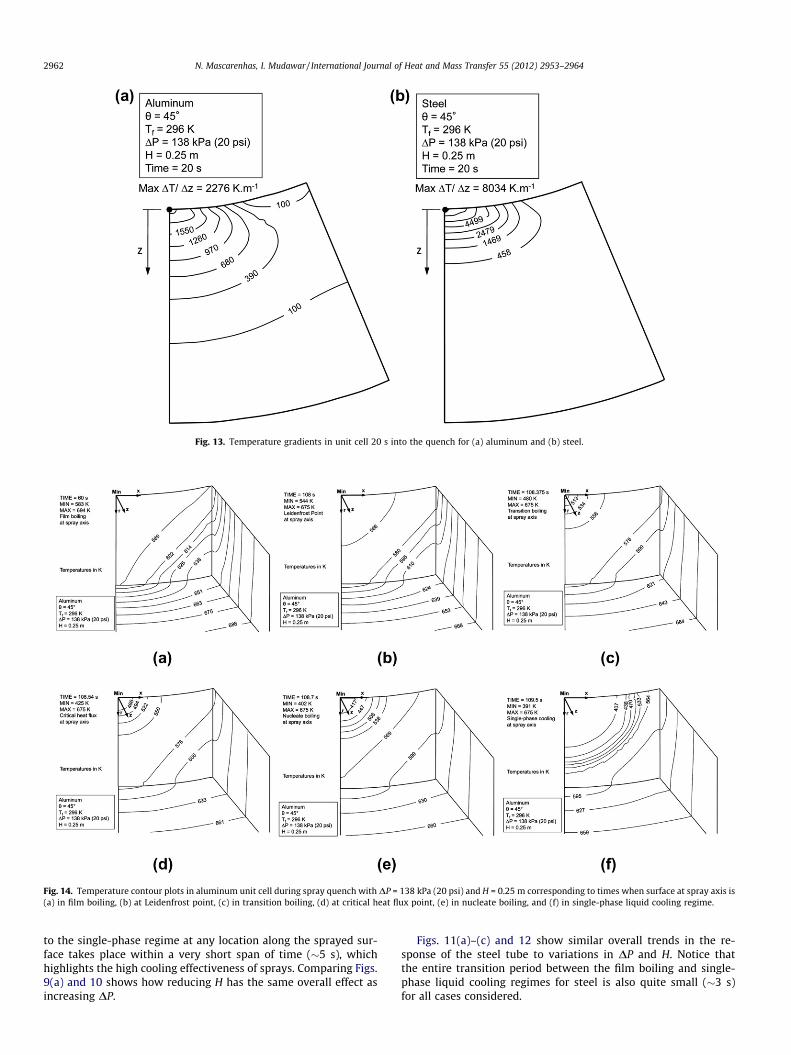
Fig. 13. Temperature gradients in unit cell 20 s into the quench for (a) aluminum and (b) steel.
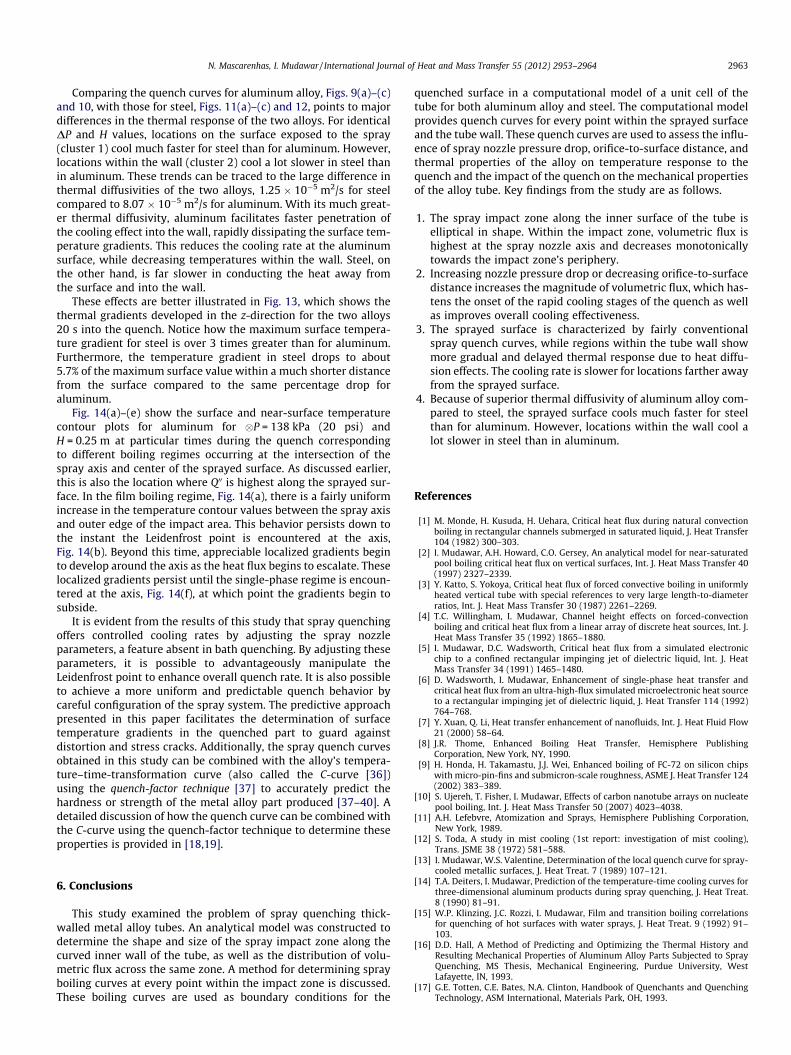
Fig. 14. Temperature contour plots in aluminum unit cell during spray quench with DP = 138 kPa (20 psi) and H = 0.25 m corresponding to times when surface at spray axis is(a) in film boiling, (b) at Leidenfrost point, (c) in transition boiling, (d) at critical heat flux point, (e) in nucleate boiling, and (f) in single-phase liquid cooling regime.
2962 N. Mascarenhas, I. Mudawar / International Journal of Heat and Mass Transfer 55 (2012) 2953–2964
to the single-phase regime at any location along the sprayed sur-face takes place within a very short span of time (�5 s), whichhighlights the high cooling effectiveness of sprays. Comparing Figs.9(a) and 10 shows how reducing H has the same overall effect asincreasing DP.
Figs. 11(a)–(c) and 12 show similar overall trends in the re-sponse of the steel tube to variations in DP and H. Notice thatthe entire transition period between the film boiling and single-phase liquid cooling regimes for steel is also quite small (�3 s)for all cases considered.
N. Mascarenhas, I. Mudawar / International Journal of Heat and Mass Transfer 55 (2012) 2953–2964 2963
Comparing the quench curves for aluminum alloy, Figs. 9(a)–(c)and 10, with those for steel, Figs. 11(a)–(c) and 12, points to majordifferences in the thermal response of the two alloys. For identicalDP and H values, locations on the surface exposed to the spray(cluster 1) cool much faster for steel than for aluminum. However,locations within the wall (cluster 2) cool a lot slower in steel thanin aluminum. These trends can be traced to the large difference inthermal diffusivities of the two alloys, 1.25 � 10�5 m2/s for steelcompared to 8.07 � 10�5 m2/s for aluminum. With its much great-er thermal diffusivity, aluminum facilitates faster penetration ofthe cooling effect into the wall, rapidly dissipating the surface tem-perature gradients. This reduces the cooling rate at the aluminumsurface, while decreasing temperatures within the wall. Steel, onthe other hand, is far slower in conducting the heat away fromthe surface and into the wall.
These effects are better illustrated in Fig. 13, which shows thethermal gradients developed in the z-direction for the two alloys20 s into the quench. Notice how the maximum surface tempera-ture gradient for steel is over 3 times greater than for aluminum.Furthermore, the temperature gradient in steel drops to about5.7% of the maximum surface value within a much shorter distancefrom the surface compared to the same percentage drop foraluminum.
Fig. 14(a)–(e) show the surface and near-surface temperaturecontour plots for aluminum for �P = 138 kPa (20 psi) andH = 0.25 m at particular times during the quench correspondingto different boiling regimes occurring at the intersection of thespray axis and center of the sprayed surface. As discussed earlier,this is also the location where Q00 is highest along the sprayed sur-face. In the film boiling regime, Fig. 14(a), there is a fairly uniformincrease in the temperature contour values between the spray axisand outer edge of the impact area. This behavior persists down tothe instant the Leidenfrost point is encountered at the axis,Fig. 14(b). Beyond this time, appreciable localized gradients beginto develop around the axis as the heat flux begins to escalate. Theselocalized gradients persist until the single-phase regime is encoun-tered at the axis, Fig. 14(f), at which point the gradients begin tosubside.
It is evident from the results of this study that spray quenchingoffers controlled cooling rates by adjusting the spray nozzleparameters, a feature absent in bath quenching. By adjusting theseparameters, it is possible to advantageously manipulate theLeidenfrost point to enhance overall quench rate. It is also possibleto achieve a more uniform and predictable quench behavior bycareful configuration of the spray system. The predictive approachpresented in this paper facilitates the determination of surfacetemperature gradients in the quenched part to guard againstdistortion and stress cracks. Additionally, the spray quench curvesobtained in this study can be combined with the alloy’s tempera-ture–time-transformation curve (also called the C-curve [36])using the quench-factor technique [37] to accurately predict thehardness or strength of the metal alloy part produced [37–40]. Adetailed discussion of how the quench curve can be combined withthe C-curve using the quench-factor technique to determine theseproperties is provided in [18,19].
6. Conclusions
This study examined the problem of spray quenching thick-walled metal alloy tubes. An analytical model was constructed todetermine the shape and size of the spray impact zone along thecurved inner wall of the tube, as well as the distribution of volu-metric flux across the same zone. A method for determining sprayboiling curves at every point within the impact zone is discussed.These boiling curves are used as boundary conditions for the
quenched surface in a computational model of a unit cell of thetube for both aluminum alloy and steel. The computational modelprovides quench curves for every point within the sprayed surfaceand the tube wall. These quench curves are used to assess the influ-ence of spray nozzle pressure drop, orifice-to-surface distance, andthermal properties of the alloy on temperature response to thequench and the impact of the quench on the mechanical propertiesof the alloy tube. Key findings from the study are as follows.
1. The spray impact zone along the inner surface of the tube iselliptical in shape. Within the impact zone, volumetric flux ishighest at the spray nozzle axis and decreases monotonicallytowards the impact zone’s periphery.
2. Increasing nozzle pressure drop or decreasing orifice-to-surfacedistance increases the magnitude of volumetric flux, which has-tens the onset of the rapid cooling stages of the quench as wellas improves overall cooling effectiveness.
3. The sprayed surface is characterized by fairly conventionalspray quench curves, while regions within the tube wall showmore gradual and delayed thermal response due to heat diffu-sion effects. The cooling rate is slower for locations farther awayfrom the sprayed surface.
4. Because of superior thermal diffusivity of aluminum alloy com-pared to steel, the sprayed surface cools much faster for steelthan for aluminum. However, locations within the wall cool alot slower in steel than in aluminum.
References
[1] M. Monde, H. Kusuda, H. Uehara, Critical heat flux during natural convectionboiling in rectangular channels submerged in saturated liquid, J. Heat Transfer104 (1982) 300–303.
[2] I. Mudawar, A.H. Howard, C.O. Gersey, An analytical model for near-saturatedpool boiling critical heat flux on vertical surfaces, Int. J. Heat Mass Transfer 40(1997) 2327–2339.
[3] Y. Katto, S. Yokoya, Critical heat flux of forced convective boiling in uniformlyheated vertical tube with special references to very large length-to-diameterratios, Int. J. Heat Mass Transfer 30 (1987) 2261–2269.
[4] T.C. Willingham, I. Mudawar, Channel height effects on forced-convectionboiling and critical heat flux from a linear array of discrete heat sources, Int. J.Heat Mass Transfer 35 (1992) 1865–1880.
[5] I. Mudawar, D.C. Wadsworth, Critical heat flux from a simulated electronicchip to a confined rectangular impinging jet of dielectric liquid, Int. J. HeatMass Transfer 34 (1991) 1465–1480.
[6] D. Wadsworth, I. Mudawar, Enhancement of single-phase heat transfer andcritical heat flux from an ultra-high-flux simulated microelectronic heat sourceto a rectangular impinging jet of dielectric liquid, J. Heat Transfer 114 (1992)764–768.
[7] Y. Xuan, Q. Li, Heat transfer enhancement of nanofluids, Int. J. Heat Fluid Flow21 (2000) 58–64.
[8] J.R. Thome, Enhanced Boiling Heat Transfer, Hemisphere PublishingCorporation, New York, NY, 1990.
[9] H. Honda, H. Takamastu, J.J. Wei, Enhanced boiling of FC-72 on silicon chipswith micro-pin-fins and submicron-scale roughness, ASME J. Heat Transfer 124(2002) 383–389.
[10] S. Ujereh, T. Fisher, I. Mudawar, Effects of carbon nanotube arrays on nucleatepool boiling, Int. J. Heat Mass Transfer 50 (2007) 4023–4038.
[11] A.H. Lefebvre, Atomization and Sprays, Hemisphere Publishing Corporation,New York, 1989.
[12] S. Toda, A study in mist cooling (1st report: investigation of mist cooling),Trans. JSME 38 (1972) 581–588.
[13] I. Mudawar, W.S. Valentine, Determination of the local quench curve for spray-cooled metallic surfaces, J. Heat Treat. 7 (1989) 107–121.
[14] T.A. Deiters, I. Mudawar, Prediction of the temperature-time cooling curves forthree-dimensional aluminum products during spray quenching, J. Heat Treat.8 (1990) 81–91.
[15] W.P. Klinzing, J.C. Rozzi, I. Mudawar, Film and transition boiling correlationsfor quenching of hot surfaces with water sprays, J. Heat Treat. 9 (1992) 91–103.
[16] D.D. Hall, A Method of Predicting and Optimizing the Thermal History andResulting Mechanical Properties of Aluminum Alloy Parts Subjected to SprayQuenching, MS Thesis, Mechanical Engineering, Purdue University, WestLafayette, IN, 1993.
[17] G.E. Totten, C.E. Bates, N.A. Clinton, Handbook of Quenchants and QuenchingTechnology, ASM International, Materials Park, OH, 1993.
2964 N. Mascarenhas, I. Mudawar / International Journal of Heat and Mass Transfer 55 (2012) 2953–2964
[18] D.D. Hall, I. Mudawar, Predicting the impact of quenching on mechanicalproperties of complex-shaped aluminum alloy parts, J. Heat Transfer 117(1995) 479–488.
[19] D.D. Hall, I. Mudawar, Experimental and numerical study of quenchingcomplex-shaped metallic alloys with multiple, overlapping sprays, Int. J.Heat Mass Transfer 38 (1995) 1201–1216.
[20] K.A. Estes, I. Mudawar, Correlation of Sauter mean diameter and critical heatflux for spray cooling of small surfaces, Int. J. Heat Mass Transfer 38 (1995)2985–2996.
[21] I. Mudawar, K.A. Estes, Optimizing and predicting CHF in spray cooling of asquare surface, J. Heat Transfer 118 (1996) 672–680.
[22] D.D. Hall, I. Mudawar, R.E. Morgan, S.L. Ehlers, Validation of a systematicapproach to modeling spray quenching of aluminum alloy extrusions,composites and continuous castings, J. Mater. Eng. Perform. 6 (1997) 77–92.
[23] R.-H. Chen, L.C. Chow, J.E. Navedo, Effects of spray characteristics on criticalheat flux in subcooled water spray cooling, Int. J. Heat Mass Transfer 45 (2002)4033–4043.
[24] J.R. Rybicki, I. Mudawar, Single-phase and two-phase cooling characteristics ofupward-facing and downward-facing sprays, Int. J. Heat Mass Transfer 49(2006) 5–16.
[25] J.W. Hodgson, R.T. Saterbak, J.E. Sunderland, An experimental investigation ofheat transfer from a spray cooled isothermal cylinder, J. Heat Transfer 90(1968) 457–463.
[26] F.P. Buckingham, A. Haji-Sheikh, Cooling of high-temperature cylindricalsurfaces using a water-air spray, J. Heat Transfer 117 (1995) 1018–1027.
[27] L.D. Albright, Cooling short cylinders in air using a water spray, Trans. Am. Inst.Agri. Eng. 19 (1976) 762–765.
[28] T.-B. Chang, Effects of nozzle configuration on a shell-and-tube sprayevaporator with liquid catcher, Appl. Therm. Eng. 26 (2006) 814–823.
[29] S.A. Moeykens, W.W. Huebsch, M.B. Pate, Heat transfer of R-134a in single-tube spray evaporation including lubrication effects and enhanced surfaceresults, Trans. ASHRAE 101 (1995) 111–123.
[30] S.A. Moeykens, M.B. Pate, The effects of nozzle height and orifice size on sprayevaporation heat transfer performance for a low-finned, triangular-pitch tubebundle with R-134a, Trans. ASHRAE 101 (1995) 420–433.
[31] S.A. Moeykens, J.E. Kelly, M.B. Pate, Spray evaporation heat transferperformance of R-123 in tube bundles, Trans. ASHRAE 102 (1996) 259–272.
[32] I.T. Elperin, Heat transfer of two-phase flow with a bundle of tubes, Inzh.-Fiz.Zh. 4 (1961) 30–35.
[33] E.W. Takahara, Experimental Study of Heat Transfer from a Heated CircularCylinder in Two-Phase, Water-air Flow, MS Thesis, Air Force Institute ofTechnology, Wright-Patterson AFB, OH, 1966.
[34] N. Mascarenhas, I. Mudawar, Analytical and computational methodology formodeling spray quenching of solid metal alloy cylinders, Int. J. Heat MassTransfer 53 (2010) 5871–5883.
[35] H.E. Boyer, T.L. Gall (Eds.), Metals Handbook, American Society for Metals,Materials Park, OH, 1985.
[36] W.L. Fink, L.A. Willey, Quenching of 75S aluminum alloy, Trans. Am. Inst.Mining Metallurg. Eng. 175 (1948) 414–427.
[37] J.W. Evancho, J.T. Staley, Kinetics of precipitation in aluminum alloys duringcontinuous cooling, Metallurg. Trans. 5 (1974) 43–47.
[38] J.T. Staley, Quench factor analysis of aluminum alloys, Mater. Sci. Technol. 3(1987) 923–935.
[39] J.W. Cahn, Transformation kinetics during continuous cooling, Acta Metallurg.4 (1956) 572–575.
[40] C.E. Bates, Predicting properties and minimizing residual stress in quenchedsteel parts, J. Heat Treat. 6 (1988) 27–45.