Embed Size (px)
Citation preview

International Journal of Fatigue 37 (2012) 134–145
Contents lists available at SciVerse ScienceDirect
International Journal of Fatigue
journal homepage: www.elsevier .com/locate / i j fa t igue
High resolution analysis of opening and sliding in fatigue crack growth
Michael D. Sangid a, Garrett J. Pataky b, Huseyin Sehitoglu b,⇑, Reginald F. Hamilton c, Hans J. Maier d
a School of Aeronautics and Astronautics, Purdue University, 701 W. Stadium Ave., West Lafayette, IN 47907-2045, USAb Department of Mechanical Science and Engineering, University of Illinois at Urbana-Champaign, 1206 W. Green St., Urbana, IL 61801, USAc Department of Engineering Science and Mechanics, Pennsylvania State University, 212 Earth-Engineering Sciences Bldg., University Park, PA 16802-6812, USAd Lehrstuhl für Werkstoffkunde (Materials Science), University of Paderborn, 33095 Paderborn, Germany
a r t i c l e i n f o
Article history:Received 14 August 2011Received in revised form 30 October 2011Accepted 3 November 2011Available online 11 November 2011
Keywords:Fatigue crack growthMixed modeCrack closureCrack openingStainless steel
0142-1123/$ - see front matter � 2011 Elsevier Ltd. Adoi:10.1016/j.ijfatigue.2011.11.001
⇑ Corresponding author.E-mail address: [email protected] (H. Sehitoglu
a b s t r a c t
The use of digital image correlation analysis during fatigue crack growth (FCG) of polycrystalline and[111] oriented single crystal specimens of 316L stainless steel allows for the investigation of mixed modecrack propagation in the vicinity of the crack tip. This technique offers significant benefit in addressingcrack closure at the microscale compared to the large body of work studying this phenomenon at themacroscale. Understanding of FCG behavior relies on the sliding (mode II) details which can be rathercomplicated. In this study, the mode I (opening) and mode II (sliding) mechanisms are differentiatedwithin the single crystal specimens for slanted cracks. Further, crack opening displacement profiles areobtained in mode I and mode II, which are used to quantify crack closure in each specimen. Finally,the irreversible strain within the plastic zone ahead of the crack tip is measured during crack propaga-tion. The results show that [111] oriented single crystal specimen fatigued at R = �1 display the most slipirreversibilities due to reverse dislocation motion leading to dislocation kinks/jogs. As a result, residualstress is diminished at the crack tip thereby resulting in earlier crack opening within the loading cycle.
� 2011 Elsevier Ltd. All rights reserved.
1. Introduction
Fatigue crack growth (FCG) remains a critical life-limiting fail-ure mechanism in engineering components. The complexities inunderstanding the propagation phenomena exist despite the largebody of work on the macroscopic characteristics of crack advance-ment. To simplify the problem at hand, fatigue crack propagationwas analyzed in single crystals to grasp the physics of crackadvancement. The mechanism of crack growth is dislocation emis-sion from the crack tip, which strongly depends on the orientationof the crystal [1]. In fact, crack propagation is locally affected by themicrostructure at the crack tip as crack propagation occurs throughsuccessive blunting (during the tensile loading portion) and sharp-ening (during the reversal of load) of the crack tip [2]. By modelingcrack propagation as a series of slip processes, Neumann accuratelypredicted the crack growth rate of straight cracks with well definedgeometry in single crystals [3]. He refined his model to account forelastic anisotropy thereby including inhomogeneity of slip on acti-vated slip bands [4]. In the above studies, pure metals were ana-lyzed, although experiments have been conducted on singlecrystals of engineering alloys, including stainless steel [5] and Ni-based superalloys [6]. The results showed that cracks grow on{111} slip planes at the microscale, which introduced mixed mode
ll rights reserved.
).
cracking [6]. In the present work, we analyze the mechanism ofcrack advancement in stainless steel single crystals includingmixed mode cracking. Historically, measuring mode II crackgrowth, i.e. sliding, has proven to be difficult [7]. By the use of highresolution digital image correlation (DIC) and single crystal speci-mens, however, we are now able to quantify the effects of mixedmode crack growth.
In 1961, Forsyth recognized that stage I cracks sustained open-ing and sliding displacements, thus introducing the need to studymode II crack growth [8]. Typically, in polycrystals, stage II cracksgrow at 90� with respect to the external load axis, thus represent-ing pure mode I, i.e. opening; whereas, stage I cracks grow at 45�due to deformation along slip bands, thus combining modes Iand II propagation [2] and requiring a combination of mixed modestress intensity factors for analysis and life prediction [9]. Startingin the late 1970s and 1980s, many experimental studies focused onmixed mode crack growth, which suggested that crack growth isgoverned by local tensile stresses and shear stresses at the cracktip, generally resulting in in-plane loading conditions [7,9–11].Many variables and parameters influence mixed mode crackgrowth, including load magnitudes, material strength, initial cracktip conditions, e.g. pre-cracking method, mean stress (or cyclicstress ratio), overloads, crack tip plasticity, and crack closure[12,13]. Of primary importance to the crack propagation rate isthe role of crack closure, which is analyzed in this study utilizinghigh resolution displacement measurement.
M.D. Sangid et al. / International Journal of Fatigue 37 (2012) 134–145 135
In 1963, Christensen reported roughness-induced crack closureduring FCG [14]. When the crack paths are tortuous, there is a sig-nificant sliding component at the crack tips that modifies crackadvancement. Elber, in 1970, discussed the impact of plasticity-induced crack closure as it influences the effective fatigue crackpropagation rate [15]. He noted that cracks remain shut during aportion of the tensile loading cycle, thus this portion of loadingdoes not promote crack advancement and should not be incorpo-rated into calculations of the stress intensity factor range, DK[16]. Crack closure is ultimately due to the reversal of strain atthe crack tip, which plays a critical role in the crack propagationmechanism. During crack closure, there is a reversal of dislocationmotion, which can remove the residual stress produced duringcrack opening while leaving the newly formed crack surface intact[4]. This effectively restarts the process to allow the crack to con-tinue propagating during the next loading cycle. Many parametersinfluence the phenomenon of plasticity-induced crack closure; inorder to explain these variables in a unified manner, finite elementbased analysis was used to explain the role of material constraint,applied stress, strain hardening, mean stress, crack size, and notcheffects on fatigue crack growth behavior [17,18]. By accounting forcrack closure, the FCG rates condense to a single curve in singlecrystal specimens with various loading orientations [6]. Thus, thereis a strong need to account for crack closure, although accuratelymeasuring crack closure is not a simple task.
Elber measured crack closure using displacement gages [15,16].This technique has progressed to include back-face strain gages,crack mouth gages, and clip gages [19]. Other methods includeelectrical potential drop [20] or replica techniques [21]. Non-contact methods emerged which allowed for in situ measurementswithout disturbing the test specimen including laser interferomet-ric displacement gages [22] and DIC techniques [23,24]. Stereo-imaging analysis allows for displacement and strain measurementsat the crack tip [25,26]. This study adopts the methodology of col-lecting data in real time over many cycles for full-field measure-ments of crack closure to accurately predict crack opening levels[27]. In this study, we use high resolution DIC to quantify crack clo-sure levels and also study the crack displacement and strain fieldsat the crack tip. These local crack tip measurements allow us to dis-tinguish opening (mode I) and sliding (mode II) crack growth andalso quantify the slip irreversibility process at the crack tip in poly-crystalline and single crystal specimens.
The physics of crack advancement are directly influenced by theinteraction of dislocations emitted from the crack tip with the localmicrostructure (in the vicinity of the crack tip), which can lead tocomplex dislocation arrangements. The result of this process is slipirreversibilities during fatigue loading. The slip introduced duringforward loading is not recovered fully during reverse loading dueto the following: activation of different slip systems, cutting of dis-locations, annihilation of edge dislocations producing vacancies,cross-slipping of screw dislocations, shearing of precipitates, thepresence of grain boundaries (in polycrystalline samples), etc.Hence, fatigue damage and crack propagation is governed by irre-versible plastic flow [28]. Mughrabi quantified the cyclic slip irre-versibility p, defined as the fraction of plastic shear strain that ismicrostructurally irreversible [29]. In this case, p varies from 0,
Table 1Summary of the fatigue crack growth test parameters, specimen dimensions, and imaging
Crystallography R-ratio
Stress range, Dr (MPa) Thickness (mm) Magnifi
[111] Single Crystal 0.05 178 1.03 4.6�Polycrystalline 0.0624 245 1.23 4.9�[111] Single crystal �1 300 1.75 6�
as is the case in low loading amplitudes, to 1, for high loadingamplitudes and near stress concentrators such as the crack tip.Applying this concept to FCG, Wu et al. presented a model basedon a restricted slip reversal process. Their dislocation based ap-proach related the FCG rate to the difference between the averageplastic strain ahead of the crack tip during loading and unloading[30]. Advanced models such as discrete dislocation dynamics [31]and cohesive zone element [32] have been used to describe FCG,each containing a representation of slip irreversibility thus aidingthe FCG process.
It has previously been established that single crystal specimenscan shed light onto the fatigue crack growth process without thepresence of complicated microstructural features, such as grainboundaries. In this study, we contrast FCG in single crystal andpolycrystalline specimens. In the [1 1 1] oriented single crystals,the cracks grow at an angle, thus making it necessary to decom-pose the crack growth process into mode I (opening) and mode II(sliding). The use of DIC allows us to analyze the crack tip openingprofiles, the effects of crack closure, and the role of slip irreversibil-ities ahead of the crack tip. Each of these phenomena elucidates thephysics of crack advancement through careful considerations ofthe dislocation mechanics and strain fields ahead of the crack tip.
2. Experimental details
2.1. Material and fatigue testing
In this study, polycrystalline and [111] oriented single crystalspecimens of 316L stainless steel were used for FCG testing. Themechanical behavior of these specimens can be found in [33]. Aportion of the material was grown into a single crystal from a seedusing the Bridgman technique in vacuum and its orientation wasverified using electron backscatter diffraction. Single edge-notchtension specimens were electrical discharge machined with anotch depth of 0.5 mm, a gage length of 9 mm long, a width of3 mm, and a thickness reported in Table 1. The notch length is in-cluded in all reported crack lengths in this study. The specimenswere mechanically polished to a mirror finish using abrasive paperup to 2400 grit size. A fine layer of black paint was airbrushed ontoeach specimen to create a speckle pattern for DIC. An IMI 202FTdigital camera was used to capture images during the fatigue crackgrowth experiments with the magnification, resolution, and mea-surement frequency as shown in Table 1 for each specimen.
The specimens were cyclically loaded in a servo-hydraulic loadframe at the R-ratios and stress ranges given in Table 1 at a rate be-tween 3 and 10 Hz to initiate a crack at the notch. Images of the fa-tigue crack growth through the [111] oriented single crystal andpolycrystalline specimens are shown in Fig. 1a–c. Once a crackwas visually identified, measurement cycles were run periodicallyto capture a greater number of images per cycle to provide an in-depth analysis into the fatigue process.
2.2. Digital image correlation procedure
The results obtained from digital image correlation are used asthe basis for each of the analytical techniques in this paper. Since
parameters.
cation Resolution (lm/pix) Measurement frequency (Hz) Images per cycle
0.95 1 150.90 1 150.78 0.08 188

Fig. 1. Snapshots recorded during the fatigue crack growth experiments of: (a) [111] oriented single crystal specimen at R = 0.05 and Dr = 178 MPa, (b) a polycrystallinespecimen at R = 0.0624 and Dr = 245 MPa, and (c) [111] oriented single crystal specimen at R = �1 and Dr = 300 MPa. Vertical displacement contours of each specimen areshown using digital image correlation, which are normalized by the maximum displacement measured in each specimen. The images in (d), (e), and (f) correspond to thespecimens and experimental parameters in (a), (b), and (c), respectively. In (d) the arrow points to the location of a carbide particle, which deflected the crack thus influencingthe crack closure at this location.
Fig. 2. (a) An example of the two-subset virtual extensometers on the [111] oriented specimen. Each line across the crack represents a different extensometer. The subsets oneach side of the crack, as pointed out by an arrow, will separate as the crack opens. (b) A schematic showing the displacements measured by the extensometers. (c) Coordinatesystem for measuring crack opening and sliding displacement.
136 M.D. Sangid et al. / International Journal of Fatigue 37 (2012) 134–145
DIC compares the light intensity on the surface of a deformed im-age to that of a reference image to determine the displacements, a
random array of intensity levels is necessary, typically createdusing a speckle pattern. The surface contains numerous pixels of
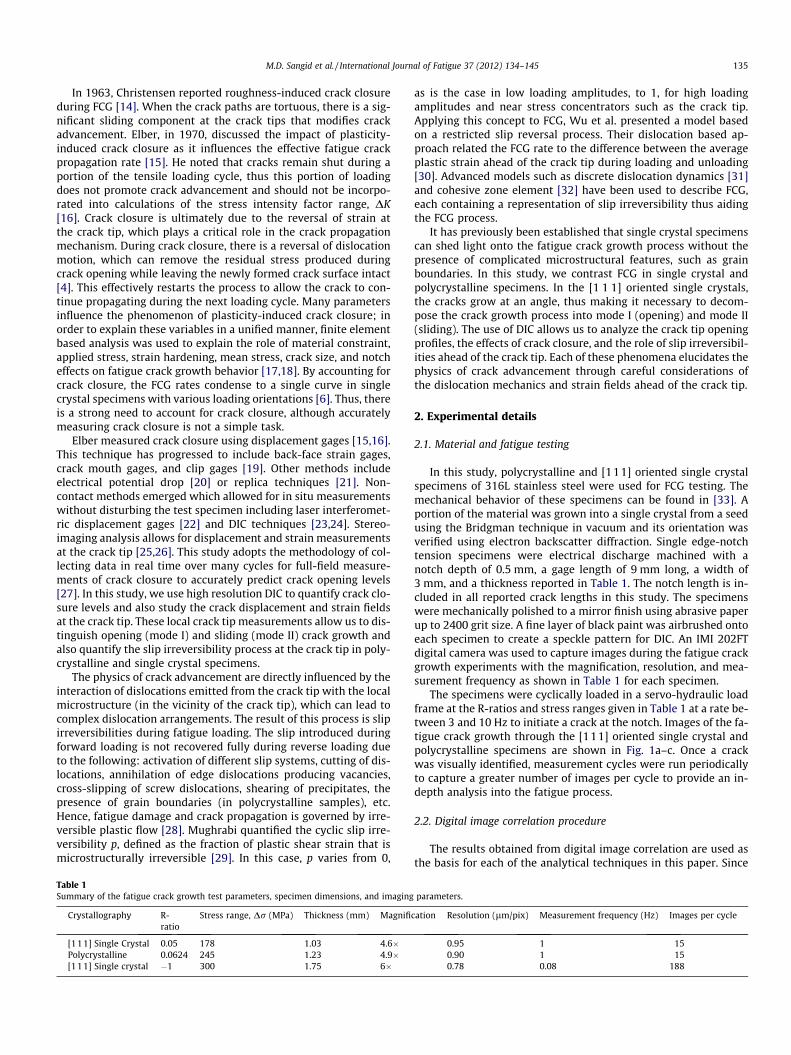
Fig. 3. Fatigue crack growth results for the polycrystalline and single crystal 316LSS specimens at room temperature in air with test conditions shown in Table 1. TheParis law fit is shown for the polycrystalline specimen and the coefficients for theParis law fits and threshold stress intensity factor for each specimen are summa-rized in Table 2.
Table 2Paris law constants and stress intensity factor threshold from fatigue crack growthtests of 316L SS.
Crystallography R-ratio DKthres (MPap
m) C m
[111] Single crystal 0.05 20 9.96 � 10�13 7.46Polycrystalline 0.0624 18 3.64 � 10�10 3.43[111] Single crystal �1 21 7.86 � 10�13 6.45
M.D. Sangid et al. / International Journal of Fatigue 37 (2012) 134–145 137
the varying light intensity and square groups of pixels, or subsets,define unique blocks of light intensities. DIC uses an initial guessand finds the displacements by tracking individual subsets anddetermining the best correlation between the two images. A com-mercially available image correlation program (Vic-2d produced byCorrelated Solutions) performed DIC during the measurement cy-cles. The first image of each measurement cycle, captured at min-imum load, was used as the reference image for that cycleincluding the full image field, both behind and ahead of the cracktip. The maximum subset size was 72 lm by 72 lm with a maxi-mum of 9 lm between the centers of the subsets. At each corre-lated point, the horizontal (Dx) and vertical (Dy) displacementswere calculated and differentiated to obtain the strains assuminga small strain approximation. Localized smoothing of the strainwas performed by the built-in filtering function in Vic-2D. Imagesof the vertical displacement, Dy, contours are shown for each spec-imen in Fig. 1d and f. Using DIC, so called two-point virtual extens-ometers can be defined, which track two subsets, one on each sideof the crack flanks, as shown in Fig. 2a and b. By using the first im-age in the cycle as the reference image, the load level at which thecrack begins to open is identified. Since the virtual extensometersrequire no physical setup, many of these can be placed along thecrack face, as displayed in Fig. 2a, thus allowing for distinctions be-tween the global and crack tip crack closure. The virtual extensom-eters must be placed perpendicular to the crack flanks, in order toget the pure vertical (DUI) and horizontal (DUII) displacements.Once completed, the advantage of using the virtual extensometersis the clear distinction between the two types of displacementswithout needing to rotate any of the processed data, as shown inFig. 2c. This makes it easy to analyze mixed mode fatigue crack
growth. The difference in the vertical crack tip displacements,DUI = DUI,upper � DUI,lower, describes the mode I crack opening,and the horizontal crack tip displacements, DUII = DUII,upper �DUII,lower, describes the mode II crack sliding. The gages are placedstarting at 20 lm in front of the crack tip and extended back be-hind the crack until the notch was reached, thus allowing for crackopening displacement profile measurements during loading.
2.3. Transmission electron microscopy procedure
For transmission electron microscopy (TEM) 1 mm thick discswere sectioned with a low-speed diamond saw parallel to the load-ing axis from the failed specimens, and then mechanically groundand polished down to 0.15 mm foil thickness. Large electron trans-parent areas were obtained in these foils by conventional twin jetpolishing using a solution consisting of 5 pct perchloric acid in eth-anol at �20 �C and 15 V. The TEM was operated at a nominal volt-age of 200 kV and a double-tilt specimen holder was employed forimaging under two-beam conditions.
3. Results
3.1. Fatigue crack growth
Fatigue crack growth tests were performed on a polycrystallinespecimen and two single crystal specimens oriented in the [1 1 1]crystallographic direction. The crack growth behavior as a functionof the total stress intensity range is given in Fig. 3. The stress inten-sity factor ranges displayed were determined using:
DK I ¼ Drffiffiffiffiffiffipap
� f ða=wÞ ð1Þ
DK II ¼ Dsffiffiffiffiffiffipap
� f ða=wÞ ð2Þ
where Dr and Ds are the normal and shear stress ranges on thecrack plane, respectively, a is the crack length, and f(a/w) is the geo-metric correction factor. The stress intensity factors were measuredin MPa
ffiffiffiffiffimp
. For a single-edge notch tension specimen, the geometriccorrection factor is given as [34]:
f ða=wÞ ¼ 0:265ð1� a=wÞ4 þ 0:857þ 0:265ð1� a=wÞð1� a=wÞ3=2 ð3Þ
where a is the crack length and w is the specimen width.The most general expression for combining the stress intensity
factor ranges to calculate DKtot is given as follows [9].
DKtot ¼ffiffiffiffiffiffiffiffiffiffiffiffiffiffiffiffiffiffiffiffiffiffiffiffiffiffiffiffiffiffiDK2
I þ a � DK2II
qð4Þ
Since the anisotropic case is complex, it requires the use of theenergy release rates, Ii, Eqs. (5) and (6) for mode I and mode II,respectively [35]. The ratio between these two energy release ratesis used to calculate a, i.e. ða ¼ I1=I2Þ
I1 ¼ �pK I
2a22Im
K Iðl1 þ l2Þ þ K II
l1l2
� �ð5Þ
I2 ¼pK II
2a11Im½K IIðl1 þ l2Þ þ K Il1l2� ð6Þ
where aij are the compliance coefficients and l1 and l2 are the rootsfound from the characteristic equation for which the imaginaryparts are positive.
a11l4 � 2a16l3 þ ð2a12 þ a66Þl2 � 2a26lþ a22 ¼ 0 ð7Þ
The energy release rate ratio, a, ranged from 2.25 to 3.8 for thecases included in this study. Once a was determined, the mixedmode stress intensity factor range, DKtot, was calculated and theresults are plotted in Fig. 3. The data were fit to the Paris law:
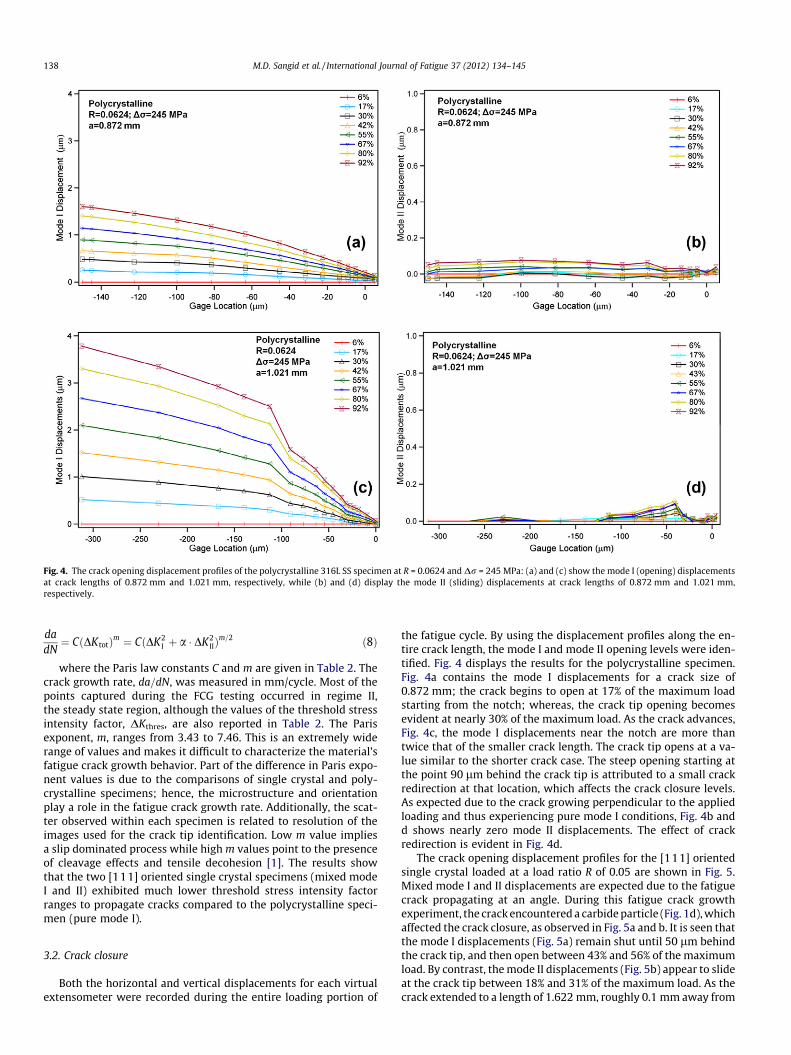
Fig. 4. The crack opening displacement profiles of the polycrystalline 316L SS specimen at R = 0.0624 and Dr = 245 MPa: (a) and (c) show the mode I (opening) displacementsat crack lengths of 0.872 mm and 1.021 mm, respectively, while (b) and (d) display the mode II (sliding) displacements at crack lengths of 0.872 mm and 1.021 mm,respectively.
138 M.D. Sangid et al. / International Journal of Fatigue 37 (2012) 134–145
dadN¼ CðDKtotÞm ¼ CðDK2
I þ a � DK2IIÞ
m=2 ð8Þ
where the Paris law constants C and m are given in Table 2. Thecrack growth rate, da=dN, was measured in mm/cycle. Most of thepoints captured during the FCG testing occurred in regime II,the steady state region, although the values of the threshold stressintensity factor, DKthres, are also reported in Table 2. The Parisexponent, m, ranges from 3.43 to 7.46. This is an extremely widerange of values and makes it difficult to characterize the material’sfatigue crack growth behavior. Part of the difference in Paris expo-nent values is due to the comparisons of single crystal and poly-crystalline specimens; hence, the microstructure and orientationplay a role in the fatigue crack growth rate. Additionally, the scat-ter observed within each specimen is related to resolution of theimages used for the crack tip identification. Low m value impliesa slip dominated process while high m values point to the presenceof cleavage effects and tensile decohesion [1]. The results showthat the two [111] oriented single crystal specimens (mixed modeI and II) exhibited much lower threshold stress intensity factorranges to propagate cracks compared to the polycrystalline speci-men (pure mode I).
3.2. Crack closure
Both the horizontal and vertical displacements for each virtualextensometer were recorded during the entire loading portion of
the fatigue cycle. By using the displacement profiles along the en-tire crack length, the mode I and mode II opening levels were iden-tified. Fig. 4 displays the results for the polycrystalline specimen.Fig. 4a contains the mode I displacements for a crack size of0.872 mm; the crack begins to open at 17% of the maximum loadstarting from the notch; whereas, the crack tip opening becomesevident at nearly 30% of the maximum load. As the crack advances,Fig. 4c, the mode I displacements near the notch are more thantwice that of the smaller crack length. The crack tip opens at a va-lue similar to the shorter crack case. The steep opening starting atthe point 90 lm behind the crack tip is attributed to a small crackredirection at that location, which affects the crack closure levels.As expected due to the crack growing perpendicular to the appliedloading and thus experiencing pure mode I conditions, Fig. 4b andd shows nearly zero mode II displacements. The effect of crackredirection is evident in Fig. 4d.
The crack opening displacement profiles for the [111] orientedsingle crystal loaded at a load ratio R of 0.05 are shown in Fig. 5.Mixed mode I and II displacements are expected due to the fatiguecrack propagating at an angle. During this fatigue crack growthexperiment, the crack encountered a carbide particle (Fig. 1d), whichaffected the crack closure, as observed in Fig. 5a and b. It is seen thatthe mode I displacements (Fig. 5a) remain shut until 50 lm behindthe crack tip, and then open between 43% and 56% of the maximumload. By contrast, the mode II displacements (Fig. 5b) appear to slideat the crack tip between 18% and 31% of the maximum load. As thecrack extended to a length of 1.622 mm, roughly 0.1 mm away from

Fig. 5. The crack opening displacement profiles of the [111] oriented single crystal 316L SS specimen at R = 0.05 and Dr = 178 MPa: (a), (c), and (e) show the mode I(opening) displacements at crack lengths of 1.517 mm, 1.622 mm, and 1.940 mm, respectively, while (b), (d), and (f) display the mode II (sliding) displacements at cracklengths of 1.517 mm, 1.622 mm, and 1.940 mm, respectively.
M.D. Sangid et al. / International Journal of Fatigue 37 (2012) 134–145 139
the previous crack opening displacement profiles, the effects of thecarbide disappear. As seen in Fig. 5c and d, the crack opens or is fullyslipped between 12% and 25%, which matches the results foundusing finite element models [18]. The largest crack length,1.940 mm, has the largest displacements in both mode I (Fig. 5e)and mode II (Fig. 5f). The displacements are positive at the cracktip at higher loads in Fig. 5f, which indicated that the crack flanks slidpast the initial crack tip location.
The other [111] oriented single crystal specimen loaded at a loadratio R of�1 is observed to have the greatest crack opening displace-ments, as shown in Fig. 6. Note that the scale is at least twice that ofthe previous figures. Examining the first crack length of 1.327 mm,the maximum crack flank opening displacements in Fig. 6a are ob-served to be approximately 4 lm, which is significantly more thanthe largest crack length of the [111] oriented specimen subjectedto a load ratio R of 0.05. Another interesting observation is that

Fig. 6. The crack opening displacement profiles of the [111] oriented single crystal 316L SS specimen at R = �1 and Dr = 300 MPa: (a) and (c) show the mode I (opening)displacements at crack lengths of 1.327 mm and 1.733 mm, respectively, while (b) and (d) display the mode II (sliding) displacements at crack lengths of 1.327 mm and1.733 mm, respectively. Note that the scale in (a) and (c) is twice that of Fig. 4.
140 M.D. Sangid et al. / International Journal of Fatigue 37 (2012) 134–145
Fig. 6b and d shows that the crack is fully slipped in mode II whilestill in compression. For the [111] specimens, at similar crack sizes,the R = �1 specimen has a crack opening displacement of approxi-mately 5� the value of the R = 0.05 specimen.
4. Discussion
4.1. Crack opening and sliding
Using the crack opening displacement profiles, the crack closurephenomena in both mode I and mode II were measured as dis-cussed in Section 3.2 and summarized in Fig. 7. These measure-ments allow us to differentiate and quantify the effects of crackopening (mode I) and sliding (mode II). Their displacements andmeasuring techniques are sketched in Fig. 7a. The results for thepolycrystalline sample loaded in mode I (Fig. 7b) and both of themode I results for the [111] oriented single crystals (Fig. 7c andd) indicate that the cracks were closed for approximately 20% ofthe tensile loading cycle except in the presence of the carbide par-ticle. The effects of the carbide are evident in Fig. 7c with the crackbeing shut in mode II for the majority of the loading cycle, nearly60%, after passing the carbide. The results for mode I show thatthe carbide had a much smaller effect in this case as there existsonly as small drop in crack opening level. In the polycrystallinespecimen (Fig. 7b), the crack is perpendicular to the applied loaded,and hence only a single opening mode is observed. In all of thecrack opening plots in Fig. 7, a trend exists such that a larger value
of crack opening displacement is observed with increasing cracklength. This is as expected as a larger crack creates less compliance,which facilitates crack opening; exceptions to this trend are pres-ent at the site of the carbide (Fig. 7c).
We note substantial differences in the opening character be-tween the two [111] oriented single crystal specimens. First, themode I opening level is significantly greater in the R = �1 speci-men. Additionally, the mode II opening levels in the R = �1 speci-men shows that the crack opened consistently during thecompressive portion of the loading cycle. The major difference inloading between the two [111] specimens is the compression por-tion of the fatigue cycle in one of the samples; it was concludedthat loading in compression causes the crack to open earlier inthe loading cycle and to a greater extent in tension, which is dueto the removal of the residual stress at the crack tip during re-versed plasticity in the R = �1 specimen [4]. This indicates thatcyclic loading with a compressive portion of the fatigue cycle ismore damaging than that of pure tension cycling.
4.2. Crack closure effects on fatigue crack growth
As a consequence of crack closure, the crack opens for only aportion of the loading cycle, and thus acts as a shielding mecha-nism for stress, which reduces the effective stress intensity factorrange at the crack tip to
DKeff ¼ Kmax � Kopen ð9Þ

Fig. 7. (a) Schematic depicting crack displacement during mode I (opening) and mode II (sliding) crack growth including the unloaded (baseline) and loaded view of the crack.The mode I and mode II crack opening and sliding levels as a function of crack length for (b) polycrystalline specimen, which experiences pure mode I opening due to thehorizontal growth of the crack, (c) [111] oriented single crystal specimen at R = 0.05, notice the crack deflection at the carbide particle resulted in an increase in crack sliding,and (d) [111] oriented single crystal specimen at R = �1.
Fig. 8. Fatigue crack growth results for the polycrystalline and single crystal 316LSS specimens at room temperature in air with testing conditions summarized inTable 1. The results shown are for the effective stress intensity factor range bytaking into account the effects of crack closure. The Paris law fit is shown for thecomplete set of test results (polycrystalline specimen and two [111] oriented singlecrystal specimens). The coefficients for the effective Paris fit and threshold stressintensity factor for each specimen are displayed in Table 3.
M.D. Sangid et al. / International Journal of Fatigue 37 (2012) 134–145 141
Therefore, the effective stress intensity factor range, DKeff, onlyaccounts for the portion of the stress intensity factor above thecrack opening level, Kopen, which is measured using the DIC virtualextensometers at the crack tip and along the crack.
Since cracks can only grow when they are open, we should ex-pect a lower effective stress intensity factor range, DKeff (Eq. (9)),compared to DKtot (Eq. (4)), which is modified thereby reducingthe crack growth rate [15,16] as follows:
dadN¼ C 0ðDKeffÞm
0¼ C 0ðDK2
I;eff þ a � DK2II;eff Þ
m0=2: ð10Þ
By modifying for crack closure, the effective fatigue crack growthresults are shown in Fig. 8 and the modified Paris law coefficients,C0 and m0, are given in Table 3. Notice that the data shift to the leftas the stress intensity factor range is reduced according to Eq. (9).
Table 3Effective Paris law constants and stress intensity factor threshold from fatigue crackgrowth tests by taking into account the role of crack closure in 316L SS.
Crystallography R-ratio DKthres (MPap
m) C0 m0
[111] Single crystal 0.05 8 6.37 � 10�09 3.89Polycrystalline 0.0624 6 1.05 � 10�08 3.32[111] Single crystal �1 10 3.29 � 10�09 3.65
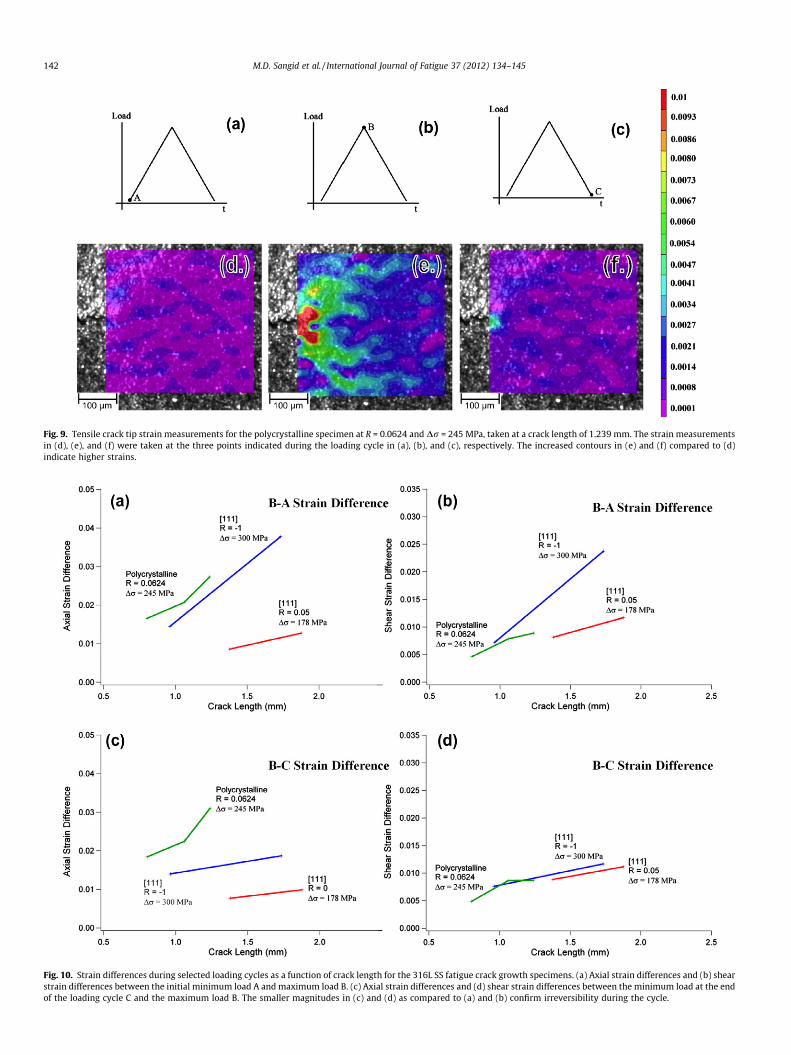
Fig. 9. Tensile crack tip strain measurements for the polycrystalline specimen at R = 0.0624 and Dr = 245 MPa, taken at a crack length of 1.239 mm. The strain measurementsin (d), (e), and (f) were taken at the three points indicated during the loading cycle in (a), (b), and (c), respectively. The increased contours in (e) and (f) compared to (d)indicate higher strains.
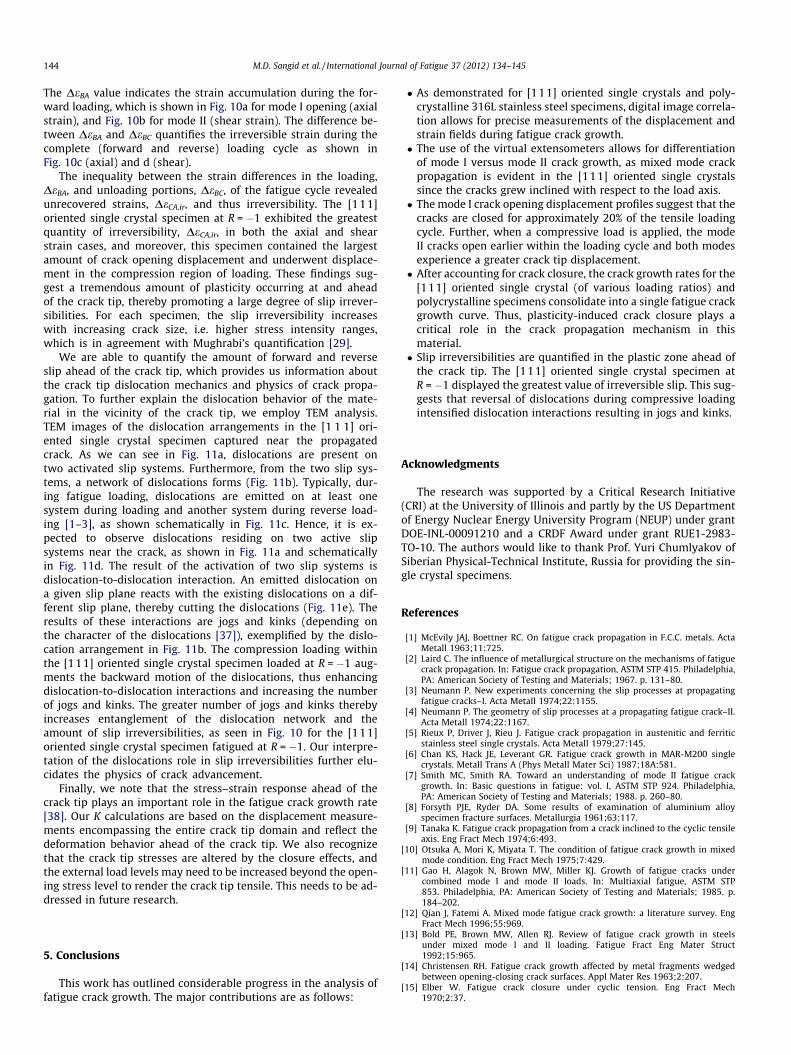
Fig. 10. Strain differences during selected loading cycles as a function of crack length for the 316L SS fatigue crack growth specimens. (a) Axial strain differences and (b) shearstrain differences between the initial minimum load A and maximum load B. (c) Axial strain differences and (d) shear strain differences between the minimum load at the endof the loading cycle C and the maximum load B. The smaller magnitudes in (c) and (d) as compared to (a) and (b) confirm irreversibility during the cycle.
142 M.D. Sangid et al. / International Journal of Fatigue 37 (2012) 134–145

M.D. Sangid et al. / International Journal of Fatigue 37 (2012) 134–145 143
The threshold values are thus smaller as shown in Table 3, and as aresult a smaller crack can start to grow at the same applied stressrange. Also, there is a marked decrease in the m0 value by account-ing for crack closure. As expected, the fatigue crack growth datashould consolidate to a single line after taking crack closure into ac-count [6], as shown in Fig. 8. Note that the effective crack growthexponents, m0, are nearly the same for all three specimens and havevalues in the range of 3.32–3.89. Hence, for the [111] oriented sin-gle crystal specimens, the crack closure phenomenon explains thediscrepancy in fatigue crack growth rates between the loading con-ditions, i.e. the loading ratio R. Additionally, by accounting for crackclosure, the two single crystal specimens and polycrystalline speci-men exhibit the same crack growth rate. Thus, we can measure andisolate the material’s resistance to crack growth in the absence ofcrack closure effects on fatigue crack growth. Moreover, with fur-ther analysis of the slip mechanism within the materials and theslip irreversibilities that accumulate during fatigue loading, wecan better understand the physics of crack propagation.
4.3. Slip mode and irreversibilities
As previously stated, the mechanism for FCG is a series of slipprocesses, where dislocations are emitted from the crack tip dur-
Fig. 11. TEM images of the [111] oriented single crystal specimen showing (a) dislocatiospecimen. (c) Schematic of dislocation emission from the crack tip on two slip systems dupresent dislocations resulting in (e) cutting of the dislocations and the formation of kin
ing loading and not fully reversed during unloading. The differ-ence in the average shear strain in the plastic zone ahead ofthe crack tip during forward and reverse loading is related tothe fatigue crack growth rate [30]. Thus, it is important to quan-tify this concept of slip irreversibility as it relates to the FCGmechanism. In order to gain a quantitative understanding of slipirreversibilities on the mesoscopic scale, we measured strainswithin the plastic zone ahead of the crack tip during the cyclicloading.
We use DIC to measure the strains within the vicinity of thecrack tip at various points in the loading cycle: the minimum loadat the beginning of the cycle (Fig. 9a), the maximum load (Fig. 9b),and the minimum load at the end of the cycle (Fig. 9c). The corre-sponding strain fields are shown in Fig. 9d–f. The strain is mea-sured and averaged within the cyclic plastic zone radius ahead ofthe crack tip at the minimum load prior to the loading cycle (pointA), at the maximum load (point B), and at the minimum load afterthe completion of the current loading cycle (point C) for each of thethree test specimens. The cyclic plastic zone is theoretically onequarter of the monotonic plastic zone size due to reversed loadingfor an R = 0 loading without closure effects [21,36]. The strainswere averaged inside this relatively small cyclic plastic zone, whichwas around the crack tip, to account for the slight strain gradient.
ns present on two slip systems and (b) a network of dislocations formed within thering fatigue loading. (d) The motion of a dislocation on one slip system interacts withks/jogs.
144 M.D. Sangid et al. / International Journal of Fatigue 37 (2012) 134–145
The DeBA value indicates the strain accumulation during the for-ward loading, which is shown in Fig. 10a for mode I opening (axialstrain), and Fig. 10b for mode II (shear strain). The difference be-tween DeBA and DeBC quantifies the irreversible strain during thecomplete (forward and reverse) loading cycle as shown inFig. 10c (axial) and d (shear).
The inequality between the strain differences in the loading,DeBA, and unloading portions, DeBC, of the fatigue cycle revealedunrecovered strains, DeCA,ir, and thus irreversibility. The [111]oriented single crystal specimen at R = �1 exhibited the greatestquantity of irreversibility, DeCA,ir, in both the axial and shearstrain cases, and moreover, this specimen contained the largestamount of crack opening displacement and underwent displace-ment in the compression region of loading. These findings sug-gest a tremendous amount of plasticity occurring at and aheadof the crack tip, thereby promoting a large degree of slip irrever-sibilities. For each specimen, the slip irreversibility increaseswith increasing crack size, i.e. higher stress intensity ranges,which is in agreement with Mughrabi’s quantification [29].
We are able to quantify the amount of forward and reverseslip ahead of the crack tip, which provides us information aboutthe crack tip dislocation mechanics and physics of crack propa-gation. To further explain the dislocation behavior of the mate-rial in the vicinity of the crack tip, we employ TEM analysis.TEM images of the dislocation arrangements in the [1 1 1] ori-ented single crystal specimen captured near the propagatedcrack. As we can see in Fig. 11a, dislocations are present ontwo activated slip systems. Furthermore, from the two slip sys-tems, a network of dislocations forms (Fig. 11b). Typically, dur-ing fatigue loading, dislocations are emitted on at least onesystem during loading and another system during reverse load-ing [1–3], as shown schematically in Fig. 11c. Hence, it is ex-pected to observe dislocations residing on two active slipsystems near the crack, as shown in Fig. 11a and schematicallyin Fig. 11d. The result of the activation of two slip systems isdislocation-to-dislocation interaction. An emitted dislocation ona given slip plane reacts with the existing dislocations on a dif-ferent slip plane, thereby cutting the dislocations (Fig. 11e). Theresults of these interactions are jogs and kinks (depending onthe character of the dislocations [37]), exemplified by the dislo-cation arrangement in Fig. 11b. The compression loading withinthe [111] oriented single crystal specimen loaded at R = �1 aug-ments the backward motion of the dislocations, thus enhancingdislocation-to-dislocation interactions and increasing the numberof jogs and kinks. The greater number of jogs and kinks therebyincreases entanglement of the dislocation network and theamount of slip irreversibilities, as seen in Fig. 10 for the [111]oriented single crystal specimen fatigued at R = �1. Our interpre-tation of the dislocations role in slip irreversibilities further elu-cidates the physics of crack advancement.
Finally, we note that the stress–strain response ahead of thecrack tip plays an important role in the fatigue crack growth rate[38]. Our K calculations are based on the displacement measure-ments encompassing the entire crack tip domain and reflect thedeformation behavior ahead of the crack tip. We also recognizethat the crack tip stresses are altered by the closure effects, andthe external load levels may need to be increased beyond the open-ing stress level to render the crack tip tensile. This needs to be ad-dressed in future research.
5. Conclusions
This work has outlined considerable progress in the analysis offatigue crack growth. The major contributions are as follows:
� As demonstrated for [111] oriented single crystals and poly-crystalline 316L stainless steel specimens, digital image correla-tion allows for precise measurements of the displacement andstrain fields during fatigue crack growth.� The use of the virtual extensometers allows for differentiation
of mode I versus mode II crack growth, as mixed mode crackpropagation is evident in the [111] oriented single crystalssince the cracks grew inclined with respect to the load axis.� The mode I crack opening displacement profiles suggest that the
cracks are closed for approximately 20% of the tensile loadingcycle. Further, when a compressive load is applied, the modeII cracks open earlier within the loading cycle and both modesexperience a greater crack tip displacement.� After accounting for crack closure, the crack growth rates for the
[111] oriented single crystal (of various loading ratios) andpolycrystalline specimens consolidate into a single fatigue crackgrowth curve. Thus, plasticity-induced crack closure plays acritical role in the crack propagation mechanism in thismaterial.� Slip irreversibilities are quantified in the plastic zone ahead of
the crack tip. The [111] oriented single crystal specimen atR = �1 displayed the greatest value of irreversible slip. This sug-gests that reversal of dislocations during compressive loadingintensified dislocation interactions resulting in jogs and kinks.
Acknowledgments
The research was supported by a Critical Research Initiative(CRI) at the University of Illinois and partly by the US Departmentof Energy Nuclear Energy University Program (NEUP) under grantDOE-INL-00091210 and a CRDF Award under grant RUE1-2983-TO-10. The authors would like to thank Prof. Yuri Chumlyakov ofSiberian Physical-Technical Institute, Russia for providing the sin-gle crystal specimens.
References
[1] McEvily JAJ, Boettner RC. On fatigue crack propagation in F.C.C. metals. ActaMetall 1963;11:725.
[2] Laird C. The influence of metallurgical structure on the mechanisms of fatiguecrack propagation. In: Fatigue crack propagation, ASTM STP 415. Philadelphia,PA: American Society of Testing and Materials; 1967. p. 131–80.
[3] Neumann P. New experiments concerning the slip processes at propagatingfatigue cracks–I. Acta Metall 1974;22:1155.
[4] Neumann P. The geometry of slip processes at a propagating fatigue crack–II.Acta Metall 1974;22:1167.
[5] Rieux P, Driver J, Rieu J. Fatigue crack propagation in austenitic and ferriticstainless steel single crystals. Acta Metall 1979;27:145.
[6] Chan KS, Hack JE, Leverant GR. Fatigue crack growth in MAR-M200 singlecrystals. Metall Trans A (Phys Metall Mater Sci) 1987;18A:581.
[7] Smith MC, Smith RA. Toward an understanding of mode II fatigue crackgrowth. In: Basic questions in fatigue: vol. I, ASTM STP 924. Philadelphia,PA: American Society of Testing and Materials; 1988. p. 260–80.
[8] Forsyth PJE, Ryder DA. Some results of examination of aluminium alloyspecimen fracture surfaces. Metallurgia 1961;63:117.
[9] Tanaka K. Fatigue crack propagation from a crack inclined to the cyclic tensileaxis. Eng Fract Mech 1974;6:493.
[10] Otsuka A, Mori K, Miyata T. The condition of fatigue crack growth in mixedmode condition. Eng Fract Mech 1975;7:429.
[11] Gao H, Alagok N, Brown MW, Miller KJ. Growth of fatigue cracks undercombined mode I and mode II loads. In: Multiaxial fatigue, ASTM STP853. Philadelphia, PA: American Society of Testing and Materials; 1985. p.184–202.
[12] Qian J, Fatemi A. Mixed mode fatigue crack growth: a literature survey. EngFract Mech 1996;55:969.
[13] Bold PE, Brown MW, Allen RJ. Review of fatigue crack growth in steelsunder mixed mode I and II loading. Fatigue Fract Eng Mater Struct1992;15:965.
[14] Christensen RH. Fatigue crack growth affected by metal fragments wedgedbetween opening-closing crack surfaces. Appl Mater Res 1963;2:207.
[15] Elber W. Fatigue crack closure under cyclic tension. Eng Fract Mech1970;2:37.
M.D. Sangid et al. / International Journal of Fatigue 37 (2012) 134–145 145
[16] Elber W. The significance of fatigue crack closure. ASTM Special TechnicalPublication; 1971. p. 230.
[17] McClung RC, Sehitoglu H. On the finite element analysis of fatigue crackclosure. 1. Basic modeling issues. Eng Fract Mech 1989;33:237.
[18] McClung RC, Sehitoglu H. On the finite element analysis of fatigue crackclosure. 2. Numerical results. Eng Fract Mech 1989;33:253.
[19] Allison JE, Ku RC, Pompetzki MA. A comparison of measurement methods andnumerical procedures for the experimental characterization of fatigue crackclosure. In: Mechanics of fatigue crack closure, ASTM STP 982. Philadelphia,PA: American Society of Testing and Materials; 1988. p. 171–85.
[20] Schijve J. Fatigue crack closure: observations and technical significance. In:Mechanics of fatigue crack closure, ASTM STP 982. Philadelphia, PA: AmericanSociety of Testing and Materials; 1988. p. 5–34.
[21] Sehitoglu H. Crack opening and closure in fatigue. Eng Fract Mech1985;21:329.
[22] Macha DE, Corbly DM, Jones JW. On the variation of fatigue-crack-openingload with measurement location. Exp Mech 1979;19:207.
[23] Riddell WT, Piascik RS, Sutton MA, Zhao W, McNeill SR, Helm JD. Determiningfatigue crack opening loads from near-crack-tip displacementmeasurements. San Diego, CA, USA: ASTM; 1999. p. 157.
[24] Sutton MA, Zhao W, McNeill SR, Helm JD, Piascik RS, Riddell WT. Local crackclosure measurements: development of a measurement system usingcomputer vision and a far-field microscope. San Diego, CA, USA: ASTM;1999. p. 145.
[25] Williams D, Davidson D, Lankford J. Fatigue-crack-tip plastic strains by thestereoimaging technique. Exp Mech 1980;20:134.
[26] McClung RC, Davidson DL. High resolution numerical and experimentalstudies of fatigue cracks. Eng Fract Mech 1991;39:113.
[27] Carroll J, Efstathiou C, Lambros J, Sehitoglu H, Hauber B, Spottswood S, et al.Investigation of fatigue crack closure using multiscale image correlationexperiments. Eng Fract Mech 2009;76:2384.
[28] Sadananda K, Glinka G. Dislocation processes that affect kinetics of fatiguecrack growth. Philos Mag 2005;85:189.
[29] Mughrabi H. Cyclic slip irreversibilities and the evolution of fatigue damage.Metall Mater Trans B: Process Metall Mater Process Sci 2009;40:431.
[30] Wu XJ, Koul AK, Krausz AS. A transgranular fatigue crack growth model basedon restricted slip reversibility. Metall Trans A (Phys Metall Mater Sci)1993;24A:1373.
[31] Deshpande VS, Needleman A, Van Der Giessen E. A discrete dislocationanalysis of near-threshold fatigue crack growth. Acta Mater 2001;49:3189.
[32] Brinckmann S, Siegmund T. Computations of fatigue crack growth with straingradient plasticity and an irreversible cohesive zone model. Eng Fract Mech2008;75:2276.
[33] Karaman I, Sehitoglu H, Maier HJ, Chumlyakov YI. Competing mechanisms andmodeling of deformation in austenitic stainless steel single crystals with andwithout nitrogen. Acta Mater 2001;49:3919.
[34] Tada H, Paris PC, Irwin GR. The stress analysis of cracks handbook. 2nd ed. St.Louis, MO; 1985.
[35] Sih GC, Paris PC, Irwin GR. On cracks in rectilinearly anisotropic bodies. Int JFract Mech 1965;1:189.
[36] Rice JR. Mechanics of crack tip deformation and extension by fatigue. ASTMSTP 1967;415:247.
[37] Hirth JP, Lothe J. Theory of dislocations. 2nd ed. New York: Wiley Interscience;1992.
[38] Sun W, Sehitoglu H. Residual stress fields during fatigue crack growth. FatigueFract Eng Mater Struct 1992;15:115–28.