Embed Size (px)
Citation preview
International Journal of Fatigue 31 (2009) 1921–1927
Contents lists available at ScienceDirect
International Journal of Fatigue
journal homepage: www.elsevier .com/locate / i j fa t igue
Fatigue crack growth analysis using 2-D weight function
A. Jankowiak a, H. Jakubczak a,*, G. Glinka b
a Warsaw University of Technology, Institute of Construction Machinery Engineering, Narbutta 85, 02-524 Warsaw, Polandb University of Waterloo, Department of Mechanical and Mechatronics Engineering, Waterloo, Ontario, Canada N2L 3G1
a r t i c l e i n f o
Article history:Received 17 September 2008Received in revised form 29 January 2009Accepted 18 February 2009Available online 1 March 2009
Keywords:Stress intensity factor2-D weight functionArbitrary crack shapeArbitrary stress distributionCrack growth
0142-1123/$ - see front matter � 2009 Elsevier Ltd. Adoi:10.1016/j.ijfatigue.2009.02.037
* Corresponding author. Tel.: +48 809 098 494.E-mail address: [email protected]
a b s t r a c t
A method for crack growth analysis of planar cracks under arbitrary Mode I loading is presented in thepaper. The method is based on the point-load (2-D) weight function used for the calculation of stressintensity factors. An algorithm for the analysis of fatigue crack growth of planar cracks, and validationresults supporting the entire methodology is also discussed. Application examples of the proposedmethod for crack growth analysis under arbitrary Mode I stress fields are presented as well.
� 2009 Elsevier Ltd. All rights reserved.
1. Introduction require experience and are time consuming in the case of the fati-
Mechanical and structural components contain often crack-likedefects or cracks initiated at notches under service cyclic loading.Cracks can initiate sub-surface (embedded elliptical-like cracks)or at the surface and have most often a semi-elliptical shape (sur-face cracks). The surface cracks are very common for welded jointsof structural components.
In order to determine the time spent on the stable fatiguegrowth of such cracks the crack growth analysis needs to be carriedout. Crack growth analyses in engineering practice are very oftencarried out for Mode I crack loading, i.e. for normal stress appliedto the crack surface. One of the most important issues in the crackgrowth analysis is the calculation of the stress intensity factor(SIF). The problem is quite simple if the stress applied to the cracksurface is uniform or symmetrical with respect to the crack axis[7,8]. However, the problem gets complicated in the case of 2-Dnon-uniform stress distribution. Moreover, in the case of geomet-rically complex crack shapes and machine or structural compo-nents certain simplifications are necessary resulting in theapproximation of actual cracks by standard elliptical or semi-ellip-tical shapes. This may result in inaccurate (and usually conserva-tive) residual life predictions.
The determination of SIFs and the two-dimensional analysis offatigue growth of planar cracks under non-uniform stress distribu-tion is possible only by using the finite element (FEM) or boundaryelement (BEM) method. Despite some advantages both methods
ll rights reserved.
.pl (H. Jakubczak).
gue crack growth analysis.The point-load weight function developed by Glinka and Rein-
hardt [1,9] enables calculation of stress intensity factors for planarconvex cracks under any Mode I stress distribution. Application ofthe method, discussed below, to fatigue crack growth analysis maysignificantly reduce the calculation time. The method makes possi-ble to calculate stress intensity factors at arbitrarily selected num-ber of points on the actual crack contour. Crack extensions are thencalculated for each of these points and the new crack shape isdetermined. The process is repeated on cycle-by-cycle basis untilthe final crack dimension is achieved. The number of repetitionsdetermines the fatigue crack propagation life in cycles.
2. Point-load weight function (WF2D)
The two-dimensional point-load weight function mA(x,y) repre-sents the stress intensity factor at an arbitrary point A on the crackfront, induced by a pair of unit forces, F = 1, applied to the cracksurface at point P(x,y), presented in Fig. 1. In order to determinethe SIF at the point A on the crack front induced by a two-dimen-sional stress field r(x ,y) the product of the stress field r(x,y) andthe weight function mA(x ,y) needs to be integrated over the entirecrack surface area X [7]:
KA ¼Z
X
Zrðx; yÞ �mAðx; yÞdxdy ð1Þ
The point-load weight function mA(x,y) was derived from theapproximate equation proposed by Oore and Burns [6] – see nota-tion in Fig. 1.
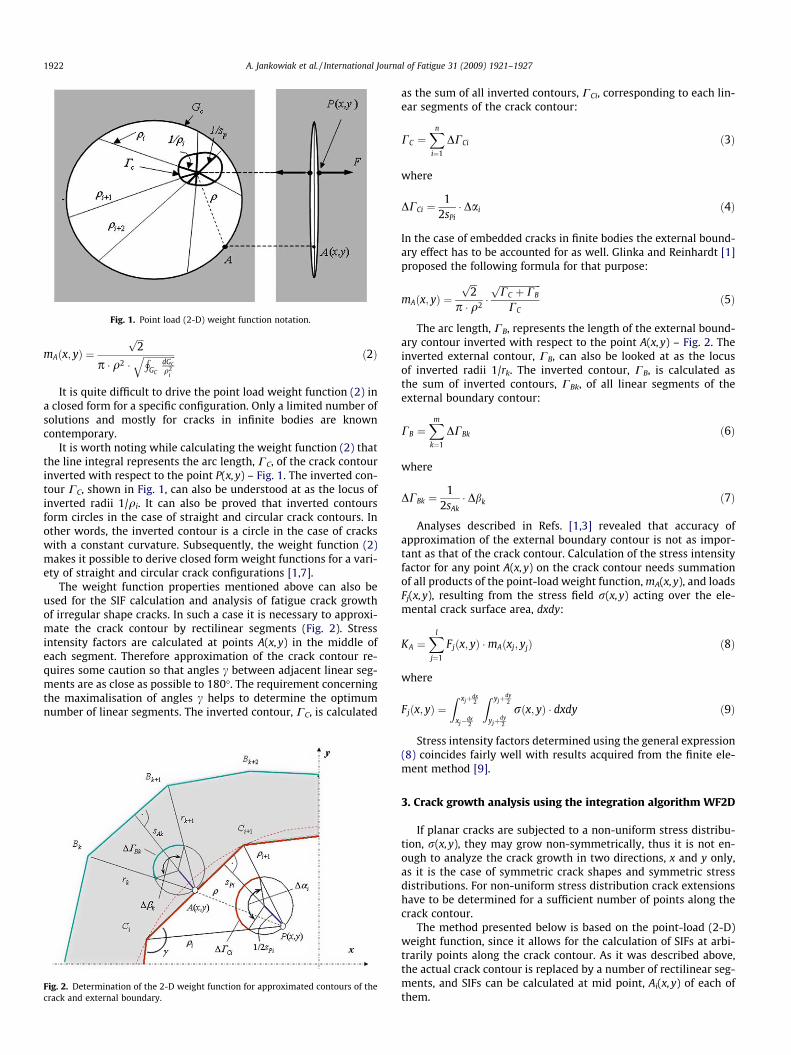
Fig. 1. Point load (2-D) weight function notation.
1922 A. Jankowiak et al. / International Journal of Fatigue 31 (2009) 1921–1927
mAðx; yÞ ¼ffiffiffi2p
p � q2 �ffiffiffiffiffiffiffiffiffiffiffiffiffiffiH
GC
dGcq2
i
q ð2Þ
It is quite difficult to drive the point load weight function (2) ina closed form for a specific configuration. Only a limited number ofsolutions and mostly for cracks in infinite bodies are knowncontemporary.
It is worth noting while calculating the weight function (2) thatthe line integral represents the arc length, CC, of the crack contourinverted with respect to the point P(x,y) – Fig. 1. The inverted con-tour CC, shown in Fig. 1, can also be understood at as the locus ofinverted radii 1/qi. It can also be proved that inverted contoursform circles in the case of straight and circular crack contours. Inother words, the inverted contour is a circle in the case of crackswith a constant curvature. Subsequently, the weight function (2)makes it possible to derive closed form weight functions for a vari-ety of straight and circular crack configurations [1,7].
The weight function properties mentioned above can also beused for the SIF calculation and analysis of fatigue crack growthof irregular shape cracks. In such a case it is necessary to approxi-mate the crack contour by rectilinear segments (Fig. 2). Stressintensity factors are calculated at points A(x,y) in the middle ofeach segment. Therefore approximation of the crack contour re-quires some caution so that angles c between adjacent linear seg-ments are as close as possible to 180�. The requirement concerningthe maximalisation of angles c helps to determine the optimumnumber of linear segments. The inverted contour, CC, is calculated
Fig. 2. Determination of the 2-D weight function for approximated contours of thecrack and external boundary.
as the sum of all inverted contours, CCi, corresponding to each lin-ear segments of the crack contour:
CC ¼Xn
i¼1
DCCi ð3Þ
where
DCCi ¼1
2sPi� Dai ð4Þ
In the case of embedded cracks in finite bodies the external bound-ary effect has to be accounted for as well. Glinka and Reinhardt [1]proposed the following formula for that purpose:
mAðx; yÞ ¼ffiffiffi2p
p � q2 �ffiffiffiffiffiffiffiffiffiffiffiffiffiffiffiffiffiffiCC þ CBp
CCð5Þ
The arc length, CB, represents the length of the external bound-ary contour inverted with respect to the point A(x,y) – Fig. 2. Theinverted external contour, CB, can also be looked at as the locusof inverted radii 1/rk. The inverted contour, CB, is calculated asthe sum of inverted contours, CBk, of all linear segments of theexternal boundary contour:
CB ¼Xm
k¼1
DCBk ð6Þ
where
DCBk ¼1
2sAk� Dbk ð7Þ
Analyses described in Refs. [1,3] revealed that accuracy ofapproximation of the external boundary contour is not as impor-tant as that of the crack contour. Calculation of the stress intensityfactor for any point A(x,y) on the crack contour needs summationof all products of the point-load weight function, mA(x,y), and loadsFj(x,y), resulting from the stress field r(x,y) acting over the ele-mental crack surface area, dxdy:
KA ¼Xl
j¼1
Fjðx; yÞ �mAðxj; yjÞ ð8Þ
where
Fjðx; yÞ ¼Z xjþdx
2
xj�dx2
Z yjþdy2
yjþdy2
rðx; yÞ � dxdy ð9Þ
Stress intensity factors determined using the general expression(8) coincides fairly well with results acquired from the finite ele-ment method [9].
3. Crack growth analysis using the integration algorithm WF2D
If planar cracks are subjected to a non-uniform stress distribu-tion, r(x,y), they may grow non-symmetrically, thus it is not en-ough to analyze the crack growth in two directions, x and y only,as it is the case of symmetric crack shapes and symmetric stressdistributions. For non-uniform stress distribution crack extensionshave to be determined for a sufficient number of points along thecrack contour.
The method presented below is based on the point-load (2-D)weight function, since it allows for the calculation of SIFs at arbi-trarily points along the crack contour. As it was described above,the actual crack contour is replaced by a number of rectilinear seg-ments, and SIFs can be calculated at mid point, Ai(x,y) of each ofthem.
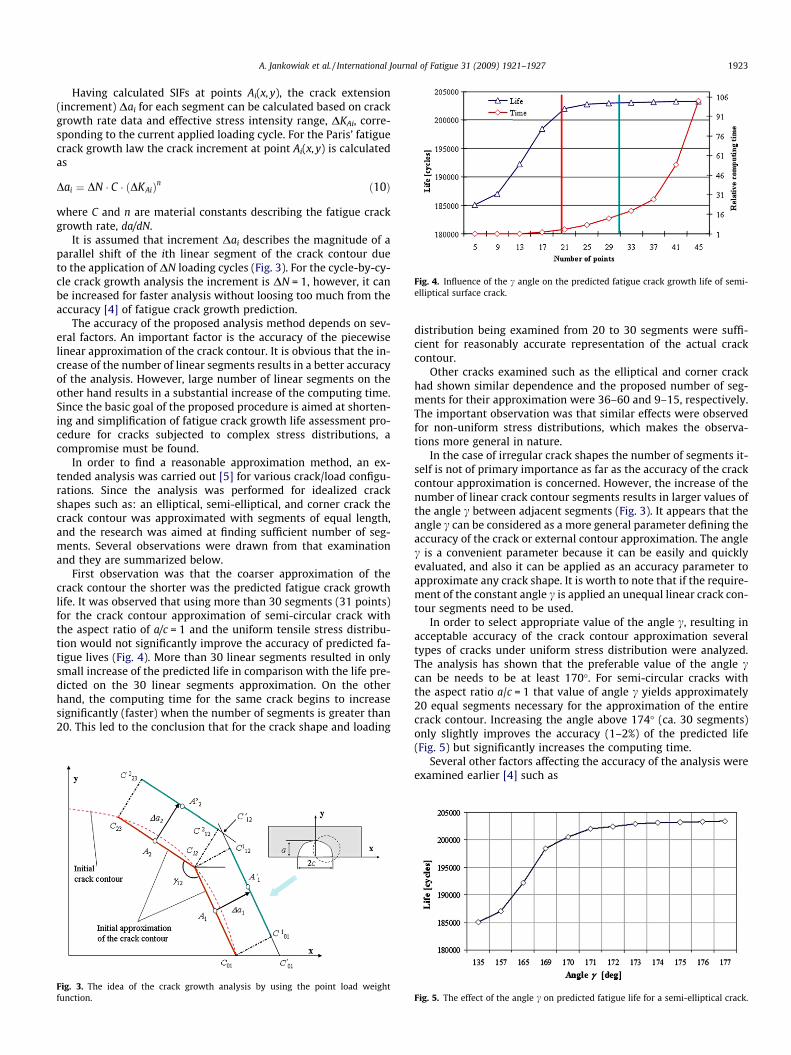
Fig. 4. Influence of the c angle on the predicted fatigue crack growth life of semi-elliptical surface crack.
A. Jankowiak et al. / International Journal of Fatigue 31 (2009) 1921–1927 1923
Having calculated SIFs at points Ai(x,y), the crack extension(increment) Dai for each segment can be calculated based on crackgrowth rate data and effective stress intensity range, DKAi, corre-sponding to the current applied loading cycle. For the Paris’ fatiguecrack growth law the crack increment at point Ai(x,y) is calculatedas
Dai ¼ DN � C � ðDKAiÞn ð10Þ
where C and n are material constants describing the fatigue crackgrowth rate, da/dN.
It is assumed that increment Dai describes the magnitude of aparallel shift of the ith linear segment of the crack contour dueto the application of DN loading cycles (Fig. 3). For the cycle-by-cy-cle crack growth analysis the increment is DN = 1, however, it canbe increased for faster analysis without loosing too much from theaccuracy [4] of fatigue crack growth prediction.
The accuracy of the proposed analysis method depends on sev-eral factors. An important factor is the accuracy of the piecewiselinear approximation of the crack contour. It is obvious that the in-crease of the number of linear segments results in a better accuracyof the analysis. However, large number of linear segments on theother hand results in a substantial increase of the computing time.Since the basic goal of the proposed procedure is aimed at shorten-ing and simplification of fatigue crack growth life assessment pro-cedure for cracks subjected to complex stress distributions, acompromise must be found.
In order to find a reasonable approximation method, an ex-tended analysis was carried out [5] for various crack/load configu-rations. Since the analysis was performed for idealized crackshapes such as: an elliptical, semi-elliptical, and corner crack thecrack contour was approximated with segments of equal length,and the research was aimed at finding sufficient number of seg-ments. Several observations were drawn from that examinationand they are summarized below.
First observation was that the coarser approximation of thecrack contour the shorter was the predicted fatigue crack growthlife. It was observed that using more than 30 segments (31 points)for the crack contour approximation of semi-circular crack withthe aspect ratio of a/c = 1 and the uniform tensile stress distribu-tion would not significantly improve the accuracy of predicted fa-tigue lives (Fig. 4). More than 30 linear segments resulted in onlysmall increase of the predicted life in comparison with the life pre-dicted on the 30 linear segments approximation. On the otherhand, the computing time for the same crack begins to increasesignificantly (faster) when the number of segments is greater than20. This led to the conclusion that for the crack shape and loading
Fig. 3. The idea of the crack growth analysis by using the point load weightfunction.
distribution being examined from 20 to 30 segments were suffi-cient for reasonably accurate representation of the actual crackcontour.
Other cracks examined such as the elliptical and corner crackhad shown similar dependence and the proposed number of seg-ments for their approximation were 36–60 and 9–15, respectively.The important observation was that similar effects were observedfor non-uniform stress distributions, which makes the observa-tions more general in nature.
In the case of irregular crack shapes the number of segments it-self is not of primary importance as far as the accuracy of the crackcontour approximation is concerned. However, the increase of thenumber of linear crack contour segments results in larger values ofthe angle c between adjacent segments (Fig. 3). It appears that theangle c can be considered as a more general parameter defining theaccuracy of the crack or external contour approximation. The anglec is a convenient parameter because it can be easily and quicklyevaluated, and also it can be applied as an accuracy parameter toapproximate any crack shape. It is worth to note that if the require-ment of the constant angle c is applied an unequal linear crack con-tour segments need to be used.
In order to select appropriate value of the angle c, resulting inacceptable accuracy of the crack contour approximation severaltypes of cracks under uniform stress distribution were analyzed.The analysis has shown that the preferable value of the angle ccan be needs to be at least 170�. For semi-circular cracks withthe aspect ratio a/c = 1 that value of angle c yields approximately20 equal segments necessary for the approximation of the entirecrack contour. Increasing the angle above 174� (ca. 30 segments)only slightly improves the accuracy (1–2%) of the predicted life(Fig. 5) but significantly increases the computing time.
Several other factors affecting the accuracy of the analysis wereexamined earlier [4] such as
Fig. 5. The effect of the angle c on predicted fatigue life for a semi-elliptical crack.
1924 A. Jankowiak et al. / International Journal of Fatigue 31 (2009) 1921–1927
1. The effect of the increase of the number of linear segments dur-ing the crack growth simulation by applying new approxima-tions (increased number of linear segments),
2. Partitioning of long linear segments which evolved due touneven crack extension and fitting them to the theoretical crackcontour.
The analyses performed for various crack shapes and stress dis-tributions revealed that the predicted life was only few percentlonger than that one obtained for constant number of segments,whereas the calculation time increased significantly.
The algorithm for crack growth analysis using the 2-D weightfunction is as follows:
1. Determine the location of the crack or crack-like defect in acomponent, and define the plane of the prospective crackgrowth (Fig. 6). The plane can be assumed as perpendicular tothe principal stress component S1.
2. Replace the actual crack contour by a number of linearsegments.
3. Calculate the SIFs at mid point Ai(x,y) of each linear segment.4. Calculate the crack extension (increment) Dai for each segment
based on crack growth rate data and the effective stress inten-sity range, DKAi, induced by current loading cycle.
5. Apply parallel translation of each linear segment by the calcu-lated crack increment Dai.
6. Construct the new crack contour and locate positions of pointsAi(x,y) for each segment. It should be noted that after severalsubsequent crack increments the linear crack contour segmentsadjacent to the external boundary elements may vanish.
7. Repeat steps 3 through 6 until the crack growth analysis limit-ing condition is reached. The crack growth can be consideredcomplete after reaching pre-defined final crack dimension orby exceeding the fracture toughness of the material or afterelapsing required number off loading cycles. The number ofcycles, N, accumulated to reach one of the limiting conditionsdetermines the fatigue crack propagation life of the analyzedcomponent.
4. Validation of the crack growth procedure
An extensive validation of the proposed procedure concerningfatigue crack growth analysis of two-dimensional cracks was car-ried out. The results were compared with those obtained fromthe FALPR fatigue analysis program described in Ref. [2]. The FALPRprogram uses 1-D weight function method for calculating stressintensity factors, which in the case of planar cracks is limited to
Fig. 6. Defining the prospective crack growth plane and the Mode I stressdistribution.
only one-dimensional stress distributions. Therefore the compari-sons were performed for selected planar cracks (semi-ellipticaland corner cracks) under stress distributions defined by 1-D math-ematical formula. The results obtained for semi-elliptical cracksare described below.
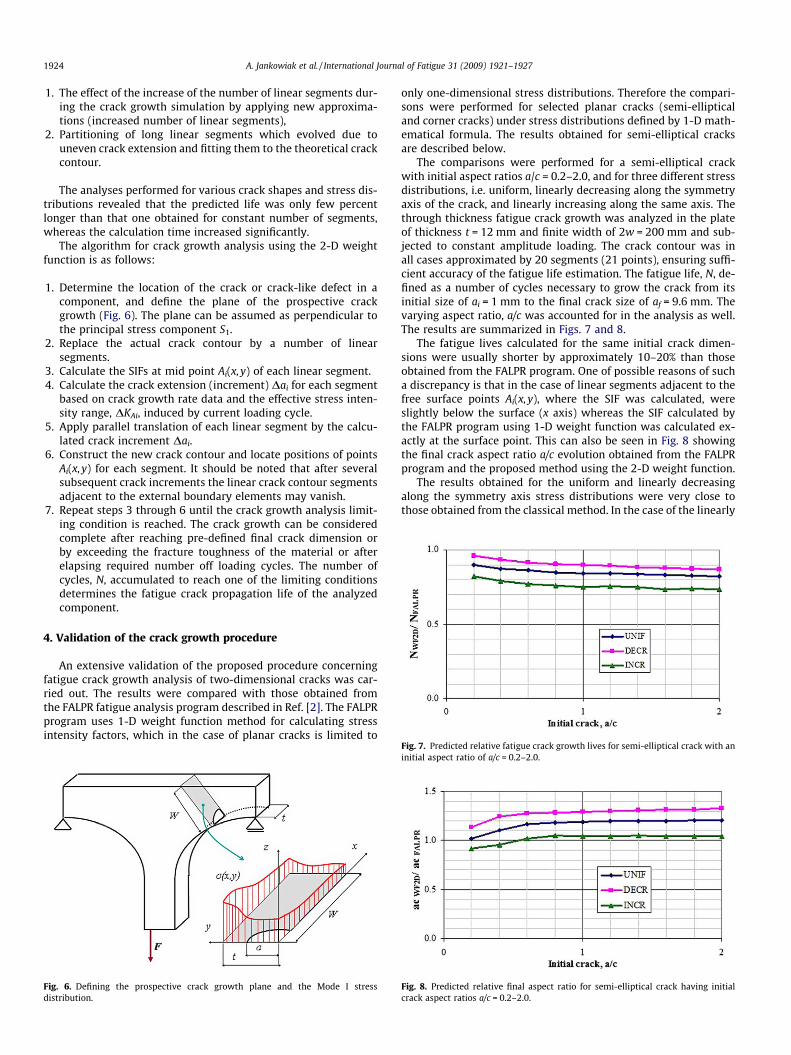
The comparisons were performed for a semi-elliptical crackwith initial aspect ratios a/c = 0.2–2.0, and for three different stressdistributions, i.e. uniform, linearly decreasing along the symmetryaxis of the crack, and linearly increasing along the same axis. Thethrough thickness fatigue crack growth was analyzed in the plateof thickness t = 12 mm and finite width of 2w = 200 mm and sub-jected to constant amplitude loading. The crack contour was inall cases approximated by 20 segments (21 points), ensuring suffi-cient accuracy of the fatigue life estimation. The fatigue life, N, de-fined as a number of cycles necessary to grow the crack from itsinitial size of ai = 1 mm to the final crack size of af = 9.6 mm. Thevarying aspect ratio, a/c was accounted for in the analysis as well.The results are summarized in Figs. 7 and 8.
The fatigue lives calculated for the same initial crack dimen-sions were usually shorter by approximately 10–20% than thoseobtained from the FALPR program. One of possible reasons of sucha discrepancy is that in the case of linear segments adjacent to thefree surface points Ai(x,y), where the SIF was calculated, wereslightly below the surface (x axis) whereas the SIF calculated bythe FALPR program using 1-D weight function was calculated ex-actly at the surface point. This can also be seen in Fig. 8 showingthe final crack aspect ratio a/c evolution obtained from the FALPRprogram and the proposed method using the 2-D weight function.
The results obtained for the uniform and linearly decreasingalong the symmetry axis stress distributions were very close tothose obtained from the classical method. In the case of the linearly
Fig. 7. Predicted relative fatigue crack growth lives for semi-elliptical crack with aninitial aspect ratio of a/c = 0.2–2.0.
Fig. 8. Predicted relative final aspect ratio for semi-elliptical crack having initialcrack aspect ratios a/c = 0.2–2.0.
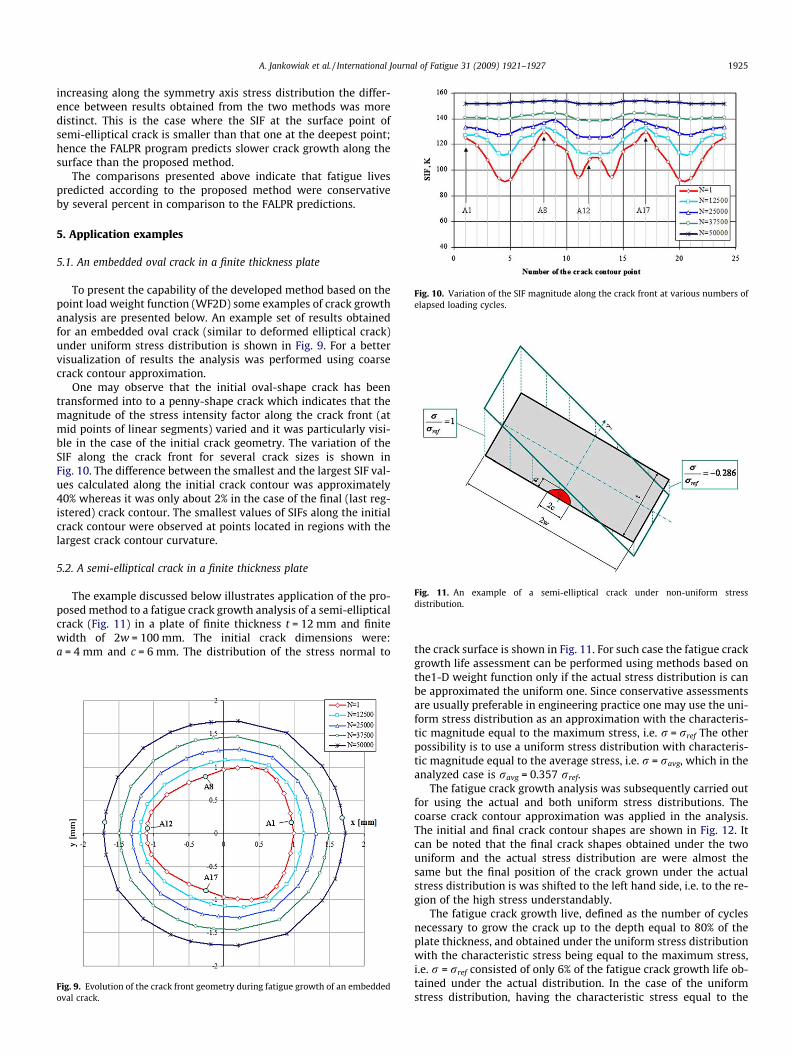
Fig. 10. Variation of the SIF magnitude along the crack front at various numbers ofelapsed loading cycles.
Fig. 11. An example of a semi-elliptical crack under non-uniform stressdistribution.
A. Jankowiak et al. / International Journal of Fatigue 31 (2009) 1921–1927 1925
increasing along the symmetry axis stress distribution the differ-ence between results obtained from the two methods was moredistinct. This is the case where the SIF at the surface point ofsemi-elliptical crack is smaller than that one at the deepest point;hence the FALPR program predicts slower crack growth along thesurface than the proposed method.
The comparisons presented above indicate that fatigue livespredicted according to the proposed method were conservativeby several percent in comparison to the FALPR predictions.
5. Application examples
5.1. An embedded oval crack in a finite thickness plate
To present the capability of the developed method based on thepoint load weight function (WF2D) some examples of crack growthanalysis are presented below. An example set of results obtainedfor an embedded oval crack (similar to deformed elliptical crack)under uniform stress distribution is shown in Fig. 9. For a bettervisualization of results the analysis was performed using coarsecrack contour approximation.
One may observe that the initial oval-shape crack has beentransformed into to a penny-shape crack which indicates that themagnitude of the stress intensity factor along the crack front (atmid points of linear segments) varied and it was particularly visi-ble in the case of the initial crack geometry. The variation of theSIF along the crack front for several crack sizes is shown inFig. 10. The difference between the smallest and the largest SIF val-ues calculated along the initial crack contour was approximately40% whereas it was only about 2% in the case of the final (last reg-istered) crack contour. The smallest values of SIFs along the initialcrack contour were observed at points located in regions with thelargest crack contour curvature.
5.2. A semi-elliptical crack in a finite thickness plate
The example discussed below illustrates application of the pro-posed method to a fatigue crack growth analysis of a semi-ellipticalcrack (Fig. 11) in a plate of finite thickness t = 12 mm and finitewidth of 2w = 100 mm. The initial crack dimensions were:a = 4 mm and c = 6 mm. The distribution of the stress normal to
Fig. 9. Evolution of the crack front geometry during fatigue growth of an embeddedoval crack.
the crack surface is shown in Fig. 11. For such case the fatigue crackgrowth life assessment can be performed using methods based onthe1-D weight function only if the actual stress distribution is canbe approximated the uniform one. Since conservative assessmentsare usually preferable in engineering practice one may use the uni-form stress distribution as an approximation with the characteris-tic magnitude equal to the maximum stress, i.e. r = rref The otherpossibility is to use a uniform stress distribution with characteris-tic magnitude equal to the average stress, i.e. r = ravg, which in theanalyzed case is ravg = 0.357 rref.
The fatigue crack growth analysis was subsequently carried outfor using the actual and both uniform stress distributions. Thecoarse crack contour approximation was applied in the analysis.The initial and final crack contour shapes are shown in Fig. 12. Itcan be noted that the final crack shapes obtained under the twouniform and the actual stress distribution are were almost thesame but the final position of the crack grown under the actualstress distribution is was shifted to the left hand side, i.e. to the re-gion of the high stress understandably.
The fatigue crack growth live, defined as the number of cyclesnecessary to grow the crack up to the depth equal to 80% of theplate thickness, and obtained under the uniform stress distributionwith the characteristic stress being equal to the maximum stress,i.e. r = rref consisted of only 6% of the fatigue crack growth life ob-tained under the actual distribution. In the case of the uniformstress distribution, having the characteristic stress equal to the
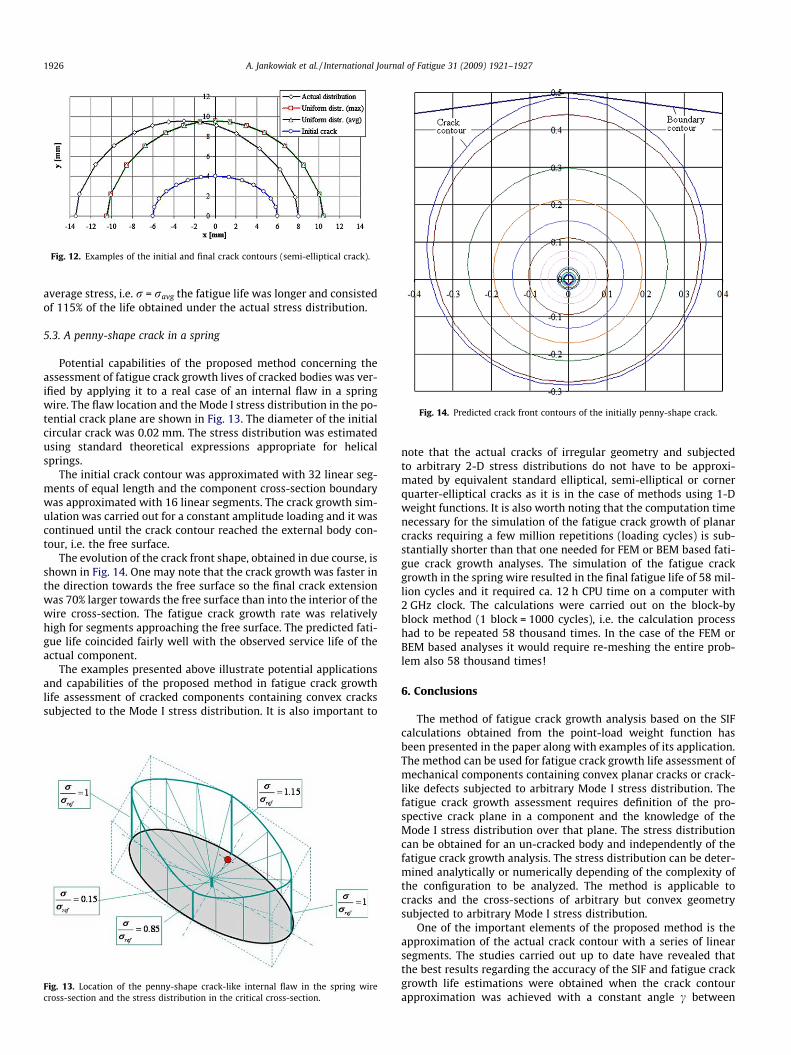
Fig. 12. Examples of the initial and final crack contours (semi-elliptical crack).
Fig. 14. Predicted crack front contours of the initially penny-shape crack.
1926 A. Jankowiak et al. / International Journal of Fatigue 31 (2009) 1921–1927
average stress, i.e. r = ravg the fatigue life was longer and consistedof 115% of the life obtained under the actual stress distribution.
5.3. A penny-shape crack in a spring
Potential capabilities of the proposed method concerning theassessment of fatigue crack growth lives of cracked bodies was ver-ified by applying it to a real case of an internal flaw in a springwire. The flaw location and the Mode I stress distribution in the po-tential crack plane are shown in Fig. 13. The diameter of the initialcircular crack was 0.02 mm. The stress distribution was estimatedusing standard theoretical expressions appropriate for helicalsprings.
The initial crack contour was approximated with 32 linear seg-ments of equal length and the component cross-section boundarywas approximated with 16 linear segments. The crack growth sim-ulation was carried out for a constant amplitude loading and it wascontinued until the crack contour reached the external body con-tour, i.e. the free surface.
The evolution of the crack front shape, obtained in due course, isshown in Fig. 14. One may note that the crack growth was faster inthe direction towards the free surface so the final crack extensionwas 70% larger towards the free surface than into the interior of thewire cross-section. The fatigue crack growth rate was relativelyhigh for segments approaching the free surface. The predicted fati-gue life coincided fairly well with the observed service life of theactual component.
The examples presented above illustrate potential applicationsand capabilities of the proposed method in fatigue crack growthlife assessment of cracked components containing convex crackssubjected to the Mode I stress distribution. It is also important to
Fig. 13. Location of the penny-shape crack-like internal flaw in the spring wirecross-section and the stress distribution in the critical cross-section.
note that the actual cracks of irregular geometry and subjectedto arbitrary 2-D stress distributions do not have to be approxi-mated by equivalent standard elliptical, semi-elliptical or cornerquarter-elliptical cracks as it is in the case of methods using 1-Dweight functions. It is also worth noting that the computation timenecessary for the simulation of the fatigue crack growth of planarcracks requiring a few million repetitions (loading cycles) is sub-stantially shorter than that one needed for FEM or BEM based fati-gue crack growth analyses. The simulation of the fatigue crackgrowth in the spring wire resulted in the final fatigue life of 58 mil-lion cycles and it required ca. 12 h CPU time on a computer with2 GHz clock. The calculations were carried out on the block-byblock method (1 block = 1000 cycles), i.e. the calculation processhad to be repeated 58 thousand times. In the case of the FEM orBEM based analyses it would require re-meshing the entire prob-lem also 58 thousand times!
6. Conclusions
The method of fatigue crack growth analysis based on the SIFcalculations obtained from the point-load weight function hasbeen presented in the paper along with examples of its application.The method can be used for fatigue crack growth life assessment ofmechanical components containing convex planar cracks or crack-like defects subjected to arbitrary Mode I stress distribution. Thefatigue crack growth assessment requires definition of the pro-spective crack plane in a component and the knowledge of theMode I stress distribution over that plane. The stress distributioncan be obtained for an un-cracked body and independently of thefatigue crack growth analysis. The stress distribution can be deter-mined analytically or numerically depending of the complexity ofthe configuration to be analyzed. The method is applicable tocracks and the cross-sections of arbitrary but convex geometrysubjected to arbitrary Mode I stress distribution.
One of the important elements of the proposed method is theapproximation of the actual crack contour with a series of linearsegments. The studies carried out up to date have revealed thatthe best results regarding the accuracy of the SIF and fatigue crackgrowth life estimations were obtained when the crack contourapproximation was achieved with a constant angle c between
A. Jankowiak et al. / International Journal of Fatigue 31 (2009) 1921–1927 1927
adjacent linear segments. Acceptable accuracy was achieved whenthe angle c between adjacent segments was at least 170�.
In most cased the predicted fatigue crack growth lives wereconservative by 10–20% in comparison with simulations usingthe 1-D weight functions and resulting approximations.
The proposed method enables prediction of crack growth livesin CPU times comparable to those needed only for the calculationof handbook classical SIF solutions therefore it is much less timeconsuming than the FEM/BEM numerical methods.
References
[1] Glinka G, Reinhardt W. Calculation of stress intensity factors for cracks ofcomplex geometry and subjected to arbitrary nonlinear stress fields. Fatigueand fracture mechanics, vol. 31. West Conshohocken (PA): ASTM STP 1389;2000. p. 348–70.
[2] Jakubczak H, Glinka G. Program FALPR for fatigue crack growth analysis. Ontario(Canada): Stress and Fatigue-Fracture Design, Inc.; 1995–2008.
[3] Jakubczak H, Jankowiak A. Mode I stress intensity factors for cracks in arbitrarystress fields. Mach Dyn Prob 2003;27(4):7–16.
[4] Jankowiak A. Analysis of crack growth using the two dimensional weightfunction. PhD thesis, Warsaw University of Technology; 2007 [in Polish].
[5] Jankowiak A, Jakubczak H. Crack contour approximation for life assessmentbased on 2-D weight function. Mach Dyn Prob 2006;30(2):54–62.
[6] Oore M, Burns DJ. Estimation of stress intensity factors for embedded irregularcracks subjected to arbitrary normal stress fields. J Press Vess Technol ASME1980;102:201–11.
[7] Shen G, Glinka G. Weight functions for a surface semi-elliptical crack in a finitethickness plate. Theor Appl Fract Mech 1991;15(2):247–55.
[8] Tada H, Paris P, Irwin G. The stress analysis of cracks handbook. 2nd ed. St. Louis(MO): Paris Production Inc.; 1985.
[9] Wu Z, Jakubczak H, Glinka G, Molski K, Nilsson L. Determination of stressintensity factors for cracks in complex stress fields. Arch Mech Eng2003;L(1):41–67.