Embed Size (px)
Citation preview
International Journal of Engineering Research and General Science Volume 3, Issue 3, May-June, 2015 ISSN 2091-2730
1159 www.ijergs.org
Colour and COD removal of Distillery spent wash by using Electro coagulation
Mr.Manoj.P.Wagh1, Dr.P.D.Nemade
2, Mr. Sameer .R. Dhasal
3.
Mr. Manoj.P.Wagh1, Research Scholar in D. Y. Patil College of Engineering and Technology Pimpri, Pune,
Dr.P.D.Nemade2, Principal, S. B. Patil College of Engineering Indapur, Pune.
Mr. Sameer.R. Dhasal3 final year Civil Engineering students of P. Dr. V. Vikhe Patil College of Engineering Ahmednagar.
Email id – [email protected]. Contact no: - 09762863588
Abstract - Distilleries are one of the backbone industries of India contributing a fair amount to nations GDP. It also contributes to
India’s export. Distillery industry consumes 12-15 l of water for one liter of alcohol production, generating 4.04 x 10¹⁰
liter of
unwanted residual liquid waste called spent wash. Spent wash is a dark brown colour and very high organic loading, very high
chemical oxygen demand (COD) and high Biochemical Oxygen demand (BOD). Thus distillery industries have a great adverse impact
on the environment. Numbers of clean up technologies have been worked out to efficiently treat the distillery spent wash. In this
paper, electro coagulation with aeration is carried out by using Aluminum and Iron electrodes in a batch reactor. The effects of
operating parameter such as current density, pH, agitation speed, aeration were studied. By using iron electrodes, the maximum colour
removal 99.78 % was observed at a 25 Voltage for pH 8. UV spectrophotometer was used to find out colour removal. Maximum COD
removal was found to be 85.71% at pH 3 for an electro coagulation time of 150 minutes.
Keywords: - Electro coagulation, distillery spent wash, molasses, melanoidin, UV Spectrophotometer, Caramelized, Recalcitrant
1. INTRODUCTION
Distillery spent wash is apparently one of the serious pollution problems of the countries, especially who producing alcohol
from the fermentation and subsequent distillation of sugar cane molasses. In India there are approximately 319 sugar
industries producing alcohol 3.25 x 10⁹
liters and generating 40.4. X 109 liters of spending was annually [1,2,3]. The
distillery spent wash is characterized as one of the caramelized and recalcitrant wastes containing extremely high COD,
BOD, SS, inorganic solids, colour and low in pH typically 10-15 liters of effluent are produced for each liter of alcohol [4,5].
It is the common example that distillery effluent is disposed without proper treatment causing serious hazard to surrounding
land and water bodies because they prevent sunlight penetration into an aquatic system thereby dissolved oxygen
concentration is depleted. This has occurred due to the presence of dark brown pigment melanoidin, generated through
maillard reaction between sugar and amino compounds [6, 7, 8]. Economical and eco-friendly distillery spent treatment is a
great challenge to environmentalists and scholars. There are a number of methods to treat distillery spent wash, especially
decolourization and removal of COD such as physical, chemical and biological methods. Bio-methanation of distillery spent
wash followed by aerobic treatment is the commonly used treatment to treat distillery [9, 10]. Aerobic treatment reduces the
chemical oxygen demand (COD), and Biological oxygen demand up to 50 to 70 %, but till 100% color, COD and BOD are
not reduced [11].
Table 1: Characteristics of Untreated and aerobically treated distillery effluent [2, 12, 13, 14]
Parameter
(All values in mg/l except pH)
Untreated distillery effluent Aerobically treated effluent

International Journal of Engineering Research and General Science Volume 3, Issue 3, May-June, 2015 ISSN 2091-2730
1160 www.ijergs.org
pH 3.0-4.5 7.5-8.0
BOD5 50,000- 60,000 8000-10,000
COD 1,10,000- 1,90,000 45,000-52,000
Total Solid (TS) 1,10,000-1,90,000 70,000-75,000
Total Volatile Solid (TVS) 80,000-1,20,000 68,000-70,000
Total suspended solid (TSS) 13,000-15,000 38,000-42,000
Total dissolved solids (TDS) 90,000-1,50,000 30,000-32,000
Chlorides 8000-8500 7000-8000
Phenols 8000-10,000 7000-8000
Sulphate 7500-9000 3000-5000
Phosphate 2500-2700 1500-1700
Total nitrogen 5000-7000 4000-4200
2. LITERATURE REVIEW
Electro coagulation is an efficient method to remove colour and reduce COD. Manisankar et al., (2004) in their work
concludes that by using Graphite - Graphite electrodes 85.2 % COD removed at pH 6.9 – 7.2 and duration is 180 minutes. Krishna et
al., (2010) reported that by using Al - Al electrode 72.3 % COD removed in 2 hours when pH is 3. Khandegar and Saroha et al.,
(2012) state that by using Al - Al electrode 81.3 % COD removed successfully. They also prove that by using Al - Fe electrode 71.8 %
COD removed in 2 hour duration when the pH of the solution is 3. Khandegar et al., (2014) revealed that 98 % COD removal
efficiency was obtained by using Al – Al electrode when the pH of the waste water is 7.2. They also concluded that the electro -
coagulation technique can be successfully employed for the treatment of distillery effluent. Electro coagulation (EC) has the potential
to treat distillery spent wash. Electro coagulation reaction occurring at the electrodes for aluminum and iron electrodes is as follows
For Aluminum electrodes [15]
At anode
Al → Al3+
+ 3e-
(1)
At Cathode
Al + 3H2O → Al (OH) 3 + 3H+ + 3e
- (2)
2Al + 3 H2O → Al2O3 + 6H+
+ 6e-
(3)
For Iron electrodes [15]
At Anode
Fe (s) → Fe2+
+ 2e-
(4)
Fe2+
+ 2OH - → Fe (OH)
2 (5)
At Cathode
Fe +2 H2O → Fe (OH) 2 → Fe (OH) 2 +H2 (6)
Distillery spent wash contains chlorides. By the passing the electric current generation of chlorine and hypo chloride irons occurs. It
reacts with organic matter present is spent wash, and oxidation starts. Due to formation of hyphochorous acid and hyphochloride irons
the organic matter decomposes because of their high oxidative potential. Following reaction takes place at anode and cathode.

International Journal of Engineering Research and General Science Volume 3, Issue 3, May-June, 2015 ISSN 2091-2730
1161 www.ijergs.org
At anode
2 Cl- → Cl2 + 2e
- (7)
2H2O +2e- → H2 + 2OH
- (8)
3. MATERIALS AND METHODS
In present work Spent wash was collected from a shri dnyneshwar distillery, bhenda Ahmednagar. As per the distillery laboratory,
characteristics of spent wash are mentioned in table no.2. In practice these parameters are usually measured in situ.
Table No 2:- Spent Wash Parameters
Parameter Untreated
(Raw spent wash)
Homonization tank Digester tank Digester Outlet
pH 3.50-4.20 6.6 7.20-7.60 7.5-8.0
Temperature 35 - 400C 40
0 C
37 - 39
0 C 37- 40
0C
TVA(Total
Volatile Acid)
2500-3500 mg/l 15,000 mg/l 3,500 – 5,000 mg/l 5014
COD 80,000-1,44,200 mg/l 35,000-45,000 mg/l 30,000 – 34,600 mg/l 35432
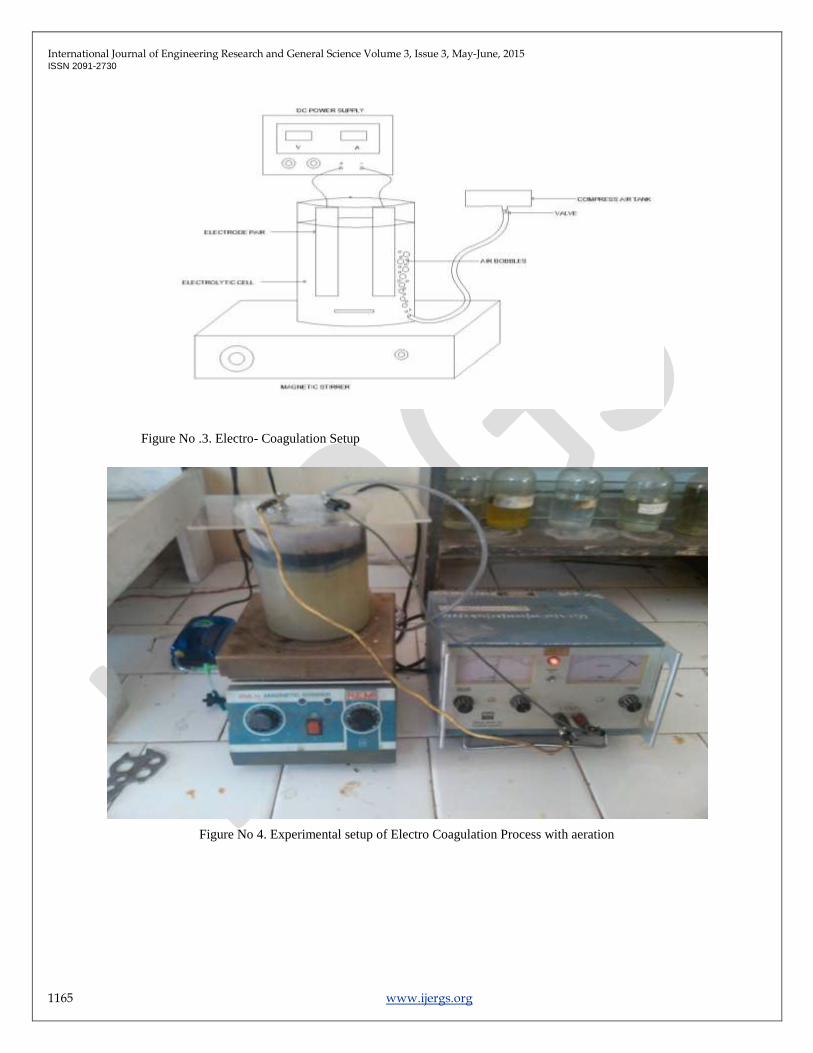
4. EXPERIMENTAL SETUP
The experiment was conducted in the batch mode of operation. In each run 1000ml of sample was taken for electro
coagulation in a beaker. Two different types of electrodes i.e. Iron and Aluminium are used and the most effective electrode in the
treatment process is analyzed. A pair of electrodes as Fe-Fe or Al-Al is used at a time. Each electrode having cross sectional area
100mm×28mm×3mm are used. The dipping area for each the electrode was 75mm×28mm×3mm. DC power supply having a capacity
7V-30V and 0-1.2Amp was used. For each run the voltage applied is varied to determine the efficiency of the treatment at different
voltage ranges.
Magnetic stirrer of 1 Liter capacity was used and the agitation speed was kept 500rpm throughout the experiment. For aeration
a motor is provided and the pipe of aeration is inserted in the beaker. The total time required for each run is 150 minutes. A sample is
taken out every 30 minutes using a 25ml glass pipette. Total 6 samples are analyzed in each run. A sample is taken in a conical flask
and then the difference between colour and COD is measured for different time intervals.
% Colour removal efficiency = Initial –Final
--------------------------- X 100
Initial
Organic strength of the spent wash is nothing but Chemical oxygen demand, which was determined by the dichromate method (Open
reflux titrimetric method).
4.1. Colour Removal
International Journal of Engineering Research and General Science Volume 3, Issue 3, May-June, 2015 ISSN 2091-2730
1162 www.ijergs.org
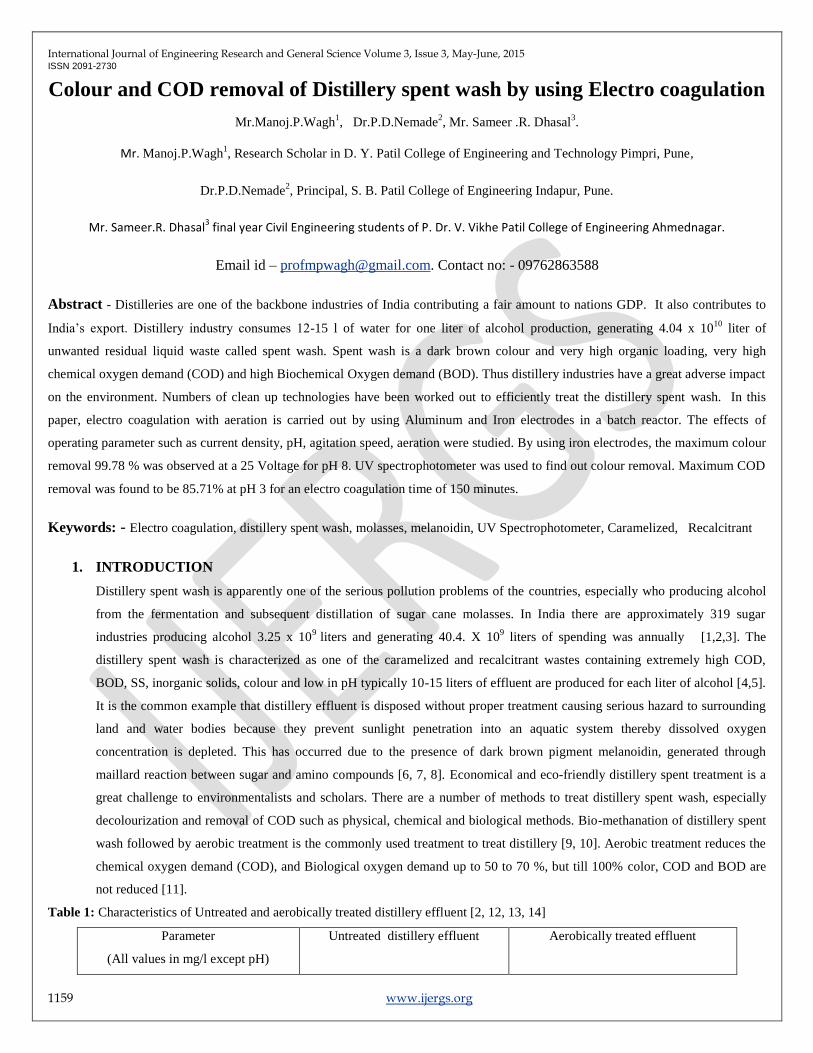
The treated sample is observed using spectrophotometer to measure the percentage colour removal by electro coagulation
process. The spectrophotometer used was “Spectrochem NV-201” having wavelength range 400-700 λ. Firstly instrument is turned on
and warm up time of 15-20 minutes is given. Then any wavelength is selected and with the sample compartment closed empty the %
transmittance (zero percent transmission of light) to read 0% T is set using front dial. Then clean and dry cuvette filled approximately
¾ full of distilled water is placed in a sample compartment. The compartment is closed and % transmittance is adjusted to 100%
(100% transmission of light) using front dial. This is the calibration process for spectrophotometer.
Figure No 1. Spectrophotometer (Spectrochem NV 201)
For obtaining the most suitable wavelength of the sample further adjustment is required to be done. Sample is taken in the
cuvette and placed in the sample compartment. By changing the wavelength λ, the % absorbance of the sample is noted. The
frequency at which the % absorbance is maximum should be selected as the most suitable frequency for the given sample. The
wavelength λ suitable for distillery wastewater was 425 λ.
% Absorbance at different wavelength is given in the following table.
Wavelength λ % Absorbance
400 1.710
425 2.020
450 1.610
475 1.190
500 0.870
525 0.580
550 0.390
575 0.690
International Journal of Engineering Research and General Science Volume 3, Issue 3, May-June, 2015 ISSN 2091-2730
1163 www.ijergs.org
600 0.330
625 0.350
650 0.320
675 0.150
700 0.440
4.2. COD Removal
The chemical oxygen demand (C.O.D) is used as a measure of the oxygen equivalent of the organic matter content of a sample
that is susceptible to oxidation by a strong chemical oxidant. The COD of the sample is determined by Dichromate reflux method. The
reagents used for the COD process are as follows-Silver Sulphate Ag2SO4.
Standard Ferrous Ammonium Sulphate Fe (NH4)2. (SO4)2.6H2O.
39gm FAS powder is added to 20ml of concentrated H2SO4 and diluted with 1 liter distilled water.
Ferroin Indicator
Mercuric Sulphate HgSO4 crystals.
Silver Sulphate Ag2SO4
Sulphuric acid conc. H2SO4. (96% pure)
Standard potassium dichromate (K2Cr2O7) 0.25N
Firstly 15gm of K2Cr2O7 powder is heated in the oven at 105oC for 2hrs. Then after cooling 12.25gm powder is added in 1
liter distilled water.
For COD process firstly 5 conical flasks are taken in which four flasks are for the sample and the fifth flask is for Blank
correction. For COD process the dilution factor 10 is taken, i.e. 1 ml of the sample is added to 9 ml of distilled water. 1 gm of HgSO4
and Ag2SO4 are added to each flask. 10 ml of K2Cr2O7 and 30 ml of H2SO4 is added to the flask and the solution is stirred. Then the
flasks are placed on COD hot plate at 80oC for 2Hrs.

International Journal of Engineering Research and General Science Volume 3, Issue 3, May-June, 2015 ISSN 2091-2730
1164 www.ijergs.org
Figure No 2. COD Hot Plate with Temperature Regulator
After 2 Hrs sample is cooled for 1 Hr. then 40 ml of distilled water is added to each flask. Ferroin indicator is added 2-3
drops. The solution is titrated against Ferrous Ammonium Sulphate Till the end point i.e. reddish brown is achieved and the burette
readings are noted. Electro coagulation (EC) efficiency was determined in terms of colour and COD removal
Formula for COD calculations
(a-b) ×N×8×1000 × D.F.
ml of sample
Where,
a = ml of titrant used for blank correction
b = ml of titrant used for sample
N = Normality of FAS = 2.5
Blank reading
D.F. = 200
International Journal of Engineering Research and General Science Volume 3, Issue 3, May-June, 2015 ISSN 2091-2730
1165 www.ijergs.org
Figure No .3. Electro- Coagulation Setup
Figure No 4. Experimental setup of Electro Coagulation Process with aeration

International Journal of Engineering Research and General Science Volume 3, Issue 3, May-June, 2015 ISSN 2091-2730
1166 www.ijergs.org
Figure No 5. Colour Removal Efficiency by using Electro coagulation
5. RESULT AND DISCUSSION
5.1 Effect of pH of the solution
Initially experiments were conducted on original solution pH 8. The colour removal efficiency 99.78 % and 97.42 % for Fe –
Fe electrodes and Al-Al electrodes respectively. This efficiency is achieved by electro coagulation (EC) followed by filtration of
sample. In electro coagulation process aluminum electrodes are dissolved and more oxidation of Iron electrodes.
Graph No 1. % Colour Removal for Al –Al Electrodes at pH 3
0
10
20
30
40
50
60
70
80
0 30 60 90 120 150
% C
olo
ur
rem
ov
al
Times in Minutes
%Colour removal(Al)
For pH 3 Voltage 7V
%Colour removal(Al)
For pH 3 Voltage 10V
%Colour removal(Al)
For pH 3 Voltage 15V

International Journal of Engineering Research and General Science Volume 3, Issue 3, May-June, 2015 ISSN 2091-2730
1167 www.ijergs.org
Graph No 2. % Colour Removal for Fe –Fe Electrodes at pH 3
Graph No 3. % Colour Removal for Al - Al and Fe –Fe Electrodes at pH 3
0
10
20
30
40
50
60
70
80
90
0 30 60 90 120 150
% C
olo
ur
Rem
ov
al
Times in Minutes
%Colour removal(Fe)
For pH 3 Voltage 7V
%Colour removal(Fe)
For pH 3 Voltage 10V
%Colour removal(Fe)
For pH 3 Voltage 15V
0
10
20
30
40
50
60
70
80
90
100
30 60 90 120 150
% C
olo
ur
rem
ov
al
Times in Minutes
% Colour removal(Al) For
pH 3 Voltage 7V
% Colour removal(Al) For
pH 3 Voltage 10V
% Colour removal(Al) For
pH 3 Voltage 15V
% Colour removal(Fe) For
pH 3 Voltage 7V
% Colour removal(Fe) For
pH 3 Voltage 10V
% Colour removal(Fe) For
pH 3 Voltage 15V

International Journal of Engineering Research and General Science Volume 3, Issue 3, May-June, 2015 ISSN 2091-2730
1168 www.ijergs.org
Graph No 4. % Colour Removal for Al - Al Electrodes at pH 5
Graph No 5. % Colour Removal for Fe –Fe Electrodes at pH 5
0
20
40
60
80
100
120
20 40 60 80 100 120
% Colour Removal
pH=5Voltage 20V
% Colour Removal
pH=5Voltage 25V
% Colour Removal
pH=5Voltage 30V
0
10
20
30
40
50
60
70
80
90
20 40 60 80 100 120
% Colour Removal
Voltage 20V
% Colour Removal
Voltage 25V
% Colour Removal
Voltage 30V

International Journal of Engineering Research and General Science Volume 3, Issue 3, May-June, 2015 ISSN 2091-2730
1169 www.ijergs.org
Graph No 6. % Colour Removal for Al - Al and Fe –Fe Electrodes at pH 5
Graph No 7. % Colour Removal for Al –Al Electrodes at pH 8
0
10
20
30
40
50
60
70
80
90
100
20 40 60 80 100 120
% C
olo
ur
rem
ova
l
Times in Minutes
% Colour Removal , (Untreatedspent wash) using Al-Al ElectrodepH=5Voltage 20V
% Colour Removal , (Untreatedspent wash) using Al-Al ElectrodepH=5Voltage 25V
% Colour Removal , (Untreatedspent wash) using Al-Al ElectrodepH=5Voltage 30V
% Colour Removal , (Untreatedspent wash) using Fe-Fe ElectrodepH=5Voltage 20V
% Colour Removal , (Untreatedspent wash) using Fe-Fe ElectrodepH=5Voltage 25V
% Colour Removal , (Untreatedspent wash) using Fe-Fe ElectrodepH=5Voltage 30V
0
20
40
60
80
100
120
0 30 60 90 120 150
%C
olo
ur
rem
ov
al
Time
%Colour removal(Al)
Voltage 15V
%Colour removal(Al)
Voltage 20V
%Colour removal(Al)
Voltage 25V

International Journal of Engineering Research and General Science Volume 3, Issue 3, May-June, 2015 ISSN 2091-2730
1170 www.ijergs.org
Graph No 8. % Colour removal for Fe-Fe Electrodes at pH 8
Graph No 9. % Colour removal for Al-Al and Fe-Fe Electrodes at pH 8
4.2. Effect of pH on COD removal
Experiments were performed to check effect of different pH on COD removal. It is found that at lower pH maximum COD removal
occurs because acidic condition is more favorable for COD removal. In acidic condition chlorine is present in the spent wash in the
form of hypochlorous acid which has more oxidation potential. Al –Al electrodes remove maximum COD removal as compared to Fe-
Fe electrodes.
0
20
40
60
80
100
120
0 30 60 90 120 150
%co
lou
r re
mo
va
l
Time
%Colour removal(Fe)
Voltage 15V
%Colour removal(Fe)
Voltage 20V
%Colour removal(Fe)
Voltage 25V
0
10
20
30
40
50
60
70
80
90
100
30 60 90 120 150
% C
olo
ur
rem
ova
l
Times in Minutes
% Colour removal(Al) For pH 8Voltage 15V
% Colour removal(Al) For pH 8Voltage 20V
% Colour removal(Al) For pH 8Voltage 25V
% Colour removal(Fe) For pH 8 15V
% Colour removal(Fe) For pH 8 20V
% Colour removal(Fe) For pH 8 25V

International Journal of Engineering Research and General Science Volume 3, Issue 3, May-June, 2015 ISSN 2091-2730
1171 www.ijergs.org
Graph No 10. % COD removal by Al-Al and Fe- Fe electrodes at different pH
Graph No 11. % COD removal by Al-Al and Fe- Fe electrodes at different pH
ACKNOWLEDGEMENT
The authors would like to express sincere thanks to Dr. R. K. Jain Principal, D. Y. Patil College of Engineering and Technology,
Pimpri, Pune. Also, thanks to Dr. A. V. Kulkarni, Dean (R&D), PG/PhD/Research, Padmashree Dr.D.Y.Patil Institute of Engineering
& Technology, Pimpri, Pune-18
5. CONCLUSION
Treatment of distillery spent wash was carried out by using electro-coagulation in batch mode operation. Aluminum and iron type
electrodes are used in the electro-coagulation (EC) process and optimum values of various parameters were obtained. The maximum
99.78 % removal of colour was obtained by using iron electrodes (Fe-Fe) at 25 volts for pH 8. For aluminum electrodes (Al-Al)
maximum colour removed was 98.81 % at 20 volt for pH 8. In both cases this maximum colour removal efficiency was obtained by
0
10
20
30
40
50
60
70
80
90
30 60 90 120 150
% C
OD
rem
oval
Times in Minutes
% COD removal for Al-Al
electrodes at pH 3
% COD removal for Al-Al
electrodes at pH 5
% COD removal for Al-Al
electrodes at pH 8
% COD removal for Fe-Fe
electrodes at pH 3
% COD removal for Fe-Fe
electrodes at pH 5
% COD removal for Fe-Fe
electrodes at pH 8
0
10
20
30
40
50
60
70
80
90
30 60 90 120 150
% C
OD
re
mo
val
Times in Minutes
% COD removal for Al-Alelectrodes at pH 3
% COD removal for Al-Alelectrodes at pH 5
% COD removal for Al-Alelectrodes at pH 8
% COD removal for Fe-Feelectrodes at pH 3
% COD removal for Fe-Feelectrodes at pH 5
% COD removal for Fe-Feelectrodes at pH 8

International Journal of Engineering Research and General Science Volume 3, Issue 3, May-June, 2015 ISSN 2091-2730
1172 www.ijergs.org
electro coagulation followed by filtration by using watman paper number 42. Optimum COD removal found to be 85.71 % for pH 3
for an electro coagulation time of 150 minutes.
REFERENCES:
[1] Santal A. R and Singh N. (2013): Biodegradation of melanoidin from distillery effluent: role of microbes and their potential
enzymes, “Biodegradation of Hazardous and Special Products”. Chapter 5, pp. 71-100.
[2] Sarayu Mohana, Bhavik K.Acharya, Datta Madamwar(2009):- distillery spent wash Treatment technologies and potential
applications, “Journal of Hazardous Materials” 163 pp. 12-25.
[3] Sankaran.K., Premalatha.M.,Vijaysekaran.M.,Somasundara.VT (2014):- DEPHY Project: Distillery wastewater treatment
through anaerobic digestion and phycoremediation- A green industry approach, “Renewable and Sustainable Energy
Reviews” 37 pp 634-643.
[4] Biradar.A (2003): physico-chemical and biological methods for the Treatment of post anaerobic distillery spent wash PhD
thesis, center for environmental science and engineering Indian institute of technology, Bombay
[5] Asaithambi, Lakshinarayana Garlanka (2012):- Influence of experimental parameters in the treatment of distillery effluent by
electrochemical oxidation, “Separation Science and Technology”, 47, pp 470-481.
[6] Satyawali, Y., Balkrishnan. M., (2007): Removal of colour from biomethanated distillery spent wash by treatment with
activated carbons, Bioresource Technology. 98, pp. 2629 – 2635
[7] Pandey.R.A., Malhotra.S,Tankhiwale.A, Pande.S (2003): Treatment of biologically treated distillery effluent a case study
“International Journal of Environmental Studies”,vol.60 ,pp.263-275.
[8] Khandegar V. and Anil .K.Saroha (2012):- Electrochemical treatment of distillery spent wash using aluminum and iron
electrodes, “Chinese Journal of Chemical Engineering”, 20 (3) pp.439-443.
[9] Yadav S, (2012): Degradation and decolourization of post methanated distillery effluent in biphasic treatment system of
bacteria and wetland plant for environmental safety PhD thesis, school of life science, Pandit Ravi Shankar Shukla
University.
[10] Sushil kumar Shukla (2014):- Fungal decolourization of anaerobically biodigested distillery effluent (ABDE) following
coagulant pretreatment,International “Journal of science, Environment and Technology”, Vol 3, N0 2, pp 723-734.
[11] Shruti.M.Krishna.B.M.and Usha.N.Murthy (2013): “Colour removal from bio-digester effluent by electrochemical treatment
with and without fenton reagent”,International Journal of current Engineering and Technology.,115-117
[12] Manisankar. P, Rani. C and Vishwanathan. S (2004): Effect of Halides in the Electrochemical Treatment of Distillery
Effluent, Chemosphere, pp. 57-961
[13] Prasad. R. K and Srivastava. S. N. (2009): Electrochemical degradation of distillery spent wash using catalytic anode: factor
design of experiments. Chemical Engineering Journal. V.146, pp. 22-29
[14] Thakur. C, Srivastava. V. C and Mali. I. D., (2009): Electrochemical treatment of a distillery wastewater: parametric and
residue disposal study, Chemical Engineering, Journal, Vol 148, pp. 494-505
[15] Biwyk.A (1991): Electrocoagulation of biologically treated sewage, “World Congress of Chemical Engineering Germany
“Karlsruhe, pp 16-21.
[16] Khandekar.V and Saroha. A.K. (2013):- Electrocoagulation of distillery spent wash for complete organic reduction,
“International Journal of ChemTech Research”, Vol.2, pp 712-718.

International Journal of Engineering Research and General Science Volume 3, Issue 3, May-June, 2015 ISSN 2091-2730
1173 www.ijergs.org
[17] Krishna. B. M., Murthy. U. N., Kumar. B. M and Lokesh. K. S. (2010): “Electrochemical pretreatment of distillery waste
water using aluminum electrode, Journal of Applied Electrochemistry, Vol 40, pp. 663 -667
[18] Khandegar. V, Saroha. A. K (2014): Treatment of Distillery Spent wash by Electro coagulation, Journal of Clean Energy
Technologies. Vol 2, pp. 244-247


![International Journal of Engineering Research and General ...pnrsolution.org/Datacenter/Vol4/Issue6/30.pdf · The concept of two dimensional classical theories of lubrication [3],](https://img.pdfslide.us/doc/110x75/5d5212af88c993730d8b6c34/international-journal-of-engineering-research-and-general-the-concept-of.jpg)