Embed Size (px)
Citation preview

Contents lists available at ScienceDirect
International Journal of Educational Research
journal homepage: www.elsevier.com/locate/ijedures
School factors that are related to school principals’ job satisfactionand organizational commitment
Yan Liua,⁎, Mehmet Sukru Bellibasb
aDepartment of Educational Leadership, Policy an Instructional Technology, School of Education & Professional Studies, Central Connecticut StateUniversity, Barnard Building-Room 23106, 1615 Stanley St., New Britain, CT 06050, USAb College of Education, Adiyaman University, Turkey
A R T I C L E I N F O
Keywords:School principalJob satisfactionOrganizational commitmentSocial interactionSchool safetySchool autonomyManagement typeFunding resource
A B S T R A C T
Despite that principals’ job satisfaction and organizational commitment are substantial for re-cruitment and retention of effective leaders, research exploring school factors for the determi-nistic role in such attitudes has been unexpectedly rare. Given the crucial role of a schoolprincipal in leading school success, understanding the status of the principal's psychologicalconditions and the antecedent school factors is important. This research is a secondary analysisusing the TALIS 2013 dataset, and applied a rigorous quantitative approach. Latent Trait methodwas first applied to construct latent variables of principals' job satisfaction and organizationalcommitment to compare the interests across countries. Then a two-level Generalized StructuralEquation Model was used to detect the structured relationship between a set of school factors andprincipals' attitudes with pooled 32-country data. Finally, Generalized Structural Equation Modelwas fitted for each country's data to investigate how school factors influence principals' attitudesin different contexts. The study revealed significant variations among countries and continents inthe principal’s job satisfaction and organizational commitment. The school’s positive social in-teraction, safety, human resource, autonomy for staffing, school management type and thefunding resources significantly predict the principal's attitudes towards the job and the school.
1. Introduction
The principal is regarded as an imperative leading force for school success (Leithwood & Seashore-Louis, 2011). Through theprincipal’s leadership, schools can create optimal conditions to support student learning by fostering positive social interaction andstimulating intellectual development (Dimmock, 2013; Robinson, Lloyd, & Rowe, 2008). A school’s organizational learning(Schechter, 2008) of maintaining effectiveness or transforming from failure to success needs consistent focus and continuous effortguided by school leaders (Fuller, Young, & Baker, 2007; Louis, Dretzke, & Wahlstrom, 2010). However, principals’ turnover willpotentially interrupt or even terminate the process because of inconsistency in school goals, missions, and efforts (Baker, Punswick, &Belt, 2010; Miller, 2013).
Retaining experienced principals is fundamental for school success (Printy, 2010). However, a report (Markow, Lara, & Helen,2013) by Metlife revealed that regardless of demographic backgrounds, almost three-quarters of principals in the US indicated thattheir jobs had become too complicated. This same survey conducted since 2001 indicated the principal turnover intention was at ahistorical high that one-third was likely to leave the job in five years. The increase of principal turnover rate (Clifford & Chiang, 2016;Palmer, Watch, & Gibson, 2017) has resulted in extra costs and labor for schools to fill the vacancy. In addition, excessive principal
https://doi.org/10.1016/j.ijer.2018.04.002Received 23 November 2017; Received in revised form 31 January 2018; Accepted 26 April 2018
⁎ Corresponding author.E-mail address: [email protected] (Y. Liu).
International Journal of Educational Research 90 (2018) 1–19
0883-0355/ © 2018 Elsevier Ltd. All rights reserved.
T
turnover is also associated with increased teacher turnover and decreased student outcomes (Fuller et al., 2007; Miller, 2009). Suchnegative effects of high principal turnover are even more notable and detrimental in low-performing and minority-student dominantschools (Béteille, Kalogrides, & Loeb, 2012).
To prevent principal turnover, it is strategically important to find out principals’ attitudes toward the job before they leave. Jobsatisfaction (JS) and organizational commitment (OC) are two essential indicators for this purpose because job turnover intention isclosely related to JS and OC (Aydogdu & Asikgil, 2011). Therefore, delving in the status and antecedents of these two job-relatedpsychological features are crucial in providing supportive interventions. In addition, JS and PC are important factors that influenceorganizational empowerment (Humborstad & Perry, 2011), in-role behaviors (Williams & Anderson, 1991) and performance (Judge,Thoresen, Bono, & Patton, 2001). Therefore, the research on the principal JS and OC is vital not only for preventing turnover, but alsofor increasing principal effectiveness. Fig. 1 illustrates such relationship.
Despite the importance, there is surprisingly limited research for the topic. To date, researchers have been exclusively interestedin JS and OC of teachers while mostly overlooking JS and OC of school leaders (Dude, 2012). There are only few studies that haveprovided empirical evidence on influential factors of principal JS and OC respectively (Chang, Leach, & Anderman, 2015; Eckman,2004; Federici & Skaalvik, 2012; Suman & Srivastava, 2012). Given that JS and OC are related to each other (Liu & Printy, 2017),there is little evidence regarding how determining factors are related to JS and OC by controlling the covariance between them. Inaddition, there are few studies that have conceptualized school-related factors through a comprehensive lens and investigated theeffect of the whole-school experience on principal JS and OC. The gap in the literature calls for rigorous research to investigate towhat extent comprehensive school-related factors impact a principal’s JS and OC in order to provide the information needed toprevent turnover of school principals. An international comparative study is even more meaningful as it can situate each individualcountry in a global community in order to reveal cross-national variation in principal attitudes and the factors that might impact suchattitudes in different contexts.
2. Literature review
2.1. Principal job satisfaction
There is no agreed-upon definition for JS. Yet, the conceptual investigations of JS have revealed two major components in thedefinition and measuring of the concept: affective (emotional) and cognitive. One of the most widely used definitions of JS wasproduced by Locke (1976), who defined JS from an affective perspective. According to his statement, job satisfaction can be definedas “a pleasurable or positive emotional state resulting from the appraisal of one's job or job experiences” (p. 1300). From thisperspective, JS is substantially related to one’s emotions and therefore, “an individual’s appraisal of the degree to which the job fulfilsone’s own job values can cause a positive emotional state of satisfaction or a contrasting negative feeling of dissatisfaction” (Coomber& Barriball, 2007, p. 297). In addition to affect, cognitive component of JS has also been acknowledged in the literature. Cognitivecomponent of JS is defined in terms of discrepancy between an individual’s perceptions of the situation and a known standard or his/her expectation level (Campbell, Converse, & Rodgers, 1976). Although two components (affective and cognitive) of JS may havedifferent effect on organizations (Moorman, 1993), research has provided evidence that they are not totally separated from oneanother; indeed, they operate in parallel (Edwards, 1990).
JS is not only derived from how people perceive and feel about their jobs, it is also related to their experiences with the job.Therefore, the study of JS has drawn on two major theoretical bodies of knowledge (Spector, 1997). One is Process Theory, whichemphasizes “how” and deals with processes by which factors such as expectations and procedures impact JS. The other one is ContentTheory, which emphasizes “what” and is concerned with individual needs and goals for the job. For instance, Maslow (1975)’sHierarchy of Needs, which list several categories of needs to be met for an individual to be satisfied with the work and (Herzberg(1966)’s Two-Factor Theory, which identifies maintenance and motivating factors determining an individual’s satisfaction with the
Fig. 1. Framework of the relationship among school factors, job satisfaction, organizational commitment and outcomes.
Y. Liu, M.S. Bellibas International Journal of Educational Research 90 (2018) 1–19
2
job, are among two prominent Content Theories (Coomber & Barriball, 2007). In the present study, the primary focus was on ContentTheory because principal JS is related to a broad of school factors that impact the principal experience (Waskiewicz, 1999). However,the focus here is not limited to the school factors in order to provide a comprehensive understanding of “what” influence principals’JS. Raelin (1980) argued that JS research needs to consider two fundamental aspects: (1) the characteristics of the job condition and(2) the individuals’ traits. From this classification, not only do job-related factors influence the extent of JS, but also the principal’sindividual characteristics. Therefore, it is imperative to take into consideration both job-related school factors and principal char-acteristics when exploring what matters for principal JS.
2.2. Factors predicting principal job satisfaction
As to what factors impact principal JS, the available research has an intense interest in how principal and school characteristicsmatter. It has been reported that there is variation of JS among principals according to race (Barry, 2002), gender (Eckman, 2004),experience and location (Sodoma & Else, 2009), as well as school enrollment (Graham & Messner, 1998). Previous research has alsoidentified both extrinsic and intrinsic aspects of a principal’s job that can impact JS, including the expectation of safety (Halawah,2005), trust (Louis, Louis, Murphy, & Murphy, 2017), a sense of success and autonomy for school decision-making (Dou, Devos, &Valcke, 2017), career advancement opportunities and salary (Sun & Ni, 2016), perceived school effectiveness (Eckman, 2004), andstudent behavioral issues and resources (Friedman, Friedman, & Markow, 2008). The research has also examined how school ac-countability and increased instructional responsibilities, changes in student demographics, lack of support, politics, and the job stressimpact principal JS (Byrd, 2010).
By reviewing these studies, it stands out that previous research has focused intensively on how principals’ characteristics, needs,expectations, school resources, and daily job-related experiences impact satisfaction. One important school factor that has not beenfully examined is the dynamic relationship among the staff. School social capital is an imperative element in building organizationalcapacity (Bryk, Sebring, Allensworth, Luppescu, & Easton; Dimmock, 2013).
2.3. Principal organizational commitment
Organizational commitment is the individual’s psychological attachment to their organization (O'Reilly & Chatman, 1986). Itrefers to an individual’s strong belief in and acceptance of goals and values of his/her organization, willingness to do best for his/herorganization, and eagerness to stay as a member of the organization (Mowday, Steers, & Porter, 1979). A committed person is morelikely to remain with the organization, possess substantial motivation to achieve the goals of his/her organization (Steers, 1977), andis ready to give something of his/her self for the success of the organization (Mowday et al., 1979). An individual’s commitment is notlimited to his/her expression of belief or opinions but could be inferred from his/her daily actions (Mowday et al., 1979). OC istherefore seen as a substantial solution for the personnel’s turnover intention (Steers, 1977; Williams & Hazer, 1986).
The foci of the OC research had been the definition and the scale of measurement until Meyer and Allen (1991) developed theThree-Component Model. Their model integrated previous definitions of OC that had proliferated in the literature. They generalizedthree themes: affective attitudes toward the organization (affective commitment), perceived costs associated with leaving the or-ganization (continuance commitment), and obligation to remain with the organization (normative commitment). These three types ofthe OC established a decent framework to define and interpret the OC research, and have provided the groundwork for currentresearch measuring principal OC more focusing on affective commitment.
2.4. Factors impacting principal organizational commitment
The majority of studies examining the antecedent of OC in education have focused on working conditions and experiences. Thescope of research in this category is broad as researchers have looked into different aspects including socialization practices(Kammeyer-Mueller & Wanberg, 2003), work challenge (Colquitt, Lepine, & Wesson, 2011), task autonomy (Aubé, Rousseau, &Morin, 2007), the roles of the job (Williams & Anderson, 1991), and group relationship (Farooq, Payaud, Merunka, & Valette-Florence, 2014), among others. The scope of the work experience has been found to have the strongest and most consistent corre-lations with affective commitment across studies (Morrow, 2011). These studies reaffirm that explorations of antecedents of principalOC need to include complete school factors because these factors influence the work experience of a principal and their socialattachment to the school.
One study focusing on school principals particularly found that job autonomy, psychological empowerment, and distributivejustice are associated with principal OC (Dude, 2012). Another study found perceived fairness, organizational tenure, perceivedorganizational support, and the principal’s age to be positive predictors of OC (Hawkins Jr, 1998). Nevertheless, studies of theantecedents of OC for the school principals are very limited in the literature (Chang et al., 2015).
2.5. School factors, job satisfaction, and organizational commitment
In earlier parts of the literature review, a discussion for the definitions of JS and OC and related school factors is provided. It isindicated that both JS and OC has substantial consequence for organizations by their inverse effect on employee turnover. However,the two concepts do not refer to the same phenomenon. There exist several points that enable us to differentiate JS from OC (Mowdayet al., 1979). First of all, while OC is the key to the employee to determine whether to remain with the organization, JS refers to the
Y. Liu, M.S. Bellibas International Journal of Educational Research 90 (2018) 1–19
3
extent to which a job fulfils one’s values or the degree to which the job meets a given standard or specific expectations of theemployee. Second, OC refers to an individual’s attachment to the employing organization in general, including the goals and values,yet JS is more about a specific task environment in which the individual performs his responsibilities. Third, OC develops slowly andremains stable over time yet JS includes immediate reactions to a specific task related to the work. Therefore, an individual could bedissatisfied with a specific part of his/her work (eg. payment) but may still not have an intention of leaving the job. Finally, OC is notaffected by day to day events but JS is likely to chance by every day experience of the employee.
As discussed earlier, when principal JS and OC are the interest of a study, it is important to explore the reciprocal relationshipamong school factors, principal characteristics, and principal JS and OC. School factors and the impact on staff have continuouslybeen an interest of research, exploring what a school is like, and how this may impact the people inside (Cohen, McCabe, Michelli, &Pickeral, 2009). Over time, researchers look at the atmosphere, culture, resources, social networks of a school (Loukas & Murphy,2007) to investigate how one aspect or aspects impact people. From a comprehensive perspective, each school has its unique social,financial, managerial and physical factors, which Cohen et al. (2009) synthesized as four dimensions: physical and social-emotionalfactor, quality of teaching and learning, interpersonal relationship and collaboration, and the structural environment. Prior researchhas demonstrated that school factors are essential for teacher JS (De Nobile, McCormick, & Hoekman, 2013; Desai, Karahalios,Persuad, & Reker, 2014), teacher commitment (Bogler & Somech, 2004), and student outcomes (Bryk et al., 2010). However, there isno solid evidence to validate how broad aspects of school factors impact principal JS and OC.
3. Current study
In sum, the knowledge base is not yet complete about principal JS and OC, and the antecedents of such attitudes. There are threemajor limitations. First and foremost, there is very limited research about principal JS and OC generally. Given the importance ofschool principals for the success of schools, and the increasing principal turnover rate, there is not enough evidence regarding whatmakes principals feel satisfied with their jobs and committed to their schools. Second, previous research has investigated theantecedents of school principal JS and OC with personal and organizational demographic factors as well as the expectations andneeds of the job. However, this research has failed to investigate how a comprehensive model of school factors including schoolsafety, social interaction, resources, organizational structural, professional development opportunity, student composition as well asschool and principal characteristics impact principals’ JS and OC. Third, a large-scale, international comparative study is missingfrom the literature, so there is no opportunity to situate countries in an international context to understand the status of principal JSand OC as well as what makes principals more satisfied and committed in different contexts. Outside the educational arena, acomparative study done by Karin Andreassi, Lawter, Brockerhoff, and Rutigliano (2014) found regional patterns for JS. Asian em-ployees were among the least satisfied, followed by European workers. North American employees were more satisfied but still notcomparable to their counterparts in South America. Whether this finding translates to school principals in educational settingsremains unknown.
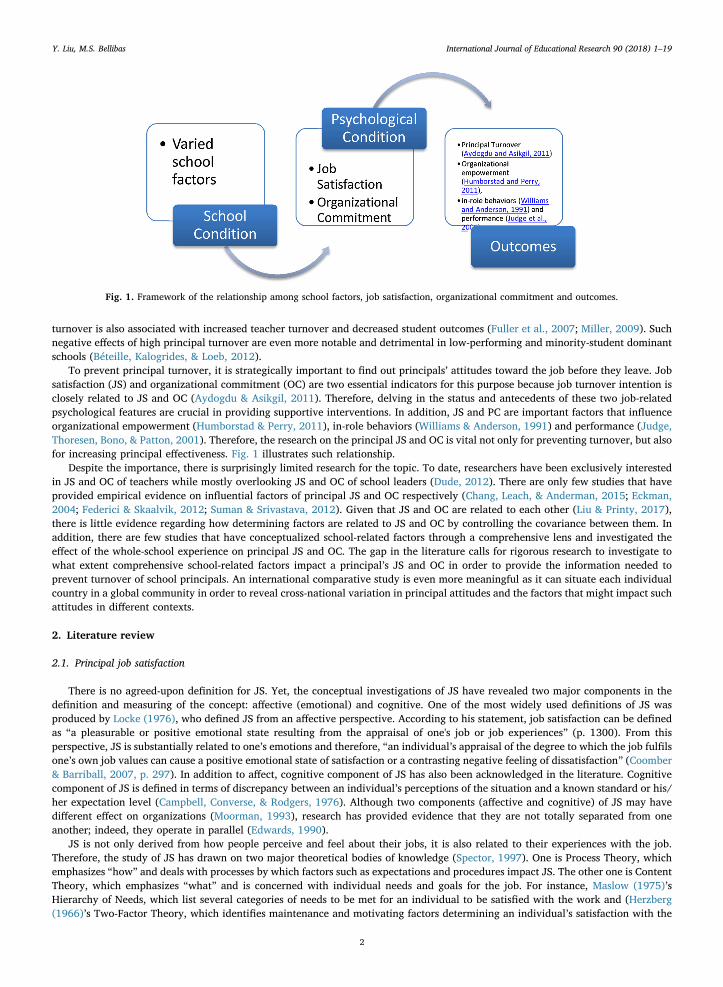
Specifically, we have three research questions. First, the researchers intend to compare the current status of principal JS and OCacross counties and regions. Second, the researchers aspire to provide empirical evidence regarding how a comprehensive scope ofschool factors might be related to principals’ JS and OC, by controlling the variation between countries, principals and schools. Weseparate this question into two sub-questions, and were particularly interested in first, how the relationship exists between schoolfactors and principals’ JS and OC using international pooled data through a global lens. Second, given TALIS data was actuallyconducted in each individual country, the researchers are interested in how a comprehensive scope of school factors are related toprincipals’ JS and OC within each participating country. Fig. 2 illustrates such interest in the conceptual framework of the study.
4. Method
4.1. Data sources and samples
The data employed in this study comes from the second round of the Teaching and Learning International Survey (TALIS)conducted in 2013. TALIS was administered by the Organization for Economic Co-operation and Development (OECD), which aims tounderstand educational systems of the participant countries. The TALIS study focuses on multifaceted issues. While 24 countriesparticipated in TALIS in 2008 during the first round, the number of participants increased to 34 in 2013 for “core” study (OECD,2014b). TALIS had two surveys for teachers and principals. This study used 6045 principals’ survey data at the lower secondary levelfrom 32 countries. TALIS study used a two-stage cluster sampling approach that first sampled 200 schools from each participantcountry, then randomly sampled 20 teachers from each selected school. Given the feature of the complex survey design, the weighthas to be used to adjust for the unequal probability of selection due to the cluster sampling approach and the varied response rates(OECD, 2014b). The principal survey final weight was used for the study. OECD calculated the final weight as the product of a baseweight and of one or many adjustment factors; the former is the inverse of the selection probability, the latter compensates for non-response and other random occurrences that could possibly induce biases in the estimates (OECD, 2014b).
The OECD’s report (OECD, 2014a) provides a preliminary descriptive analysis by comparing participating countries’ principal JSfor profession and environment, but the data have not been fully utilized to its capacity when it comes to investigating the nuancedrelationship between a comprehensive set of school factors and principal JS and OC.
Y. Liu, M.S. Bellibas International Journal of Educational Research 90 (2018) 1–19
4

4.2. Dependent variables
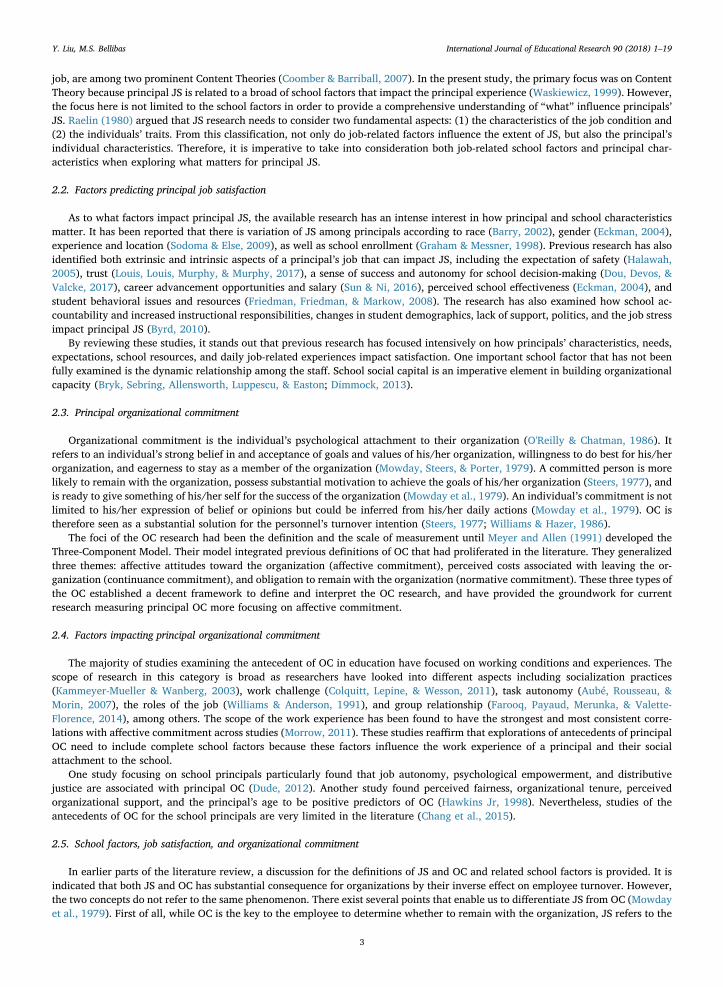
Principal JS and OC are the dependent variables. In the TALIS data, there is a set of questions probing principals’ attitudes towardtheir job and school on a four-point measurement, namely “strongly disagree”, “disagree”, “agree” and “strongly agree”. Whilst wecan rank the levels, we cannot place a “value” to them; we cannot say that " strongly agree " is twice as positive as “agree”. Since theitems are categorical variables, this study used the Latent Trait Analysis (LTA) to transform these categorical variables into twocontinuous latent variables in one model with covariance between JS and OC. LTA is form of factor analysis for binary (dichotomous)or ordered-category data (Langeheine & Rost, 2013; Muthén, 1984). LTA tends to be used over Confirmative Factor Analysis if thedata set is large and the focus is on the scale and the item character, which is the case for this study (Meade & Lautenschlager, 2004).Fig. 3 might be able to adequately illustrate the connection between theory, measurement and the data.
The construct of the latent variables was specified to handle the complex data appropriately (Langeheine & Rost, 2013; Muth́en &
Fig. 2. Conceptual framework for the study.
Fig. 3. Connections between theory, measurement and data.
Y. Liu, M.S. Bellibas International Journal of Educational Research 90 (2018) 1–19
5
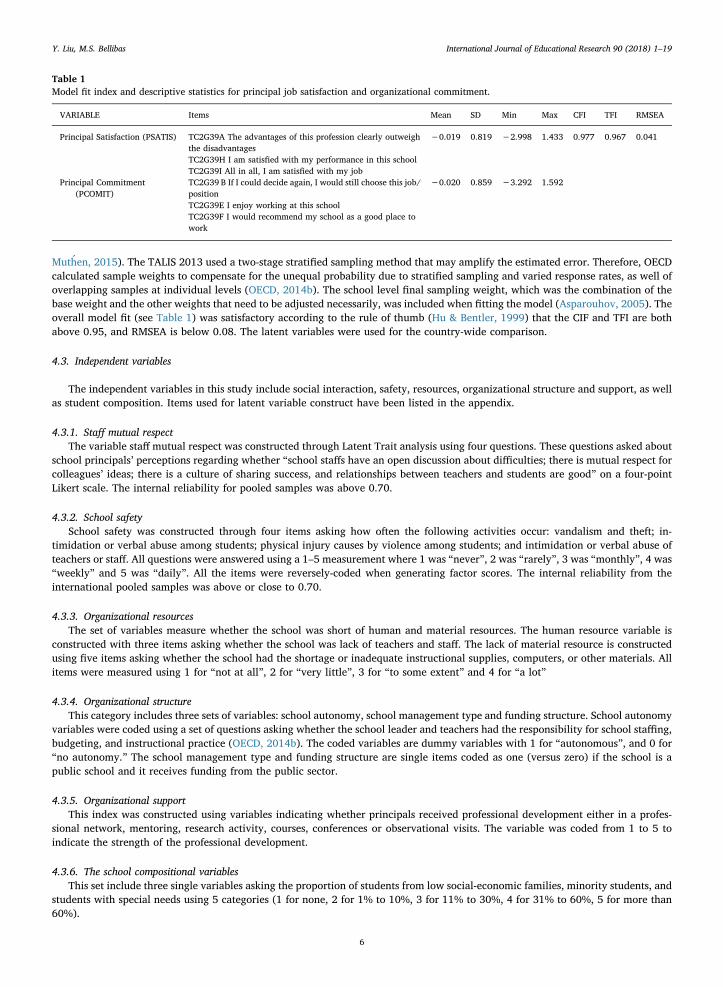
Muth́en, 2015). The TALIS 2013 used a two-stage stratified sampling method that may amplify the estimated error. Therefore, OECDcalculated sample weights to compensate for the unequal probability due to stratified sampling and varied response rates, as well ofoverlapping samples at individual levels (OECD, 2014b). The school level final sampling weight, which was the combination of thebase weight and the other weights that need to be adjusted necessarily, was included when fitting the model (Asparouhov, 2005). Theoverall model fit (see Table 1) was satisfactory according to the rule of thumb (Hu & Bentler, 1999) that the CIF and TFI are bothabove 0.95, and RMSEA is below 0.08. The latent variables were used for the country-wide comparison.
4.3. Independent variables
The independent variables in this study include social interaction, safety, resources, organizational structure and support, as wellas student composition. Items used for latent variable construct have been listed in the appendix.
4.3.1. Staff mutual respectThe variable staff mutual respect was constructed through Latent Trait analysis using four questions. These questions asked about
school principals’ perceptions regarding whether “school staffs have an open discussion about difficulties; there is mutual respect forcolleagues’ ideas; there is a culture of sharing success, and relationships between teachers and students are good” on a four-pointLikert scale. The internal reliability for pooled samples was above 0.70.
4.3.2. School safetySchool safety was constructed through four items asking how often the following activities occur: vandalism and theft; in-
timidation or verbal abuse among students; physical injury causes by violence among students; and intimidation or verbal abuse ofteachers or staff. All questions were answered using a 1–5 measurement where 1 was “never”, 2 was “rarely”, 3 was “monthly”, 4 was“weekly” and 5 was “daily”. All the items were reversely-coded when generating factor scores. The internal reliability from theinternational pooled samples was above or close to 0.70.
4.3.3. Organizational resourcesThe set of variables measure whether the school was short of human and material resources. The human resource variable is
constructed with three items asking whether the school was lack of teachers and staff. The lack of material resource is constructedusing five items asking whether the school had the shortage or inadequate instructional supplies, computers, or other materials. Allitems were measured using 1 for “not at all”, 2 for “very little”, 3 for “to some extent” and 4 for “a lot”
4.3.4. Organizational structureThis category includes three sets of variables: school autonomy, school management type and funding structure. School autonomy
variables were coded using a set of questions asking whether the school leader and teachers had the responsibility for school staffing,budgeting, and instructional practice (OECD, 2014b). The coded variables are dummy variables with 1 for “autonomous”, and 0 for“no autonomy.” The school management type and funding structure are single items coded as one (versus zero) if the school is apublic school and it receives funding from the public sector.
4.3.5. Organizational supportThis index was constructed using variables indicating whether principals received professional development either in a profes-
sional network, mentoring, research activity, courses, conferences or observational visits. The variable was coded from 1 to 5 toindicate the strength of the professional development.
4.3.6. The school compositional variablesThis set include three single variables asking the proportion of students from low social-economic families, minority students, and
students with special needs using 5 categories (1 for none, 2 for 1% to 10%, 3 for 11% to 30%, 4 for 31% to 60%, 5 for more than60%).
Table 1Model fit index and descriptive statistics for principal job satisfaction and organizational commitment.
VARIABLE Items Mean SD Min Max CFI TFI RMSEA
Principal Satisfaction (PSATIS) TC2G39A The advantages of this profession clearly outweighthe disadvantages
−0.019 0.819 −2.998 1.433 0.977 0.967 0.041
TC2G39H I am satisfied with my performance in this schoolTC2G39I All in all, I am satisfied with my job
Principal Commitment(PCOMIT)
TC2G39 B If I could decide again, I would still choose this job/position
−0.020 0.859 −3.292 1.592
TC2G39E I enjoy working at this schoolTC2G39F I would recommend my school as a good place towork
Y. Liu, M.S. Bellibas International Journal of Educational Research 90 (2018) 1–19
6
The control variables include a set of principal demographic information with two school variables as size and school location.The statistics are in Appendix
4.4. Data analysis
To answer the first research question, we first constructed latent variables for both JS and OC, thereafter, we applied ANOVA tocompare the extent of principals’ JS and OC across countries and continents.
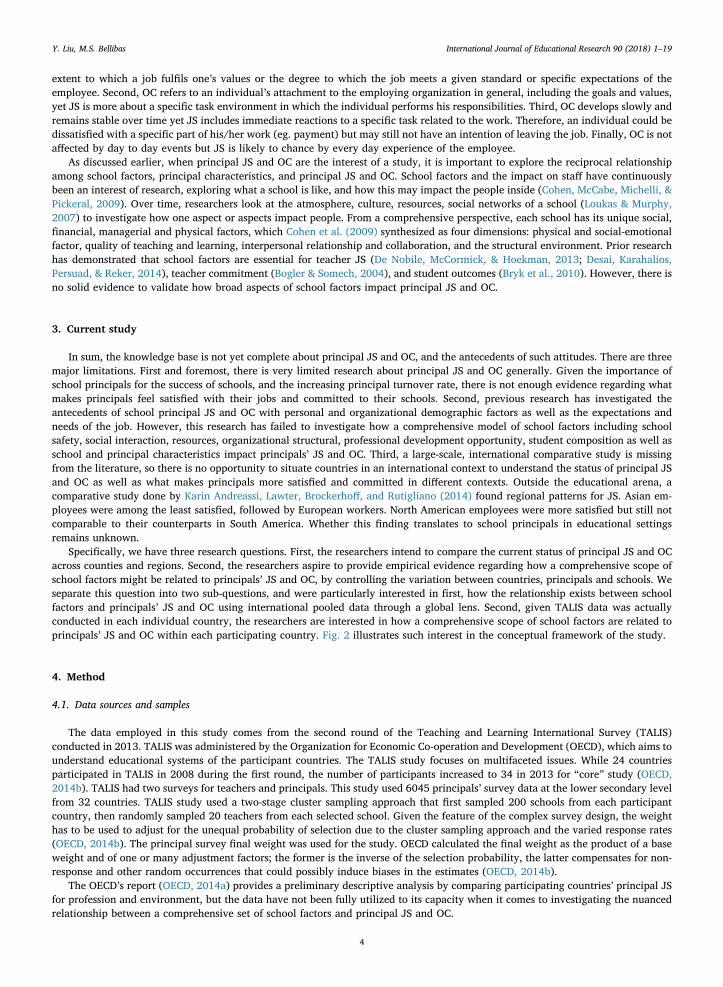
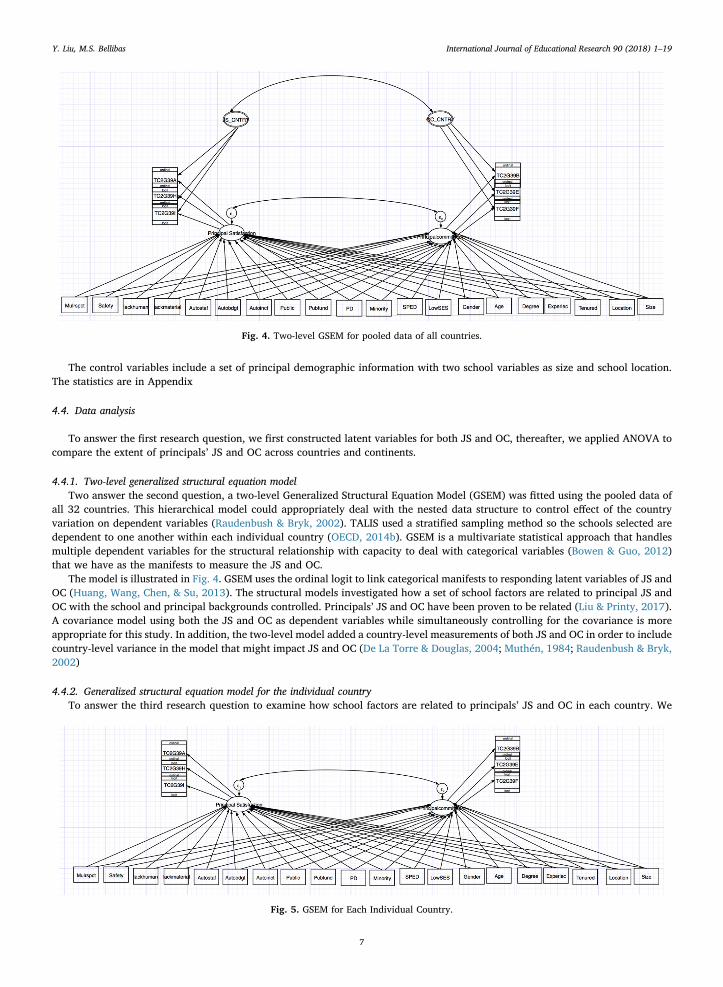
4.4.1. Two-level generalized structural equation modelTwo answer the second question, a two-level Generalized Structural Equation Model (GSEM) was fitted using the pooled data of
all 32 countries. This hierarchical model could appropriately deal with the nested data structure to control effect of the countryvariation on dependent variables (Raudenbush & Bryk, 2002). TALIS used a stratified sampling method so the schools selected aredependent to one another within each individual country (OECD, 2014b). GSEM is a multivariate statistical approach that handlesmultiple dependent variables for the structural relationship with capacity to deal with categorical variables (Bowen & Guo, 2012)that we have as the manifests to measure the JS and OC.
The model is illustrated in Fig. 4. GSEM uses the ordinal logit to link categorical manifests to responding latent variables of JS andOC (Huang, Wang, Chen, & Su, 2013). The structural models investigated how a set of school factors are related to principal JS andOC with the school and principal backgrounds controlled. Principals’ JS and OC have been proven to be related (Liu & Printy, 2017).A covariance model using both the JS and OC as dependent variables while simultaneously controlling for the covariance is moreappropriate for this study. In addition, the two-level model added a country-level measurements of both JS and OC in order to includecountry-level variance in the model that might impact JS and OC (De La Torre & Douglas, 2004; Muthén, 1984; Raudenbush & Bryk,2002)
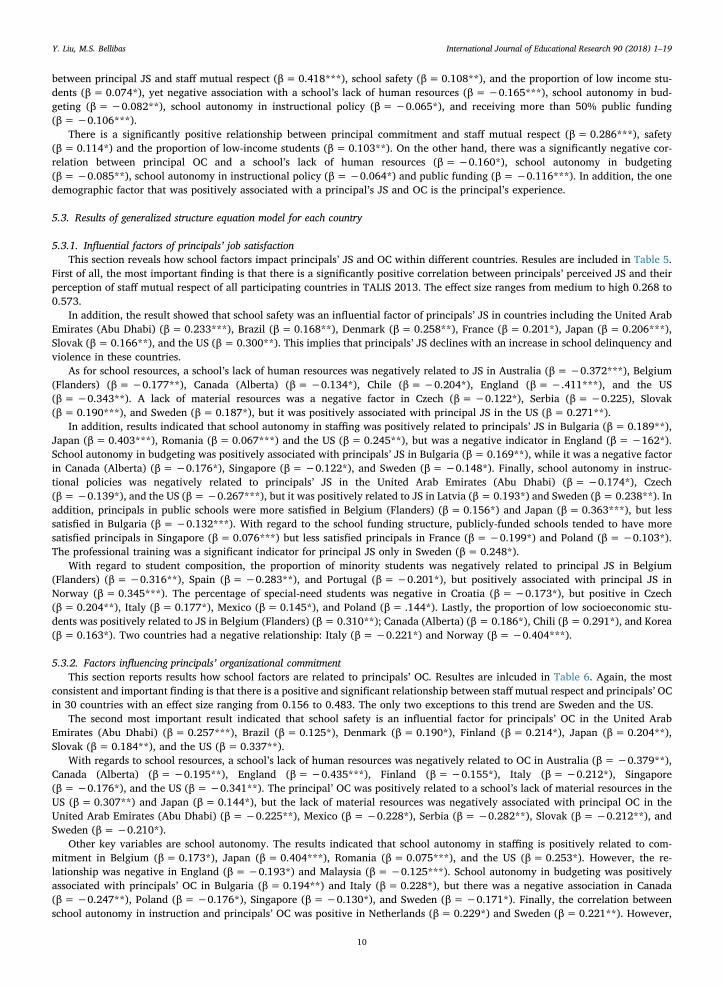
4.4.2. Generalized structural equation model for the individual countryTo answer the third research question to examine how school factors are related to principals’ JS and OC in each country. We
Fig. 4. Two-level GSEM for pooled data of all countries.
Fig. 5. GSEM for Each Individual Country.
Y. Liu, M.S. Bellibas International Journal of Educational Research 90 (2018) 1–19
7

applied single-level Generalized Structural Equation Modeling (GSEM) for each country (Fig. 5).
5. Findings
5.1. The variation of principals’ job satisfaction and organizational commitment
Our first interest was to compare principals’ JS and OC across participant countries. The ANOVA result indicated that there is asignificant difference for principals’ JS (F=21.06***) and OC (F=19.21***) across countries. On average, principals in Mexico,Australia, Chile, Israel, Malaysia, Singapore, and Denmark reported higher level of JS and OC. On the other hand, principals in Italy,Japan, Latvia, Estonia, France, Bulgaria, Croatia, and Serbia exhibited the lower level of JS and OC.
Table 2ANOVA Result for principals’ satisfaction and commitment comparison (32 countries).
Job Satisfaction Organizational Commitment
Country N mean sd se(mean) mean sd se(mean)
MEX 186 0.615 0.723 0.053 0.605 0.662 0.049AUS 109 0.397 0.752 0.072 0.439 0.721 0.069CHL 148 0.375 0.844 0.069 0.337 0.828 0.068MYS 145 0.372 0.833 0.069 0.296 0.687 0.057ISR 181 0.360 0.843 0.063 0.330 0.793 0.059SGP 142 0.33 0.855 0.072 0.301 0.782 0.066DNK 123 0.32 0.757 0.068 0.352 0.716 0.065CAB 173 0.292 0.833 0.063 0.115 0.829 0.063ESP 192 0.175 0.883 0.064 0.169 0.856 0.062ROU 195 0.126 0.840 0.060 −0.046 0.814 0.058ENG 150 0.124 0.917 0.075 0.150 0.918 0.075USA 98 0.113 0.840 0.085 0.185 0.820 0.083PRT 175 0.086 0.749 0.057 0.147 0.748 0.057AAD 128 0.024 0.977 0.086 −0.033 0.919 0.081NOR 106 0.023 0.730 0.071 0.072 0.72 0.07BRA 1050 −0.021 0.889 0.027 −0.065 0.831 0.026KOR 162 −0.038 0.991 0.078 −0.063 0.866 0.068FIN 146 −0.057 0.804 0.067 0.024 0.786 0.065BFL 151 −0.074 0.795 0.065 −0.045 0.801 0.065NLD 115 −0.111 0.790 0.074 0.010 0.734 0.068POL 187 −0.183 0.747 0.055 −0.155 0.724 0.053SVK 186 −0.209 0.685 0.050 −0.192 0.712 0.052CZE 220 −0.218 0.699 0.047 −0.137 0.707 0.048SWE 170 −0.229 0.778 0.060 −0.183 0.807 0.062SRB 185 −0.242 0.792 0.058 −0.300 0.800 0.059HRV 196 −0.257 0.781 0.056 −0.284 0.745 0.053BGR 197 −0.260 0.801 0.057 −0.307 0.785 0.056FRA 173 −0.267 0.811 0.062 −0.159 0.767 0.058ITA 194 −0.282 0.799 0.057 −0.179 0.759 0.054LVA 110 −0.282 0.664 0.063 −0.290 0.666 0.064EST 195 −0.297 0.716 0.051 −0.155 0.684 0.049JPN 192 −0.733 0.806 0.058 −0.645 0.754 0.054Total 6080 −0.02 0.859 0.011 −0.019 0.819 0.011One−way ANOVA F=21.06*** F=19.21***
Note.*** P < 0.001.
Table 3Principals’ satisfaction and commitment across five continents.
Job Satisfaction Organizational Commitment
Continent N mean sd se(mean) mean sd se(mean)
Oceania 109 0.397 0.752 0.072 0.439 0.721 0.069North America 271 0.227 0.838 0.051 0.141 0.825 0.05South America 1384 0.107 0.894 0.024 0.068 0.846 0.023Asia 950 0.023 0.972 0.032 0.008 0.877 0.028Europe 3366 −0.117 0.798 0.014 −0.09 0.783 0.013Total 6080 −0.02 0.859 0.011 −0.019 0.819 0.011
Y. Liu, M.S. Bellibas International Journal of Educational Research 90 (2018) 1–19
8

Table 2 displays that there is a substantial difference in principals’ JS and OC across the five continents. On average, the highestlevel of JS and OC is among principals in Oceania. Oceania is followed by North America and South America. The lowest level of JSand OC are found among European and Asian principals (Table 3).
5.2. Two-Level generalized structural equation model results for pooled data
We report the standardized coefficient, so the effect size is comparable as small(.1), medium(.3) or large (.5) (Jacob Cohen,Cohen, West, & Aiken, 2013). The results of the two-level GSEM in Table 4 indicated there was a significantly positive relationship
Table 4Two-Level GSEM Results.
PRINCIPAL JOB SATISFACTION PRINCIPAL ORGANIZATIONAL COMMITMENT
Independent VariableMutual respect and Collaboration 0.418*** 0.286***
Collaboration (0.014) (0.014)Safety 0.108** 0.114**
(0.013) (0.013)Lack_humanresource −0.165*** −0.160***
(0.016) (0.016)Lack_material 0.062 0.053
(0.023) (0.024)Autonomy_staff 0.065 0.072
(0.067) (0.072)Autonomy_budget −0.082** −0.085**
(0.072) (0.070)Autonomy_instructional policy −0.065* −0.064*
(0.054) (0.056)Public −0.033 −0.056
(0.069) (0.067)Publicfund −0.106*** −0.116***
(0.062) (0.062)PD 0.009 0.024
(0.027) (0.027)Minority −0.054 −0.037
(0.028) (0.027)SPED 0.034 0.034
(0.045) (0.044)LowSES 0.074* 0.103**
(0.023) (0.022)
Controlled VariablesLocation 0.064 0.078*
(0.021) (0.021)Size 0.121*** 0.121***
(0.000) (0.000)Gender 0.017 0.045
(0.051) (0.053)Age −0.014 0.027
(0.004) (0.004)Degree 0.023 0.026
(0.102) (0.110)Experience 0.122*** 0.115***
(0.004) (0.004)Tenured 0.039 0.049
(0.122) (0.120)(0.309) (0.308)
Variancevar(cntry) 0.040*
(0.020)var(e.PSATIS) 0.517***
(0.031)var(e.PCOMIT) 0.527***
(0.024)cov(e.PCOMITe.PSATIS) 0.489***
(0.026)N 4879
Note: Standardized beta coefficients, Standard errors in parentheses.
Y. Liu, M.S. Bellibas International Journal of Educational Research 90 (2018) 1–19
9
between principal JS and staff mutual respect (β=0.418***), school safety (β=0.108**), and the proportion of low income stu-dents (β=0.074*), yet negative association with a school’s lack of human resources (β=−0.165***), school autonomy in bud-geting (β=−0.082**), school autonomy in instructional policy (β=−0.065*), and receiving more than 50% public funding(β=−0.106***).
There is a significantly positive relationship between principal commitment and staff mutual respect (β=0.286***), safety(β=0.114*) and the proportion of low-income students (β=0.103**). On the other hand, there was a significantly negative cor-relation between principal OC and a school’s lack of human resources (β=−0.160*), school autonomy in budgeting(β=−0.085**), school autonomy in instructional policy (β=−0.064*) and public funding (β=−0.116***). In addition, the onedemographic factor that was positively associated with a principal’s JS and OC is the principal’s experience.
5.3. Results of generalized structure equation model for each country
5.3.1. Influential factors of principals’ job satisfactionThis section reveals how school factors impact principals’ JS and OC within different countries. Resules are included in Table 5.
First of all, the most important finding is that there is a significantly positive correlation between principals’ perceived JS and theirperception of staff mutual respect of all participating countries in TALIS 2013. The effect size ranges from medium to high 0.268 to0.573.
In addition, the result showed that school safety was an influential factor of principals’ JS in countries including the United ArabEmirates (Abu Dhabi) (β=0.233***), Brazil (β=0.168**), Denmark (β=0.258**), France (β=0.201*), Japan (β=0.206***),Slovak (β=0.166**), and the US (β=0.300**). This implies that principals’ JS declines with an increase in school delinquency andviolence in these countries.
As for school resources, a school’s lack of human resources was negatively related to JS in Australia (β=−0.372***), Belgium(Flanders) (β=−0.177**), Canada (Alberta) (β=−0.134*), Chile (β=−0.204*), England (β=−.411***), and the US(β=−0.343**). A lack of material resources was a negative factor in Czech (β=−0.122*), Serbia (β=−0.225), Slovak(β=0.190***), and Sweden (β=0.187*), but it was positively associated with principal JS in the US (β=0.271**).
In addition, results indicated that school autonomy in staffing was positively related to principals’ JS in Bulgaria (β=0.189**),Japan (β=0.403***), Romania (β=0.067***) and the US (β=0.245**), but was a negative indicator in England (β=−162*).School autonomy in budgeting was positively associated with principals’ JS in Bulgaria (β=0.169**), while it was a negative factorin Canada (Alberta) (β=−0.176*), Singapore (β=−0.122*), and Sweden (β=−0.148*). Finally, school autonomy in instruc-tional policies was negatively related to principals’ JS in the United Arab Emirates (Abu Dhabi) (β=−0.174*), Czech(β=−0.139*), and the US (β=−0.267***), but it was positively related to JS in Latvia (β=0.193*) and Sweden (β=0.238**). Inaddition, principals in public schools were more satisfied in Belgium (Flanders) (β=0.156*) and Japan (β=0.363***), but lesssatisfied in Bulgaria (β=−0.132***). With regard to the school funding structure, publicly-funded schools tended to have moresatisfied principals in Singapore (β=0.076***) but less satisfied principals in France (β=−0.199*) and Poland (β=−0.103*).The professional training was a significant indicator for principal JS only in Sweden (β=0.248*).
With regard to student composition, the proportion of minority students was negatively related to principal JS in Belgium(Flanders) (β=−0.316**), Spain (β=−0.283**), and Portugal (β=−0.201*), but positively associated with principal JS inNorway (β=0.345***). The percentage of special-need students was negative in Croatia (β=−0.173*), but positive in Czech(β=0.204**), Italy (β=0.177*), Mexico (β=0.145*), and Poland (β= .144*). Lastly, the proportion of low socioeconomic stu-dents was positively related to JS in Belgium (Flanders) (β=0.310**); Canada (Alberta) (β=0.186*), Chili (β=0.291*), and Korea(β=0.163*). Two countries had a negative relationship: Italy (β=−0.221*) and Norway (β=−0.404***).
5.3.2. Factors influencing principals’ organizational commitmentThis section reports results how school factors are related to principals’ OC. Resultes are inlcuded in Table 6. Again, the most
consistent and important finding is that there is a positive and significant relationship between staffmutual respect and principals’ OCin 30 countries with an effect size ranging from 0.156 to 0.483. The only two exceptions to this trend are Sweden and the US.
The second most important result indicated that school safety is an influential factor for principals’ OC in the United ArabEmirates (Abu Dhabi) (β=0.257***), Brazil (β=0.125*), Denmark (β=0.190*), Finland (β=0.214*), Japan (β=0.204**),Slovak (β=0.184**), and the US (β=0.337**).
With regards to school resources, a school’s lack of human resources was negatively related to OC in Australia (β=−0.379**),Canada (Alberta) (β=−0.195**), England (β=−0.435***), Finland (β=−0.155*), Italy (β=−0.212*), Singapore(β=−0.176*), and the US (β=−0.341**). The principal’ OC was positively related to a school’s lack of material resources in theUS (β=0.307**) and Japan (β=0.144*), but the lack of material resources was negatively associated with principal OC in theUnited Arab Emirates (Abu Dhabi) (β=−0.225**), Mexico (β=−0.228*), Serbia (β=−0.282**), Slovak (β=−0.212**), andSweden (β=−0.210*).
Other key variables are school autonomy. The results indicated that school autonomy in staffing is positively related to com-mitment in Belgium (β=0.173*), Japan (β=0.404***), Romania (β=0.075***), and the US (β=0.253*). However, the re-lationship was negative in England (β=−0.193*) and Malaysia (β=−0.125***). School autonomy in budgeting was positivelyassociated with principals’ OC in Bulgaria (β=0.194**) and Italy (β=0.228*), but there was a negative association in Canada(β=−0.247**), Poland (β=−0.176*), Singapore (β=−0.130*), and Sweden (β=−0.171*). Finally, the correlation betweenschool autonomy in instruction and principals’ OC was positive in Netherlands (β=0.229*) and Sweden (β=0.221**). However,
Y. Liu, M.S. Bellibas International Journal of Educational Research 90 (2018) 1–19
10
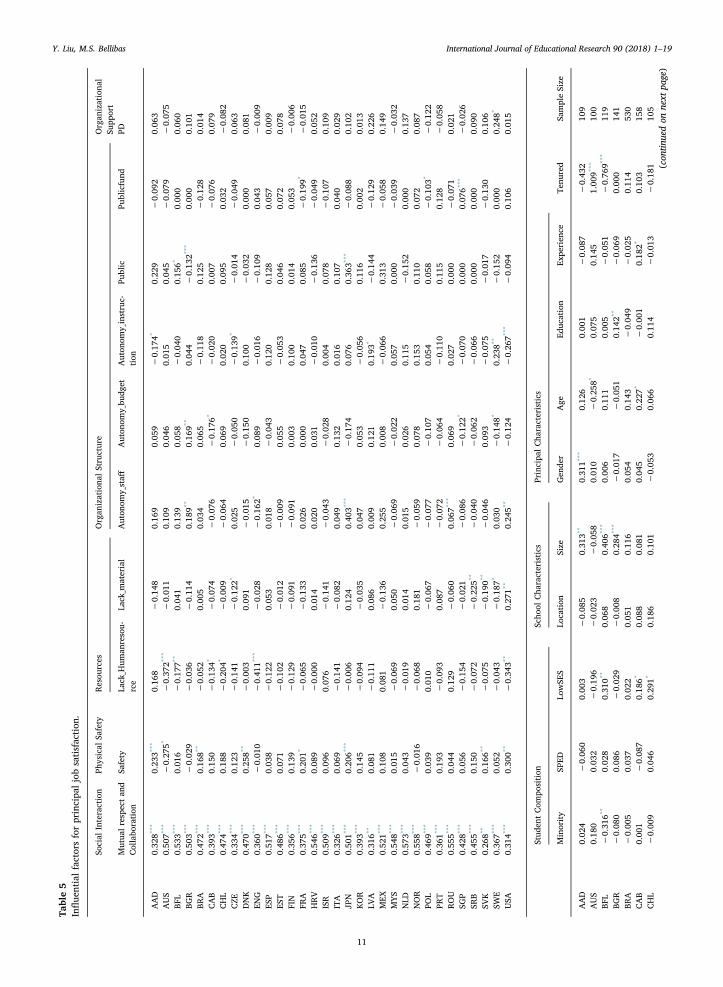
Table5
Influe
ntialfactorsforprincipa
ljobsatisfaction
.
Social
Interaction
Physical
Safety
Resou
rces
Organ
izationa
lStructure
Organ
izationa
lSu
pport
Mutua
lrespectan
dCollabo
ration
Safety
Lack_H
uman
resou-
rce
Lack_m
aterial
Auton
omy_staff
Auton
omy_bu
dget
Auton
omy_instruc-
tion
Public
Publicfund
PD
AAD
0.32
8***
0.23
3***
0.16
8−
0.14
80.16
90.05
9−
0.17
4*0.22
9−
0.09
20.06
3AUS
0.50
7***
−0.27
5*−0.37
2***
−0.01
10.10
90.04
60.01
50.04
5−
0.07
9−0.07
5BF
L0.53
3***
0.01
6−0.17
7**
0.04
10.13
90.05
8−
0.04
00.15
6*0.00
00.06
0BG
R0.50
3***
−0.02
9−0.03
6−
0.11
40.18
9**
0.16
9**
0.04
4−
0.13
2***
0.00
00.10
1BR
A0.47
2***
0.16
8**
−0.05
20.00
50.03
40.06
5−
0.11
80.12
5−
0.12
80.01
4CAB
0.39
3***
0.15
0−0.13
4*−
0.07
4−
0.07
6−0.17
6*−
0.02
00.00
7−
0.07
60.07
9CHL
0.47
4***
0.18
8−0.20
4*−
0.00
9−
0.06
40.06
90.02
00.09
50.03
2−0.08
2CZE
0.33
4***
0.12
3−0.14
1−
0.12
2*0.02
5−0.05
0−
0.13
9*−
0.01
4−
0.04
90.06
3DNK
0.47
0***
0.25
8**
−0.00
30.09
1−
0.01
5−0.15
00.10
0−
0.03
20.00
00.08
1EN
G0.36
0***
−0.01
0−0.41
1***
−0.02
8−
0.16
2*0.08
9−
0.01
6−
0.10
90.04
3−0.00
9ES
P0.51
7***
0.03
8−0.12
20.05
30.01
8−0.04
30.12
00.12
80.05
70.00
9ES
T0.48
6***
0.07
1−0.10
2−
0.01
2−
0.00
90.05
5−
0.05
30.04
60.07
20.07
8FIN
0.35
6***
0.13
9−0.12
9−
0.09
1−
0.09
10.00
30.10
00.01
40.05
3−0.00
6FR
A0.37
5***
0.20
1*−0.06
5−
0.13
30.02
60.00
00.04
70.08
5−
0.19
9*−0.01
5HRV
0.54
6***
0.08
9−0.00
00.01
40.02
00.03
1−
0.01
0−
0.13
6−
0.04
90.05
2ISR
0.50
9***
0.09
60.07
6−
0.14
1−
0.04
3−0.02
80.00
40.07
8−
0.10
70.10
9ITA
0.32
6***
0.06
9−0.14
1−
0.08
20.04
90.13
20.01
60.10
70.04
00.02
9JP
N0.50
1***
0.20
6***
−0.00
60.12
40.40
3***
−0.17
40.07
60.36
3***
−0.08
80.10
2KOR
0.39
3***
0.14
5−0.09
4−
0.03
50.04
70.05
3−
0.05
60.11
60.00
20.01
3LV
A0.31
6**
0.08
1−0.11
10.08
60.00
90.12
10.19
3*−
0.14
4−
0.12
90.22
6MEX
0.52
1***
0.10
80.08
1−
0.13
60.25
50.00
8−
0.06
60.31
3−
0.05
80.14
9MYS
0.54
8***
0.01
5−0.06
90.05
0−
0.06
9−0.02
20.05
70.00
0−
0.03
9−0.03
2NLD
0.57
3***
0.04
3−0.01
90.01
40.01
50.02
60.11
5−
0.15
20.00
00.13
7NOR
0.55
8***
−0.01
6−0.06
80.18
1−
0.05
90.07
80.15
30.11
00.07
20.08
7PO
L0.46
9***
0.03
90.01
0−
0.06
7−
0.07
7−0.10
70.05
40.05
8−
0.10
3*−0.12
2PR
T0.36
1***
0.19
3−0.09
30.08
7−
0.07
2−0.06
4−
0.11
00.11
50.12
8−0.05
8ROU
0.55
5***
0.04
40.12
9−
0.06
00.06
7***
0.06
90.02
70.00
0−
0.07
10.02
1SG
P0.42
8***
0.05
6−0.15
4−
0.02
1−
0.08
6−0.12
2*−
0.07
00.00
00.07
6***
−0.02
6SR
B0.45
5***
0.15
0−0.07
2−
0.22
5**
−0.04
0−0.06
2−
0.06
60.00
00.00
00.09
0SV
K0.26
8**
0.16
6**
−0.07
5−
0.19
0**
−0.04
60.09
3−
0.07
5−
0.01
7−
0.13
00.10
6SW
E0.36
7***
0.05
2−0.04
3−
0.18
7*0.03
0−0.14
8*0.23
8**
−0.15
20.00
00.24
8*
USA
0.31
4***
0.30
0**
−0.34
3**
0.27
1**
0.24
5**
−0.12
4−
0.26
7***
−0.09
40.10
60.01
5
Stud
entCom
position
Scho
olCha
racteristics
Principa
lCha
racteristics
Minority
SPED
LowSE
SLo
cation
Size
Gen
der
Age
Educ
ation
Expe
rien
ceTe
nured
SampleSize
AAD
0.02
4−0.06
00.00
3−0.08
50.31
3**
0.31
1***
0.12
60.00
1−0.08
7−
0.43
210
9AUS
0.18
00.03
2−
0.19
6−0.02
3−
0.05
80.01
0−0.25
8*0.07
50.14
51.00
9***
100
BFL
−0.31
6**
0.02
80.31
0**
0.06
80.40
6***
0.00
60.11
10.00
5−0.05
1−
0.76
9***
119
BGR
−0.08
00.08
6−
0.02
9−0.00
80.28
4***
−0.01
7−0.05
10.14
2**
−0.06
90.00
014
1BR
A−0.00
50.03
70.02
20.05
10.11
60.05
40.14
3−
0.04
9−0.02
50.11
453
0CAB
0.00
1−0.08
70.18
6*0.08
80.08
10.04
50.22
7*−
0.00
10.18
2*0.10
315
8CHL
−0.00
90.04
60.29
1*0.18
60.10
1−0.05
30.06
60.11
4−0.01
3−
0.18
110
5(con
tinuedon
next
page)
Y. Liu, M.S. Bellibas International Journal of Educational Research 90 (2018) 1–19
11
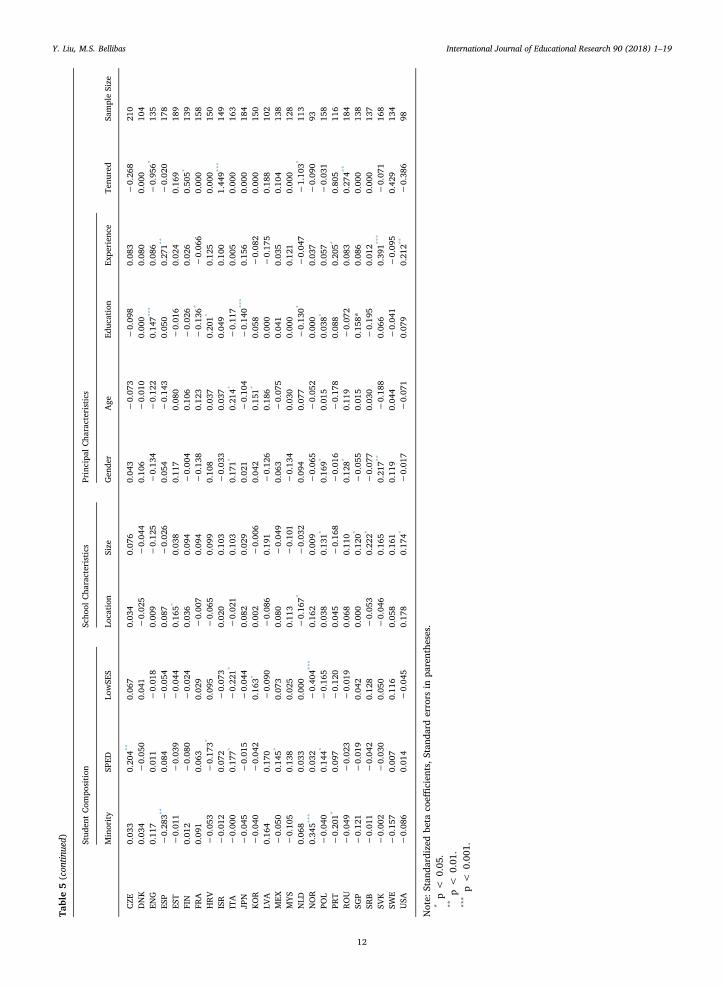
Table5(con
tinued) Stud
entCom
position
Scho
olCha
racteristics
Principa
lCha
racteristics
Minority
SPED
LowSE
SLo
cation
Size
Gen
der
Age
Educ
ation
Expe
rien
ceTe
nured
SampleSize
CZE
0.03
30.20
4**
0.06
70.03
40.07
60.04
3−0.07
3−
0.09
80.08
3−
0.26
821
0DNK
0.03
4−0.05
00.04
1−0.02
5−
0.04
40.10
6−0.01
00.00
00.08
00.00
010
4EN
G0.11
70.01
1−
0.01
80.00
9−
0.12
5−0.13
4−0.12
20.14
7***
0.08
6−
0.95
6*13
5ES
P−0.28
3**
0.08
4−
0.05
40.08
7−
0.02
60.05
4−0.14
30.05
00.27
1**
−0.02
017
8ES
T−0.01
1−0.03
9−
0.04
40.16
5*0.03
80.11
70.08
0−
0.01
60.02
40.16
918
9FIN
0.01
2−0.08
0−
0.02
40.03
60.09
4−0.00
40.10
6−
0.02
60.02
60.50
5*13
9FR
A0.09
10.06
30.02
9−0.00
70.09
4−0.13
80.12
3−
0.13
6*−0.06
60.00
015
8HRV
−0.05
3−0.17
3*0.09
5−0.06
50.09
90.10
80.03
70.20
1*0.12
50.00
015
0ISR
−0.01
20.07
2−
0.07
30.02
00.10
3−0.03
30.03
70.04
90.10
01.44
9***
149
ITA
−0.00
00.17
7*−
0.22
1*−0.02
10.10
30.17
1*0.21
4*−
0.11
70.00
50.00
016
3JP
N−0.04
5−0.01
5−
0.04
40.08
20.02
90.02
1−0.10
4−
0.14
0***
0.15
60.00
018
4KOR
−0.04
0−0.04
20.16
3*0.00
2−
0.00
60.04
20.15
1*0.05
8−0.08
20.00
015
0LV
A0.16
40.17
0−
0.09
0−0.08
60.19
1−0.12
60.18
60.00
0−0.17
50.18
810
2MEX
−0.05
00.14
5*0.07
30.08
0−
0.04
90.06
3−0.07
50.04
10.03
50.10
413
8MYS
−0.10
50.13
80.02
50.11
3−
0.10
1−0.13
40.03
00.00
00.12
10.00
012
8NLD
0.06
80.03
30.00
0−0.16
7*−
0.03
20.09
40.07
7−
0.13
0*−0.04
7−
1.10
3*11
3NOR
0.34
5***
0.03
2−
0.40
4***
0.16
20.00
9−0.06
5−0.05
20.00
00.03
7−
0.09
093
POL
−0.04
00.14
4*−
0.16
50.03
80.13
1*0.16
9*0.01
50.03
8*0.05
7−
0.03
115
8PR
T−0.20
1*0.09
7−
0.12
00.04
5−
0.16
8−0.01
6−0.17
80.08
80.20
5*0.80
511
6ROU
−0.04
9−0.02
3−
0.01
90.06
80.11
00.12
8*0.11
9−
0.07
20.08
30.27
4**
184
SGP
−0.12
1−0.01
90.04
20.00
00.12
0*−0.05
50.01
50.15
8*0.08
60.00
013
8SR
B−0.01
1−0.04
20.12
8−0.05
30.22
2*−0.07
70.03
0−
0.19
50.01
20.00
013
7SV
K−0.00
2−0.03
00.05
0−0.04
60.16
50.21
7**
−0.18
80.06
60.39
1***
−0.07
116
8SW
E−0.15
70.00
70.11
60.05
80.16
10.11
90.04
4−
0.04
1−0.09
50.42
913
4USA
−0.08
60.01
4−
0.04
50.17
80.17
4*−0.01
7−0.07
10.07
90.21
2**
−0.38
698
Note:
Stan
dardized
beta
coeffi
cien
ts,S
tand
arderrors
inpa
renthe
ses.
*p<
0.05
.**
p<
0.01
.***p<
0.00
1.
Y. Liu, M.S. Bellibas International Journal of Educational Research 90 (2018) 1–19
12
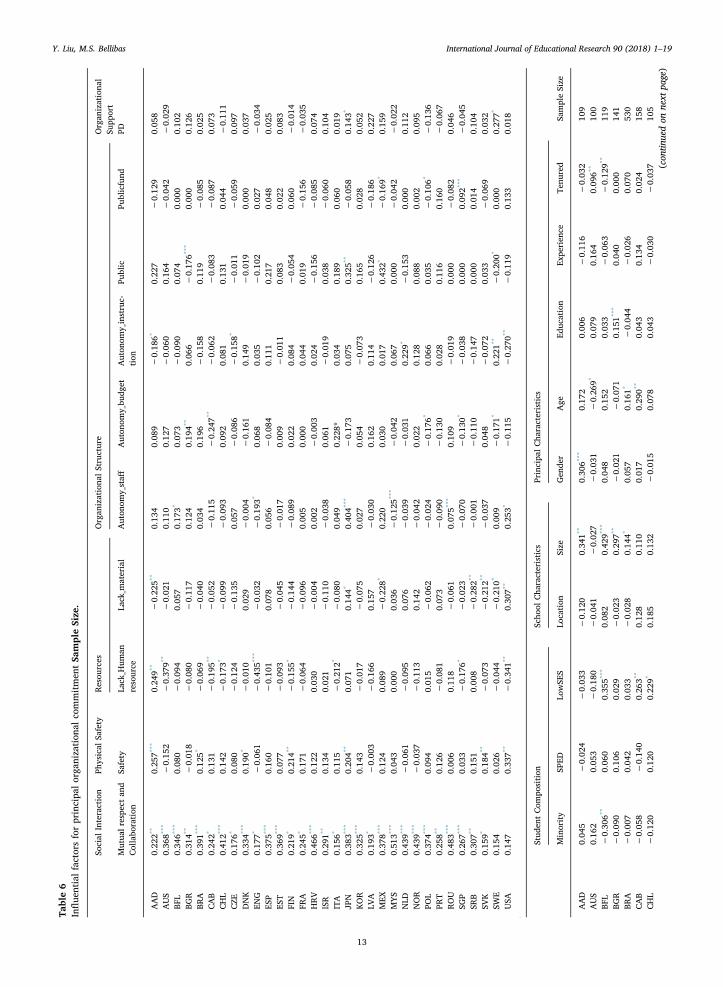
Table6
Influe
ntialfactorsforprincipa
lorga
nization
alco
mmitmen
tSa
mpleSize
.
Social
Interaction
Physical
Safety
Resou
rces
Organ
izationa
lStructure
Organ
izationa
lSu
pport
Mutua
lrespectan
dCollabo
ration
Safety
Lack_H
uman
resource
Lack_m
aterial
Auton
omy_staff
Auton
omy_bu
dget
Auton
omy_instruc-
tion
Public
Publicfund
PD
AAD
0.22
2**
0.25
7***
0.24
9**
−0.22
5**
0.13
40.08
9−
0.18
6*0.22
7−
0.12
90.05
8AUS
0.36
8***
−0.15
2−
0.37
9**
−0.02
10.11
00.12
7−
0.06
00.16
4−
0.04
2−0.02
9BF
L0.34
6***
0.08
0−
0.09
40.05
70.17
3*0.07
3−
0.09
00.07
40.00
00.10
2BG
R0.31
4**
−0.01
8−
0.08
0−0.11
70.12
40.19
4**
0.06
6−0.17
6***
0.00
00.12
6BR
A0.39
1***
0.12
5*−
0.06
9−0.04
00.03
40.19
6−
0.15
80.11
9−
0.08
50.02
5CAB
0.24
2*0.13
1−
0.19
5**
−0.05
2−0.11
5−
0.24
7**
−0.06
2−0.08
3−
0.08
70.07
3CHL
0.41
2***
0.14
2−
0.17
3*−0.09
9−0.09
30.09
20.08
10.13
10.04
4−0.11
1CZE
0.17
6*0.08
0−
0.12
4−0.13
50.05
7−
0.08
6−
0.15
8*−0.01
1−
0.05
90.09
7DNK
0.33
4***
0.19
0*−
0.01
00.02
9−0.00
4−
0.16
10.14
9−0.01
90.00
00.03
7EN
G0.17
7*−0.06
1−
0.43
5***
−0.03
2−0.19
3*0.06
80.03
5−0.10
20.02
7−0.03
4ES
P0.37
5***
0.16
0−
0.10
10.07
80.05
6−
0.08
40.11
10.21
70.04
80.02
5ES
T0.36
9***
0.07
7−
0.09
3−0.04
5−0.01
70.00
9−
0.01
10.08
30.02
20.08
3FIN
0.21
9*0.21
4**
−0.15
5*−0.14
4−0.08
90.02
20.08
4−0.05
40.06
0−0.01
4FR
A0.24
5*0.17
1−
0.06
4−0.09
60.00
50.00
00.04
40.01
9−
0.15
6−0.03
5HRV
0.46
6***
0.12
20.03
0−0.00
40.00
2−
0.00
30.02
4−0.15
6−
0.08
50.07
4ISR
0.29
1**
0.13
40.02
1−0.11
0−0.03
80.06
1−
0.01
90.03
8−
0.06
00.10
4ITA
0.15
6*0.11
5−
0.21
2*−0.08
00.04
90.22
8*0.03
40.18
90.06
00.01
9JP
N0.38
3***
0.20
4**
0.07
10.14
4*0.40
4***
−0.17
30.07
50.32
5**
−0.05
80.14
3*
KOR
0.32
5***
0.14
3−
0.01
7−0.07
50.02
70.05
4−
0.07
30.16
50.02
80.05
2LV
A0.19
3*−0.00
3−
0.16
60.15
7−0.03
00.16
20.11
4−0.12
6−
0.18
60.22
7MEX
0.37
8***
0.12
40.08
9−0.22
8*0.22
00.03
00.01
70.43
2*−
0.16
9*0.15
9MYS
0.51
3***
0.04
30.00
00.03
6−0.12
5***
−0.04
20.06
70.00
0−
0.04
2−0.02
2NLD
0.43
9***
−0.06
1−
0.09
50.07
6−0.03
9−
0.03
10.22
9*−0.15
30.00
00.11
2NOR
0.43
9***
−0.03
7−
0.11
30.14
2−0.04
20.02
20.12
80.08
80.00
20.09
5PO
L0.37
4***
0.09
40.01
5−0.06
2−0.02
4−
0.17
6*0.06
60.03
5−
0.10
6*−0.13
6PR
T0.25
8**
0.12
6−
0.08
10.07
3−0.09
0−
0.13
00.02
80.11
60.16
0−0.06
7ROU
0.48
3***
0.00
60.11
8−0.06
10.07
5***
0.10
9−
0.01
90.00
0−
0.08
20.04
6SG
P0.26
7***
0.03
3−
0.17
6*−0.02
3−0.07
0−
0.13
0*−
0.03
80.00
00.09
2***
−0.04
5SR
B0.30
7**
0.15
10.00
8−0.28
2**
−0.00
1−
0.11
0−
0.14
70.00
00.01
40.10
4SV
K0.15
9*0.18
4**
−0.07
3−0.21
2**
−0.03
70.04
8−
0.07
20.03
3−
0.06
90.03
2SW
E0.15
40.02
6−
0.04
4−0.21
0*0.00
9−
0.17
1*0.22
1**
−0.20
0*0.00
00.27
7*
USA
0.14
70.33
7**
−0.34
1**
0.30
7**
0.25
3*−
0.11
5−
0.27
0**
−0.11
90.13
30.01
8
Stud
entCom
position
Scho
olCha
racteristics
Principa
lCha
racteristics
Minority
SPED
LowSE
SLo
cation
Size
Gen
der
Age
Educ
ation
Expe
rien
ceTe
nured
SampleSize
AAD
0.04
5−0.02
4−0.03
3−0.12
00.34
1**
0.30
6***
0.17
20.00
6−
0.11
6−
0.03
210
9AUS
0.16
20.05
3−0.18
0−0.04
1−0.02
7−0.03
1−
0.26
9*0.07
90.16
40.09
6**
100
BFL
−0.30
6**
0.06
00.35
5***
0.08
20.42
9***
0.04
80.15
20.03
3−
0.06
3−
0.12
9**
119
BGR
−0.09
00.10
60.02
9−0.02
30.29
7**
−0.02
1−
0.07
10.15
1***
0.04
00.00
014
1BR
A−0.00
70.04
20.03
3−0.02
80.14
4*0.05
70.16
1*−
0.04
4−
0.02
60.07
053
0CAB
−0.05
8−0.14
00.26
3**
0.12
80.11
00.01
70.29
0**
0.04
30.13
40.02
415
8CHL
−0.12
00.12
00.22
9*0.18
50.13
2−0.01
50.07
80.04
3−
0.03
0−
0.03
710
5(con
tinuedon
next
page)
Y. Liu, M.S. Bellibas International Journal of Educational Research 90 (2018) 1–19
13
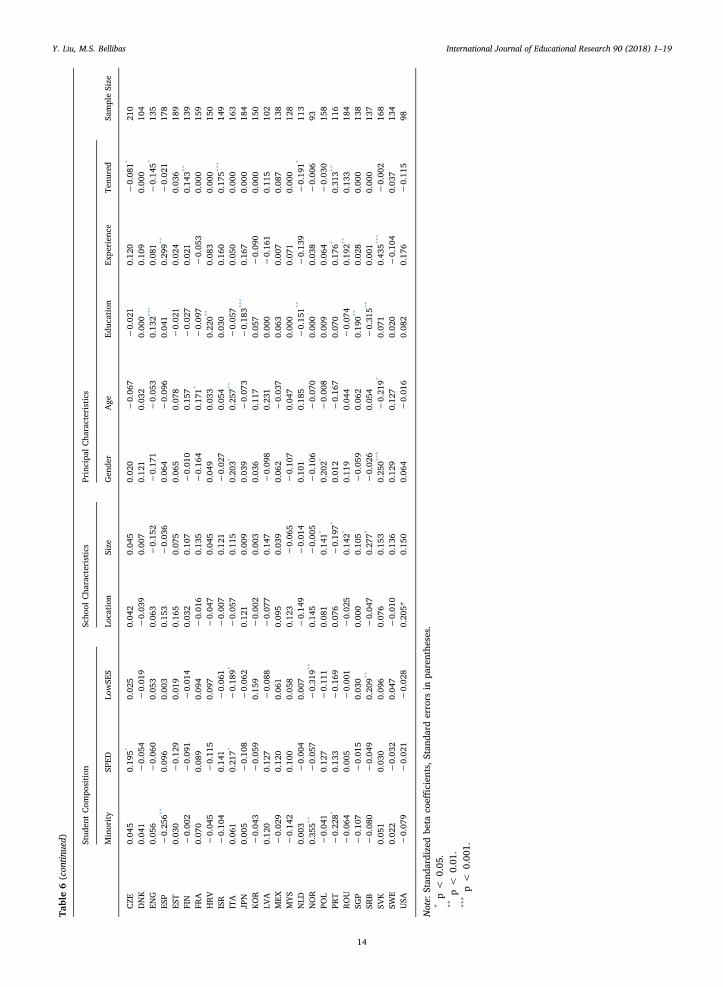
Table6(con
tinued) Stud
entCom
position
Scho
olCha
racteristics
Principa
lCha
racteristics
Minority
SPED
LowSE
SLo
cation
Size
Gen
der
Age
Educ
ation
Expe
rien
ceTe
nured
SampleSize
CZE
0.04
50.19
5*0.02
50.04
20.04
50.02
0−0.06
7−0.02
10.12
0−
0.08
1*21
0DNK
0.04
1−0.05
4−0.01
9−0.03
90.00
70.12
10.03
20.00
00.10
90.00
010
4EN
G0.05
6−0.06
00.05
30.06
3−0.15
2−0.17
1−0.05
30.13
2***
0.08
1−
0.14
5*13
5ES
P−
0.25
6**
0.09
60.00
30.15
3−0.03
60.06
4−0.09
60.04
10.29
9**
−0.02
117
8ES
T0.03
0−0.12
90.01
90.16
50.07
50.06
50.07
8−0.02
10.02
40.03
618
9FIN
−0.00
2−0.09
1−0.01
40.03
20.10
7−0.01
00.15
7−0.02
70.02
10.14
3**
139
FRA
0.07
00.08
90.09
4−0.01
60.13
5−0.16
40.17
1*−0.09
7−
0.05
30.00
015
9HRV
−0.04
5−0.11
50.09
7−0.04
70.04
50.04
90.03
30.22
0**
0.08
30.00
015
0ISR
−0.10
40.14
1−0.06
1−0.00
70.12
1−0.02
70.05
40.03
00.16
00.17
5***
149
ITA
0.06
10.21
7*−0.18
9*−0.05
70.11
50.20
3*0.25
7**
−0.05
70.05
00.00
016
3JP
N0.00
5−0.10
8−0.06
20.12
10.00
90.03
9−0.07
3−0.18
3***
0.16
70.00
018
4KOR
−0.04
3−0.05
90.15
9−0.00
20.00
30.03
60.11
70.05
7−
0.09
00.00
015
0LV
A0.12
00.12
7−0.08
8−0.07
70.14
7−0.09
80.23
10.00
0−
0.16
10.11
510
2MEX
−0.02
90.12
00.06
10.09
50.03
90.06
2−0.03
70.06
30.00
70.08
713
8MYS
−0.14
20.10
00.05
80.12
3−0.06
5−0.10
70.04
70.00
00.07
10.00
012
8NLD
0.00
3−0.00
40.00
7−0.14
9−0.01
40.10
10.18
5−0.15
1**
−0.13
9−
0.19
1*11
3NOR
0.35
5**
−0.05
7−0.31
9**
0.14
5−0.00
5−0.10
6−0.07
00.00
00.03
8−
0.00
693
POL
−0.04
10.12
7−0.11
10.08
10.14
1*0.20
2*−0.00
80.00
90.06
4−
0.03
015
8PR
T−
0.22
8*0.13
3−0.16
90.07
6−0.19
7*0.01
2−0.16
70.07
00.17
6*0.31
3**
116
ROU
−0.06
40.00
5−0.00
1−0.02
50.14
2*0.11
90.04
4−0.07
40.19
2**
0.13
318
4SG
P−
0.10
7−0.01
50.03
00.00
00.10
5−0.05
90.06
20.19
0**
0.02
80.00
013
8SR
B−
0.08
0−0.04
90.20
9**
−0.04
70.27
7*−0.02
60.05
4−0.31
5**
0.00
10.00
013
7SV
K0.05
10.03
00.09
60.07
60.15
30.25
0***
−0.21
9*0.07
10.43
5***
−0.00
216
8SW
E0.02
2−0.03
20.04
7−0.01
00.13
60.12
90.12
70.02
0−
0.10
40.03
713
4USA
−0.07
9−0.02
1−0.02
80.20
5*0.15
00.06
4−0.01
60.08
20.17
6−
0.11
598
Note:
Stan
dardized
beta
coeffi
cien
ts,S
tand
arderrors
inpa
renthe
ses.
*p<
0.05
.**
p<
0.01
.***p<
0.00
1.
Y. Liu, M.S. Bellibas International Journal of Educational Research 90 (2018) 1–19
14

school autonomy in instructional policies was negatively related to principals’ OC in the United Arab Emirates (Abu Dhabi)(β=−0.186*), Czech (β=−0.158*) and the US (β=−0.270**).
In addition, principals in public schools were more committed to their schools in Japan (β=0.325**) and Mexico (β=0.432*),but less committed in Bulgaria (β=−0.176***) and Sweden (β=−0.200*). Publicly-funded schools had more committed prin-cipals in Singapore (β=0.092***) but less committed principals in Mexico (β=−0.169*) and Poland (β=−0.106*).Organizational development opportunity was a positive indicator for principal OC in Japan (β=0.143*) and Sweden (β=0.277*).
When it came to student demographics, the proportion of minority students was a positive factor in Norway (β=0.355**), butnegatively related to principal OC in Belgium (Flanders) (β=−.306**), Spain (β=−0.256**) and Portugal (β=−0.228*). Thepercentage of special-need students was positively related to principal OC in Czech (β=0.195**) and Italy (β=0.217*). Lastly, thecomposition of low social-economic students was positively associated with principals’ OC in Belgium (Flanders) (β=0.355***);Canada (Alberta) (β=0.263**), Chili (β=0.229*), and Serbia (β=0.209**). Two countries exhibited a negative relationship: Italy(β=−0.189*) and Norway (β=−0.319**).
6. Discussion
The present research has the interest in comparing principal JS and OC across countries and continents, and investigating howschool factors impact principal JS and OC globally and in each country. School improvement research has indicated that leadership isthe second most important school-related factor influencing school success, after teachers (Leithwood, Louis, Anderson, & Wahlstrom,2004). The recruitment and retention of effective school principals depend substantially on the extent to which they are satisfied withand committed to their job and schools (Fraser & Brock, 2013).
The findings of the study indicated that compared to their peers in Oceania, South American, North American, European, andAsian principals (especially principals in Japan, Latvia, Italy, France and Estonia) exhibited the lowest JS and/or OC, which iscompatible with existing research (Karin Andreassi et al., 2014) finding that Asian employees were the least satisfied.
The results revealed that the most important factor accounting for variation in principal JS and OC is staff mutual respect. Theeffect is positive and significant in all participant countries for JS and 30/32 countries for OC. Therefore, a principal’s JS and OC isassociated significantly with the social interactions and the relationship among staff. This suggests the importance of a positive schoolclimate, especially a respectful and collaborative relationship among staff and students, which is consistent with prior research thatrevealed the same importance of positive social relationships for teachers (De Nobile et al., 2013; Desai et al., 2014).
In several countries or regions, including Abu Dhabi, Brazil, Denmark, Finland, Japan, Slovakia, and the United States, the level ofschool safety also appeared to be relevant to principals’ OC and JS. More specifically, while principals in all countries are more likelyto be committed to and satisfied with their job when positive social relationship among staff is evident, principals in these countriesare also more likely to be committed to and satisfied with their job when their school is a safe place. This finding emphasizes theimportance of what Bryk et al. (2010) addressed in their Chicago Study-that a school has to possess a safe and orderly structure tohelp build organizational capacity.
As to the other factors investigated in this research, school human resource is a determining factor as the lack of human resourcewas negatively associated with principals’ JS and OC. Such finding is not surprising as human capital is the most important element inbuilding organizational capacity (Dimmock, 2013; Tutt & Williams, 2012) and student achievement (DuFour & Mattos, 2013). Inaddition, this finding is extended to the positive effect of school autonomy in staffing on JS and OC. The previous evidence (Markowet al., 2013) supported that principals rate a lack of control over school staffing as the main reason for job dissatisfaction. Theautonomy for staffing has been viewed by principals as the essential pathway for building strong school human capital (Dimmock,2012). On the other hand, autonomy in budgeting and instructional policies are less likely to be the positive influences on JS and OC.This indicates that dealing with budgeting, fundraising, and instructional management is challenging for principals.
As to school management type and funding resources, the results are mixed. Principals have higher JS and OC in public andpublicly-funded schools in some countries while opposite results were found in other countries. This finding is partially reflected bythe challenges and difficulties public school principals might face in different contexts. When linked with the finding of the negativeeffect of budgeting autonomy, this discussion could be extended to whether sufficient school funding and resources is a key variablefor principal attitudes, partially due to the fact that public schools tend to face more funding challenges (Harding & Kershner, 2015;Mestry & Ndhlovu, 2014).
School composition appeared as an important factor predicting principal JS and OC. That is, principals working in schools with ahigher proportion of minority students are less likely to be satisfied and committed. Diverse schools are more likely to struggle withunderachievement, high teacher turnover (Simon & Johnson, 2015), and disciplinary issues (Gregory, Skiba, & Noguera, 2010).However, it is interesting to note that the proportion of low socioeconomic students is positively related to principals’ JS and OC,which suggests further research is needed to explore the emotional status of the principal serving low-income kids. A connection withstudents and schools, and a high level of normative commitment, might be reasons for them to remain in a disadvantaged school.
7. Conclusion
The principal is an indispensable ingredient for school success. Therefore, principal JS and OC are extremely important in assuringschool achievement (Leithwood & Seashore-Louis, 2011; Yousef, 2017). However, there is very limited research evidence regardingthe topic. This current study is therefore valuable in that it addresses the gaps by drawing on comparative cross-national data,situating each country in an international context to explore variations in principal JS and OC, and developing a framework of a
Y. Liu, M.S. Bellibas International Journal of Educational Research 90 (2018) 1–19
15

comprehensive set of school factors that impact JS and OC.The present study suggests the existence of significant variations among individual countries and regions. Such evidence is
important for the countries struggling with high principal turnover and burnout. More importantly, this research provides evidenceabout what school factors are related to the low level of satisfaction and commitment. Moving forward from previous research thatfocuses on working conditions and student populations (Ni, Sun, & Rorrer, 2015; Sun & Ni, 2016), this study added essentialcomponents to the analysis and found that social interaction among the staff, school safety, school human resources, and autonomyfor staffing are all important factors influencing principal satisfaction and commitment. Among all factors, however, mutual respectappeared to be the most important.
Although researchers (Bellibas & Liu, 2016) generally believe it is imperative for principals to create a school climate in whichsafety and respect are evident for teachers to be successful, it is evident in the current research that principals themselves benefit fromsuch a positive environment. Considering the current pressure on principals for accountability and achievement, which might causedissatisfaction and less commitment, it is imperative now that the positive staff interaction, collaboration, school safety and de-veloping strong human capital are crucial for retaining principals.
7.1. Limitations and future research
Though this research takes advantage of large-scale international data and rigorous data analysis, it still carries limitations. Firstof all, this study adopted a comprehensive model to investigate how wide-ranging school factors impact school principal JS and OC.However, caution needs to be applied when interpreting the results of this study. First of all, the research used self-reported data thatcould be skewed because respondents may be too embarrassed or concerned to reveal certain details. In addition, the individualbiases or feelings of the respondents may affect the results as well (Northrup, 1996). Though the consistency of a positive correlationbetween JS and OC within each country is a good sign of validity of the data, the limitation of self-reported data should be ac-knowledged.
Second, TALIS is a large-scale international study that collects data from different contexts. This study has indicated that factorsinfluencing principal JS and OC are generally not consistent across contexts. Though the provision of comparative evidence is apioneering feature of this study, this study cannot answer why some factors are particularly critical in certain countries and not inothers. It will be up to future research to explore why certain factors impact JS and OC differentially in the particular context.
Third, although we have tried to include a wide range of school factors in this analysis, our model still has approximately 50% ofthe variance in both JS and OC left unexplained, which indicates that principals’ attitudes still depend on other factors that are notincluded in our model.
Furthermore, the correlations described here have an obvious recursive nature. Where the school’s physical, social, and man-agerial environment impacts the principal’s JS and OC, the principal’s attitude would simultaneously impact how he/she works tobuild school climate, which is a very important dynamic that we would like to investigate in further research. However, the TALISsurvey collects cross-sectional data from principals and teachers every five years, and there have been only two rounds of studiesdone so far (2008 and 2013). These two surveys have different measures and items investigating the primary interests of this study.Therefore, it is fundamentally difficult to conduct a recursive analysis using a set of longitudinal data to track the trajectory of themutual effects between principal attitudes and school factors for now, therefore, is recommended for the future study.
Appendix A. Items used for latent variable construction
Latent Variable Variables Used fromTALIS 2013
Item Wording
How strongly do you agree or disagree with these statements as applied to this school?1 as strongly disagree, 2 as disagree, 3 as agree, and 4 as strongly agreeMutual Respect and
CollaborationTC2G30C School staff have an open discussion about difficultiesTC2G30D There is mutual respect for colleagues' ideasTC2G30E There is a culture of sharing successTC2G30F The relationships between teachers and students are good
In this school, how often do the following occur?1 as "never", 2 as "rarely", 3 as "monthly ", 4 as "weekly" and 5 as " daily (These variables have been reversely coded)
School Safety TC2G32D Vandalism and theftTC2G32E Intimidation or verbal abuse among students (or other forms of
non-physical bullying)TC2G32F Physical injury caused by violence among studentsTC2G32G Intimidation or verbal abuse of teachers or staff
In this school's capacity to provide quality instruction currently hindered by any of the following issues1 for "not at all", 2 for "very little", 3 for " to some extent" and 4 for "a lot"
Y. Liu, M.S. Bellibas International Journal of Educational Research 90 (2018) 1–19
16

Lack of human resource TC2G31A Shortage of qualified and /or well performing teachersTC2G31B Shortage of teachers with competences in teaching students with
special needsTC2G31C Shortage of vocational teachers
Lack of materials TC2G31D Shortage of inadequacy of instructional materialsTC2G31E Shortage of inadequacy of computer instructionTC2G31F Insufficient internet accessTC2G31G Shortage of inadequacy of computer software for instructionTC2G31H Shortage of inadequacy of library materials
Regarding this school, who has a significant responsibility for the following tasks?(As Principals and Teacher were coded asautonomous (1), as external authority was coded as No Autonomy=0
School autonomy for staffing TC2G18A 1 - Appointing or hiring teachersTC2G18A 5TC2G18B 1- Dismissing or suspending teachers from employmentTC2G18B 5
School autonomy for budgeting TC2G18C 1 - Establishing teachers' starting salaries, including setting pay scalesTC2G18C 5TC2G18D 1 - Determining teachers' salary increaseTC2G18D 5TC2G18E 1 - Deciding on budget allocations within the schoolTC2G18E 5
School autonomy forinstructional policies
TC2G18F 1 - Establishing student disciplinary policies and proceduresTC2G18F 5TC2G18G 1 - Establishing student assessment policies, including< nationals/
regional> assessmentsTC2G18G 5TC2G18J 1 - Determining course content, including< nationals/
regional> curriculaTC2G18J 5TC2G18K 1 - Deciding which courses are offeredTC2G18K 5
Appendix B. Descriptive statistics for all variables
N mean sd se(mean) max min
Depend VariablesPrincipal Jobs satisfaction 6078 −0.020 0.859 0.011 1.592 −3.292Principal Organizational commitment 6078 −0.019 0.819 0.011 1.433 −2.998
Independent VariablesMutual respect and Collaboration 6065 0.004 0.495 0.006 1.268 −0.813Safety 6052 0.000 1.803 0.023 3.968 −6.140Lack_humanresource 6063 0.000 1.816 0.023 4.681 −3.208Lack_material 6064 0.006 1.184 0.015 2.871 −1.967Autonomy_staff 5996 0.335 0.472 0.006 1 0Autonomy_budget 5881 0.206 0.404 0.005 1 0Autonomy_instruction 5888 0.289 0.453 0.006 1 0Public 6114 0.858 0.350 0.004 1 0Public fund 6095 0.869 0.337 0.004 1 0PD 5684 3.546 .770 .010 5 1Minority 6001 1.873 1.046 0.014 5 1SPED 6037 2.154 0.666 0.009 5 1LowSES 6030 2.838 1.085 0.014 5 1
Control VariablesLocation 6092 3.762 1.431 0.018 6 1Size 6023 658.524 493.737 6.362 4335 6Female 6120 0.519 0.500 0.006 1 0
Y. Liu, M.S. Bellibas International Journal of Educational Research 90 (2018) 1–19
17

Age 6101 50.582 8.218 0.105 73 23Degree 6089 2.991 0.301 0.004 4 1Experiences 5733 8.673 7.186 0.095 45 0Tenured 6061 0.952 0.214 0.003 1 0
References
Asparouhov, T. (2005). Sampling weights in latent variable modeling. Structural Equation Modeling, 12(3), 411–434.Aubé, C., Rousseau, V., & Morin, E. M. (2007). Perceived organizational support and organizational commitment: The moderating effect of locus of control and work
autonomy. Journal of Managerial Psychology, 22(5), 479–495.Aydogdu, S., & Asikgil, B. (2011). An empirical study of the relationship among job satisfaction, organizational commitment and turnover intention. International
Review of Management and Marketing, 1(3), 43.Béteille, T., Kalogrides, D., & Loeb, S. (2012). Stepping stones: Principal career paths and school outcomes. Social Science Research, 41(4), 904–919.Baker, B. D., Punswick, E., & Belt, C. (2010). School leadership stability, principal moves, and departures: Evidence from Missouri. Educational Administration Quarterly,
46(4), 523–557.Barry, D. A. (2002). Job satisfaction and leadership style: A study of Michigan high school principals. [Retrieved from http://scholarworks.wmich.edu/dissertations/1158].Bellibas, M. S., & Liu, Y. (2016). The effects of principals’ perceived instructional and distributed leadership practices on their perceptions of school climate.
International Journal of Leadership in Education, 1–19 [Retrieved from https://doi.org/10.1080/13603124.2016.1147608 https://doi.org/10.1080/13603124.2016.1147608].
Bogler, R., & Somech, A. (2004). Influence of teacher empowerment on teachers’ organizational commitment, professional commitment and organizational citizenshipbehavior in schools. Teaching and Teacher Education, 20(3), 277–289.
Bowen, N. K., & Guo, S. (2012). Structural equation modeling. Oxford; New York, NY: Oxford University Press.Bryk, A. S., Sebring, P. B., Allensworth, E., Luppescu, S., & Easton, J. Q. (2010). Organizing schools for improvement: Lessons from Chicago. Chicago, IL: University of
Chicago Press.Byrd, J. K. (2010). Determining factors that influence high school principal turnover over a five year period. [Retrieved from https://digital.library.unt.edu/ark:/67531/
metadc28476/m2/1/high_res_d/dissertation.pdf].Campbell, A., Converse, P. E., & Rodgers, W. L. (1976). The quality of American life: Perceptions, evaluations, and satisfactions. Russell Sage Foundation.Chang, Y., Leach, N., & Anderman, E. M. (2015). The role of perceived autonomy support in principals’ affective organizational commitment and job satisfaction. Social
Psychology of Education, 18(2), 315–336. http://dx.doi.org/10.1007/s11218-014-9289-z.Clifford, M., & Chiang, E. (2016). The great american principal turnover: And how districts can stop the churn. [Retrieved from http://www.realcleareducation.com/
articles/2016/08/25/the_great_american_principal_turnover_1303.html].Cohen, J., McCabe, L., Michelli, N. M., & Pickeral, T. (2009). School climate: Research, policy, practice, and teacher education. Teachers College Record, 111(1),
180–213.Cohen, J., Cohen, P., West, S. G., & Aiken, L. S. (2013). Applied multiple regression/correlation analysis for the behavioral sciences. Routledge.Colquitt, J., Lepine, J. A., & Wesson, M. J. (2011). Organizational behavior: Improving performance and commitment in the workplace. New York, NY: McGraw-Hill Irwin.Coomber, B., & Barriball, K. L. (2007). Impact of job satisfaction components on intent to leave and turnover for hospital-based nurses: A review of the research
literature. International Journal of Nursing Studies, 44(2), 297–314.De La Torre, J., & Douglas, J. A. (2004). Higher-order latent trait models for cognitive diagnosis. Psychometrika, 69(3), 333–353.De Nobile, J., McCormick, J., & Hoekman, K. (2013). Organizational communication and occupational stress in Australian Catholic primary schools. Journal of
Educational Administration, 51(6), 744–767. http://dx.doi.org/10.1108/JEA-09-2011-0081.Desai, P., Karahalios, V., Persuad, S., & Reker, K. (2014). Social-emotional learning. Communique, 43(1), 14–16.Dimmock, C. (2012). Leadership, capacity building and school improvement: Concepts, themes and impact. Abingdon, Oxon; New York, NY: Routledge.Dimmock, C. (2013). School-Based management and school effectiveness. New York, NY: Routledge.Dou, D., Devos, G., & Valcke, M. (2017). The relationships between school autonomy gap, principal leadership, teachers’ job satisfaction and organizational com-
mitment. Educational Management Administration & Leadership, 45(6), 959–977.DuFour, R., & Mattos, M. (2013). Improve schools? Educational Leadership, 70(7), 34–39.Dude, D. J. (2012). Organizational commitment of principals: The effects of job autonomy, empowerment, and distributive justice. [Retrieved from http://ir.uiowa.edu/cgi/
viewcontent.cgi?article=3233&context=etd].Eckman, E. W. (2004). Similarities and differences in role conflict, role commitment, and job satisfaction for female and male high school principals. Educational
Administration Quarterly, 40(3), 366–387. http://dx.doi.org/10.1177/0013161X03257835.Edwards, K. (1990). The interplay of affect and cognition in attitude formation and change. Journal of Personality and Social Psychology, 59(2), 202.Farooq, O., Payaud, M., Merunka, D., & Valette-Florence, P. (2014). The impact of corporate social responsibility on organizational commitment: Exploring multiple
mediation mechanisms. Journal of Business Ethics, 125(4), 563–580.Federici, R. A., & Skaalvik, E. M. (2012). Principal self-efficacy: Relations with burnout, job satisfaction and motivation to quit. Social Psychology of Education: An
International Journal, 15(3), 295.Fraser, J., & Brock, B. L. (2013). Catholic school principal job satisfaction: Keys to retention and recruitment. Catholic Education: A Journal of Inquiry and Practice, 9(14),
425–440.Friedman, B. A., Friedman, M. A., & Markow, D. (2008). Predictors of principals' satisfaction with their schools. Journal of Educational Administration, 46(5), 598–612.
http://dx.doi.org/10.1108/09578230810895519.Fuller, E. J., Young, M. D., & Baker, B. (2007). The relationship between principal characteristics, principal turnover, teacher quality, and student achievement. Paper
presented at the Annual meeting of the American Educational Research Association.Graham, M. W., & Messner, P. E. (1998). Principals and job satisfaction. International Journal of Educational Management, 12(5), 196–202. http://dx.doi.org/10.1108/
09513549810225925.Gregory, A., Skiba, R. J., & Noguera, P. A. (2010). The achievement gap and the discipline gap two sides of the same coin? Educational Researcher, 39(1), 59–68.Halawah, I. (2005). The relationship between effective communication of high school principal and school climate. Education, 126(2), 334–346.Harding, S., & Kershner, S. (2015). Counter-recruitment and the campaign to demilitarize public schools. Palgrave Macmillan US: Springer.Hawkins, D. W., Jr (1998). Predictors of affective organizational commitment among high school principals. [Retrieved from http://theses.lib.vt.edu/theses/available/etd-
32298-1310/unrestricted/DISSERTATION.PDF].Herzberg, F. I. (1966). Work and the nature of man.Hu, L.t., & Bentler, P. (1999). Cutoff criteria for fit indexes in covariance structure analysis: Conventional criteria versus new alternatives. Structural Equation Modeling:
A Multidisciplinary Journal, 6(1), 1–55. http://dx.doi.org/10.1080/10705519909540118.Huang, H.-Y., Wang, W.-C., Chen, P.-H., & Su, C.-M. (2013). Higher-order item response models for herarchical latent traits. Applied Psychological Measurement, 37(8),
619–637.Humborstad, S. I. W., & Perry, C. (2011). Employee empowerment, job satisfaction and organizational commitment: An in-depth empirical investigation. Chinese
Management Studies, 5(3), 325–344.
Y. Liu, M.S. Bellibas International Journal of Educational Research 90 (2018) 1–19
18
Judge, T. A., Thoresen, C. J., Bono, J. E., & Patton, G. K. (2001). The job satisfaction–job performance relationship: A qualitative and quantitative review. PsychologicalBulletin, 127(3), 376.
Kammeyer-Mueller, J. D., & Wanberg, C. R. (2003). Unwrapping the organizational entry process: Disentangling multiple antecedents and their pathways to ad-justment. Journal of Applied Psychology, 88(5), 779.
Karin Andreassi, J., Lawter, L., Brockerhoff, M., & Rutigliano Peter, J. (2014). Cultural impact of human resource practices on job satisfaction: A global study across 48countries. Cross Cultural Management, 21(1), 55–77.
Langeheine, R., & Rost, J. (2013). Latent trait and latent class models. New York, NY: Springer Science & Business Media.Leithwood, K. A., & Seashore-Louis, K. (2011). Linking leadership to student learning. San Francisco, CA: Jossey Bass Ltd.Leithwood, K. A., Louis, K. S., Anderson, S., & Wahlstrom, K. (2004). Executive summary: How leadership influences student learning. [Retrieved from http://cehd.umn.
edu/CAREI/leadership/ExecutiveSummary.pdf].Liu, Y., & Printy, S. M. (2017). Distributed leadership and educator attitudes. In T. S. Ransaw, & R. Majors (Eds.). Emerging issues and trends in education. Michigan State
University Press.Locke, E. A. (1976). The nature and causes of job satisfaction. In M. D. Dunnette (Ed.). Handbook of industrial and organizational psychology (pp. 1297–1349). Chicago:
Rand McNally.Louis, K. S., Dretzke, B., & Wahlstrom, K. (2010). How does leadership affect student achievement? Results from a national US survey. School Effectiveness and School
Improvement, 21(3), 315–336.Louis, K. S., Louis, K. S., Murphy, J., & Murphy, J. (2017). Trust, caring and organizational learning: The leader’s role. Journal of Educational Administration, 55(1),
103–126.Loukas, A., & Murphy, J. L. (2007). Middle school student perceptions of school climate: Examining protective functions on subsequent adjustment problems. Journal
of School Psychology, 45(3), 293–309. http://dx.doi.org/10.1016/j.jsp.2006.10.001.Markow, D., Lara, M., & Helen, L. (2013). The MetLife survey of the American teacher: Challenges for school leadership. [Retrieved from https://www.metlife.com/assets/
cao/foundation/MetLife-Teacher-Survey-2012.pdf].Maslow, A. H. (1975). Motivation and personality. Harper & Row.Meade, A. W., & Lautenschlager, G. J. (2004). A comparison of item response theory and confirmatory factor analytic methodologies for establishing measurement
equivalence/invariance. Organizational Research Methods, 7(4), 361–388.Mestry, R., & Ndhlovu, R. (2014). The implications of the national norms and standards for school funding policy on equity in South African public schools. South
African Journal of Education, 34(3), 1–11.Meyer, J. P., & Allen, N. J. (1991). A three-component conceptualization of organizational commitment. Human Resource Management Review, 1(1), 61–89.Miller, A. (2009). Principal turnover, student achievement and teacher retention. [Retrieved from http://harris.princeton.edu/seminars/pdfs/miller.pdf].Miller, A. (2013). Principal turnover and student achievement. Economics of Education Review, 36, 60–72.Moorman, R. H. (1993). The influence of cognitive and affective based job satisfaction measures on the relationship between satisfaction and organizational citizenship
behavior. Human Relations, 46(6), 759–776.Morrow, P. C. (2011). Managing organizational commitment: Insights from longitudinal research. Journal of Vocational Behavior, 79(1), 18–35.Mowday, R. T., Steers, R. M., & Porter, L. W. (1979). The measurement of organizational commitment. Journal of Vocational Behavior, 14(2), 224–247.Muthén, B. (1984). A general structural equation model with dichotomous, ordered categorical, and continuous latent variable indicators. Psychometrika, 49(1),
115–132.Muth́en, L., & Muth́en, B. (2015). Mplus user's guide. [Retrieved from https://www.statmodel.com/download/usersguide/MplusUsersGuidev6.pdf].Ni, Y., Sun, M., & Rorrer, A. (2015). Principal turnover: Upheaval and uncertainty in charter schools? Educational Administration Quarterly, 51(3), 409–437.Northrup, D. A. (1996). The problem of the self-report in the survey researchInstitute For Social Research11 [(3). Retrieved from http://www.math.yorku.ca/ISR/self.
htm].O'Reilly, C. A., & Chatman, J. (1986). Organizational commitment and psychological attachment: The effects of compliance, identification, and internalization on
prosocial behavior. Journal of Applied Psychology, 71(3), 492–499.OECD (2014a). TALIS 2013 results: An international perspective on teaching and learning. [Retrieved from http://www.istruzione.it/allegati/2014/OCSE_TALIS_
Rapporto_Internazionale_EN.pdf].OECD (2014b). TALIS 2013 technical report [Retrieved from https://www.oecd.org/edu/school/TALIS-technical-report-2013.pdf].Palmer, J., Watch, O., & Gibson, B. (2017). Oklahoma schools beset by high principal turnover. [Retrieved from http://kgou.org/post/oklahoma-schools-beset-high-
principal-turnover].Printy, S. M. (2010). Principals' influence on instructional quality: Insights from US schools. School Leadership & Management, 30(2), 111–126. http://dx.doi.org/10.
1080/13632431003688005.Raelin, J. A. (1980). A mandated basis of interorganizational relations: The legal-political network. Human Relations, 33(1), 57–68.Raudenbush, S. W., & Bryk, A. S. (2002). Hierarchical linear models: Applications and data analysis methods. Thousand Oaks, California: SAGE Publications.Robinson, V. M. J., Lloyd, C. A., & Rowe, K. J. (2008). The impact of leadership on student outcomes: An analysis of the differential effects of leadership types.
Educational Administration Quarterly, 44(5), 635–674. http://dx.doi.org/10.1177/0013161X08321509.Schechter, C. (2008). Organizational learning mechanisms: The meaning, measure, and implications for school improvement. Educational Administration Quarterly,
44(2), 155–186.Simon, N. S., & Johnson, S. M. (2015). Teacher turnover in high-poverty schools: What we know and can do. Teachers College Record, 117(3), 1–36.Sodoma, B., & Else, D. (2009). Job satisfaction of Iowa public school principals. Rural Educator, 31(1), 10–18.Spector, P. E. (1997). Job satisfaction: Application, assessment, cause, and consequences. Thousand Oaks, Calif: Sage Publications.Steers, R. M. (1977). Antecedents and outcomes of organizational commitment. Administrative Science Quarterly, 46–56.Suman, S., & Srivastava, A. K. (2012). Antecedents of organisational commitment across hierarchical levels. Psychology and Developing Societies, 24(1), 61–83.Sun, M., & Ni, Y. (2016). Work environments and labor markets: Explaining principal turnover gap between charter schools and traditional public schools. Educational
Administration Quarterly, 52(1), 144–183.Tutt, R., & Williams, P. (2012). How successful schools work? Thousand Oaks, Calif: London.Waskiewicz, S. P. (1999). Variables that contribute to job satisfaction of secondary school assistant principals. [Dissertation/Thesis. Retrieved from http://citeseerx.ist.psu.
edu/viewdoc/download?doi=10.1.1.4.2672&rep=rep1&type=pdf].Williams, L. J., & Anderson, S. E. (1991). Job satisfaction and organizational commitment as predictors of organizational citizenship and in-role behaviors. Journal of
Management, 17(3), 601–617.Williams, L. J., & Hazer, J. T. (1986). Antecedents and consequences of satisfaction and commitment in turnover models: A reanalysis using latent variable structural
equation methods. Journal of Applied Psychology, 71(2), 219.Yousef, D. A. (2017). Organizational commitment, job satisfaction and attitudes toward organizational change: A study in the local government. International Journal of
Public Administration, 40(1), 77–88.
Y. Liu, M.S. Bellibas International Journal of Educational Research 90 (2018) 1–19
19


![Saigon Chinatown by Coomber 1 (alternate take)[1]](https://img.pdfslide.us/doc/110x75/55d092bfbb61ebae218b4794/saigon-chinatown-by-coomber-1-alternate-take1.jpg)

![Saigon Chinatown by Coomber 2[1]](https://img.pdfslide.us/doc/110x75/55d092a2bb61ebb4218b4781/saigon-chinatown-by-coomber-21.jpg)