Embed Size (px)
Citation preview

International Journal of
Advances in Scientific Research and Engineering (ijasre)
E-ISSN : 2454-8006
DOI: 10.31695/IJASRE.2018.32879
Volume 4, Issue 9
September - 2018
www.ijasre.net Page 109
Scientific Journal Impact Factor (SJIF): 4.891
Study of Geohydrology Potential of Urban Area in Sumbersari
District of Jember Regency, Indonesia
Noor Salim1
Lecturer 1
Department of Civil Engineering
Muhammadiyah University of Jember
Jember, Jawa Timur
Indonesia
________________________________________________________________________________________________________
ABSTRACT
The increase of population, housing facilities and infrastructure in Sumbersari District of Jember Regency is significant in
2012. This causes groundwater to raise sharply exploits of 200 liters/ second to 800 liters/second. The long-term goal of this
research was to determine the potential magnitude of groundwater in order to obtain the maximum threshold of groundwater
exploitation. The specific target of this research is to obtain the distribution or flow of groundwater in the urban zone. Prediction
methods groundwater Geo electric potential is subsequently performed using analysis tools for the interpretation of the Geo
hydrological condition Ip2WIN computing based programs. Stages activity is the collection of map of urban Geo
hydrological study, daily rainfall data collection station at least 3 rain, field investigations by means of geoelectric Schlumberger
configuration in 4 area stretching east-west and north-south, the analysis of data in the laboratory with computational software
IP2WIN, calculation of the availability of groundwater, water balance calculation. The Result showed that the maximum limit on
the amount of groundwater exploitation that groundwater sustainability awake and anticipating water shortages or drought is
approximately 2494.125 liter/sec, assuming groundwater making 5 liters/sec in the groundwater wells that may be performed in
the District Sumbersari District Jember is a maximum of 500 groundwater well.
.Key Words: Groundwater, Geohydrology, Geo electric.
_________________________________________________________________________________________________
1. INTRODUCTION
Availability of clean water that can be utilized by neighborhood is one of the natural resources which has to be renewed.
The utilization is done by human population all over the world, especially by the population in Sumbersari District, Jember
Regency. Clean water can be collected from the utilization of surface water available such as rivers and lakes. In addition to
surface water, ground water is also can be used as source of clean water. Availability of water resources can not be unrelated from
the hydrology cycle. Hydrology cycle can be described as every deformation and movement of water from the atmosphere, land
surface or ground water as a dependent complex system (Kodoatie, 1996).
All the system in the cycle is controlled by sun incoming radiation or sun outgoing radiation. Detailed process of
hydrology cycle is as follows: before reaching the surface of soil, some of the rain water is blocked by the vegetation and the other
falls to the land surface through the leaves gaps or flows down through the tree barks. Small part of it will be evaporated
immediately to the atmosphere. Some of the rain water that reaches the soil surface will undergo infiltration and the other will
flow down as surface run off to the lower elevation. The infiltrated water will flow horizontally or vertically, forming ground
water. Ground water is water which occupies the cavities in geological layers. Soil layers under ground water surface is called
saturated zone, meanwhile unsaturated zone is usually above the saturated zone to the soil surface, where cavities are filled with
water and air. Because water is incluing soil moisture inside the root zone, thus this means so important to the farming, botany and
geotechnical engineering. There is no clear boundary between the saturated and unsaturated zone because both has interdependent
boundary, which water from both zone can move towards each other (Soemarto, 1987). Ground water also can be described as
water under soil surface. One of the soil water sources is infiltrated rain water, which flows down through the cavity between soil
grains. This water can effect soil properties related to settlement, foundation stability, slope stability et cetera, especially for the
fine grained soil (Utomo, 2005).
Noor Salim, Study of Geohydrology Potential of Urban Area in Sumbersari ….
www.ijasre.net Page 110
DOI: 10.31695/IJASRE.2018.32879
The availability of underground water (in aquifers) has a strategic role. In terms of utilization, ground water can be
carried out immediately according to current needs by pumping techniques through boreholes, as well as surface water utilization.
In the storage side, ground water can actually have a value of reserve quantity in a much larger amount than surface water, in
accordance with the volume of the existing aquifer, and is not lost by evaporation or not easily contaminated. In addition to the
reserve quantity value, underground water quality can be maintained properly due to the physical and chemical filtration and
cleaning process by soil and rock media. If surface water always correlates directly with rainfall and evaporation and also surface
runoff into the sea through rivers, it is not the case for the ground water. Underground water is actually a long-term clean water
reserve that supports the preservation of clean water reserves in an area.
Exploitation of the potential of groundwater sources in the Sumbersari District District of Jember Regency has been
carried out through groundwater drilling at several points both by individuals, private and government agencies. However, the
water discharge generated at some points has been felt to be insufficient to meet water needs. To meet the need for clean water, it
is necessary to know the potential of groundwater and the potential of underground water content from sources of groundwater
that can be drilled. Thus, it is necessary to search for more potential and ground water sources. This can be discovered through
investigation of the local geological conditions and the determination of the physical condition of the subsurface. On the other
hand, exploitation of ground water must be balanced with efforts to conserve ground water reserves. This conservation effort is
carried out to maintain the sustainability of groundwater sources that can be exploited. With the presence of well-maintained
forests on the surface, the sustainability of ground water reserves in aquifers can also be maintained. This conservation must also
be supported by the availability of aquifer potential data such as the position of aquifers under the earth's surface, aquifer
thickness, aquifer permeability. Especially, to find out the availability of groundwater potential data that can be used directly and
to support efforts to conserve the groundwater resources, investigations into the existence and dimensions of aquifers in the
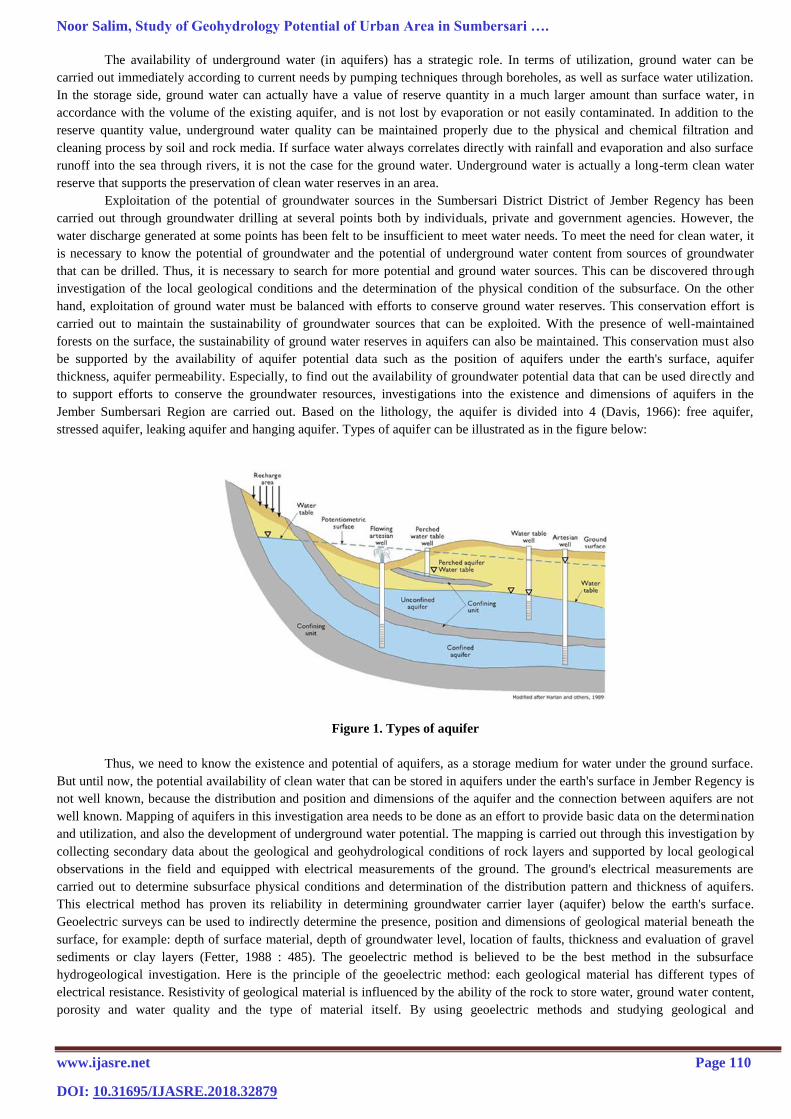
Jember Sumbersari Region are carried out. Based on the lithology, the aquifer is divided into 4 (Davis, 1966): free aquifer,
stressed aquifer, leaking aquifer and hanging aquifer. Types of aquifer can be illustrated as in the figure below:
Figure 1. Types of aquifer
Thus, we need to know the existence and potential of aquifers, as a storage medium for water under the ground surface.
But until now, the potential availability of clean water that can be stored in aquifers under the earth's surface in Jember Regency is
not well known, because the distribution and position and dimensions of the aquifer and the connection between aquifers are not
well known. Mapping of aquifers in this investigation area needs to be done as an effort to provide basic data on the determination
and utilization, and also the development of underground water potential. The mapping is carried out through this investigation by
collecting secondary data about the geological and geohydrological conditions of rock layers and supported by local geological
observations in the field and equipped with electrical measurements of the ground. The ground's electrical measurements are
carried out to determine subsurface physical conditions and determination of the distribution pattern and thickness of aquifers.
This electrical method has proven its reliability in determining groundwater carrier layer (aquifer) below the earth's surface.
Geoelectric surveys can be used to indirectly determine the presence, position and dimensions of geological material beneath the
surface, for example: depth of surface material, depth of groundwater level, location of faults, thickness and evaluation of gravel
sediments or clay layers (Fetter, 1988 : 485). The geoelectric method is believed to be the best method in the subsurface
hydrogeological investigation. Here is the principle of the geoelectric method: each geological material has different types of
electrical resistance. Resistivity of geological material is influenced by the ability of the rock to store water, ground water content,
porosity and water quality and the type of material itself. By using geoelectric methods and studying geological and
International Journal of Advances in Scientific Research and Engineering (ijasre), Vol 4 (9), September - 2018
Scientific Journal Impact Factor (SJIF): 4.89 Page 111
geohydrological conditions, mapping of underground water aquifers in Jember Regency can be done to meet the need for clean
water.
2. RESEARCH METHODOLOGY
In this research, things we have to do in order to determine the location of a groundwater aquifer are location survey,
finding out the general description of the investigation area, geological conditions, the conditions of the investigation area's
geological hydro and exploration of Vertical Electrical Sounding (VES) geoelectric resistance. To get an overview of the
subsurface structure, geophysical exploration is carried out by Vertical Electrical Sounding (VES) geoelectric resistance method
with Schlumberger configuration. The technical implementation of this research is as follows:
2.1 Preparation Phase
Before conducting the exploration process, the preparation stage must be carried out, the stages are the location of
measurement survey and the determination of the path for Geoelectric measurements. The next preparation is planning the field
measurements. This is related to the acquisition design which is associated with the desired depth target and data accuracy.
Because each location has different characteristics, the acquisition must be designed appropriately to get maximum results.
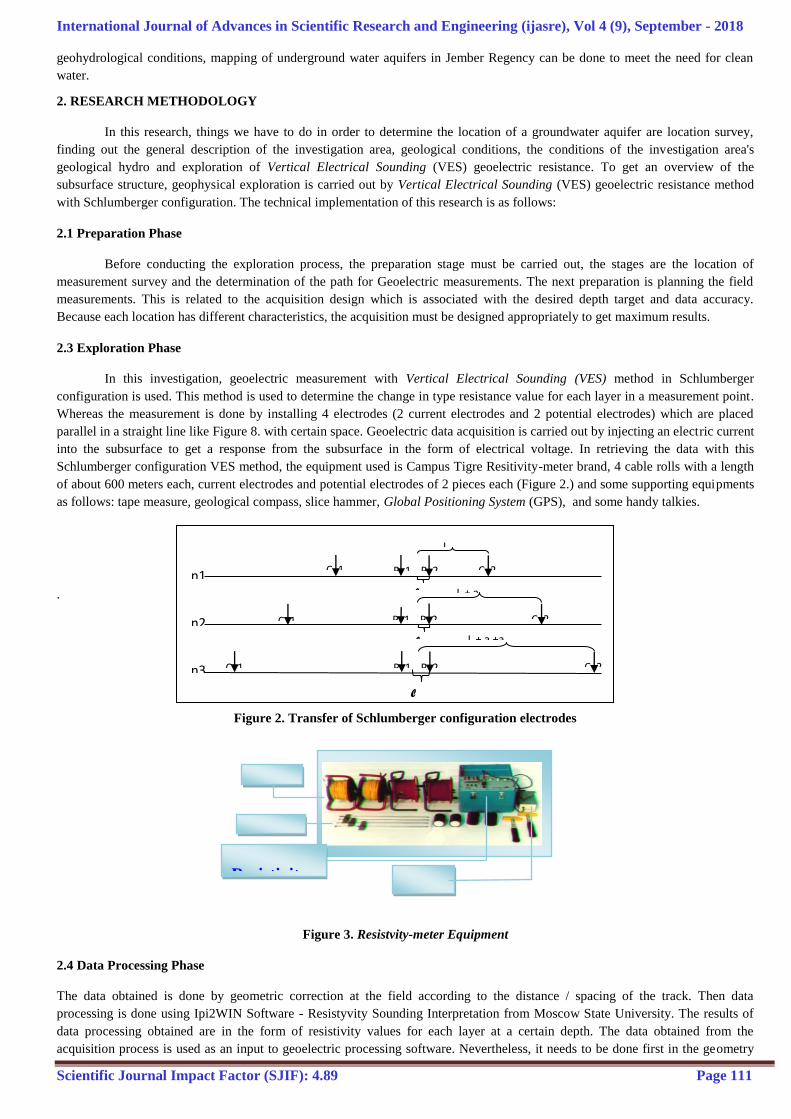
2.3 Exploration Phase
In this investigation, geoelectric measurement with Vertical Electrical Sounding (VES) method in Schlumberger
configuration is used. This method is used to determine the change in type resistance value for each layer in a measurement point.
Whereas the measurement is done by installing 4 electrodes (2 current electrodes and 2 potential electrodes) which are placed
parallel in a straight line like Figure 8. with certain space. Geoelectric data acquisition is carried out by injecting an electric current
into the subsurface to get a response from the subsurface in the form of electrical voltage. In retrieving the data with this
Schlumberger configuration VES method, the equipment used is Campus Tigre Resitivity-meter brand, 4 cable rolls with a length
of about 600 meters each, current electrodes and potential electrodes of 2 pieces each (Figure 2.) and some supporting equipments
as follows: tape measure, geological compass, slice hammer, Global Positioning System (GPS), and some handy talkies.
.
Figure 2. Transfer of Schlumberger configuration electrodes
Figure 3. Resistvity-meter Equipment
2.4 Data Processing Phase
The data obtained is done by geometric correction at the field according to the distance / spacing of the track. Then data
processing is done using Ipi2WIN Software - Resistyvity Sounding Interpretation from Moscow State University. The results of
data processing obtained are in the form of resistivity values for each layer at a certain depth. The data obtained from the
acquisition process is used as an input to geoelectric processing software. Nevertheless, it needs to be done first in the geometry
l
L
L + a
l
l
L + a +a
n1
n2
n3
P 1 C 2 C 1 P 2
P 1 C 2 C 1 P 2
P 1 C 2 C 1 P 2
Electr
odes
Cabl
es
Resistivity-
meter
Campus
Tigre
Pow
er
Supp
ly
Noor Salim, Study of Geohydrology Potential of Urban Area in Sumbersari ….
www.ijasre.net Page 112
DOI: 10.31695/IJASRE.2018.32879
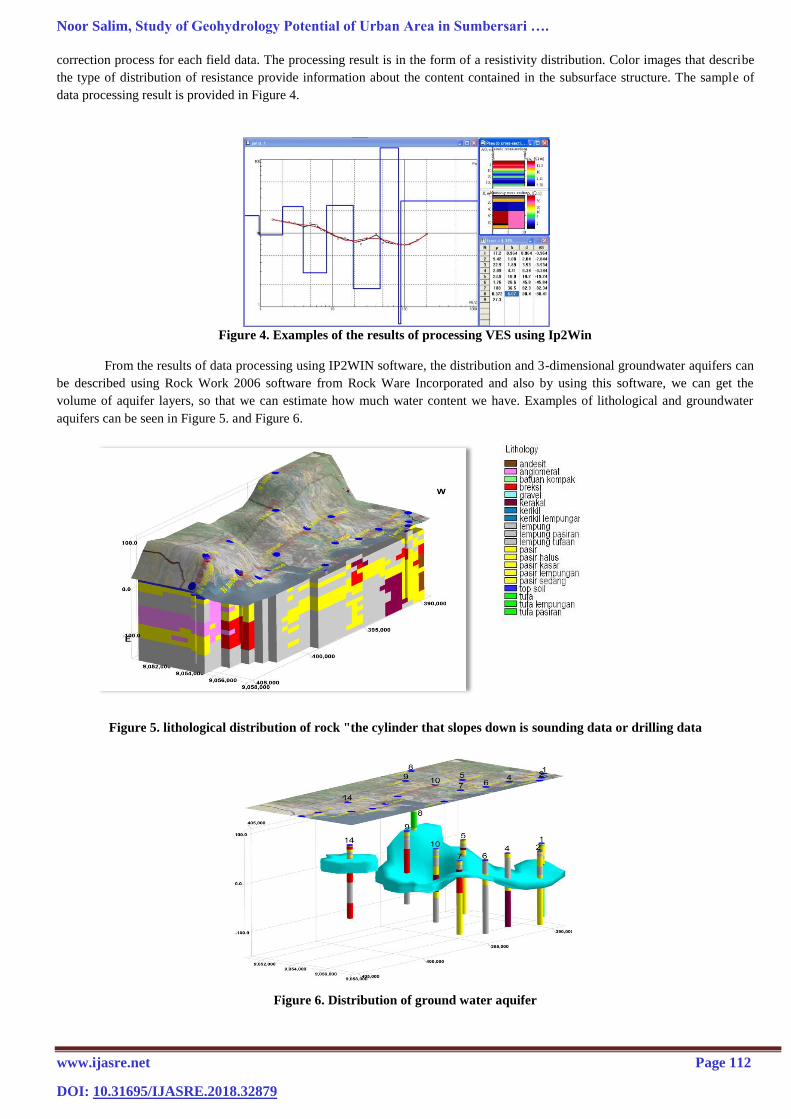
correction process for each field data. The processing result is in the form of a resistivity distribution. Color images that describe
the type of distribution of resistance provide information about the content contained in the subsurface structure. The sample of
data processing result is provided in Figure 4.
Figure 4. Examples of the results of processing VES using Ip2Win
From the results of data processing using IP2WIN software, the distribution and 3-dimensional groundwater aquifers can
be described using Rock Work 2006 software from Rock Ware Incorporated and also by using this software, we can get the
volume of aquifer layers, so that we can estimate how much water content we have. Examples of lithological and groundwater
aquifers can be seen in Figure 5. and Figure 6.
Figure 5. lithological distribution of rock "the cylinder that slopes down is sounding data or drilling data
Figure 6. Distribution of ground water aquifer
International Journal of Advances in Scientific Research and Engineering (ijasre), Vol 4 (9), September - 2018
Scientific Journal Impact Factor (SJIF): 4.89 Page 113
3. RESULTS AND DISCUSSION
3.1 Data Collecting
Data can be collected in the free area and far from densely populated area, but still in the urban area and administratively
located in Sumbersari District, Jember Regency. Geoelectric tools are used to estimate groundwater by processing data using
IP2Win software. Estimation using geoelectric devices is done at only a point with data collection distance intervals at 25 m, 50 m,
100 m, 200 m and 500 m.
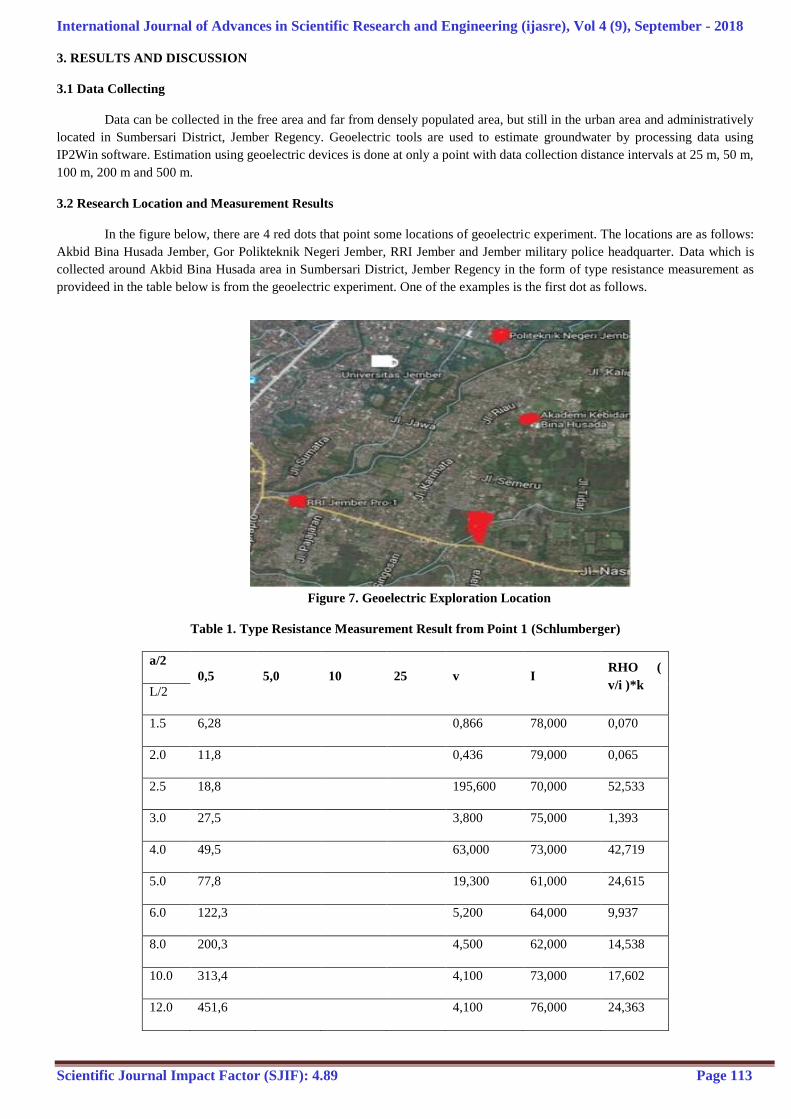
3.2 Research Location and Measurement Results
In the figure below, there are 4 red dots that point some locations of geoelectric experiment. The locations are as follows:
Akbid Bina Husada Jember, Gor Polikteknik Negeri Jember, RRI Jember and Jember military police headquarter. Data which is
collected around Akbid Bina Husada area in Sumbersari District, Jember Regency in the form of type resistance measurement as
provideed in the table below is from the geoelectric experiment. One of the examples is the first dot as follows.
Figure 7. Geoelectric Exploration Location
Table 1. Type Resistance Measurement Result from Point 1 (Schlumberger)
a/2
0,5 5,0 10 25 v I RHO (
v/i )*k L/2
1.5 6,28 0,866 78,000 0,070
2.0 11,8 0,436 79,000 0,065
2.5 18,8 195,600 70,000 52,533
3.0 27,5 3,800 75,000 1,393
4.0 49,5 63,000 73,000 42,719
5.0 77,8 19,300 61,000 24,615
6.0 122,3 5,200 64,000 9,937
8.0 200,3 4,500 62,000 14,538
10.0 313,4 4,100 73,000 17,602
12.0 451,6 4,100 76,000 24,363
Noor Salim, Study of Geohydrology Potential of Urban Area in Sumbersari ….
www.ijasre.net Page 114
DOI: 10.31695/IJASRE.2018.32879
15.0 706.1 62,8 4,200 89,000 2,964
20.0 1255 177,8 2,000 61,000 5,830
25.0 1962 188,5 10,300 56,000 34,671
30.0 2826 274.9 125,7 22,400 75,000 37,542
40.0 5025 494.8 236,6 40,600 315,000 30,495
50.0 7853 777.5 377 31,450 410,000 28,919
60.0 11309 1123 549,8 23,500 378,000 34,181
75.0 17671 1759 867.9 314,1 26,550 381,000 21,888
100 31415 3133 1555 589 9,150 262,000 20,570
125 4900 2438 942,5 2,700 168,000 15,147
150 7060 3518 1374 2,300 141,333 22,360
200 12558 6267 2474 1,650 366,000 11,153
250 19627 9800 3887 11,950 506,000 91,798
300 28266 14121 5615 6,367 504,000 70,930
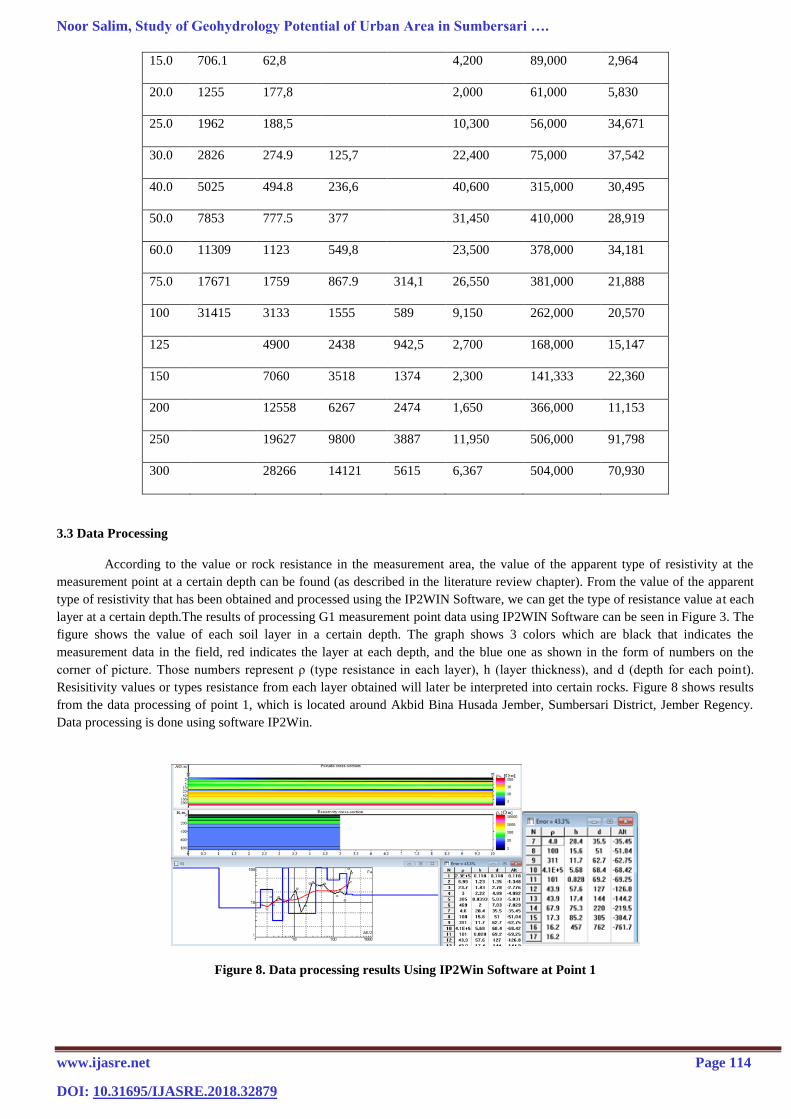
3.3 Data Processing
According to the value or rock resistance in the measurement area, the value of the apparent type of resistivity at the
measurement point at a certain depth can be found (as described in the literature review chapter). From the value of the apparent
type of resistivity that has been obtained and processed using the IP2WIN Software, we can get the type of resistance value at each
layer at a certain depth.The results of processing G1 measurement point data using IP2WIN Software can be seen in Figure 3. The
figure shows the value of each soil layer in a certain depth. The graph shows 3 colors which are black that indicates the
measurement data in the field, red indicates the layer at each depth, and the blue one as shown in the form of numbers on the
corner of picture. Those numbers represent ρ (type resistance in each layer), h (layer thickness), and d (depth for each point).
Resisitivity values or types resistance from each layer obtained will later be interpreted into certain rocks. Figure 8 shows results
from the data processing of point 1, which is located around Akbid Bina Husada Jember, Sumbersari District, Jember Regency.
Data processing is done using software IP2Win.
Figure 8. Data processing results Using IP2Win Software at Point 1
International Journal of Advances in Scientific Research and Engineering (ijasre), Vol 4 (9), September - 2018
Scientific Journal Impact Factor (SJIF): 4.89 Page 115
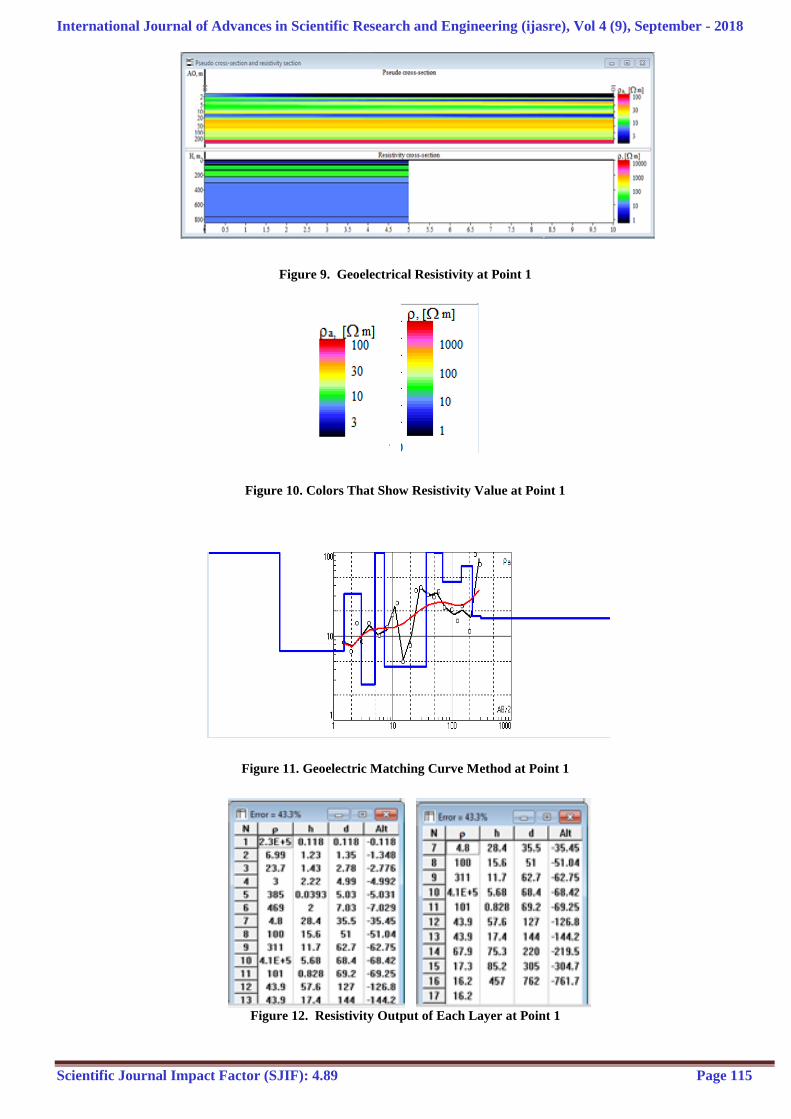
Figure 9. Geoelectrical Resistivity at Point 1
Figure 10. Colors That Show Resistivity Value at Point 1
Figure 11. Geoelectric Matching Curve Method at Point 1
Figure 12. Resistivity Output of Each Layer at Point 1
Noor Salim, Study of Geohydrology Potential of Urban Area in Sumbersari ….
www.ijasre.net Page 116
DOI: 10.31695/IJASRE.2018.32879
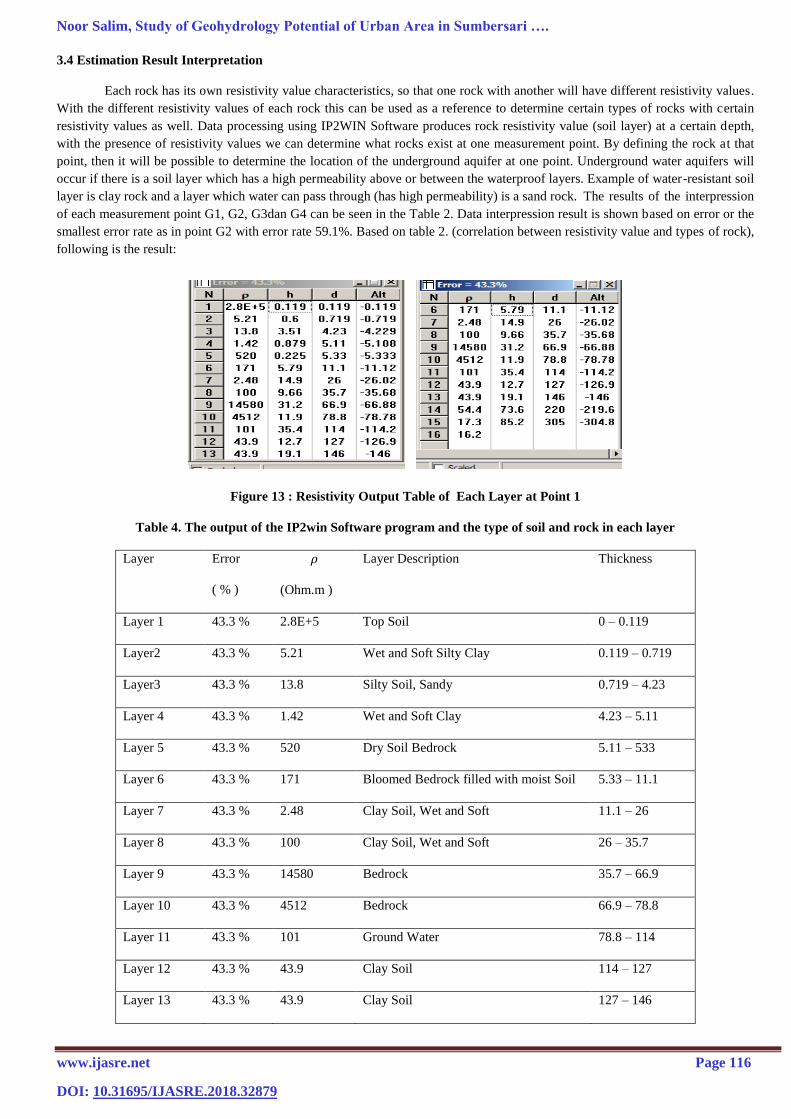
3.4 Estimation Result Interpretation
Each rock has its own resistivity value characteristics, so that one rock with another will have different resistivity values.
With the different resistivity values of each rock this can be used as a reference to determine certain types of rocks with certain
resistivity values as well. Data processing using IP2WIN Software produces rock resistivity value (soil layer) at a certain depth,
with the presence of resistivity values we can determine what rocks exist at one measurement point. By defining the rock at that
point, then it will be possible to determine the location of the underground aquifer at one point. Underground water aquifers will
occur if there is a soil layer which has a high permeability above or between the waterproof layers. Example of water-resistant soil
layer is clay rock and a layer which water can pass through (has high permeability) is a sand rock. The results of the interpression
of each measurement point G1, G2, G3dan G4 can be seen in the Table 2. Data interpression result is shown based on error or the
smallest error rate as in point G2 with error rate 59.1%. Based on table 2. (correlation between resistivity value and types of rock),
following is the result:
Figure 13 : Resistivity Output Table of Each Layer at Point 1
Table 4. The output of the IP2win Software program and the type of soil and rock in each layer
Layer Error
( % )
(Ohm.m )
Layer Description Thickness
Layer 1 43.3 % 2.8E+5 Top Soil 0 – 0.119
Layer2 43.3 % 5.21 Wet and Soft Silty Clay 0.119 – 0.719
Layer3 43.3 % 13.8 Silty Soil, Sandy 0.719 – 4.23
Layer 4 43.3 % 1.42 Wet and Soft Clay 4.23 – 5.11
Layer 5 43.3 % 520 Dry Soil Bedrock 5.11 – 533
Layer 6 43.3 % 171 Bloomed Bedrock filled with moist Soil 5.33 – 11.1
Layer 7 43.3 % 2.48 Clay Soil, Wet and Soft 11.1 – 26
Layer 8 43.3 % 100 Clay Soil, Wet and Soft 26 – 35.7
Layer 9 43.3 % 14580 Bedrock 35.7 – 66.9
Layer 10 43.3 % 4512 Bedrock 66.9 – 78.8
Layer 11 43.3 % 101 Ground Water 78.8 – 114
Layer 12 43.3 % 43.9 Clay Soil 114 – 127
Layer 13 43.3 % 43.9 Clay Soil 127 – 146
International Journal of Advances in Scientific Research and Engineering (ijasre), Vol 4 (9), September - 2018
Scientific Journal Impact Factor (SJIF): 4.89 Page 117
Layer 14 43.3 % 54.4 Clay Soil 146 – 220
Layer 15 43.3 % 17.3 Sand Soil 220 – 305
Layer 16 43.3 % 16,2 Sand Soil 305 -
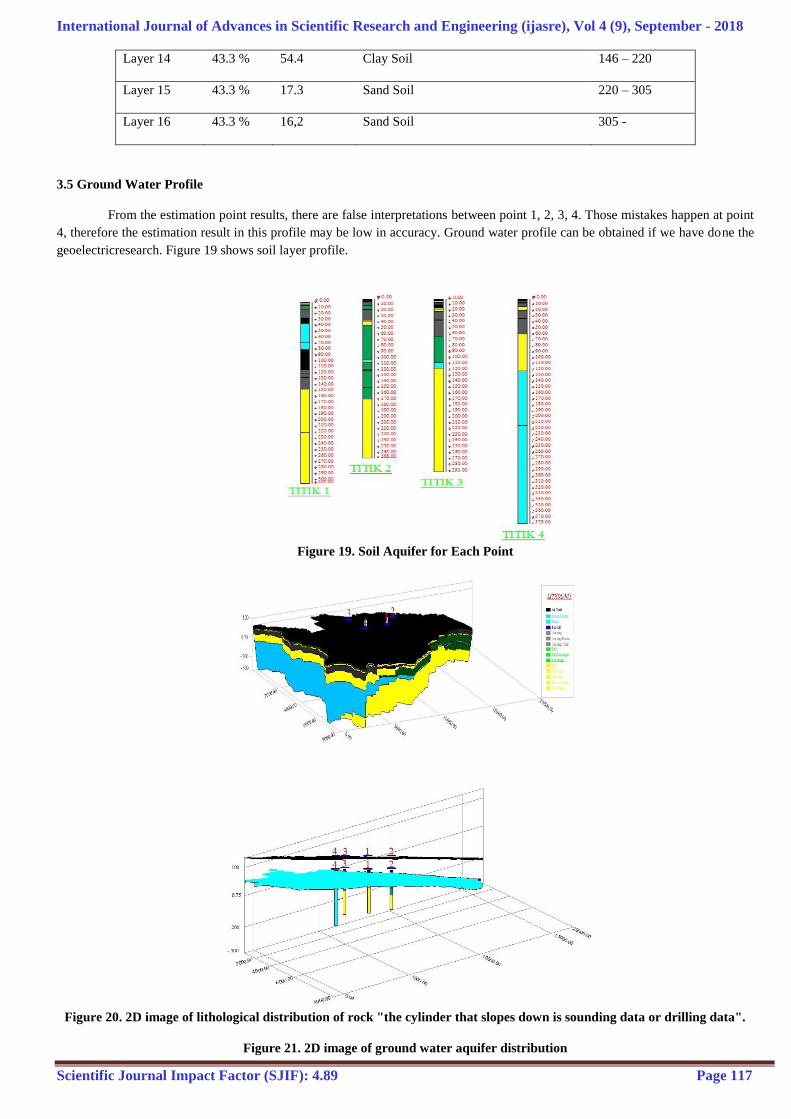
3.5 Ground Water Profile
From the estimation point results, there are false interpretations between point 1, 2, 3, 4. Those mistakes happen at point
4, therefore the estimation result in this profile may be low in accuracy. Ground water profile can be obtained if we have done the
geoelectricresearch. Figure 19 shows soil layer profile.
Figure 19. Soil Aquifer for Each Point
Figure 20. 2D image of lithological distribution of rock "the cylinder that slopes down is sounding data or drilling data".
Figure 21. 2D image of ground water aquifer distribution
Noor Salim, Study of Geohydrology Potential of Urban Area in Sumbersari ….
www.ijasre.net Page 118
DOI: 10.31695/IJASRE.2018.32879
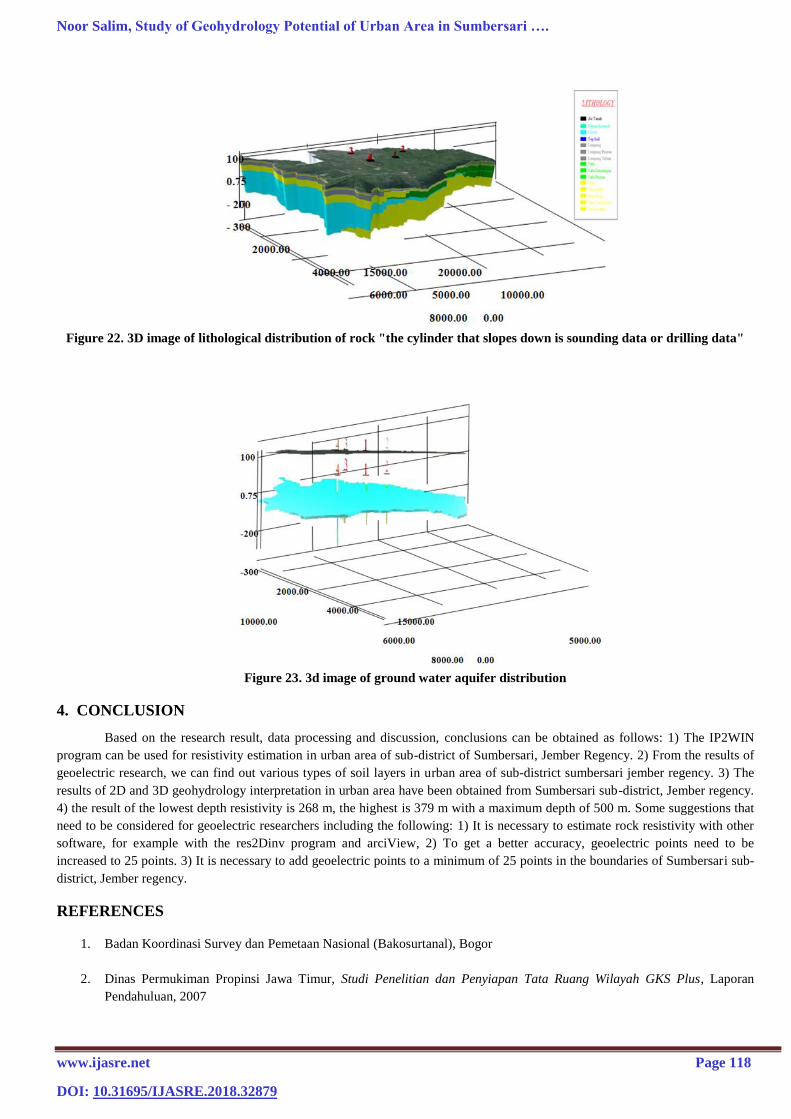
Figure 22. 3D image of lithological distribution of rock "the cylinder that slopes down is sounding data or drilling data"
Figure 23. 3d image of ground water aquifer distribution
4. CONCLUSION
Based on the research result, data processing and discussion, conclusions can be obtained as follows: 1) The IP2WIN
program can be used for resistivity estimation in urban area of sub-district of Sumbersari, Jember Regency. 2) From the results of
geoelectric research, we can find out various types of soil layers in urban area of sub-district sumbersari jember regency. 3) The
results of 2D and 3D geohydrology interpretation in urban area have been obtained from Sumbersari sub-district, Jember regency.
4) the result of the lowest depth resistivity is 268 m, the highest is 379 m with a maximum depth of 500 m. Some suggestions that
need to be considered for geoelectric researchers including the following: 1) It is necessary to estimate rock resistivity with other
software, for example with the res2Dinv program and arciView, 2) To get a better accuracy, geoelectric points need to be
increased to 25 points. 3) It is necessary to add geoelectric points to a minimum of 25 points in the boundaries of Sumbersari sub-
district, Jember regency.
REFERENCES
1. Badan Koordinasi Survey dan Pemetaan Nasional (Bakosurtanal), Bogor
2. Dinas Permukiman Propinsi Jawa Timur, Studi Penelitian dan Penyiapan Tata Ruang Wilayah GKS Plus, Laporan
Pendahuluan, 2007
International Journal of Advances in Scientific Research and Engineering (ijasre), Vol 4 (9), September - 2018
Scientific Journal Impact Factor (SJIF): 4.89 Page 119
3. Jhon M. Reynolds, 1997, An Introduction to Applied and Environmental Geophysics, Jhon Wiley & Sons.
4. Kodoatie R.J, 1996, Pengantar Hidrogeologi, Penerbit Andi : Yogyakarta.
5. Koefoed, O, 1979, Geosounding Principles, Resistivity Sounding Measurement, Elsevier, Amsterdam.
6. Sharma, P.V, 1997, Environmental and Engineering Geophysics, Cambridge University Press. Cambridge.
7. Sihwanto, 1993, Evaluasi Potensi Air Tanah Daerah Maumere, Sikka, Flores, Nusa Tenggara Timur, Departemen
Pertambangan dan Energi, Bandung.
8. Telford W.M, 1990, Applied Geophysics Second Edition, Cambridge University Press.`
9. Undang-undang Republik Indonesia Nomor 4 tahun 1992 tentang Perumahan dan Permukiman
10. Balai Pengkajian Teknologi Peryanian Karangploso, Embunbung Kolam Penampung Air,1997.