Embed Size (px)
Citation preview
http://www.ijdrt.com 150
Int. J. Drug Res. Tech. 2016, Vol. 6 (3), 150-163 ISSN 2277 - 1506
International Journal of Drug Research and Technology
Available online at http://www.ijdrt.com
Original Research Paper
FORMULATION DEVELOPMENT, OPTIMIZATION AND EVALUATION OF
BILAYER PUSH-PULL OSMOTIC PUMP TABLET OF ATENOLOL USING 32
FACTORIAL DESIGNS
Kailas N. Tarkase and Pooja V. Kadu*
Department of Quality Assurance Technique, P.D.V.V.P.F’s College of Pharmacy
(Savitribai Phule Pune University), Vilad Ghat, Ahemadnagar-414001, Maharashtra, India
ABSTRACT
The objective of this study was to Formulate, Optimize and Evaluate Bilayer Push Pull Osmotic Pump
Tablet of Atenolol Using 32
Factorial Designs. The main aim is to improve the site specification and to
provide the controlled release of drug for once-a-day drug delivery system. The push pull osmotic tablets
were prepared by double compression method; this study evaluates that regardless of the drug properties
which do not significantly affect the drug delivery, the release kinetics is mainly controlled by some factors
as, the plasticizer proportion in the membrane, the osmotic agent proportion and the drug layer polymer
grade. The influence of each factor was investigated defining their acceptability range. Results, shows that
the use of suspension agent in drug layer affects the drug release. The formulation batch F3 was taken as
ideal optimized batch. On the basis of results the effect of orifice diameter, polymer concentration in drug
layer, coating composition and plasticizer amount was tested and promising results were found. The drug
release was independent of pH but dependent on the osmotic pressure of the dissolution medium. The
release kinetics followed the peppas model.
Keywords: Atenolol, Polyethylene oxide, Polyvinyl pyrrolidione K-30, Osmotic pump, Oral osmotic
systems, In-vitro study.
INTRODUCTION
One of the common ways to reach drug in systemic circulation is via oral route. Oral drug delivery poses
problem of multiple dosing for drugs for which half-life is less. Multiple dosing per day is leading cause of
reduced patient compliance. To solve this there are two approaches could be explored, first is invention of
drug for which half-life is more and second is to extend half-life of drug. Controlled Drug Delivery System
(CDDS) helps to get desired drug release pattern for long period of time so that rate and extent of drug
release from oral drug delivery could be predicted. Controlled Drug Delivery System is classified as
Physical, Chemical and Biochemical processes. Physical controlled drug delivery includes Osmotic
pressure activated drug delivery system, Hydrodynamic pressure activated drug delivery system, Vapour
pressure activated drug delivery system, Mechanically activated drug delivery system, Magnetically
activated drug delivery system, Sonophoretic activated drug delivery system, Iontophoresis activated drug
delivery system and Hydration activated drug delivery system. Hypertension means the abnormally raised
arterial blood pressure. There are many conditions which elevate arterial pressure including primary renal
disease, hyperthyroidism, hyper aldosteronism leading to secondary hypertension. The primary
hypertension causes are not known. In these patients although the cause is not completely understood,
heredity, emotional factors and various physiological factors play a major role in raising blood pressure. If
this condition is not treated, complication like left heart failure, congestive heart failure, cerebrovascular
disease, kidney damage and atherosclerosis may develop. Normal blood pressure is defined as levels
Pooja V. Kadu et al. / International Journal of Drug Research and Technology 2016, Vol. 6 (3), 150-163
http://www.ijdrt.com 151
<120/80 mmHg. Systolic blood pressure of 120–139 mmHg or diastolic blood pressure 80–89 mmHg is
classified as prehypertension. These patients are at increased risk for progression to hypertension.
Hypertension is defined as systolic blood pressure ≥140 mmHg or diastolic blood pressure ≥90 mmHg.
MATERIAL AND METHODS
Material
Atenolol, Polyethylene Oxide was obtained as a gift sample from Lupin Pharmaceutical, Mulshi, Nande
Village, Pune, Maharashtra (India). PVP-K30 from OZONE International, Mumbai; Lactose, Magnesium
stearate, Magnesium stearate from LOBA Chemie Pvt. Ltd., Mumbai, All other chemicals and reagents
used were of AR grade.
Method
Formulation Development, Optimization and Evaluation of Bilayer Push-Pull Osmotic Pump Tablet of
Atenolol Using 32 Factorial Designs.
UV-Visible Spectroscopic Scanning-Spectral Analysis
Determination of UV Spectrum in Methanol
The stock solution of atenolol was prepared by dissolving it in methanol. A dilution of 15µg/ml was kept in
cuvette. In UV spectrum was recorded using double beam UV-visible spectrophotometer in the wavelength
range 200-400 nm with methanol.
Calibration Curve of the Drug
Preparation of Standard Curve in Methanol: The stock solution of atenolol was prepared by dissolving 5
mg of drug in methanol and final volume was made to 100 ml. The solutions in concentration range of 2-
10µg/ml were prepared by appropriate dilution of stock solution. The UV absorbance of these solutions was
determined spectrophotometricaly at ƛ max 226 nm.
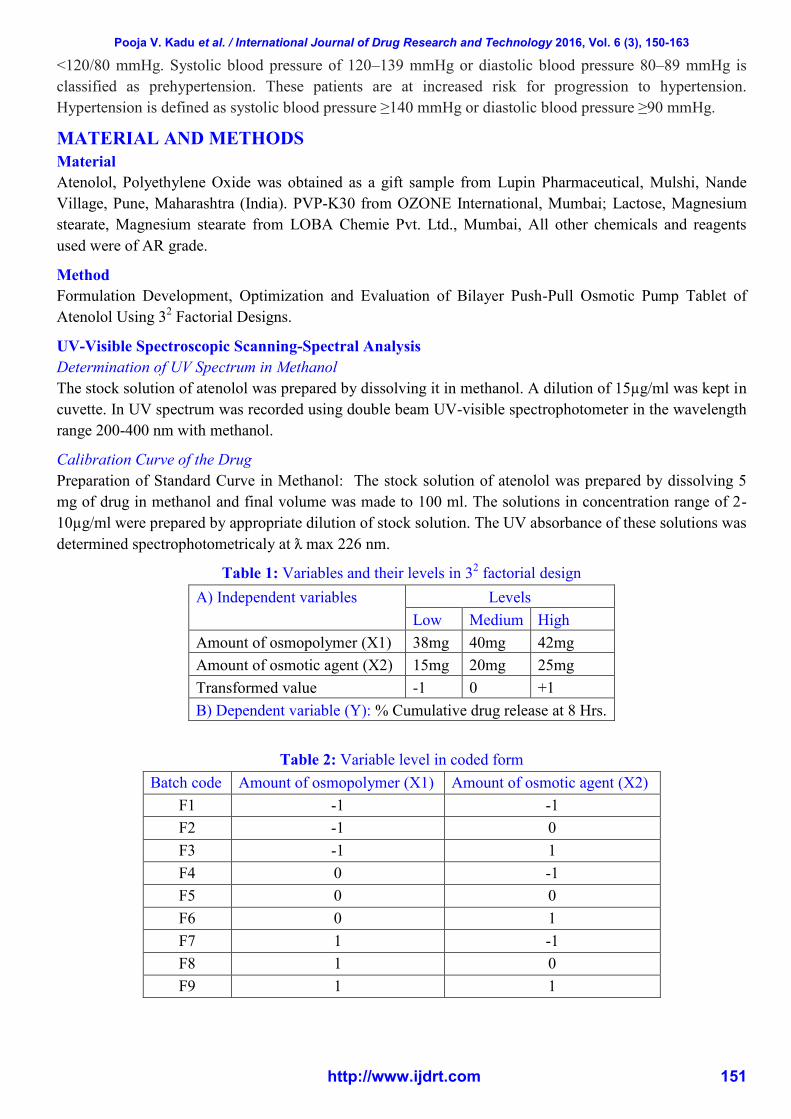
Table 1: Variables and their levels in 32 factorial design
A) Independent variables Levels
Low Medium High
Amount of osmopolymer (X1) 38mg 40mg 42mg
Amount of osmotic agent (X2) 15mg 20mg 25mg
Transformed value -1 0 +1
B) Dependent variable (Y): % Cumulative drug release at 8 Hrs.
Table 2: Variable level in coded form
Batch code Amount of osmopolymer (X1) Amount of osmotic agent (X2)
F1 -1 -1
F2 -1 0
F3 -1 1
F4 0 -1
F5 0 0
F6 0 1
F7 1 -1
F8 1 0
F9 1 1
Pooja V. Kadu et al. / International Journal of Drug Research and Technology 2016, Vol. 6 (3), 150-163
http://www.ijdrt.com 152
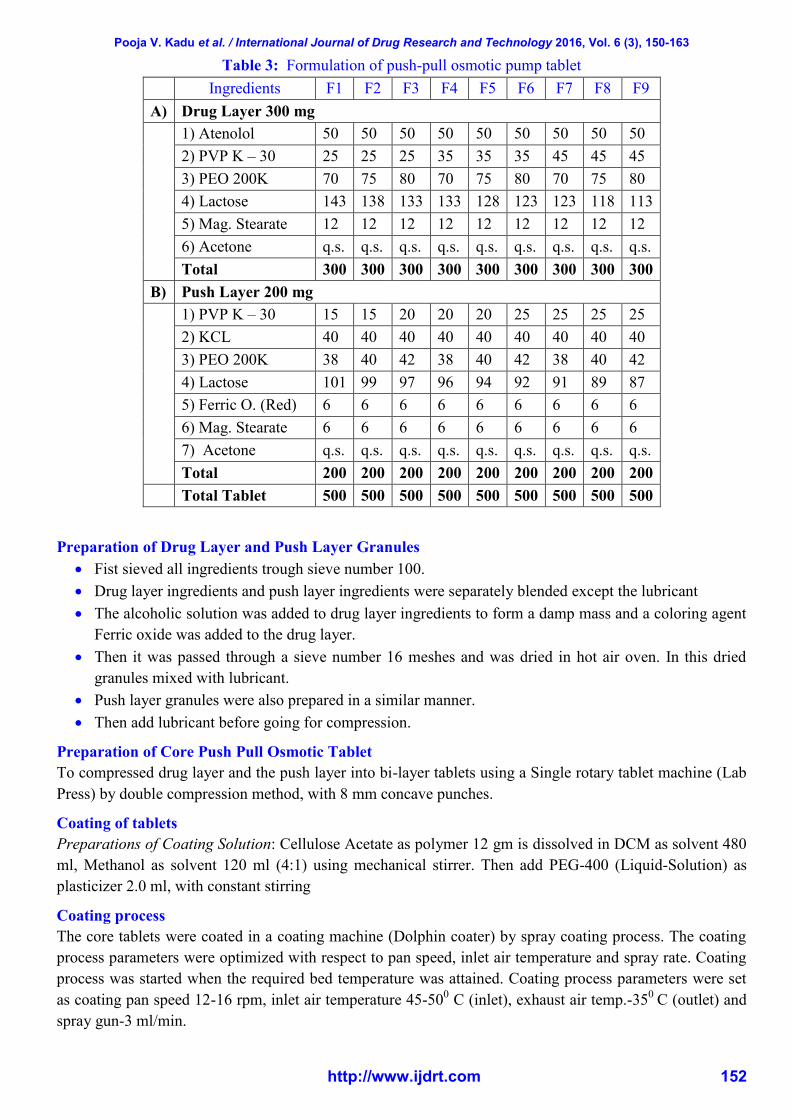
Table 3: Formulation of push-pull osmotic pump tablet
Ingredients F1 F2 F3 F4 F5 F6 F7 F8 F9
A) Drug Layer 300 mg
1) Atenolol 50 50 50 50 50 50 50 50 50
2) PVP K – 30 25 25 25 35 35 35 45 45 45
3) PEO 200K 70 75 80 70 75 80 70 75 80
4) Lactose 143 138 133 133 128 123 123 118 113
5) Mag. Stearate 12 12 12 12 12 12 12 12 12
6) Acetone q.s. q.s. q.s. q.s. q.s. q.s. q.s. q.s. q.s.
Total 300 300 300 300 300 300 300 300 300
B) Push Layer 200 mg
1) PVP K – 30 15 15 20 20 20 25 25 25 25
2) KCL 40 40 40 40 40 40 40 40 40
3) PEO 200K 38 40 42 38 40 42 38 40 42
4) Lactose 101 99 97 96 94 92 91 89 87
5) Ferric O. (Red) 6 6 6 6 6 6 6 6 6
6) Mag. Stearate 6 6 6 6 6 6 6 6 6
7) Acetone q.s. q.s. q.s. q.s. q.s. q.s. q.s. q.s. q.s.
Total 200 200 200 200 200 200 200 200 200
Total Tablet
weight
500 500 500 500 500 500 500 500 500
Preparation of Drug Layer and Push Layer Granules
Fist sieved all ingredients trough sieve number 100.
Drug layer ingredients and push layer ingredients were separately blended except the lubricant
The alcoholic solution was added to drug layer ingredients to form a damp mass and a coloring agent
Ferric oxide was added to the drug layer.
Then it was passed through a sieve number 16 meshes and was dried in hot air oven. In this dried
granules mixed with lubricant.
Push layer granules were also prepared in a similar manner.
Then add lubricant before going for compression.
Preparation of Core Push Pull Osmotic Tablet
To compressed drug layer and the push layer into bi-layer tablets using a Single rotary tablet machine (Lab
Press) by double compression method, with 8 mm concave punches.
Coating of tablets
Preparations of Coating Solution: Cellulose Acetate as polymer 12 gm is dissolved in DCM as solvent 480
ml, Methanol as solvent 120 ml (4:1) using mechanical stirrer. Then add PEG-400 (Liquid-Solution) as
plasticizer 2.0 ml, with constant stirring
Coating process
The core tablets were coated in a coating machine (Dolphin coater) by spray coating process. The coating
process parameters were optimized with respect to pan speed, inlet air temperature and spray rate. Coating
process was started when the required bed temperature was attained. Coating process parameters were set
as coating pan speed 12-16 rpm, inlet air temperature 45-500 C (inlet), exhaust air temp.-35
0 C (outlet) and
spray gun-3 ml/min.
Pooja V. Kadu et al. / International Journal of Drug Research and Technology 2016, Vol. 6 (3), 150-163
http://www.ijdrt.com 153
Percentage Weight Gain of Tablet: Four percent (4%) weight gain of all tablets after coating to the initial
wt. of tablet before coating.
Evaluation
Uniformity of Weight
The weight variation test is carried out in order ensure uniformity in the weight of the tablets in a batch.
The total weight of 20 tablets from formulation was determined and the average was calculated. The
individual weights of tablets were also determined and the weight variation was calculated by the formula.
% deviation= individual weight – average weight / average weight x 100
Hardness
To select ten tablets from each batch and hardness was measured using Monsanto Hardness tester to find
the average tablet hardness.
Thickness
Five Tablets were selected at random from individual formulations and thickness was measured by using
Digital Vernier calliper scale.
Friability (%F)
Twenty tablets from each batch were selected randomly and weighed. Then put 20 tablets in Roche
Friabilator for 100 revolutions. Tablets were removed, de-dusted and weighed again.
% F = (Wi-Wr/Wi) 100
Drug Content
Five tablets were weighed individually and powdered. An amount equivalent to 5 mg of Atenolol was
accurately weighed and placed in a 100 ml volumetric flask to prepare a 100 ppm solution in phosphate
buffer pH. 6.8 or any solvent (as stock). From this 1ml dilute to 10 ml volumetric flask (10 ppm). The
sample was measured at λmax 226 nm using a Shimadzu UV/Vis double beam spectrophotometer and
Atenolol concentration was calculated from the standard curve prepared simultaneously.
Drug Excipients Interaction Study
Fourier Transform Infrared Spectroscopy (FT-IR)
It was determined by FT-IR (PRESTIGE-21, Shimadzu). The base line correction was done with blank
background measurement. Then the spectrum of dried drug was run. FT-IR spectra were recorded in the
wavelength region of 4000 to 500 cm -1
.
Differential Scanning Calorimetry (DSC)
The 3.41 mg of sample was weighed and sealed in aluminum pan. Empty aluminum pan was used as a
reference. DSC thermogram was recorded.
In-Vitro Drug Release Studies
The release rate of Atenolol from Push pull osmotic tablets was determined up to 12 hours using USP-type
II dissolution testing apparatus (paddle type). The dissolution test was performed using the dissolution
medium (900ml) consisted of 0.1N hydrochloric acid for first 2 hours and the phosphate buffer pH 6.8 from
3 to next 12 hours, maintained and at 50 rpm. A sample (5ml) of the solution was withdrawn from the
dissolution apparatus at specific time intervals (Each 1Hr) throughout the dissolution study of 12 hours for
analysis and replaced with fresh dissolution medium thus maintained sink condition. In 5ml solution
withdraw 1ml solution an dilute with phosphate buffer pH. 6.8. The samples were filtered using whatmann
Filter Paper. The samples were analysed for Atenolol at 226 nm using a Shimadzu UV-1800 UV/Vis
double-beam spectrophotometer. Cumulative percentage drug release (% CDR) was calculated using an
equation obtained from a standard curve and PCP Disso Software.
Kinetics of Drug Release

Pooja V. Kadu et al. / International Journal of Drug Research and Technology 2016, Vol. 6 (3), 150-163
http://www.ijdrt.com 154
The dissolution profile of all the formulations were fitted to zero order kinetics, first order kinetics,
Higuchi, Hixson-Crowell, Korsmeyer and Peppas to ascertain the kinetic modeling of drug release by using
a PCP Disso Version 2.08 software, and the model with the higher correlation coefficient was considered to
be the best model.
RESULT AND DISCUSSION
UV-Visible Spectroscopic Scanning-Spectral Analysis
Figure 1: Wavelength maxima of Atenolol in Methanol (Conc. 20ppm)–226 nm
Table 4: Standard calibration curve data for atenolol
Conc. (ppm) Abs. at (226nm)
0 0.0000
5 0.2104
10 0.4067
15 0.6231
20 0.7506
25 1.0456
Figure 2: Calibration curve of atenolol
Pooja V. Kadu et al. / International Journal of Drug Research and Technology 2016, Vol. 6 (3), 150-163
http://www.ijdrt.com 155
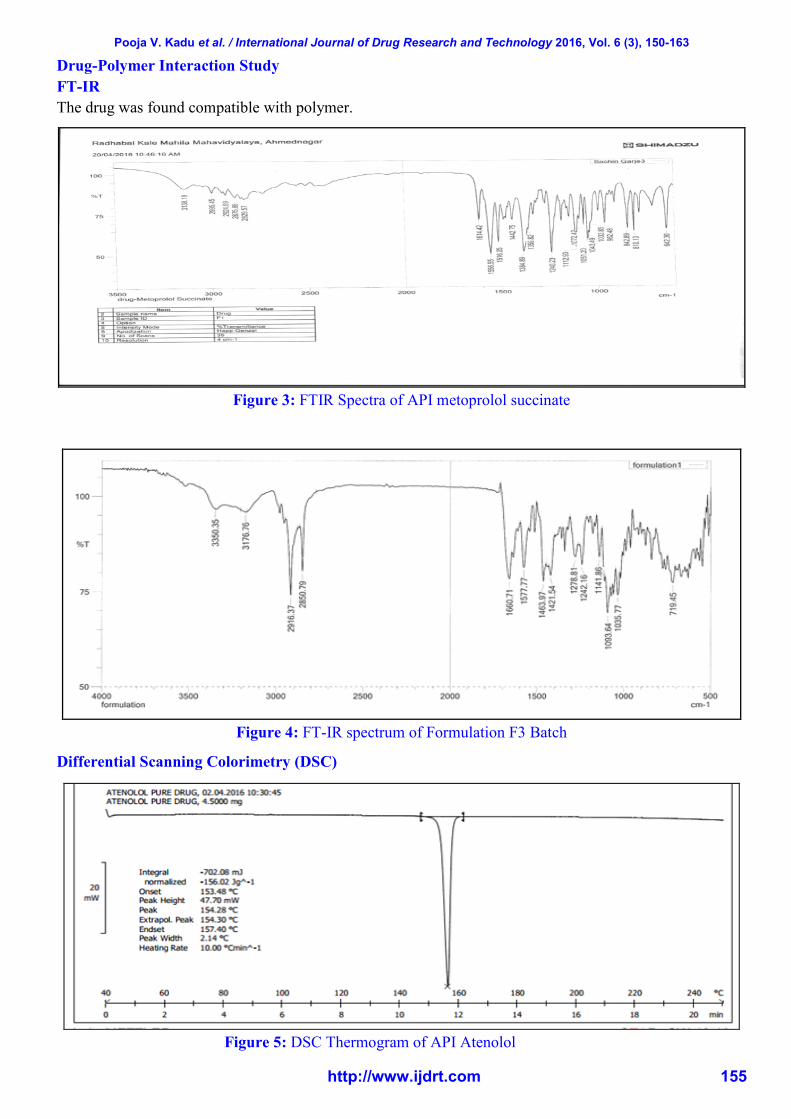
Drug-Polymer Interaction Study
FT-IR
The drug was found compatible with polymer.
Figure 3: FTIR Spectra of API metoprolol succinate
Figure 4: FT-IR spectrum of Formulation F3 Batch
Differential Scanning Colorimetry (DSC)
Figure 5: DSC Thermogram of API Atenolol
Pooja V. Kadu et al. / International Journal of Drug Research and Technology 2016, Vol. 6 (3), 150-163
http://www.ijdrt.com 156
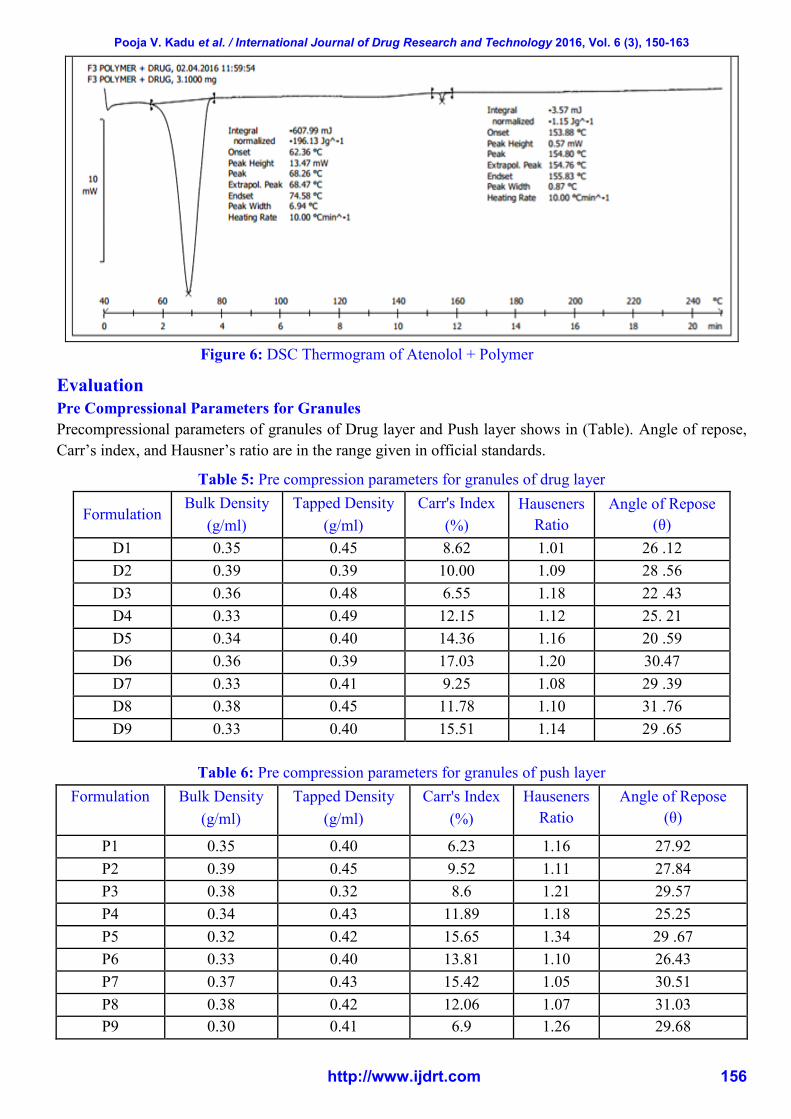
Figure 6: DSC Thermogram of Atenolol + Polymer
Evaluation
Pre Compressional Parameters for Granules
Precompressional parameters of granules of Drug layer and Push layer shows in (Table). Angle of repose,
Carr’s index, and Hausner’s ratio are in the range given in official standards.
Table 5: Pre compression parameters for granules of drug layer
Formulation Bulk Density
(g/ml)
Tapped Density
(g/ml)
Carr's Index
(%)
Hauseners
Ratio
Angle of Repose
(θ)
D1 0.35 0.45 8.62 1.01 26 .12
D2 0.39 0.39 10.00 1.09 28 .56
D3 0.36 0.48 6.55 1.18 22 .43
D4 0.33 0.49 12.15 1.12 25. 21
D5 0.34 0.40 14.36 1.16 20 .59
D6 0.36 0.39 17.03 1.20 30.47
D7 0.33 0.41 9.25 1.08 29 .39
D8 0.38 0.45 11.78 1.10 31 .76
D9 0.33 0.40 15.51 1.14 29 .65
Table 6: Pre compression parameters for granules of push layer
Formulation Bulk Density
(g/ml)
Tapped Density
(g/ml)
Carr's Index
(%)
Hauseners
Ratio
Angle of Repose
(θ)
P1 0.35 0.40 6.23 1.16 27.92
P2 0.39 0.45 9.52 1.11 27.84
P3 0.38 0.32 8.6 1.21 29.57
P4 0.34 0.43 11.89 1.18 25.25
P5 0.32 0.42 15.65 1.34 29 .67
P6 0.33 0.40 13.81 1.10 26.43
P7 0.37 0.43 15.42 1.05 30.51
P8 0.38 0.42 12.06 1.07 31.03
P9 0.30 0.41 6.9 1.26 29.68

Pooja V. Kadu et al. / International Journal of Drug Research and Technology 2016, Vol. 6 (3), 150-163
http://www.ijdrt.com 157
Evaluation of Post Compression Parameter
To shows post compressional parameters i.e. Hardness (7.26 to 7.50 kg/cm2), Friability (0.22 to 0.28 %),
Weight variation (0.490 to 0.510mg), Thickness (3.86 to 3.87 mm) and Diameter (9.02 to 9.04 mm). Drug
content was (98.28 to 98.16%) within the acceptable official limits.
Table 7: Post compression parameters of tablet formulation
Batch Weight variation
(n=20)
Thickness
(mm, n=10)
Diameter
(mm, n=10)
Hardness
(kg/cm2, n=10)
Friability
(%, n=20)
% Drug Content
(n=3)
Coating Thickness
(mm, n=3)
F1 500 ± 0.5 3.86 9.02 6.18 0.22 98.23% 0.21
F2 500 ± 1.0 3.86 9.04 7.04 0.24 98.12% 0.22
F3 490 ± 1.0 3.85 9.02 6.15 0.23 99.04% 0.23
F4 510 ± 0.5 3.85 9.02 6.10 0.26 99.16% 0.22
F5 500 ± 0.5 3.87 9.03 6.16 0.27 98.74% 0.21
F6 500 ± 1.5 3.86 9.03 6.12 0.25 97.29% 0.23
F7 490 ± 1.0 3.85 9.02 6.16 0.28 98.65% 0.21
F8 490 ± 1.5 3.86 9.04 6.17 0.22 99.02% 0.23
F9 500 ± 0.5 3.85 9.02 6.18 0.25 98.34% 0.21
In-Vitro Drug Release Studies
Table 8: In-vitro % Drug Release of F1 to F9
Percentage Cumulative Drug Release Profile of all formulations
Time [hr.] F1 F2 F3 F4 F5 F6 F7 F8 F9
0 0 0 0 0 0 0 0 0 0
1 41.39 34.41 28.85 34.47 39.20 48.21 28.91 31.04 27.12
2 43.04 38.52 42.88 39.14 43.61 55.43 32.44 38.49 31.01
3 49.12 45.61 50.85 43.27 48.19 58.82 39.69 46.16 37.18
4 54.22 51.12 58.24 50.78 54.13 62.91 44.20 52.21 43.86
5 58.11 57.19 64.19 56.38 59.60 68.39 49.02 58.80 50.04
6 62.14 66.22 71.93 63.17 64.01 73.29 57.32 66.31 56.24
7 68.45 72.41 75.27 68.93 68.32 77.94 62.11 71.89 60.71
8 71.32
77.81 81.79 74.88 73.11 82.18 68.87 78.97 69.20
9 76.26 83.20 86.18 80.96 76.48 87.17 76.22 83.47 77.38
10 81.52 86.26 90.14 85.75 81.24 93.01 82.10 88.90 82.93
11 86.11 88.43 95.05 89.53 85.92 96.71 90.23 91.57 88.15
12 89.57 90.04 98.28 94.51 92.47 98.15 96.57 95.08 91.64
Pooja V. Kadu et al. / International Journal of Drug Research and Technology 2016, Vol. 6 (3), 150-163
http://www.ijdrt.com 158
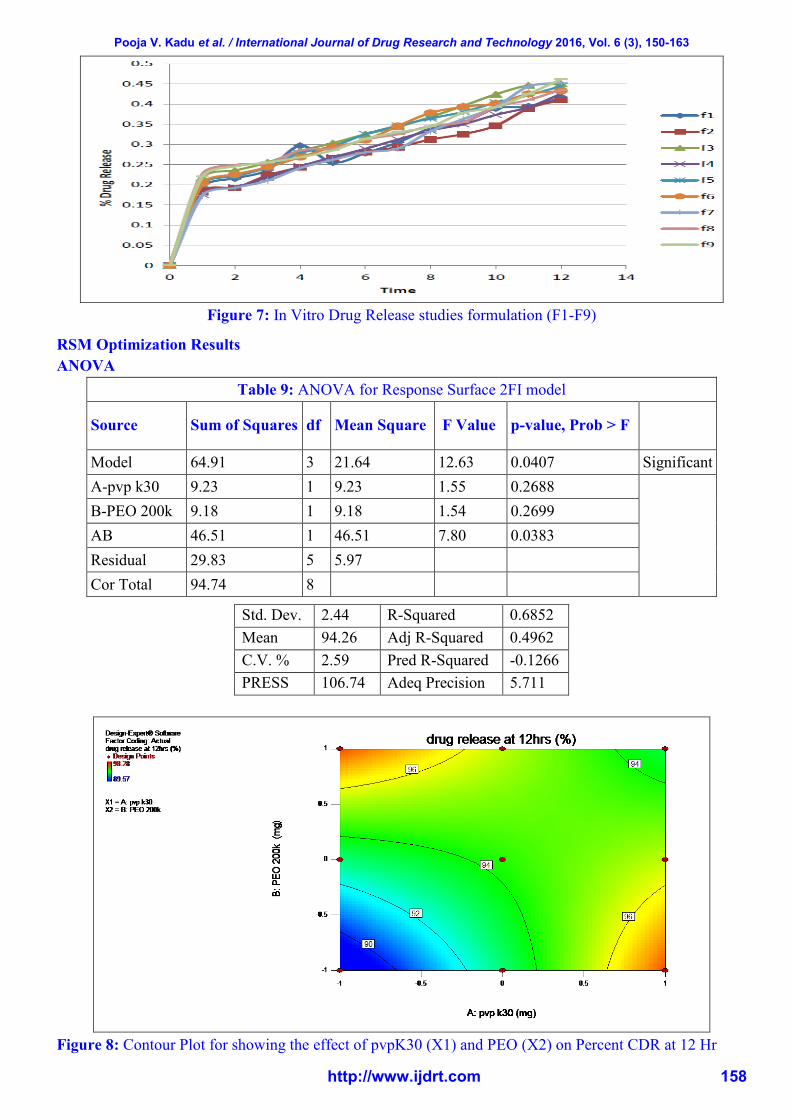
Figure 7: In Vitro Drug Release studies formulation (F1-F9)
RSM Optimization Results
ANOVA
Table 9: ANOVA for Response Surface 2FI model
Source Sum of Squares df Mean Square F Value p-value, Prob > F
Model 64.91 3 21.64 12.63 0.0407 Significant
A-pvp k30 9.23 1 9.23 1.55 0.2688
B-PEO 200k 9.18 1 9.18 1.54 0.2699
AB 46.51 1 46.51 7.80 0.0383
Residual 29.83 5 5.97
Cor Total 94.74 8
Std. Dev. 2.44 R-Squared 0.6852
Mean 94.26 Adj R-Squared 0.4962
C.V. % 2.59 Pred R-Squared -0.1266
PRESS 106.74 Adeq Precision 5.711
Figure 8: Contour Plot for showing the effect of pvpK30 (X1) and PEO (X2) on Percent CDR at 12 Hr
Pooja V. Kadu et al. / International Journal of Drug Research and Technology 2016, Vol. 6 (3), 150-163
http://www.ijdrt.com 159
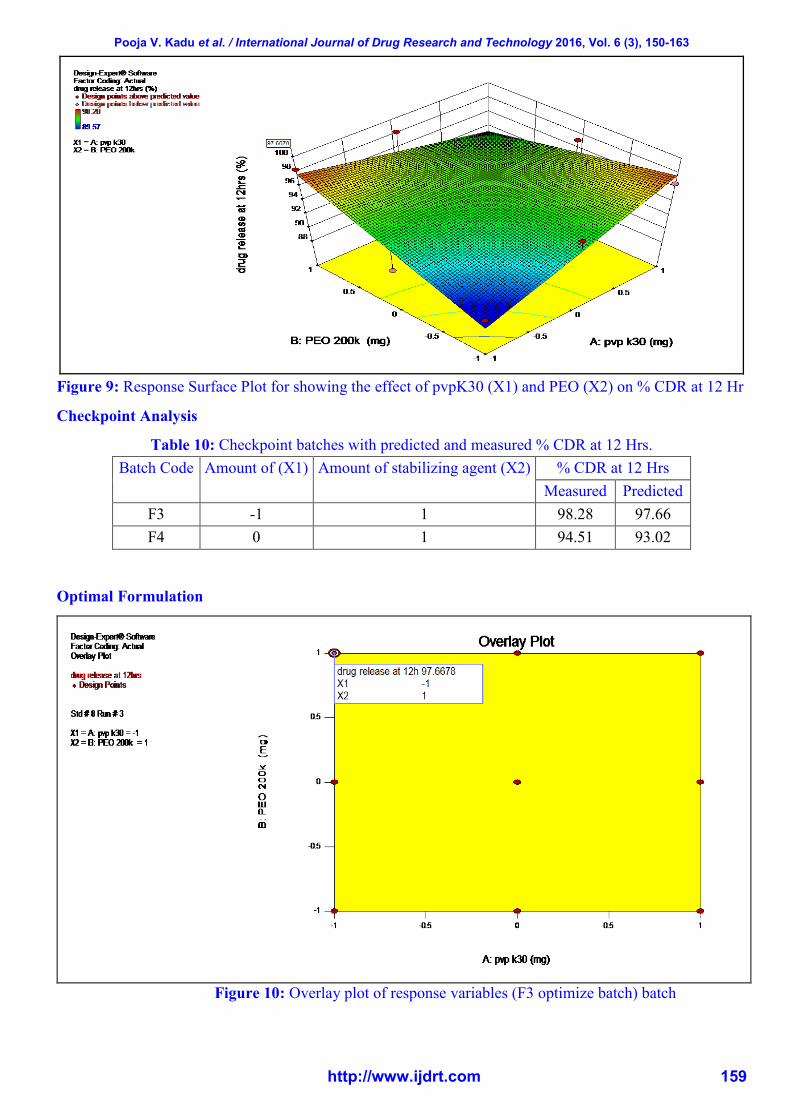
Figure 9: Response Surface Plot for showing the effect of pvpK30 (X1) and PEO (X2) on % CDR at 12 Hr
Checkpoint Analysis
Table 10: Checkpoint batches with predicted and measured % CDR at 12 Hrs.
Batch Code Amount of (X1) Amount of stabilizing agent (X2) % CDR at 12 Hrs
Measured Predicted
F3 -1 1 98.28 97.66
F4 0 1 94.51 93.02
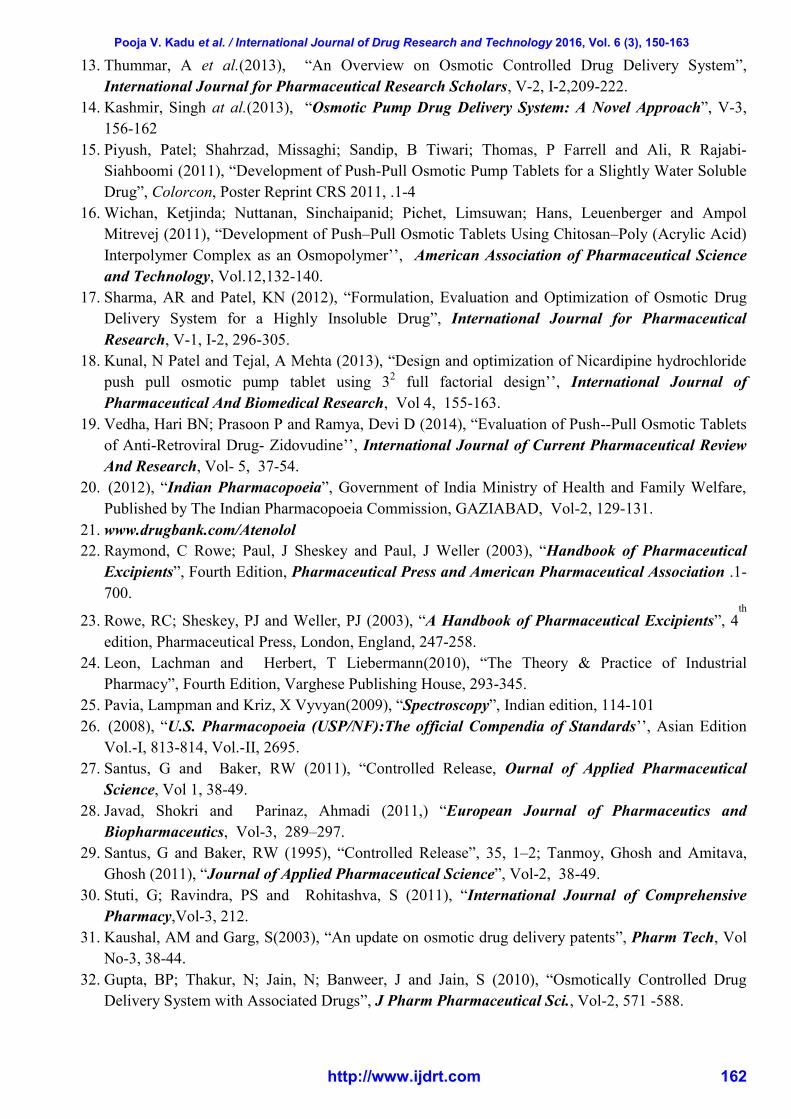
Optimal Formulation
Figure 10: Overlay plot of response variables (F3 optimize batch) batch

Pooja V. Kadu et al. / International Journal of Drug Research and Technology 2016, Vol. 6 (3), 150-163
http://www.ijdrt.com 160
Figure 11: Contour Plot for showing the effect of pvpK30 (X1) and PEO (X2)
%CDR at 12 hr with predicted value
Kinetics of Drug Release
To know the release mechanism and kinetics of optimized formulations (F3) were attempted to fit into
mathematical models and R2 values for zero order, first order, matrix Korsmeyer-Peppas and Hixon-
Crowel models were represented in Table
Figure 12: In Vitro Drug Release of F3 optimize Formulation
Model R K
Zero order 0.5668 10.0293
1st order 0.9415 -0.2717
Matrix 0.9565 30.0077
Peppas 0.9743 45.3292
Best fit model
Hix.Crow. 0.9479 -0.0601

Pooja V. Kadu et al. / International Journal of Drug Research and Technology 2016, Vol. 6 (3), 150-163
http://www.ijdrt.com 161
Stability Study Of Optimize Batch (F3)
(Storage Condition: 40º C ± 2º C / 75% RH ± 5% RH, Time Period: 3 months)
Table 11: Stability study on the optimized formulation F3
Sr. No Time (Days) % Purity
1 30 99.21
2 60 99.16
3 90 99.07
CONCLUSION
Atenolol is a Beta-1 selected adrenoceptor blocking agent, for oral administration in the treatment of
Hypertension, Angina pectoris and Heart failure. It has a half life of 6 to 7 hours. It gives once-a-day
administration.IR and DSC study shows that there is compatibility between drug and excipients. The
desired release profile was obtained by optimizing amount of osmotic agent, and osmopolymer. From the in
vitro drug release study, it was inferred that drug release increased with the amount of osmotic agent and
osmopolymer. To reduce the frequency of administration and to improve patient compliance, an
osmotically controlled release formulation of Atenolol is desirable.
ACKNOWLEDGEMENTS
The authors are thankful to Lupin Pharmaceutical, mulshi, Nande Village, Pune, Maharashtra (India) for
providing drug Sample and all The suppliers for gift samples and also sincere thanks to Prof. K N Tarkase
Sir and Prof. Dr. Prabhakar Ghorpade Sir for their grand support in project.
REFERENCES
1. Prescott, LF et al. (1989), “The Need For Improved Drug Delivery In Clinical Practice, In: Novel
Drug Delivery And Its Therapeutic Application”, John Wiley and Sons, West Susset, U.K. , Vol 1,
212-275.
2. Bhatt, PP (2012), “Osmotic Drug Delivery Systems For Poorly Water Soluble Drugs”, Pharma
Ventures Ltd., Oxford, Vol-2, 25-30.
3. Martin, A (1994), “Physical Pharmacy”, 4th
Edition, Lippincott Williams and Wilkins, 116-117.
4. Santus, G and Baker, RW J (2009), “Control Release, WEP, Osmotishe Umtersuchen”, Leipzig,
1877.
5. PH, Nikam; JA, Kareparamban; AP, Jadhav and VJ, Kadam (2012), “Osmotic Pump: A Reliable
Drug Delivery System’’, Research Journal of Pharmaceutical, Biological and Chemical Sciences,
Volume 3, Issue 3, 478-493.
6. MA, Khan; S, Bolton and MS, Kislalioglu (1994), Int. J. Pharm., Vol-2,102, 185.
7. Prasoon, P; Ramya, Devi D and Vedha, Hari BN(2014), “Push-Pull Osmotic Tablets - An Overview
with Its Commercial Significance’’, Research Journal of Pharmaceutical, Biological and
Chemical Science, Vol-12, 12-25.
8. Lewis, GA (2013), “Optimization Methods, Encyclopedia of Pharmaceutical Technology”, 3rd
Ed., Vol-12, Marcel Dekkar, New York, 2452-2462.
9. Schwartz, JB and Connor, RE(2013), “Optimization techniques in pharmaceutical formulation and
processing, Modern Pharmaceutics”, 3 Ed. Mercel Dekker, New York ,727-752.
10. Nasim, Sadri Alamdari and Zahra, Jafari Azar, (2012), “Preparation and evaluation of sustained
release pellets of Tramadol”, African Journal of Pharmacy and Pharmacology, Vol.6, 2123-2132.
11. Prescott, LF (1989), “The Need For Improved Drug Delivery In Clinical Practice, In: Novel Drug
Delivery And Its Therapeutic Application”, John Wiley and Sons, West Susset, U.K., 111.
12. Thorat, Mangesh S et al. (2012), “Overview of Past and Current Osmotic Drug Delivery Systems”,
International Journal of Pharmaceutical and Chemical Sciences, Vol. 1, 1092-1102.
Pooja V. Kadu et al. / International Journal of Drug Research and Technology 2016, Vol. 6 (3), 150-163
http://www.ijdrt.com 162
13. Thummar, A et al.(2013), “An Overview on Osmotic Controlled Drug Delivery System”,
International Journal for Pharmaceutical Research Scholars, V-2, I-2,209-222.
14. Kashmir, Singh at al.(2013), “Osmotic Pump Drug Delivery System: A Novel Approach”, V-3,
156-162
15. Piyush, Patel; Shahrzad, Missaghi; Sandip, B Tiwari; Thomas, P Farrell and Ali, R Rajabi-
Siahboomi (2011), “Development of Push-Pull Osmotic Pump Tablets for a Slightly Water Soluble
Drug”, Colorcon, Poster Reprint CRS 2011, .1-4
16. Wichan, Ketjinda; Nuttanan, Sinchaipanid; Pichet, Limsuwan; Hans, Leuenberger and Ampol
Mitrevej (2011), “Development of Push–Pull Osmotic Tablets Using Chitosan–Poly (Acrylic Acid)
Interpolymer Complex as an Osmopolymer’’, American Association of Pharmaceutical Science
and Technology, Vol.12,132-140.
17. Sharma, AR and Patel, KN (2012), “Formulation, Evaluation and Optimization of Osmotic Drug
Delivery System for a Highly Insoluble Drug”, International Journal for Pharmaceutical
Research, V-1, I-2, 296-305.
18. Kunal, N Patel and Tejal, A Mehta (2013), “Design and optimization of Nicardipine hydrochloride
push pull osmotic pump tablet using 32 full factorial design’’, International Journal of
Pharmaceutical And Biomedical Research, Vol 4, 155-163.
19. Vedha, Hari BN; Prasoon P and Ramya, Devi D (2014), “Evaluation of Push--Pull Osmotic Tablets
of Anti-Retroviral Drug- Zidovudine’’, International Journal of Current Pharmaceutical Review
And Research, Vol- 5, 37-54.
20. (2012), “Indian Pharmacopoeia”, Government of India Ministry of Health and Family Welfare,
Published by The Indian Pharmacopoeia Commission, GAZIABAD, Vol-2, 129-131.
21. www.drugbank.com/Atenolol
22. Raymond, C Rowe; Paul, J Sheskey and Paul, J Weller (2003), “Handbook of Pharmaceutical
Excipients”, Fourth Edition, Pharmaceutical Press and American Pharmaceutical Association .1-
700.
23. Rowe, RC; Sheskey, PJ and Weller, PJ (2003), “A Handbook of Pharmaceutical Excipients”, 4th
edition, Pharmaceutical Press, London, England, 247-258.
24. Leon, Lachman and Herbert, T Liebermann(2010), “The Theory & Practice of Industrial
Pharmacy”, Fourth Edition, Varghese Publishing House, 293-345.
25. Pavia, Lampman and Kriz, X Vyvyan(2009), “Spectroscopy”, Indian edition, 114-101
26. (2008), “U.S. Pharmacopoeia (USP/NF):The official Compendia of Standards’’, Asian Edition
Vol.-I, 813-814, Vol.-II, 2695.
27. Santus, G and Baker, RW (2011), “Controlled Release, Ournal of Applied Pharmaceutical
Science, Vol 1, 38-49.
28. Javad, Shokri and Parinaz, Ahmadi (2011,) “European Journal of Pharmaceutics and
Biopharmaceutics, Vol-3, 289–297.
29. Santus, G and Baker, RW (1995), “Controlled Release”, 35, 1–2; Tanmoy, Ghosh and Amitava,
Ghosh (2011), “Journal of Applied Pharmaceutical Science”, Vol-2, 38-49.
30. Stuti, G; Ravindra, PS and Rohitashva, S (2011), “International Journal of Comprehensive
Pharmacy,Vol-3, 212.
31. Kaushal, AM and Garg, S(2003), “An update on osmotic drug delivery patents”, Pharm Tech, Vol
No-3, 38-44.
32. Gupta, BP; Thakur, N; Jain, N; Banweer, J and Jain, S (2010), “Osmotically Controlled Drug
Delivery System with Associated Drugs”, J Pharm Pharmaceutical Sci., Vol-2, 571 -588.

Pooja V. Kadu et al. / International Journal of Drug Research and Technology 2016, Vol. 6 (3), 150-163
http://www.ijdrt.com 163
33. Dong, L; Shafi, K; Wan, J and Wong, PA(2000), “Novel osmotic delivery system: L-OROS Soft
cap, in Proceedings of the International Symposium on Controlled Release of Bioactive Materials,
Paris, France, 23-29.
34. Parmar, NS; Vyas, SK and Jain, NK (2008), “In: Advanced in Controlled and Novel Drug
Delivery”, CBS Publisher, 22-31.
35. Ade, RN; Lavande, JP; Dukale, SV; Jaiswal, SB; Sheaikh, SS and Chandewar, AV (2013),
“Osmotically controlled drug delivery system: an updated review”, International Journal of
Universal Pharmacy and Bio Sciences, 2 Vol-2, 183-206.
36. Gupta, S; Singh, RP; Sharma, R; Kalyanwat, R and Lokwani, P (2011), “Osmotic pumps: a review,
pharmacieglobale”, International Journal of Comprehensive Pharmacy, Vol 6, 1-8.
37. Gadwal, P and Rudrawal, P (2010), International Journal of Pharmacy & Life Sciences, Vol-2,
302-312.
38. NK, Jain(2011), “Advances in Controlled and Novel Drug Delivery”, CBS publisher & distributer,
First Adition.Vol.3, 20.
39. Verma, RK; Mishra, B and Garg, G (2000), “Osmotically controlled oral drug delivery”, Drug Dev.
Ind. Pharm., Vol-26, 695-708.
40. Vyas, SP and Khar, RK (2002), “Controlled Drug Delivery,Concepts And Advances”, 1st Ed.,
Vallabh Prakashan, New Delhi, 477-502.
41. Tzahi, Y Cath and Amy, E Childress (2006), “Menachem Elimelech Forward osmosis: Principles,
applications, and recent developments”, Journal of Membrane Science, 70–87.
Correspondence Author:
Pooja V. Kadu*
Department of Quality Assurance Technique, P.D.V.V.P.F’s College of Pharmacy (Savitribai Phule Pune University), Vilad
Ghat, Ahemadnagar-414001, Maharashtra, India
Cite This Article: Kailas, N Tarkase and Pooja, V Kadu (2016), “Formulation development, optimization
and evaluation of bilayer push-pull osmotic pump tablet of atenolol using 32 factorial designs”,
International Journal of Drug Research and Technology, Vol. 6 (3), 150-163.