Embed Size (px)
Citation preview

Preparation and identification of new Azo (methyl-xanthine) ligands and their transition metal complexes.
Ivan M Shaker, Hussien A Salih, Saad M Mahdi
Department of Chemistry, College of Science, Babylon University, Babylon-Iraq.
Abstract : Two of new azo methyl-xanthine ligands were prepared, via the reaction of the
diazonium salt of amino antipyrine with the coupling components (caffeine and theophylline)
in a 5% basic media in 0C˚ . The legends were identified with many techniques to ensure the
formation of these compounds such (FTIR spectroscopy , elementary analysis and mass
spectroscopy).
Three of divalent transition metal ion complexes (Co, Ni and Cu) for each ligand prepared,
after the fixation of the preparation demands (optimal concentration, optimal pH and M:L ratio)
, these were resulted from the an extensive UV-Visible study of the aqueous solutions of these
complexes. Two methods were used for M: L ratio determination (the mole ratio & continuous
variation methods), all these indicated the (1:2 ,M:L) ratios for all complexes.
The solid complexes were prepared and identified with the previous techniques (except mass
spectroscopy).Indeed there are many complimentary techniques were used for the
determination of the solid complexes geometry as (electrical molar conductivity, magnetic
susceptibility).
All complexes have the ionic properties with the presence of chloride ion out of the
coordination core.
Magnetic susceptibility data agreed with the present of (three odd electrons for cobalt
complexes, two odd electron for nickel complexes & odd electron for copper complexes) for
the two prepared ligands.
One pot data indicate the octahedral geometry for all complexes, and the prepared ligands
behaves as bidentate ligand via the imidazole nitrogen and the far azo nitrogen atom.
Keywords : methyl xanthine - Azo, Azo compounds, caffeine, theophylline, transition metal
complexes.
Introduction:-
Drugs can characterize and analyzed by using many analytical techniques (Spectrophotometric, FTIR,
NMR, MS and others)1, the colorimetric method regarded as one the famed one
2, while the formation of azo dye
was one of them3 when the drug component have a degree of nucleophicity that can react readily with the
diazonium salt to form a suitable color azo compound, that can characterize colorimetry owning specific λmax in
the visible region of the UV-visible spectrum.
Methyl –xanthines (Caffeine and theophylline) are in the family of alkaloid methyl-xanthins, can be
normally found in cola nuts, coffee bean ,tea leaves and other kind of plants 4they were used as stimulators
especially caffeine the most frequently psychoactive substance in the world5.
International Journal of ChemTech Research CODEN (USA): IJCRGG, ISSN: 0974-4290, ISSN(Online):2455-9555
Vol.9, No.10 pp 99-110, 2016

Ivan M Shaker et al /International Journal of ChemTech Research, 2016,9(10),pp 99-110. 100
Methyl-xanthine (especially theophylline) can determine by spectrophotometry
6,titrimetry
7,
complexmetry8, colorimetry
9, phosphorimetry
10 and chromatography
11.While an azo coupling reaction with
(sulfanilic acid) act as classic method for determination (pauly reaction)12
.Indeed, many azo-theophylline was
synthesized from coupling with salt of diazonium of different aniline derivatives13,14,15
.
Caffeine in the other hand, measured mostly by chromatography method (HPLC)16
, and scarce
literature , which focused on the determination of caffeine using the azo reaction17
.
The utilizing of these azo-methylxnthine in the field of analytical chemistry, via complexation of these
chelates with ions of the metals.
Through our expansion in search of the literature, we did not find only a few research18,19
, it is believed
that the reason for this is attributed to the lack of researchers in this area , while we did not find any inorganic
chemistry study and was limited to the analytical side only.
So it was our vision to engage in the midst of thread and worked to prepared and identified of two azo
-methyl xanthine ligands (TAAP & CAAP) and their transition metal element complexes.
Experimental
All chemicals used in this work were of analytical reagent grade from (Fluke, BDH and Sigma).
(C.H.N) % for the ligand and its complexes determined by (Micro Analytical unit, 1108 CHN Elemental
analyzer).
Melting points with (Stuarts SPM300).
UV-Visible spectroscopic data by (Shimadzu 1650 PC).
Mass spectra was done by (Shimadzu GCMS QP2010 ultra)with ionization energy (5-20 eV).
IR Data by using (Shimadzu 8400S FTIR test scan series).
Molar electrical conductivity measured by (Info lab terminal).
Balance magnetic Susceptibility Model MSB-MKI.
Procedures
Azo compound preparation
Azo –methylxanthine ligands were prepared , via preparation of daizonium salt of p-amino
antipyrine(0.01mole,2.03gm) dissolved in a cold acidic media ( 10 ml conc.HCl +10ml D.W) , then transfer the
component to a crashed ice bath , then a solution of NaNO2(0.01 mole , 0.7gm) in 10 ml D.W was added
carefully and dropwise to the antipyrine solution at 0C˚ then it left for 15 min. to complete the daization .
The coupling component of methylxanthin ( theophylline 0.01 mole , 1.8gm& caffeine 0.01 mole,
1.94gm) were dissolved in 5% aqueous basic solution ( KOH for theophylline13
, NaOH+Na2CO3(modified
procedure) for caffeine, then transfer the container to the iced bath , after the daizoation period was complete ,
the daizonium solution was droped on the mehylxanthin solutions with stirring at 0C˚, the brown colour was
observed within operation and the pH value was adjested to a neutral value ,hence the azo dye was formed as
fine powder ,then they filtered and washed with DDW to remove the trace of salt formed and driad with 80C˚
oven , then recrystallized with hot ethanol , and the yieldswas calculated for each dye.
Azo complex preparation
Methyl xanthine azo complexes were prepared with the same procedure , after the fixation of optimal
conditions(pH and concentration) , indeed to the suitable mole ratio for solid complex preparation ( M:L,1:2) ,
that a 0.01 mole of each ligands (0.79 gm of TAAP and 0.818gm of CAAP) were dissolved in 75 ml hot
absolute ethanol and transferred to the 250 ml round bottom flask , then a 0.005 mole of metal chloride salts of
(Cobalt, Nickel and Copper ) dissolved in there optimal pH value of ammonium acetate buffer solutions , the
salt solution was dropped slowly on the ligand solution with stirring and heating at 70C˚, and the reaction
complete within one hour, with the monitoring by TLC technique then the reaction mixture reduced to the half
, and with the assistment of iced bath , the colored fin crystal of the complex appered , filtered and washed with

Ivan M Shaker et al /International Journal of ChemTech Research, 2016,9(10),pp 99-110. 101
few amount of hot ethanol : water mixture to remove unreacted compound , dried at 80C
˚ oven then the yield
calculated.
Table 1. Some Physical properties and Elementary analysis for the ligands and their complexes.
Compounds M.Wt
g/mol
Color m.p C˚ Yield Elementary analysis
C% found
(calculated)
H %
found
(calcul
ated)
N%
found
(calculat
ed)
M%
found
(calcul
ated)
CAAP
408.41 brown 144-146 88% 55.93
(55.88)
4.98
(4.94)
27.45
(27.44)
--------
----
[Co(CAAP)2(H2O)C
l] Cl
964.68 Black
brown
163-165 80% 47.38
(47.31)
4.42
(4.39)
23.28
(23.23)
6.16
(6.11)
[Ni(CAAP)2(H2O)Cl
] Cl
964.44 Deep
maron
173-175 83% 47.33
(47.32)
4.43
(4.39)
23.27
(23.24)
6.15
(6.09)
[Cu(CAAP)2(H2O)C
l] Cl
969.30 Brisk 151-153 79% 47.11
(47.09)
4.40
(4.37)
23.18
(23.12)
6.59
(6.56)
TAAP
394.39 Brown
reddish
149-151 86% 54.88
(54.82)
4.61
(4.60)
28.48
(28.41)
--------
----
[Co(TAAP)2(H2O)C
l] Cl
936.63 Honey 210-212 82% 46.22
(46.16)
4.11
(4.09)
23.99
(23.93)
6.33
(6.29)
[Ni(TAAP)2(H2O)Cl
] Cl
936.39 Maroon 213-215 81% 46.20
(46.18)
4.13
(4.09)
23.98
(23.93)
6.35
(6.27)
[Cu(TAAP)2(H2O)C
l] Cl
941.24 Deep
brisk
170-172 81% 45.98
(45.94)
4.10
(4.07)
23.88
(23.81)
6.80
(6.75)
CAAP= C19H20N8O3 , TAAP= C18H18N8O3
CAAT = Caffiene azo antipyrine
TAAP= Theophyline azo antypyrine
Results and discussion
Azo compound preparation methods vary depending on their components (coupling and amine) and
their condition is not the same 20
.
Methyl xanthines can be regarded as coupling components, due to they owned a degree of
nucleophicity at C8 position, it can developed in a basic media.
In this article they used 5% KOH solution for theophylline, while a mixed 5% basic (NaOH +Na2CO3)
solution was used for caffeine, to avoid dissociation and enhanced the nucleophicity.
Two of methyl xanthine azo ligands were prepared, via coupling the diazonium salt of 4-amino
antipyrin with (theophylline and caffeine) in 5% basic solution at 0 C˚ as in the following reaction.

Ivan M Shaker et al /International Journal of ChemTech Research, 2016,9(10),pp 99-110. 102
O
N
N
H3C
CH3
NH2
HCl/H2O
NaNO2
O
N
N
H3C
CH3
N2Cl
O
N
N
H3C
CH3
N2Cl
+
ON
CH3
N
X
N
N
CH3
O
x=H,CH3
Azo reaction
0C
0C
O
N
N
H3C
CH3
NON
CH3
N
N
N
CH3
O
N
X
X =H,CH3
5% basic media
Fig.1 Schematic reaction of (TAAP &CAAP) preparation
These ligands were brown fine powder, insoluble in water, but soluble in most organic solvents
(ethanol, methanol, acetone, DMF, DMSO, acetonitrile, chloroform and dichloromethane).
FTIR technique can utilized for organic compound identification21
, it can show the functional groups of
the chemicals, the main functional groups of azo compounds can observe in the IR spectra, in this work there
are some groups developed for(CAAP&TAAP )as(N-H imd str. 3438cm-1
&3487cm-1
) for the two ligands
respectively.
Imidazole azomethine give a st. band in the region (1600&1597)cm-1
, while the azo dye group (N=N)
observed within (1454& 1452) cm-1
,xanthine carbonyl system was clearly shown at (1660-1701)cm-1
,these can
show in the figure.2

Ivan M Shaker et al /International Journal of ChemTech Research, 2016,9(10),pp 99-110. 103
Fig.2 FTIR Spectra for ( CAAP) & (TAAP)
Another analytical technique was used for identification, Mass spectroscopy, they can able to sorts
ions based on their mass (weight), one of the mass spectrum usage to determine the masses of the particles and
of molecules, and to elucidate the chemical structure of the molecules22
.
Mass fragmentation of the ligands (TAAP &CAAP), detected the M and (M+1) clearly, that the
molecular mass of these ligands obtaind from their spectras , as aresults the (m/z)that equavelant to the mass of
CAAP , was equal to (408), while TAAP (m/z)equal to (394), the spectras can shown in fig.3
Fig.3 Mass spectra of (CAAP & TAAP)
Optimal condition determination
Organic ligands can act as chelating agent, due to their owing of donating atomsthat used for ions
coordinating and they can determine them coloromitry using UV-Visible technique, that the colored mixtures
have specific (λmax) under condition (conc.&pH), that obey the lambert – beers low.
In the UV-Visible study the ligands (CAAP & TAAP) λmax were determined, spectrophotometry as
shown;
CAAP
TAAP
Ivan M Shaker et al /International Journal of ChemTech Research, 2016,9(10),pp 99-110. 104
Sample-1
Abs
orba
nce(
Abs
)
Wavelength(nm)
0.0
0.5
1.0
1.5
200 300 400 500 600 700
(2
06
.0, 2
.66
55
) (
21
0.0
, 1.6
10
7)
(2
52
.0, 1
.47
40
) (
26
0.0
, 1.3
68
8)
(2
74
.0, 1
.26
66
) (
28
0.0
, 1.1
81
0)
Fig.4 UV-Visible spectra of the prepared
ligands.
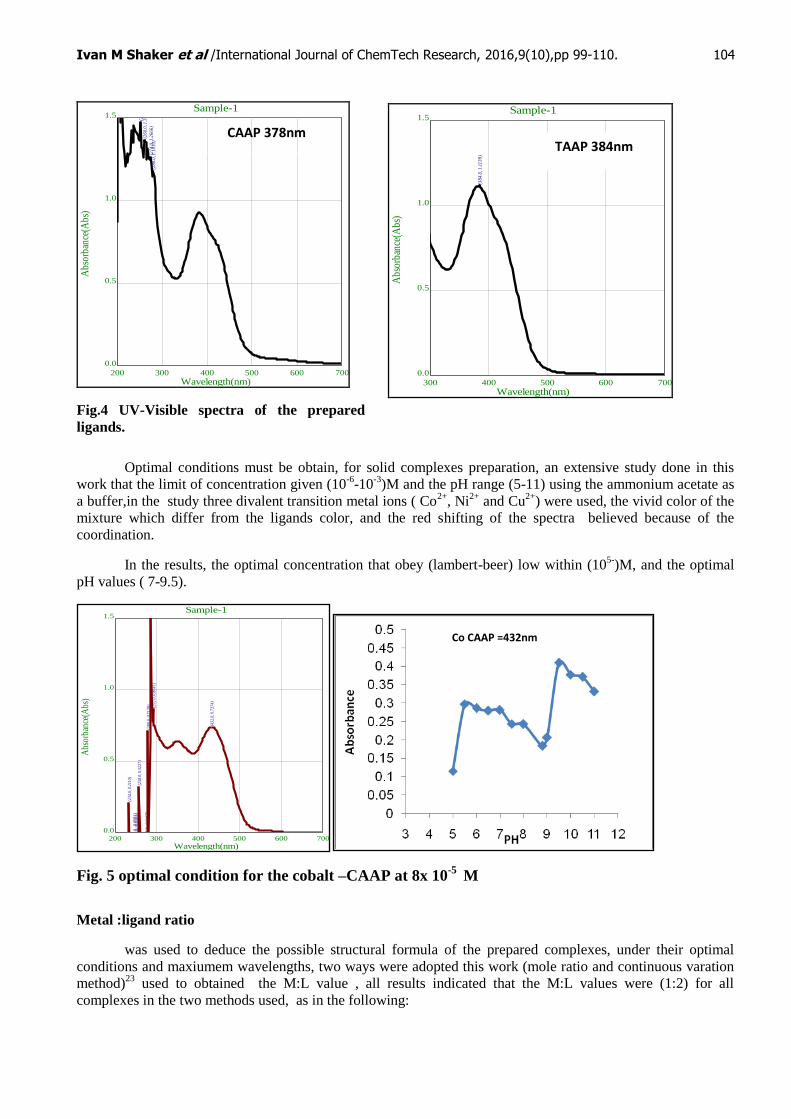
Optimal conditions must be obtain, for solid complexes preparation, an extensive study done in this
work that the limit of concentration given (10-6
-10-3
)M and the pH range (5-11) using the ammonium acetate as
a buffer,in the study three divalent transition metal ions ( Co2+
, Ni2+
and Cu2+
) were used, the vivid color of the
mixture which differ from the ligands color, and the red shifting of the spectra believed because of the
coordination.
In the results, the optimal concentration that obey (lambert-beer) low within (105-
)M, and the optimal
pH values ( 7-9.5).
Fig. 5 optimal condition for the cobalt –CAAP at 8x 10⁻⁵
M
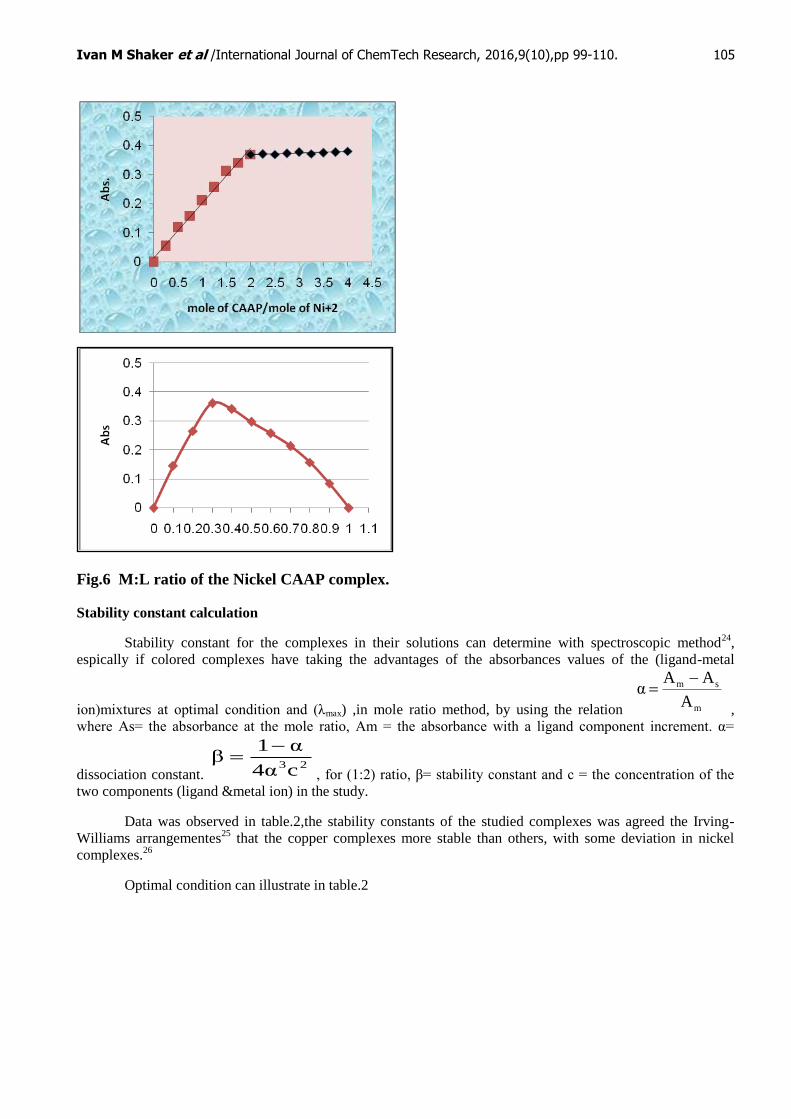
Metal :ligand ratio
was used to deduce the possible structural formula of the prepared complexes, under their optimal
conditions and maxiumem wavelengths, two ways were adopted this work (mole ratio and continuous varation
method)23
used to obtained the M:L value , all results indicated that the M:L values were (1:2) for all
complexes in the two methods used, as in the following:
Sample-1
Abs
orba
nce(
Abs
)
Wavelength(nm)
0.0
0.5
1.0
1.5
200 300 400 500 600 700
(234
.0, 0
.211
0) (2
46.0
, -0.
0581
) (2
50.0
, -0.
0561
) (2
58.0
, 0.3
227)
(276
.0, -
0.04
67)
(280
.0, 0
.713
9) (2
86.0
, 1.5
495)
(292
.0, 0
.864
1)
(432
.0, 0
.737
4)
CAAP 378nm
Sample-1
Abs
orba
nce(
Abs
)Wavelength(nm)
0.0
0.5
1.0
1.5
300 400 500 600 700 (
20
6.0
, 0.3
82
0)
(2
18
.0, 1
.11
89
) (
22
2.0
, 0.5
80
6)
(2
28
.0, 0
.49
53
) (
23
4.0
, 0.3
91
3)
(2
42
.0, 0
.62
87
) (
24
8.0
, 0.7
19
2)
(2
56
.0, 0
.42
53
) (
26
4.0
, 0.6
28
3)
(2
70
.0, 0
.68
20
) (
27
8.0
, 0.4
73
6)
(2
82
.0, 0
.80
96
) (
29
2.0
, 0.9
45
8) (3
84
.0, 1
.11
39
)
TAAP 384nm
Co CAAP =432nm
Ivan M Shaker et al /International Journal of ChemTech Research, 2016,9(10),pp 99-110. 105
Fig.6 M:L ratio of the Nickel CAAP complex.
Stability constant calculation
Stability constant for the complexes in their solutions can determine with spectroscopic method24
,
espically if colored complexes have taking the advantages of the absorbances values of the (ligand-metal
ion)mixtures at optimal condition and (λmax) ,in mole ratio method, by using the relation m
sm
A
AAα
,
where As= the absorbance at the mole ratio, Am = the absorbance with a ligand component increment. α=
dissociation constant. 23c4α
α1β
, for (1:2) ratio, β= stability constant and c = the concentration of the
two components (ligand &metal ion) in the study.
Data was observed in table.2,the stability constants of the studied complexes was agreed the Irving-
Williams arrangementes25
that the copper complexes more stable than others, with some deviation in nickel
complexes.26
Optimal condition can illustrate in table.2
XM
Ni CAAP

Ivan M Shaker et al /International Journal of ChemTech Research, 2016,9(10),pp 99-110. 106
Table .2 Optimal condition data for (TAAP&CAAP)
Ligand ( 5X10⁻⁵
)M
Conc.
Metal
ion
λmax
nm
Optimal
Conc.x10-5
Optimal
pH
ε x103
L / mol.cm β
L2 /mol
2 logβ
TAAP λmax = 384nm
ε = 12x103 L /mol.cm
Co(II)
Ni(II)
Cu(II)
426
444
450
8
7
6
9
9
7
4.2
4.18
4.5
2.29X10¹²
1.11X10¹²
3.32x10¹²
12.3
12.04
12.52
CAAP λmax = 378nm
ε = 9x10³ L /mol.cm
Co(II)
Ni(II)
Cu(II)
432
430
428
8
7
7
9.5
9
8.5
5.1
5.2
4.4
2.65X10¹²
2.07X10¹²
4.32X10¹²
12.42
12.31
12.63
Solid complexes were prepared depending on the optimal condition needed, the complexes synthetic
were confirmed via TLC, elementary analysis and FTIR technique, an increment in (hydrogen atom) in
elementary analysis may attributed to the presence of an aqua molecule within complexes,this will confirmed
with FTIR results,later.
FTIR data emphasized the complex formation27
via the alteration of the shape and site of two means
bands , due the coordination with the azo-methylxanthin ligands, by shifting of the azomethane and azo group
towered lower frequances, indded the appearance of metal-nitrogen band28
, while a brodining in most
complexes due the appearance of an aquamolecule,that has a hydroxyl group interfered with (imidazole N-H)
band,and appeared clearly in the others. And its oxygen atom can coordinate to the metal ions 28
.
FTIR data presented in table.3
Table.3 FTIR data for (CAAP &TAAP) and their complexes in cm-1
Compound imdN-H Aq.(OH
)
Imd(C=N) N=N M-Ow
(H2O)
M-N
CAAP 3439 ---- 1600 1454 ----- -----
CoCAAP 3440 Int. 1591 1435 914 462
NiCAAP 3434 Int. 1591 1429 910 437
CuCAAP 3432 Int. 1591 1446 900 435
TAAP 3487 ---- 1597 1452 ------ ------
CoTAAP 3485 3429 1593 1435 916 457
NiTAAP 3488 3408 1591 1442 881 432
CuTAAP 3484 3414 1589 1444 875 439
FTIR Spectra of the copper complexes are shown as :

Ivan M Shaker et al /International Journal of ChemTech Research, 2016,9(10),pp 99-110. 107
Fig.7 Copper complexes FTIR Spectra
Electrical Molar conductivity
Ionic formula of the complexes could be known by conductivity measurement, that the electrical
conductivity proportional to the charged species in the solution 24
, reach zero value in non-ionic complexes.
The present work , three solvents was used for solvation of the complexes at room temp and 10-3
M
concentration, all measurements confirmed that all complexes were ionic by the ratio (1:1), this means the
presence of free chloride ion in the solutions, the electrical molar conductivity data shown in the following table
:
Table .4Electrical molar conductivity at 25C˚ and 1X10
-3M conc.
Am (S.mol-1
.cm-2
) Complex
(DMF) (DMSO) (EtOH)
35.1 42.5 42.1 [Co(TAAP)2 (H2O)Cl] Cl
39.0 26.5 34.8 [Ni(TAAP)2 (H2O)Cl] Cl
52.0 34.5 36.6 [Cu(TAAP)2 (H2O)Cl] Cl
42.3 48.6 37.4 [Co(CAAP)2 (H2O)Cl] Cl
87.0 60.7 45.3 [Ni(CAAP)2 (H2O)Cl] Cl
75.0 52.2 41.7 [Cu(CAAP)2 (H2O)Cl] Cl

Ivan M Shaker et al /International Journal of ChemTech Research, 2016,9(10),pp 99-110. 108
Magnatic susceptibility data
Magnetic susceptibility data act as a complementary tool for the complexes geometry suggestion
(especially for TME΄s) 29
, via the study influence of the partially filled outer orbital, magnetic data supplied us
with the electronic contribution and the metal oxidation state, that the number of odd electron(s) for the metal
play a role which either complex in the high - spin state or low30
.
-The Cobalt complexes have a (4.18 & 4.33 B.M ) values for (Co-CAAP and Co-TAAP) complexes
respectively and this agreed with the abundance of three odd electrons of octahedral cobalt complexes 31
While the Nickel complexed gives a (3.08 & 3.11) B. M for (CAAP and TAAP) complexes
respectively , this will agreed with octahedral nickel complexes that have two odd electrons30
.
Copper susceptibility values were (1.87 & 1.83) B.M for copper complexes of the two ligands (CAAP
and TAAP); this was tuned with the odd electron octahedral copper complexes as in literature32
.
Electronic spectrca of the complexes was not studied in this work, due to the weakness of the d-d
transitions (forbidden) ,and there are interfered with the CT band of the complexes.
Suggested complexes geometry
Work results indicated that the azo methylxanthin ligands (TAAP&CAAP) complexes have
- the octahedral geometry
- the ligands chelated from the imidazole nitogen atom and the far azo nitrogen atom.
- the complexes was ionic
- the present of aqua molecule within coordination sphere .
An example of these complexes geometry , as shown in the following cobalt complexes.
N
N
N
CH3
O
N
H3C
O
O
N
N
H3C
CH3
N
NN
N
N
H3C
O
N
CH3
O
O
N
N
CH3
H3C
N
N
Co
Cl
OH2
Cl
X
X
Where x = H for (CoTAAP), x=CH3 for (CoCAAP).
Figure.8 Cobalt complexes geometry
Conculsions:-
Form the work results , we coculded :-
1. Methyl xanthin (theophylline and caffeine) can measure spectrophotometrically via azo reaction, in
addition to the chromatotgraphic methods.
2. They can form an organic ligands via coupling with different amines, in a feasible procedure .

Ivan M Shaker et al /International Journal of ChemTech Research, 2016,9(10),pp 99-110. 109
3. These ligands can utilize in the field of analytical chemistry, due to their sensitivity to a low ionic
concentration, and formation of vivid colored solution can detect colorimetry .
4. Azo methylxanthin can formed a stable complexes with metallic ions, espically TME, have different
geometries according to their conditions and results.
5. They believe that the ligands and their complexes have to some extent, biological activity against
microbiol .
The novelty of the ligands was developed in (REAXYS), that they were new ligands as :
References
1. H.G.Brittain " Analytical profiles of Drug substances and Excipitins", Academic press 2002,29.
2. A.Kar " Pharmaceutical Drug analysis ", New age international Publishers,2005.
3. S. A. Adrabigbe, O. A. Adegoke, O. S. Idowu and S. O. Olaleye, Sensitive spectrophotometric
determination of aceclofenac following azo dye formation with 4-carboxyl -2,6 dinitrobenzene
dizonium ion. Acta Poloniae Pharmaceutica - Drug Research, 2012,69 , 2; 203-211.

Ivan M Shaker et al /International Journal of ChemTech Research, 2016,9(10),pp 99-110. 110
4. M.M. Paradkar and J. Irudayara,A Rapid FTIR Spectroscopic Method for Estimation of Caffeine in
Soft Drinks and Total Methylxanthines in Tea and Coffee
5. Journal of food Science.2002, 67,7;2507-2511.
6. Lovett. R. Coffee: The demon drink? New Scientist. 2005, 24:2518.
7. British Pharmacopeia, Pharmaceutical Press, London, 1980.
8. T. Medwick and F. Schiesswohl, Nonaques titimitric analysis of aminophylline , journal of
pharmaceutical science. 1963, 52;843-846.
9. F. Pellerin and G. Leroux-Mamo,Titrations in concentrated saline medium: application to the
argentimetric determination of theophylline and theobromine,Ann. Pharm. Fr.1971., 29; 153-160.
10. B. M. Scheinthal and L.Chafetz, Eur. Pat. Appl.1982,12.
11. R. P. Bateh and J. D. Winefordner, the analysis of theophylline-contianing pharmaceuticals by room
temperature –phosphoresence, Anal. Lett. 1982, 15; 373-383.
12. B. M. Scheinthal and L.Chafetz, specific gas chromatographic determination of xanthine and
barbiturates by flash-heater N-butylation, journal of chromatography,1973. 76; 467-470.
13. H. Pauly,Über die Konstitution des Histidins. I. Mitteilung. Z. Physiol. Chem. 1904, 42;508-518.
14. A. P. Mazurek, L. Skulskib and J. C. Dobrowolski,Tautometric azo-hydrazo equilibria in 8-
arylazotheophyllines:theoretical and exprimintal studies J. of Mol. Str. 1997., 410 ; 421-424
15. C. E. Muller, R. Sauer, U. Geis, W. Frobenius, P. Talik, andM. Pawlowski, Aza-analogs of 8-
Styrylxanthine as A2A –adenosine receptor antigonists, Arch. Pham Pham Med Chem 1997, 330;181-
189.
16. S. R. EL-Shabguri, S. A. Hussein and S. E. Emara , colorimetric determination of theophylline and
aminophylline with diazoted p-nitroaniline, Talanra, 1989., 36, 12; 1288-1290.
17. P. L. Fernández, M. J. Martín, A. G. González and F. Pablos , HPLC determination catechins and
caffeine in tea.different of green,black and instant tea.Analyst, 2000,125; 421-425.
18. P. M. Best and C. W. Abramcheck , The metallochromic indicator dye Arsenazo III forms 1 : 1
complexes with caffeineBiochimica et Biophysica Acta 1985, 838 ;179-182
19. N.N.Basargin, D.N. Askerov, I.K.Gusejnov and Sh.U. Islamov, on relationship between acid-base
properties of azo compounds based on theophylline and analytical characteristics of its complexes with
scandium and copper. Zhurnal Neorganicheskoj Khimii. 1981., 26(2) ; 368-373,
20. N.N.Basargin, D.N. Askerov, I.K.Gusejnov and Sh.U. Islamov, on relationship between acid-base
properties of azo compounds based on theophylline and analytical characteristics of their complexes
with rare earths. Zhurnal Neorganicheskoj Khimii.1982., 27(2) ; 311-315.
21. H.Zollinger " Diazo chemistry", VCH publisher , 1995.
22. 21.D.L.Pavia, G.M.Lampman, G.Z.Kriz"Introduction of spectroscopy" 5thed , Cengage learning, 2015.
23. J.D. Watson & O.D. Sparkman; "Introduction to mass spectrometry", 4th ed. John Wiley &Sons Ltd.
2007.
24. D. A. Skooge, “Fundamentals Analytical Chemistry”, 5th. Ed. , New York, 1988.
25. G.W. Ewing “Instrumental Methods of Chemical Analysis”, 5th ed. McGraw– Hill ,1985.
26. H.Iriving and R.Williams, the stability of transition - metal complexes,journal of the chemical society,
1953;3192-3210.
27. D.L. Leussing, the estimation of the stabilities of bivalent transition metal complexes and deviations
from the Irving-Williams order, Talanta,1960,4;264-267.
28. M. SÖNMEZ. Synthesis and characterization of copper(II), nickel(II), cadmium(II), cobalt(II) and
zinc(II) complexes with 2-Benzoyl-3-hydroxy-1-naphthylamino-3-phenyl-2-propen-1-on.
Truk.J.Chem.,2001,25;181-185.
29. K. Nakamoto;" Infrared and Raman Spectra of Inorganic and Coordination compounds". 6th Ed, John
Wiley& Sons, Inc. Publication. 2009.
30. R. Jeans and E. Moore; " Metal ligand bonding ", Royal Society of chemistry ". 1st published, 2004.
31. Lever ABP, ”Inorganic Electronic Spectroscopy” 2nd
Ed, Elsevier, 1984.
32. B. Singh, R. N. Sing and R. C. Aggarwal. Magnetic and spectral studies on N-(thiophene-2-
carboxmido)salicylaldimine complexes of some binvalent 3d metal ions. Polyhedron, 1985.4; 401-407.
33. J. Kotz, P. Treichel, J. Townsend and D. Treichel "Chemistry &chemical reactivity " 9th Ed. Cengage
learning, USA, 2015.
*****