Embed Size (px)
Citation preview
8/6/2019 International Journal of Biometrics and Bioinformatics IJBB_V5_I2
http://slidepdf.com/reader/full/international-journal-of-biometrics-and-bioinformatics-ijbbv5i2 1/133
8/6/2019 International Journal of Biometrics and Bioinformatics IJBB_V5_I2
http://slidepdf.com/reader/full/international-journal-of-biometrics-and-bioinformatics-ijbbv5i2 2/133
INTERNATIONAL JOURNAL OF BIOMETRICS
AND BIOINFORMATICS (IJBB)
VOLUME 5, ISSUE 2, 2011
EDITED BYDR. NABEEL TAHIR
ISSN (Online): 1985-2347
International Journal of Biometrics and Bioinformatics (IJBB) is published both in traditional paper
form and in Internet. This journal is published at the website http://www.cscjournals.org,
maintained by Computer Science Journals (CSC Journals), Malaysia.
IJBB Journal is a part of CSC Publishers
Computer Science Journals
http://www.cscjournals.org

8/6/2019 International Journal of Biometrics and Bioinformatics IJBB_V5_I2
http://slidepdf.com/reader/full/international-journal-of-biometrics-and-bioinformatics-ijbbv5i2 3/133
INTERNATIONAL JOURNAL OF BIOMETRICS AND
BIOINFORMATICS (IJBB)
Book: Volume 5, Issue 2, May 2011Publishing Date: 31-05-2011
ISSN (Online): 1985-2347
This work is subjected to copyright. All rights are reserved whether the whole or
part of the material is concerned, specifically the rights of translation, reprinting,
re-use of illusions, recitation, broadcasting, reproduction on microfilms or in any
other way, and storage in data banks. Duplication of this publication of parts
thereof is permitted only under the provision of the copyright law 1965, in its
current version, and permission of use must always be obtained from CSC
Publishers.
IJBB Journal is a part of CSC Publishers
http://www.cscjournals.org
© IJBB Journal
Published in Malaysia
Typesetting: Camera-ready by author, data conversation by CSC Publishing Services – CSC Journals,
Malaysia
CSC Publishers, 2011
8/6/2019 International Journal of Biometrics and Bioinformatics IJBB_V5_I2
http://slidepdf.com/reader/full/international-journal-of-biometrics-and-bioinformatics-ijbbv5i2 4/133
EDITORIAL PREFACE
This is the second issue of volume five of International Journal of Biometric and Bioinformatics(IJBB). The Journal is published bi-monthly, with papers being peer reviewed to high internationalstandards. The International Journal of Biometric and Bioinformatics is not limited to a specificaspect of Biology but it is devoted to the publication of high quality papers on all division of Bio in
general. IJBB intends to disseminate knowledge in the various disciplines of the Biometric fieldfrom theoretical, practical and analytical research to physical implications and theoretical orquantitative discussion intended for academic and industrial progress. In order to position IJBB asone of the good journal on Bio-sciences, a group of highly valuable scholars are serving on theeditorial board. The International Editorial Board ensures that significant developments inBiometrics from around the world are reflected in the Journal. Some important topics covers by
journal are Bio-grid, biomedical image processing (fusion), Computational structural biology,Molecular sequence analysis, Genetic algorithms etc.
The initial efforts helped to shape the editorial policy and to sharpen the focus of the journal.Starting with volume 5, 2011, IJBB appears in more focused issues. Besides normal publications,IJBB intend to organized special issues on more focused topics. Each special issue will have adesignated editor (editors) – either member of the editorial board or another recognized specialist
in the respective field.
The coverage of the journal includes all new theoretical and experimental findings in the fields ofBiometrics which enhance the knowledge of scientist, industrials, researchers and all thosepersons who are coupled with Bioscience field. IJBB objective is to publish articles that are notonly technically proficient but also contains information and ideas of fresh interest for Internationalreadership. IJBB aims to handle submissions courteously and promptly. IJBB objectives are topromote and extend the use of all methods in the principal disciplines of Bioscience.
IJBB editors understand that how much it is important for authors and researchers to have theirwork published with a minimum delay after submission of their papers. They also strongly believethat the direct communication between the editors and authors are important for the welfare,quality and wellbeing of the Journal and its readers. Therefore, all activities from paper
submission to paper publication are controlled through electronic systems that include electronicsubmission, editorial panel and review system that ensures rapid decision with least delays in thepublication processes.
To build its international reputation, we are disseminating the publication information throughGoogle Books, Google Scholar, Directory of Open Access Journals (DOAJ), Open J Gate,ScientificCommons, Docstoc and many more. Our International Editors are working onestablishing ISI listing and a good impact factor for IJBB. We would like to remind you that thesuccess of our journal depends directly on the number of quality articles submitted for review.Accordingly, we would like to request your participation by submitting quality manuscripts forreview and encouraging your colleagues to submit quality manuscripts for review. One of thegreat benefits we can provide to our prospective authors is the mentoring nature of our reviewprocess. IJBB provides authors with high quality, helpful reviews that are shaped to assist authors
in improving their manuscripts.
Editorial Board MembersInternational Journal of Biometric and Bioinformatics (IJBB)

8/6/2019 International Journal of Biometrics and Bioinformatics IJBB_V5_I2
http://slidepdf.com/reader/full/international-journal-of-biometrics-and-bioinformatics-ijbbv5i2 5/133
EDITORIAL BOARD
EDITOR-in-CHIEF (EiC)
Professor João Manuel R. S. TavaresUniversity of Porto (Portugal)
ASSOCIATE EDITORS (AEiCs)
Assistant Professor. Yongjie Jessica ZhangMellon UniversityUnited States of America
Professor. Jimmy Thomas EfirdUniversity of North CarolinaUnited States of America
Professor. H. Fai Poon
Sigma-Aldrich IncUnited States of America
Professor. Fadiel AhmedTennessee State UniversityUnited States of America
Mr. Somnath Tagore (AEiC - Marketing)Dr. D.Y. Patil UniversityIndia
Professor. Yu XueHuazhong University of Science and Technology
China
Associate Professor Chang-Tsun Li University of WarwickUnited Kingdom
Professor. Calvin Yu-Chian ChenChina Medical universityTaiwan
EDITORIAL BOARD MEMBERS (EBMs)
Dr. Wichian SittiprapapornMahasarakham UniversityThailand
Assistant Professor. M. Emre CelebiLouisiana State UniversityUnited States of America
8/6/2019 International Journal of Biometrics and Bioinformatics IJBB_V5_I2
http://slidepdf.com/reader/full/international-journal-of-biometrics-and-bioinformatics-ijbbv5i2 6/133
Dr. Ganesan PugalenthiGenome Institute of SingaporeSingapore
Dr. Vijayaraj Nagarajan
National Institutes of HealthUnited States of America
Dr. Paola LeccaUniversity of TrentoItaly
Associate Professor. Renato Natal JorgeUniversity of PortoPortugal
Assistant Professor. Daniela IacovielloSapienza University of RomeItaly
Professor. Christos E. ConstantinouStanford University School of MedicineUnited States of America
Professor. Fiorella SGALLARIUniversity of BolognaItaly
Professor. George PerryUniversity of Texas at San AntonioUnited States of America
Assistant Professor. Giuseppe PlacidiUniversità dell'AquilaItaly
Assistant Professor. Sae HwangUniversity of IllinoisUnited States of America
Associate Professor Quan WenUniversity of Electronic Science and TechnologyChina
Dr. Paula Moreira
University of CoimbraPortugal
Dr. Riadh HammamiLaval UniversityCanada
8/6/2019 International Journal of Biometrics and Bioinformatics IJBB_V5_I2
http://slidepdf.com/reader/full/international-journal-of-biometrics-and-bioinformatics-ijbbv5i2 7/133
International Journal of Biometrics and Bioinformatics (IJBB), Volume (5), Issue (2) : 2011
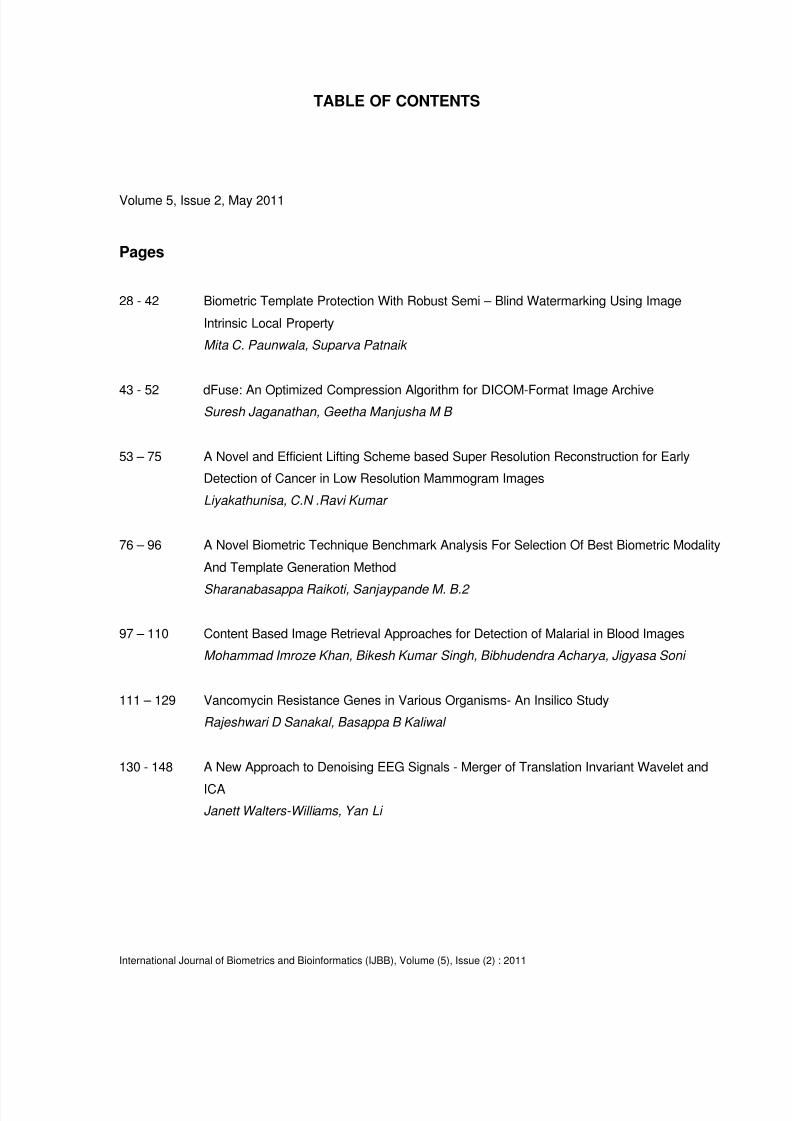
TABLE OF CONTENTS
Volume 5, Issue 2, May 2011
Pages
28 - 42 Biometric Template Protection With Robust Semi – Blind Watermarking Using Image
Intrinsic Local Property
Mita C. Paunwala, Suparva Patnaik
43 - 52 dFuse: An Optimized Compression Algorithm for DICOM-Format Image ArchiveSuresh Jaganathan, Geetha Manjusha M B
53 – 75
76 – 96
97 – 110
111 – 129
130 - 148
A Novel and Efficient Lifting Scheme based Super Resolution Reconstruction for Early
Detection of Cancer in Low Resolution Mammogram Images
Liyakathunisa, C.N .Ravi Kumar
A Novel Biometric Technique Benchmark Analysis For Selection Of Best Biometric Modality
And Template Generation Method
Sharanabasappa Raikoti, Sanjaypande M. B.2
Content Based Image Retrieval Approaches for Detection of Malarial in Blood Images
Mohammad Imroze Khan, Bikesh Kumar Singh, Bibhudendra Acharya, Jigyasa Soni
Vancomycin Resistance Genes in Various Organisms- An Insilico Study
Rajeshwari D Sanakal, Basappa B Kaliwal
A New Approach to Denoising EEG Signals - Merger of Translation Invariant Wavelet and
ICA
Janett Walters-Williams, Yan Li
8/6/2019 International Journal of Biometrics and Bioinformatics IJBB_V5_I2
http://slidepdf.com/reader/full/international-journal-of-biometrics-and-bioinformatics-ijbbv5i2 8/133
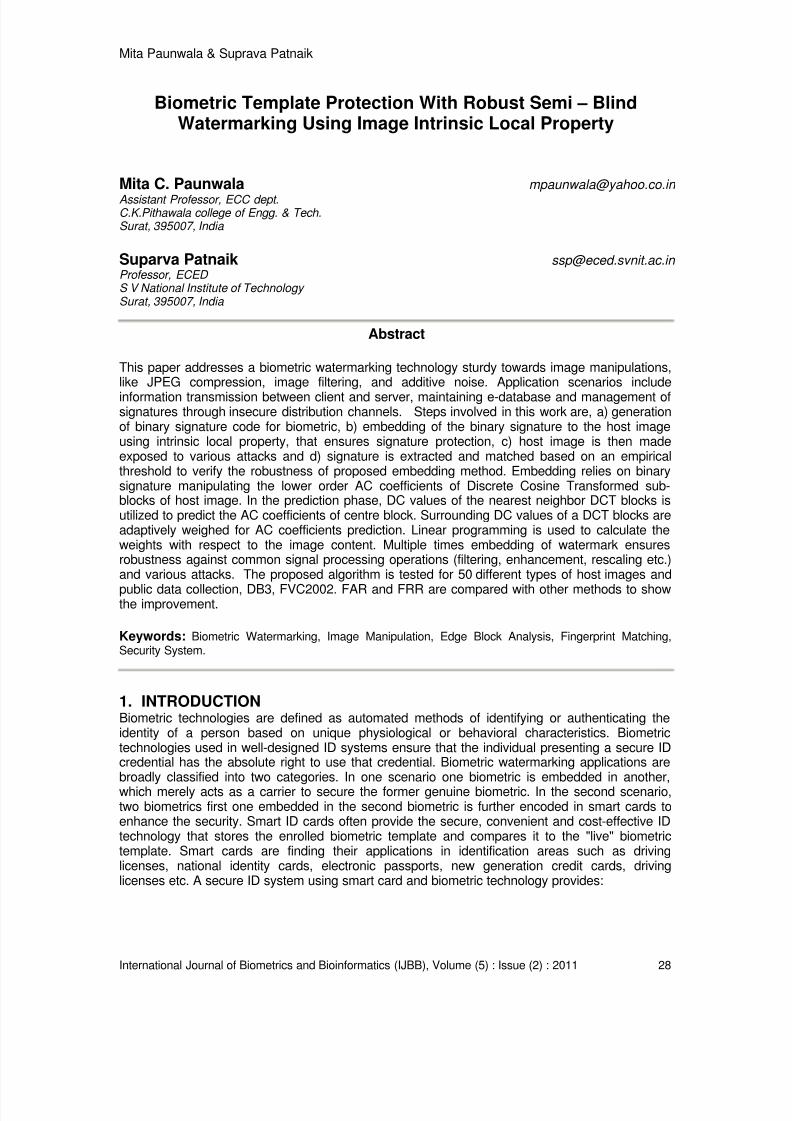
Mita Paunwala & Suprava Patnaik
International Journal of Biometrics and Bioinformatics (IJBB), Volume (5) : Issue (2) : 2011 28
Biometric Template Protection With Robust Semi – BlindWatermarking Using Image Intrinsic Local Property
Mita C. Paunwala [email protected] Assistant Professor, ECC dept.C.K.Pithawala college of Engg. & Tech.Surat, 395007, India
Suparva Patnaik [email protected] Professor, ECED S V National Institute of Technology Surat, 395007, India
Abstract
This paper addresses a biometric watermarking technology sturdy towards image manipulations,like JPEG compression, image filtering, and additive noise. Application scenarios include
information transmission between client and server, maintaining e-database and management ofsignatures through insecure distribution channels. Steps involved in this work are, a) generationof binary signature code for biometric, b) embedding of the binary signature to the host imageusing intrinsic local property, that ensures signature protection, c) host image is then madeexposed to various attacks and d) signature is extracted and matched based on an empiricalthreshold to verify the robustness of proposed embedding method. Embedding relies on binarysignature manipulating the lower order AC coefficients of Discrete Cosine Transformed sub-blocks of host image. In the prediction phase, DC values of the nearest neighbor DCT blocks isutilized to predict the AC coefficients of centre block. Surrounding DC values of a DCT blocks areadaptively weighed for AC coefficients prediction. Linear programming is used to calculate theweights with respect to the image content. Multiple times embedding of watermark ensuresrobustness against common signal processing operations (filtering, enhancement, rescaling etc.)and various attacks. The proposed algorithm is tested for 50 different types of host images and
public data collection, DB3, FVC2002. FAR and FRR are compared with other methods to showthe improvement.
Keywords: Biometric Watermarking, Image Manipulation, Edge Block Analysis, Fingerprint Matching,Security System.
1. INTRODUCTION
Biometric technologies are defined as automated methods of identifying or authenticating theidentity of a person based on unique physiological or behavioral characteristics. Biometrictechnologies used in well-designed ID systems ensure that the individual presenting a secure IDcredential has the absolute right to use that credential. Biometric watermarking applications arebroadly classified into two categories. In one scenario one biometric is embedded in another,which merely acts as a carrier to secure the former genuine biometric. In the second scenario,two biometrics first one embedded in the second biometric is further encoded in smart cards toenhance the security. Smart ID cards often provide the secure, convenient and cost-effective IDtechnology that stores the enrolled biometric template and compares it to the "live" biometrictemplate. Smart cards are finding their applications in identification areas such as drivinglicenses, national identity cards, electronic passports, new generation credit cards, drivinglicenses etc. A secure ID system using smart card and biometric technology provides:
8/6/2019 International Journal of Biometrics and Bioinformatics IJBB_V5_I2
http://slidepdf.com/reader/full/international-journal-of-biometrics-and-bioinformatics-ijbbv5i2 9/133
Mita Paunwala & Suprava Patnaik
International Journal of Biometrics and Bioinformatics (IJBB), Volume (5) : Issue (2) : 2011 29
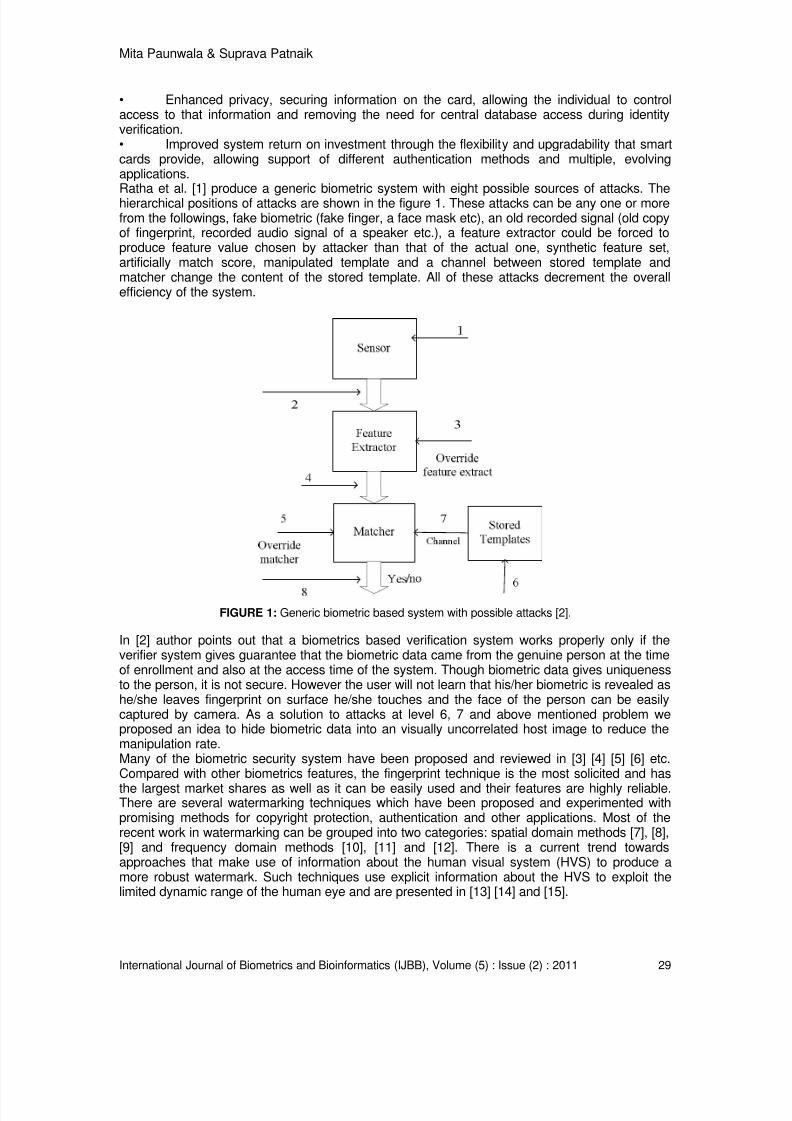
• Enhanced privacy, securing information on the card, allowing the individual to controlaccess to that information and removing the need for central database access during identityverification.• Improved system return on investment through the flexibility and upgradability that smartcards provide, allowing support of different authentication methods and multiple, evolvingapplications.Ratha et al. [1] produce a generic biometric system with eight possible sources of attacks. Thehierarchical positions of attacks are shown in the figure 1. These attacks can be any one or morefrom the followings, fake biometric (fake finger, a face mask etc), an old recorded signal (old copyof fingerprint, recorded audio signal of a speaker etc.), a feature extractor could be forced toproduce feature value chosen by attacker than that of the actual one, synthetic feature set,artificially match score, manipulated template and a channel between stored template andmatcher change the content of the stored template. All of these attacks decrement the overallefficiency of the system.
FIGURE 1: Generic biometric based system with possible attacks [2].
In [2] author points out that a biometrics based verification system works properly only if theverifier system gives guarantee that the biometric data came from the genuine person at the timeof enrollment and also at the access time of the system. Though biometric data gives uniquenessto the person, it is not secure. However the user will not learn that his/her biometric is revealed ashe/she leaves fingerprint on surface he/she touches and the face of the person can be easilycaptured by camera. As a solution to attacks at level 6, 7 and above mentioned problem weproposed an idea to hide biometric data into an visually uncorrelated host image to reduce themanipulation rate.Many of the biometric security system have been proposed and reviewed in [3] [4] [5] [6] etc.Compared with other biometrics features, the fingerprint technique is the most solicited and has
the largest market shares as well as it can be easily used and their features are highly reliable. There are several watermarking techniques which have been proposed and experimented withpromising methods for copyright protection, authentication and other applications. Most of therecent work in watermarking can be grouped into two categories: spatial domain methods [7], [8],[9] and frequency domain methods [10], [11] and [12]. There is a current trend towardsapproaches that make use of information about the human visual system (HVS) to produce amore robust watermark. Such techniques use explicit information about the HVS to exploit thelimited dynamic range of the human eye and are presented in [13] [14] and [15].
8/6/2019 International Journal of Biometrics and Bioinformatics IJBB_V5_I2
http://slidepdf.com/reader/full/international-journal-of-biometrics-and-bioinformatics-ijbbv5i2 10/133
Mita Paunwala & Suprava Patnaik
International Journal of Biometrics and Bioinformatics (IJBB), Volume (5) : Issue (2) : 2011 30
There have been only a few published papers on biometric watermarking of fingerprint images. In[16] author proposed Bio-hashing and cancelable fingerprint template transformation techniquesbased on six metrics to protect biometric trait, facilitates the security evaluation and vulnerable tolinkage attacks. In [17] author proposed multiple watermarking algorithm in texture regions offingerprint image using discrete wavelet transform. They used Face and text information aswatermark. Their approach is resilient to common attacks such as compression, filtering andnoise. In [18] spatial domain fragile watermarking method for fingerprint image verification wasproposed. The method can localize any region of image that has been tampered. Authorsconclude that their watermarking technique does not lead to a significant performance loss infingerprint verification. The fragile watermarking method discussed is used to detect thetampering effect but fail for retrieving original biometric. In [19] author proposed scheme fortemplate protection with steganography in which the secret key (which is in the form of pixelintensities) will be merged in the picture itself while encoding, and at decoding end only theauthentic user will be allowed to decode. But author has not discussed sturdiness of algorithm forvarious channel attacks. In [20], a semi unique key based on local block averages was used todetect tampering of host images, which includes fingerprints and faces. The technique is robustenough to detect even the most minor changes and determine where such changes took place inthe image. In [21] two spatial domain watermarking methods for fingerprint images are used, inwhich the first method utilizes gradient orientation analysis in watermark embedding and secondmethod preserves the singular points in the fingerprint image. Multiple times embedding of
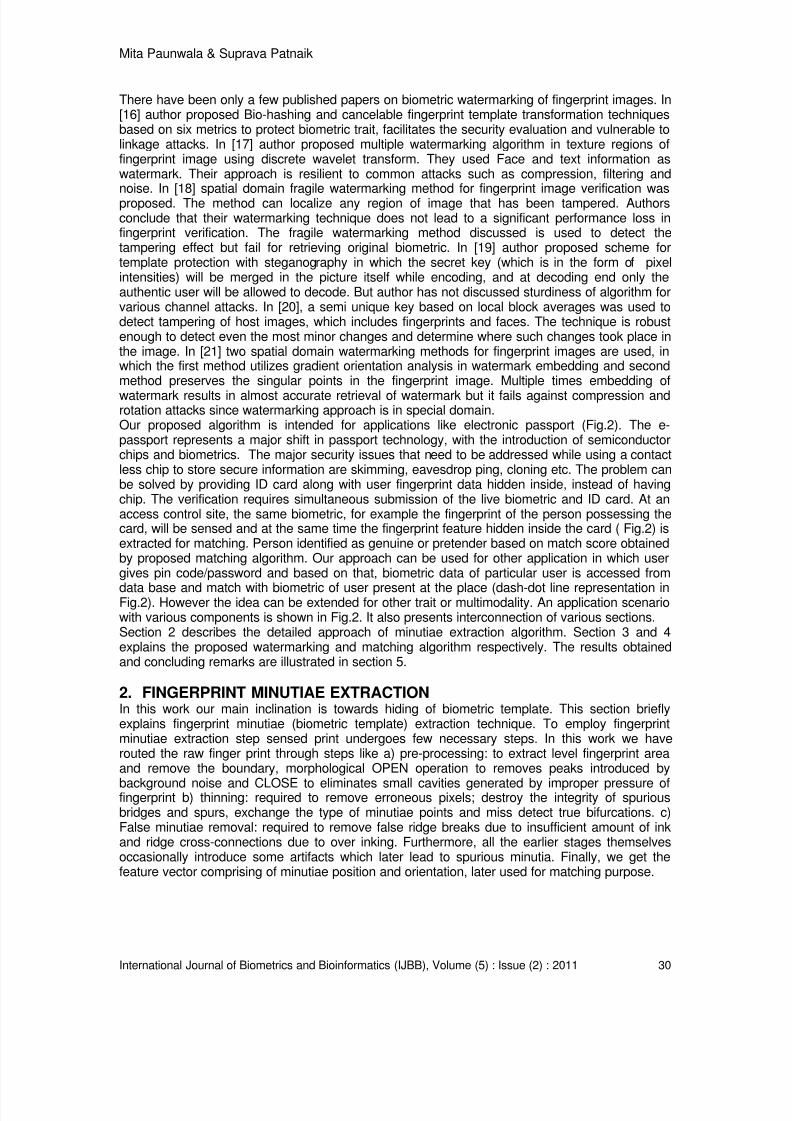
watermark results in almost accurate retrieval of watermark but it fails against compression androtation attacks since watermarking approach is in special domain.Our proposed algorithm is intended for applications like electronic passport (Fig.2). The e-passport represents a major shift in passport technology, with the introduction of semiconductorchips and biometrics. The major security issues that need to be addressed while using a contactless chip to store secure information are skimming, eavesdrop ping, cloning etc. The problem canbe solved by providing ID card along with user fingerprint data hidden inside, instead of havingchip. The verification requires simultaneous submission of the live biometric and ID card. At anaccess control site, the same biometric, for example the fingerprint of the person possessing thecard, will be sensed and at the same time the fingerprint feature hidden inside the card ( Fig.2) isextracted for matching. Person identified as genuine or pretender based on match score obtainedby proposed matching algorithm. Our approach can be used for other application in which usergives pin code/password and based on that, biometric data of particular user is accessed from
data base and match with biometric of user present at the place (dash-dot line representation inFig.2). However the idea can be extended for other trait or multimodality. An application scenariowith various components is shown in Fig.2. It also presents interconnection of various sections.Section 2 describes the detailed approach of minutiae extraction algorithm. Section 3 and 4explains the proposed watermarking and matching algorithm respectively. The results obtainedand concluding remarks are illustrated in section 5.
2. FINGERPRINT MINUTIAE EXTRACTION
In this work our main inclination is towards hiding of biometric template. This section brieflyexplains fingerprint minutiae (biometric template) extraction technique. To employ fingerprintminutiae extraction step sensed print undergoes few necessary steps. In this work we haverouted the raw finger print through steps like a) pre-processing: to extract level fingerprint areaand remove the boundary, morphological OPEN operation to removes peaks introduced by
background noise and CLOSE to eliminates small cavities generated by improper pressure offingerprint b) thinning: required to remove erroneous pixels; destroy the integrity of spuriousbridges and spurs, exchange the type of minutiae points and miss detect true bifurcations. c)False minutiae removal: required to remove false ridge breaks due to insufficient amount of inkand ridge cross-connections due to over inking. Furthermore, all the earlier stages themselvesoccasionally introduce some artifacts which later lead to spurious minutia. Finally, we get thefeature vector comprising of minutiae position and orientation, later used for matching purpose.
8/6/2019 International Journal of Biometrics and Bioinformatics IJBB_V5_I2
http://slidepdf.com/reader/full/international-journal-of-biometrics-and-bioinformatics-ijbbv5i2 11/133
Mita Paunwala & Suprava Patnaik
International Journal of Biometrics and Bioinformatics (IJBB), Volume (5) : Issue (2) : 2011 31
FIGURE 2: Application Scenario.
3. PROPOSED WATERMARKING APPROACH
We have proposed a DCT based semi-blind watermarking technique. In which watermark(fingerprint minutiae template) is embedded by modulating low frequency band AC coefficients of
8 x 8 block by its estimated values. Estimation is done using the DC coefficients of 8 neighboringblocks. In [22] authors provide the relation between estimated AC coefficient and neighborhoodDC coefficients but not considered the variations in the image for AC coefficient estimation. Theproposed method considers the local block variations in the image and accordingly ACcoefficients are estimated with different equations. Linear Programming based optimizationtechnique [23] is then considered to calculate weights based on image content. Furthermore eachwatermark bit is embedded multiple times to ensure robustness against various attacks andsignal processing operations.
3.1 Optimization procedureAny linear program (LP) consists of four parts: a set of decision variables, parameters, objectivefunction, and a set of constraints. The objective function is to fulfill the decision-maker's desire(objective), whereas the constraints which shape the feasible region usually come from the
decision-maker's environment putting some restrictions/conditions on achieving the objective.
3.1.1 Block wise DCT Computation
In the proposed approach linear programming based optimization is used to estimate thecoefficients using the neighborhood knowledge. Original image X
of some arbitrary size M x N is
divided into 8 x 8 blocks. Let i j x be a pixel value from the block, then 1≤ i ≤8 and 1≤ j ≤8. Each
block is transformed into y ij by applying two dimensional DCT (Discrete Cosine Transform).
8/6/2019 International Journal of Biometrics and Bioinformatics IJBB_V5_I2
http://slidepdf.com/reader/full/international-journal-of-biometrics-and-bioinformatics-ijbbv5i2 12/133
Mita Paunwala & Suprava Patnaik
International Journal of Biometrics and Bioinformatics (IJBB), Volume (5) : Issue (2) : 2011 32
Eachi j
x block is then categorized into smoother block or edge blocks by measuring block
variance.
( )8 8
2
1 1
63
i j
i j
x
v
µ = =
−
=
∑∑ (1)
Where µ is mean of block. Variance being very sensitive to uncertainties is used as a decisiveparameter to decide the block sensitivity with further uncertainties. The blocks with variance ( v )greater than threshold (th) are classified as edge blocks and block variance equal or less thanthreshold (th) are marked as smoother blocks. Optimization procedure is applied only to smootherblocks. Variance being very sensitive to uncertainties is used as a decisive parameter to decidethe block sensitivity towards uncertainties. Watermark embedding causes intensity alterationleading to rise in uncertainties. Blocks with lesser sensitivity are suitable for embedding.
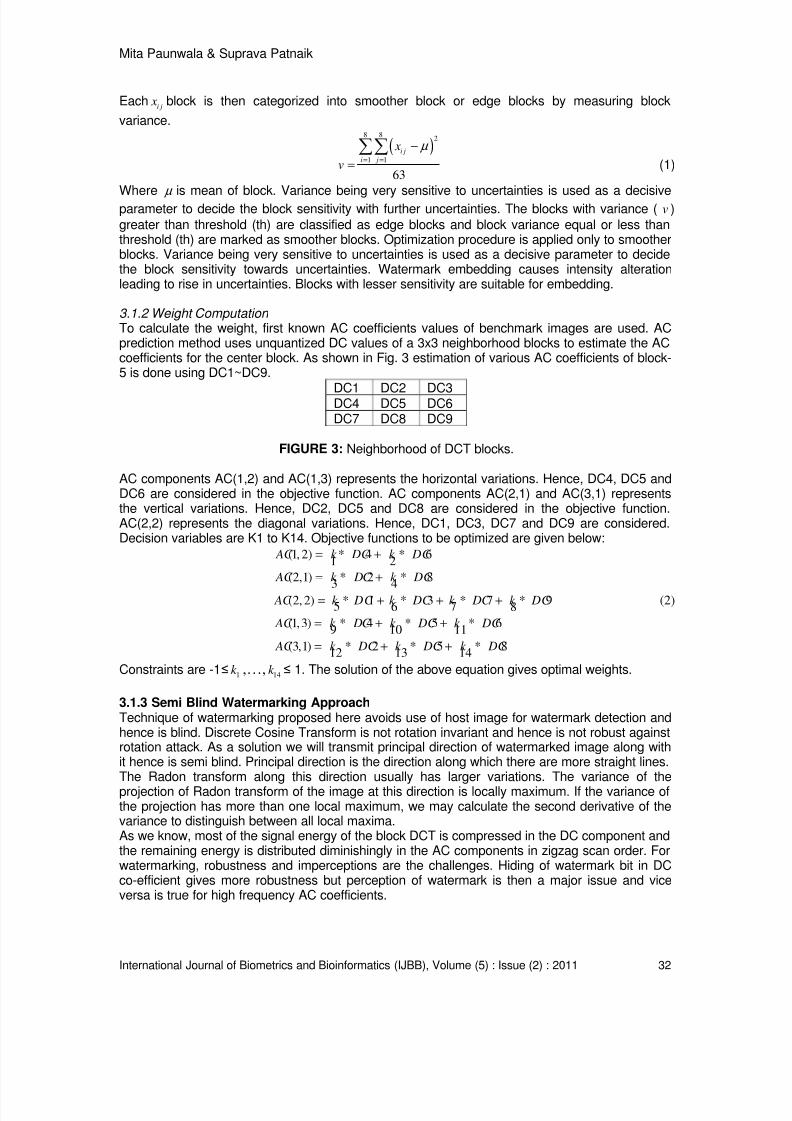
3.1.2 Weight Computation To calculate the weight, first known AC coefficients values of benchmark images are used. ACprediction method uses unquantized DC values of a 3x3 neighborhood blocks to estimate the ACcoefficients for the center block. As shown in Fig. 3 estimation of various AC coefficients of block-5 is done using DC1~DC9.
DC1 DC2 DC3DC4 DC5 DC6DC7 DC8 DC9
FIGURE 3: Neighborhood of DCT blocks.
AC components AC(1,2) and AC(1,3) represents the horizontal variations. Hence, DC4, DC5 andDC6 are considered in the objective function. AC components AC(2,1) and AC(3,1) representsthe vertical variations. Hence, DC2, DC5 and DC8 are considered in the objective function.AC(2,2) represents the diagonal variations. Hence, DC1, DC3, DC7 and DC9 are considered.Decision variables are K1 to K14. Objective functions to be optimized are given below:
(1, 2) * 4 * 61 2
(2,1) * 2 * 8
3 4(2, 2) * 1 * 3 * 7 * 9
5 76 8
(1,3) * 4 * 5 * 69 10 11
(3,1) * 2 * 5 * 812 13 14
AC k DC k DC
AC k DC k DC
AC k DC k DC k DC k DC
AC k DC k DC k DC
AC k DC k DC k DC
= +
= +
= + + +
= + +
= + +
(2)
Constraints are -1≤ 1k ,…, 14
k ≤ 1. The solution of the above equation gives optimal weights.
3.1.3 Semi Blind Watermarking ApproachTechnique of watermarking proposed here avoids use of host image for watermark detection andhence is blind. Discrete Cosine Transform is not rotation invariant and hence is not robust againstrotation attack. As a solution we will transmit principal direction of watermarked image along withit hence is semi blind. Principal direction is the direction along which there are more straight lines.The Radon transform along this direction usually has larger variations. The variance of theprojection of Radon transform of the image at this direction is locally maximum. If the variance ofthe projection has more than one local maximum, we may calculate the second derivative of thevariance to distinguish between all local maxima.As we know, most of the signal energy of the block DCT is compressed in the DC component andthe remaining energy is distributed diminishingly in the AC components in zigzag scan order. Forwatermarking, robustness and imperceptions are the challenges. Hiding of watermark bit in DCco-efficient gives more robustness but perception of watermark is then a major issue and viceversa is true for high frequency AC coefficients.
8/6/2019 International Journal of Biometrics and Bioinformatics IJBB_V5_I2
http://slidepdf.com/reader/full/international-journal-of-biometrics-and-bioinformatics-ijbbv5i2 13/133
Mita Paunwala & Suprava Patnaik
International Journal of Biometrics and Bioinformatics (IJBB), Volume (5) : Issue (2) : 2011 33
In our approach we have selected AC co-efficient nearest to DC coefficient for each smootherblocks as in Fig.3, unlike the DC coefficient used in choi’s method [24] for hiding watermark(fingerprint minutia). Furthermore we embed each watermark bit multiple times to get robustness.Embedding steps are as given below.
Step 1: Apply radon transform to the host image and calculate the variance for all angles between0 - 179 degree.Step 2: Find out local maxima by applying second order derivative. Find out correspondingdirection where maximum is projected. The resultant direction is known as principal direction of
host image ( oφ ).
Step 3: Convert minutia points into binary pattern ‘w’.Step 4: Apply 8 x 8 DCT to the host image and categorized edge block and smoother block.Step 5: Select the i
AC ,1≤ i ≤5 coefficient nearest to its DC coefficient of smoother block and
estimates its value ( AC i
Λ
) from its neighborhood blocks DC j, 1≤ j ≤ 9 co-efficient as in Eq.(2).
Step 6: Modulate each selected AC coefficient with following translation rule
( ) 1
( ) 0
ii
i i i
i i i
ii
i i i
i i i
For w k
if AC AC
then AC AC TH
else
AC AC TH
for w k
if AC AC
then AC AC TH
else
AC AC TH
Λ
Λ
Λ
Λ
=
>
= +
= +
=
<
= −
= −
where, THi is threshold value which gives robustness against various attacks. Higher the value of
THi, robustness is better but at the same time perceptibility (artifacts) is high. So selection of TH i is a tradeoff between robustness and imperceptions. Its value is decided locally, as 10-20% ofcorresponding coefficient.Step 7: Embed each watermark bit at multiple location.Step 8: Apply inverse 8x8 DCT with modified AC coefficients values to get watermarked image.
At the decoding side, before extracting watermark bit first find principal direction of watermarked
image ( r φ ). If watermarked image is rotated then principal direction of the watermarked image is
different than that of transmitted direction. Take a difference of both direction and de-rotatewatermarked image by difference angle (
d φ ). Decoding of watermark bit requires estimated value
AC i
Λ
of coefficient and original AC i to extract watermark bit. If AC i > AC i
Λ
then extracted bit is ‘1’,
otherwise if AC i < AC i
Λ
then extracted bit is ‘0’. Each watermark bit gathered from multiplelocations and maximum of that is considered as retrieved bit. The technique proposed here is
semi blind watermarking as it requires knowledge of principal direction (o
φ ).
4. MATCHING APPROACHMatching stage used here is similar to that proposed in [25], establish the number of consequentminutia pairs to compute the final matching score after alignment. The difference of our approachis only that, we calculates minutiae matching score based on similarity between matchingminutiae pair by avoiding triangular matching method and fix feature vector length to avoid
8/6/2019 International Journal of Biometrics and Bioinformatics IJBB_V5_I2
http://slidepdf.com/reader/full/international-journal-of-biometrics-and-bioinformatics-ijbbv5i2 14/133
Mita Paunwala & Suprava Patnaik
International Journal of Biometrics and Bioinformatics (IJBB), Volume (5) : Issue (2) : 2011 34
complexity. Furthermore, we limit the ridge orientation between 0◦and 180
◦. Matching task can be
easily completed, if two minutia patterns are exactly aligned. However, in practice, such asituation is rarely encountered.Non-linear deformation of fingerprint makes impossible to have exact location of minutia pointthan that in the template. Also location and direction error makes matching task complex.Therefore, the matching algorithm needs to be elastic which means that it should be capable oftolerating, the deformations due to the location and direction errors and non-linear deformationsto some extent. Keeping the above idea as the target, we have proposed a relaxed idea as thepart of matching algorithm in this paper.In alignment stage, the global structure of a minutia describes a rotation and translation invariantfeature of the minutia in its neighborhood. The novel structure of each minutia we construct in thispaper is not sensitive to noise because it only depends on the global finger print orientation fieldwhich is relatively robust to noise. Our structure capturing the affluent information on fingerprintridge-orientation pattern which is more discriminative than the local minutia structure described in[26].
4.1 Feature Vector StructureA minutia point M k detected from a fingerprint can be described by a feature vector given by
( ),F x yk k k k
φ = (3)
Where, (xk, yk) describes the location and Ø k is the ridge orientation. Note that in a fingerprintimage, there is no difference between a local ridge orientation of 0
◦and 180
◦, since the ridges
oriented at 0◦
and the ridges oriented at 180◦
in a local neighborhood cannot be differentiatedfrom each other. So, the value of Ø k is commonly set in the range from 0 to π according to theEq. (4). Given a minutia point M k with orientation Ø k , we define a grid structure with N directionalmetric. Principal axis oriented along the orientation of M k .
0 ,
2
if k k
k if
k k
φ φ π φ
φ π π φ π
≤ <=
− ≤ <
(4)
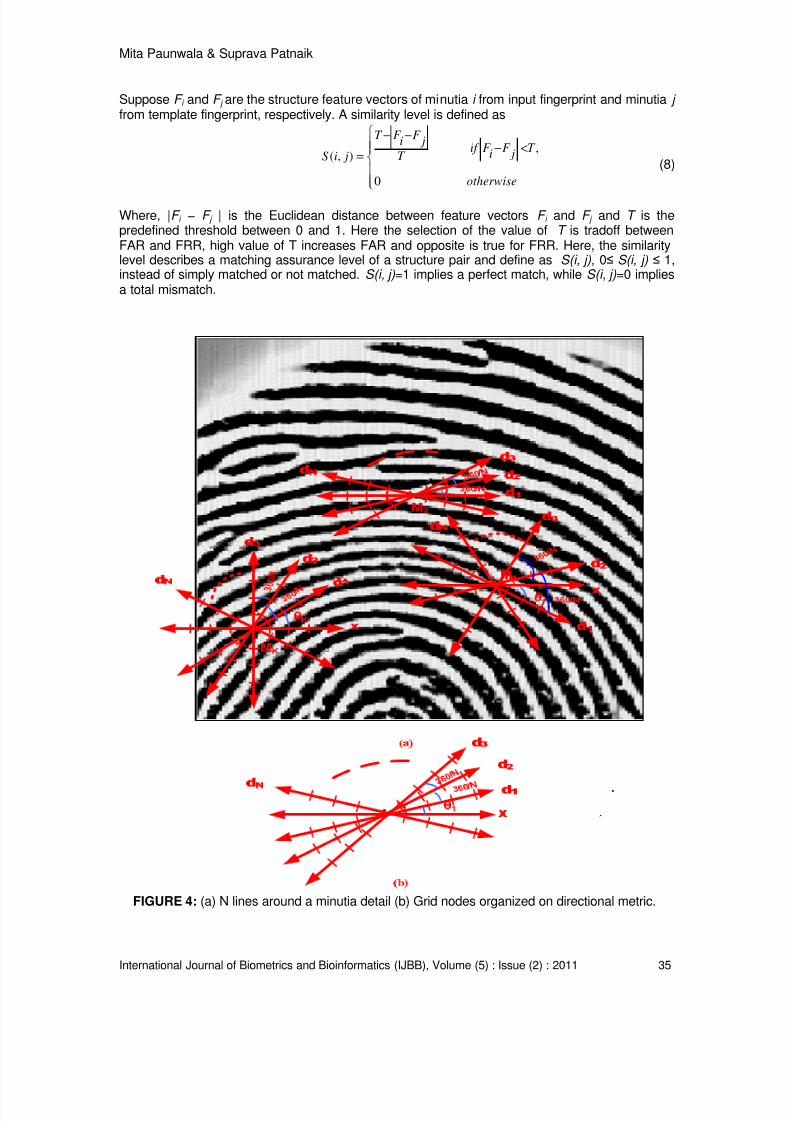
Let θ1 = Ø k , θ2 = θ1 + 360/N and θN = θN-1 + 360/N. We plot N metric along the angles [θ1, θ2,θ3,…θN] with respect to X axis through the minutia point M k as shown in Fig. 4(a). Grid nodes asshown in Fig. 4(b) are marked along each metric at an interval of τ starting with the minutia pointM k . Larger the value of N and smaller the value of τ will increase the size of feature vector. This
will give better accuracy at the cost of increased computational complexity. By defining theorientation of grid nodes as, (1 ≤ dm ≤ N), we calculate the relative direction between minutia M k and grid nodes as
( , ), ,
k k d
i d k i d m mψ φ φ ψ =
(5)
is free from the rotation and translation of the fingerprint. Where,,k i d m
φ , represents the orientation
of grid nodes. The orientation of grid node falls in furrows is considered as 0 degree. We haveconsidered five grid nodes for each directional metric, specified feature vector of size 1 x 15 foreach minutiae point as shown in Eq. (6). The final feature vector F k of a minutia M k that describesits structure characteristic with global fingerprint orientation field is given by Eq. (7).
[0.12, 0.78, 0, 0, -0.15, -0.15, -0.15, 0.58, 0.78, 0, 0, 0, 0.78, 0.78, 0] (6)
}, 11
N k nd k mF
k i d m im
ψ
= = =
(7)
Where, nd k m
gives number of grid nodes along the direction metric d m corresponding to kth
minutiae. The structure feature vector F k is invariant to rotation and translation of the fingerprint.
8/6/2019 International Journal of Biometrics and Bioinformatics IJBB_V5_I2
http://slidepdf.com/reader/full/international-journal-of-biometrics-and-bioinformatics-ijbbv5i2 15/133
Mita Paunwala & Suprava Patnaik
International Journal of Biometrics and Bioinformatics (IJBB), Volume (5) : Issue (2) : 2011 35
Suppose F i and F j are the structure feature vectors of minutia i from input fingerprint and minutia j from template fingerprint, respectively. A similarity level is defined as
( , )
0
T F F i j
if F F T i jT S i j
otherwise
− − − < ,
=
(8)
Where, |F i − F j | is the Euclidean distance between feature vectors F i and F j and T is thepredefined threshold between 0 and 1. Here the selection of the value of T is tradoff betweenFAR and FRR, high value of T increases FAR and opposite is true for FRR. Here, the similaritylevel describes a matching assurance level of a structure pair and define as S(i, j), 0≤ S(i, j) ≤ 1,instead of simply matched or not matched. S(i, j)=1 implies a perfect match, while S(i, j)=0 impliesa total mismatch.
••
• ••
•
• •
• • •••
•
• •• ••
FIGURE 4: (a) N lines around a minutia detail (b) Grid nodes organized on directional metric.
8/6/2019 International Journal of Biometrics and Bioinformatics IJBB_V5_I2
http://slidepdf.com/reader/full/international-journal-of-biometrics-and-bioinformatics-ijbbv5i2 16/133
Mita Paunwala & Suprava Patnaik
International Journal of Biometrics and Bioinformatics (IJBB), Volume (5) : Issue (2) : 2011 36
4.2 Matching of Global Minutiae StructureWith the defined feature vectors, we compute matching score based on consequent minutia pairs.Degree of similarity between two fingerprint decides genuine/imposter attempt. In order tocompute matching score, we need to identify a set of consequent minutia pairs from template andinput fingerprint.System identifies a user truly if the match score is computed with reliable consequent point pairs.In order to have reliable consequent point pair input finger must be properly aligned with templatefingerprint. The alignment stage is intended to recover the geometric transformation between thetwo fingerprint impressions. In our work, the rigid transformation, i.e., translation vector ( t =[tx, ty
] T ) and rotation angle (Ø ), is recovered by the best-matched structure pair that exhibits the
largest similarity value in Eq. (8). The best-matched minutia structure pair (s1, s2), minutia s1from the input fingerprint and another s2 from the template fingerprint is obtained by maximizingthe similarity level as
( , ) max( ( , ))1 2 ,
S s s S i ji j
=
( ) ( ) and
2 1 D s D sφ = − ( ) ( )
2 1t P s R s
φ = −
(9)
Where, R Ø denotes the 2 × 2 operator of counter clockwise rotation used to find the position ofrotated minutia (s1) and the position of a minutia s2 are denoted by P(s2) =[x(s2), y(s2)]
T .
Direction of minutia is denoted by D(s). Applying the estimated geometric transformation onto the
minutiae from the test fingerprint we obtain the list comprising the aligned minutiae. Also, theorientation field from the test fingerprint will be aligned using the estimated transformationsimultaneously.The non-linear deformations and deformations due to the location and direction errors can betolerate to some extent by having elastic matching algorithm, achieved by selecting bounding boxBg in the feature space instead of an exact matching. A small size bounding box Bg is chosen toget two consequent minutiae lists L1 and L2 which are from the template fingerprint and the testfingerprint, respectively. The pairs with the largest similarity level values in Eq. (8), which, also fallin the bounding box Bg are considered as consequent minutiae pairs. Here the size of boundingbox is tradeoff between the false acceptance rate (FAR) and the false rejection rate (FRR).
4.3 Matching Score ComputationWith the introduction of our minutia structures and similarity of consequent minutia pairs,
matching score can be determined by Mm. Let N1 and N2 denote the number of minutiae locatedinside the intersection of the two fingerprint images for test and template fingerprints,respectively. The minutia matching score Mm can be calculated according to the followingequation.
{ }
( , ),
,max ,1 2
S i ji j
M m N N
∑
= (10)
where i, j is the consequent minutiae pair, one from test fingerprint and another from templatefingerprint, respectively, and S(i, j) is computed according to Eq. (8). 5. EXPERIMENTAL EVALUATION
Experiments are performed on four bench mark images as given in Fig. 5 to calculate the optimalweights. All objective functions are simplified by using above four images based on imagecontent. Variance threshold of 1000 is selected to distinguish smoother blocks from edge blocks.Weights derived from experiments are given in Table 1.The algorithm proposed above is tested on the public domain collection of fingerprint images,DB3 in FVC2004. It comprises 800 fingerprint images of size 300×480 pixels captured at aresolution of 512dpi, from 100 fingers (eight impressions per finger). Individual minutiae data setscontained between 25 to 35 minutiae points, with an average of 30 minutiae points. Experiment isperformed for 50 different types (low freq, medium freq., high freq., highly textured etc.) of hostimages of size 512 x 512. Out of them results for four images shown in Fig. 6 are presented here.
8/6/2019 International Journal of Biometrics and Bioinformatics IJBB_V5_I2
http://slidepdf.com/reader/full/international-journal-of-biometrics-and-bioinformatics-ijbbv5i2 17/133
Mita Paunwala & Suprava Patnaik
International Journal of Biometrics and Bioinformatics (IJBB), Volume (5) : Issue (2) : 2011 37
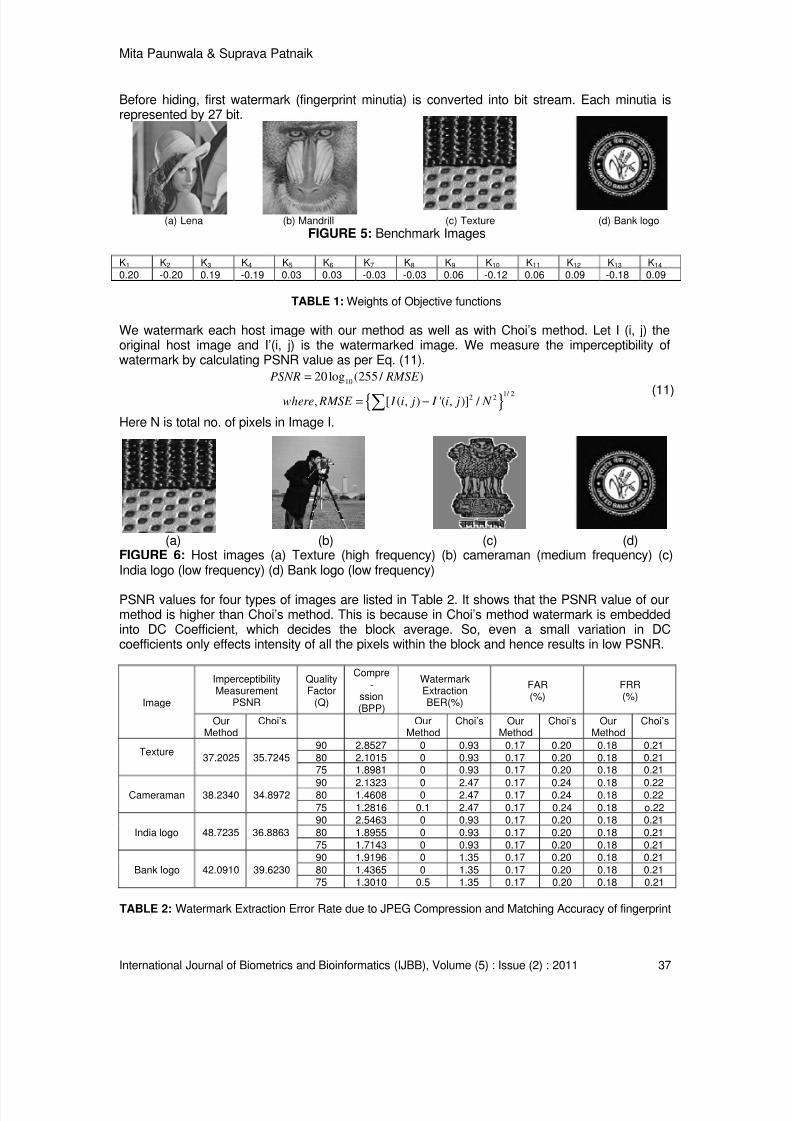
Before hiding, first watermark (fingerprint minutia) is converted into bit stream. Each minutia isrepresented by 27 bit.
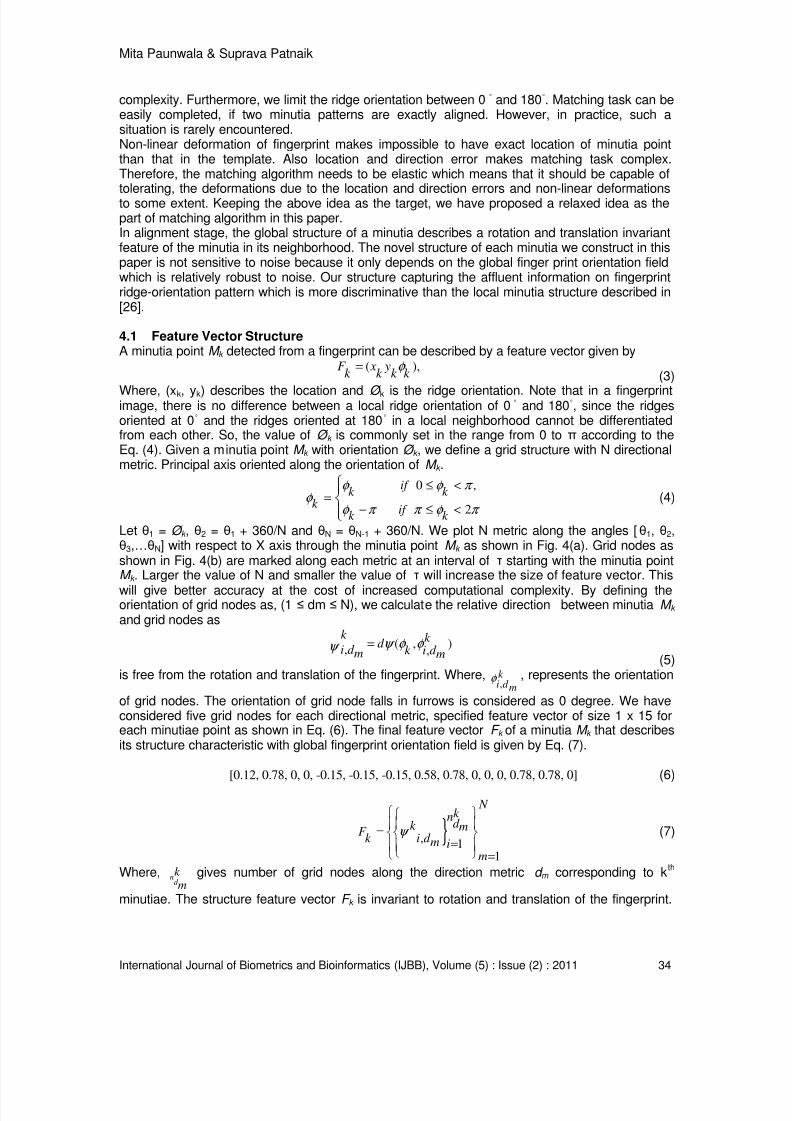
(a) Lena (b) Mandrill (c) Texture (d) Bank logo
FIGURE 5: Benchmark Images
K1 K2 K3 K4 K5 K6 K7 K8 K9 K10 K11 K12 K13 K14 0.20 -0.20 0.19 -0.19 0.03 0.03 -0.03 -0.03 0.06 -0.12 0.06 0.09 -0.18 0.09
TABLE 1: Weights of Objective functions
We watermark each host image with our method as well as with Choi’s method. Let I (i, j) theoriginal host image and I’(i, j) is the watermarked image. We measure the imperceptibility ofwatermark by calculating PSNR value as per Eq. (11).
{ }
10
1/ 22 2
20log (255 / )
, [ ( , ) '( , )] /
PSNR RMSE
where RMSE I i j I i j N
=
= −∑ (11)
Here N is total no. of pixels in Image I.
(a) (b) (c) (d)FIGURE 6: Host images (a) Texture (high frequency) (b) cameraman (medium frequency) (c)India logo (low frequency) (d) Bank logo (low frequency)
PSNR values for four types of images are listed in Table 2. It shows that the PSNR value of ourmethod is higher than Choi’s method. This is because in Choi’s method watermark is embeddedinto DC Coefficient, which decides the block average. So, even a small variation in DCcoefficients only effects intensity of all the pixels within the block and hence results in low PSNR.
Image
ImperceptibilityMeasurement
PSNR
QualityFactor
(Q)
Compre-
ssion(BPP)
WatermarkExtractionBER(%)
FAR(%)
FRR(%)
OurMethod
Choi’s OurMethod
Choi’s OurMethod
Choi’s OurMethod
Choi’s
Texture37.2025 35.7245
90 2.8527 0 0.93 0.17 0.20 0.18 0.2180 2.1015 0 0.93 0.17 0.20 0.18 0.2175 1.8981 0 0.93 0.17 0.20 0.18 0.21
Cameraman 38.2340 34.897290 2.1323 0 2.47 0.17 0.24 0.18 0.2280 1.4608 0 2.47 0.17 0.24 0.18 0.22
75 1.2816 0.1 2.47 0.17 0.24 0.18 o.22
India logo 48.7235 36.8863
90 2.5463 0 0.93 0.17 0.20 0.18 0.21
80 1.8955 0 0.93 0.17 0.20 0.18 0.2175 1.7143 0 0.93 0.17 0.20 0.18 0.21
Bank logo 42.0910 39.6230
90 1.9196 0 1.35 0.17 0.20 0.18 0.21
80 1.4365 0 1.35 0.17 0.20 0.18 0.2175 1.3010 0.5 1.35 0.17 0.20 0.18 0.21
TABLE 2: Watermark Extraction Error Rate due to JPEG Compression and Matching Accuracy of fingerprint
8/6/2019 International Journal of Biometrics and Bioinformatics IJBB_V5_I2
http://slidepdf.com/reader/full/international-journal-of-biometrics-and-bioinformatics-ijbbv5i2 18/133
Mita Paunwala & Suprava Patnaik
International Journal of Biometrics and Bioinformatics (IJBB), Volume (5) : Issue (2) : 2011 38
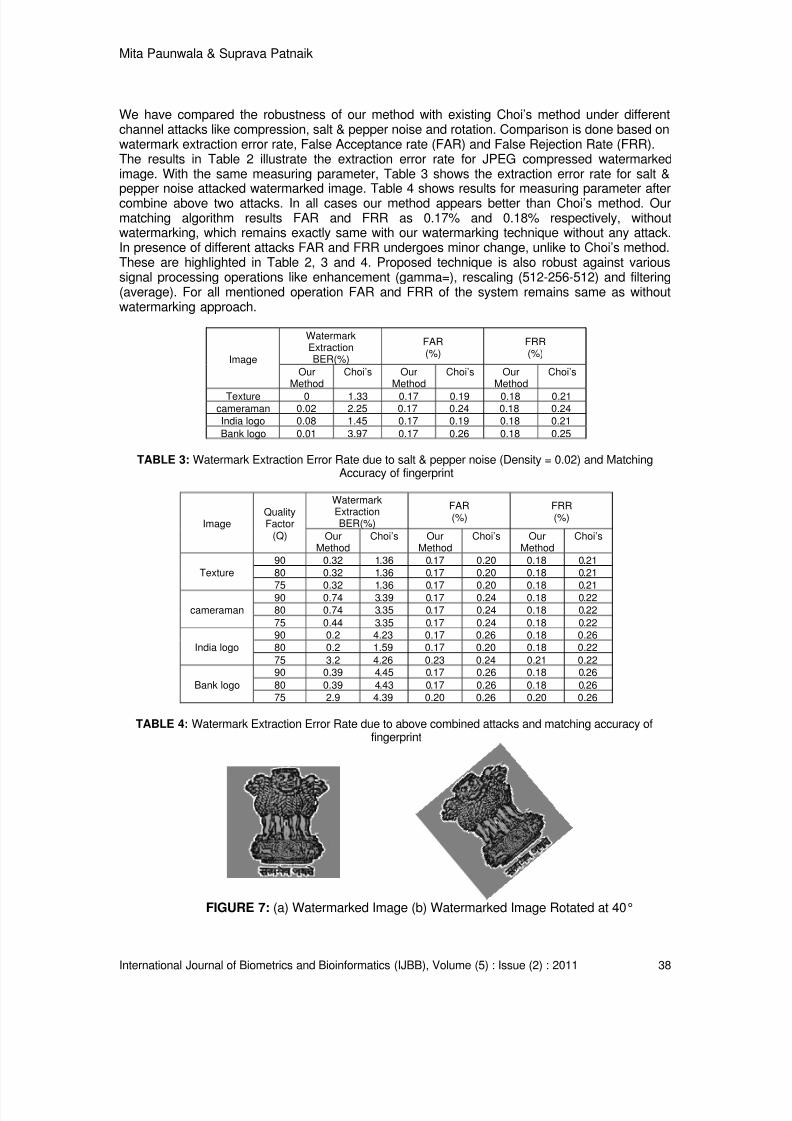
We have compared the robustness of our method with existing Choi’s method under differentchannel attacks like compression, salt & pepper noise and rotation. Comparison is done based onwatermark extraction error rate, False Acceptance rate (FAR) and False Rejection Rate (FRR).The results in Table 2 illustrate the extraction error rate for JPEG compressed watermarkedimage. With the same measuring parameter, Table 3 shows the extraction error rate for salt &pepper noise attacked watermarked image. Table 4 shows results for measuring parameter aftercombine above two attacks. In all cases our method appears better than Choi’s method. Ourmatching algorithm results FAR and FRR as 0.17% and 0.18% respectively, withoutwatermarking, which remains exactly same with our watermarking technique without any attack.In presence of different attacks FAR and FRR undergoes minor change, unlike to Choi’s method.These are highlighted in Table 2, 3 and 4. Proposed technique is also robust against varioussignal processing operations like enhancement (gamma=), rescaling (512-256-512) and filtering(average). For all mentioned operation FAR and FRR of the system remains same as withoutwatermarking approach.
Image
WatermarkExtractionBER(%)
FAR(%)
FRR(%)
OurMethod
Choi’s OurMethod
Choi’s OurMethod
Choi’s
Texture 0 1.33 0.17 0.19 0.18 0.21cameraman 0.02 2.25 0.17 0.24 0.18 0.24India logo 0.08 1.45 0.17 0.19 0.18 0.21
Bank logo 0.01 3.97 0.17 0.26 0.18 0.25
TABLE 3: Watermark Extraction Error Rate due to salt & pepper noise (Density = 0.02) and MatchingAccuracy of fingerprint
ImageQualityFactor
(Q)
WatermarkExtractionBER(%)
FAR(%)
FRR(%)
OurMethod
Choi’s OurMethod
Choi’s OurMethod
Choi’s
Texture90 0.32 1.36 0.17 0.20 0.18 0.2180 0.32 1.36 0.17 0.20 0.18 0.21
75 0.32 1.36 0.17 0.20 0.18 0.21
cameraman90 0.74 3.39 0.17 0.24 0.18 0.2280 0.74 3.35 0.17 0.24 0.18 0.22
75 0.44 3.35 0.17 0.24 0.18 0.22
India logo90 0.2 4.23 0.17 0.26 0.18 0.2680 0.2 1.59 0.17 0.20 0.18 0.22
75 3.2 4.26 0.23 0.24 0.21 0.22
Bank logo
90 0.39 4.45 0.17 0.26 0.18 0.26
80 0.39 4.43 0.17 0.26 0.18 0.2675 2.9 4.39 0.20 0.26 0.20 0.26
TABLE 4: Watermark Extraction Error Rate due to above combined attacks and matching accuracy offingerprint
FIGURE 7: (a) Watermarked Image (b) Watermarked Image Rotated at 40°
8/6/2019 International Journal of Biometrics and Bioinformatics IJBB_V5_I2
http://slidepdf.com/reader/full/international-journal-of-biometrics-and-bioinformatics-ijbbv5i2 19/133
Mita Paunwala & Suprava Patnaik
International Journal of Biometrics and Bioinformatics (IJBB), Volume (5) : Issue (2) : 2011 39
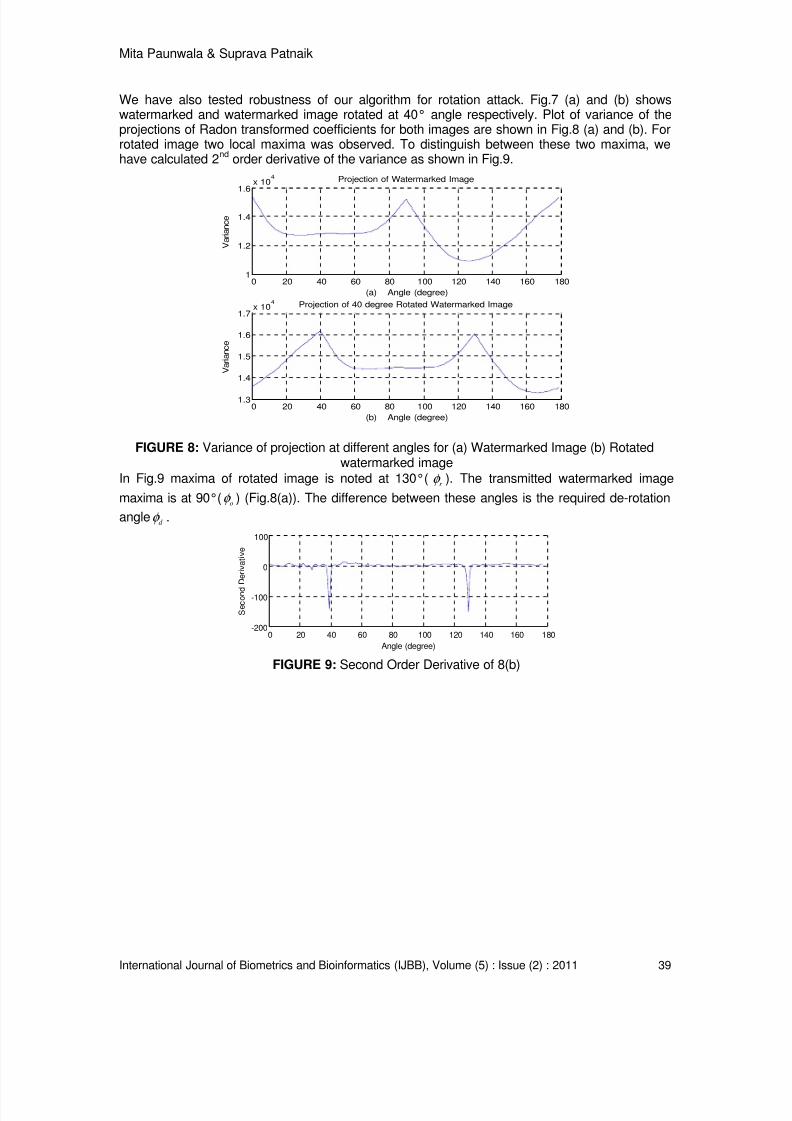
We have also tested robustness of our algorithm for rotation attack. Fig.7 (a) and (b) showswatermarked and watermarked image rotated at 40° angle respectively. Plot of variance of theprojections of Radon transformed coefficients for both images are shown in Fig.8 (a) and (b). Forrotated image two local maxima was observed. To distinguish between these two maxima, wehave calculated 2
ndorder derivative of the variance as shown in Fig.9.
0 20 40 60 80 100 120 140 160 1801
1.2
1.4
1.6x 10
4 Projection of Watermarked Image
(a) Angle (degree)
V a r i a n c e
0 20 40 60 80 100 120 140 160 1801.3
1.4
1.5
1.6
1.7x 10
4 Projection of 40 degree Rotated Watermarked Image
(b) Angle (degree)
V a r i a n c e
FIGURE 8: Variance of projection at different angles for (a) Watermarked Image (b) Rotatedwatermarked image
In Fig.9 maxima of rotated image is noted at 130°(r φ ). The transmitted watermarked image
maxima is at 90°( oφ ) (Fig.8(a)). The difference between these angles is the required de-rotation
angled φ .
0 20 40 60 80 100 120 140 160 180-200
-100
0
100
Angle (degree)
S e c o n d
D e r i v a t i v e
FIGURE 9: Second Order Derivative of 8(b)
8/6/2019 International Journal of Biometrics and Bioinformatics IJBB_V5_I2
http://slidepdf.com/reader/full/international-journal-of-biometrics-and-bioinformatics-ijbbv5i2 20/133
Mita Paunwala & Suprava Patnaik
International Journal of Biometrics and Bioinformatics (IJBB), Volume (5) : Issue (2) : 2011 40
ImageRotation
Angle(Ød)
WatermarkExtractionBER(%)
FAR(%)
FRR(%)
Texture15 6.5 0.27 0.2735 7.5 0.28 0.28
75 6.5 0.27 0.28
cameraman15 8.5 0.3 0.3135 8.5 0.3 0.31
75 8.5 0.3 0.31
India logo15 10 0.35 0.3335 8 0.29 0.29
75 9 0.29 0.29
Bank logo
15 Destroyed Destroyed Destroyed
35 Destroyed Destroyed Destroyed75 Destroyed Destroyed Destroyed
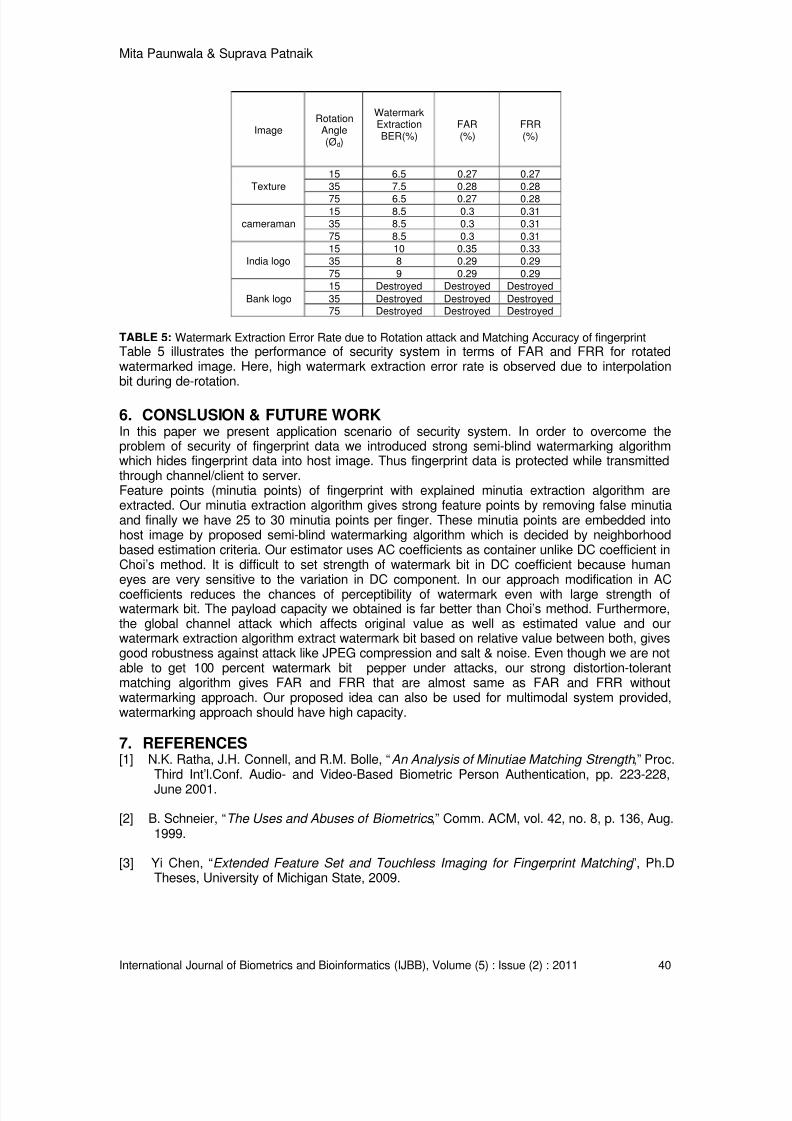
TABLE 5: Watermark Extraction Error Rate due to Rotation attack and Matching Accuracy of fingerprint
Table 5 illustrates the performance of security system in terms of FAR and FRR for rotatedwatermarked image. Here, high watermark extraction error rate is observed due to interpolationbit during de-rotation.
6. CONSLUSION & FUTURE WORKIn this paper we present application scenario of security system. In order to overcome theproblem of security of fingerprint data we introduced strong semi-blind watermarking algorithmwhich hides fingerprint data into host image. Thus fingerprint data is protected while transmittedthrough channel/client to server.Feature points (minutia points) of fingerprint with explained minutia extraction algorithm areextracted. Our minutia extraction algorithm gives strong feature points by removing false minutiaand finally we have 25 to 30 minutia points per finger. These minutia points are embedded intohost image by proposed semi-blind watermarking algorithm which is decided by neighborhoodbased estimation criteria. Our estimator uses AC coefficients as container unlike DC coefficient inChoi’s method. It is difficult to set strength of watermark bit in DC coefficient because humaneyes are very sensitive to the variation in DC component. In our approach modification in ACcoefficients reduces the chances of perceptibility of watermark even with large strength ofwatermark bit. The payload capacity we obtained is far better than Choi’s method. Furthermore,the global channel attack which affects original value as well as estimated value and ourwatermark extraction algorithm extract watermark bit based on relative value between both, givesgood robustness against attack like JPEG compression and salt & noise. Even though we are notable to get 100 percent watermark bit pepper under attacks, our strong distortion-tolerantmatching algorithm gives FAR and FRR that are almost same as FAR and FRR withoutwatermarking approach. Our proposed idea can also be used for multimodal system provided,watermarking approach should have high capacity.
7. REFERENCES[1] N.K. Ratha, J.H. Connell, and R.M. Bolle, “An Analysis of Minutiae Matching Strength ,” Proc.
Third Int’l.Conf. Audio- and Video-Based Biometric Person Authentication, pp. 223-228,
June 2001.
[2] B. Schneier, “The Uses and Abuses of Biometrics ,” Comm. ACM, vol. 42, no. 8, p. 136, Aug.1999.
[3] Yi Chen, “Extended Feature Set and Touchless Imaging for Fingerprint Matching ”, Ph.DTheses, University of Michigan State, 2009.
8/6/2019 International Journal of Biometrics and Bioinformatics IJBB_V5_I2
http://slidepdf.com/reader/full/international-journal-of-biometrics-and-bioinformatics-ijbbv5i2 21/133
Mita Paunwala & Suprava Patnaik
International Journal of Biometrics and Bioinformatics (IJBB), Volume (5) : Issue (2) : 2011 41
[4] Salil Prabhakar, “Fingerprint Classification and Matching Using a Filterbank”, Ph.D Theses,University of Michigan State, 2001.
[5] Panyayot Chaikan, Montri Karnjanadecha, “The Use of Top-View Finger Image for Personal Identification” Proceedings of the 5th International IEEE Symposium on image and SignalProcessing and Analysis, 343-346, Nov. 2007.
[6] A. K. Jain D. Maltoni, D. Maio and S. Prabhakar. Handbook of Fingerprint Recognition .Springer, New York, 2003.
[7] Ashourian, M.; Enteshary, R., “IEEE Conference on Convergent Technologies for Asia-Pacific Region”, TENCON, Vol. 1, pp 428-431, 2003.
[8] B. Verma, S. Jain, D. P. Agarwal, and A. Phadikar, "A New color image watermarkingscheme," Infocomp, Journal of computer science , vol. 5,N.2, pp. 37-42, 2006.
[9] X. Wu and Z.-H. Guan, "A novel digital watermark algorithm based on chaotic maps,"Physics Letters A, vol. 365, pp. 403-406, 2007.
[10] Feng Yang, Lei Li, “An adaptive, SVM -based watermarking in frequency domain”,
International Conference on Wavelet Analysis and Pattern Recognition, pp. 465 – 469,Hongkong, 30 sep., 2008.
[11] L. Chun-Shien, H. Shih-Kun, S. Chwen-Jye, and L. Hong-Yuan Mark, "Cocktailwatermarkingfor digital image protection," Multimedia, IEEE Transactions on , vol. 2, pp.209-224, 2000.
[12] W. Lu, H. Lu, and F.L. Chung, "Robust digital image watermarking based on subsampling,"Applied Mathematics and Computation , vol.181, pp. 886-893, 2006.
[13] Wang-sheng Fang, Kang Chen, “A Wavelet Watermarking Based on HVS andWatermarking Capacity Analysis”, IEEE International Conference on MultimediaInformation Networking and Security, pp. 141-144, Hubei, Dec., 2009.
[14] Hongping Xu, Xiaoxia Wan, “International Conference on Computer Science and SoftwareEngineering”, pp. 245- 248,Hubei, Dec., 2008.
[15] Yanhong Zhang, “Blind watermark algorithm based on HVS and RBF neural network in DWTdomain”, WSEAS Transactions on Computers, Volume 8, Issue 1, January 2009.
[16] Nagar Abhishk, Nandkumar Karthik, Jain Anil k., “Biometric Template Transformation: a security analysis ,” Proc. SPIE, the International Society for Optical Engineering, vol.7541,2010.
[17] Noore A., Singh R., Vatsa M. and Houck M.M., “ Enhancing Security of Fingerprints Through Contextual Biometric Watermarking ”, Journal of Forensic Science International,
Vol. 169, Issue 2, Pp. 188-194 ,July 2007.
[18] S. Pankanti and M.M. Yeung, “Verification Watermarks on Fingerprint Recognition and Retrieval ,” Proc. SPIE, vol. 3657, pp. 66-78, 1999.
[19] Chander Kant, Ranjender Nath & Sheetal Chaudhary, “Biometrics Security usingsteganography”, International Journal of Security, Vol. 2 : Issue (1).
8/6/2019 International Journal of Biometrics and Bioinformatics IJBB_V5_I2
http://slidepdf.com/reader/full/international-journal-of-biometrics-and-bioinformatics-ijbbv5i2 22/133
Mita Paunwala & Suprava Patnaik
International Journal of Biometrics and Bioinformatics (IJBB), Volume (5) : Issue (2) : 2011 42
[20] S. Jain, “Digital Watermarking Techniques: A Case Study in Fingerprints & Faces ,” IndianConf. Computer Vision, Graphics, and Image Processing, pp. 139-144, Dec. 2000.
[21] B. Gunsel, U. Uludag, and A.M. Tekalp, “Robust Watermarking of Fingerprint Images ,”Pattern Recognition, vol. 35, no. 12, pp. 2739-2747, Dec. 2002.
[22] Yulin Wang , Alan Pearmain, “Blind image data hiding based on self reference” PatternRecognition Letters 25, 1681–1689, 2004.
[23] Hiller and Lieberman, “ Introduction to Operations Research ,” Seventh edition, TataMcGraw-Hill, 2001.
[24] Choi, Y., Aizawa, I., “Digital watermarking using interblock correlation ”, In: Proc. Internat.Conf. on Image Processing, vol. 2, pp. 16–220, 24–28 October 1999.
[25] J. Qi. and Y. Wang, "A robust fingerprint matching method ", Pattern Recognition, vol. 35,pp.1655-1671, 2005.
[26] X. Jiang, W.Y. Yau,” Fingerprint minutiae matching based on the local and global structures ”, Proc. of the 15th International Conference on Pattern Recognition, vol. 2, pp.1038–1041, 2000.
8/6/2019 International Journal of Biometrics and Bioinformatics IJBB_V5_I2
http://slidepdf.com/reader/full/international-journal-of-biometrics-and-bioinformatics-ijbbv5i2 23/133
Suresh Jaganathan & Geetha Manjusha M B
International Journal of Biometrics and Bioinformatics (IJBB), Volume (5) : Issue (2) : 2011 43
dFuse: An Optimized Compression Algorithm for DICOM-formatImage Archive
Suresh Jaganathan [email protected]
Assistant Professor Department of Computer Science and Engineering
Sri Sivasubramania Nadar College of Engineering,
Chennai, Tamilnadu, India
Geetha Manjusha M B [email protected] PG Scholar
Department of Computer Science and Engineering
Sri Sivasubramania Nadar College of Engineering,
Chennai, Tamilnadu, India
Abstract
Medical images are useful for knowing the details of the human body for health science orremedial reasons. DICOM is structured as a multi-part document in order to facilitate extension ofthese images. Additionally, DICOM defined information objects are not only for images but alsofor patients, studies, reports, and other data groupings. More information details in DICOM,resulted in large size, and transferring or communicating these files took lots of time. To solvethis, files can be compressed and transferred. Efficient compression solutions are available andthey are becoming more critical with the recent intensive growth of data and medical imaging. Inorder to receive the original and less sized image, we need effective compression algorithm.There are different algorithms for compression such as DCT, Haar, Daubechies which has itsroots in cosine and wavelet transforms. In this paper, we propose a new compression algorithmcalled “dFuse”. It uses cosine based three dimensional transform to compress the DICOM files.We use the following parameters to check the efficiency of the proposed algorithm, they are i) filesize, ii) PSNR, iii) compression percentage and iv) compression ratio. From the experimental
results obtained, the proposed algorithm works well for compressing medical images.
Keywords: Medical Image, Image Compression, DICOM, Wavelets, Cosine Transforms
1. INTRODUCTIONMedical imaging is a regulation within the medical arena which makes use of technology toacquire images of inside the human body. These images are utilized in analytics, as trainingtools, and in regular healthcare. This sometimes specified as diagnostic imaging, because it isoften helps doctors to diagnose easily. One kind of medical images is DICOM. DICOM not onlystores the image, but also some details such as patient name, patient-id and date scanned etc.DICOM varies from other data formats, as it contain groups of information together into a dataset. A DICOM data object comprises of a number of attributes, comprising items such as ID,
DOB, date, name etc. Also one single attribute comprising the image pixel data. In order tomaintain more details, file size increases, because of this transferring the file takes a lot of time.To avoid this difficulty, efficient compression techniques [1] are needed.
Image compression focuses [2] on the difficulty of decreasing the quantity of information that areneeded to signify an image. This is used to decrease the image storage and transmissionrequirements. The inverse process of the image compression is called decompression and it isapplied to the compressed data to get back the reconstructed image. The goal of compression isto decrease the number of bits as much as possible, while maintaining the resolution and thevisual excellence of the reconstructed image as close to the original image. Image compression
8/6/2019 International Journal of Biometrics and Bioinformatics IJBB_V5_I2
http://slidepdf.com/reader/full/international-journal-of-biometrics-and-bioinformatics-ijbbv5i2 24/133
Suresh Jaganathan & Geetha Manjusha M B
International Journal of Biometrics and Bioinformatics (IJBB), Volume (5) : Issue (2) : 2011 44
has many benefits. Image compression [3] provides a potential cost savings coupled with sendinga smaller amount of data over switched telephone. It not only reduces storage requirements butalso overall execution time. It reduces the probability of transmission errors since fewer bits aretransferred. It offers a level of security against illicit monitoring. There are different compressionmethods available in medical imaging such as cosine [4], wavelet transforms [5].
The rest of the paper is organized as follows. Section 2 brief introduction to medical images,Section 3 describes the definitions of various compression algorithms. Section 4 narrates theproposed architecture and explains the algorithm proposed. Section 5 discusses the experimentalresults obtained and finally Section 6 concludes the paper.
2. MEDICAL IMAGESMedical images [6, 7] are used to provide a photograph of the inner side of the body as clear as itis. These images are helpful to recognize unusual things in inner parts of the body, such astumors, blood vessels, broken bones, and so on. The most famous types of diagnostic imagesare the x-ray images that use radiation to take a stationary image of a specific area of the body.Doctors can know the medical outcomes of a calculated tomography scan that can be retrievedvia a commercial computer. Behind the scenes, gigantic amount of data is compressed, so thatdoctor observes it on a computer screen. Computed tomography scans, along with magneticresonance imaging and positron emission tomography scans form substantial amounts of data.Data is not stockpiled on a typical hard drive and the gap required to accumulate these images ina clinical background would engage in a complete wing of the hospital and also with currentelectronic medical records custody laws.
The DICOM Standards Committee survives to produce and sustain international standards forcommunication of biomedical diagnostics and curative information in restraints that utilize digitalimages and allied data. The objectives of DICOM are to accomplish companionability and toincrease workflow effectiveness. DICOM is used by every medical profession that exploits imageswithin the healthcare industry. These include dentistry, mammography, ophthalmology,endoscopy, orthopedics, radiology, cardiology, surgery, pediatrics, radiation therapy, pathologyetc. DICOM also tackles the assimilation of information created by these various areas ofexpertise applications in the patient’s e-Medical Record. This defines the network and mediaswapping services permitting storage and retrieval to these DICOM objects for these record
systems. The compression of DICOM files has an enormous value. Compression of an image canbe a solitary image or set of images. The DICOM standard has been very disinclined to acceptdemise algorithms in medical practice. However, the diagnostic information created by hospitalshas statistically enhanced and a compression technique is desired that outcomes with larger datadiminutions and so transmission speed.
3. DEFINITIONS
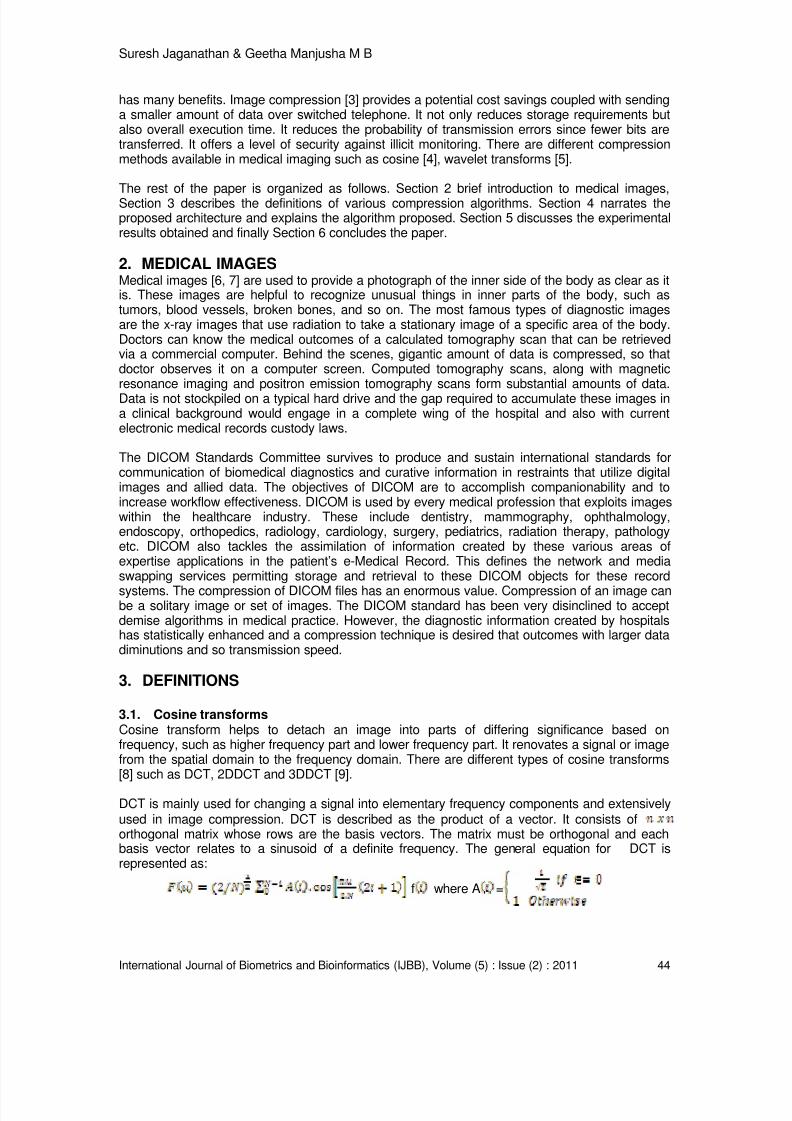
3.1. Cosine transformsCosine transform helps to detach an image into parts of differing significance based onfrequency, such as higher frequency part and lower frequency part. It renovates a signal or imagefrom the spatial domain to the frequency domain. There are different types of cosine transforms[8] such as DCT, 2DDCT and 3DDCT [9].
DCT is mainly used for changing a signal into elementary frequency components and extensivelyused in image compression. DCT is described as the product of a vector. It consists oforthogonal matrix whose rows are the basis vectors. The matrix must be orthogonal and eachbasis vector relates to a sinusoid of a definite frequency. The general equation for DCT isrepresented as:
f where A =
8/6/2019 International Journal of Biometrics and Bioinformatics IJBB_V5_I2
http://slidepdf.com/reader/full/international-journal-of-biometrics-and-bioinformatics-ijbbv5i2 25/133
Suresh Jaganathan & Geetha Manjusha M B
International Journal of Biometrics and Bioinformatics (IJBB), Volume (5) : Issue (2) : 2011 45
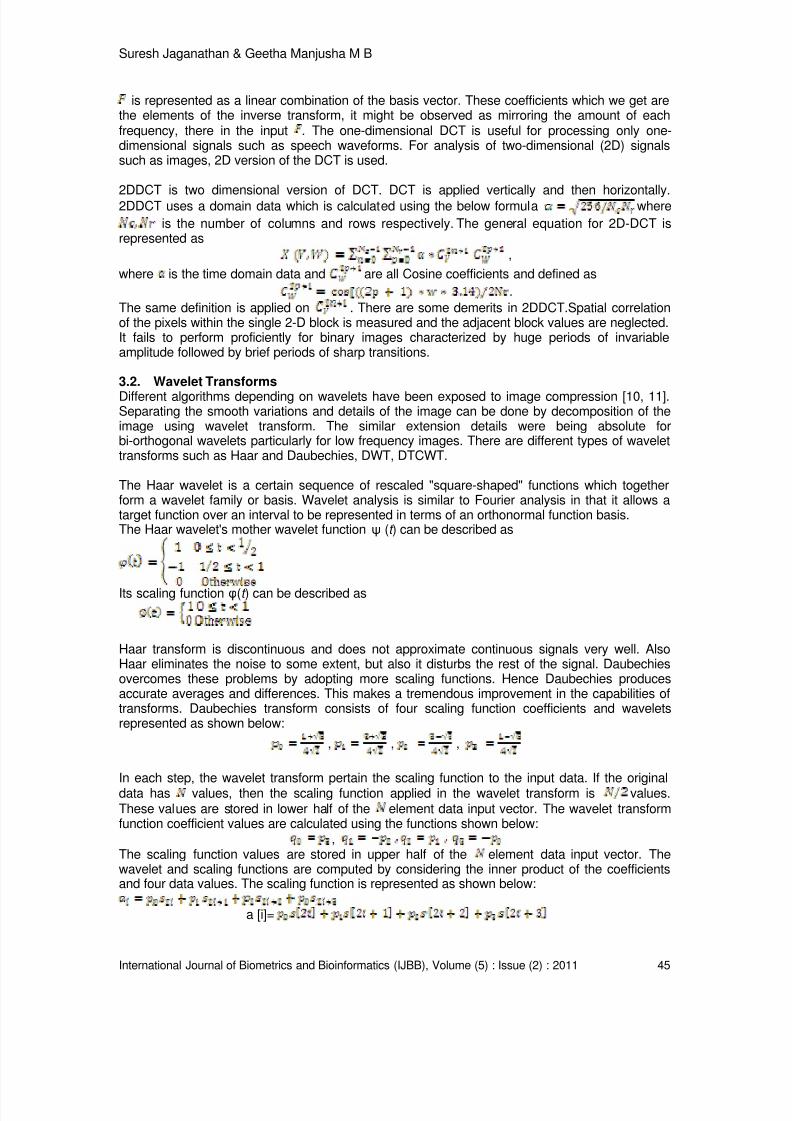
is represented as a linear combination of the basis vector. These coefficients which we get arethe elements of the inverse transform, it might be observed as mirroring the amount of eachfrequency, there in the input . The one-dimensional DCT is useful for processing only one-dimensional signals such as speech waveforms. For analysis of two-dimensional (2D) signalssuch as images, 2D version of the DCT is used.
2DDCT is two dimensional version of DCT. DCT is applied vertically and then horizontally.2DDCT uses a domain data which is calculated using the below formula where
is the number of columns and rows respectively. The general equation for 2D-DCT isrepresented as
,
where is the time domain data and are all Cosine coefficients and defined as
.
The same definition is applied on . There are some demerits in 2DDCT.Spatial correlationof the pixels within the single 2-D block is measured and the adjacent block values are neglected.It fails to perform proficiently for binary images characterized by huge periods of invariableamplitude followed by brief periods of sharp transitions.
3.2. Wavelet Transforms
Different algorithms depending on wavelets have been exposed to image compression [10, 11].Separating the smooth variations and details of the image can be done by decomposition of theimage using wavelet transform. The similar extension details were being absolute forbi-orthogonal wavelets particularly for low frequency images. There are different types of wavelettransforms such as Haar and Daubechies, DWT, DTCWT.
The Haar wavelet is a certain sequence of rescaled "square-shaped" functions which togetherform a wavelet family or basis. Wavelet analysis is similar to Fourier analysis in that it allows atarget function over an interval to be represented in terms of an orthonormal function basis.The Haar wavelet's mother wavelet function ψ (t ) can be described as
Its scaling function φ(t ) can be described as
Haar transform is discontinuous and does not approximate continuous signals very well. AlsoHaar eliminates the noise to some extent, but also it disturbs the rest of the signal. Daubechiesovercomes these problems by adopting more scaling functions. Hence Daubechies producesaccurate averages and differences. This makes a tremendous improvement in the capabilities oftransforms. Daubechies transform consists of four scaling function coefficients and waveletsrepresented as shown below:
, , ,
In each step, the wavelet transform pertain the scaling function to the input data. If the originaldata has values, then the scaling function applied in the wavelet transform is values.These values are stored in lower half of the element data input vector. The wavelet transformfunction coefficient values are calculated using the functions shown below:
,The scaling function values are stored in upper half of the element data input vector. Thewavelet and scaling functions are computed by considering the inner product of the coefficientsand four data values. The scaling function is represented as shown below:
a [i]=
8/6/2019 International Journal of Biometrics and Bioinformatics IJBB_V5_I2
http://slidepdf.com/reader/full/international-journal-of-biometrics-and-bioinformatics-ijbbv5i2 26/133
Suresh Jaganathan & Geetha Manjusha M B
International Journal of Biometrics and Bioinformatics (IJBB), Volume (5) : Issue (2) : 2011 46
The wavelet function is represented as shown below:
c [i]=
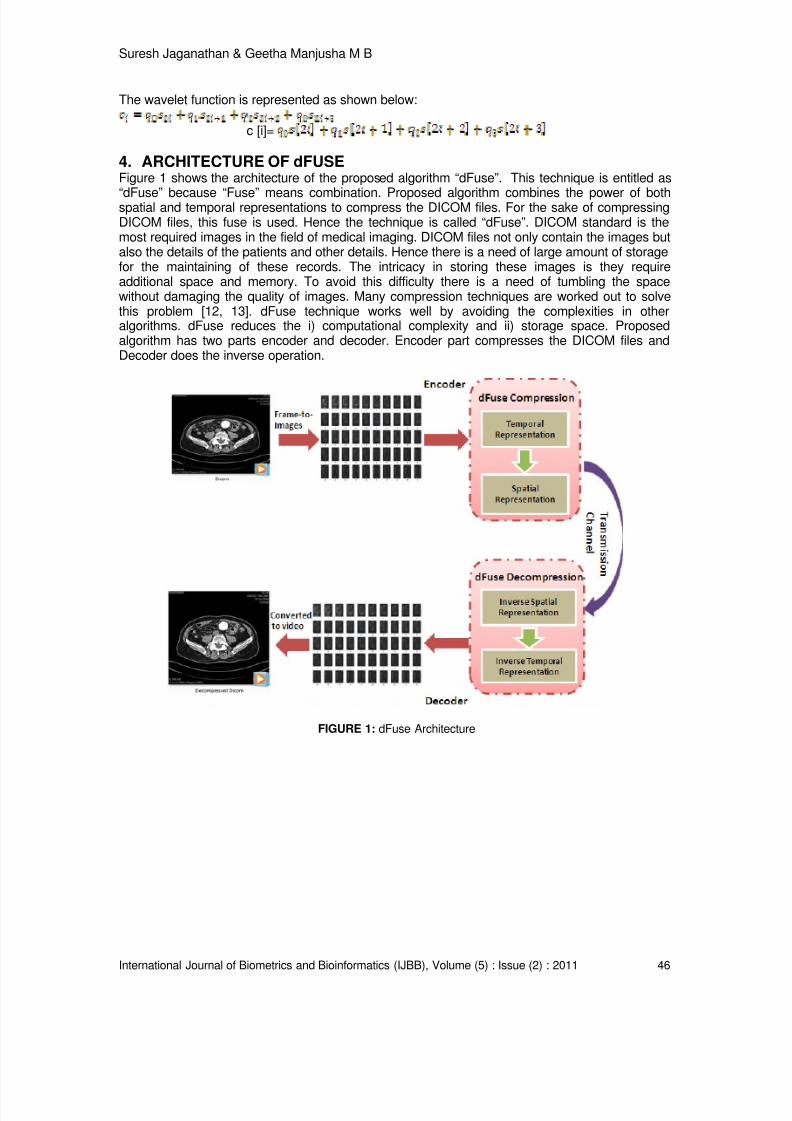
4. ARCHITECTURE OF dFUSEFigure 1 shows the architecture of the proposed algorithm “dFuse”. This technique is entitled as
“dFuse” because “Fuse” means combination. Proposed algorithm combines the power of bothspatial and temporal representations to compress the DICOM files. For the sake of compressingDICOM files, this fuse is used. Hence the technique is called “dFuse”. DICOM standard is themost required images in the field of medical imaging. DICOM files not only contain the images butalso the details of the patients and other details. Hence there is a need of large amount of storagefor the maintaining of these records. The intricacy in storing these images is they requireadditional space and memory. To avoid this difficulty there is a need of tumbling the spacewithout damaging the quality of images. Many compression techniques are worked out to solvethis problem [12, 13]. dFuse technique works well by avoiding the complexities in otheralgorithms. dFuse reduces the i) computational complexity and ii) storage space. Proposedalgorithm has two parts encoder and decoder. Encoder part compresses the DICOM files andDecoder does the inverse operation.
FIGURE 1: dFuse Architecture
8/6/2019 International Journal of Biometrics and Bioinformatics IJBB_V5_I2
http://slidepdf.com/reader/full/international-journal-of-biometrics-and-bioinformatics-ijbbv5i2 27/133
Suresh Jaganathan & Geetha Manjusha M B
International Journal of Biometrics and Bioinformatics (IJBB), Volume (5) : Issue (2) : 2011 47
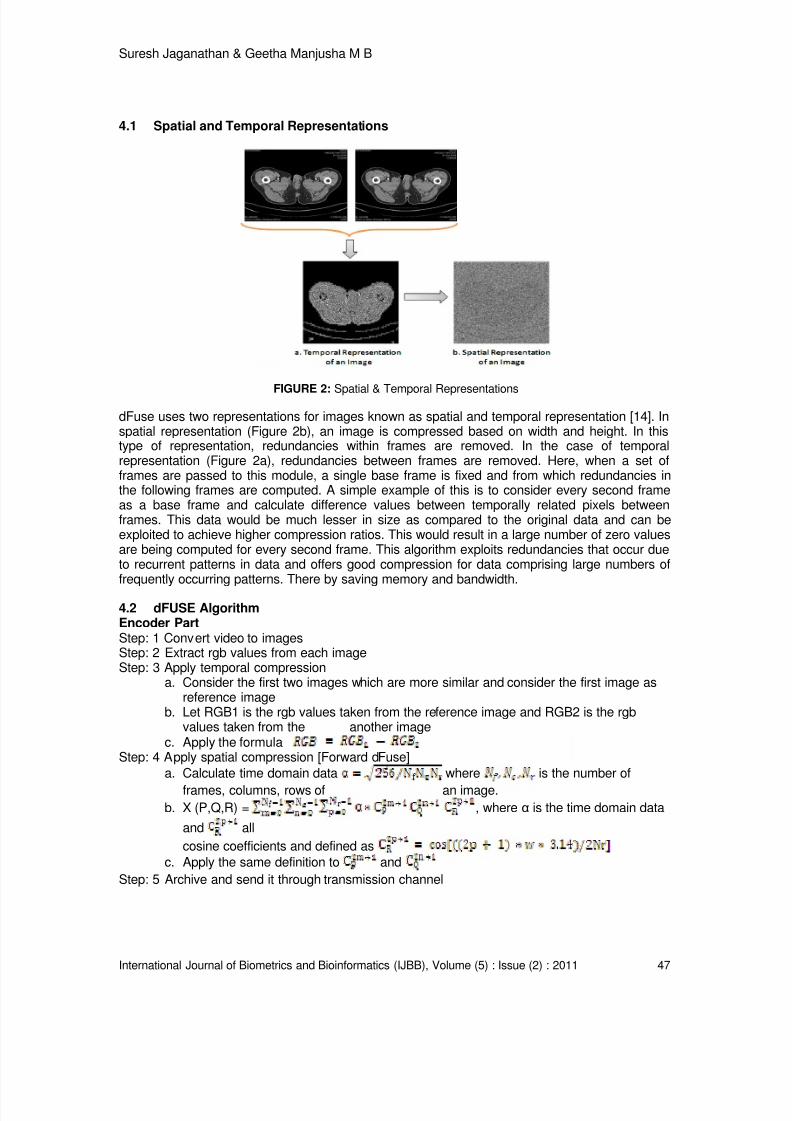
4.1 Spatial and Temporal Representations
FIGURE 2: Spatial & Temporal Representations
dFuse uses two representations for images known as spatial and temporal representation [14]. Inspatial representation (Figure 2b), an image is compressed based on width and height. In thistype of representation, redundancies within frames are removed. In the case of temporalrepresentation (Figure 2a), redundancies between frames are removed. Here, when a set offrames are passed to this module, a single base frame is fixed and from which redundancies inthe following frames are computed. A simple example of this is to consider every second frameas a base frame and calculate difference values between temporally related pixels betweenframes. This data would be much lesser in size as compared to the original data and can beexploited to achieve higher compression ratios. This would result in a large number of zero valuesare being computed for every second frame. This algorithm exploits redundancies that occur dueto recurrent patterns in data and offers good compression for data comprising large numbers offrequently occurring patterns. There by saving memory and bandwidth.
4.2 dFUSE AlgorithmEncoder PartStep: 1 Convert video to imagesStep: 2 Extract rgb values from each imageStep: 3 Apply temporal compression
a. Consider the first two images which are more similar and consider the first image asreference image
b. Let RGB1 is the rgb values taken from the reference image and RGB2 is the rgbvalues taken from the another image
c. Apply the formulaStep: 4 Apply spatial compression [Forward dFuse]
a. Calculate time domain data where is the number of
frames, columns, rows of an image.
b. X (P,Q,R) = , where α is the time domain data
and all
cosine coefficients and defined as
c. Apply the same definition to and
Step: 5 Archive and send it through transmission channel
8/6/2019 International Journal of Biometrics and Bioinformatics IJBB_V5_I2
http://slidepdf.com/reader/full/international-journal-of-biometrics-and-bioinformatics-ijbbv5i2 28/133
Suresh Jaganathan & Geetha Manjusha M B
International Journal of Biometrics and Bioinformatics (IJBB), Volume (5) : Issue (2) : 2011 48
Decoder PartStep: 1 Apply spatial decompression [Inverse dFuse]
a. Extract the rgb values from the spatially compressed image.
b. Calculate time domain data where is the number of
frames, columns, rows of an image.
c. , where α is the
time domain data and is cosine coefficients and defined as
d. Apply the same definition to and .
Step: 2 Apply temporal decompressiona. Group the images.b. Calculate
c. Calculate
d. Reconstruct the images from rgb values.Step: 3 Reconstruct the video from the reconstructed images.
5. EXPERIMENTAL RESULTSProposed algorithm is implemented and then checked its efficiency using these parameters, i)file
size, ii) compressed ratio, iii) PSNR ratio and iv) compression percentage.
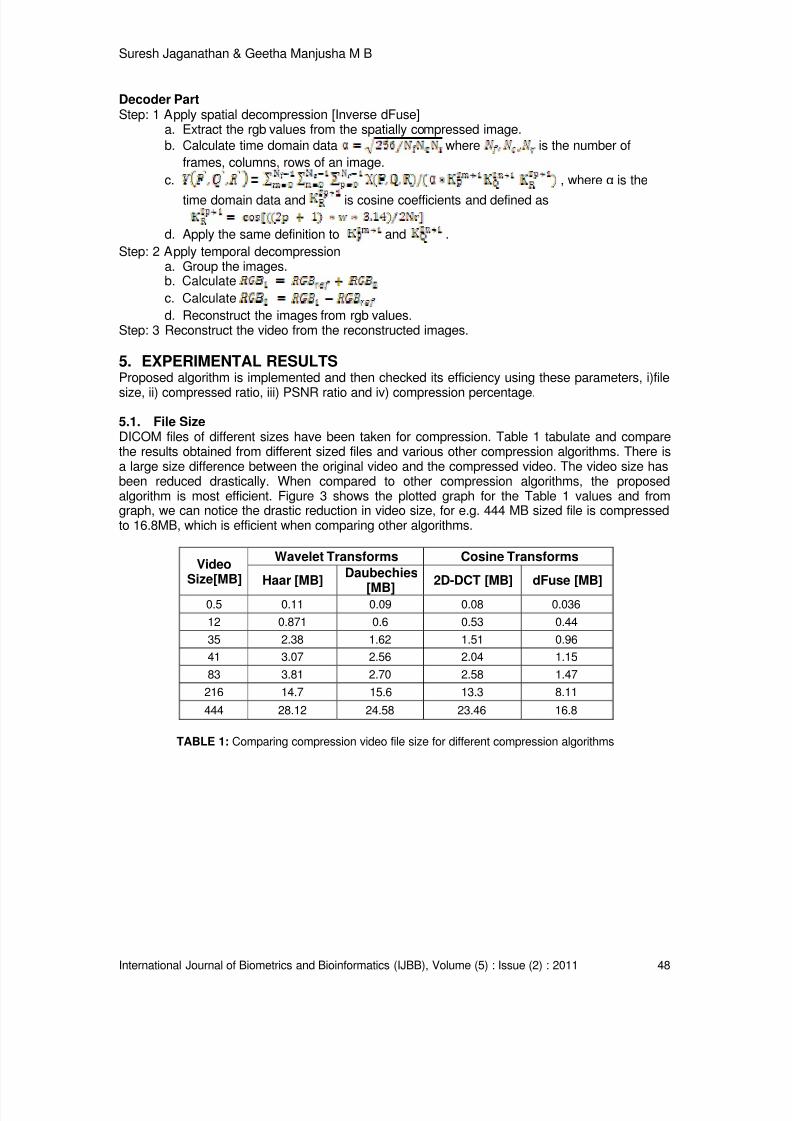
5.1. File SizeDICOM files of different sizes have been taken for compression. Table 1 tabulate and comparethe results obtained from different sized files and various other compression algorithms. There isa large size difference between the original video and the compressed video. The video size hasbeen reduced drastically. When compared to other compression algorithms, the proposedalgorithm is most efficient. Figure 3 shows the plotted graph for the Table 1 values and fromgraph, we can notice the drastic reduction in video size, for e.g. 444 MB sized file is compressedto 16.8MB, which is efficient when comparing other algorithms.
VideoSize[MB]
Wavelet Transforms Cosine Transforms
Haar [MB]Daubechies
[MB]2D-DCT [MB] dFuse [MB]
0.5 0.11 0.09 0.08 0.036
12 0.871 0.6 0.53 0.44
35 2.38 1.62 1.51 0.96
41 3.07 2.56 2.04 1.15
83 3.81 2.70 2.58 1.47
216 14.7 15.6 13.3 8.11
444 28.12 24.58 23.46 16.8
TABLE 1: Comparing compression video file size for different compression algorithms
8/6/2019 International Journal of Biometrics and Bioinformatics IJBB_V5_I2
http://slidepdf.com/reader/full/international-journal-of-biometrics-and-bioinformatics-ijbbv5i2 29/133
8/6/2019 International Journal of Biometrics and Bioinformatics IJBB_V5_I2
http://slidepdf.com/reader/full/international-journal-of-biometrics-and-bioinformatics-ijbbv5i2 30/133
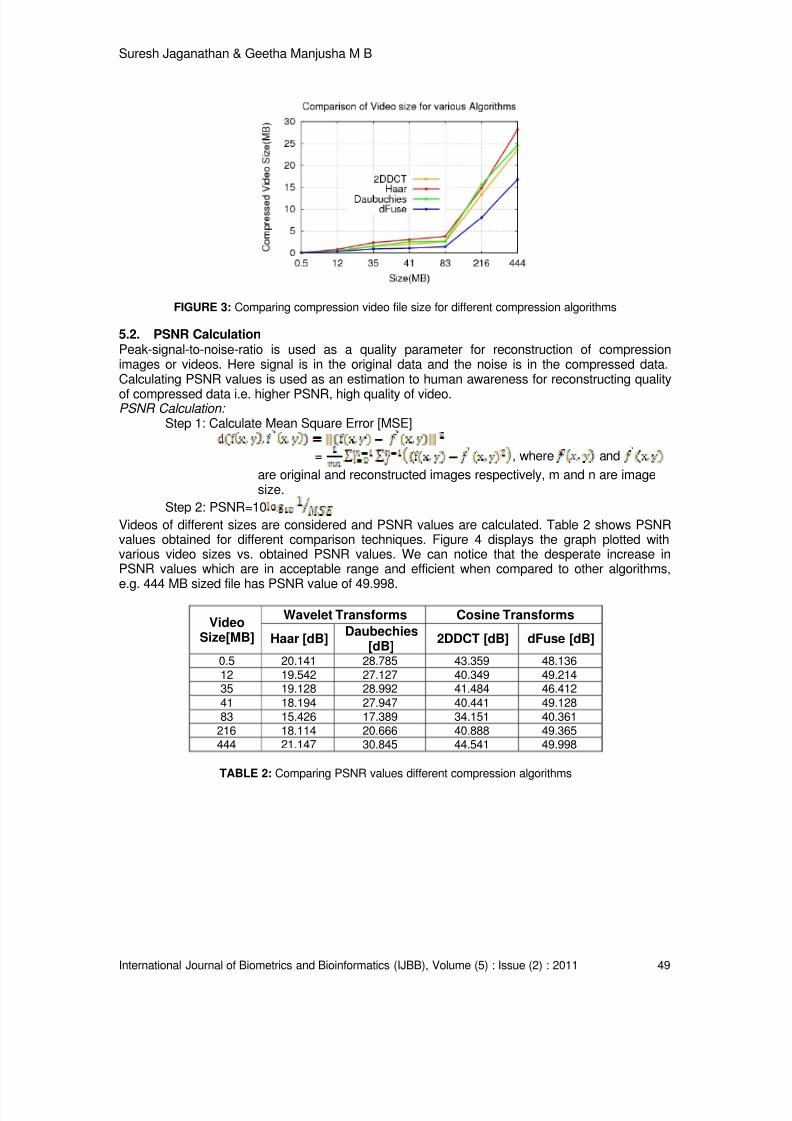
Suresh Jaganathan & Geetha Manjusha M B
International Journal of Biometrics and Bioinformatics (IJBB), Volume (5) : Issue (2) : 2011 50
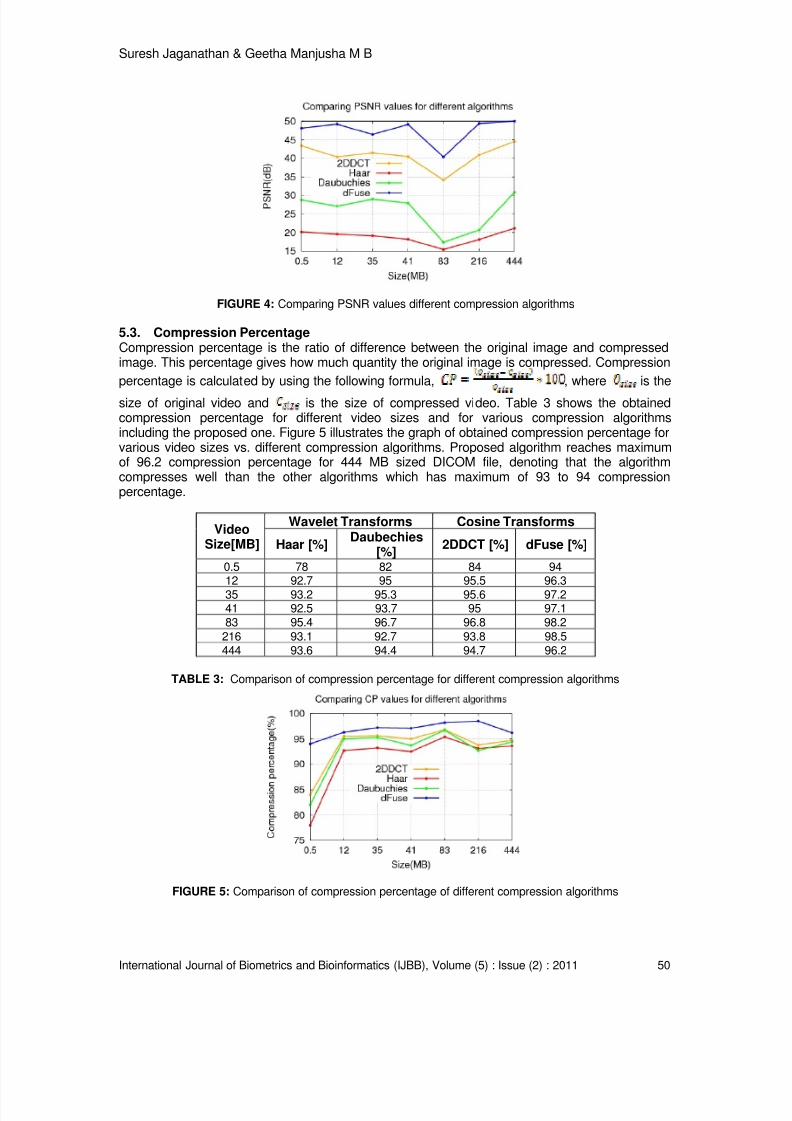
FIGURE 4: Comparing PSNR values different compression algorithms
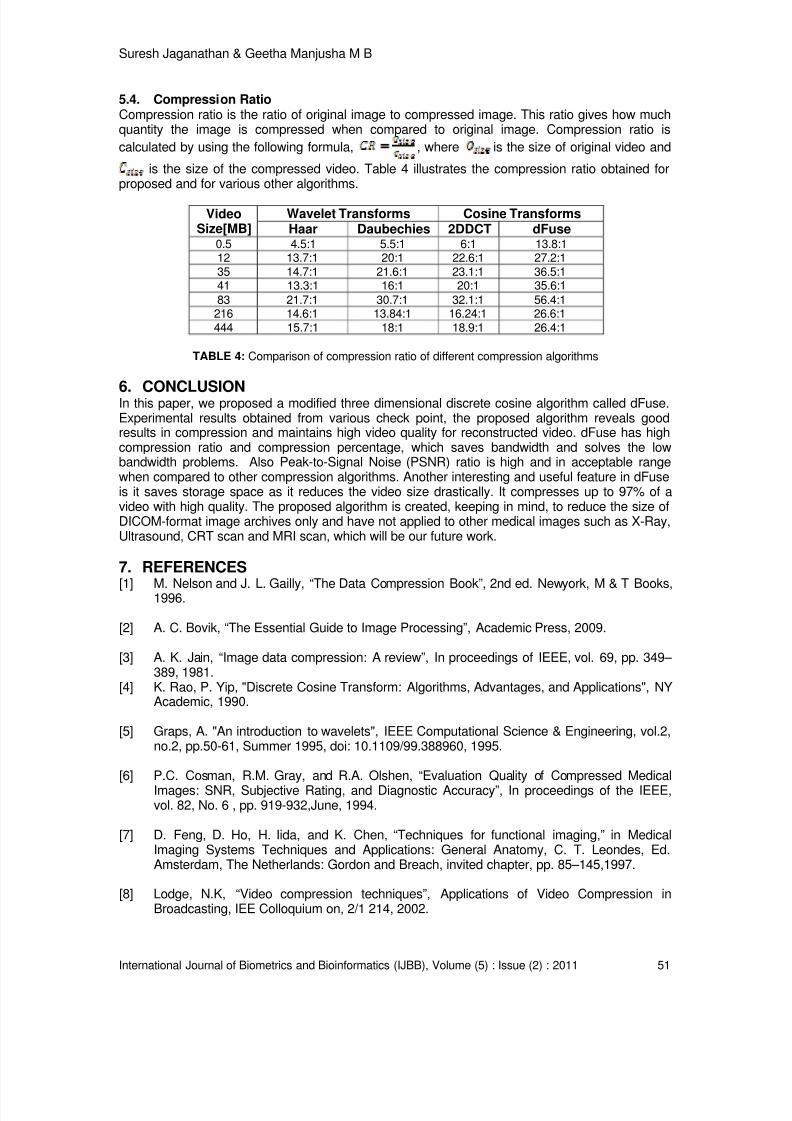
5.3. Compression PercentageCompression percentage is the ratio of difference between the original image and compressedimage. This percentage gives how much quantity the original image is compressed. Compression
percentage is calculated by using the following formula, , where is the
size of original video and is the size of compressed video. Table 3 shows the obtainedcompression percentage for different video sizes and for various compression algorithmsincluding the proposed one. Figure 5 illustrates the graph of obtained compression percentage forvarious video sizes vs. different compression algorithms. Proposed algorithm reaches maximumof 96.2 compression percentage for 444 MB sized DICOM file, denoting that the algorithmcompresses well than the other algorithms which has maximum of 93 to 94 compressionpercentage.
VideoSize[MB]
Wavelet Transforms Cosine Transforms
Haar [%]Daubechies
[%]2DDCT [%] dFuse [%]
0.5 78 82 84 9412 92.7 95 95.5 96.335 93.2 95.3 95.6 97.241 92.5 93.7 95 97.183 95.4 96.7 96.8 98.2
216 93.1 92.7 93.8 98.5444 93.6 94.4 94.7 96.2
TABLE 3: Comparison of compression percentage for different compression algorithms
FIGURE 5: Comparison of compression percentage of different compression algorithms
8/6/2019 International Journal of Biometrics and Bioinformatics IJBB_V5_I2
http://slidepdf.com/reader/full/international-journal-of-biometrics-and-bioinformatics-ijbbv5i2 31/133
8/6/2019 International Journal of Biometrics and Bioinformatics IJBB_V5_I2
http://slidepdf.com/reader/full/international-journal-of-biometrics-and-bioinformatics-ijbbv5i2 32/133
Suresh Jaganathan & Geetha Manjusha M B
International Journal of Biometrics and Bioinformatics (IJBB), Volume (5) : Issue (2) : 2011 52
[9] Ouni T, Ayedi W, Abid M, ”New low complexity DCT based video compression method ”, InProceedings of Tele Communication ICT09, doi:10.1109/ICTEL2009.5158644,pp:202-207,2009.
[10] Gargour, C., Gabrea, M., Ramachandran, V., Lina, J.M., "A short introduction to waveletsand their applications," IEEE Circuits and Systems Magazine, vol.9, no.2, pp.57-68,doi: 10.1109/MCAS.2009.932556, 2009.
[11] S. Mallat., “A Wavelet Tour of Signal Processing”, Third Edition: The Sparse Way.Academic Press, 2008.
[12] Nadia Benamor and Najoua Essaokri Ben amara, "DICOM Image Compression By WaveletTransform," In proceedings of IEEE Systems Man and Cybernetics (SMC), Harnmamet,Tunisia, 2002.
[13] Suapang, P., Dejhan K., Yimmun S., "Medical image compression and DICOM-formatimage archive”, ICCAS-SICE, pp.1945-1949, 2009.
[14] D. Ho, D. Feng, and K. Chen, “Dynamic image data compression in spatial and temporal
domains: Theory and algorithm,” IEEE Trans. Inform. Technol. Biomed., vol. 1, pp. 219– 228, Dec. 1997.
8/6/2019 International Journal of Biometrics and Bioinformatics IJBB_V5_I2
http://slidepdf.com/reader/full/international-journal-of-biometrics-and-bioinformatics-ijbbv5i2 33/133
Liyakathunisa & C.N. Ravi Kumar
International Journal of Biometrics and Bioinformatics (IJBB), Volume (5) : Issue (2) : 2011 53
A Novel and Efficient Lifting Scheme based Super ResolutionReconstruction for Early Detection of Cancer in Low Resolution
Mammogram Images
Liyakathunisa [email protected] Ph.D Research Scholar Dept of Computer Science & Engg S. J. College of Engineering Mysore, India.
C.N .Ravi Kumar [email protected] Professor & Head of Department Dept of Computer Science & Engg S. J. College of Engineering Mysore, India .
Abstract
Mammography is the most effective method for early detection of breast diseases. However, the
typical diagnostic signs, such as masses and microcalcifications, are difficult to be detected
because mammograms are low contrast and noisy images. We concentrate on a special case of
super resolution reconstruction for early detection of cancer from low resolution mammogram
images. Super resolution reconstruction is the process of combining several low resolution
images into a single higher resolution image. This paper describes a novel approach for
enhancing the resolution of mammographic images. We are proposing an efficient lifting wavelet
based denoising with adaptive interpolation for super resolution reconstruction. Under this frame
work, the digitized low resolution mammographic images are decomposed into many levels to
obtain different frequency bands. We use Daubechies (D4) lifting schemes to decompose low
resolution mammogram images into multilevel scale and wavelet coefficients. Then our proposed
novel soft thresholding technique is used to remove the noisy coefficients, by fixing optimumthreshold value. In order to obtain an image of higher resolution adaptive interpolation is applied.
Our proposed lifting wavelet transform based restoration and adaptive interpolation preserves the
edges as well as smoothens the image without introducing artifacts. The proposed algorithm
avoids the application of iterative method, reduces the complexity of calculation and applies to
large dimension low-resolution images. Experimental results show that the proposed approach
has succeeded in obtaining a high-resolution mammogram image with a high PSNR, ISNR ratio
and a good visual quality.
Keywords: Adaptive Interpolation, Lifting Wavelet Transform, Mammogram, Super Resolution,
Soft Thresholding.
1. INTRODUCTIONBreast cancer is the most common cause of cancer death in women between age of 40 and 45years. It is one of the leading causes of mortality in women. The World Health Organization’sInternational Agency for Research on Cancer in Lyon, France, estimates that more than 1,50,000women worldwide die of breast cancer each year [4]. It is expected that 89,000 new cases ofbreast cancer will be found each year. One out of every 15 newly born girls is expected todevelop breast cancer. Mammography, Xeroradiography and Thermography are used for thedetection of cancer.
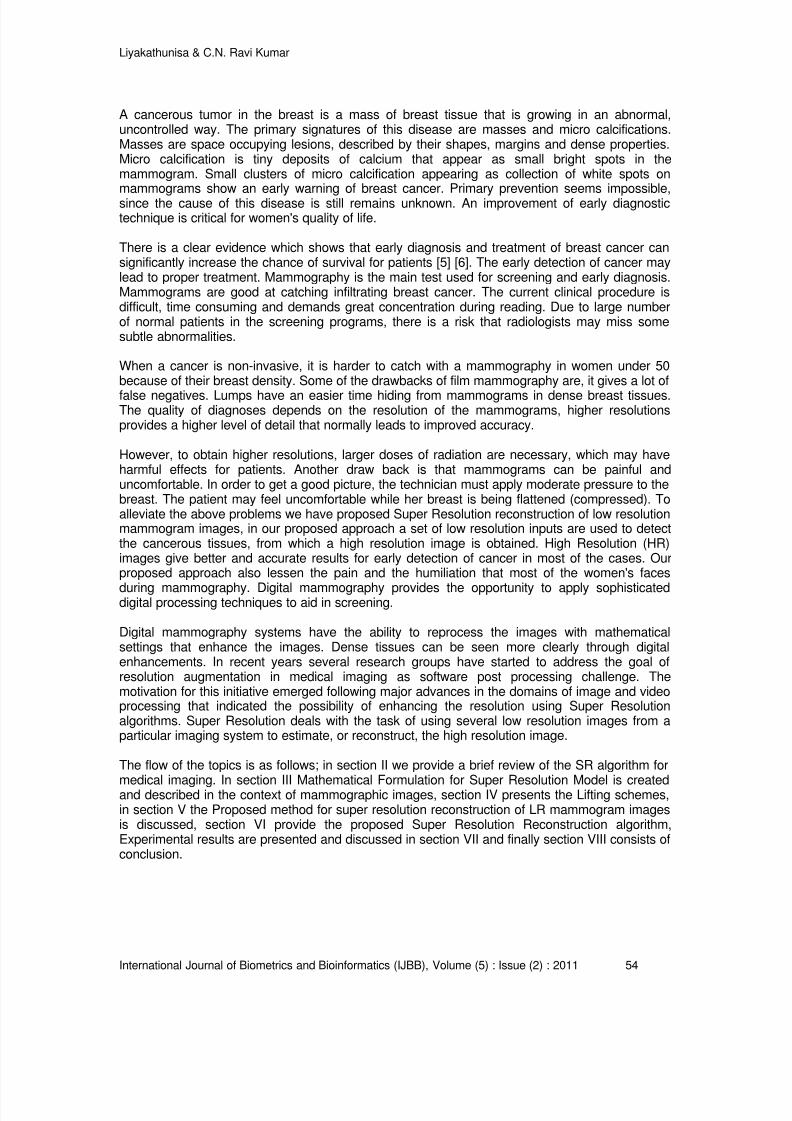
8/6/2019 International Journal of Biometrics and Bioinformatics IJBB_V5_I2
http://slidepdf.com/reader/full/international-journal-of-biometrics-and-bioinformatics-ijbbv5i2 34/133
Liyakathunisa & C.N. Ravi Kumar
International Journal of Biometrics and Bioinformatics (IJBB), Volume (5) : Issue (2) : 2011 54
A cancerous tumor in the breast is a mass of breast tissue that is growing in an abnormal,uncontrolled way. The primary signatures of this disease are masses and micro calcifications.Masses are space occupying lesions, described by their shapes, margins and dense properties.Micro calcification is tiny deposits of calcium that appear as small bright spots in themammogram. Small clusters of micro calcification appearing as collection of white spots onmammograms show an early warning of breast cancer. Primary prevention seems impossible,since the cause of this disease is still remains unknown. An improvement of early diagnostictechnique is critical for women's quality of life.
There is a clear evidence which shows that early diagnosis and treatment of breast cancer cansignificantly increase the chance of survival for patients [5] [6]. The early detection of cancer maylead to proper treatment. Mammography is the main test used for screening and early diagnosis.Mammograms are good at catching infiltrating breast cancer. The current clinical procedure isdifficult, time consuming and demands great concentration during reading. Due to large numberof normal patients in the screening programs, there is a risk that radiologists may miss somesubtle abnormalities.
When a cancer is non-invasive, it is harder to catch with a mammography in women under 50because of their breast density. Some of the drawbacks of film mammography are, it gives a lot of
false negatives. Lumps have an easier time hiding from mammograms in dense breast tissues.The quality of diagnoses depends on the resolution of the mammograms, higher resolutionsprovides a higher level of detail that normally leads to improved accuracy.
However, to obtain higher resolutions, larger doses of radiation are necessary, which may haveharmful effects for patients. Another draw back is that mammograms can be painful anduncomfortable. In order to get a good picture, the technician must apply moderate pressure to thebreast. The patient may feel uncomfortable while her breast is being flattened (compressed). Toalleviate the above problems we have proposed Super Resolution reconstruction of low resolutionmammogram images, in our proposed approach a set of low resolution inputs are used to detectthe cancerous tissues, from which a high resolution image is obtained. High Resolution (HR)images give better and accurate results for early detection of cancer in most of the cases. Ourproposed approach also lessen the pain and the humiliation that most of the women's faces
during mammography. Digital mammography provides the opportunity to apply sophisticateddigital processing techniques to aid in screening.
Digital mammography systems have the ability to reprocess the images with mathematicalsettings that enhance the images. Dense tissues can be seen more clearly through digitalenhancements. In recent years several research groups have started to address the goal ofresolution augmentation in medical imaging as software post processing challenge. Themotivation for this initiative emerged following major advances in the domains of image and videoprocessing that indicated the possibility of enhancing the resolution using Super Resolutionalgorithms. Super Resolution deals with the task of using several low resolution images from aparticular imaging system to estimate, or reconstruct, the high resolution image.
The flow of the topics is as follows; in section II we provide a brief review of the SR algorithm for
medical imaging. In section III Mathematical Formulation for Super Resolution Model is createdand described in the context of mammographic images, section IV presents the Lifting schemes,in section V the Proposed method for super resolution reconstruction of LR mammogram imagesis discussed, section VI provide the proposed Super Resolution Reconstruction algorithm,Experimental results are presented and discussed in section VII and finally section VIII consists ofconclusion.
8/6/2019 International Journal of Biometrics and Bioinformatics IJBB_V5_I2
http://slidepdf.com/reader/full/international-journal-of-biometrics-and-bioinformatics-ijbbv5i2 35/133
Liyakathunisa & C.N. Ravi Kumar
International Journal of Biometrics and Bioinformatics (IJBB), Volume (5) : Issue (2) : 2011 55
2. RELATED WORKSuper Resolution problem was extensively addresses in the literature during the last twodecades. A variety of reconstruction algorithm have been proposed in literature, where thecommon goal is to estimate the HR image as accurately as possible, while minimizing the noise,and preserving the image smoothness. In 2001 and 2003 initial attempts were made to adaptsuper resolution algorithms from the computer vision community to medical imaging applications,
initial research dealt with Magnetic Resonance Imaging (MRI) and Position EmissionTomography (PET) modality. Results were encouraged and were reproduced around the world.In this paper we will discuss the main reconstruction algorithms that are in use, such as IterativeBack Projection (IBP)[7] , Projection on to Convex Sets(POCS)[10], Frequency DomainTechniques[8][9] . Green Span and Peled [11] and Kennedy et. al [12] suggested SuperResolution Reconstruction for MRI images where they used IBP. In the IBP approach, anestimate of the high resolution image is compared with low resolution image estimates. Thedifferences between the estimated low resolution images and the actual low resolution imagesare then used to refine the high resolution image in an iterative manner. Hsu et al. [13] proposedto create high resolution cardiovascular images using a super resolution method based onProjection on Convex Sets (POCS). In the POCS approach, a convex constraint set is set up tomaintain consistency with the low resolution images. The estimated high resolution image isprojected onto each constraint within the convex constraint set until the desired condition issatisfied. Frequency domain technique was suggested by Tsai and Huang [8] and Kim et al [9];most frequency domain methods are based on transforming the input images to the frequencydomain (using 2-D discrete Fourier transform (DFT)), combining the spectral data and returningthe output image. (After applying 2-D IDFT) Phase adaptive Super resolution was proposed byAlexander et al [14] in 2009. In this approach the SR problem is formulated as a constrainedoptimization problem using a third order Markov prior model, and adapts the priors based on thephase variations of the LR mammographic images. In 2010 super resolution for mammogramswas proposed by Jun et al. [15]. In their approach, the algorithm combines machine learningmethods and stochastic search to learn the mapping from LR to HR mapping using a data set oftraining images. In this paper we have proposed a novel and efficient wavelet based superresolution reconstruction of low resolution mammogram images.
3. MATHEMATICAL FORMULATION FOR THE SUPER RESOLUTION MODELIn this section we give the mathematical model for super resolution image reconstruction from a
set of Low Resolution (LR) mammographic images. During acquisition image is often corruptedby noise and because of the slight difference in X-ray attenuation between masses, the imagesmay appear with low contrast and often very blurred. They are also down sampled and wrapped,resulting in a set of aliased, blurred, noisy and shifted (mis -registered) images. In practice theimage shifts can be obtained by the x-ray tube rotations or by moving the imaged object withrespect to the x-ray source.
Let us consider the low resolution sensor plane by 1 2 M by M . The low resolution intensity
values are denoted as1 2
{ ( , )} 0..... -1 0...... -1 y i j where i M and j M = = ; if the down sampling
parameters are q1 2q and in horizontal and vertical directions, then the high resolution image will
be of size1 1 2 2
q M q M × . We assume that1 2
q q q= = and therefore the desired high resolution
image Z will have intensity values ( ){ }, Z k l where 0 ... -1 0 ... -11 2k qM and l qM = = .
Given ( ){ }, z k l the process of obtaining down sampled LR aliased image { ( , )} y i j is
2
( 1) 1( 1) 11( , ) ( , )
q i q j y i j z k l
q k qi l qj
+ − + −= ∑ ∑
= =(1)
i.e. the low resolution intensity is the average of high resolution intensities over a neighborhood ofq
2pixels. We formally state the problem by casting it in a Low Resolution restoration frame work.
8/6/2019 International Journal of Biometrics and Bioinformatics IJBB_V5_I2
http://slidepdf.com/reader/full/international-journal-of-biometrics-and-bioinformatics-ijbbv5i2 36/133
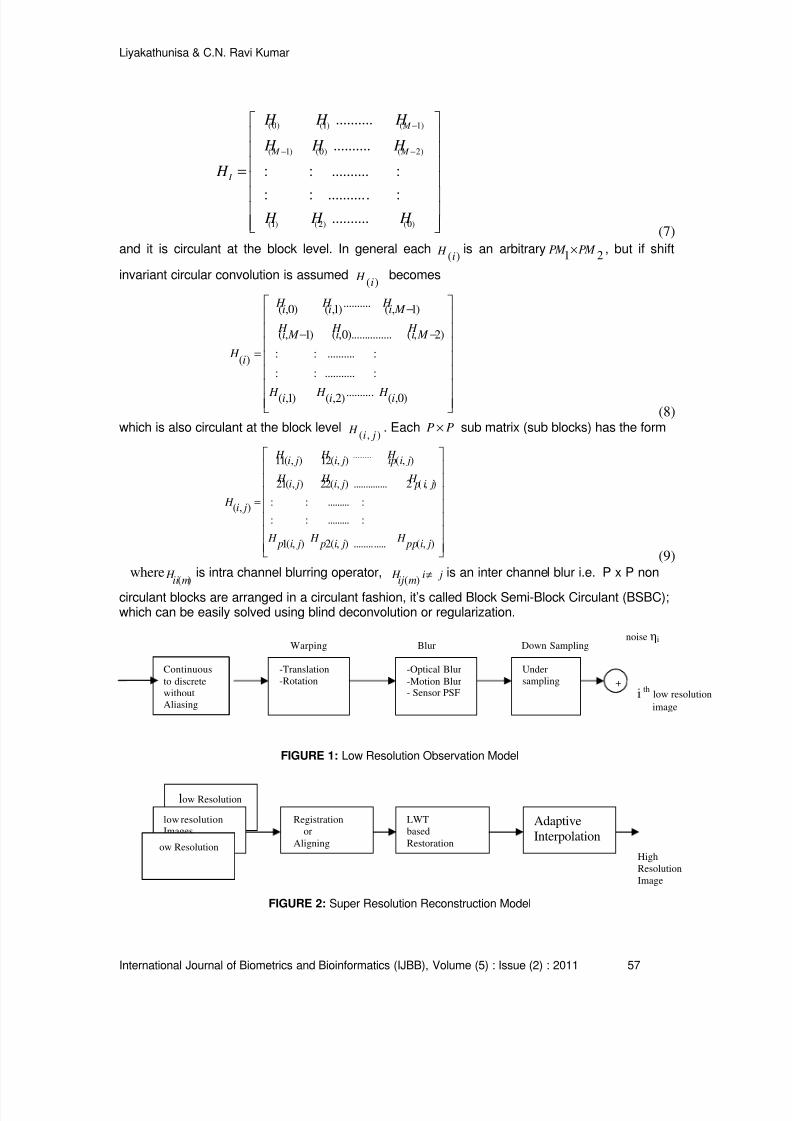
8/6/2019 International Journal of Biometrics and Bioinformatics IJBB_V5_I2
http://slidepdf.com/reader/full/international-journal-of-biometrics-and-bioinformatics-ijbbv5i2 37/133
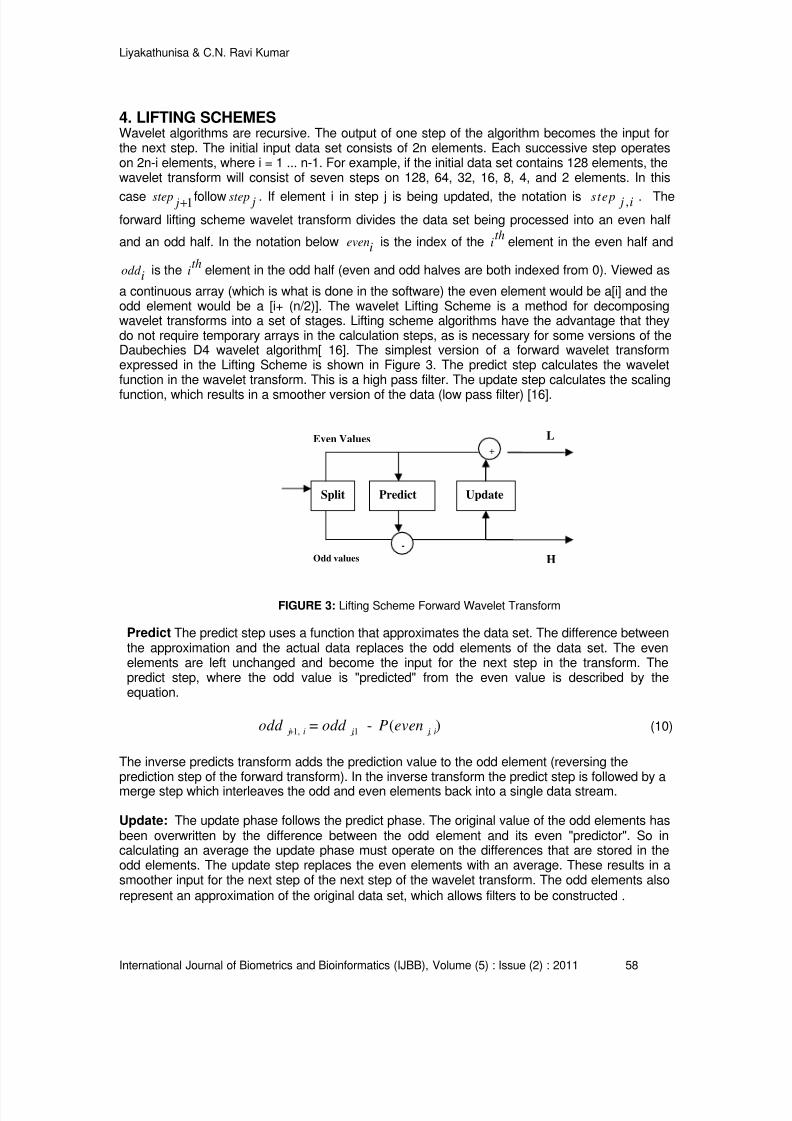
8/6/2019 International Journal of Biometrics and Bioinformatics IJBB_V5_I2
http://slidepdf.com/reader/full/international-journal-of-biometrics-and-bioinformatics-ijbbv5i2 38/133
Liyakathunisa & C.N. Ravi Kumar
International Journal of Biometrics and Bioinformatics (IJBB), Volume (5) : Issue (2) : 2011 58
4. LIFTING SCHEMESWavelet algorithms are recursive. The output of one step of the algorithm becomes the input forthe next step. The initial input data set consists of 2n elements. Each successive step operateson 2n-i elements, where i = 1 ... n-1. For example, if the initial data set contains 128 elements, thewavelet transform will consist of seven steps on 128, 64, 32, 16, 8, 4, and 2 elements. In this
case 1step j+ follow step j . If element i in step j is being updated, the notation is ,step j i . The
forward lifting scheme wavelet transform divides the data set being processed into an even half
and an odd half. In the notation below eveni is the index of theth
i element in the even half and
odd i is theth
i element in the odd half (even and odd halves are both indexed from 0). Viewed as
a continuous array (which is what is done in the software) the even element would be a[i] and theodd element would be a [i+ (n/2)]. The wavelet Lifting Scheme is a method for decomposingwavelet transforms into a set of stages. Lifting scheme algorithms have the advantage that theydo not require temporary arrays in the calculation steps, as is necessary for some versions of theDaubechies D4 wavelet algorithm[ 16]. The simplest version of a forward wavelet transformexpressed in the Lifting Scheme is shown in Figure 3. The predict step calculates the waveletfunction in the wavelet transform. This is a high pass filter. The update step calculates the scaling
function, which results in a smoother version of the data (low pass filter) [16].
FIGURE 3: Lifting Scheme Forward Wavelet Transform
Predict The predict step uses a function that approximates the data set. The difference betweenthe approximation and the actual data replaces the odd elements of the data set. The evenelements are left unchanged and become the input for the next step in the transform. Thepredict step, where the odd value is "predicted" from the even value is described by theequation.
1, ,1 ,= - ( ) j i j j iodd odd P even+ (10)
The inverse predicts transform adds the prediction value to the odd element (reversing theprediction step of the forward transform). In the inverse transform the predict step is followed by amerge step which interleaves the odd and even elements back into a single data stream.
Update: The update phase follows the predict phase. The original value of the odd elements hasbeen overwritten by the difference between the odd element and its even "predictor". So incalculating an average the update phase must operate on the differences that are stored in theodd elements. The update step replaces the even elements with an average. These results in asmoother input for the next step of the next step of the wavelet transform. The odd elements also
represent an approximation of the original data set, which allows filters to be constructed.
Split Predict Update
+
-
Even Values
Odd values
L
H
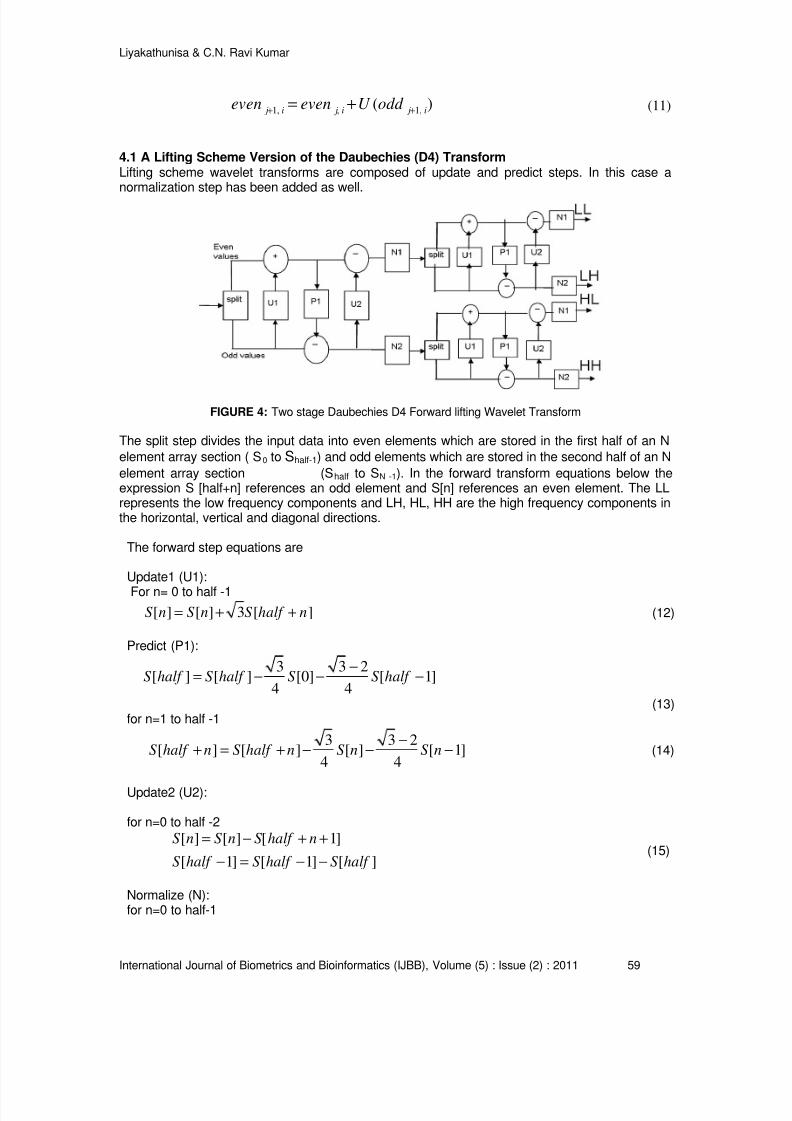
8/6/2019 International Journal of Biometrics and Bioinformatics IJBB_V5_I2
http://slidepdf.com/reader/full/international-journal-of-biometrics-and-bioinformatics-ijbbv5i2 39/133
Liyakathunisa & C.N. Ravi Kumar
International Journal of Biometrics and Bioinformatics (IJBB), Volume (5) : Issue (2) : 2011 59
1, , 1,( ) j i j i j ieven even U odd + +
= + (11)
4.1 A Lifting Scheme Version of the Daubechies (D4) TransformLifting scheme wavelet transforms are composed of update and predict steps. In this case anormalization step has been added as well.
FIGURE 4: Two stage Daubechies D4 Forward lifting Wavelet Transform
The split step divides the input data into even elements which are stored in the first half of an N
element array section ( S0 to Shalf-1) and odd elements which are stored in the second half of an N
element array section (Shalf to SN -1). In the forward transform equations below theexpression S [half+n] references an odd element and S[n] references an even element. The LLrepresents the low frequency components and LH, HL, HH are the high frequency components inthe horizontal, vertical and diagonal directions.
The forward step equations are
Update1 (U1):
For n= 0 to half -1
[ ] [ ] 3 [ ]S n S n S half n= + + (12)
Predict (P1):
3 3 2[ ] [ ] [0] [ 1]
4 4S half S half S S half
−= − − −
(13)for n=1 to half -1
3 3 2[ ] [ ] [ ] [ 1]
4 4S half n S half n S n S n
−+ = + − − − (14)
Update2 (U2):
for n=0 to half -2
[ ] [ ] [ 1]
[ 1] [ 1] [ ]
S n S n S half n
S half S half S half
= − + +
− = − −(15)
Normalize (N):for n=0 to half-1
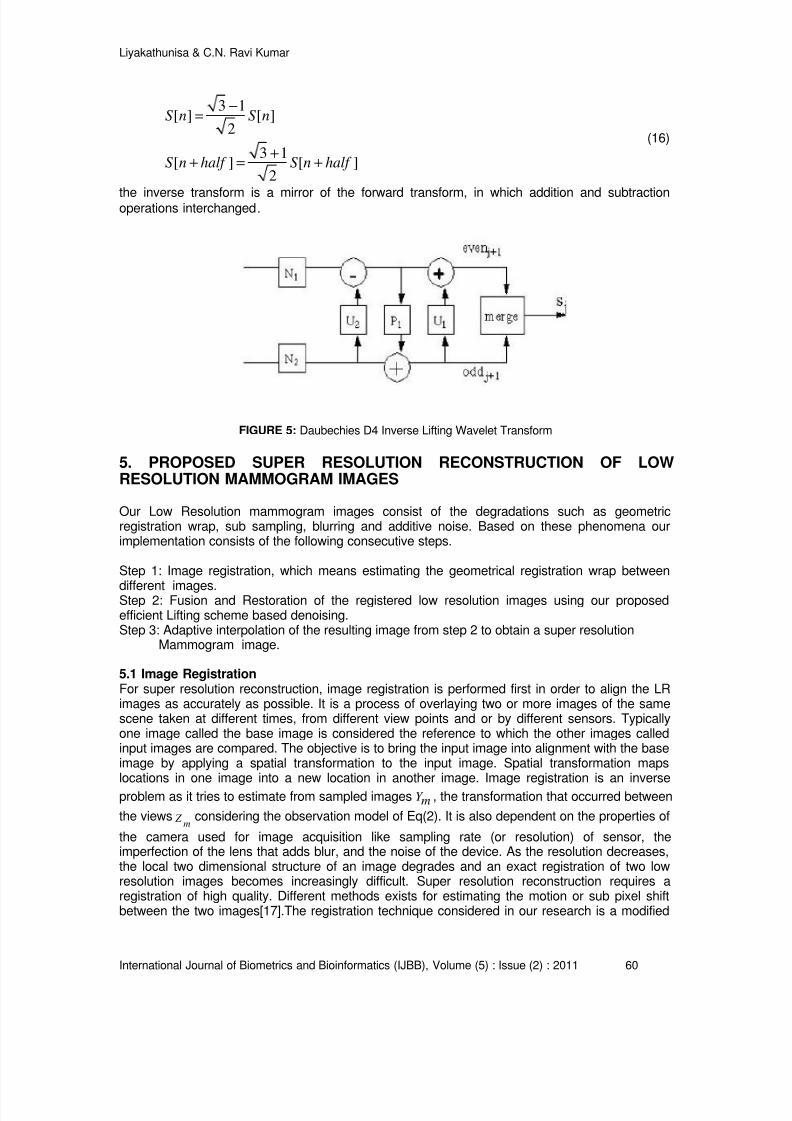
8/6/2019 International Journal of Biometrics and Bioinformatics IJBB_V5_I2
http://slidepdf.com/reader/full/international-journal-of-biometrics-and-bioinformatics-ijbbv5i2 40/133
Liyakathunisa & C.N. Ravi Kumar
International Journal of Biometrics and Bioinformatics (IJBB), Volume (5) : Issue (2) : 2011 60
3 1[ ] [ ]
2
3 1[ ] [ ]
2
S n S n
S n half S n half
−=
++ = +
(16)
the inverse transform is a mirror of the forward transform, in which addition and subtractionoperations interchanged.
FIGURE 5: Daubechies D4 Inverse Lifting Wavelet Transform
5. PROPOSED SUPER RESOLUTION RECONSTRUCTION OF LOWRESOLUTION MAMMOGRAM IMAGES
Our Low Resolution mammogram images consist of the degradations such as geometricregistration wrap, sub sampling, blurring and additive noise. Based on these phenomena ourimplementation consists of the following consecutive steps.
Step 1: Image registration, which means estimating the geometrical registration wrap between
different images.Step 2: Fusion and Restoration of the registered low resolution images using our proposedefficient Lifting scheme based denoising.Step 3: Adaptive interpolation of the resulting image from step 2 to obtain a super resolution
Mammogram image.
5.1 Image RegistrationFor super resolution reconstruction, image registration is performed first in order to align the LRimages as accurately as possible. It is a process of overlaying two or more images of the samescene taken at different times, from different view points and or by different sensors. Typicallyone image called the base image is considered the reference to which the other images calledinput images are compared. The objective is to bring the input image into alignment with the baseimage by applying a spatial transformation to the input image. Spatial transformation mapslocations in one image into a new location in another image. Image registration is an inverse
problem as it tries to estimate from sampled imagesY m , the transformation that occurred between
the viewsm
Z considering the observation model of Eq(2). It is also dependent on the properties of
the camera used for image acquisition like sampling rate (or resolution) of sensor, theimperfection of the lens that adds blur, and the noise of the device. As the resolution decreases,the local two dimensional structure of an image degrades and an exact registration of two lowresolution images becomes increasingly difficult. Super resolution reconstruction requires aregistration of high quality. Different methods exists for estimating the motion or sub pixel shiftbetween the two images[17].The registration technique considered in our research is a modified
8/6/2019 International Journal of Biometrics and Bioinformatics IJBB_V5_I2
http://slidepdf.com/reader/full/international-journal-of-biometrics-and-bioinformatics-ijbbv5i2 41/133
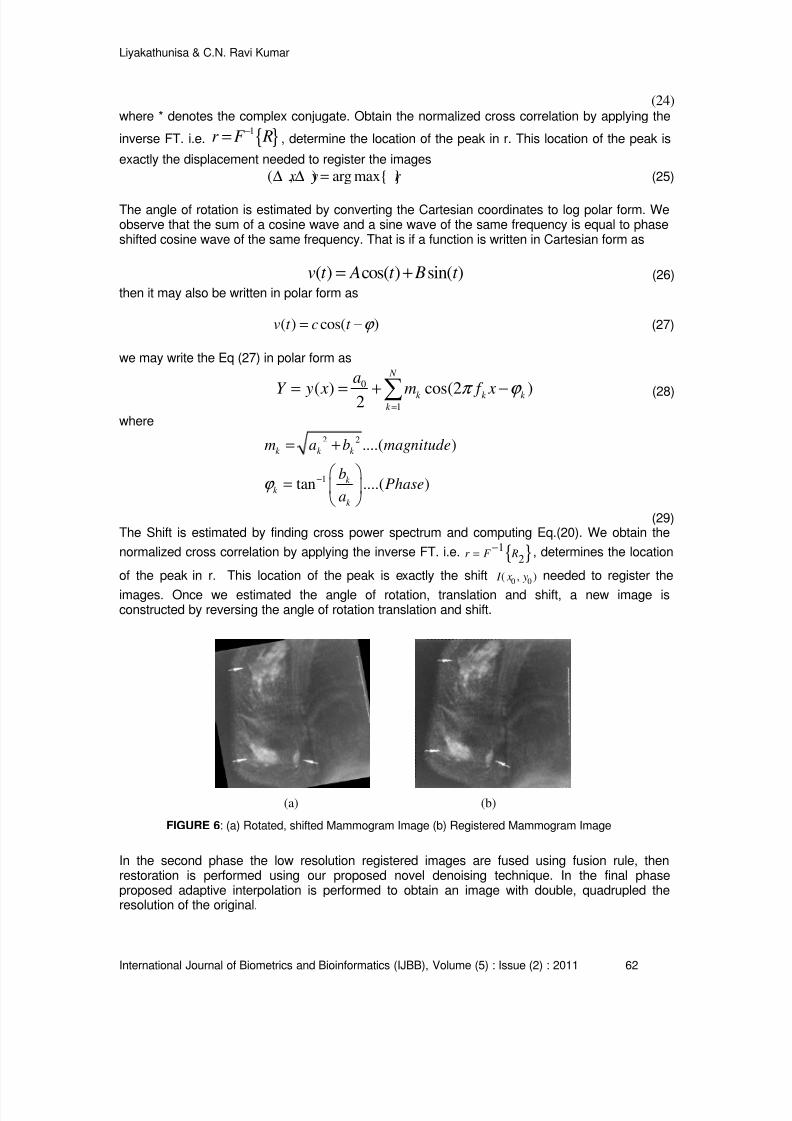
8/6/2019 International Journal of Biometrics and Bioinformatics IJBB_V5_I2
http://slidepdf.com/reader/full/international-journal-of-biometrics-and-bioinformatics-ijbbv5i2 42/133
Liyakathunisa & C.N. Ravi Kumar
International Journal of Biometrics and Bioinformatics (IJBB), Volume (5) : Issue (2) : 2011 62
(24)where * denotes the complex conjugate. Obtain the normalized cross correlation by applying the
inverse FT. i.e. { }1r F R−= , determine the location of the peak in r. This location of the peak is
exactly the displacement needed to register the images
( , ) arg max{ } x y r ∆ ∆ = (25)
The angle of rotation is estimated by converting the Cartesian coordinates to log polar form. Weobserve that the sum of a cosine wave and a sine wave of the same frequency is equal to phaseshifted cosine wave of the same frequency. That is if a function is written in Cartesian form as
( ) cos( ) sin( )v t A t B t = + (26)
then it may also be written in polar form as
( ) cos( )v t c t ϕ = − (27)
we may write the Eq (27) in polar form as
0
1( ) cos(2 )2
N
k k k k
a
Y y x m f xπ ϕ == = + −∑ (28)
where
2 2
1
....( )
tan ....( )
k k k
k k
k
m a b magnitude
bPhase
aϕ −
= +
=
(29)The Shift is estimated by finding cross power spectrum and computing Eq.(20). We obtain the
normalized cross correlation by applying the inverse FT. i.e. { }12
r F R−
= , determines the location
of the peak in r. This location of the peak is exactly the shift0 0
( , ) I x y needed to register the
images. Once we estimated the angle of rotation, translation and shift, a new image isconstructed by reversing the angle of rotation translation and shift.
In the second phase the low resolution registered images are fused using fusion rule, thenrestoration is performed using our proposed novel denoising technique. In the final phaseproposed adaptive interpolation is performed to obtain an image with double, quadrupled theresolution of the original.
(b)
FIGURE 6: (a) Rotated, shifted Mammogram Image (b) Registered Mammogram Image
(a)
8/6/2019 International Journal of Biometrics and Bioinformatics IJBB_V5_I2
http://slidepdf.com/reader/full/international-journal-of-biometrics-and-bioinformatics-ijbbv5i2 43/133
Liyakathunisa & C.N. Ravi Kumar
International Journal of Biometrics and Bioinformatics (IJBB), Volume (5) : Issue (2) : 2011 63
5.2 Lifting Wavelet based RestorationImages are obtained in areas ranging from everyday photography to astronomy, remote sensing,medical imaging and microscopy. In each case there is an underlying object or scene we wish toobserve, the original or the true image is the ideal representation of the observed scene. Yet theobservation process is never perfect, there is uncertainty in the measurement occurring as blur,noise and other degradations in the recorded images. Image restoration aims to recover anestimate of the original image from the degraded observations. Classical image restoration seeksan estimate of the true image assuming the blur is known, whereas blind image restorationtackles the much more difficult but realistic problem where the degradations are unknown.The low resolution observation model of Eq.(2) is considered. We formally state by casting theproblem in multi channel restoration format, the blur is considered as between channels andwithin channel of the low resolution images. In order to remove the blur and noise from the LRimages we have proposed an efficient wavelet based denoising using thresholding, our proposed
approach performs much better when compared to other approaches.
5.2.1. Proposed Efficient lifting Wavelet Transform Based Denoising for SRR UsingThresholdingImage denoising techniques are necessary to remove random additive noises while retaining asmuch as possible the important image features. The main objective of these types of randomnoise removal is to suppress the noise while preserving the original image details [19]. Statisticalfilter like average filter, wiener filter can be used for removing such noises but wavelet baseddenoising techniques proved better results than these filters. The wavelet transforms compressesthe essential information in an image into a relatively few, large coefficients which representsimage details at different resolution scales. In recent years there has been a fair amount ofresearch on wavelet thresholding and threshold selection for image denoising [20][21][22] .Let Z be an M x M image from Eq. (2), during transmission the image Z is corrupted by zero
mean White Gaussian noise η with standard deviation σ . At the receiver end the noisy
observation Y of Eq. (2) is obtained. The goal is to obtain the image Z from noisy observation Ysuch that the MSE is minimum. Lifting Wavelet Transforms decomposes the image into differentfrequency subbands. Small coefficients in the subbands are dominated by noise whilecoefficients with large absolute value carry more image information than noise. Replacing noisycoefficients by zeros and an inverse lifting wavelet transform may lead to reconstruction that haslesser noise. Normally hard thresholding and soft thresholding techniques are used for denoising.
Hard Thresholding
( , ) if X T
=0 if X T
D X T X = ⟩
⟨(30)
Soft Thresholding
( ) ( ) ( )X, T = Sign X *max 0, X - T D (31)
Where X is the input subband, D is the denoised band after thresholding and T is the thresholdlevel. The denoising algorithms, which are based on thresholding suggests that each coefficientof every detail subband is compared to threshold level and is either retained or killed if itsmagnitude is greater or less respectively.
In lifting wavelet transform decomposes an image into one approximate (LL) and three details(LH, HL and HH) subbands. The approximate coefficients are not submitted in this process. Sinceon one hand they carry the most important information about the image, on the other hand thenoise mostly affects the high frequency subbands. Hence the HH subband contains mainly noise.
8/6/2019 International Journal of Biometrics and Bioinformatics IJBB_V5_I2
http://slidepdf.com/reader/full/international-journal-of-biometrics-and-bioinformatics-ijbbv5i2 44/133
Liyakathunisa & C.N. Ravi Kumar
International Journal of Biometrics and Bioinformatics (IJBB), Volume (5) : Issue (2) : 2011 64
For estimating the noise level we use the Median Absolute Deviation (MAD) as proposed byDonoho [23].
, ,ij
ij
Median Y σ = ,Y LH HL HH
0.6745∈ (32)
The factor 0.6745 in the denominator rescales the numerator so that σ is also a suitableestimator for standard deviation for Gaussian white noise. Selecting an optimum threshold value(T) for soft thresholding is not an easy task. An optimum threshold value should be selectedbased on the subband characteristics. In lifting schemes subbands decomposition as the levelincreases, the coefficient of the subband becomes smoother. For example when an image isdecomposed into 2 level LWT using Daubechies 4 tap lifting wavelet transform, we get foursubbands figure (5), the HH subband of first level contains large amount of noise, hence thenoise level is estimated for the HH subband using Eq (32).Once the noise level is estimated weselect the threshold value T. The Threshold value T is
( )T = σ - HM GM − (33)
Here σ is the noise variance of the corrupted image. As given in [19], the Harmonic mean andgeometric mean are best suited for the removal of Gaussian noise, hence we use the absolutedifference of both the Harmonic Mean (HM) and Geometric Mean (GM) or either of the meansalso can be considered for denoising the image corrupted by Gaussian noise. The harmonicmean filter is better at removing Gaussian type noise and preserving edge features than thearithmetic mean filter. Hence we have considered harmonic mean than arithmetic mean. Theprocess is repeated for LH and HL bands and threshold is selected for all the three bands once
threshold is estimated, soft thresholding of Eq.(31) , is performed to denoise the image.
( )
2 M
M M 1
g i,ji=1 j=1
HM =
∑ ∑(34)
12 M M M
GM = g(i, j)i=1 j=1∏ ∏
(35)
5.3. Proposed Adaptive Interpolation for Super Resolution ReconstructionOnce the image are denoised using our proposed soft thresholding technique, interpolation isperformed to obtain an image of double, quadruple the size of the original image. Our proposedalgorithm works in four phases: In the first phase the lifting wavelet transform based fused imageis expanded. Suppose the size of the fused image is n x m. The image will be expanded to size N(2n-1) x (2m-1). In the figure (7) solid circles show original pixels and hallow circles showundefined pixels. In the remaining three phases these undefined pixels will be filled
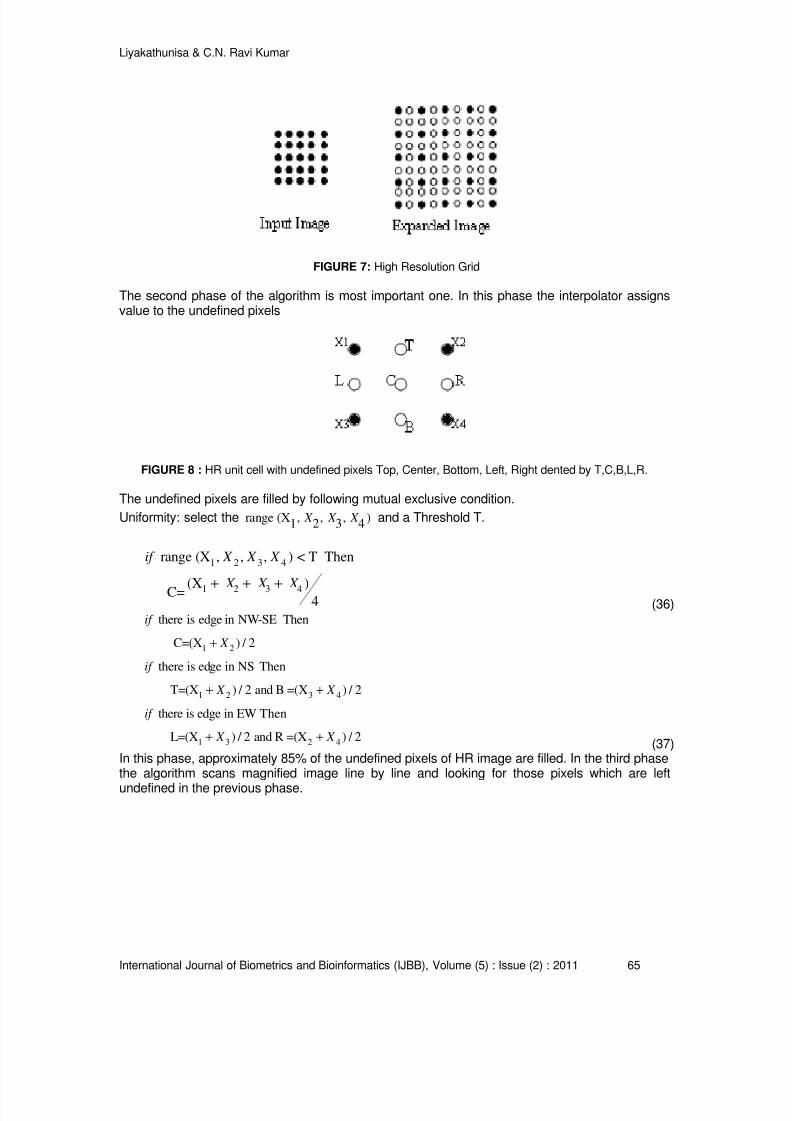
8/6/2019 International Journal of Biometrics and Bioinformatics IJBB_V5_I2
http://slidepdf.com/reader/full/international-journal-of-biometrics-and-bioinformatics-ijbbv5i2 45/133
Liyakathunisa & C.N. Ravi Kumar
International Journal of Biometrics and Bioinformatics (IJBB), Volume (5) : Issue (2) : 2011 65
FIGURE 7: High Resolution Grid
The second phase of the algorithm is most important one. In this phase the interpolator assignsvalue to the undefined pixels
FIGURE 8 : HR unit cell with undefined pixels Top, Center, Bottom, Left, Right dented by T,C,B,L,R.
The undefined pixels are filled by following mutual exclusive condition.
Uniformity: select the range (X , , , )1 2 3 4
X X X and a Threshold T.
1 2 3 4
1 2 3 4
range (X , , , ) < T Then
(X )C= 4
if X X X
X X X + + +(36)
1 2
1 2 3 4
there is edge in NW-SE Then
C=(X ) / 2
there is edge in NS Then
T=(X ) / 2 and B =(X ) / 2
there is edge in EW T
if
X
if
X X
if
+
+ +
1 3 2 4
hen
L=(X ) / 2 and R =(X ) / 2 X X + +(37)
In this phase, approximately 85% of the undefined pixels of HR image are filled. In the third phasethe algorithm scans magnified image line by line and looking for those pixels which are left
undefined in the previous phase.
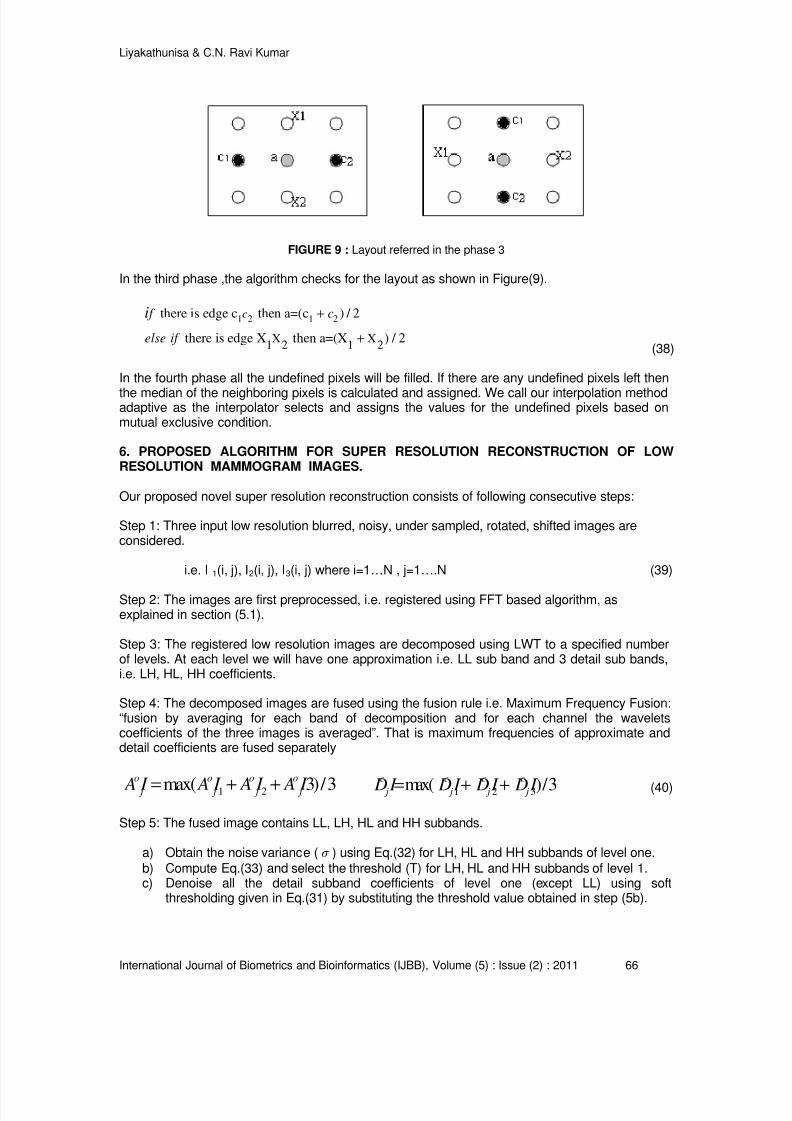
8/6/2019 International Journal of Biometrics and Bioinformatics IJBB_V5_I2
http://slidepdf.com/reader/full/international-journal-of-biometrics-and-bioinformatics-ijbbv5i2 46/133
8/6/2019 International Journal of Biometrics and Bioinformatics IJBB_V5_I2
http://slidepdf.com/reader/full/international-journal-of-biometrics-and-bioinformatics-ijbbv5i2 47/133
8/6/2019 International Journal of Biometrics and Bioinformatics IJBB_V5_I2
http://slidepdf.com/reader/full/international-journal-of-biometrics-and-bioinformatics-ijbbv5i2 48/133
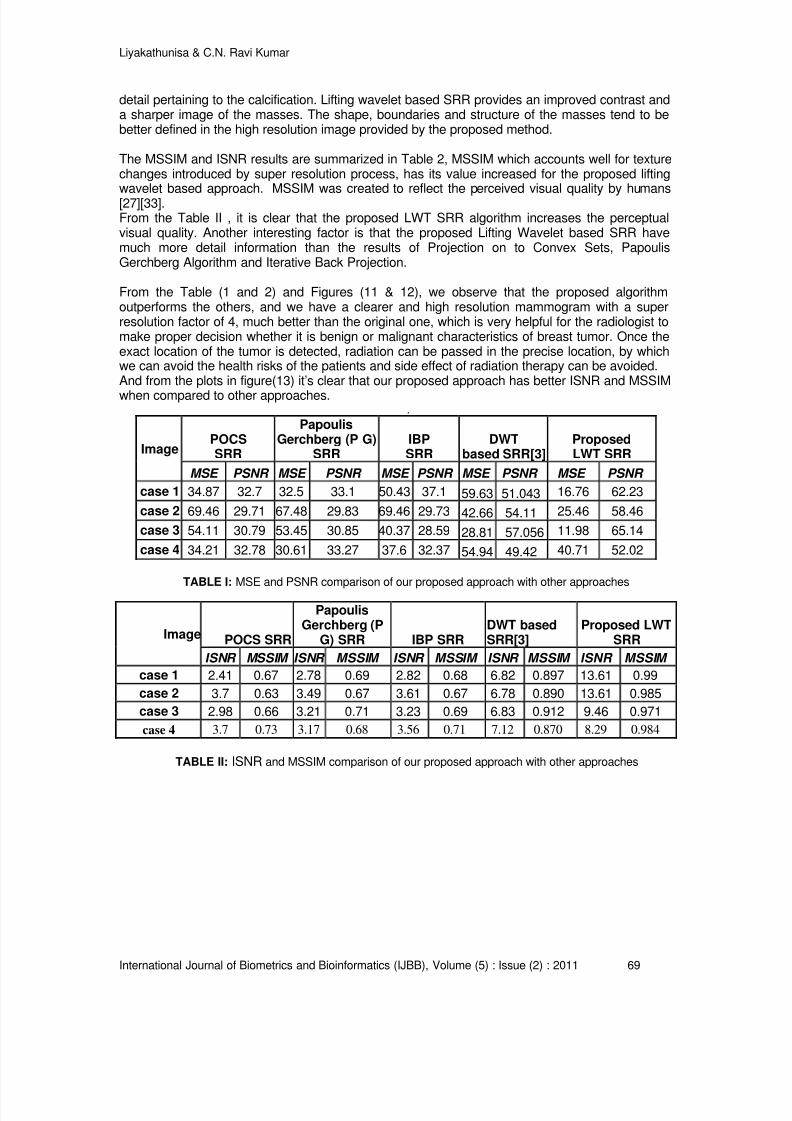
8/6/2019 International Journal of Biometrics and Bioinformatics IJBB_V5_I2
http://slidepdf.com/reader/full/international-journal-of-biometrics-and-bioinformatics-ijbbv5i2 49/133
Liyakathunisa & C.N. Ravi Kumar
International Journal of Biometrics and Bioinformatics (IJBB), Volume (5) : Issue (2) : 2011 69
detail pertaining to the calcification. Lifting wavelet based SRR provides an improved contrast anda sharper image of the masses. The shape, boundaries and structure of the masses tend to bebetter defined in the high resolution image provided by the proposed method.
The MSSIM and ISNR results are summarized in Table 2, MSSIM which accounts well for texturechanges introduced by super resolution process, has its value increased for the proposed liftingwavelet based approach. MSSIM was created to reflect the perceived visual quality by humans[27][33].From the Table II , it is clear that the proposed LWT SRR algorithm increases the perceptualvisual quality. Another interesting factor is that the proposed Lifting Wavelet based SRR havemuch more detail information than the results of Projection on to Convex Sets, PapoulisGerchberg Algorithm and Iterative Back Projection.
From the Table (1 and 2) and Figures (11 & 12), we observe that the proposed algorithmoutperforms the others, and we have a clearer and high resolution mammogram with a superresolution factor of 4, much better than the original one, which is very helpful for the radiologist tomake proper decision whether it is benign or malignant characteristics of breast tumor. Once theexact location of the tumor is detected, radiation can be passed in the precise location, by whichwe can avoid the health risks of the patients and side effect of radiation therapy can be avoided.And from the plots in figure(13) it’s clear that our proposed approach has better ISNR and MSSIM
when compared to other approaches..
ImagePOCSSRR
PapoulisGerchberg (P G)
SRRIBPSRR
DWTbased SRR[3]
ProposedLWT SRR
MSE PSNR MSE PSNR MSE PSNR MSE PSNR MSE PSNR
case 1 34.87 32.7 32.5 33.1 50.43 37.1 59.63 51.043 16.76 62.23
case 2 69.46 29.71 67.48 29.83 69.46 29.73 42.66 54.11 25.46 58.46
case 3 54.11 30.79 53.45 30.85 40.37 28.59 28.81 57.056 11.98 65.14
case 4 34.21 32.78 30.61 33.27 37.6 32.37 54.94 49.42 40.71 52.02
TABLE I: MSE and PSNR comparison of our proposed approach with other approaches
Image POCS SRR
PapoulisGerchberg (P
G) SRR IBP SRRDWT basedSRR[3]
Proposed LWTSRR
ISNR MSSIM ISNR MSSIM ISNR MSSIM ISNR MSSIM ISNR MSSIM
case 1 2.41 0.67 2.78 0.69 2.82 0.68 6.82 0.897 13.61 0.99
case 2 3.7 0.63 3.49 0.67 3.61 0.67 6.78 0.890 13.61 0.985
case 3 2.98 0.66 3.21 0.71 3.23 0.69 6.83 0.912 9.46 0.971
case 4 3.7 0.73 3.17 0.68 3.56 0.71 7.12 0.870 8.29 0.984
TABLE II: ISNR and MSSIM comparison of our proposed approach with other approaches
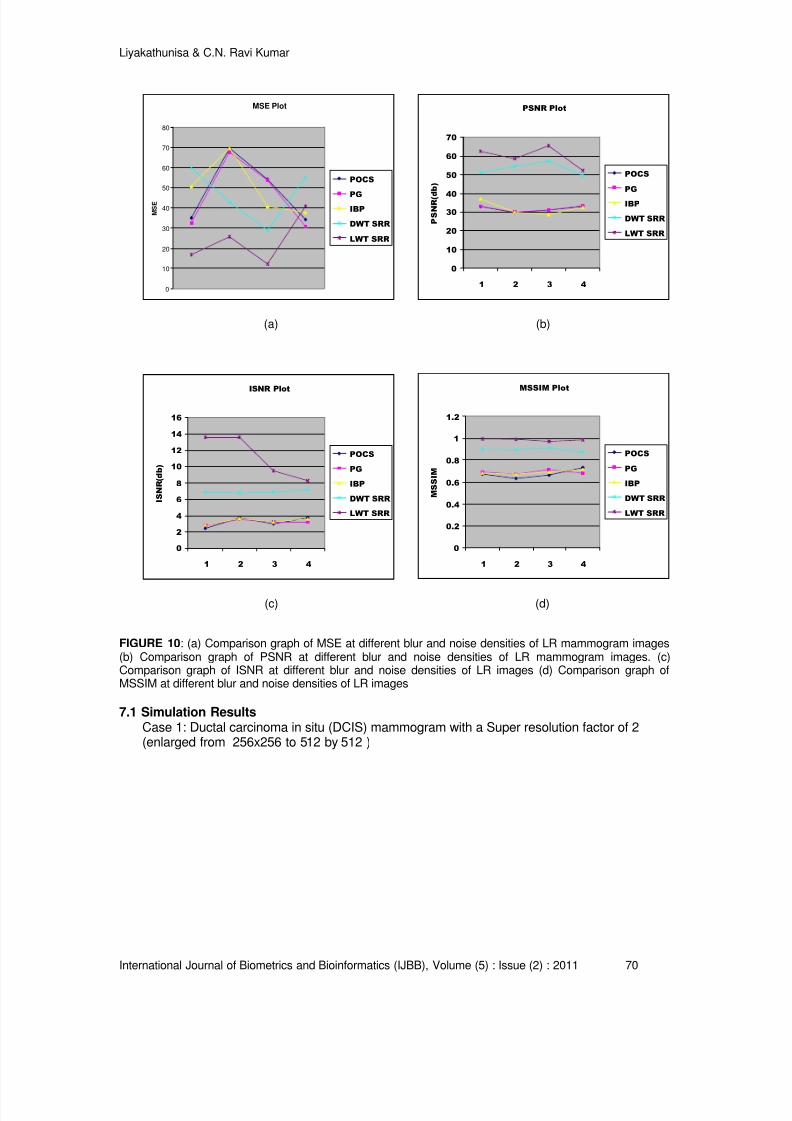
8/6/2019 International Journal of Biometrics and Bioinformatics IJBB_V5_I2
http://slidepdf.com/reader/full/international-journal-of-biometrics-and-bioinformatics-ijbbv5i2 50/133
Liyakathunisa & C.N. Ravi Kumar
International Journal of Biometrics and Bioinformatics (IJBB), Volume (5) : Issue (2) : 2011 70
MSE Plot
0
10
20
30
40
50
60
70
80
M S E
POCS
PG
IBP
DWT SRR
LWT SRR
PSNR Plot
0
10
20
30
40
50
60
70
1 2 3 4
P S N R ( d b )
POCS
PG
IBP
DWT SRR
LWT SRR
(a) (b)
ISNR Plot
0
2
4
6
8
10
12
14
16
1 2 3 4
I S N R ( d b )
POCS
PG
IBP
DWT SRR
LWT SRR
MSSIM Plot
0
0.2
0.4
0.6
0.8
1
1.2
1 2 3 4
M S S I M
POCS
PG
IBP
DWT SRR
LWT SRR
(c) (d)
FIGURE 10: (a) Comparison graph of MSE at different blur and noise densities of LR mammogram images(b) Comparison graph of PSNR at different blur and noise densities of LR mammogram images. (c)Comparison graph of ISNR at different blur and noise densities of LR images (d) Comparison graph ofMSSIM at different blur and noise densities of LR images
7.1 Simulation ResultsCase 1: Ductal carcinoma in situ (DCIS) mammogram with a Super resolution factor of 2(enlarged from 256x256 to 512 by 512 )
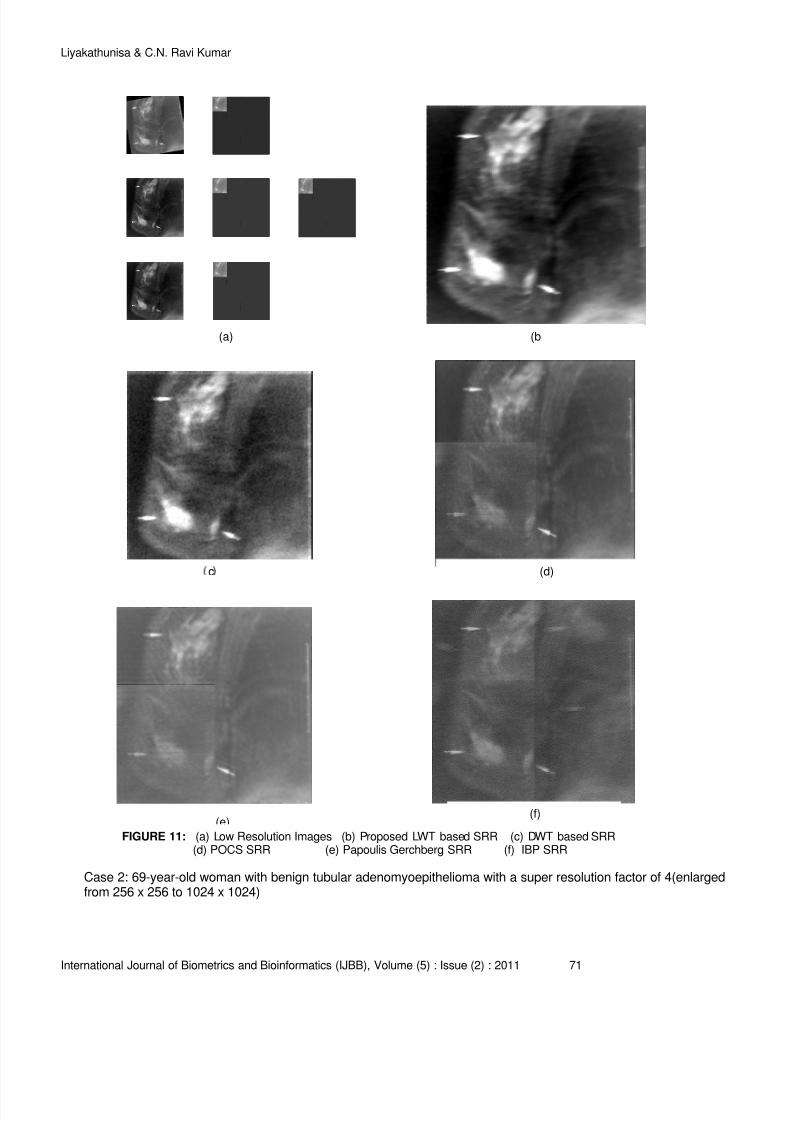
8/6/2019 International Journal of Biometrics and Bioinformatics IJBB_V5_I2
http://slidepdf.com/reader/full/international-journal-of-biometrics-and-bioinformatics-ijbbv5i2 51/133
Liyakathunisa & C.N. Ravi Kumar
International Journal of Biometrics and Bioinformatics (IJBB), Volume (5) : Issue (2) : 2011 71
Case 2: 69-year-old woman with benign tubular adenomyoepithelioma with a super resolution factor of 4(enlargedfrom 256 x 256 to 1024 x 1024)
(a) (b
(d)c
(f)(e)
FIGURE 11: (a) Low Resolution Images (b) Proposed LWT based SRR (c) DWT based SRR(d) POCS SRR (e) Papoulis Gerchberg SRR (f) IBP SRR
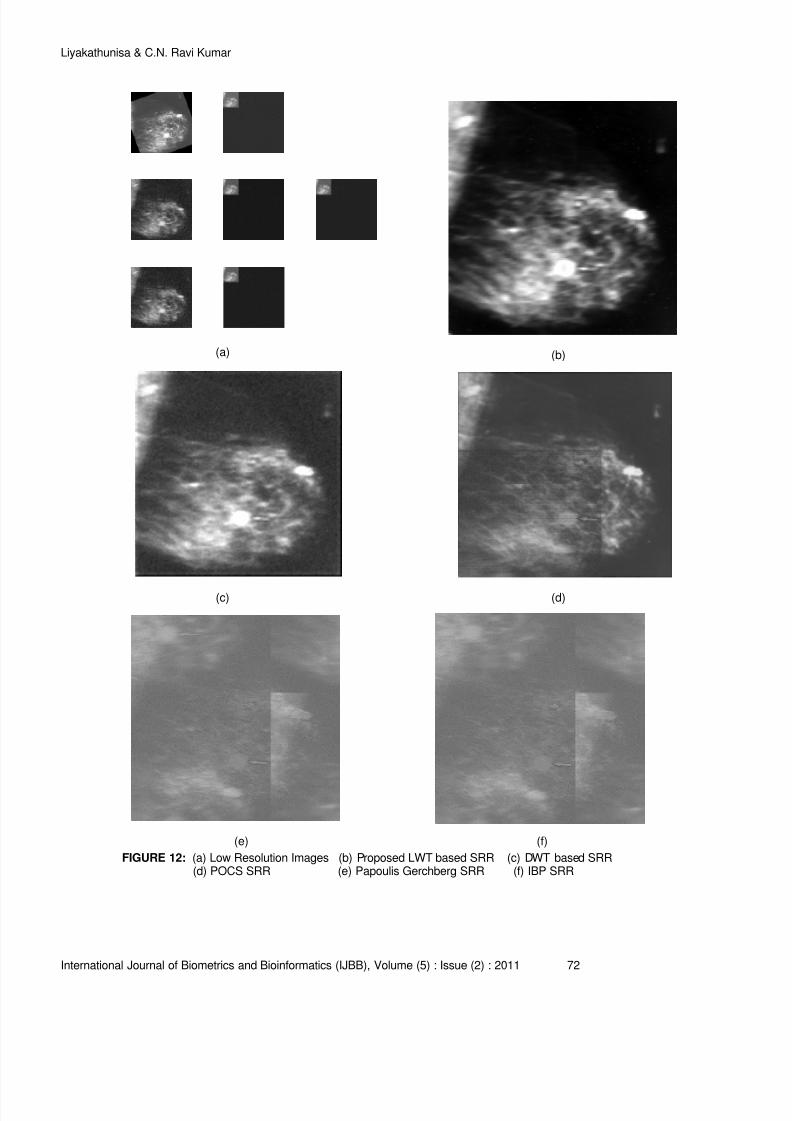
8/6/2019 International Journal of Biometrics and Bioinformatics IJBB_V5_I2
http://slidepdf.com/reader/full/international-journal-of-biometrics-and-bioinformatics-ijbbv5i2 52/133
Liyakathunisa & C.N. Ravi Kumar
International Journal of Biometrics and Bioinformatics (IJBB), Volume (5) : Issue (2) : 2011 72
(a) (b)
(d)(c)
(e) (f)
FIGURE 12: (a) Low Resolution Images (b) Proposed LWT based SRR (c) DWT based SRR(d) POCS SRR (e) Papoulis Gerchberg SRR (f) IBP SRR
8/6/2019 International Journal of Biometrics and Bioinformatics IJBB_V5_I2
http://slidepdf.com/reader/full/international-journal-of-biometrics-and-bioinformatics-ijbbv5i2 53/133
Liyakathunisa & C.N. Ravi Kumar
International Journal of Biometrics and Bioinformatics (IJBB), Volume (5) : Issue (2) : 2011 73
8. CONCLUSIONIn this paper we have proposed a novel and efficient lifting scheme based denoising for superresolution reconstruction of low resolution mammogram images. We have presented a new wayto improve the quality of x-ray mammography images without having to use more radiations,which increases health risks of patients. The results indicate that the proposed system canfacilitate the doctor to detect breast cancer in early stage of diagnosis process. Early detection
tests for breast cancer can save many thousands of lives, with super resolution reconstructionthe cancer can be diagnosed at an early stage and treated successfully. High resolution imagesgive better visibility of the breast, particularly near the skin line, chest wall and in women withdense breast tissues. As medical imaging moves towards complete digital imaging and producesprohibitively large amounts of data, compression is necessary for storage and communicationpurposes. Our method has the potential for storage and communication purposes. Our methodhas the potential to eliminate the need to store images at full resolution, since they could beregenerated them from low resolution ones. Experimental results show that the proposedalgorithm yields significantly superior image quality when it is compared to the other well knownalgorithms.
REFERENCES[1] Liyakathunisa and C.N.Ravi Kumar, “Advances in Super Resolution Reconstruction of Low
Resolution Images" International Journal of Computational Intelligence Research ISSN 0973-1873 Volume 6, Number 2 , pp. 215-236,2010.
[2] Liyakathunisa, C.N.Ravi Kumar and V.K. Ananthashayana , “Super ResolutionReconstruction of Low Resolution Images using Wavelet Lifting schemes" in Proc ICCEE'09,2nd International Conference on Electrical Computer Engineering", Dec 28-30TH 2009,Dubai, Indexed in IEEE Xplore.
[3] Liyakathunisa and C.N.Ravi Kumar, “A Novel and Robust Wavelet Based Super ResolutionReconstruction of Low Resolution Images Using Efficient Denoising and AdaptiveInterpolation”, in International Journal of Image Processing-IJIP, CSC Journals Publications,Issue 4, Vol 4, pp 401-420, 2010.
[4] R.Gaughan, “New approaches to early detection of breast cancer makes small gains”
,Biophotonics Int. , pp 48-53, 1998.
[5] Smith R.A., “Epidemiology of breast cancer categorical course in physics”, Tech. AspectsBreast Imaging, Radiol. Sco. N. Amer., pp 21-33, 1993.
[6] S. Shapiro, W. Venet, P.Strax, L.Venet, and R. Roester, ” Ten-to Fourteen year Effect ofscreening on breast cancer mortality”, JNCL, vol 69, pp 349, 1982.
[7] M. Irani and S. Peleg, “Improving resolution by image registration", CVGIP: Graphical Modelsand Image Proc., vol. 53, pp. 231-239, May 1991.
[8] R.Y. Tsai and T.S. Huang, “Multiple frame image restoration and registration”, in Advances inComputer Vision and Image Processing. Greenwich, CT: AI Press Inc., pp, 317-339.
[9] P. Vandewalle, S. Susstrunk, and M. Vetterli, Lcav, “A frequency domain approach toregistration of aliased images with application to Super resolution", EURASIP Journal onapplied signal processing pp 1-14, 2006.
[10] S. C. Park, M. K. Park, and M. G. Kang, “Super-resolution image reconstruction: A technicalreview”, IEEE Signal Processing Mag., vol. 20, pp. 21-36, May 2003.
[11] H. Greenspan, G. Oz, N. Kiryati, and S. Peled, “Super-resolution in mri,” in Proceedings ofIEEE International Symposium on Biomedical Imaging, pp. 943 -946, 2002.
8/6/2019 International Journal of Biometrics and Bioinformatics IJBB_V5_I2
http://slidepdf.com/reader/full/international-journal-of-biometrics-and-bioinformatics-ijbbv5i2 54/133
Liyakathunisa & C.N. Ravi Kumar
International Journal of Biometrics and Bioinformatics (IJBB), Volume (5) : Issue (2) : 2011 74
[12] J. A. Kennedy, O. Israel, A. Frenkel, R. Bar-Shalom, and H. Azhari, “Super-resolution in petimaging”, IEEE transactions on medical imaging, vol. 25, no. 2, pp. 137 - 147, February2006.
[13] J. T. Hsu1, C. C. Yen, C. C. Li, M. Sun, B. Tian, and M. Kaygusuz, “Application of wavelet-based pocs super resolution for cardiovascular mri image enhancement ”, in Proceedings ofthe Third International Conference on Image and Graphics (ICIG04), pp. 572-575, 2004.
[14] Alexander wong and Jacob Scharcanski, “ Phase -adaptive Super Resolution ofmammogram Images using complex wavelts ", 2009.
[15] Jun Zhang, olacFuentes and Ming-Yingleung, “Super resolution of Mammograms", 2010.
[16] A.Jensen, A.la Cour-Hardo, “Ripples in Mathematics” , Springer publications.
[17] Barbara ZItova, J.Flusser, “Image Registration: Survey”, Image and vision computing, 21,Elsevier publications, 2003.
[18] E.D. Castro, C. Morandi, “Registration of translated and rotated images using finite Fourier
transform” , IEEE Transactions on Pattern Analysis and Machine Intelligence 700–703,1987.
[19] Gonazalez Woods , “ Digital Image Processing”, 2nd
Edition.
[20] S. Grace Chang, Bin Yu and M. Vattereli, “Adaptive Wavelet Thresholding for Imagedenoising and compression”, IEEE Transaction, Image Processing, vol. 9, pp. 1532-15460.
[21] S.K.Mohiden, Perumal,Satik, “Image Denosing using DWT”, IJCSNS, Vol 8, No 1, 2008.
[22] D. Gnanadurai, V.Sadsivam, “An Efficient Adaptive Threshoding Technique for Wavaletbased Image Denosing” , IJSP, Vol 2, spring 2006.
[23] D.L.Donoho and I.M JohnStone, “Adapting to unknown smoothness via wavelet shrinkage “,
Journal of American Association, Vol 90,no, 432, pp1200-1224 .
[24] Huang, X.S., Chen, Z, “A Wavelet-Based Image Fusion Algorithm" , In Proceedings of theIEEE Region 10 Conference on Computers, Communications, Control and PowerEngineering (TENCON 2002), 602-605, Beijing 2002.
[25] T. Acharya, P.S. Tsai, “Image up-sampling using Discrete Wavelet Transform", inProceedings of the 7th International Conference on Computer Vision, Pattern Recognitionand Image Processing (CVPRIP).
[26] S. Grace Chang, Bin Yu and M. Vattereli, “Adaptive Wavelet Thresholding for Imagedenoising and compression", IEEE Transaction, Image Processing, vol. 9, pp. 1532-15460.
[27] Wang, Bovik, Sheikh, et al, “Image Quality Assessment: From Error Visibility to StructuralSimilarity”, IEEE Transactions of Image Processing, vol. 13, pp. 1-12, April 2004.
[28] S. Chaudhuri, Ed., “Super-Resolution Imaging”, Norwell, A: Kluwer, 2001.
[29] S.Susan Young, Ronal G.Diggers, Eddie L.Jacobs, “Signal Processing and performanceAnalysis for imaging Systems”, ARTEC HOUSE, INC , 2008.
[30] G.R.Ayer and J.C.Danity, “ Iterative Blind Deconvolution”, vol13, No 7, optics Letters, July1988.

8/6/2019 International Journal of Biometrics and Bioinformatics IJBB_V5_I2
http://slidepdf.com/reader/full/international-journal-of-biometrics-and-bioinformatics-ijbbv5i2 55/133
Liyakathunisa & C.N. Ravi Kumar
International Journal of Biometrics and Bioinformatics (IJBB), Volume (5) : Issue (2) : 2011 75
[31] G.K. Lemanur, Drocihe and J.Decoinck, “Highly Regular Wavelets for the Detection ofclustered Micro calcification in Mammograms”, IEEE Trans on Medical Imaging, VOl.22, No.3, March 2003.
[32] J.Kristin , McLoughlin, J.Philip , Bones, “Noise Equalization for Detection of Microcalcification Clusters in Direct Digital Mammogram Images”, IEE Trans on Medical Imaging,Vol 23, No 0 , March 2004.
[33] I. B´egin and F. P. Ferrie, “Comparison of super-resolution algorithms using image qualitymeasures,” in Proceedings of the 3rd Canadian conference on computer and robot vision.Washington, DC, USA: IEEE Computer Society, pp. 72, 2006.
[34] B. Girod, “What’s wrong with mean-squared error?” in Digital images and human vision, MITPress, Cambridge, MA. ISBN 0-262-23171-9, pp. 207–220, 1993.
8/6/2019 International Journal of Biometrics and Bioinformatics IJBB_V5_I2
http://slidepdf.com/reader/full/international-journal-of-biometrics-and-bioinformatics-ijbbv5i2 56/133
Raikoti Sharanabasappa1, Dr Sanjaypande M. B.
International Journal of Biometrics and Bioinformatics (IJBB), Volume (5) : Issue (2) : 2011 76
A Novel Biometric Technique Benchmark Analysis For SelectionOf Best Biometric Modality And Template Generation Method
Raikoti Sharanabasappa11 [email protected]
Research Scholar Dravidian University Kuppam, India
Dr Sanjaypande M. B.2 [email protected] Prof. and Head of Dept.VVIET Mysore, India
Abstract
A biometric security is a technique by means of which digital contents are protected by acryptographic key generated from the biometric features of a person like Retina, Iris, Fingerprint,Face, Voice and so on. Normally the digital contents like documents are protected by acryptographic key generated from a unique password. The process in irreversible, i.e the key can
be generated from the password but not the vice versa. Passwords are relatively easy to hack asmost of the users keep their personal information like date of birth as password and alsopassword length has a limit as human beings cannot remember a password of significantly largelength. Hence guessing the password of a user, whose significant information is available, iseasier. Therefore off late lot of emphasis has been given to biometric features. Biometric featuresof no two people are same. For example the finger prints or the face of any two people differ.Hence if a template (alphanumeric or binary representation of features from a biometric data) isselected for the key generation than cracking them for accessing information becomessignificantly difficult. But as with every advantage comes certain limitations also. The keys are nottime invariant. Templates tends to change based on the data acquisition, or with time. Forexample the finger prints or palm prints changes with ages. Iris, retina and face features changeswith change in light intensity during the acquisition phase. Fingerprint features changes withchange in the orientation of the finger while scanning. In a classic authentication problem, such
variability’s can be easily dealt with by keeping a threshold for the acceptance of the features.Such acceptance threshold is not applicable for the case of biometric templates. Even slightest ofthe variability in the templates changes the generated key, therefore causing a high falserejection rate. Hence in this work we analyze the most accepted biometric features andtechniques for key generation and propose the most invariable technique in terms of dataacquisition invariability. The work analyzes Iris, Face, Fingerprint and Palm prints for analysis ofthe biometric template generation and key generation form the templates. Further a uniquebenchmark analysis technique is proposed for quantifying the quality of a biometric model orfeatures.
Keywords: Template Quality Analysis, Biometric Security, Biometric Key Invariability.
1. INTRODUCTION 1.1 Public Key CryptographyIt is a means of exchanging digital data securely over a network or internet. If a peer wants tosend a document to other peer by encrypting it, then the peers first exchange their secured keys.A key is unique number generated randomly using a key generation function with the help of a setof alphanumeric string and users identity (like user name). Hence the key is unique to each user.While peer A wants to send information to B, it encrypts the document with the public key of B.While decrypting, B needs to decrypt the document with its private key. Now even if there is aneavesdropping while the public keys are exchanged and unauthenticated user acquires the
8/6/2019 International Journal of Biometrics and Bioinformatics IJBB_V5_I2
http://slidepdf.com/reader/full/international-journal-of-biometrics-and-bioinformatics-ijbbv5i2 57/133
Raikoti Sharanabasappa1, Dr Sanjaypande M. B.
International Journal of Biometrics and Bioinformatics (IJBB), Volume (5) : Issue (2) : 2011 77
public key of B, any encrypted document transmitted from A to B will not be decrypted by theunauthenticated entity because it is unaware of the private key of B. Now if the same entity had todecrypt the document successfully, it has to “guess” the private key of B. It requires a reverseengineering by means of which the unauthenticated entity first tracks the function through whichthis key might have been generated and then uses a trial and error method to guess the key. Adecade ago, this technique was quite full proof because the amount of time required by anycomputer to guess the key through trial and error method or as commonly known brute forcemethod would be significantly high and extend to weeks and months. But Over the period of timethe processing capabilities of the computers are being increased by many a folds. Therefore therandom guessing of the keys has become less time consuming and hackers are able to crackmost sophisticated keys even with the help of a simple personal computer and without the aid ofany super computer. Hence there was a need to come up with techniques which offers morerandomness than the unique string which used to be use as a key generation base. Hencebiometric templates got an edge and attention for public key cryptography over last decade or so.
1.2 Biometric TemplatesFor generating the key it is essential to select a password as discussed in the previous section. A
password is a typical and known combination of numerals and characters that user canremember. Now every user has a limitation of remembering the length of the password. Hencenumber of permutations is finite even though it is huge. Whenever possible combinations of the
key are finite the probability of generating the key from random combination is non zero.Considering that there are ten digits and twenty six characters (English alphabet) and that thepassword is of length ten, then total possible combinations are
35P10 .
Now let us consider that number of possible symbol is S and the length of the password is D thenpossible combination C is depicted as
C=SPD (1)
Hence the randomness of the key can be increased by increasing the both S and D. Number ofcharacters are fixed and is a set of maximum 256( as used by modern computer systems). Still itdoes not guarantee an infinite set. Instead of the symbols if real number sets are used as thebase for generating the key than S becomes a set of all real numbers and can be claimedcomputationally infinite. Hence even a fixed length of D ensures a virtually untraceable key. It isalmost impossible for human beings to remember large set of real numbers. Therefore a simplesolution to the problem is to generate this number each and every time from the identity of the
user, for instance face or fingerprint or palm print or voice or retina and so on. These identitiesare called biometric identities. The identity is scanned to a digital format and features areextracted from the pattern. These features are unique and are commonly known as biometrictemplates. A common technique for using these templates is to store them either centrally in aserver or locally in the form of a smart card.
Hence a biometric template is a finite length set of either real numbers or symbols representingthe unique identity of a person and can be used to generate unique key for public keycryptography [1].
Hence it can be said that biometric templates are set of measurable features which can be eitherused for public key cryptography or authenticating the person.
1.3 Problem formationThe biometrics features must be selected in such a way that it produces a unique and finite setfor the user identity [2].The overall process of data security can be elaborated in figure 1.
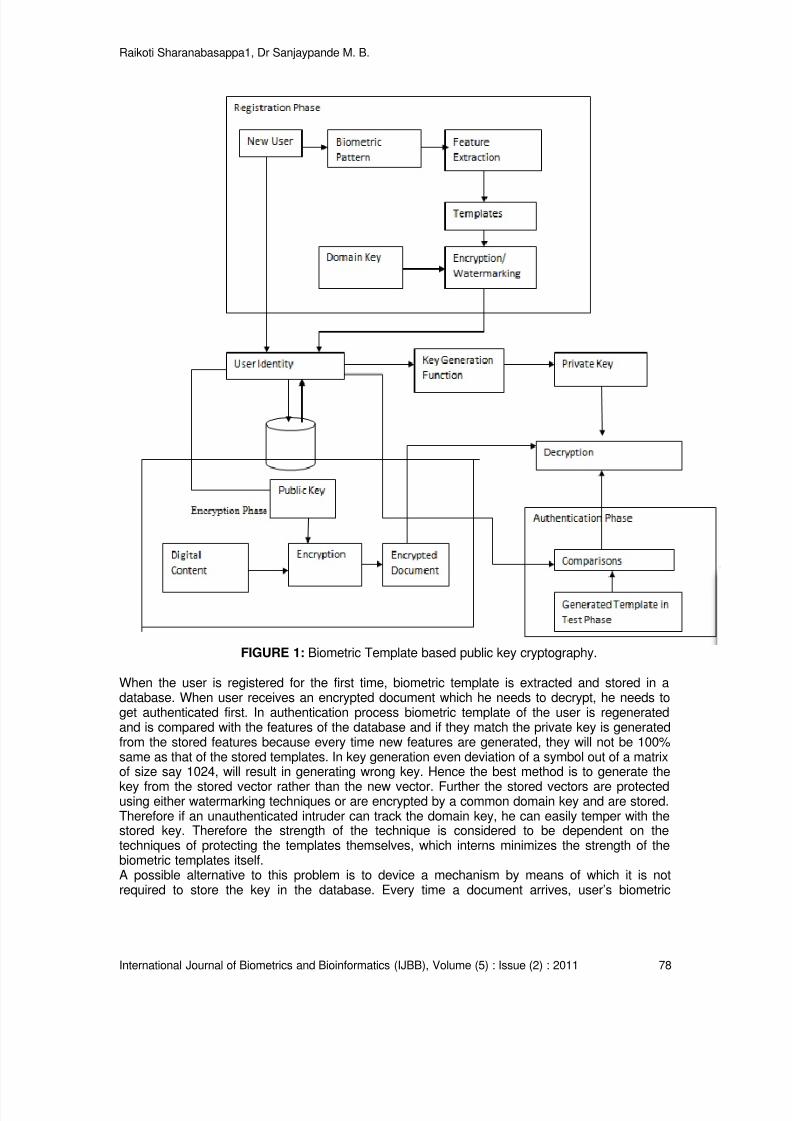
8/6/2019 International Journal of Biometrics and Bioinformatics IJBB_V5_I2
http://slidepdf.com/reader/full/international-journal-of-biometrics-and-bioinformatics-ijbbv5i2 58/133
Raikoti Sharanabasappa1, Dr Sanjaypande M. B.
International Journal of Biometrics and Bioinformatics (IJBB), Volume (5) : Issue (2) : 2011 78
FIGURE 1: Biometric Template based public key cryptography.
When the user is registered for the first time, biometric template is extracted and stored in adatabase. When user receives an encrypted document which he needs to decrypt, he needs toget authenticated first. In authentication process biometric template of the user is regeneratedand is compared with the features of the database and if they match the private key is generatedfrom the stored features because every time new features are generated, they will not be 100%same as that of the stored templates. In key generation even deviation of a symbol out of a matrixof size say 1024, will result in generating wrong key. Hence the best method is to generate the
key from the stored vector rather than the new vector. Further the stored vectors are protectedusing either watermarking techniques or are encrypted by a common domain key and are stored.Therefore if an unauthenticated intruder can track the domain key, he can easily temper with thestored key. Therefore the strength of the technique is considered to be dependent on thetechniques of protecting the templates themselves, which interns minimizes the strength of thebiometric templates itself.A possible alternative to this problem is to device a mechanism by means of which it is notrequired to store the key in the database. Every time a document arrives, user’s biometric
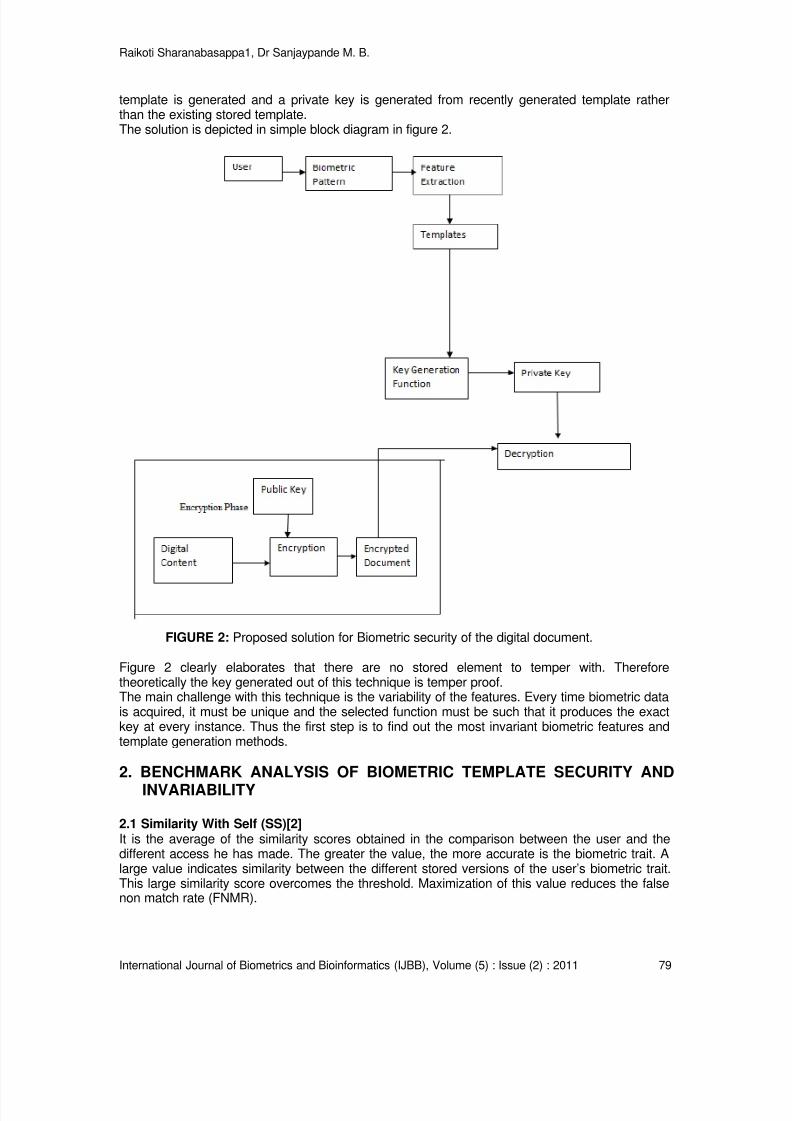
8/6/2019 International Journal of Biometrics and Bioinformatics IJBB_V5_I2
http://slidepdf.com/reader/full/international-journal-of-biometrics-and-bioinformatics-ijbbv5i2 59/133
Raikoti Sharanabasappa1, Dr Sanjaypande M. B.
International Journal of Biometrics and Bioinformatics (IJBB), Volume (5) : Issue (2) : 2011 79
template is generated and a private key is generated from recently generated template ratherthan the existing stored template.The solution is depicted in simple block diagram in figure 2.
FIGURE 2: Proposed solution for Biometric security of the digital document.
Figure 2 clearly elaborates that there are no stored element to temper with. Thereforetheoretically the key generated out of this technique is temper proof.The main challenge with this technique is the variability of the features. Every time biometric datais acquired, it must be unique and the selected function must be such that it produces the exactkey at every instance. Thus the first step is to find out the most invariant biometric features andtemplate generation methods.
2. BENCHMARK ANALYSIS OF BIOMETRIC TEMPLATE SECURITY AND
INVARIABILITY
2.1 Similarity With Self (SS)[2]It is the average of the similarity scores obtained in the comparison between the user and thedifferent access he has made. The greater the value, the more accurate is the biometric trait. Alarge value indicates similarity between the different stored versions of the user’s biometric trait.This large similarity score overcomes the threshold. Maximization of this value reduces the falsenon match rate (FNMR).
8/6/2019 International Journal of Biometrics and Bioinformatics IJBB_V5_I2
http://slidepdf.com/reader/full/international-journal-of-biometrics-and-bioinformatics-ijbbv5i2 60/133
8/6/2019 International Journal of Biometrics and Bioinformatics IJBB_V5_I2
http://slidepdf.com/reader/full/international-journal-of-biometrics-and-bioinformatics-ijbbv5i2 61/133
8/6/2019 International Journal of Biometrics and Bioinformatics IJBB_V5_I2
http://slidepdf.com/reader/full/international-journal-of-biometrics-and-bioinformatics-ijbbv5i2 62/133
Raikoti Sharanabasappa1, Dr Sanjaypande M. B.
International Journal of Biometrics and Bioinformatics (IJBB), Volume (5) : Issue (2) : 2011 82
where ( , ) p v w is the probability density of the feature vectors given class w , ( ) p w is the
probability density of the class , and ( ) p v is the prior probability density of the feature vectors.
The feature vector is accepted as member of the template class if its posterior probability density
exceeds a threshold max[0, ]t t ∈ .
Thus it is important to define the rejection mechanism of a pattern along with its acceptancecriteria.It is known [l0] that the optimum rule is to reject the pattern if the maximum of the a posterioriprobabilities is less than some threshold. More explicitly, the optimum recognition rule is given as
( | ) 1k d vδ = ( 0)k ≠
i.e., to accept the pattern v for recognition and to identify it as of the kth
pattern class whenever
( | ) ( | )k i p F v k p F v j≥ for all j=1,2,…,n (8)
And
1
( | ) (1 ) ( | )n
k i
i
p F v k t p F v i
=
≥ − ∑ … (9)
To reject a pattern
1
max[ ( | )] (1 ) ( | )n
i ii
i
p F v i t p F v i=
< − ∑ … (10)
where v is the pattern vector, n is the number of classes, 1 2( , ,..., )
n p p p is the a priori
probability distribution of the classes, ( | )F v i is the conditional probability density for v given the
ith
class, ( ! 0)id i = is the decision that v is identified as of the ith
class while d , is the decision to
reject, and t is a constant between 0 and 1 (0 1)t ≤ ≤ .
2.4.3 Quantization Error and Log Likelihood Ratio[4]There bound be the difference amongst the templates generated from one instance to anotherinstance. Therefore under no way practically invariable templates can be generated. In order tominimize this variability, a quantization based technique is adopted by different works. Accordingto this system, rather than using the values generated from the templates to generate the key, thetemplate values can be quantized to set of values.In a one-dimensional feature space V the likelihood ratio of user is defined as:
0
( , , )
( , , )o
G v L
G v
ω ω ω
µ σ
µ σ = …(11)
Where the numerator defined the background probability density function and the denominatordefines the actual probability density function of a user.In simple terms, The generated pattern from the biometric features are Quantized to their nearestvalues and the likihood probability defines the fraction of probability of the quantized set to theprobability distribution function of the actual set.
2.4.4 Normalized Hamming DistanceThe formulated templates are converted into zeros and ones and are matched and similarityscores are calculated. Bit-wise comparison of the templates is made and Hamming distance iscalculated for every such comparison. This is achieved by doing successive bit wise “X-OR”ingand “AND”ing. To account for the rotational inconsistencies the maximum matched value ischosen. The mask templates are used to ignore the noisy parts of the image. The formula forfinding out the hamming distance is given as
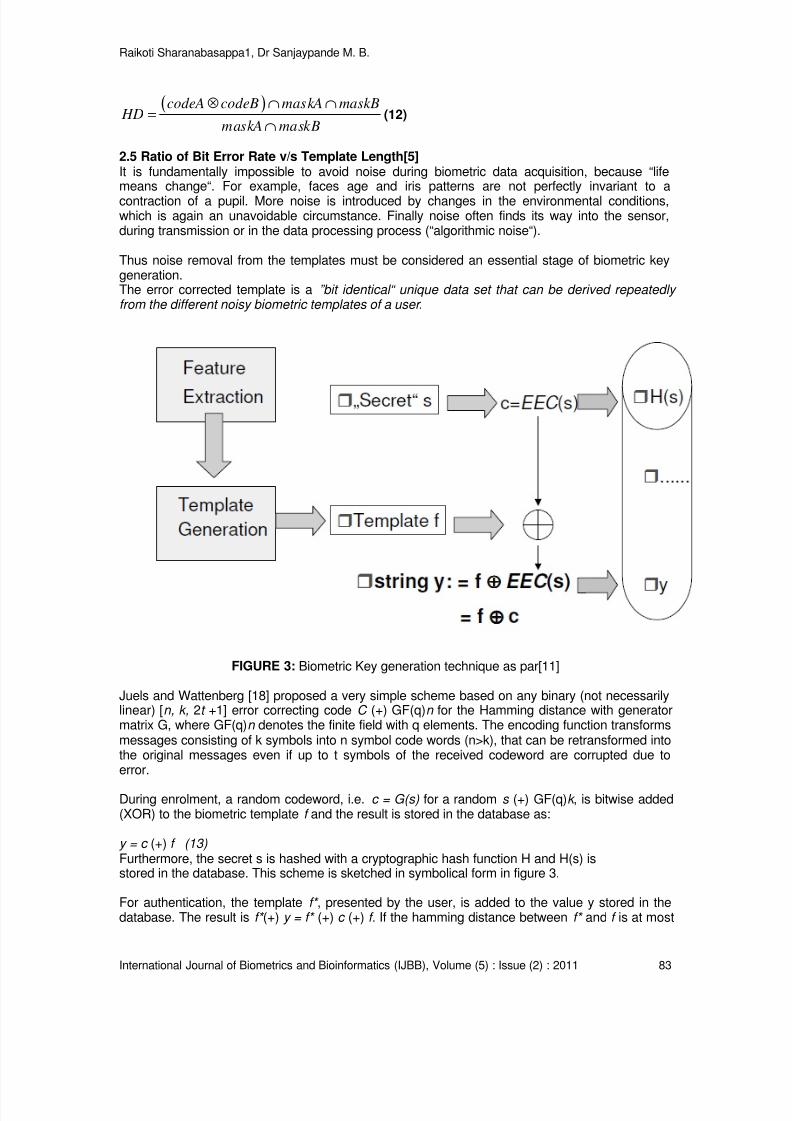
8/6/2019 International Journal of Biometrics and Bioinformatics IJBB_V5_I2
http://slidepdf.com/reader/full/international-journal-of-biometrics-and-bioinformatics-ijbbv5i2 63/133
Raikoti Sharanabasappa1, Dr Sanjaypande M. B.
International Journal of Biometrics and Bioinformatics (IJBB), Volume (5) : Issue (2) : 2011 83
( )codeA codeB maskA maskB HD
maskA maskB
⊗ ∩ ∩=
∩(12)
2.5 Ratio of Bit Error Rate v/s Template Length[5]It is fundamentally impossible to avoid noise during biometric data acquisition, because “lifemeans change“. For example, faces age and iris patterns are not perfectly invariant to acontraction of a pupil. More noise is introduced by changes in the environmental conditions,which is again an unavoidable circumstance. Finally noise often finds its way into the sensor,during transmission or in the data processing process (“algorithmic noise“).
Thus noise removal from the templates must be considered an essential stage of biometric keygeneration.The error corrected template is a ”bit identical“ unique data set that can be derived repeatedly from the different noisy biometric templates of a user .
FIGURE 3: Biometric Key generation technique as par[11]
Juels and Wattenberg [18] proposed a very simple scheme based on any binary (not necessarilylinear) [n, k, 2t +1] error correcting code C (+) GF(q)n for the Hamming distance with generatormatrix G, where GF(q)n denotes the finite field with q elements. The encoding function transformsmessages consisting of k symbols into n symbol code words (n>k), that can be retransformed intothe original messages even if up to t symbols of the received codeword are corrupted due toerror.
During enrolment, a random codeword, i.e. c = G(s) for a random s (+) GF(q)k , is bitwise added(XOR) to the biometric template f and the result is stored in the database as:
y = c (+) f (13)Furthermore, the secret s is hashed with a cryptographic hash function H and H(s) isstored in the database. This scheme is sketched in symbolical form in figure 3.
For authentication, the template f* , presented by the user, is added to the value y stored in thedatabase. The result is f* (+) y = f* (+) c (+) f. If the hamming distance between f* and f is at most
8/6/2019 International Journal of Biometrics and Bioinformatics IJBB_V5_I2
http://slidepdf.com/reader/full/international-journal-of-biometrics-and-bioinformatics-ijbbv5i2 64/133
Raikoti Sharanabasappa1, Dr Sanjaypande M. B.
International Journal of Biometrics and Bioinformatics (IJBB), Volume (5) : Issue (2) : 2011 84
t, c = G(s) and hence s can be recovered. If the hash value of the recovered s matches the onestored in the database, the user is authenticated. This approach extracts a secret key from thebiometric template presented and the corresponding public string. No information about this keyshall be extractable from the public string without the corresponding biometric template.
Thus an error correction code must be device from the template and needs to be stored in adatabase. This code does not reveal any information about generating the template, rather canchange the generated template such that the error with corresponding to the actual template fromwhich the error correction code is derived is zero.Thus we measure the bit error rate ratio as bit wise difference between the actual template andthe generated template when the templates are converted into a binary bit stream. We adopt localbinary patter generation technique for achieving the same.
2.6 Related Work[1] Elaborates the various techniques for biometric data security by proposing a matchingenvironment based on smart cards. It also elaborates the mechanism of generating a hash fromthe fingerprint biometric data and encrypting data through this hash.
Authors in [2] deal with the variability in the biometric templates. According to the finding of theauthor, every matching for authentication must also measure the quality of the just generated
template and periodically must update the template in order to maintain high accuracy inbiometric authentication process. The paper also presents matrices for biometric template qualityanalysis which is used in the proposed benchmark analysis work.
Authors in [3] elaborate the main problem with the conventional password based securitytechniques and emphasizes on the facts as to why the biometric keys are better thanconventional keys. The work defines the technical steps associated with the keys and alsodiscusses the properties of good biometric keys.
For biometric key generation from biometric features like faces and fingerprints, first imagespecific features must be extracted which is called templates. A quantization is applied on thetemplate to generate the key. As real number range is infinity, if a key is generated withoutquantization, matching becomes a difficult process. Hence authors in [4] elaborate the
mechanism for the quantization process for key generation. They also suggest a log likelyhoodbased technique for the same.
Even though biometric keys are strong technique for cryptographic key generation, because theyare stored in the database, there remains a chance for the keys to be eavesdropped byunauthenticated users which makes the system vulnerable. Therefore techniques must also beadopted for such key generation. Hence authors in [5] proposes the techniques for securing thebiometric key itself.
[6] proposes an Iris recognition technique with the help of bio orthogonal wavelets. But mostimportantly the authors in [6] proposes an encoding technique for the templates for ease inmatching.
The strength of a biometric key is defined from the inability of a propoer guessing of a key usingbrute force technique. A biometric key appears random to any intruder. Therefore how heguesses the key depends upon the entropy information of a random variable that generates thekey. [7] defines a mathematical relationship of probability of successful guess of a key with theentropy information of the templates and hence quantifies the fact that entropy analysis of anytemplate is an important step in deciding the strength of the key.
The closeness of a template with the stored template depends upon the distance between thetemplates. This distance can be represented in various mathematical forms as proposed by the
8/6/2019 International Journal of Biometrics and Bioinformatics IJBB_V5_I2
http://slidepdf.com/reader/full/international-journal-of-biometrics-and-bioinformatics-ijbbv5i2 65/133
Raikoti Sharanabasappa1, Dr Sanjaypande M. B.
International Journal of Biometrics and Bioinformatics (IJBB), Volume (5) : Issue (2) : 2011 85
authors of [8]. The authors also proves experimentally that log likelyhood measure is one of thebetter way of representing the closeness of two templates.
Whenever a mechanism is selected for biometric template matching for authenticating purpose, itinvariably presents a false rejection and false acceptance on the biometric data and themechanism itself. The authors in [9] presents a unique way to select the appropriate tradeoffbetween the rejection and acceptance tradeoff so that the adopted technique is acceptable andefficient. The author also presents a benchmark analysis for optimality for any recognitiontechnique in [10] and illustrate the proposed theory with the help of character recognition system.Gabor based techniques are widely adopted for biometric feature representation or generation oftemplates. But the size of such initial vectors is so high that it presents a practical problem ofstorage. Thus biometric template reduction becomes an important aspect for biometric keygeneration or authentication technique. [12] presents a technique for minimizing the number offeature vectors for template generation.
Out of all the possible attacks on biometric keys the most severe attack is on the stored keys.This findings of [13] forms a base for our assumption that if a system can be deviced without thenecessatiy for the key to be saved, a biometric system can be made un-attackable. Even thoughthe authors present multi biometric model for hardening the security of a biometric system, thesystem still remains vulnerable against the attacks.
For any biometric like face or fingerprints or iris, templates will differ from one instance to theother instance of acquisition. Therefore out of N number of aquistion of the templates of a singlefeature type of a person there would certainly exist a variability amongst the templates. Thereforeauthors in [14] presents a systematic way of extracting the best template out of all the templates.This paper also presents an important step for biometric feature benchmark analysis byproposing a clustering technique for seggegating the biometric features by their average distancemeasures.
As against most widely used gabor convolve methods, authors in [15] proves that biorthogonalwavelets achieve higher accuracy with low FAR and high FRR. Thus Biorthogonal wavelet basedtemplate generation is selected as one of the methods for testing the quality of a biometrictemplate for experiments in this paper.
[16] classifies the type of attack on the stored biometric systems and proposes a uniquemechanism for minimizing the risk emerging from such attack. But the authors presents animportant finding that encrypting the biometric keys or appending more security layer forprotecting the biometric data leads to more complicated processing in the recognition phasewhich delays the overall time for recognition. This findings also strengthens the need for a systemwhich can empirically analyze the quality of a biometric system before adopting it.
[17] presents a technique to remove the need of a centralize storage for biometric data with thehelp of smart cards. But the authors also emphesis that even such a card based system cannotguarantee a perfect un attackable system as the user information can be eavesdropped from thecard itself.
[18] discusses various techniques by means of which the biometric data itself ( not the templates)can be acquired , forged and can be used. It also presents a wide verity of attacks and describesat which instance and which data sets the attacks can affect.
In [19] authors describes a technique for generation of digital signature from biometric template.Such signatures can be used in public key cryptography for encryption and decryption of digitaldocuments shared across a network.
[20] analyzes the technique proposed by [11] to rectify the errors in generated template by usingReed Solmon code. The authors also proposes a unique mechanism for protection of biometric
8/6/2019 International Journal of Biometrics and Bioinformatics IJBB_V5_I2
http://slidepdf.com/reader/full/international-journal-of-biometrics-and-bioinformatics-ijbbv5i2 66/133
Raikoti Sharanabasappa1, Dr Sanjaypande M. B.
International Journal of Biometrics and Bioinformatics (IJBB), Volume (5) : Issue (2) : 2011 86
key by storing the checksum rather than the key in the database. The authors also show that akey generation from biometric template and subsequent correction using the checksum improvesthe system security to a great deal. This work has adopted the elaborated model for errorcorrection in biometric template.
In [21] authors have used irreversibility and revocability of the templates as a measurement forbiometric key security and shows the technique of biometric matching in the securedenvironment. The authors present another significant observation here interms of featureselection. [21] finds that lower order features like means and standard deviation can not revealthe actual information of any feature set and higher order spectra is better suited for therepresentation of the features. Hence in our benchmark analysis, we have used a higher orderspectra for determining the closeness of the templates.
[22] proposes an alternative method for biometric security through intronization. It is a process ofadding extra feature systematically in the biometric template to increase the randomness of thetemplate and also demonstrates that even after intronization, the achieved results aresatisfactory.
[23] discusses one of the most least talked possible attacks on the biometric templates. Theauthor here finds out a technique through which the image itself can be interpolated or
reconstructed from leaked template. Therefore this image can be subsequently used to obtain unauthorized information through hill climbing attack. Thus the findings demonstrates that not onlythe randomness of the templates are enough to provide security to the biometric system but atthe same time it is also important to ensure that the inverse process of reconstruction of imagesshould not be possible from the templates.
[24] elaborates a new technique called biometric template transformation be menas of whichdirect mathematical transformation can be achieved on the templates to extract more informationfrom the templates. This important transformation is the answare for the following severeproblem. Whenever a biometric key is encrypted, it can not be used for direct matching at thetime of verification. The key needs to be decrypted before matching which invariably exposes thekey. But with the help of direct transformation on the biometric templates, key matching can beperformed over the encrypted keys, minimizing the requirement for a decryption stage prior to
verification.
In [25] authors proves that presence of noise in the biometric data actually improves the securityof the data itself. This claim is supported through entropy analysis of the generated key from thetemplate and the relationship of energy and the entropy of the information.
[26] discusses various mathematical transformation related to guessing of a biometric key andpresents a fish-bone model for categorization of the attacks on biometric data. The model helps inidentifying various areas which must be considered for ensuring the security of biometric data.
[27] proposes a mechanism for mixing a biometric template with biometric key for biometric keyprotection.
[28] discusses about possible technique for face biometric and is used for selection of thetechniques for the current work.
Merely ensuring a strong key generation technique is not sufficient for biometric techniqueadaptation. It must be checked for the feasibility of adaptation. [29] presents various means offeasibility check for biometric techniques.
[30] proposes an indexing scheme through binning to index the biometric images in a largedatabase into groups for better classification and representation.

8/6/2019 International Journal of Biometrics and Bioinformatics IJBB_V5_I2
http://slidepdf.com/reader/full/international-journal-of-biometrics-and-bioinformatics-ijbbv5i2 67/133
Raikoti Sharanabasappa1, Dr Sanjaypande M. B.
International Journal of Biometrics and Bioinformatics (IJBB), Volume (5) : Issue (2) : 2011 87
Authors in [31] discusses a unique technique for secured biometric mechanism by introduction ofN-template system. The authors clasim and proves that if more than one template is generatedfrom the same biometric feature like iris and a similarity measurement function can be deviced tofind the similarity between the templates than, the empirical value of similarity can be used toauthenticating the users rather than the template itself.
The method of selecting best templates or function that generates best templates are alwaysresult driven tests. Thus it is quite difficult to select the best templates out of available templates.[32] accesses this problem partially and presents a score based mechanism for templateselection. In this work, the prototype of [32] is extended for selecting not only the best templatesbut for selecting the mechanism itself which can generate most acceptable templates.
[33] discusses various non technical issues alongside the technical issues for acception abiometric access control technique.
Improving the biometric recognition with 0% FAR and 0% FRR is considered to be idealtheoretical biometric system which is not yet achieved. Authors in [34] observe that most widelyused technique for enhancing the security of a biometric system is through combining more thanone modality like combining face and iris. But this needs the user to expose his features twicebefore two different sensors. Instead [34] proposes a mechanism to extract two different types of
features from the same modality to enhance the recognition efficiency.
3. ALGORITHMIC APPROCH FOR BIOMETRIC TEMPLATE QUALITYBENCHMARK ANALYSIS
For analysis the quality of a specific biometric type and the template generated from the specificfeature set of the template for time invariance analysis must be carried out with the followingModeli) First select d different type of biometric features like face, fingerprint, iris, Retina, Palm Printetc. We define D={Face,Iris,Fingerprint}---(14) as a set of different biometric types.ii) U is a finite set of N users.
{ }1 2
, , ...,u
U u u uN = (15)
iii) Select feature selection method for each type of D and let us consider that the feature
selection set is F
{ }1 2 1 2 3 1 2, ,..., , , , ,..., , , ,...
nc ni npF C C C I I I I P P P= (16)
Where I,C,P represents feature selection methods for Iris, Face and Fingerprints respectively.iv) Let T be a set of all the templates generated from all the feature selection technique from (14)with all the feature generation methods from (16) for all the users from (15).
{ }1 2 3 int, , ,...,i i i iT T T T T = (17)
Where nt is total number of templates and are given by
x x xnt nu ni np nc= (18) and i is used to denote independent users.
{ }iT T = where i=1,2,….nu (19)
8/6/2019 International Journal of Biometrics and Bioinformatics IJBB_V5_I2
http://slidepdf.com/reader/full/international-journal-of-biometrics-and-bioinformatics-ijbbv5i2 68/133
Raikoti Sharanabasappa1, Dr Sanjaypande M. B.
International Journal of Biometrics and Bioinformatics (IJBB), Volume (5) : Issue (2) : 2011 88
Now let us consider that templates of separate instances of the same users are taken over the
time and is represented by j.
Then (19) is redefined as
{ }ijT T = (20) where j=1,2,3….t where t is the maximum number of instances.
The objective is to find best F for which
( 1)ij i jT EQT −
( 1) ( 2)i j i jT EQT − −
( ) ( 1) for alli j t i j t T EQT i− − −
(21)
(21) must also satisfy the constraints low SO and high SS as par equation (2) and (3).
Equal operator EQis defined as the set of distance measurement techniques.
{ }1 2 3, , ,...,m
EQ D D D D= (22)
Where m are different types of distance measurement.
From (18) it is clear that as number of users increases, total number of analysis step alsoincreases. Therefore rather than checking for (21) after generating all the features we need tominimize the selected features such that total number of comparison does not increase withnumber of instances and user.In order to process the number of processing in (21) we define following steps
a) Generate two instances of feature vectors from each user for every technique to form the setijT as in (20) for t=2.
b) For every user i, take the uncorrelated Euclidian distance E between template Ti1 and Ti2.
If(Eik>95%) where k represents template generation method F from (16), then
Delete Fk.
Therefore at the end of step (b) F1 will be a reduced length set of techniques nf2 where nf2<nf,the standard set of all techniques F of length nf. These are the techniques which produces mostsimilar templates after two instance comparison.c) Now divide the users into two categories C1 the set of all genuine user and C2 a set of all
imposters. C1 and C2 are constructed randomly with any user having equal probability to be inthe set C1 or C2.
Calculate average SSf and SOf with all templates from every independent Feature generationtechnique where suffix f represents a particular feature or template generation technique.Find out average SSf and SOf as Assf and Asof.Omit all the f for which following condition is false.(SSf<Assf)&&(SOf>Asof).
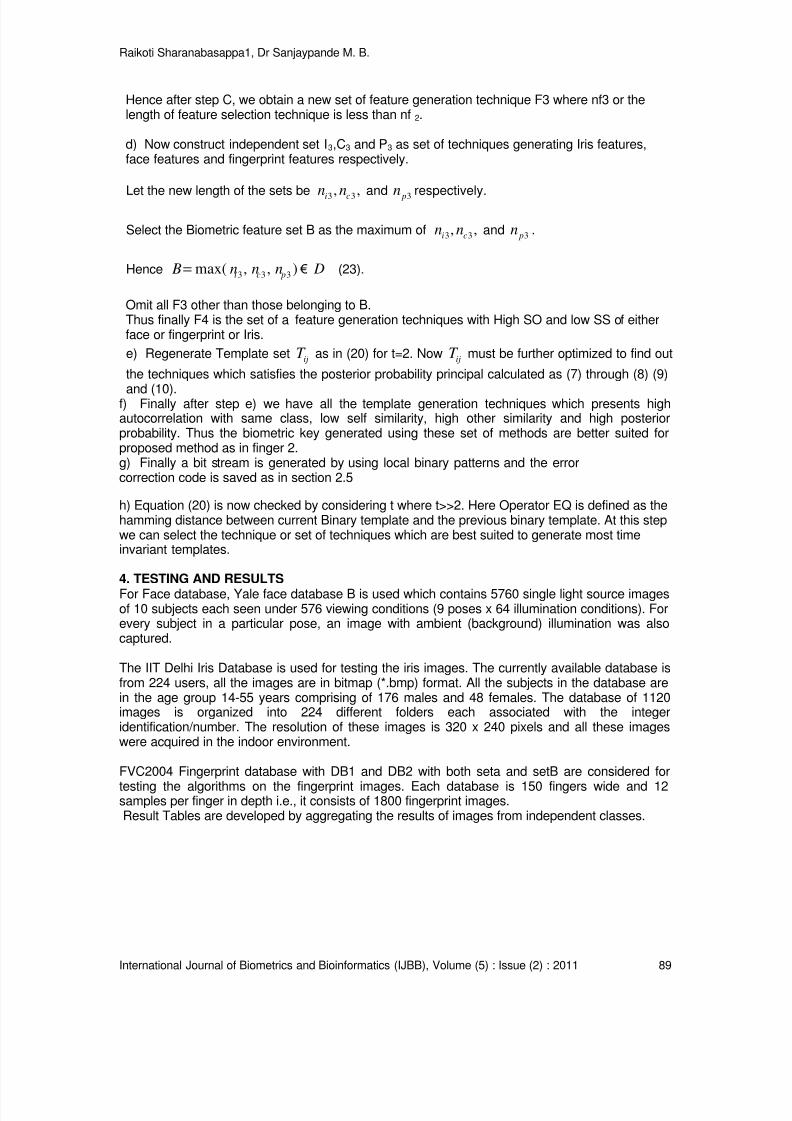
8/6/2019 International Journal of Biometrics and Bioinformatics IJBB_V5_I2
http://slidepdf.com/reader/full/international-journal-of-biometrics-and-bioinformatics-ijbbv5i2 69/133
Raikoti Sharanabasappa1, Dr Sanjaypande M. B.
International Journal of Biometrics and Bioinformatics (IJBB), Volume (5) : Issue (2) : 2011 89
Hence after step C, we obtain a new set of feature generation technique F3 where nf3 or thelength of feature selection technique is less than nf 2.
d) Now construct independent set I3,C3 and P3 as set of techniques generating Iris features,face features and fingerprint features respectively.
Let the new length of the sets be 3 3, ,i cn n and 3 pn respectively.
Select the Biometric feature set B as the maximum of 3 3, ,i cn n and 3 pn .
Hence 3 3 3max( , , )i c p B n n n= € D (23).
Omit all F3 other than those belonging to B.Thus finally F4 is the set of a feature generation techniques with High SO and low SS of eitherface or fingerprint or Iris.
e) Regenerate Template set ijT as in (20) for t=2. Now ijT must be further optimized to find out
the techniques which satisfies the posterior probability principal calculated as (7) through (8) (9)
and (10).f) Finally after step e) we have all the template generation techniques which presents highautocorrelation with same class, low self similarity, high other similarity and high posteriorprobability. Thus the biometric key generated using these set of methods are better suited forproposed method as in finger 2.g) Finally a bit stream is generated by using local binary patterns and the errorcorrection code is saved as in section 2.5
h) Equation (20) is now checked by considering t where t>>2. Here Operator EQ is defined as thehamming distance between current Binary template and the previous binary template. At this stepwe can select the technique or set of techniques which are best suited to generate most timeinvariant templates.
4. TESTING AND RESULTS
For Face database, Yale face database B is used which contains 5760 single light source imagesof 10 subjects each seen under 576 viewing conditions (9 poses x 64 illumination conditions). Forevery subject in a particular pose, an image with ambient (background) illumination was alsocaptured.
The IIT Delhi Iris Database is used for testing the iris images. The currently available database isfrom 224 users, all the images are in bitmap (*.bmp) format. All the subjects in the database arein the age group 14-55 years comprising of 176 males and 48 females. The database of 1120images is organized into 224 different folders each associated with the integeridentification/number. The resolution of these images is 320 x 240 pixels and all these imageswere acquired in the indoor environment.
FVC2004 Fingerprint database with DB1 and DB2 with both seta and setB are considered for
testing the algorithms on the fingerprint images. Each database is 150 fingers wide and 12samples per finger in depth i.e., it consists of 1800 fingerprint images.Result Tables are developed by aggregating the results of images from independent classes.
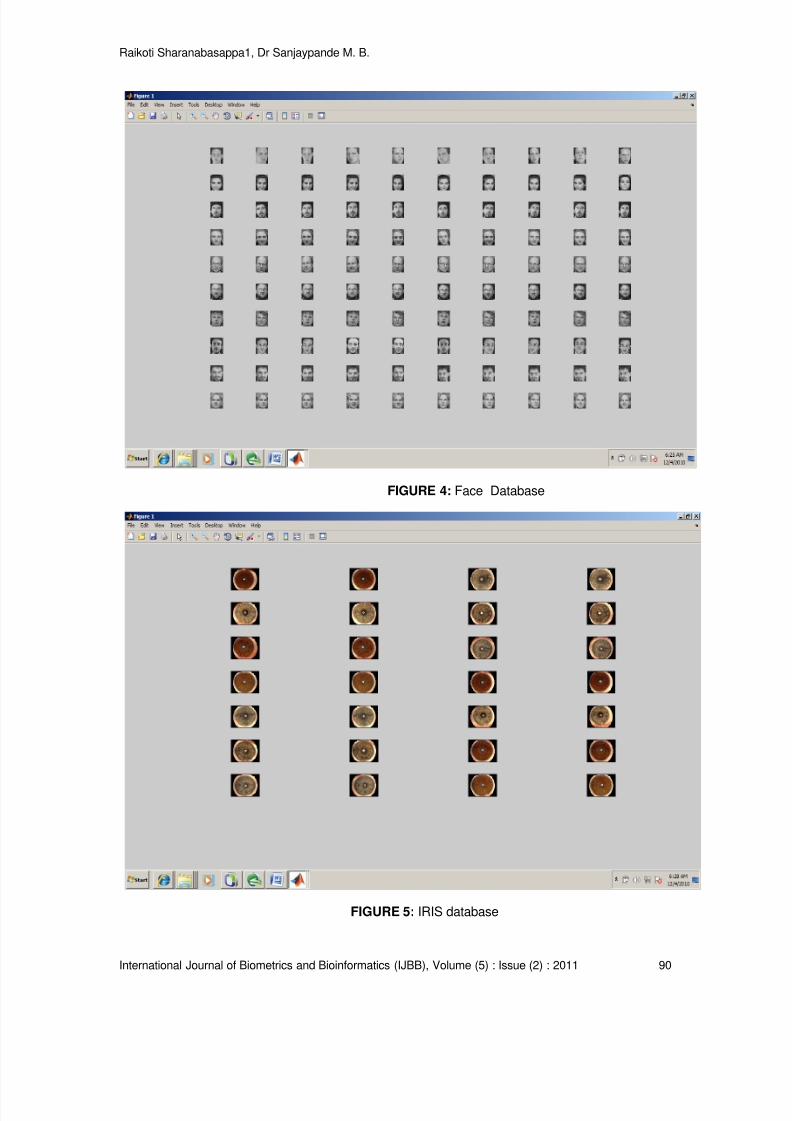
8/6/2019 International Journal of Biometrics and Bioinformatics IJBB_V5_I2
http://slidepdf.com/reader/full/international-journal-of-biometrics-and-bioinformatics-ijbbv5i2 70/133
Raikoti Sharanabasappa1, Dr Sanjaypande M. B.
International Journal of Biometrics and Bioinformatics (IJBB), Volume (5) : Issue (2) : 2011 90
FIGURE 4: Face Database
FIGURE 5: IRIS database
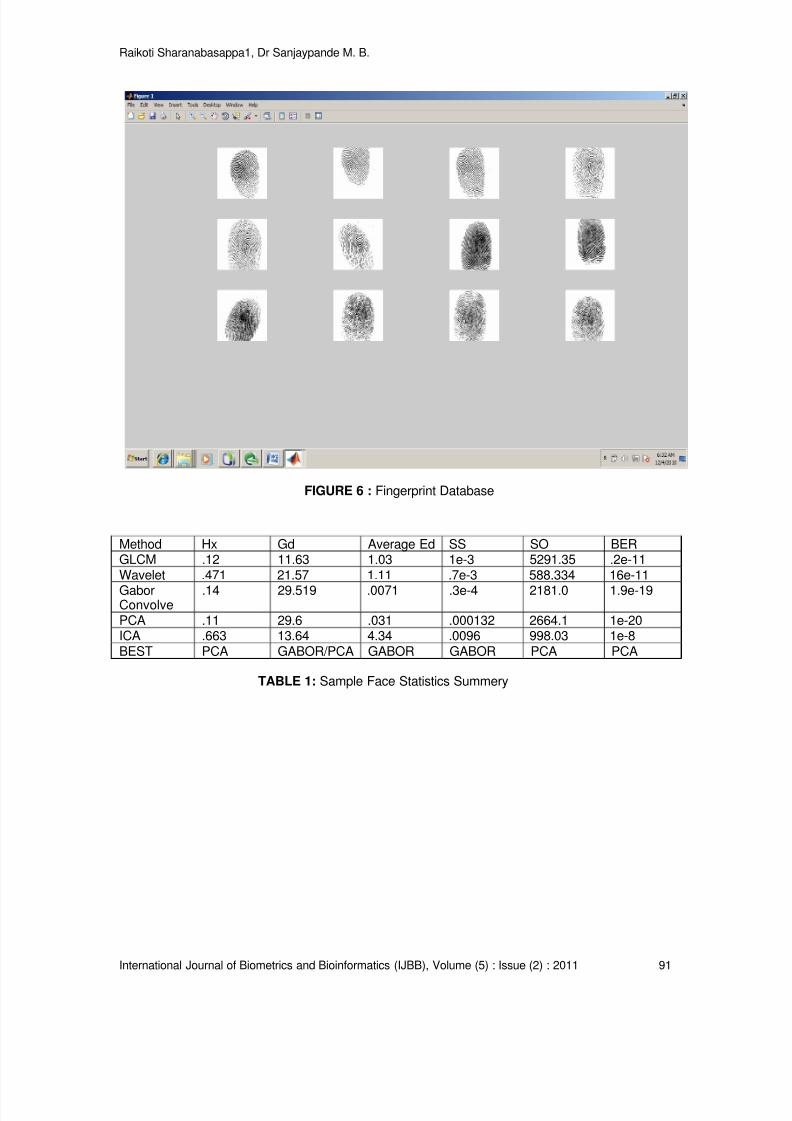
8/6/2019 International Journal of Biometrics and Bioinformatics IJBB_V5_I2
http://slidepdf.com/reader/full/international-journal-of-biometrics-and-bioinformatics-ijbbv5i2 71/133
Raikoti Sharanabasappa1, Dr Sanjaypande M. B.
International Journal of Biometrics and Bioinformatics (IJBB), Volume (5) : Issue (2) : 2011 91
FIGURE 6 : Fingerprint Database
TABLE 1: Sample Face Statistics Summery
Method Hx Gd Average Ed SS SO BERGLCM .12 11.63 1.03 1e-3 5291.35 .2e-11Wavelet .471 21.57 1.11 .7e-3 588.334 16e-11
GaborConvolve
.14 29.519 .0071 .3e-4 2181.0 1.9e-19
PCA .11 29.6 .031 .000132 2664.1 1e-20ICA .663 13.64 4.34 .0096 998.03 1e-8BEST PCA GABOR/PCA GABOR GABOR PCA PCA
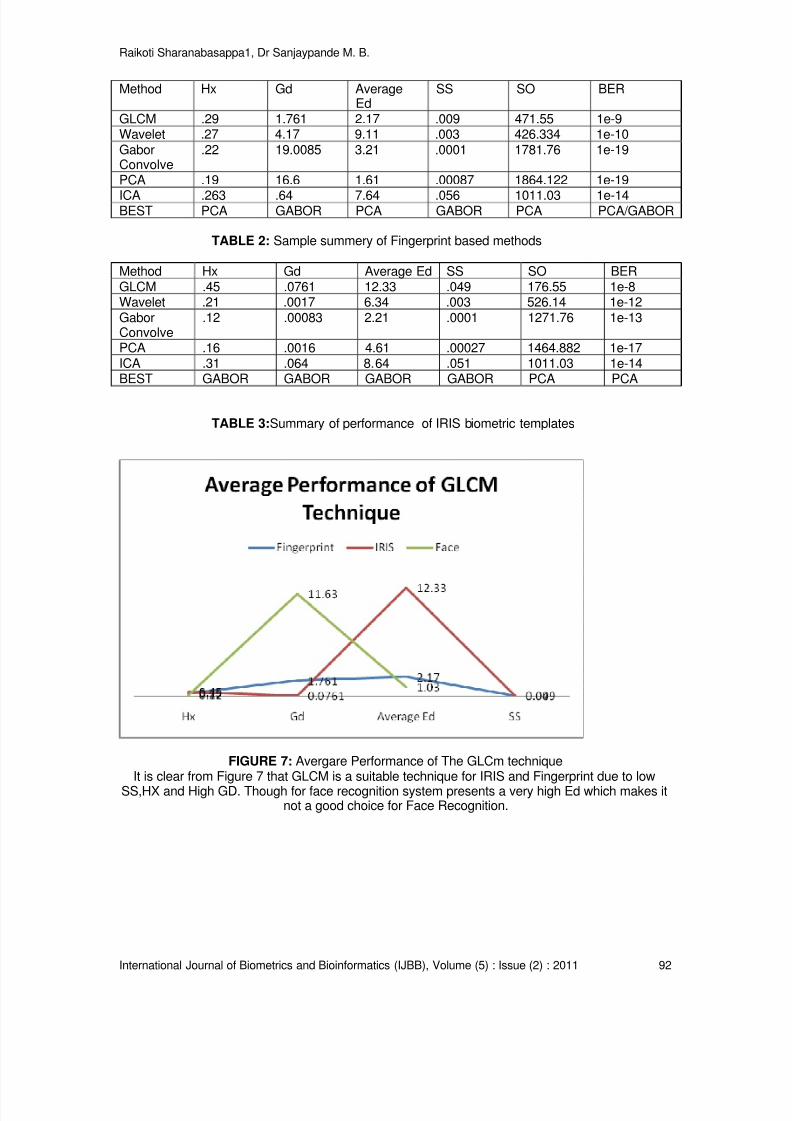
8/6/2019 International Journal of Biometrics and Bioinformatics IJBB_V5_I2
http://slidepdf.com/reader/full/international-journal-of-biometrics-and-bioinformatics-ijbbv5i2 72/133
Raikoti Sharanabasappa1, Dr Sanjaypande M. B.
International Journal of Biometrics and Bioinformatics (IJBB), Volume (5) : Issue (2) : 2011 92
TABLE 2: Sample summery of Fingerprint based methods
TABLE 3:Summary of performance of IRIS biometric templates
FIGURE 7: Avergare Performance of The GLCm techniqueIt is clear from Figure 7 that GLCM is a suitable technique for IRIS and Fingerprint due to low
SS,HX and High GD. Though for face recognition system presents a very high Ed which makes itnot a good choice for Face Recognition.
Method Hx Gd AverageEd
SS SO BER
GLCM .29 1.761 2.17 .009 471.55 1e-9Wavelet .27 4.17 9.11 .003 426.334 1e-10GaborConvolve
.22 19.0085 3.21 .0001 1781.76 1e-19
PCA .19 16.6 1.61 .00087 1864.122 1e-19
ICA .263 .64 7.64 .056 1011.03 1e-14BEST PCA GABOR PCA GABOR PCA PCA/GABOR
Method Hx Gd Average Ed SS SO BERGLCM .45 .0761 12.33 .049 176.55 1e-8Wavelet .21 .0017 6.34 .003 526.14 1e-12GaborConvolve
.12 .00083 2.21 .0001 1271.76 1e-13
PCA .16 .0016 4.61 .00027 1464.882 1e-17ICA .31 .064 8.64 .051 1011.03 1e-14BEST GABOR GABOR GABOR GABOR PCA PCA
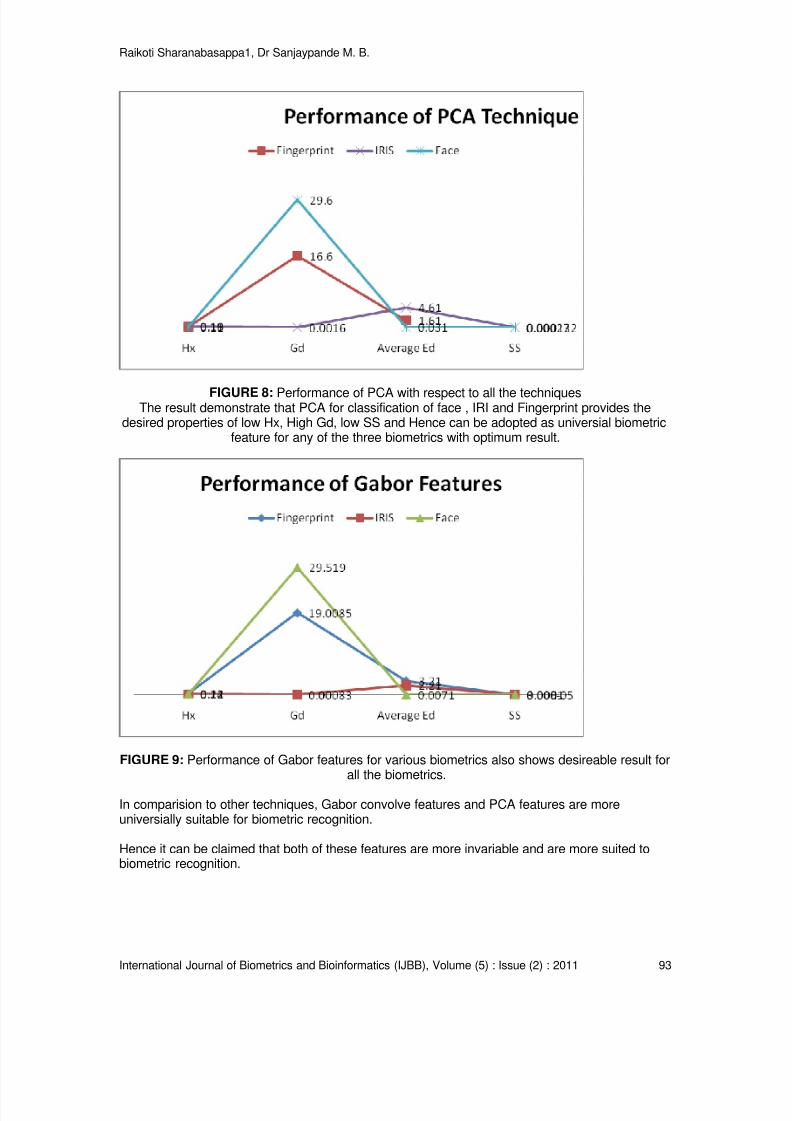
8/6/2019 International Journal of Biometrics and Bioinformatics IJBB_V5_I2
http://slidepdf.com/reader/full/international-journal-of-biometrics-and-bioinformatics-ijbbv5i2 73/133
Raikoti Sharanabasappa1, Dr Sanjaypande M. B.
International Journal of Biometrics and Bioinformatics (IJBB), Volume (5) : Issue (2) : 2011 93
FIGURE 8: Performance of PCA with respect to all the techniquesThe result demonstrate that PCA for classification of face , IRI and Fingerprint provides the
desired properties of low Hx, High Gd, low SS and Hence can be adopted as universial biometricfeature for any of the three biometrics with optimum result.
FIGURE 9: Performance of Gabor features for various biometrics also shows desireable result forall the biometrics.
In comparision to other techniques, Gabor convolve features and PCA features are moreuniversially suitable for biometric recognition.
Hence it can be claimed that both of these features are more invariable and are more suited tobiometric recognition.
8/6/2019 International Journal of Biometrics and Bioinformatics IJBB_V5_I2
http://slidepdf.com/reader/full/international-journal-of-biometrics-and-bioinformatics-ijbbv5i2 74/133
Raikoti Sharanabasappa1, Dr Sanjaypande M. B.
International Journal of Biometrics and Bioinformatics (IJBB), Volume (5) : Issue (2) : 2011 94
5. CONCLUSIONSelecting an appropriate biometric model is an important step towards achieving highperformance solutions. A lot of factors like scalability, usability and invariability must be analyzedamongst the models and the feature selection type for the template before finalizing the selection.Many work is proposed towards improving the efficiency of particular biometric technique asreviewed in related work. But there has not been any standard benchmark which offers asystematic analysis of benchmark of the performance of the system. In this work an entirely newapproach of benchmark analysis for the quality of the selected biometric model and the techniqueis proposed based on invariability analysis of the templates from instance to instance. Resultsshows that IRIS has better invariability from both face and fingerprints and also offers better SOand SS values desired for high accuracy classification. The result also suggests that once timeand instance invariant templates are generated, binarization process will always contain least biterror. Hence before any biometric model and technique is adopted, if the techniques available forthe models are analyzed using this method, it can give an assurance of performance over theuse. Further the proposed technique can be tested with many different other algorithmsdeveloped over the years for all the considered biometric model to present the proof of
acceptance.
3. REFERENCES[1] Magnus Pettersson, “The Match On Card Technology”, Precise Biometrics White Paper
[2] Ricardo García Noval, Francisco Perales López, “Poster: Adaptative Templates InBiometric Authentication”
[3] Lucas Ballard, Seny Kamara, Michael K. Reiter, “The Practical Subtleties of Biometric KeyGeneration”, 17th USENIX Security Symposium
[4] C. Chen, R.N.J. Veldhuis, T.A.M. Kevenaar, A.H.M. Akkermans, “Multi-Bits Biometric StringGeneration based on the Likelihood Ratio”, DOI: Multi-Bits Biometric String Generation
based on the Likelihood Ratio,IEEE, 2007
[5] U. Korte, R. Plaga, “Cryptographic Protection of Biometric Templates: Chance, Challengesand Applications”
[6] Aditya Abhyankar , Stephanie Schuckers, “Novel Biorthogonal Wavelet based IrisRecognition for Robust Biometric System”, International Journal of Computer Theory and Engineering, Vol. 2, No. 2 April, 2010 1793-8201
[7] James L. Maseey, “Guessing and Entropy”,DOI: 0 - 7803-2015-8/94, IEEE,1994
[8] Asker M. Bazen and Raymond N. J. Veldhuis, “Likelihood-Ratio-Based BiometricVerification”, Ieee Transactions On Circuits And Systems For Video Technology, Vol. 14,
No. 1, January 2004, 1051-8215/04,Ieee, 2004
[9] C. K. CHOW, “On Optimum Recognition Error and Reject Tradeoff”, IEEE Tr.4nsactions On Information Theory, Vol. It-16, No. 1, January 1970
[10] C. K. CHOW, “An Optimum Character Recognition System Using Decision Functions”,PGEC, June 3, 1957
[11] Juels A. and Wattenberg M., "A Fuzzy Commitment Scheme", ACM Conference onComputer and Communications Security", 1999, p.28-36
8/6/2019 International Journal of Biometrics and Bioinformatics IJBB_V5_I2
http://slidepdf.com/reader/full/international-journal-of-biometrics-and-bioinformatics-ijbbv5i2 75/133
Raikoti Sharanabasappa1, Dr Sanjaypande M. B.
International Journal of Biometrics and Bioinformatics (IJBB), Volume (5) : Issue (2) : 2011 95
[12] Daniel Gonz´alez-Jim´enez and Jos´e Luis Alba-Castro, “Modeling Marginal Distributionsof Gabor Coefficients: Application to Biometric TemplateReduction”, project PRESATEC2005-07212
[13] V. S. Meenakshi and Dr G. Padmavathi, “Securing Revocable Iris and Retinal Templatesusing Combined User and Soft Biometric based Password Hardened MultimodalFuzzy Vault”, IJCSI International Journal of Computer Science Issues, Vol. 7, Issue 5,September 2010 ISSN (Online): 1694-0814
[14] Anil Jain, Umut Uludag and Arun Ross, “Biometric Template Selection: A Case Study inFingerprints”, Proc. of 4th Int'l Conference on Audio- and Video-Based Person Authentication (AVBPA), LNCS 2688, pp. 335-342, Guildford, UK, June 9-11, 2003.
[15] Aditya Abhyankar and Stephanie Schuckers, “Novel Biorthogonal Wavelet based IrisRecognition for Robust Biometric System”, International Journal of Computer Theory and Engineering, Vol. 2, No. 2 April, 2010 1793-8201
[16] Abhishek Nagar, Karthik Nandakumar, and A. K. Jain, “Biometric template security”, SPIE,10.1117/2.1200911.001590
[17] Julien Bringer, Herve Chabanne, David Pointcheval, and Sebastien Zimmer, “AnApplication of the Boneh and Shacham Group Signature Scheme to BiometricAuthentication”, Springer-Verlag 2008
[18] Qinghan Xiao, “Security Issues in Biometric Authentication”, Proceedings of the 2005 IEEE,Workshop on Information Assurance and Security, United States Military Academy,West Point, NY
[19] Yunsu Chung, Kiyoung Moon, Hyung-Woo Lee, “Biometric Certificate based BiometricDigital Key Generation with Protection Mechanism”, Frontiers in the Convergence of Bioscience and Information Technologies 2007
[20] Andrew Beng Jin Teoh, Thian Song Ong, “Secure Biometric Template Protection viaRandomized Dynamic Quantization Transformation”, 1-4244-2427-6/08,IEEE
[21] Brenden Chen and Vinod Chandran, “Biometric Template Security Using Higher OrderSpectra”, 978-1-4244-4296-6/10, IEEE,2010
[22] Qinghai Gao, Xiaowen Zhang, and Michael Anshel, “Experiments on Matching IntronizedFingerprint Minutiae Templates”, IJCSNS International Journal of Computer Science and Network Security, VOL.8 No.9, September 2008
[23] Andy Adler, “Vulnerabilities in biometric encryption systems”, IST-044-RWS-007
[24] Michael Braithwaite, Ulf Cahn von Seelen, James Cambier,, “Application-SpecificBiometric Templates”
[25] E. Verbitskey,D. Denteneer, P. tuylys, “Reliable biometric authentication with privacyprotection.”
[26] Anil K. Jain, Karthik Nandakumar, and Abhishek Nagar, “Biometric Template Security”,EURASIP Journal on Advances in Signal Processing Volume 2008, Article ID 579416, 17 pages, doi:10.1155/2008/579416
8/6/2019 International Journal of Biometrics and Bioinformatics IJBB_V5_I2
http://slidepdf.com/reader/full/international-journal-of-biometrics-and-bioinformatics-ijbbv5i2 76/133
Raikoti Sharanabasappa1, Dr Sanjaypande M. B.
International Journal of Biometrics and Bioinformatics (IJBB), Volume (5) : Issue (2) : 2011 96
[27] Shih-Wei Sun¤y , Chun-Shien Lu¤ , and Pao-Chi Changy, “Biometric Template Protection: AKey-Mixed Template Approach”, 1-4244-0763-X/07, IEEE, 2007
[28] Morpho, “Automatic Facial Recognition: A review”, SAFRON
[29] Tony Mansfield, Marek R. G., “Feasibility study on the use of biometric in an Entitlementscheme, Biometric Feasibility Study”, Version 3, 2003
[30] Srinivasa Palla, Sharat S. Chikkerur, Venu Govindaraju, Pavan Rudravaram, “Classificationand Indexing in Large Biometric Databases”
[31] Tarachand Verma, Prof. Richa Jindal, Prof. Sonika Jindal, “A Security Algorithm For IrisBased Biometric System”, International Journal Of Engineering Science And Technology,Vol. 2(06), 2010, 2316-2320
[32] Yong Li, Jianping Yin, En Zhu, Chunfeng Hu, Hui Chen, “Score Based Biometric TemplateSelection”, 978-1-4244-2175-6/08/, IEEE, 2008
[33] Luisa Riccardi, Bruno Peticone and Mario Savastano, “Biometrics for massive access
control Traditional Problems and Innovative Approaches”, Proceedings of the 2005 IEEE Workshop on Information Assurance and Security United States Military Academy, West Point, NY
[34] C.Lakshmi Deepika, A.Kandaswamy, “An Algorithm for Improved Accuracy in UnimodalBiometric Systems through Fusion of Multiple Feature Sets”, ICGST-GVIP Journal, ISSN 1687-398X, Volume (9), Issue (III), June 2009
8/6/2019 International Journal of Biometrics and Bioinformatics IJBB_V5_I2
http://slidepdf.com/reader/full/international-journal-of-biometrics-and-bioinformatics-ijbbv5i2 77/133
Mohammad Imroze Khan, Bibhudendra Acharya, Bikesh Kumar Singh & Jigyasa Soni
International Journal of Biometrics and Bioinformatics (IJBB), Volume (5) : Issue (2) : 2011 97
Content Based Image Retrieval Approaches for Detection ofMalarial Parasite in Blood Images
Mohammad Imroze Khan [email protected]
Lecturer/Department of Electronics & Telecommunication National Institute of Technology Raipur,Raipur, 492010, India
Bibhudendra Acharya [email protected] Assistant Professor/Department of Electronics & Telecommunication National Institute of Technology Raipur,Raipur, 492010, India
Bikesh Kumar Singh [email protected] Assistant Professor/Department of Electronics & Telecommunication National Institute of Technology Raipur,Raipur, 492010, India
Jigyasa Soni [email protected] M. Tech Student/Department of Electronics & Telecommunication Shri Shankracharya College of Engineering & Technology,Bhilai, 490020, India
Abstract
Malaria is a serious global health problem, and rapid, accurate diagnosis is required to control thedisease. An image processing algorithm to automate the diagnosis of malaria in blood images isproposed in this paper. The image classification system is designed to positively identify malariaparasites present in thin blood smears, and differentiate the species of malaria. Images areacquired using a charge-coupled device camera connected to a light microscope. Morphologicaland novel threshold selection techniques are used to identify erythrocytes (red blood cells) and
possible parasites present on microscopic slides. Image features based on colour, texture andthe geometry of the cells and parasites are generated, as well as features that make use of apriori knowledge of the classification problem and mimic features used by human technicians. Atwo-stage tree classifier using back propogation feed forward neural networks distinguishesbetween true and false positives, and then diagnoses the species (Plasmodium Falciparum, P.Vivax, P. Ovale or P. Malariae) of the infection. Malaria samples obtained from the variousbiomedical research facilities are used for training and testing of the system. Infected erythrocytesare positively identified with two measurable parameters namely sensitivity and a positivepredictive value (PPV), which makes the method highly sensitive at diagnosing a completesample, provided many views are analyzed.
Keywords: Falciparum, Vivax, Ovale, Malariae and Giemsa
1. INTRODUCTION
This guideline is used for all journals. These are the manuscript preparation guidelines used as aMalaria is caused by parasites of the species Plasmodium that are spread from person to personthrough the bites of infected female mosquitoes. It can also be transmitted through bloodtransfusions. If an infected person donates blood, the blood will contain malaria parasites. If theblood is put into another person's body, the parasites will also flow into his or her bloodstream.For the most serious form of malaria, the incubation period is eight to twelve days. In some rareforms of malaria, the incubation period can be as long as ten months.
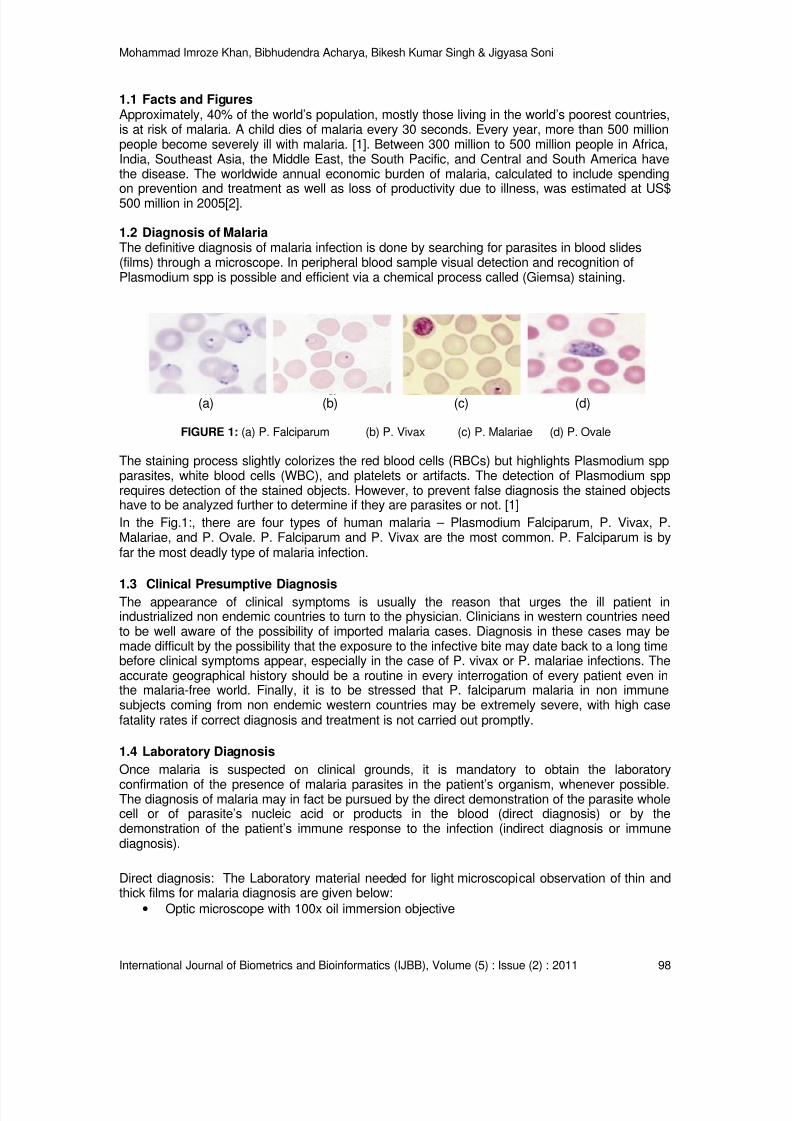
8/6/2019 International Journal of Biometrics and Bioinformatics IJBB_V5_I2
http://slidepdf.com/reader/full/international-journal-of-biometrics-and-bioinformatics-ijbbv5i2 78/133
Mohammad Imroze Khan, Bibhudendra Acharya, Bikesh Kumar Singh & Jigyasa Soni
International Journal of Biometrics and Bioinformatics (IJBB), Volume (5) : Issue (2) : 2011 98
1.1 Facts and FiguresApproximately, 40% of the world’s population, mostly those living in the world’s poorest countries,is at risk of malaria. A child dies of malaria every 30 seconds. Every year, more than 500 millionpeople become severely ill with malaria. [1]. Between 300 million to 500 million people in Africa,India, Southeast Asia, the Middle East, the South Pacific, and Central and South America havethe disease. The worldwide annual economic burden of malaria, calculated to include spendingon prevention and treatment as well as loss of productivity due to illness, was estimated at US$500 million in 2005[2].
1.2 Diagnosis of MalariaThe definitive diagnosis of malaria infection is done by searching for parasites in blood slides(films) through a microscope. In peripheral blood sample visual detection and recognition ofPlasmodium spp is possible and efficient via a chemical process called (Giemsa) staining.
(a) (b) (c) (d)
FIGURE 1: (a) P. Falciparum (b) P. Vivax (c) P. Malariae (d) P. Ovale
The staining process slightly colorizes the red blood cells (RBCs) but highlights Plasmodium sppparasites, white blood cells (WBC), and platelets or artifacts. The detection of Plasmodium spprequires detection of the stained objects. However, to prevent false diagnosis the stained objectshave to be analyzed further to determine if they are parasites or not. [1]
In the Fig.1:, there are four types of human malaria – Plasmodium Falciparum, P. Vivax, P.Malariae, and P. Ovale. P. Falciparum and P. Vivax are the most common. P. Falciparum is byfar the most deadly type of malaria infection.
1.3 Clinical Presumptive DiagnosisThe appearance of clinical symptoms is usually the reason that urges the ill patient inindustrialized non endemic countries to turn to the physician. Clinicians in western countries needto be well aware of the possibility of imported malaria cases. Diagnosis in these cases may bemade difficult by the possibility that the exposure to the infective bite may date back to a long timebefore clinical symptoms appear, especially in the case of P. vivax or P. malariae infections. Theaccurate geographical history should be a routine in every interrogation of every patient even inthe malaria-free world. Finally, it is to be stressed that P. falciparum malaria in non immunesubjects coming from non endemic western countries may be extremely severe, with high casefatality rates if correct diagnosis and treatment is not carried out promptly.
1.4 Laboratory Diagnosis
Once malaria is suspected on clinical grounds, it is mandatory to obtain the laboratory
confirmation of the presence of malaria parasites in the patient’s organism, whenever possible.The diagnosis of malaria may in fact be pursued by the direct demonstration of the parasite wholecell or of parasite’s nucleic acid or products in the blood (direct diagnosis) or by thedemonstration of the patient’s immune response to the infection (indirect diagnosis or immunediagnosis).
Direct diagnosis: The Laboratory material needed for light microscopical observation of thin andthick films for malaria diagnosis are given below:
• Optic microscope with 100x oil immersion objective
8/6/2019 International Journal of Biometrics and Bioinformatics IJBB_V5_I2
http://slidepdf.com/reader/full/international-journal-of-biometrics-and-bioinformatics-ijbbv5i2 79/133
Mohammad Imroze Khan, Bibhudendra Acharya, Bikesh Kumar Singh & Jigyasa Soni
International Journal of Biometrics and Bioinformatics (IJBB), Volume (5) : Issue (2) : 2011 99
• Electric supply of adequate mirrors for sun light• Stain stock solution• Buffered distilled/de-ionized water• Graduated cylinders• Staining recipients• Clean glass slides
• Cover slips (optional)• Disinfectant alcoholic solution• Sterile pricking needles
• Gauze or cotton
1.5 Light Microscopic Observation
The direct microscopic observation of stained blood specimens requires specific instrumentationand reagents (microscope, microscopic slides, pricking needle, staining reagents, water, electricor solar light, etc. and a trained professional to obtain to a correct diagnosis. Information on basicmicroscopy, the basic staining procedures and on the most common mistakes is given togetherwith the morphological clues to make an adequate qualitative (stage and species diagnosis) andquantitative (parasitaemia) diagnosis of malaria infection at the district level.
1.6 Fixation and Staining ProceduresThin and thick films may be allowed to dry in the air protected by dust, or actively dried by wavingit. It is important to avoid abrupt exposure to heath (fire, sunlight) that may lead to fixation andfissure the preparations. Fixation may be achieved by heat and alcoholic solutions. Methanol(methyl alcohol) is the most widely used fixative for malaria thin films. Contact with methanolshould be maintained for 10-20 seconds. If both thin and thick films are on the same slide, it ismandatory to avoid the contact of methanol (or even of its fumes!) with the thick film to avoidfixation.
Giemsa staining procedure: To achieve optimal results, it is important that the Giemsa stainingsolution is prepared with distilled or de-ionized water buffered to pH 7.2. The Giemsa stainingsolution is prepared by diluting Giemsa stain with buffered water. A ratio 1:10 and 1:20 is usuallyused for staining thin and thick films respectively, that is 2 to 1 drops of Giemsa per ml of bufferedwater. Grossly, 5 ml of the solution is necessary to stain each single slide. The Giemsa stain isthen poured onto the slide (or the slide is immersed in the staining trough) and contact ismaintained for 30-40 minutes depending on the local climatic conditions. The staining solution isthen removed by gentle but accurate rinsing with buffered distilled water and the slide is thendrained on filter paper and allowed to dry in air. When the clinical situation requires immediateaction, thick films may be stained with a Giemsa accelerate procedure. The qualitativemorphological results are however far worse than the usual ones. Briefly, the thick smear isallowed to dry under a heat source of up to 50°C (even sunlight is suitable if slides are protectedfrom dust) and then stained for 8 minutes with a 10% Giemsa solution (2 drops/ml) before rinsingand drying. Giemsa staining is the most commonly used method for both thin and thick films allover the world for the quality of the stain and, of greater importance, its stability in tropicalclimates.
1.7 Basic MicroscopyThe microscope is an essential component of the malaria diagnostic laboratory, even in fieldcondition. The care and maintenance of the microscope is thus of the outmost importance. Abasic knowledge of the main features of a microscope is also required (World HealthOrganization, 1991). A monocular microscope is best suited for a natural solar light source, butthe quality and the ease of observation is greatly improved when a binocular microscope(requiring electric light supply) is used. A routine microscope usually has three objectives (10x,40x, 100x magnifications). The 100x objective is also referred to as an “immersion objective” andhas to be used to observe blood smears. The binoculars also have their own magnification (6x or

8/6/2019 International Journal of Biometrics and Bioinformatics IJBB_V5_I2
http://slidepdf.com/reader/full/international-journal-of-biometrics-and-bioinformatics-ijbbv5i2 80/133
Mohammad Imroze Khan, Bibhudendra Acharya, Bikesh Kumar Singh & Jigyasa Soni
International Journal of Biometrics and Bioinformatics (IJBB), Volume (5) : Issue (2) : 2011 100
7x are preferred for malaria diagnosis), the total magnification resulting from the multiplication ofboth lenses. The following practical suggestions may be of help for a better use of this invaluablediagnostic tool:
• Place the slide on the stage;• Keep the diaphragm completely open and raise the condenser to reach the brightest
field;
• Using the coarse adjustment lower the stage (or lift the objective, depending on themicroscope used) to the maximum distance from the objective revolver;• Place one drop of immersion oil on the slide;• Using the coarse adjustment, lift the stage to allow the oil drop to touch the lens of the
objective;• Using the fine adjustment, sharply focus by slightly lowering the stage again;• Modulate iris diaphragm to obtain optimal illumination;• Clean the objective lenses with soft gauze or lens tissue.
• Use Xylene (always avoid strong alcohol solutions or acetone as these substances maydissolve the glue used to fix the objective lenses) only from time to time to remove tracesof dried oil.
1.8 Morphological Species and Stage Diagnosis [6]
Complete knowledge of the morphological features of the different blood stages of the differentPlasmodia species represents the essential basis of a correct laboratory diagnosis confirmation ofmalaria infection. It is to be stressed that a correct diagnosis may be done only after attentive andcareful observation of a number of microscopic fields (at least 100 microscopic fields should beobserved before a thick film may be classed as negative) and of a number of differentmorphologic characteristics that draw a well defined picture of the species. A crescent-shapedgametocyte in peripheral blood does not obligatorily mean that a P. falciparum infection is thecause of the actual clinical complaint and, however, does not rule out the possibility of mixedinfection.
2. TEST ALGORITHMThe design is essentially an image classification problem, and thus takes the form of a standardpattern recognition and classification system in Fig. 2:. It consists of five stages:
1. Image Acquisition (Done using high resolution Digital Camera)2. Image Analysis3. Image Segmentation4. Feature Generation5. Classification of Parasite and result verification
2.1 Image AnalysisImage analysis usually starts with a pre-processing stage, which includes operations such asnoise reduction.
2.1.1 Test Algorithm Using Filtering ApproachDifferent test algorithms using filter approach are describe below.
2.1.1.1 Median Filtering: [15]In microscopic image processing, it is usually necessary to perform high degree of noisereduction in an image before performing higher-level processing steps, such as edge detection.The median filter is a non-linear digital filtering technique, often used to remove noise fromimages or other signals. The idea is to examine a sample of the input and decide if it isrepresentative of the signal. This is performed using a window consisting of an odd number ofsamples. The values in the window are sorted into numerical order; the median value, the samplein the center of the window, is selected as the output. The oldest sample is discarded, a newsample acquired, and the calculation repeats.
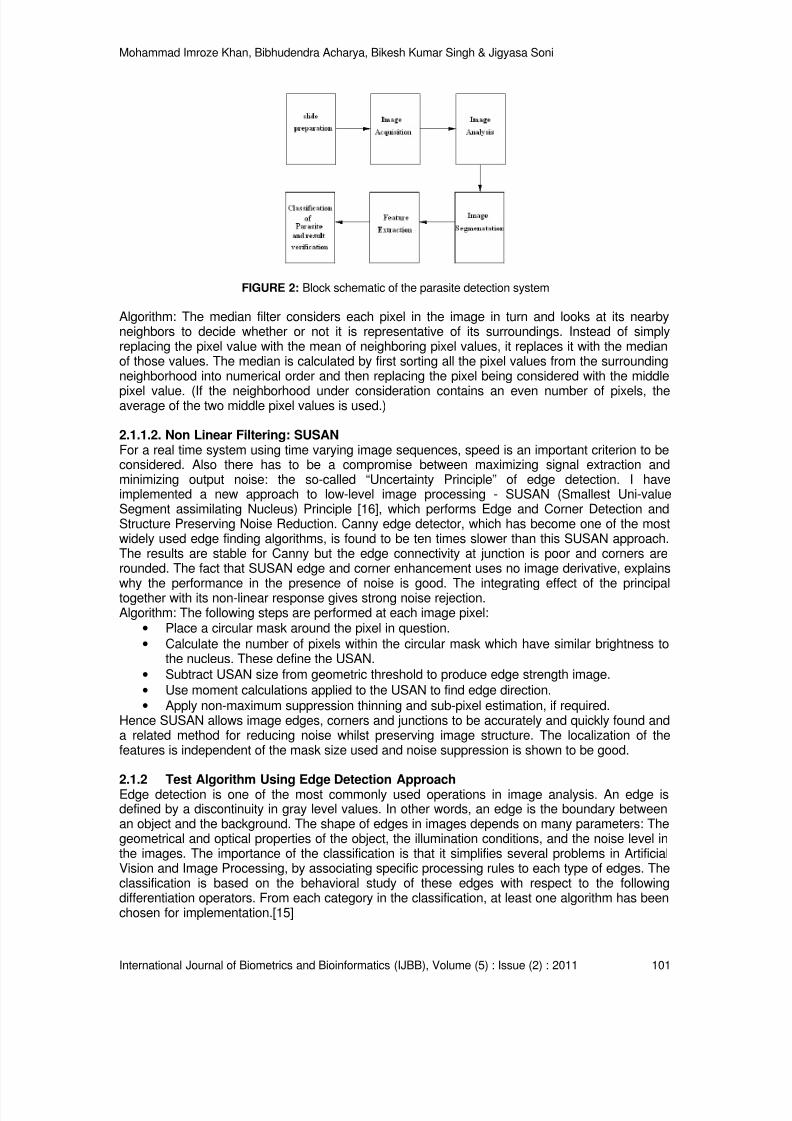
8/6/2019 International Journal of Biometrics and Bioinformatics IJBB_V5_I2
http://slidepdf.com/reader/full/international-journal-of-biometrics-and-bioinformatics-ijbbv5i2 81/133
Mohammad Imroze Khan, Bibhudendra Acharya, Bikesh Kumar Singh & Jigyasa Soni
International Journal of Biometrics and Bioinformatics (IJBB), Volume (5) : Issue (2) : 2011 101
FIGURE 2: Block schematic of the parasite detection system
Algorithm: The median filter considers each pixel in the image in turn and looks at its nearbyneighbors to decide whether or not it is representative of its surroundings. Instead of simplyreplacing the pixel value with the mean of neighboring pixel values, it replaces it with the medianof those values. The median is calculated by first sorting all the pixel values from the surroundingneighborhood into numerical order and then replacing the pixel being considered with the middle
pixel value. (If the neighborhood under consideration contains an even number of pixels, theaverage of the two middle pixel values is used.)
2.1.1.2. Non Linear Filtering: SUSANFor a real time system using time varying image sequences, speed is an important criterion to beconsidered. Also there has to be a compromise between maximizing signal extraction andminimizing output noise: the so-called “Uncertainty Principle” of edge detection. I haveimplemented a new approach to low-level image processing - SUSAN (Smallest Uni-valueSegment assimilating Nucleus) Principle [16], which performs Edge and Corner Detection andStructure Preserving Noise Reduction. Canny edge detector, which has become one of the mostwidely used edge finding algorithms, is found to be ten times slower than this SUSAN approach.The results are stable for Canny but the edge connectivity at junction is poor and corners arerounded. The fact that SUSAN edge and corner enhancement uses no image derivative, explains
why the performance in the presence of noise is good. The integrating effect of the principaltogether with its non-linear response gives strong noise rejection.Algorithm: The following steps are performed at each image pixel:
• Place a circular mask around the pixel in question.• Calculate the number of pixels within the circular mask which have similar brightness to
the nucleus. These define the USAN.• Subtract USAN size from geometric threshold to produce edge strength image.• Use moment calculations applied to the USAN to find edge direction.• Apply non-maximum suppression thinning and sub-pixel estimation, if required.
Hence SUSAN allows image edges, corners and junctions to be accurately and quickly found anda related method for reducing noise whilst preserving image structure. The localization of thefeatures is independent of the mask size used and noise suppression is shown to be good.
2.1.2 Test Algorithm Using Edge Detection ApproachEdge detection is one of the most commonly used operations in image analysis. An edge isdefined by a discontinuity in gray level values. In other words, an edge is the boundary betweenan object and the background. The shape of edges in images depends on many parameters: Thegeometrical and optical properties of the object, the illumination conditions, and the noise level inthe images. The importance of the classification is that it simplifies several problems in ArtificialVision and Image Processing, by associating specific processing rules to each type of edges. Theclassification is based on the behavioral study of these edges with respect to the followingdifferentiation operators. From each category in the classification, at least one algorithm has beenchosen for implementation.[15]
8/6/2019 International Journal of Biometrics and Bioinformatics IJBB_V5_I2
http://slidepdf.com/reader/full/international-journal-of-biometrics-and-bioinformatics-ijbbv5i2 82/133
Mohammad Imroze Khan, Bibhudendra Acharya, Bikesh Kumar Singh & Jigyasa Soni
International Journal of Biometrics and Bioinformatics (IJBB), Volume (5) : Issue (2) : 2011 102
Gradient edge detectors: This contains classical operators and uses first directional derivativeoperation. It includes algorithms such as: Sobel (1970), Prewitt (1970) etc.Zero Crossing: This uses second derivative and includes Laplacian operator and seconddirectional derivative.Laplacian of Gaussian (LoG): This was invented by Marr and Hildreth (1980) who combinedGaussian filtering with the Laplacian. This algorithm is not used frequently in machine vision.Gaussian Edge Detectors: This is symmetric along the edge and reduces the noise by smoothingthe image. The significant operator here is Canny that convolves the image with the derivative ofGaussian for Canny.
2.2 Image SegmentationFor the actual recognition stage, segmentation should be done before it to extract out only thepart that has useful information. The goal of the segmentation process is to define areas withinthe image that have some properties that make them homogeneous. The definition of thoseproperties should satisfy the general condition that the union of neighboring regions should not behomogeneous if we consider the same set of properties. After segmentation, the discontinuities inthe image correspond to boundaries between regions can be easily established.
2.2.1 Test Algorithm Using ThresholdingThresholding can be applied locally, i.e. within a neighborhood of each pixel, or globally. Due to
highly varying defect sizes, it will be impossible to find one neighborhood size that works for all.Thus, following global thresholding techniques are implemented to test their achievability.Otsu: Otsu's method is still among the most referenced methods in segmentation [17]. It is basedon minimizing within-class variances of foreground and background pixels.
Entropy: Kapur et al. explained foreground and background of an image as different signals [18].Therefore, optimal threshold is the one maximizing the sum of the two class entropies as shownin following (1).
(1)
2.2.2 Test Algorithm Using Region Based SegmentationDifferent test algorithms using Region based segmentation approaches are describe below.
2.2.2.1 Watershed Segmentation [15]Separating touching blood cells in an image is a difficult issue in the project. The watershedtransform could minimize this problem. The watershed transform finds "catchment basins" and"watershed ridge lines" in an image by treating it as a surface where light pixels are high and darkpixels are low.In watershed based segmentation, each local minima of a gray-scale image I is regarded as asurface has a hole and the surface is immersed out into water. Then, starting from the minima oflowest intensity value, the water will progressively fill up different catchment basins of image(surface) I. Conceptually the algorithm then builds a dam to avoid a situation that the watercoming from two or more different local minima would be merged. At the end of this immersionprocess, each local minimum is totally enclosed by dams corresponding to watersheds of image(surface) I.
2.2.2.2 Marker-Controlled Watershed Segmentation [15]Watershed transform can separate touching cells but not overlapping cells. For this Marker-controlled watershed segmentation is used instead. It follows this basic procedure:
1. Compute a segmentation function. This is an image whose dark regions are the objectone is trying to segment.
2. Compute foreground markers. These are connected blobs of pixels within each of theobjects.
3. Compute background markers. These are pixels that are not part of any object.
8/6/2019 International Journal of Biometrics and Bioinformatics IJBB_V5_I2
http://slidepdf.com/reader/full/international-journal-of-biometrics-and-bioinformatics-ijbbv5i2 83/133
8/6/2019 International Journal of Biometrics and Bioinformatics IJBB_V5_I2
http://slidepdf.com/reader/full/international-journal-of-biometrics-and-bioinformatics-ijbbv5i2 84/133
Mohammad Imroze Khan, Bibhudendra Acharya, Bikesh Kumar Singh & Jigyasa Soni
International Journal of Biometrics and Bioinformatics (IJBB), Volume (5) : Issue (2) : 2011 104
Where, P (b) is the first-order histogram estimate, Parameter b is the pixel amplitude value. L isthe upper limit of the quantized amplitude level. Finally, σ is the standard deviation. Geometricfeatures like size information such as the area and equivalent radius are also utilized.
2.3.2. Test Algorithm Using Moment Invariant Features [21]Moment invariants have been frequently used as features for image processing, remote sensing,shape recognition and classification. Moments can provide characteristics of an object thatuniquely represent its shape. Invariant shape recognition is performed by classification in themultidimensional moment invariant feature space. Several techniques have been developed thatderive invariant features from moments for object recognition and representation. Thesetechniques are distinguished by their moment definition, such as the type of data exploited and
the method for deriving invariant values from the image moments. These moment invariantvalues are invariant with respect to translation, scale and rotation of the shape.
Seven of these shape descriptor values are computed from central moments through order threethat are independent to object translation, scale and orientation. Translation invariance isachieved by computing moments that are normalised with respect to the centre of gravity so thatthe centre of mass of the distribution is at the origin (central moments). Size invariant momentsare derived from algebraic invariants but these can be shown to be the result of a simple sizenormalisation. From the second and third order values of the normalised central moments a set ofseven invariant moments can be computed which are independent of rotation. The momentsused to construct the moment invariants are defined in the continuous but for practicalimplementation they are computed in the discrete form. Given a function f(x, y), these regularmoments are defined by the following (2).
∫∫ = dxdy y x f y x M q p
pq ),( (2)
Where, Mpq is the two-dimensional moment of the function f(x,y). The order of the moment is (p +q) where p and q are both natural numbers. For implementation in digital from this becomes (3):
),( y x f y x M y
q
x
p
pq ∑∑= (3)
To normalise for translation in the image plane, the image centroids are used to define the centralmoments. The co-ordinates of the centre of gravity of the image are calculated using the previousequation and are given by (4):
00
10
M
M x = and
00
01
M
M y = (4)
The central moments can then be defined in their discrete representation as (5):
∑∑ −−= y
q
x
p
pqy y x x )()( µ (5)
The moments are further normalised for the effects of change of scale using the following (6):
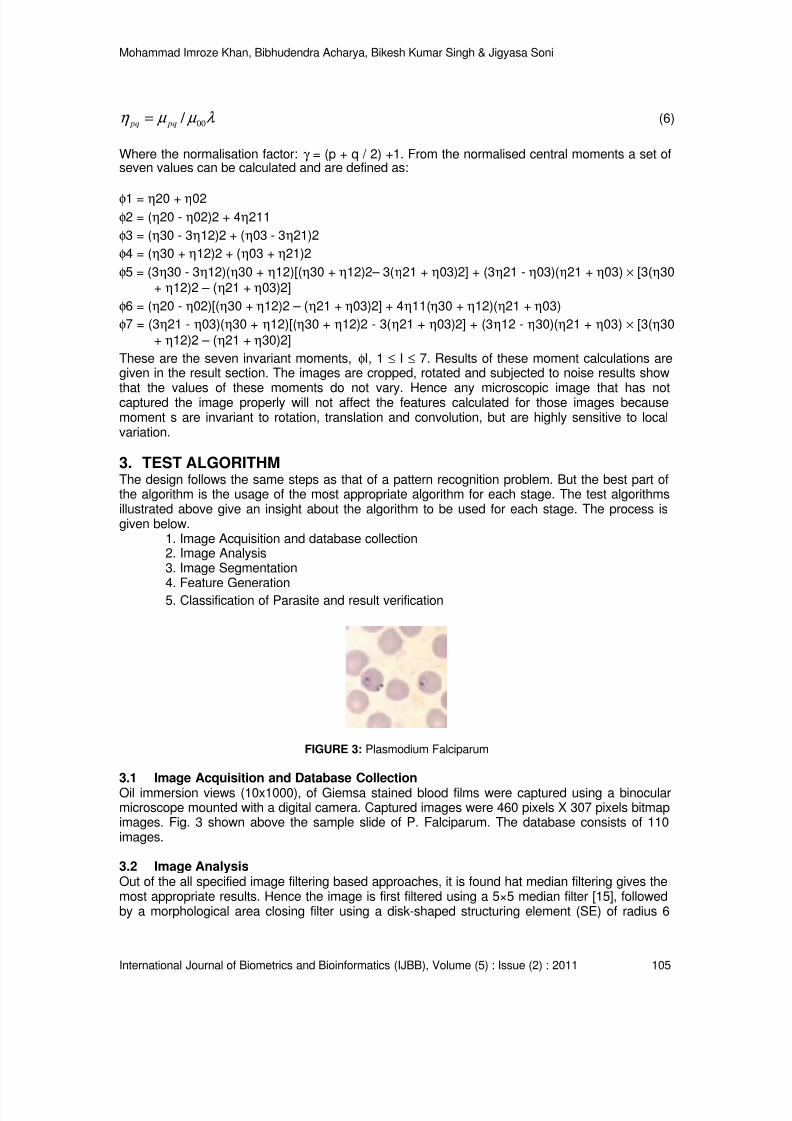
8/6/2019 International Journal of Biometrics and Bioinformatics IJBB_V5_I2
http://slidepdf.com/reader/full/international-journal-of-biometrics-and-bioinformatics-ijbbv5i2 85/133
Mohammad Imroze Khan, Bibhudendra Acharya, Bikesh Kumar Singh & Jigyasa Soni
International Journal of Biometrics and Bioinformatics (IJBB), Volume (5) : Issue (2) : 2011 105
λ µ µ η 00 / pq pq = (6)
Where the normalisation factor: γ = (p + q / 2) +1. From the normalised central moments a set ofseven values can be calculated and are defined as:
φ1 = η20 + η02φ2 = (η20 - η02)2 + 4η211
φ3 = (η30 - 3η12)2 + (η03 - 3η21)2
φ4 = (η30 + η12)2 + (η03 + η21)2
φ5 = (3η30 - 3η12)(η30 + η12)[(η30 + η12)2– 3(η21 + η03)2] + (3η21 - η03)(η21 + η03) × [3(η30+ η12)2 – (η21 + η03)2]
φ6 = (η20 - η02)[(η30 + η12)2 – (η21 + η03)2] + 4η11(η30 + η12)(η21 + η03)
φ7 = (3η21 - η03)(η30 + η12)[(η30 + η12)2 - 3(η21 + η03)2] + (3η12 - η30)(η21 + η03) × [3(η30+ η12)2 – (η21 + η30)2]
These are the seven invariant moments, φI, 1 ≤ I ≤ 7. Results of these moment calculations aregiven in the result section. The images are cropped, rotated and subjected to noise results show
that the values of these moments do not vary. Hence any microscopic image that has notcaptured the image properly will not affect the features calculated for those images becausemoment s are invariant to rotation, translation and convolution, but are highly sensitive to localvariation.
3. TEST ALGORITHMThe design follows the same steps as that of a pattern recognition problem. But the best part ofthe algorithm is the usage of the most appropriate algorithm for each stage. The test algorithmsillustrated above give an insight about the algorithm to be used for each stage. The process isgiven below.
1. Image Acquisition and database collection2. Image Analysis3. Image Segmentation
4. Feature Generation5. Classification of Parasite and result verification
FIGURE 3: Plasmodium Falciparum
3.1 Image Acquisition and Database CollectionOil immersion views (10x1000), of Giemsa stained blood films were captured using a binocularmicroscope mounted with a digital camera. Captured images were 460 pixels X 307 pixels bitmapimages. Fig. 3 shown above the sample slide of P. Falciparum. The database consists of 110images.
3.2 Image AnalysisOut of the all specified image filtering based approaches, it is found hat median filtering gives themost appropriate results. Hence the image is first filtered using a 5×5 median filter [15], followedby a morphological area closing filter using a disk-shaped structuring element (SE) of radius 6
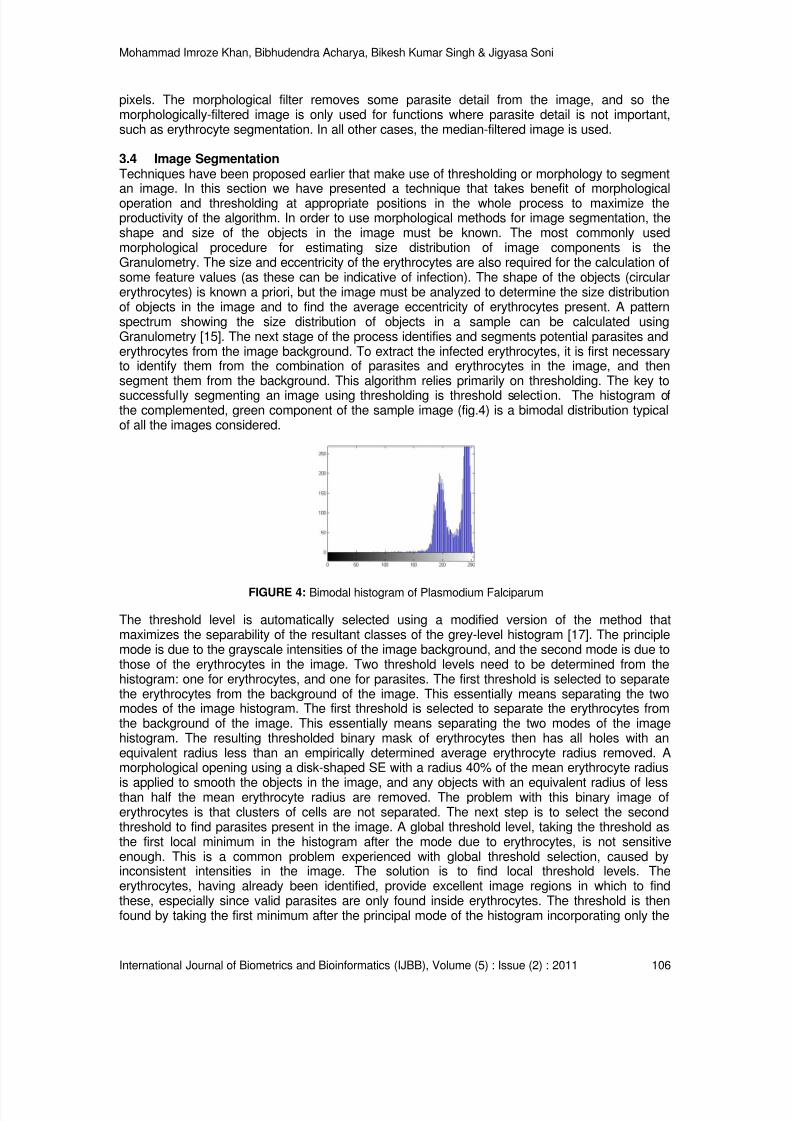
8/6/2019 International Journal of Biometrics and Bioinformatics IJBB_V5_I2
http://slidepdf.com/reader/full/international-journal-of-biometrics-and-bioinformatics-ijbbv5i2 86/133
Mohammad Imroze Khan, Bibhudendra Acharya, Bikesh Kumar Singh & Jigyasa Soni
International Journal of Biometrics and Bioinformatics (IJBB), Volume (5) : Issue (2) : 2011 106
pixels. The morphological filter removes some parasite detail from the image, and so themorphologically-filtered image is only used for functions where parasite detail is not important,such as erythrocyte segmentation. In all other cases, the median-filtered image is used.
3.4 Image SegmentationTechniques have been proposed earlier that make use of thresholding or morphology to segmentan image. In this section we have presented a technique that takes benefit of morphologicaloperation and thresholding at appropriate positions in the whole process to maximize theproductivity of the algorithm. In order to use morphological methods for image segmentation, theshape and size of the objects in the image must be known. The most commonly usedmorphological procedure for estimating size distribution of image components is theGranulometry. The size and eccentricity of the erythrocytes are also required for the calculation ofsome feature values (as these can be indicative of infection). The shape of the objects (circularerythrocytes) is known a priori, but the image must be analyzed to determine the size distributionof objects in the image and to find the average eccentricity of erythrocytes present. A patternspectrum showing the size distribution of objects in a sample can be calculated usingGranulometry [15]. The next stage of the process identifies and segments potential parasites anderythrocytes from the image background. To extract the infected erythrocytes, it is first necessaryto identify them from the combination of parasites and erythrocytes in the image, and thensegment them from the background. This algorithm relies primarily on thresholding. The key to
successfully segmenting an image using thresholding is threshold selection. The histogram ofthe complemented, green component of the sample image (fig.4) is a bimodal distribution typicalof all the images considered.
FIGURE 4: Bimodal histogram of Plasmodium Falciparum
The threshold level is automatically selected using a modified version of the method thatmaximizes the separability of the resultant classes of the grey-level histogram [17]. The principlemode is due to the grayscale intensities of the image background, and the second mode is due tothose of the erythrocytes in the image. Two threshold levels need to be determined from thehistogram: one for erythrocytes, and one for parasites. The first threshold is selected to separatethe erythrocytes from the background of the image. This essentially means separating the twomodes of the image histogram. The first threshold is selected to separate the erythrocytes fromthe background of the image. This essentially means separating the two modes of the imagehistogram. The resulting thresholded binary mask of erythrocytes then has all holes with anequivalent radius less than an empirically determined average erythrocyte radius removed. Amorphological opening using a disk-shaped SE with a radius 40% of the mean erythrocyte radius
is applied to smooth the objects in the image, and any objects with an equivalent radius of lessthan half the mean erythrocyte radius are removed. The problem with this binary image oferythrocytes is that clusters of cells are not separated. The next step is to select the secondthreshold to find parasites present in the image. A global threshold level, taking the threshold asthe first local minimum in the histogram after the mode due to erythrocytes, is not sensitiveenough. This is a common problem experienced with global threshold selection, caused byinconsistent intensities in the image. The solution is to find local threshold levels. Theerythrocytes, having already been identified, provide excellent image regions in which to findthese, especially since valid parasites are only found inside erythrocytes. The threshold is thenfound by taking the first minimum after the principal mode of the histogram incorporating only the
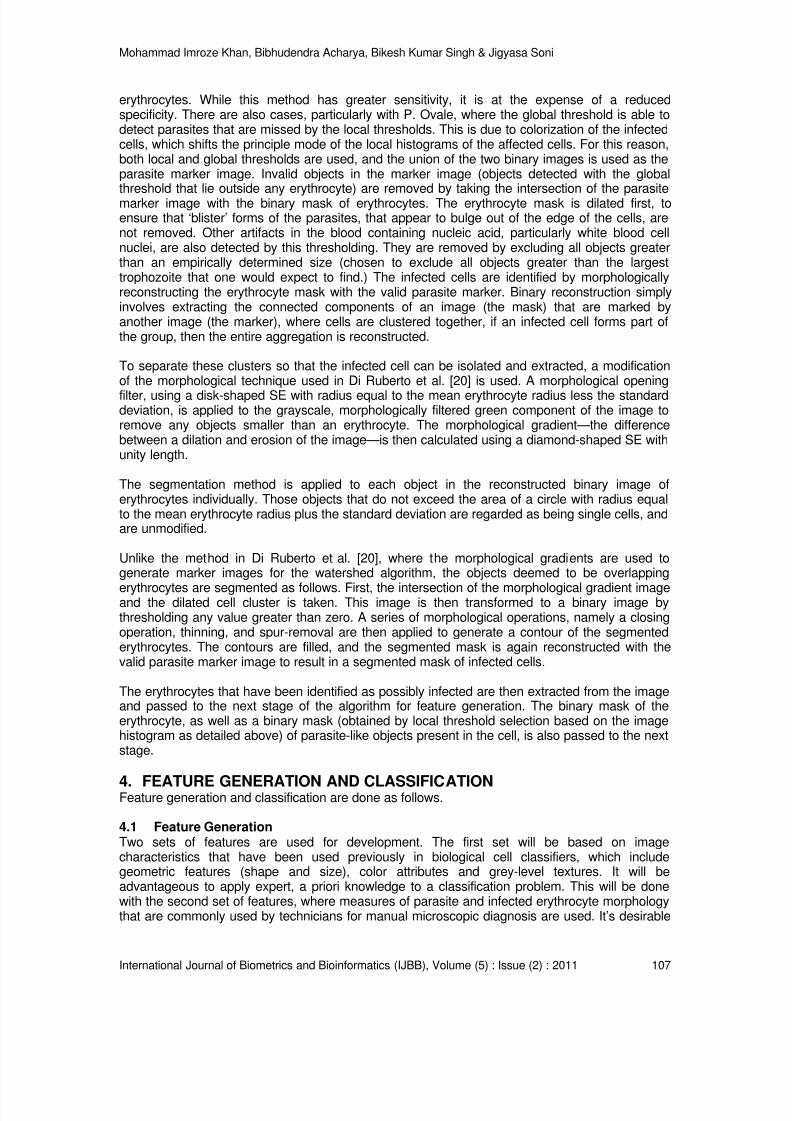
8/6/2019 International Journal of Biometrics and Bioinformatics IJBB_V5_I2
http://slidepdf.com/reader/full/international-journal-of-biometrics-and-bioinformatics-ijbbv5i2 87/133
Mohammad Imroze Khan, Bibhudendra Acharya, Bikesh Kumar Singh & Jigyasa Soni
International Journal of Biometrics and Bioinformatics (IJBB), Volume (5) : Issue (2) : 2011 107
erythrocytes. While this method has greater sensitivity, it is at the expense of a reducedspecificity. There are also cases, particularly with P. Ovale, where the global threshold is able todetect parasites that are missed by the local thresholds. This is due to colorization of the infectedcells, which shifts the principle mode of the local histograms of the affected cells. For this reason,both local and global thresholds are used, and the union of the two binary images is used as theparasite marker image. Invalid objects in the marker image (objects detected with the globalthreshold that lie outside any erythrocyte) are removed by taking the intersection of the parasitemarker image with the binary mask of erythrocytes. The erythrocyte mask is dilated first, toensure that ‘blister’ forms of the parasites, that appear to bulge out of the edge of the cells, arenot removed. Other artifacts in the blood containing nucleic acid, particularly white blood cellnuclei, are also detected by this thresholding. They are removed by excluding all objects greaterthan an empirically determined size (chosen to exclude all objects greater than the largesttrophozoite that one would expect to find.) The infected cells are identified by morphologicallyreconstructing the erythrocyte mask with the valid parasite marker. Binary reconstruction simplyinvolves extracting the connected components of an image (the mask) that are marked byanother image (the marker), where cells are clustered together, if an infected cell forms part ofthe group, then the entire aggregation is reconstructed.
To separate these clusters so that the infected cell can be isolated and extracted, a modificationof the morphological technique used in Di Ruberto et al. [20] is used. A morphological opening
filter, using a disk-shaped SE with radius equal to the mean erythrocyte radius less the standarddeviation, is applied to the grayscale, morphologically filtered green component of the image toremove any objects smaller than an erythrocyte. The morphological gradient—the differencebetween a dilation and erosion of the image—is then calculated using a diamond-shaped SE withunity length.
The segmentation method is applied to each object in the reconstructed binary image oferythrocytes individually. Those objects that do not exceed the area of a circle with radius equalto the mean erythrocyte radius plus the standard deviation are regarded as being single cells, andare unmodified.
Unlike the method in Di Ruberto et al. [20], where the morphological gradients are used togenerate marker images for the watershed algorithm, the objects deemed to be overlapping
erythrocytes are segmented as follows. First, the intersection of the morphological gradient imageand the dilated cell cluster is taken. This image is then transformed to a binary image bythresholding any value greater than zero. A series of morphological operations, namely a closingoperation, thinning, and spur-removal are then applied to generate a contour of the segmentederythrocytes. The contours are filled, and the segmented mask is again reconstructed with thevalid parasite marker image to result in a segmented mask of infected cells.
The erythrocytes that have been identified as possibly infected are then extracted from the imageand passed to the next stage of the algorithm for feature generation. The binary mask of theerythrocyte, as well as a binary mask (obtained by local threshold selection based on the imagehistogram as detailed above) of parasite-like objects present in the cell, is also passed to the nextstage.
4. FEATURE GENERATION AND CLASSIFICATIONFeature generation and classification are done as follows.
4.1 Feature GenerationTwo sets of features are used for development. The first set will be based on imagecharacteristics that have been used previously in biological cell classifiers, which includegeometric features (shape and size), color attributes and grey-level textures. It will beadvantageous to apply expert, a priori knowledge to a classification problem. This will be donewith the second set of features, where measures of parasite and infected erythrocyte morphologythat are commonly used by technicians for manual microscopic diagnosis are used. It’s desirable
8/6/2019 International Journal of Biometrics and Bioinformatics IJBB_V5_I2
http://slidepdf.com/reader/full/international-journal-of-biometrics-and-bioinformatics-ijbbv5i2 88/133
Mohammad Imroze Khan, Bibhudendra Acharya, Bikesh Kumar Singh & Jigyasa Soni
International Journal of Biometrics and Bioinformatics (IJBB), Volume (5) : Issue (2) : 2011 108
to focus on these features, because it is already known that they are able to differentiate betweenspecies of malaria.
4.2 Feature ClassificationThe final classification of an erythrocyte as infected with malaria or not, and if so, the species ofthe parasite, falls to the classifier. The classifier is a two-stage tree classifier, with an infectionclassified as positive or negative at the first node, and the species assigned at the second nodeas shown in fig. 5. The design of a tree classifier has the following steps: the design of a treestructure (which has already been assigned), the selection of features to be used at every node,and the choice of decision rule at each node [22]. The same type of classifier is used at bothnodes. Taking into account the fact that there is no guarantee that the classes are linearlyseparable, back propagation feed forward (BFF) neural networks is selected. The featuresselected for the first classifier are those that describe the colour and texture of the possibleparasites. The features used by microscopists to differentiate malaria species are selected forthe second classifier. The training goal is to minimize squared errors, and training is stoppedwhen the error of a validation set increased. This is done to avoid overtraining.
FIGURE 5: Structure of the tree classifier
5. RESULTS AND ANALYSISThe performance and accuracy of the algorithm are analyzed using two measures: sensitivity, theability of the algorithm to detect a parasite present; and positive predictive value (PPV), thesuccess of the algorithm at excluding non-infected cells. These values are expressed in terms oftrue positives (TP), false positives (FP) and false negatives (FN) as stated in equation 7:
FN TP
TP ySensitivit
+=
&FPTP
TPPPV
+= (7)
The algorithm has been tested on various malaria parasites. The results are summarized in thetable no. 1 at various stages of Image Processing as shown in fig. 6.
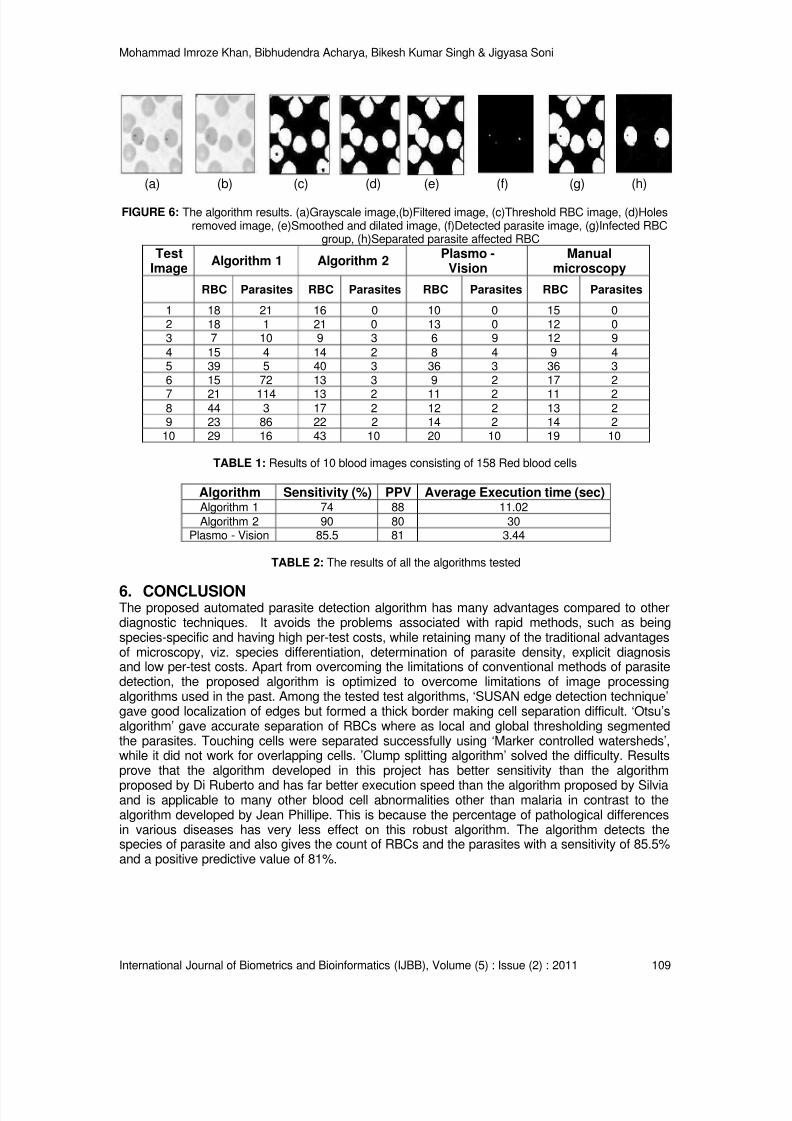
8/6/2019 International Journal of Biometrics and Bioinformatics IJBB_V5_I2
http://slidepdf.com/reader/full/international-journal-of-biometrics-and-bioinformatics-ijbbv5i2 89/133
Mohammad Imroze Khan, Bibhudendra Acharya, Bikesh Kumar Singh & Jigyasa Soni
International Journal of Biometrics and Bioinformatics (IJBB), Volume (5) : Issue (2) : 2011 109
(a) (b) (c) (d) (e) (f) (g) (h)
FIGURE 6: The algorithm results. (a)Grayscale image,(b)Filtered image, (c)Threshold RBC image, (d)Holesremoved image, (e)Smoothed and dilated image, (f)Detected parasite image, (g)Infected RBC
group, (h)Separated parasite affected RBC Test
ImageAlgorithm 1 Algorithm 2
Plasmo -Vision
Manualmicroscopy
RBC Parasites RBC Parasites RBC Parasites RBC Parasites
1 18 21 16 0 10 0 15 02 18 1 21 0 13 0 12 03 7 10 9 3 6 9 12 94 15 4 14 2 8 4 9 45 39 5 40 3 36 3 36 36 15 72 13 3 9 2 17 2
7 21 114 13 2 11 2 11 28 44 3 17 2 12 2 13 29 23 86 22 2 14 2 14 2
10 29 16 43 10 20 10 19 10
TABLE 1: Results of 10 blood images consisting of 158 Red blood cells
Algorithm Sensitivity (%) PPV Average Execution time (sec)Algorithm 1 74 88 11.02Algorithm 2 90 80 30
Plasmo - Vision 85.5 81 3.44
TABLE 2: The results of all the algorithms tested
6. CONCLUSIONThe proposed automated parasite detection algorithm has many advantages compared to otherdiagnostic techniques. It avoids the problems associated with rapid methods, such as beingspecies-specific and having high per-test costs, while retaining many of the traditional advantagesof microscopy, viz. species differentiation, determination of parasite density, explicit diagnosisand low per-test costs. Apart from overcoming the limitations of conventional methods of parasitedetection, the proposed algorithm is optimized to overcome limitations of image processingalgorithms used in the past. Among the tested test algorithms, ‘SUSAN edge detection technique’gave good localization of edges but formed a thick border making cell separation difficult. ‘Otsu’salgorithm’ gave accurate separation of RBCs where as local and global thresholding segmentedthe parasites. Touching cells were separated successfully using ‘Marker controlled watersheds’,while it did not work for overlapping cells. ’Clump splitting algorithm’ solved the difficulty. Resultsprove that the algorithm developed in this project has better sensitivity than the algorithm
proposed by Di Ruberto and has far better execution speed than the algorithm proposed by Silviaand is applicable to many other blood cell abnormalities other than malaria in contrast to thealgorithm developed by Jean Phillipe. This is because the percentage of pathological differencesin various diseases has very less effect on this robust algorithm. The algorithm detects thespecies of parasite and also gives the count of RBCs and the parasites with a sensitivity of 85.5%and a positive predictive value of 81%.
8/6/2019 International Journal of Biometrics and Bioinformatics IJBB_V5_I2
http://slidepdf.com/reader/full/international-journal-of-biometrics-and-bioinformatics-ijbbv5i2 90/133
Mohammad Imroze Khan, Bibhudendra Acharya, Bikesh Kumar Singh & Jigyasa Soni
International Journal of Biometrics and Bioinformatics (IJBB), Volume (5) : Issue (2) : 2011 110
7. REFERENCES
[1] World Health Organization. What is malaria? Facts sheet no 94.http://www.who.int/mediacentre/factsheets/fs094/en/.
[2] Foster S, Phillips M, Economics and its contribution to the fight against malaria. Ann TropMedParasitol 92:391–398, 1998.
[3] Makler MT, Palmer CJ, Alger AL, “A review of practical techniques for the diagnosis ofmalaria”. Ann Trop Med Parasitol 92(4):419–433, 1998.
[4] Bloland PB (2001) Drug resistance in malaria, WHO/CDS/CSR/DRS/ 2001.4. World HealthOrganization, Switzerland, 2001.
[5] Gilles H.M. “The differential diagnosis of malaria. Malaria. Principles and practice ofmalariology (Wernsdorfer W.H., McGregor I eds)”, 769-779, 1998.
[6] F. Castelli, G.Carosi, Diagnosis of malaria, chapter 9, Institute of Infectious and TropicalDiseases, University of Brescia (Italy).
[7] Baird J.K., Purnomo, Jones T.R. Diagnosis of malaria in the field by fluorescence
microscopy of QBC ® capillary tubes. Transactions of the Royal Society of TropicalMedicine and Hygiene; 86: 3-5, 1992.
[8] Anthony Moody, Rapid Diagnostic Tests for Malaria Parasites, Clinical MicrobiologyReviews,0893-8512/02/$04.00_0 DOI: 10.1128/CMR.15.1.66–78.2002, p. 66–78, Jan.2002.
[9] Brown A.E., Kain K.C., Pipithkul J., Webster H.K. “Demonstration by the polymerase chainreaction of mixed Plasmodium falciparum and P. vivax infections undetected byconventional microscopy”. Transactions of the Royal Society of Tropical Medicine andHygiene; 86: 609-612, 1992.
[10] Jean-Philippe Thiran, Benoit Macq, “Morphological Feature Extraction for the Classificationof Digital Images of Cancerous Tissues”. IEEE Transaction on Biomedical Engineering,Vol. 43, no. 10, October 1996.
[11] Di Ruberto, A. Dempster, S. Khan, and B. Jarra. “Automatic thresholding of infected bloodimages using granulometry and regional extrema”. In ICPR, pages 3445–3448, 2000.
[12] Silvia Halim, Timo R. Bretschneider, Yikun Li, “Estimating Malaria Parasitaemia from BloodSmear Images”. 1-4244-0342-1/06/$20.00 ©IEEE, ICARCV 2006.
[13] Selena W.S. Sio, Malaria Count, “An image analysis-based program for the accuratedetermination of parasitaemia, Laboratory of Molecular and Cellular Parasitology”,Department of Microbiology, Yong Loo Lin School of Medicine, National University ofSingapore. May 2006.
[14] F. Boray Tek, Andrew G. Dempster and Izzet Kale, “Malaria Parasite Detection inPeripheral Blood Images”, Applied DSP & VLSI Research Group, London, UK, Dec 2006.
[15] Rafeal C. Gonzalez, Richard E. Woods, Digital Image Processing, 2nd Edition, PrenticeHall, 2006.
[16] S. M. Smith, J. M. Bardy, “SUSAN - A New Approach to Low Level Image Processing”,International Journal of Computer Vision, Volume 23, and Issue 1 Pages: 45 – 78, may1997.
[17] N. Otsu, “A threshold selection method from gray-level histograms”. IEEE Transactions onSystems, Man and Cybernetics, 9(1):62.66, 1979.

8/6/2019 International Journal of Biometrics and Bioinformatics IJBB_V5_I2
http://slidepdf.com/reader/full/international-journal-of-biometrics-and-bioinformatics-ijbbv5i2 91/133
Mohammad Imroze Khan, Bibhudendra Acharya, Bikesh Kumar Singh & Jigyasa Soni
International Journal of Biometrics and Bioinformatics (IJBB), Volume (5) : Issue (2) : 2011 111
[18] J.N. Kapur, P.K. Sahoo, and A.K.C. Wong, “A new method for gray-level picturethresholding using the entropy of the histogram”. Graphical Models and Image Processing,29:273.285, 1985.
[19] T.W. Ridler and S. Calvard, “Picture thresholding using an iterative selection method”. IEEETransactions on Systems, Man and Cybernetics, SMC-8:630.632, 1978.
[20] Di Ruberto C, Dempster A, Khan S, Jarra B, “Analysis of infected blood cell images usingmorphological operators”. Image Vis Comput 20(2):133–146, 2002.
[21] M. K. Hu, “Visual pattern recognition by moment invariants”," IRE Trans. InformationTheory, vol. 8, pp. 179{187, 1962
[22] Mui JK, Fu K-S, “Automated classification of nucleated blood cells using a binary treeclassifier”. IEEE Trans Pattern Anal Machine Intell 2(5):429–443, 1980
8/6/2019 International Journal of Biometrics and Bioinformatics IJBB_V5_I2
http://slidepdf.com/reader/full/international-journal-of-biometrics-and-bioinformatics-ijbbv5i2 92/133
Rajeshwari D Sanakal & Basappa B Kaliwal
International Journal of Biometrics and Bioinformatics (IJBB), Volume (5) : Issue (2) : 2011 111
Vancomycin Resistance Genes in Various Organisms- AnInsilico Study
Rajeshwari D Sanakal [email protected] Bioinformatics Infrastructure Facility Centre Post-Graduate Department of Biotechnology and Microbiology Karnatak University,Dharwad- 580003 Karnataka, India
Basappa B Kaliwal [email protected] Professor,Bioinformatics Infrastructure Facility Centre,Post-Graduate Department of Biotechnology and Microbiology Karnatak University,Dharwad – 580003 Karnataka, India
Abstract
Vancomycin, a glycopeptide antibiotic is widely used to treat many serious infections caused bygram positive bacteria particularly, methicillin resistant Enterococci and Staphyllococcus sp.Emergence of commonly acquired resistance in bacterial pathogens has lead to clinicalcomplications and threat to human health. The resistance in these organisms is conferred byseveral vancomycin resistance genes (Van) like VanA, VanB, VanD, VanC and VanM.Knowledge of presence of Van genes in various organisms was felt necessary prior to molecularinvestigation. Therefore, in this insilico study screening was carried out for presence of Van genelike sequences using the DNA sequence information available in biological databases. Resultsindicated that many pathogenic and non-pathogenic bacteria, fungal, viral and protozoanpathogens, other organisms like fishes, mammals possess Van like sequences. The presentfindings provide first hand information on extent of presence of Van sequences in manyorganisms and their phylogenetic relationship with each other. Further investigation on thesignificance of these genes is emphasized using molecular and bioinformatics tools to helpminimize acquired resistance in antibiotics.
Keywords : Van Gene, Similarity, Sequence Analysis, Antibiotics, Enterococci, Phylogenetic Analysis
1. INTRODUCTIONThe post surgical and hospital acquired infections have become life threatening diseases andlead to many clinical complications [1]. The development of antibiotic resistance in communityacquired bacterial pathogens has become matter of great concern. Some opportunistic humanpathogens like Entrococci, Staphylococci, and Clostridium sp. cause many diseases like skininfections, cellulitis, folliculitis, pneumonia, meningitis, endocarditis, bacteremia and sepsis.Infections that occur during hospitalization are called as nosocomial infections. These infectionsare dangerous as they exhibit resistance to methicillin and glycopeptide antibiotics.
Vancomycin and teicoplanin are glycopeptide antibiotics effective against majority of grampositive bacteria, particularly against multiple drug resistant Enterococci and Staphylococci whichare resistant to β-lactum antibiotics [2]. These pathogens have acquired resistance to thesecompounds by virtue of their intrinsic property especially in clinical isolates. This leads to severecomplications in immuno compromised as well as surgical patients. vancomycin resistanceenterococci (VRE) was first reported in 1988 in Europe [3,4] and USA [5]. In Asia nosocomialinfections in hospitals have been reported from China, Japan, South Korea. Taiwan and Thailand[6,7,8,9]. Similarly, resistance to glycopeptides have been reported in S. aureus in Japan [10] and
8/6/2019 International Journal of Biometrics and Bioinformatics IJBB_V5_I2
http://slidepdf.com/reader/full/international-journal-of-biometrics-and-bioinformatics-ijbbv5i2 93/133
Rajeshwari D Sanakal & Basappa B Kaliwal
International Journal of Biometrics and Bioinformatics (IJBB), Volume (5) : Issue (2) : 2011 112
USA [11]. In India emergence of vancomycin resistance S.aureus was analysed [12] and theVancomycin resistant gene in S.aureus was detected first time [13].
Vancomycin binds with the C-terminal D-alanyl-D-alanine (D-Ala-D-Ala) residue of pentapeptideand blocks the addition of precursors by transglycosylation to peptidoglycan chain and inhibitscross linking of cell wall by transpeptidation[14]. Resistance to vancomycin is caused bysynthesis of precursors with low affinity for these antibiotics conferred by operons present on Vangene clusters that encode enzymes which synthesize low affinity precursors wherein C-terminalD-Ala residue is replaced by D-lactate (D-Lac) or D-serine (D-Ser) that modify vancomycinbinding site. These genes confer high or low level resistance to vancomycin and teicoplaninwhich may be inducible or constitutive. VanA type gene confers inducible high levels of resistanceto vancomycin and teicoplanin. Inducible various levels of resistance to vancomycin andsusceptibility to teicoplanin is conferred by type VanB [15]. VanC confined to Enterococcus gallinarum is intrinsically resistance to low levels of vancomycin but susceptible to teicoplanin[16]. VanC resistance expressed constitutively or inducibly by production of peptidoglycanprecursor ending in D-Ser [17]. VanD type confers resistance to intermediate levels ofvancomycin and low levels of teicoplanin that is expressed constitutively. VanD is nottransferable to other Enterococci and that distinguishes it from VanA and VanB [18,19].
Van A has a Tn3-like transposon with a cluster of seven genes (VanR, vanS, VanH, Van A,
VanX, VanY and VanZ) [20]. VanA is ligase of broad substrate specificity [21] responsible forproduction of dipeptidase which is incorporated in peptidoglycan precursor in place of D-alanyl – D alanine. VanA is produced by VanH dehydrogenease [22]. The VanR and VanS genes encodeVanR-VanS regulatory system which activate transcription of VanH, VanA, VanX in presence ofvancomycin. These proteins are necessary for vancomycin resistance where the vancomycinbinding site is altered. VanY encodes an accessory resistance protein D, D-carboxypeptidase,insensitive to the activity of β-lactams like penicillin G that hydrolyses the C-terminal residuethereby preventing the translocation of D-Ala D-Ala containing precursors to cell surface [23].VanZ-is likely teicoplanin resistant protein encoding gene [2].VanB ligase gene cluster is dividedin to three sub types VanB1, B2, B3 located on transposon Tn 5382 resulted from conjugation ofplasmids [24,25]. Another glycopeptide resistance gene ,VanM reported from China [8] encodesD-Alanine:D-Lactase ligase and is related to VanA, VanB and VanD gene and transferred byconjugation.
As there is increase in emergence and rapid dissemination of resistance to vancomycin that hasbecome challenge to treat human diseases, it was felt necessary to screen presence ofvancomycin resistance or vancomycin resistance like DNA sequences that are present in variousorganisms prior to carry out molecular characterization. Therefore, in this Insilico study presenceand extent of Van genes has been analysed with the sequence information available in biologicaldatabases and also by construction of phylogenetic tree. Possibly, this would provide importantclues before initiating any treatment with glycopeptide or other antibiotics and understand thenature of dissemination of antibiotics resistance in various organisms.
2. PRELIMINARIES
2.1 Methodology
Vancomycin resistance genes from Enterococcus faecalis viz.,VanA (VanR, VanS, VanH, VanA,VanX, VanY and VanZ), VanB, VanC, VanD and VanM were selected using National Centre forBiotechnology Information (NCBI) genome search with following accession numbers. VanA(VanR, VanS, VanH, VanA, VanZ, VanY)-M97297.1 and (for VanY &VanZ) -AB563188.1, Van B-U00456, VanC - AF162694.1, VanD-AF130997.1, and VanM-FJ349556. The individual geneswere screened using Basic Local Alignment Search Tool (BLASTn) tool [26] against NCBI’snonredundant nucleotide database for pairwise alignment in the month of December, 2010(BLASTn is nucleotide sequence similarity search algorithm that aligns matches with querysequence with the existing nucleotide sequence database). The sequences produced withsignificant alignments with higher score, percent identity ≥ 70% and percent query coverage ≥
8/6/2019 International Journal of Biometrics and Bioinformatics IJBB_V5_I2
http://slidepdf.com/reader/full/international-journal-of-biometrics-and-bioinformatics-ijbbv5i2 94/133
Rajeshwari D Sanakal & Basappa B Kaliwal
International Journal of Biometrics and Bioinformatics (IJBB), Volume (5) : Issue (2) : 2011 113
4% were considered for the study. Further, the sequence information of E.faecalis and S.aureas were mainly used for comparison. The vancomycin resistance like gene sequences found invarious organisms were selected after pairwise alignment with help of BLASTn tool [27].
Phylogenetic analysis is an evolutionary investigation to carry out comparison in varioussequences especially during the evolution among different organisms. The closely relatedsequences are placed in neighboring branches while distantly related sequences are placed far inphylogenetic tree. In our present study,a total of 28 sequences from various organisms wereused for the analysis. (Only few organisms representing from various groups, that weresignificantly homologous to van resistance genes were considered for analysis). Hence theselected sequences of all organisms were analyzed phylogenetically to determine how Vangenes have been associated during evolution and compared. The Phylogenetic tree wasconstructed using distance based Neighbor-Joining method using percent identity throughCLUSTALW tool[28]. Flow chart (Fig.1) depicts the method of screening of vancomycin genes invarious organisms.
2.2 Results and DiscussionResults of screening of all the Van genes is presented in Table No.1-5 ,Graphs 1-5 and Fig.2.The results indicated that there were around 37 various organisms that were homologous to Vangenes. Most of the genes were identical in around 7 organisms around (93-100% identity) in
Streptococcus sp ., Bacillus sp. and Paenibaillus sp., Eggerthella lenta, Clostridium sp.,Ruminococcus sp . apart from E.faecalis and S.aureus . Van R found homologous in around 11species viz., (Table -1-4, Graphs-1- 5). VanA, VanH, VanS, VanX, VanY and VanZ which arecomponents of VanA gene clusters individually were homologous (70-100%) in differentorganisms like Streptococcus gallolyticus , S.haemolyticus, Paenibacillus thiaminolyticus,Paenibacillus apiaris , Bacillus cereus, B.circulans, B.thurungiensis, B.clausil, Eggerthella lenta,and Ruminococcus sp .. VanC and VanD recorded homologousness only in 4 species. Van Mwas recorded in 14 organisms apart from Enterococcus species while Streptococcus suis,Lactococcus lactis, Lactococcus garvieae, Lactobacillus salivarius, Tetragenococcus halophilus displayed homology with VanY and VanM genes (Table- 1-4, Graphs-1,2 and 3). Further,VanC, VanD and VanZ showed comparatively lesser similarity with VanA and VanB genes.Interestingly, VanZ was present in Mus musculas, Rattus norvegicus, Human Immuno deficiencyvirus-1(HIV-1) isolates from Belgium and USA envelope glycoprotein and Schistsoma masoni
(Table-4-5,Graphs 4-5). Surprisingly, the part of DNA sequences of various organisms whichwere homologous to Vancomycin genes also ranged from Thermopiles to Aspergillus sp.,Haemophilus influenzae , Plamodium vivax and P.falciparam, Trypanosoma brunie , Salmonella enterica and Danio verio (zebra fish), Taeniopygia guttata (zebra finch), Gallus gallus (domesticated fowl) and Monodelphis domestica (marsupial).
Clostridium species, Streptococcus sp., Paenibacillus thiaminolyticcus, Paenibacillus apiarius,Paenibacillus popillae, Ruminococcus sp, Eggerthealla lenta, Bacillus circulans, Staphylococcus gallolyticus showed identity with VanA, VanB, VanM and VanD genes(Table- 3-4, Graphs 3-4).Other organisms like Monodelphis domestica, Rattus novegicus, Mus musculas, Aspergillus nidalans, Gallus gallus, Staphylococcus bovis, Anophelis gambaei, Trypanosoma brunei gambiense, Plasmodium falcipuram, P.Vivox, Salmonella enterica, Haemophilus influenzae,Schistosoma masoni, Bacillus thuringiensis , (Table- 3-5, Graphs 3-5 ) showed similarity with
VanA, VanY, VanZ and VanB. Presence of VanC was limited only to Streptococcus sp. andclostridium sp. apart from Enterococcus sp. (Table- 1and 3, Graphs- 1and 3 ).
The phylogenetic tree (Fig.2) of vancomycin resistance gene is categorized into 8 major clads onthe basis of their evolutionary distances by Neighbor-Joining (NJ) method using percent identity.It is depicted in the NJ evolutionary tree that first clad has monoclad of VanC of Enterococcus gallanarium with a evolutionary distance of 1.27 (gi-AF162694) which is distantly related to VanAof Enterococcs faecalis . clad 2 is divided into two sub-clads with distance of 1.25 and 2.75consisting VanZ of Enterococcus faecalis (gi-M97297.1) and Lactococcus lactis (gi-2467210)respectively that are closely related to each other.Further, clad 3 is sub divided into two
8/6/2019 International Journal of Biometrics and Bioinformatics IJBB_V5_I2
http://slidepdf.com/reader/full/international-journal-of-biometrics-and-bioinformatics-ijbbv5i2 95/133
Rajeshwari D Sanakal & Basappa B Kaliwal
International Journal of Biometrics and Bioinformatics (IJBB), Volume (5) : Issue (2) : 2011 114
branches with one branch having VanS (gi-M97297.1) with evolutionary distance of 2.42 andVanZ from Taiwan(gi-312836941) with distance of 0.64.The other branch is depicted with VanRand VanY with 1.83 and 3.17 distance values respectively (gi-M97297.1). Clad 4 is representedby three subclads with evolutionary distance of 0.39,1.71, and 2.95 by HIV-1(gi-308743091),Haemophilus influenzae (gi-CP000671.1) and VanM (gi-220901852) respectively.
The internal clad 5 is sub grouped into A and B . Group A has 6 branched sub-clads with highlyhomologous VanA (gi-M97297.1) and S.aureus (AE017171.1) with distance of 0.41. Further, it isbranched into sub-clads having Bacillus circulans (gi-6448487,distance-0.49), P.thiaminolyticus (gi-AY926880.2, distance-0.58), P.apiarius (gi-50082942,distance-0.84) and Staphylococcus haemolyticus (gi- 222159958, distance-0.33). Group B is sub divided into 5 clads withEggerthella lenta (gi-AY655718.2) highly homologous with Ruminococcus sp.(gi-56123451) andclostridium sp.(gi-56123455) with evolutionary distances of 0.25 and VanB (gi-U00456.1)with0.32 and S.bovis (gi-1262410) with 0.76 respectively. Clad 6 has monoclads VanD (gi-M97297.1) with 2.24 value of distance.
Later, clad 7 has subdivided into 4 clads comprising of VanX (gi-M97297.1), VanH(gi-M97297.1),Salmonella enterica (gi-M97297.1)., and Danio rerio gene(gi-197333707) with distance of0.59,2.35, 0.42 and 2.90 respectively. Lastly, clad 8 is having two sub-clads with Bacillus thurungiensis and Asperigillus sp. with distance of 0.89 and 3.08.It is indicated in the phylogenetic
tree (Fig.2) that VanA, VanB are more homologous with various organisms like Streptococcussp. Staphyllococcus sp., Bacillus sp., Paenibacillus sp., Ruminococcus sp., Clostridium sp.compared to VanD. HIV-1, Haemophilus influenzae and Lactococcus sp. are homologous toVanS, VanY VanZ and VanM. Further, VanX, VanH are homologous to Salmonella enterica andDanio rerio (Zebra fish) further corroborating the pairwise comparison. Moreover, VanCAsparigillus sp. and Bacillus thurungiensis showed distant relationship with VanA and VanB.
The presence and significance of Van genes in various species is discussed as follows.
Streptococcus spTable-1 and Graph-1 show Streptococcus gallolyticus, Streptococcus pneumonia, Streptococcus thermophilus, Streptococcus suis, and S. bovis organisms’ sequences that have identity of 75-95% with VanA, VanB, VanC, VanD and VanM genes of Entercoccus sp.. Streptococcus
pnemoniae, S. bovis, S.gallolyticus cause acute sinusitis, meningitis, bacteremia, sepsis,endocarditis in humans while S.thermophilus is non pathogenic. Antibiotics like pencillin G orCentrixone are administrated to treat these diseases. However, these have shown to haveacquired glycopeptide resistance in our study [29] .
Staphylococcus and Lactococcus spIt is known that S.aureus has already acquired vancomycin resistance[10] and hence underpresent investigation it is identical with Van genes (Fig.2) . Further it is depicted that S.aureus isnot similar to VanC type, indicating VanC has quite different capacity of resistance than VanAand VanB. Further, S.haemolyticus (VanA-100% and VanM-84% identity) has homologies withVan gene (Table-2, Graph-2). It is pathogenic as it causes endocarditis , and also methicillinresistant. This resistance may be due to Insertion Sequences (ISs) homologous to S.aureus. S.haemolyiticus showing resistance to Van gene may be a difficult to treat case of nosocomial
infections [30].
In Lactococcus sp . VanY and VanM type genes are found (Table-2,Graph-2). Lactococcus sp .are used in food processing and dairy industry and also as probiotics (Lactococcuslactis,Tetragenococcus halophilus). While some are animal pathogens (Lactococcus garviae ),some also opportunistic pathogens causing endocarditis and cholangitis in immunocompetentpatients [31,32] and have been isolated from clinical samples of blood, skin lesions and urine[33].These are administered with extended spectrum beta-lactam antibiotics like tazobactum.However, in our study it is indicated that both Lactococcus lactis and Lactococcus garviae have
8/6/2019 International Journal of Biometrics and Bioinformatics IJBB_V5_I2
http://slidepdf.com/reader/full/international-journal-of-biometrics-and-bioinformatics-ijbbv5i2 96/133
Rajeshwari D Sanakal & Basappa B Kaliwal
International Journal of Biometrics and Bioinformatics (IJBB), Volume (5) : Issue (2) : 2011 115
VanY and VanM sequence homologies. Perhaps, it indicates that there may be possiblesynergism towards resistance in presently administered antibiotics.
Paenibacillus spPaenibacillus strains have been reported to have VanA and VanB operons [34]. Further, theresults (Table-3,Graph-3) obtained in our findings corroborate the report and indicate that all thethree species of Paenibacillus viz P.thiaminolyticus, P.apiaris and P.popillae are having identity of80-87% with the newly reported vanM gene. Perhaps the soil bacterium and pest controlpathogens of this class that have Van comparable genes may be derived from common ancestoror may be integrated through conjugation [8]. Though P.thiaminolyticus is environmental bacteriait is reported to cause human disease in hemodialysis patients [35]. Therefore great care has tobe taken by clinicians while prescribing vancomycin in haemodialysis patient as Paenibacillus sp. have acquired Van resistance gene.
Baccillus spB. cereus, B. Clausil , B. Circulans, Baccillus thurungiensis, B. and Weihenstephanesis haveidentity with VanA, VanD and VanM and VanY genes in the results (Table-3, Graph- 3). Usuallythese species are harmless, beneficial as pest control agents, food processing agents, and usedas probiotics [36]. However, B. cereus causes vomiting and diarrhea due to food contaminationand also skin infections [37]. B. Clausil causes gastrointestinal infections and is reported as
methicillin resistant, [38]. Further, B. circulans has more number of Van resistance genes, whichis marine pathogen [39]. Perhaps, the findings at hand provide clue that through the water bodiescontaminated with human waste may synergistical ly disseminate the antibiotic resistance tomany pathogens. Hence, there should be proper management of human waste.
Clostridium spThe Clostridium sp. have shown greater similarity with most of the Van genes in our findings. Theantibiotics which is effectively used to control clostridium is metronidazole. vancomycin is secondline therapy if there is no response to metronidozole. But, the similarity results observed with allthe Van genes in this sp. (Table-4, Graph-4) indicate that clostridium too has acquired resistanceto vancomycin gene. The diseases and deaths due to Clostridium species (C. difficle, and C.Sordellii) infections are associated with wide antibiotics usage [40,41]. VanR, VanS ,VanA ,VanX,VanY and ,VanB, and VanM genes have identity (70-95%) with Ruminococcus sp. (Table-
4,Graph 4). The Ruminococcus sp. are anaerobic, cellulytic bacteria found usually in the rumen ofcattle, sheep, goats and human large intestine. Presently, these do not seem to pose any threatto human as these are non pathogenic.
Other MicroorganismsVan resistance genes from VanS, VanA, VanH, VanX, VanZ, VanB, and VanM are havingsimilarity with Eggerthella lenta (Table-4,Graph-4) sequences. It is anaerobic organism present inhuman intestinal flora found to cause anaerobic spondylodiscitis [42] which is infection ofintervertebral disc and adjoining the vertebral bones. Besides, it is also responsible forpolymicrobial blood stream infection and bacteremia [43]. Eggerthella sp. are reported to besensitive to penicillin [44]. But, in this study Eggerthella lenta has shown similarity up to 72-95%with VanA, VanB, and VanM genes that are responsible for vancomycin resistance. E. lenta alsoinfectious in following cases of post gynecological surgery, chrrioamniotitis, appendicitis and
cutaneous abscess. Therefore, clinicians should carefully advice the antibiotics wherein E. lenta may also pose threat to life of patient. Further, similarity of VanZ gene with pathogenic HIV-1isolate from Belgium and USA envelope glycoprotein and Schistosoma masoni is depicted in ourstudy (Table-1,Graph-4). It is noted that VanZ may confer resistance to teicoplanin antibioticswhere the functions of VanZ are not clearly revealed [45]. Surprisingly, results under presentinvestigation also indicated the presence of VanR, VanH,VanY type genes in (Table-4,Graph– 4)Haemophilus influenzae (influenza virus), Salmonella enterica (a gram negative bacteria),Asperigillus sp.(pathogenic fungi) and VanY type in Trypanosoma Brunei. Plasmodium vivax and P.falciparum are reported to account for 65% of malaria cases in Asia and south America.Interestingly, in this study P.vivax and P.falciparum show homologies to VanB (100% identity)
8/6/2019 International Journal of Biometrics and Bioinformatics IJBB_V5_I2
http://slidepdf.com/reader/full/international-journal-of-biometrics-and-bioinformatics-ijbbv5i2 97/133
Rajeshwari D Sanakal & Basappa B Kaliwal
International Journal of Biometrics and Bioinformatics (IJBB), Volume (5) : Issue (2) : 2011 116
and VanY (93% identity, Table-5, Graph-5) respectively. This is probably related to modificationin host-parasite interaction mechanism. As the pathogen is protozoan and transfer of resistancegenes from bacteria cannot be expected [14]. However, P.vivax and P.falciparum have beenmysterious and posing resistance to commonly used antimalarial drug chloroquinine, which isincreasing problem around the world [46].
Higher OrganismsHigher organisms viz., Anophelis gambiae (malaria spreading mosquito), Danio verio (Zebrafish),Mus musculas [rodent), Rattus norvegius (rat), Taeniopygia guttata (zebra finch), Gallus gallus (domesticated fowl), Monodelphis domestica (marsupials) have presented higherhomologies with VanB, VanR ,VanH, VanX ,VanY and VanZ genes up to 80-94% identity ofsequences (Table-5, Graph-5). Presence of single gene from Van gene clusters in any organismsmay not contribute for resistance to vancomycin. The presence of glycopeptide resistance genesequences in all above diverse organisms is unclear and need to unmask behavior of organismstowards the important antibiotics. Perhaps, drug pressure is believed to be responsible for theemergence of drug resistance in pathogens.
In our results, the observation of similarity with Van resistance genes in unrelated [nonEnterococci sp.) organisms and as well as in the organisms where glycopeptides are notadministered, may be attributed for having common ancestral origin with Van gene clusters, that
might have evolved independently [8] (Fig.2). Further, it is also reported that biopesticide,P.popillae widely used for agricultural purposes already has Van gene and might have servedas donor of Van gene and has impact on bacterial resistance [47,1] in human pathogens.Genetic variations are responsible for different glycopeptide resistance types, which are presenton transferable elements in Enterococcus and Staphylococcus sp. This has lead to emergence ofseveral types of Van resistance genes . Dissemination of glycopeptide resistance to otherbacteria has been evident with example of E.faecalis to S.aureus [48] because of absence ofbarriers for heterospecific expression of genes [14]. Further the phylogenetic analysis of Vangenes has also justified BLAST (Pairwise alignment) results.
It may be noted that some of the organisms have Van resistance gene even though vancomycinis not administered. It is observed that vancomycin resistance was inducible to Enterococcus faecalis when exposed to vancomycin [49]. Probably presence of Van genes may be attributed to
this fact .In our investigation presence of Van like sequences in other organisms may indicatechange in the nature of their cell wall. Studies made in S.aureus have provided evidence thatglycopeptide resistant organisms have thicker, more irregular cell walls than the glycopeptidessusceptible ones [50].Probably this would pose resistance to frequently used different antibiotics.
2.3 ConclusionOur findings indicate presence of vancomycin resistance like DNA sequences in variousorganisms irrespective of species and which may be pose synergistic resistance to presentlyused antibiotics. Hence the need of molecular characterization and detailed bioinformaticsinvestigation of glycopeptide resistance genes in pathogenic, commercially important organismsand animals is emphasized. A continuous surveillance can be warranted to check the emergenceof glycopeptide resistance in various organisms. Probably this would facilitate to minimizeindiscriminate use of many antibiotics all over the world and pave new ways to find alternative
measures to combat the human diseases.
AcknowledgementThe authors are grateful to Department of Biotechnology, Ministry of Science and Technology,Government of India, New Delhi, for funding the Bioinformatics Infrastructure Facility project andgranting the Research Associateship(RA) and Karnatak University,Dharwad for providing thefacilities.
8/6/2019 International Journal of Biometrics and Bioinformatics IJBB_V5_I2
http://slidepdf.com/reader/full/international-journal-of-biometrics-and-bioinformatics-ijbbv5i2 98/133
Rajeshwari D Sanakal & Basappa B Kaliwal
International Journal of Biometrics and Bioinformatics (IJBB), Volume (5) : Issue (2) : 2011 117
3. REFERENCES1. S.Mendez-Alvarez,Xiomara, Perez-Hernandez,F.Claverie-Martín, “Glycopeptide resistance
in Enterococci” , Internatl Microbiol , Vol. 3,pp.71–80, 2000.
2. Reynolds. P.E, “Structure, Biochemistry and Mechanism of Action of glycopeptideantibiotics”,Eur.J.clin.Microbiol.Infect.Dis., Vol. 8(11),pp.943-950,1989.
3. R.Leclercq, E.Derlot., J.Duval, P.Courvalin, “Plasmid-mediated resistance to Vancomycinand teicoplanin in Enterococcus faecium” . N Engl J Med. Vol. 21,319(3),pp157– 161, 1988.
4. A.H.Uttley, C.H.Collins, J .Naidoo, and R.C.George., “Vancomycin resistant enterococci”,Lancet , Vol. 1, no. 8575-76, pp. 57-58. 1988.
5. D.F.Sahm, J.Kissinger, M.S.Gilmore, P.R.Murray, R. Mulder, J. Solliday, and B. Clarke,“In vitro susceptibility studies of Vancomycin resistant Enterococcus faecalis” , Antimicrob.Agents Chemother, Vol.33,pp.1588-1591, 1989.
6. N.Fujita, M. Yoshimura, T. Komori, K.Tanimoto, and Y. Ike, “First report of the isolation ofhigh-level Vancomycin-resistant Enterococcus faecium form a patient in Japan”,AntimicrobAgents Chemother., Vol.42(8),2150, 1998.
7. Y.Ozawa, K .Tanimoto ,T Nomura, M.Yoshinaga, Y.Arakawam, and Y. Ike, “Vancomycin-resistant Enterococci in humans and imported chickens in Japan”. AppI. Environ.Microbiol., Vol.68, pp.6457-6461, 2002.
8. X.Xu , D.Lin., G.Yan., X.Ye, S.Wu., Y .Guo., D.Zhu, F.Hu, Y.Zhang, F.Wang., G.A.Jacobyand M.Wang, “VanM, a New Glycopeptide Resistance Gene Cluster Found inEnterococcus faecium ”, Antimicrobial Agents and Chemotherapy, pp.4643-4647, Vol.54,No. 11. 2010.
9. B.H. Zheng, Y.H.Tomita, S .Xiao,.Y.Wang. Y.Li and Y.Ike. “Molecular characterization ofVancomycin-resistant Enterococcus faecium isolates form mainland China,” J.Clin.
Microbiol , Vol.45, pp.2813-2818,2007
10. K.Hiramatsu, H.Hanaki, T.Ino, K .Yabuta, T.Oguri and F.C .Tenover, “Methicillin-resistantStaphylococcus aureus clinical strain with reduced Vancomycin susceptibility”,J.Antimicrob. Agents chemother, Vol. 40,pp.135-136, 1997.
11. F.D.Lowry,“Stophylococcus aureus infections”,New Engl J Med.,Vol. 339,pp.520-532,1998.
12. H.K.Tiwari and M.R.Sen , “Emergence of Vancomycin resistant Staphylococcus aureus( VRSA) from tertiary care hospital from northern part of India”,BMC Infectiousdiseases, Vol.6,156, 2006.
13. C.G.Unkal and B.B.Kaliwal, “Vancomycin resistant Staphylococcus aureus containing VanA gene isolated from clinical samples of community health care centres of NorthKarnataka,India”.,In Proceedings of ISBT held at Shillong, India,pp.464-469, 28
th- 30, Dec
2008.
14. P.Courvalin,“Vancomycin resistance in gram-positive cocci”, Clin Infect.,Dis Vol. 42(suppl1),pp.S25-S34, 2006.
8/6/2019 International Journal of Biometrics and Bioinformatics IJBB_V5_I2
http://slidepdf.com/reader/full/international-journal-of-biometrics-and-bioinformatics-ijbbv5i2 99/133
Rajeshwari D Sanakal & Basappa B Kaliwal
International Journal of Biometrics and Bioinformatics (IJBB), Volume (5) : Issue (2) : 2011 118
15. R.Quintiliani, Jr., S. Evers, and P. Courvalin, “The Van B confers various levels ofself-transferable resistance to Vancomycin in enterococci”.J.Infect.Dis., Vol. 167,pp.1220-1223,1993.
16. R.S Leclercq, J.Dutka-Malen , Duval and P Courvalin., “Vancomycin resistance geneVanC is specific to Enterococcus gallinarum”,Antimicrob. Agents Chemother. , Vol.36,pp2005-2008, 1992.
17. P.E.Reynolds and P. Courvalin , “Vancomycin resistance by synthesis of precursorterminating in D-alanyl D-alanine”. Antimicrobial Agents and chemother., Vol.49,pp.21-5,2005.
18. F.Depardieu, P.E.Reynolds and P.Courvalin, “VanD type Vancomycin resistanceEnterococcus faecium 10/96A.A”, Antimicrob. Agents chemother, Vol.47,pp.7-18 ,2003
19. B.Perichon, P.Reynolds and P.Courvalin, “VanD type glycopeptide resistant Enterococcus faecium B M 4339”, Antimicrob. Agents chemother, Vol. 41,pp.2016-2118, 1997.
20. M.Arthur and P. Courvalin, “Genetics and Mechanisms of glycopeptides resistance inenterococci”, Antimicrob Agents chemother, Vol.37,pp.1563-1571,1993.
21. T.D. Bugg , H.S. Dutka- malen , M. Arthur, P.Courvalin, and C.T. Walsh, “Identification ofVancomycin resistance protein vanA as a D-alanine ligase of altered substrate specificity”,Biochemistry , Vol.30, pp. 2017-2021, 1991.
22. M.Arthur, C.Mlinas, S. Dutka-Malen and P. Courvalin, “Structural relationship between theVancomycin resistance protein VanH and 2-hydroxycarboxylic acid dehydrogenasesGene”, Vol.103 ,pp.133-134, 1991.
23. L.D.Gutmann, S.Billot-Klein, I.Al-Obeid,S.Klare,E.Francoual,Collatz and J van Heijenoort,“Inducible carboxypeptidase activity in Vancomycin–resistant enterococci”,Antimicrob.Agents Chemother, Vol.36,pp.77-80 ,1992 .
24. L. L.Carias, S D Rudin, C.J. Donskey and L.B. Rice, “Genetic linkage and cotransfer of anovel Van B-containing Transposon (Tn 5382) and alow-affinity penicillin-binding proteingene in a clinical Vancomycin resistant Enterococcus faecium is late” ,J. Bacteriol , Vol.180,pp.4426-4434,1998.
25. K.H.Dahl, G.S. Simonsen, O.Olsvik and A.Sundsfjord, “Heterogeneity in the vanB genecluster of genomic ally diverse clinical strains of Vancomycin-resistant enterococci”,Antimicrob Agents Chemother, Vol.43,pp.1105-1110, 1999.
26. S.F. Altschul, W. Gish, W. Miller, E.W.Myers and D.J. Lipman, “Basic local alignmentsearch tool”. J. Mol. Biol. Vol.215,pp.403-410, 1990.
27. http://www.ncbi.nlm.nih.gov/blast(December,2010)
28. http://www.ebi.ac.uk/clustalw (February,2011)
29. D.L. Headings, A.Herrera, E. Mazzi, and M. A. Bergman. “Fulminant neonatal septicemiacaused by Streptococcus bovis” . J. Pediatr. , Vol.92,pp.282-283, 1978.
8/6/2019 International Journal of Biometrics and Bioinformatics IJBB_V5_I2
http://slidepdf.com/reader/full/international-journal-of-biometrics-and-bioinformatics-ijbbv5i2 100/133
Rajeshwari D Sanakal & Basappa B Kaliwal
International Journal of Biometrics and Bioinformatics (IJBB), Volume (5) : Issue (2) : 2011 119
30. M.Falcone, F.Campanile ,M.Giannella ,S.Borbone,S.Stefani ,M.Venditti, “Staphylococcus haemolyticus endocarditis: clinical and microbiologic analysis of 4 cases”, Diagn.Microbiol.Infect .Dis. ,Vol.57(3),325-31, 2007.
31. J.M.Davies, D. Burkitt and A.Watson, “Ascending cholangitis presenting with Lactococcus lactis cremoris bacteraemia: a case report”,Journal of Medical Case Reports ,3:3doi:10.1186/1752-1947-3-3,2009.
32. J.J.Fefer, K.R.Ratzan, S.E.Sharp and E.Saiz, “Lactococcus garvieae endocarditis: report ofa case and review of the literature”,Diagnostic Microbiology and Infectious Disease, Vol.32,2, pp. 127-130 ,1998.
33. R.Facklam and J.A.Elliott, “Identification, classification, and clinical relevance of catalase-negative, gram-positive cocci, excluding the streptococci and enterococci”, Clin Microbiol Rev. ,Vol.8(4),pp.479–495,1995.
34. G.Luca, B.Perichon,J. V.Heijenoort, D .Blanot and P.Courvalin, “Glycopeptide ResistancevanA Operons in Paenibacillus Strains Isolated from Soil”, Antimicrobial Agents andchemotherapy, 49 (10),pp. 4227-4233, 2005.
35. J.Ouyang, Z.Pei,L.Lutwick, S.Dalal, L.Yang ,N.Cassai, K.Sandhu ,B.Hanna, R.L.Wieczorek,M.Bluth and M.R.Pincus, “Paenibacillus thiaminolyticus: A New Cause of Human Infection,Inducing Bacteremia in a Patient on hemodialysis”, Annals of Clinical & LaboratoryScience, Vol.38,pp.393-400,2008.
36. K .V. Tilak and B.R.Srinivasa Reddy , “Bacillus cereus and B. circulans –novel inoculantsfor crops”, Current Scince, Vol.90 (5),pp.642-644, 2006.
37. A. Kotiranta, K.Lounatmaa , M.Haapasalo , “Epidemiology and pathogenesis of Baccillus cereus infections” , Microbes Infect Vol. 2 (2),pp.189-198,2000.
38. http://www.genome.jp/kegg/ (December,2010)
39. M.Thangaraj , P.Vishruth , T.Ramesh and A.P.Lipton, “RAPD Fingerprinting andDemonstration of Genetic Variation in Three Pathogens Isolated form MangroveEnvironment” ,Asian Journal of Biotechnology, Vol.3(3),pp.269-274, 2011.
40. E.Meites,S.Zane,C.Gould, “Fatal Clostridium sordellii infections after medical abortions”,NEngl J Med. , Vol.30,363(14),pp.1382-3,2010.
41. B.E.Murray.,“Diversity among multidrug-resistant entrococci”, Emerg.InfectDis, Vol.4,pp.37-47,1998.
42. C.W.Bok and Y.S.Ng, “Eggerthella lenta as a cause of anaerobic Spondylodiscitis,Singapore”, Med .J , Vol.50(12), e393-e396, 2009.
43. K.Liderot, M. Larsson, S.Borang and V.Ozenci, “Polymicrobial Bloodstream Infection withEggerthella lenta and Desulfovibrio desulfuricans”,Journal of Clinical Microbiology, Vol.48,pp.3810-3812, 2010.
44. W.G.Wade, J.Downes, D.Dymock, S.J.Hiom, A.J.Weightman, F.E.Dewhirst, B.J. Paster,N.Tzellas, B.Coleman, “The family Coriobacteriaceae : reclassification of Eubacterium exiguum (Poco et al., 1996) and Peptostreptococcus heliotrinreducens (Lanigan 1976) asSlackia exigua gen. nov., comb. nov. and Slackia heliotrinireducens gen. nov., comb. nov.,and Eubacterium lentum (Prevot 1938) as Eggerthella lenta gen. nov., comb. Nov” . Int J Syst Bacteriol , Vol. 49,595-600,1999.

8/6/2019 International Journal of Biometrics and Bioinformatics IJBB_V5_I2
http://slidepdf.com/reader/full/international-journal-of-biometrics-and-bioinformatics-ijbbv5i2 101/133
Rajeshwari D Sanakal & Basappa B Kaliwal
International Journal of Biometrics and Bioinformatics (IJBB), Volume (5) : Issue (2) : 2011 120
45. M.Arthur, C.Molinas, F.Depardieu and P.Courvalin,“Characterization of Tn/546,aTn3-related Transposon conferring glycopeptide resistance by synthesis of depsipeptidepeptidoglycon precursors Enterococcus faecium BM4147”,J. Bacteriol., Vol. 175,pp.117-127, 1993.
46. K.S.Lee,T.H.Kim,E.S.Kim, H.S.Lim, J.S.Yeom, G.Jun and J.W.Park, “Chloroquine-resistantPlasmodium vivax in the Republic of Korea”, Am. J. Trop. Med.Hyg.,80(2),pp.215-217,2009.
47. R.K.Patel,.K.Piper, F.R Cockerill III, J.M Steckelberg and A.A.Yousten., “The biopesticidePaenibacillus popillae has a Vancomycin resistance gene cluster homologous to theenterococcal VanA Vancomycin resistance gene cluster”, Antimicrob. Agents chemother, Vol. 44,pp.705-709,2000.
48. W.C. Noble, Z.Virani, R.G .Cree, “Co-transfer of Vancomycin and other resistance genesfrom Enterococcus faecalis NCTC 12201 to Staphylococcus aureus” . ,FEMS MicrobiolLett., 1, Vol. 72(2),pp.195–198,1992 .
49. N.Woodford , A.P.Jhonson,D.Morrison and D.C.Spellar, “Current perspectives on
Glycopeptide Resistance”, Clinical Microbiology Reviews, Vol. 8,pp.585-615,1995.
50. R.S.Daum,S.Gupta,R.Sabbagh,W.M.Milewski, “Characterization of Staphylococcus aureus isolates with decreased susceptibility to vancomycin and teicoplanin: isolation andpurification of a constitutively produced protein associated with decreased susceptibility”, JInfect Dis., Vol.166(5),pp.1066–1072,1992.
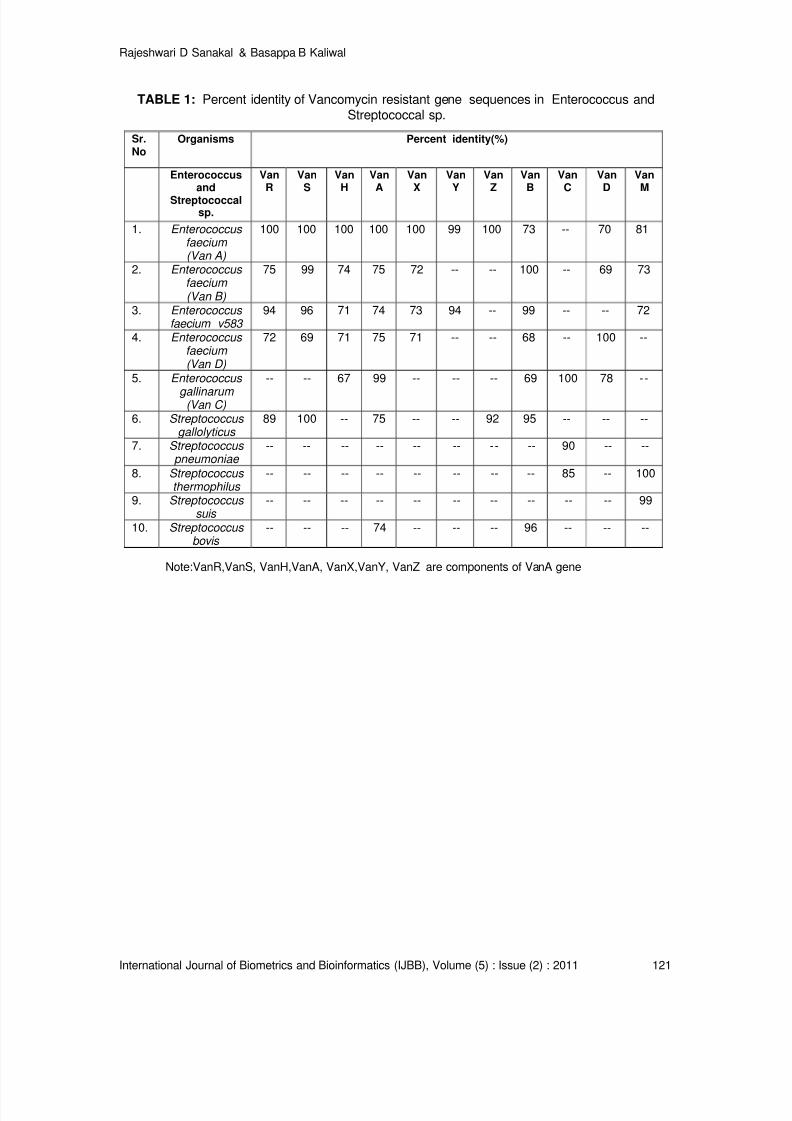
8/6/2019 International Journal of Biometrics and Bioinformatics IJBB_V5_I2
http://slidepdf.com/reader/full/international-journal-of-biometrics-and-bioinformatics-ijbbv5i2 102/133
Rajeshwari D Sanakal & Basappa B Kaliwal
International Journal of Biometrics and Bioinformatics (IJBB), Volume (5) : Issue (2) : 2011 121
TABLE 1: Percent identity of Vancomycin resistant gene sequences in Enterococcus andStreptococcal sp.
Sr.No
Organisms Percent identity(%)
Enterococcusand
Streptococcalsp.
VanR
VanS
VanH
VanA
VanX
VanY
VanZ
VanB
VanC
VanD
VanM
1. Enterococcus faecium (Van A)
100 100 100 100 100 99 100 73 -- 70 81
2. Enterococcus faecium (Van B)
75 99 74 75 72 -- -- 100 -- 69 73
3. Enterococcus faecium v583
94 96 71 74 73 94 -- 99 -- -- 72
4. Enterococcus faecium (Van D)
72 69 71 75 71 -- -- 68 -- 100 --
5. Enterococcus
gallinarum (Van C)
-- -- 67 99 -- -- -- 69 100 78 --
6. Streptococcus gallolyticus
89 100 -- 75 -- -- 92 95 -- -- --
7. Streptococcus pneumoniae
-- -- -- -- -- -- -- -- 90 -- --
8. Streptococcus thermophilus
-- -- -- -- -- -- -- -- 85 -- 100
9. Streptococcus suis
-- -- -- -- -- -- -- -- -- -- 99
10. Streptococcus bovis
-- -- -- 74 -- -- -- 96 -- -- --
Note:VanR,VanS, VanH,VanA, VanX,VanY, VanZ are components of VanA gene

8/6/2019 International Journal of Biometrics and Bioinformatics IJBB_V5_I2
http://slidepdf.com/reader/full/international-journal-of-biometrics-and-bioinformatics-ijbbv5i2 103/133
Rajeshwari D Sanakal & Basappa B Kaliwal
International Journal of Biometrics and Bioinformatics (IJBB), Volume (5) : Issue (2) : 2011 122
TABLE 2: Percent identity of Vancomycin resistant gene sequences in Staphylococcusand Lactococcus sp.
Sr.No Organisms Percent identity (%)
Staphylococcusand
Lactococcussp.
VanR
VanS
VanH
VanA
VanX
VanY
VanZ
VanB
VanC
VanD
VanM
1. Staphylococcus aureus
100 100 100 100 100 99 100 75 -- 70 81
2. Staphylococcus haemolyticus
-- -- -- 100 -- -- -- -- -- -- 84
3. Lactococcus lactis
-- -- -- -- -- 71 -- -- -- -- 100
4. Lactococcus garvieae
-- -- -- -- -- -- -- -- -- -- 99
5. Tetragenococcus halophilus
-- -- -- -- -- -- -- -- -- -- 100
Note:VanR,VanS, VanH,VanA, VanX,VanY, VanZ are components of VanA gene
TABLE 3: Percent identity of Vancomycin resistant gene sequences in Paenibacillus andBacillus species.
Note:VanR,VanS, VanH,VanA, VanX,VanY, VanZ are components of VanA gene
Sr.No
Organisms Percent identity(%)
Paenibacillusand Bacillus
sp.
VanR
VanS
VanH
VanA
VanX
VanY
VanZ
VanB
VanC
VanD
VanM
1. Lactobacillus salivarius
-- -- -- -- -- -- -- -- -- -- 100
2. Paenibacillus
thiamino- lyticus
99 91 91 91 93 84 -- 74 -- -- 83
3. Paenibacillus popillae
-- -- 74 77 80 73 -- 70 -- -- 79
4. Paenibacillus apiarius
94 90 79 91 84 81 -- -- -- -- 87
5. Bacillus cereus
88 -- -- 97 -- 73 -- -- -- -- --
6. Bacillus clausil
96 -- -- -- -- -- -- -- -- -- --
7. Bacillus circulans
91 -- 91 93 -- 94 91 -- -- 70 82
8. Bacillus thuringiensis
-- 86 -- 97 -- 70 -- -- -- -- 93
9. Bacillus weihenste- phanensis
-- -- -- -- -- 93 -- -- -- -- 93

8/6/2019 International Journal of Biometrics and Bioinformatics IJBB_V5_I2
http://slidepdf.com/reader/full/international-journal-of-biometrics-and-bioinformatics-ijbbv5i2 104/133
Rajeshwari D Sanakal & Basappa B Kaliwal
International Journal of Biometrics and Bioinformatics (IJBB), Volume (5) : Issue (2) : 2011 123
TABLE 4: Percent identity of Vancomycin resistant gene sequences in Clostridium sp. andother microorganisms
Sr.No
Organisms Percent identity(%)
Clostridium sp.and othermicroorganisms
VanR VanS VanH VanA VanX VanY VanZ VanB VanC VanD VanM
1. Clostridium sp. 95 -- -- -- 72 90 71 99 72 -- 902. Ruminococcus
sp.76 70 -- 75 70 84 -- 95 -- -- 73
3. Eggerthella lenta -- 72 71 75 72 -- 85 95 -- -- 744. HIV-1 isolate -- -- -- -- -- -- 96 -- -- -- --
5. Schistosoma masoni
-- -- -- -- -- -- 92 -- -- -- --
6. Aspergillus sp. 100 -- -- -- -- -- -- -- -- --7. Haemophilous
influenzae -- -- 71 -- -- -- -- -- -- -- --
8. Salmonella
enterica
85 -- -- -- 71 -- -- -- -- -- --
9. Trypanosoma brunei
-- -- -- -- 82 82 -- -- -- -- --
10. Plasmodium vivax
-- -- -- -- -- -- -- 100 -- -- --
11. Plasmodium falciparum
-- -- -- -- -- 93 -- -- -- -- --
Note:VanR,VanS, VanH,VanA, VanX,VanY, VanZ are components of VanA gene
TABLE 5: Percent identity of Vancomycin resistant gene sequences in higher organisms
Sr.No
Organisms Percent identity(%)
Higherorganisms
VanR
VanS
VanH
VanA
VanX
VanY
VanZ
VanB
VanC
VanD
VanM
1. Anophelis gambiae
93 -- -- -- -- -- -- -- -- -- --
2. Danio verio -- -- -- -- 91 90 -- 87 -- -- --
3. Mus musculus
-- -- -- -- 96 -- 91 -- -- -- --
4. Rattus norvegicus
-- -- -- -- -- 84 82 -- -- -- --
5. Taeniopygia guttata
87 -- 96 -- -- -- -- -- -- -- --
6. Gallus gallus -- -- -- -- 92 92 -- -- -- -- --7. Monodelphis
domestica -- -- 87 -- -- 93 -- -- -- -- --
Note:VanR,VanS, VanH,VanA, VanX,VanY, VanZ are components of VanA gene
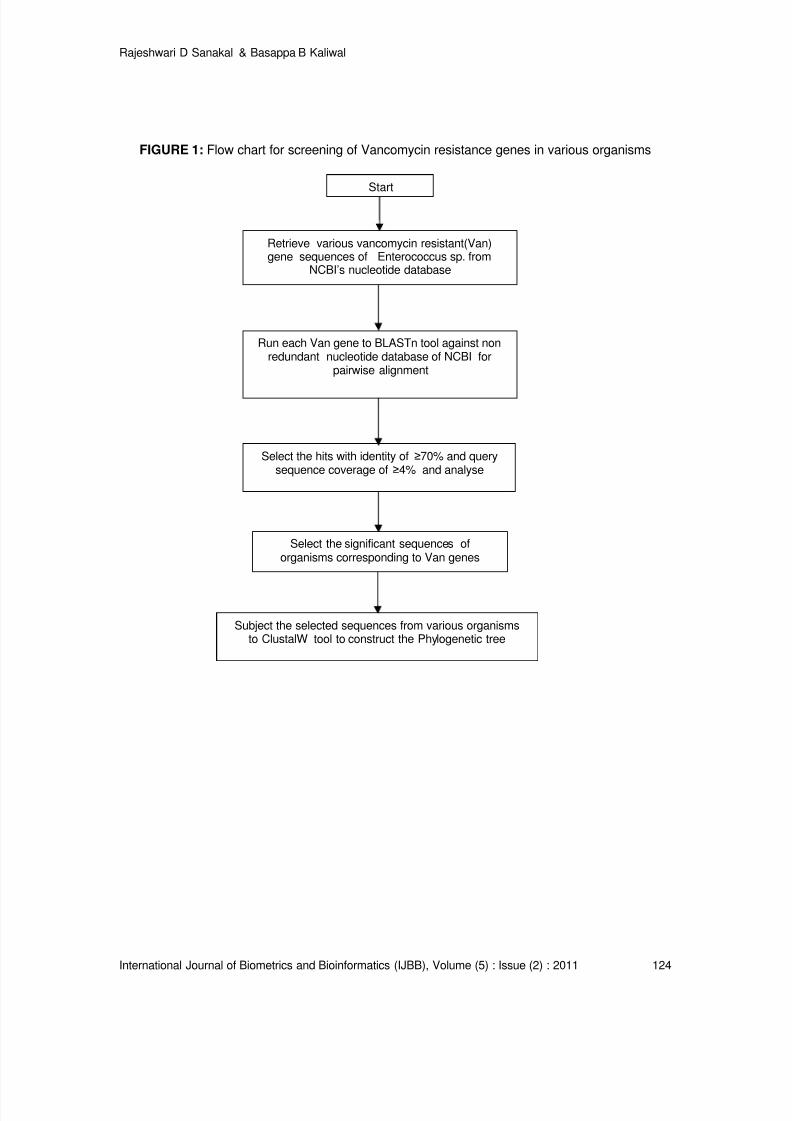
8/6/2019 International Journal of Biometrics and Bioinformatics IJBB_V5_I2
http://slidepdf.com/reader/full/international-journal-of-biometrics-and-bioinformatics-ijbbv5i2 105/133
Rajeshwari D Sanakal & Basappa B Kaliwal
International Journal of Biometrics and Bioinformatics (IJBB), Volume (5) : Issue (2) : 2011 124
FIGURE 1: Flow chart for screening of Vancomycin resistance genes in various organisms
Retrieve various vancomycin resistant(Van)gene sequences of Enterococcus sp. from
NCBI’s nucleotide database
Run each Van gene to BLASTn tool against nonredundant nucleotide database of NCBI for
pairwise alignment
Select the hits with identity of ≥70% and querysequence coverage of ≥4% and analyse
Select the significant sequences oforganisms corresponding to Van genes
Subject the selected sequences from various organismsto ClustalW tool to construct the Phylogenetic tree
Start
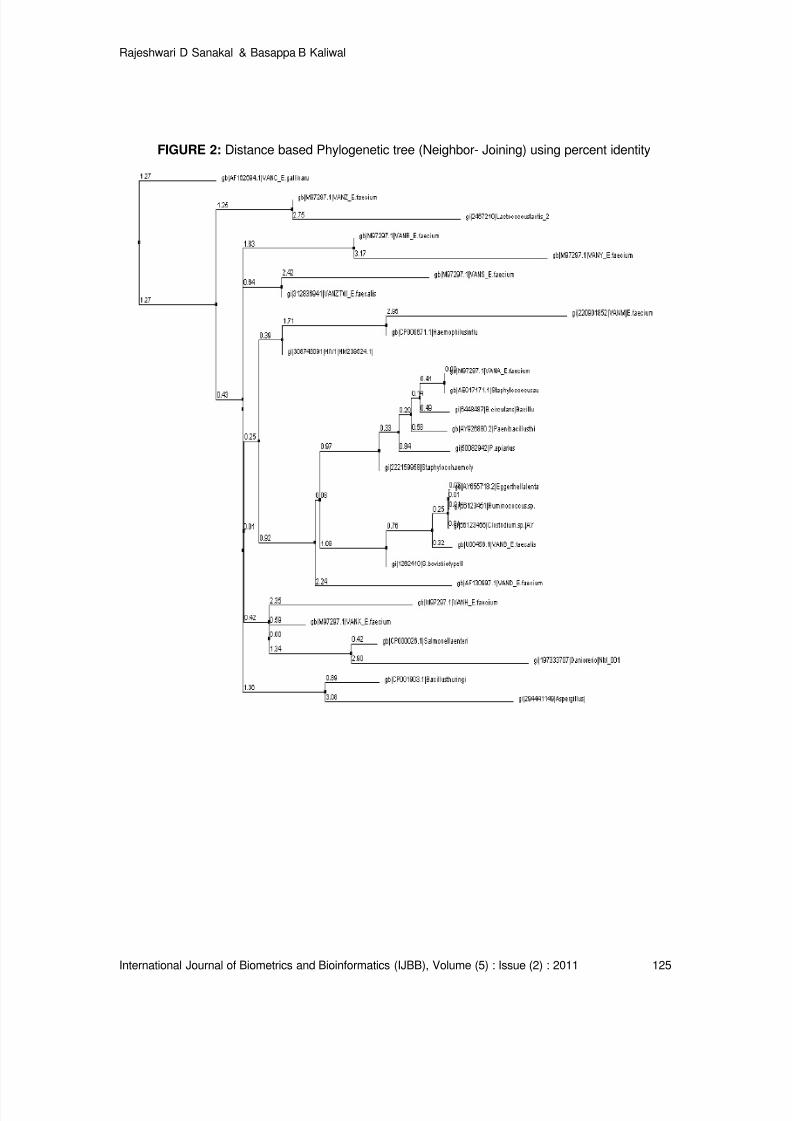
8/6/2019 International Journal of Biometrics and Bioinformatics IJBB_V5_I2
http://slidepdf.com/reader/full/international-journal-of-biometrics-and-bioinformatics-ijbbv5i2 106/133
Rajeshwari D Sanakal & Basappa B Kaliwal
International Journal of Biometrics and Bioinformatics (IJBB), Volume (5) : Issue (2) : 2011 125
FIGURE 2: Distance based Phylogenetic tree (Neighbor- Joining) using percent identity
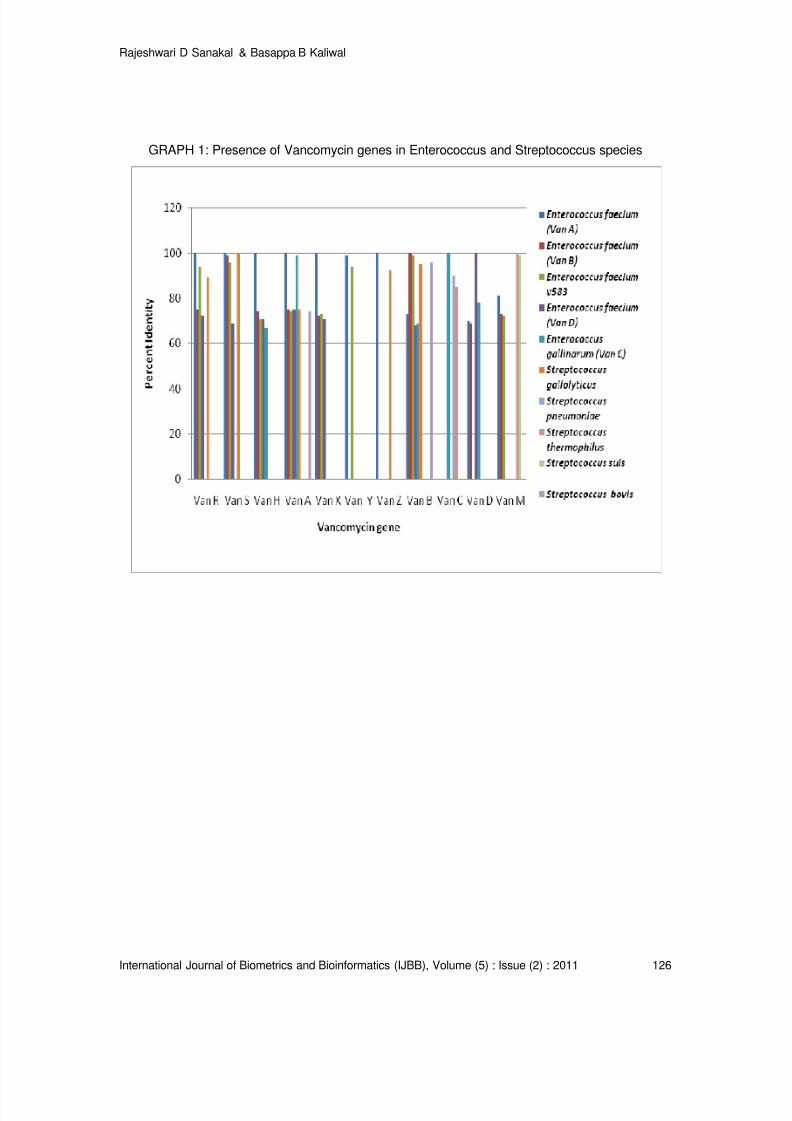
8/6/2019 International Journal of Biometrics and Bioinformatics IJBB_V5_I2
http://slidepdf.com/reader/full/international-journal-of-biometrics-and-bioinformatics-ijbbv5i2 107/133
Rajeshwari D Sanakal & Basappa B Kaliwal
International Journal of Biometrics and Bioinformatics (IJBB), Volume (5) : Issue (2) : 2011 126
GRAPH 1: Presence of Vancomycin genes in Enterococcus and Streptococcus species
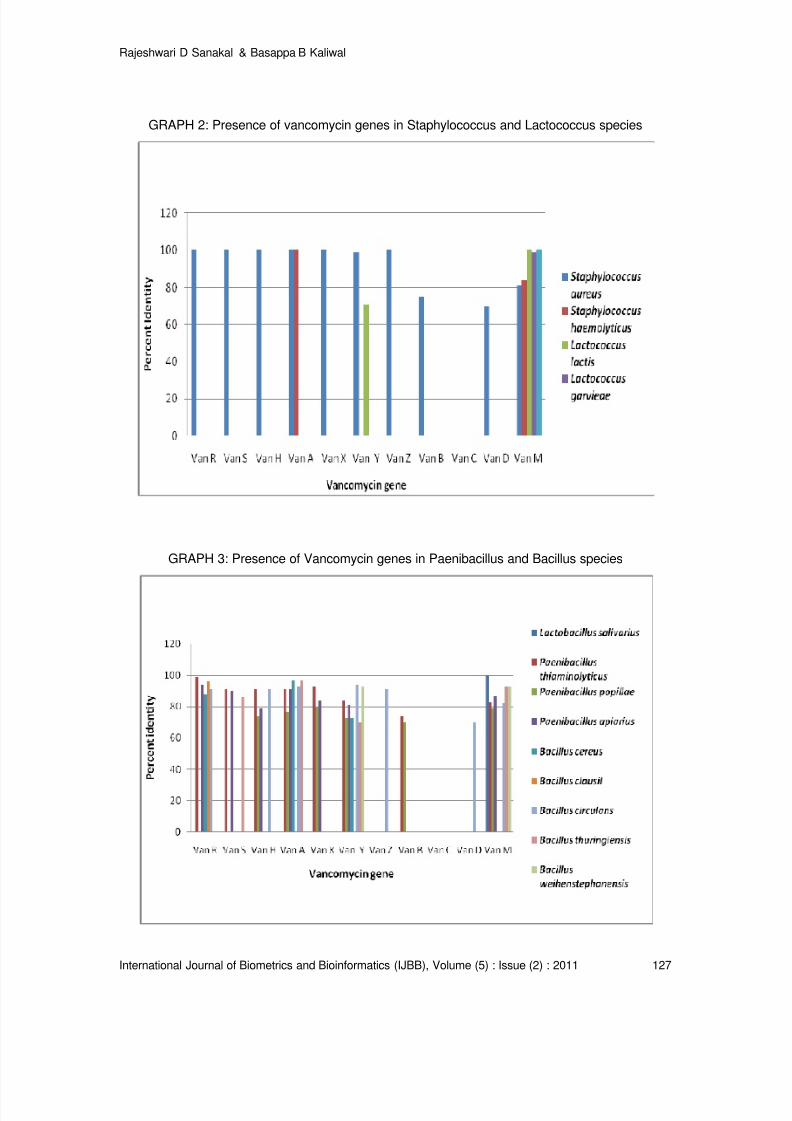
8/6/2019 International Journal of Biometrics and Bioinformatics IJBB_V5_I2
http://slidepdf.com/reader/full/international-journal-of-biometrics-and-bioinformatics-ijbbv5i2 108/133
Rajeshwari D Sanakal & Basappa B Kaliwal
International Journal of Biometrics and Bioinformatics (IJBB), Volume (5) : Issue (2) : 2011 127
GRAPH 2: Presence of vancomycin genes in Staphylococcus and Lactococcus species
GRAPH 3: Presence of Vancomycin genes in Paenibacillus and Bacillus species
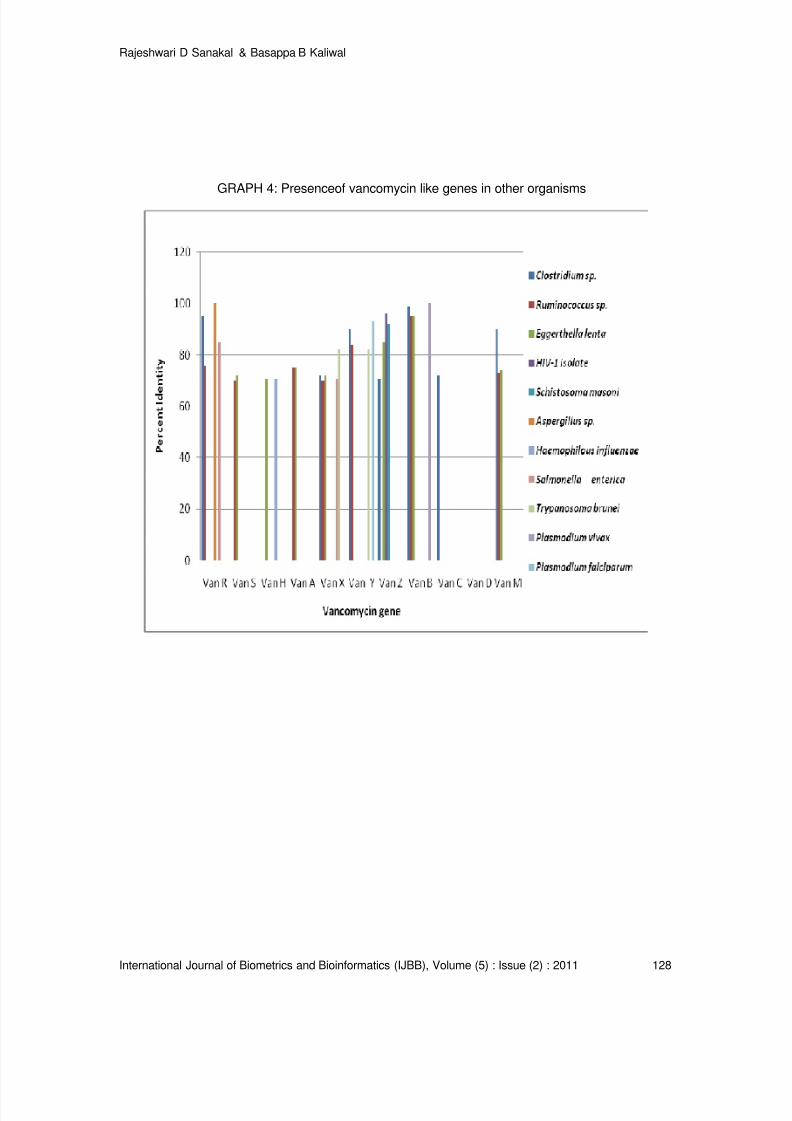
8/6/2019 International Journal of Biometrics and Bioinformatics IJBB_V5_I2
http://slidepdf.com/reader/full/international-journal-of-biometrics-and-bioinformatics-ijbbv5i2 109/133
Rajeshwari D Sanakal & Basappa B Kaliwal
International Journal of Biometrics and Bioinformatics (IJBB), Volume (5) : Issue (2) : 2011 128
GRAPH 4: Presenceof vancomycin like genes in other organisms
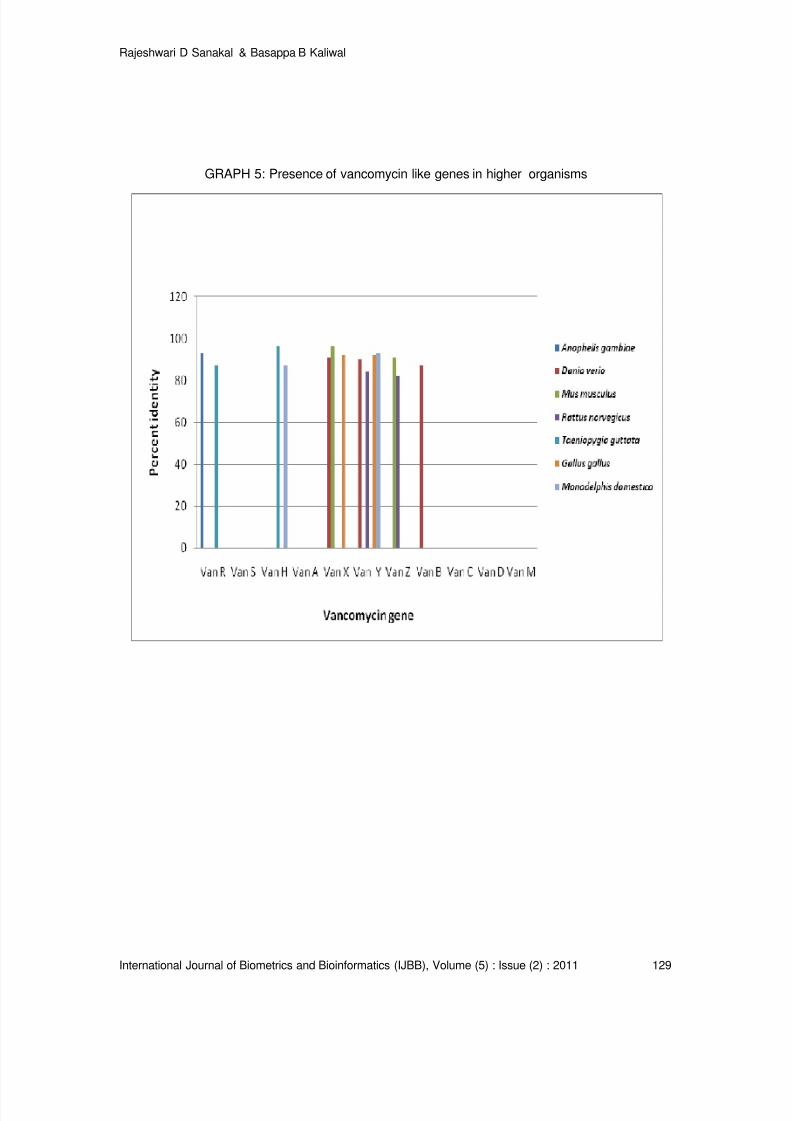
8/6/2019 International Journal of Biometrics and Bioinformatics IJBB_V5_I2
http://slidepdf.com/reader/full/international-journal-of-biometrics-and-bioinformatics-ijbbv5i2 110/133
Rajeshwari D Sanakal & Basappa B Kaliwal
International Journal of Biometrics and Bioinformatics (IJBB), Volume (5) : Issue (2) : 2011 129
GRAPH 5: Presence of vancomycin like genes in higher organisms
8/6/2019 International Journal of Biometrics and Bioinformatics IJBB_V5_I2
http://slidepdf.com/reader/full/international-journal-of-biometrics-and-bioinformatics-ijbbv5i2 111/133
Janett Walters-Williams & Yan Li
International Journal of Biometrics and Bioinformatics Volume (5) : Issue (2) : 2011 130
A New Approach to Denoising EEG Signals - Merger ofTranslation Invariant Wavelet and ICA
Janett Walters-Williams [email protected] School of Computing & Information Technology Faculty of Engineering & Computing University of Technology, Jamaica 237 Old Hope Road,Kingston 6, Jamaica W.I.
Yan Li [email protected] Department of Mathematics & Computing Faculty of Sciences University of Southern Queensland Toowoomba, Australia
Abstract
In this paper we present a new algorithm using a merger of Independent Component Analysisand Translation Invariant Wavelet Transform. The efficacy of this algorithm is evaluated byapplying contaminated EEG signals. Its performance was compared to three fixed-point ICAalgorithms (FastICA, EFICA and Pearson-ICA) using Mean Square Error (MSE), Peak Signal toNoise Ratio (PSNR), Signal to Distortion Ratio (SDR), and Amari Performance Index.Experiments reveal that our new technique is the most accurate separation method.
Keywords:Independent Component Analysis, Wavelet Transform, Unscented Kalman Filter,Electroencephalogram (EEG), Cycle Spinning
1. INTRODUCTION
The use of electroencephalogram (EEG) in the field of Medicine has had a great impact on the
study of the human brain. The EEG itself represents the brain activity for a subject and gives usan objective mode of recording brain stimulation. It also has been suggested by several studiesthat EEGs can be used to detect several diseases such as Creutzfeldt-Jakob diseases (CJD),Alzheimer’s, Dementia, Epilepsy, and Schizophrenia. The signals received, however, haveseveral origins that lead to the complexity of their identification. This complexity is made of boththe pure EEG signal and other non-cerebral signals called artifacts or noise. The artifacts haveresulted in the contamination of the EEG signals; hence the removal of these noises hasgenerated a large number of denoising techniques and methods, for example Fourier transform,time-frequency analysis, Wavelet Transform (WT), Neural Networks (NN), and IndependentComponent Analysis (ICA).
Independent Component Analysis (ICA) originated from the field of Blind Source Separation(BSS) [8]. In the BSS problem, a set of observations is given while the underlying signal
information is hidden; the mixing weights of the individual signals are unknown. BSS is aimed atidentifying the source signals and/or the mixing weights so as to separate these informationsources into signal domain, feature domain or model domain [5]. ICA therefore calls for theseparation of the EEG into its constituent independent components (ICs) and then eliminating theICs that are believed to contribute to the noise. It is subjective, inconvenient and a timeconsuming process when dealing with large amount of EEG data.
Different types of ICA algorithms were proposed in the last 10 to 12 years. Most of them supposethat the sources are stationary and are based explicitly or implicitly on high order statisticscomputation. Therefore, Gaussian sources cannot be separated, as they don’t have higher than 2
8/6/2019 International Journal of Biometrics and Bioinformatics IJBB_V5_I2
http://slidepdf.com/reader/full/international-journal-of-biometrics-and-bioinformatics-ijbbv5i2 112/133
Janett Walters-Williams & Yan Li
International Journal of Biometrics and Bioinformatics Volume (5) : Issue (2) : 2011 131
statistic moments. Other types of algorithms do not make the stationarity hypothesis, and use thenon stationary structure of the signals (i.e. their time or frequency structure) to separate them.These methods use second order statistics (SOS) only, and they are called SOS algorithms. AsEEG signals are highly non-stationary, these type of algorithms are the most widely used.
Like ICA, Wavelet Transform (WT) has been used to study EEG signals [3][20][32][35-36][41][44]successfully because of its good localization properties in time and frequency domain [13]. Here,the EEG signals pass through two complementary filters and emerge as two signals,approximation and details. This is called decomposition or analysis. The components can beassembled back into the original signal without loss of information. This process is calledreconstruction or synthesis. The mathematical manipulation, which implies analysis andsynthesis, is called discrete wavelet transform (DWT) and inverse discrete wavelet transform(IDWT). There have been many approaches to denoising using WT; those based on shrinkageare the most popular [32] where the EEG signals are decomposed into wavelets and noiseremoval done using thresholding and shrinkage.
Akin [1] in his research compared WT with fast Fourier transform and found that WT was better indetecting brain diseases. His research was confirmed by Hermann et al [16]. Unser et al [39]showed that wavelet is good at denoising EEG signals as well as other biomedical signals. WThas therefore emerged as one of the superior technique in analyzing non-stationary signals like
EEG. Its capability in transforming a time domain signal into time and frequency localization helpsto understand the behaviour of a signal better. WT however has limitations such as Gibbsphenomena [7].
Each of the above methods presents their own limitations. In our opinion a method that aims to fixthese limitations should be a more effective denoising method. This is possible as each method isused to overcome the limitation of the other. We present in this paper a new method of extractingnoise from EEG signals which aims to remove the limitations of ICA and WT while improvingeffectiveness – Cycle Spinning Wavelet Transform ICA (CTICA). The performance of CTICA isanalyzed and compared with three known fixed-point ICA algorithms – FastICA, EFICA andPearson-ICA, by using EEG signals contaminated with noise. Mean Square Error (MSE), PeakSignal to Noise Ratio (PSNR), Signal to Distortion Ratio (SDR), and Amari Performance Indexare used as criteria for testing the quality of denoising.
2. SUPPORTING LITERATURE
EEG SignalsThe nervous system sends commands and communicates by trains of electric impulses. Whenthe neurons of the human brain process information they do so by changing the flow of electricalcurrent across their membranes. These changing current (potential) generate electric fields thatcan be recorded from the scalp. Studies are interested in these electrical potentials but they canonly be received by direct measurement. This requires a patient to under-go surgery forelectrodes to be placed inside the head. This is not acceptable because of the risk to the patient.Researchers therefore collect recordings from the scalp receiving the global descriptions of thebrain activity. Because the same potential is recorded from more than one electrode, signals fromthe electrodes are supposed to be highly correlated. These are collected by the use of anelectroencephalograph and called electroencephalogram (EEG) signals.
Understanding the brain is a huge part of Neuroscience, and the development of EEG was for theelucidation of such a phenomenon. The morphology of the EEG signals has been used byresearches and in clinical practice to:
• Diagnose epilepsy and see what type of seizures is occurring.
• Produce the most useful and important test in confirming a diagnosis of epilepsy.
• Check for problems with loss of consciousness or dementia.• Help find out a person's chance of recovery after a change in consciousness.
• Find out if a person who is in a coma is brain-dead.
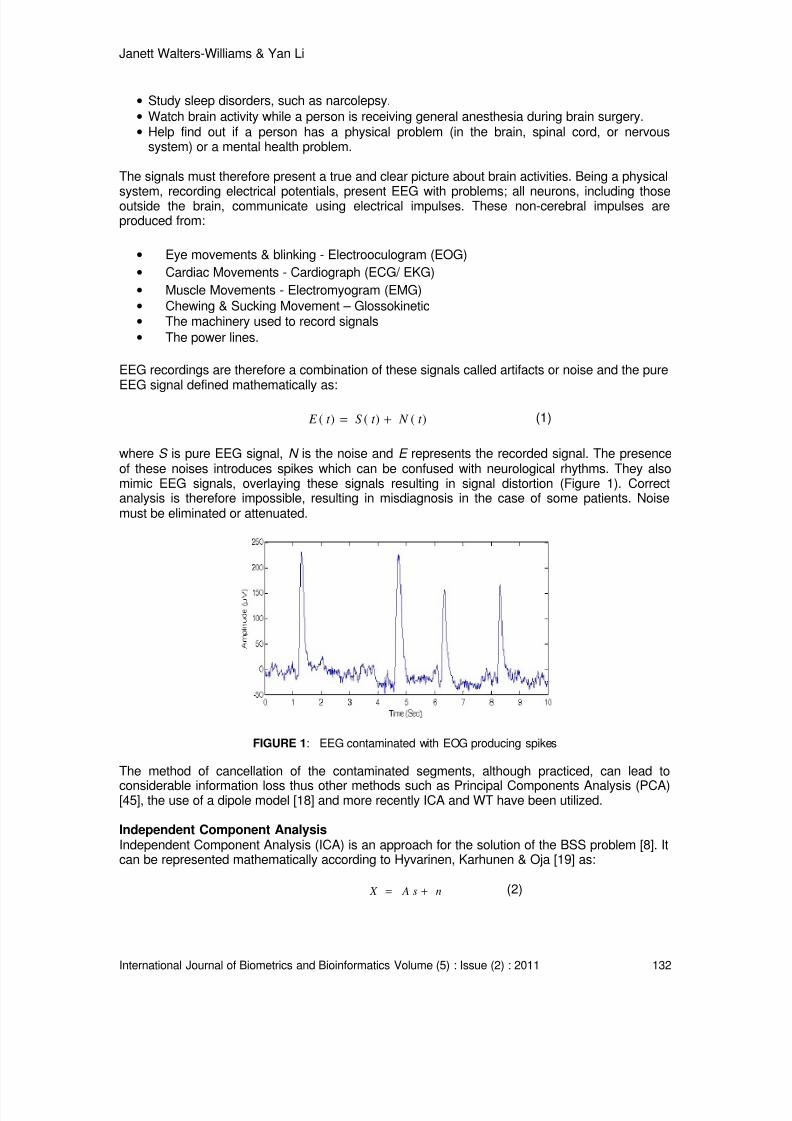
8/6/2019 International Journal of Biometrics and Bioinformatics IJBB_V5_I2
http://slidepdf.com/reader/full/international-journal-of-biometrics-and-bioinformatics-ijbbv5i2 113/133
Janett Walters-Williams & Yan Li
International Journal of Biometrics and Bioinformatics Volume (5) : Issue (2) : 2011 132
• Study sleep disorders, such as narcolepsy.
• Watch brain activity while a person is receiving general anesthesia during brain surgery.• Help find out if a person has a physical problem (in the brain, spinal cord, or nervous
system) or a mental health problem.
The signals must therefore present a true and clear picture about brain activities. Being a physical
system, recording electrical potentials, present EEG with problems; all neurons, including thoseoutside the brain, communicate using electrical impulses. These non-cerebral impulses areproduced from:
• Eye movements & blinking - Electrooculogram (EOG)
• Cardiac Movements - Cardiograph (ECG/ EKG)
• Muscle Movements - Electromyogram (EMG)
• Chewing & Sucking Movement – Glossokinetic• The machinery used to record signals
• The power lines.
EEG recordings are therefore a combination of these signals called artifacts or noise and the pureEEG signal defined mathematically as:
( ) ( ) ( ) E t S t N t = + (1)
where S is pure EEG signal, N is the noise and E represents the recorded signal. The presenceof these noises introduces spikes which can be confused with neurological rhythms. They alsomimic EEG signals, overlaying these signals resulting in signal distortion (Figure 1). Correctanalysis is therefore impossible, resulting in misdiagnosis in the case of some patients. Noisemust be eliminated or attenuated.
FIGURE 1: EEG contaminated with EOG producing spikes
The method of cancellation of the contaminated segments, although practiced, can lead to
considerable information loss thus other methods such as Principal Components Analysis (PCA)[45], the use of a dipole model [18] and more recently ICA and WT have been utilized.
Independent Component AnalysisIndependent Component Analysis (ICA) is an approach for the solution of the BSS problem [8]. Itcan be represented mathematically according to Hyvarinen, Karhunen & Oja [19] as:
X A s n= +
(2)
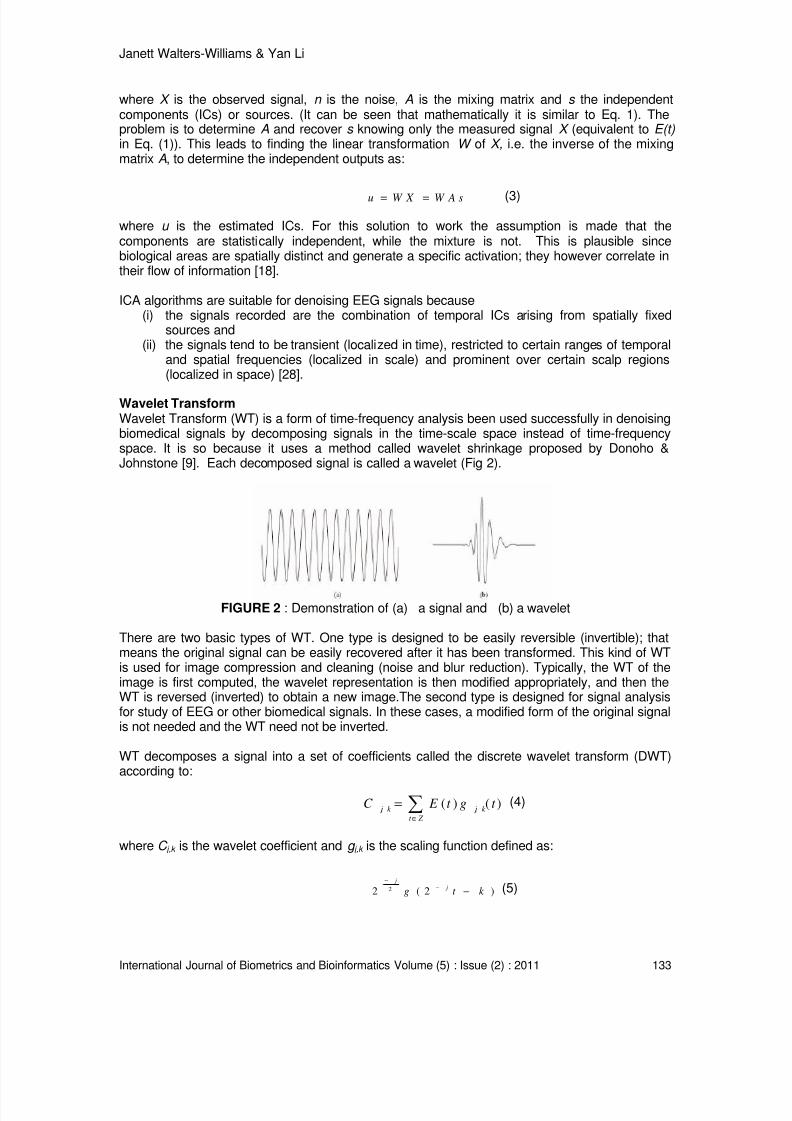
8/6/2019 International Journal of Biometrics and Bioinformatics IJBB_V5_I2
http://slidepdf.com/reader/full/international-journal-of-biometrics-and-bioinformatics-ijbbv5i2 114/133
Janett Walters-Williams & Yan Li
International Journal of Biometrics and Bioinformatics Volume (5) : Issue (2) : 2011 133
where X is the observed signal, n is the noise, A is the mixing matrix and s the independentcomponents (ICs) or sources. (It can be seen that mathematically it is similar to Eq. 1). Theproblem is to determine A and recover s knowing only the measured signal X (equivalent to E(t) in Eq. (1)). This leads to finding the linear transformation W of X, i.e. the inverse of the mixingmatrix A, to determine the independent outputs as:
u W X W A s= =
(3)
where u is the estimated ICs. For this solution to work the assumption is made that thecomponents are statistically independent, while the mixture is not. This is plausible sincebiological areas are spatially distinct and generate a specific activation; they however correlate intheir flow of information [18].
ICA algorithms are suitable for denoising EEG signals because(i) the signals recorded are the combination of temporal ICs arising from spatially fixed
sources and(ii) the signals tend to be transient (localized in time), restricted to certain ranges of temporal
and spatial frequencies (localized in scale) and prominent over certain scalp regions(localized in space) [28].
Wavelet TransformWavelet Transform (WT) is a form of time-frequency analysis been used successfully in denoisingbiomedical signals by decomposing signals in the time-scale space instead of time-frequencyspace. It is so because it uses a method called wavelet shrinkage proposed by Donoho &Johnstone [9]. Each decomposed signal is called a wavelet (Fig 2).
FIGURE 2 : Demonstration of (a) a signal and (b) a wavelet
There are two basic types of WT. One type is designed to be easily reversible (invertible); thatmeans the original signal can be easily recovered after it has been transformed. This kind of WTis used for image compression and cleaning (noise and blur reduction). Typically, the WT of theimage is first computed, the wavelet representation is then modified appropriately, and then theWT is reversed (inverted) to obtain a new image.The second type is designed for signal analysisfor study of EEG or other biomedical signals. In these cases, a modified form of the original signalis not needed and the WT need not be inverted.
WT decomposes a signal into a set of coefficients called the discrete wavelet transform (DWT)according to:
, ,( ) ( )
j k j k
t Z
C E t g t ∈
= ∑ (4)
where C j,k is the wavelet coefficient and g j,k is the scaling function defined as:
22 ( 2 ) j
jg t k
−
−− (5)
8/6/2019 International Journal of Biometrics and Bioinformatics IJBB_V5_I2
http://slidepdf.com/reader/full/international-journal-of-biometrics-and-bioinformatics-ijbbv5i2 115/133
Janett Walters-Williams & Yan Li
International Journal of Biometrics and Bioinformatics Volume (5) : Issue (2) : 2011 134
The wavelet and scaling functions depend on the chosen wavelet family, such as Haar,Daubechies and Coiflet. Compressed versions of the wavelet function match the high-frequencycomponents, while stretched versions match the low-frequency components. By correlating theoriginal signal with wavelet functions of different sizes, the details of the signal can be obtained atseveral scales or moments. These correlations with the different wavelet functions can bearranged in a hierarchical scheme called multi-resolution decomposition. The multi-resolutiondecomposition algorithm separates the signal into “details” at different moments and waveletcoefficients [35-36]. As the moments increase the amplitude of the discrete details becomesmaller, however the coefficients of the useful signals increase [44-45].
Considering Eq. (1) the wavelet transform of E(t) produces wavelet coefficients of the noiselesssignal S(t) and the coefficients of the noise N(t). Researchers found that wavelet denoising isperformed by taking the wavelet transform of the noise-corrupted E(t) and passing the detailcoefficients, of the wavelet transform, through a threshold filter where the details, if small enough,might be omitted without substantially affecting the main signals. There are two main thresholdfilters – soft and hard. Research has shown that soft-thresholding has better mathematicalcharacteristics [44-45] and provides smoother results [15]. Once discarded these coefficients arereplaced with zeroes during reconstruction using an inverse wavelet transform to yield anestimate for the true signal, defined as:
( ) ( )( )( )^
1( ) ( )] ( )thS t D E t W W E t −
= = Λ (6)
where thΛ is the diagonal thresholding operator that zeroes out wavelet coefficients less than the
threshold, th. It has been shown that this algorithm offers the advantages of smoothness andadaptation. However, as Coifman and Donoho [7] pointed out, this algorithm exhibits visualartifacts such Gibbs phenomena in the neighbourhoodof discontinuities.
Unscented Kalman FilterUnscented Kalman Filter (UKF) is a Bayesian filter which uses minimum mean-squared error(MMSE) as the criterion to measure optimality [4][34]. For highly nonlinear systems, the linearestimate of the nonlinear model does not provide a good approximation of the model, and theExtended Kalman Filter (EKF) will not track signals around sharp turning points. Another problem
with the EKF is that the estimated covariance matrix tends to underestimate the true covariancematrix and therefore risks becoming inconsistent in the statistical sense without the addition of"stabilising noise". UKF was found to address these flaws. It involves the UnscentedTransformation (UT), a method used to calculate the first and second order statistics of theoutputs of nonlinear systems with Gaussian. The nonlinear stochastic system used for thealgorithm is:
1k k k k
k k k
x A x B u v
y H x w
+= + +
= +
(7)
where A and H are the known and constant matrices respectively, x k is the unobserved state ofthe system, u k is a known exogenous input, y k is the observed measurement signal, v k is theprocess noise and w k is the measurement noise.
UKF uses the intuition that it is easier to approximate a probability distribution function rather thanto approximate an arbitrary nonlinear function or transformation. Following this intuition, a set ofsample points, called sigma points, are generated around the mean, which are thenpropagatedthrough the nonlinear map to get a more accurate estimation of the mean and covariance of themapping results. In this way, it avoids the need to calculate the Jacobian, which for complexfunctions can be a difficult task in itself (i.e., requiring complicated derivatives if done analyticallyor being computationally costly if done numerically).
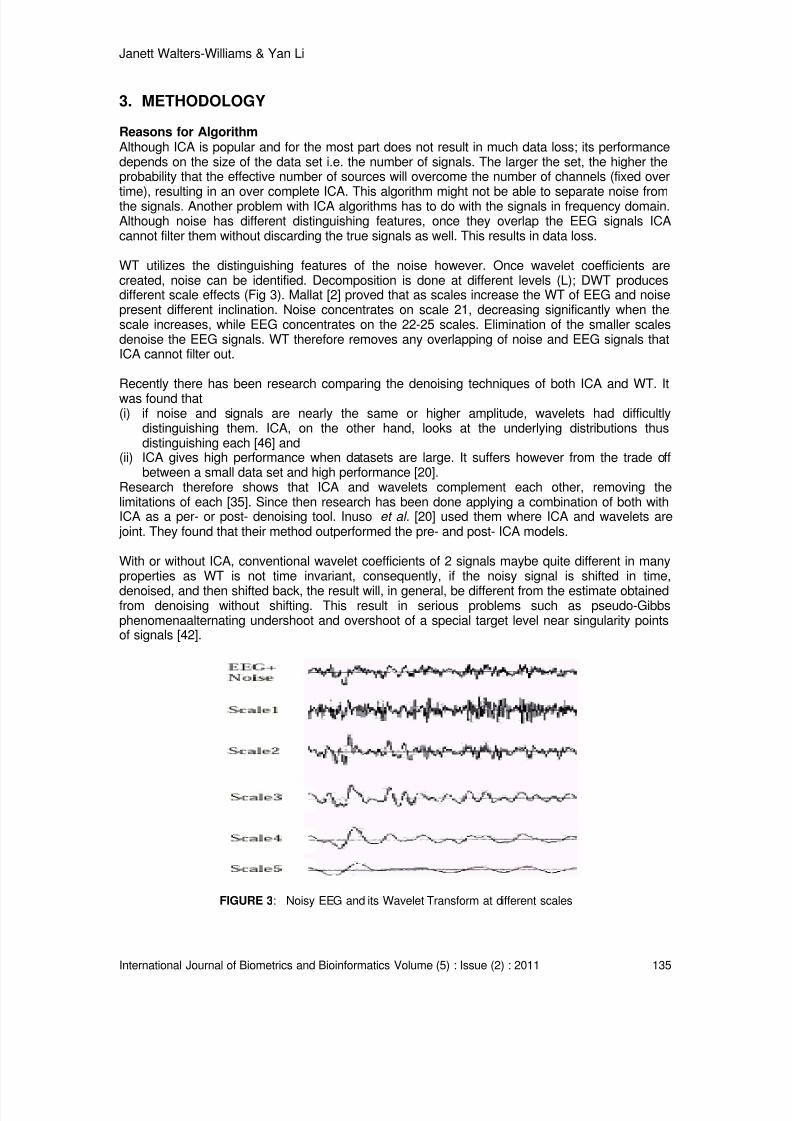
8/6/2019 International Journal of Biometrics and Bioinformatics IJBB_V5_I2
http://slidepdf.com/reader/full/international-journal-of-biometrics-and-bioinformatics-ijbbv5i2 116/133
Janett Walters-Williams & Yan Li
International Journal of Biometrics and Bioinformatics Volume (5) : Issue (2) : 2011 135
3. METHODOLOGY
Reasons for AlgorithmAlthough ICA is popular and for the most part does not result in much data loss; its performancedepends on the size of the data set i.e. the number of signals. The larger the set, the higher theprobability that the effective number of sources will overcome the number of channels (fixed over
time), resulting in an over complete ICA. This algorithm might not be able to separate noise fromthe signals. Another problem with ICA algorithms has to do with the signals in frequency domain.Although noise has different distinguishing features, once they overlap the EEG signals ICAcannot filter them without discarding the true signals as well. This results in data loss.
WT utilizes the distinguishing features of the noise however. Once wavelet coefficients arecreated, noise can be identified. Decomposition is done at different levels (L); DWT producesdifferent scale effects (Fig 3). Mallat [2] proved that as scales increase the WT of EEG and noisepresent different inclination. Noise concentrates on scale 21, decreasing significantly when thescale increases, while EEG concentrates on the 22-25 scales. Elimination of the smaller scalesdenoise the EEG signals. WT therefore removes any overlapping of noise and EEG signals thatICA cannot filter out.
Recently there has been research comparing the denoising techniques of both ICA and WT. Itwas found that(i) if noise and signals are nearly the same or higher amplitude, wavelets had difficultly
distinguishing them. ICA, on the other hand, looks at the underlying distributions thusdistinguishing each [46] and
(ii) ICA gives high performance when datasets are large. It suffers however from the trade offbetween a small data set and high performance [20].
Research therefore shows that ICA and wavelets complement each other, removing thelimitations of each [35]. Since then research has been done applying a combination of both withICA as a per- or post- denoising tool. Inuso et al. [20] used them where ICA and wavelets are
joint. They found that their method outperformed the pre- and post- ICA models.
With or without ICA, conventional wavelet coefficients of 2 signals maybe quite different in manyproperties as WT is not time invariant, consequently, if the noisy signal is shifted in time,
denoised, and then shifted back, the result will, in general, be different from the estimate obtainedfrom denoising without shifting. This result in serious problems such as pseudo-Gibbsphenomenaalternating undershoot and overshoot of a special target level near singularity pointsof signals [42].
FIGURE 3: Noisy EEG and its Wavelet Transform at different scales
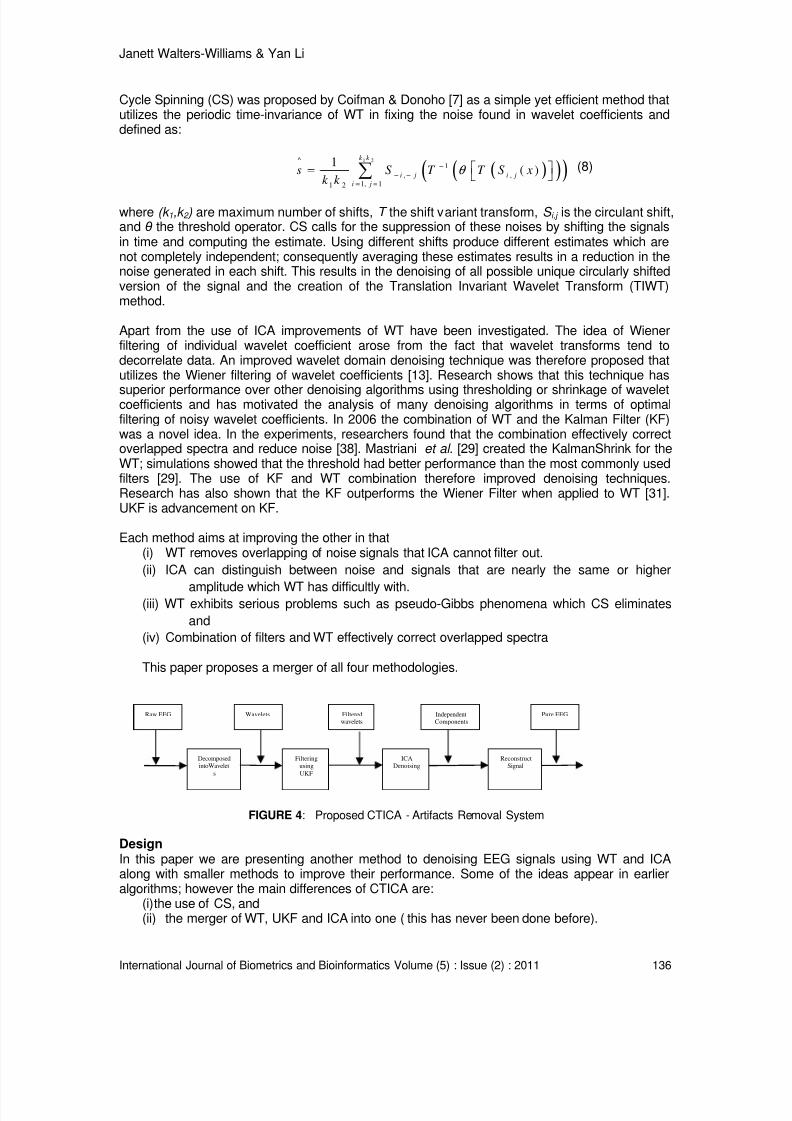
8/6/2019 International Journal of Biometrics and Bioinformatics IJBB_V5_I2
http://slidepdf.com/reader/full/international-journal-of-biometrics-and-bioinformatics-ijbbv5i2 117/133
Janett Walters-Williams & Yan Li
International Journal of Biometrics and Bioinformatics Volume (5) : Issue (2) : 2011 136
Cycle Spinning (CS) was proposed by Coifman & Donoho [7] as a simple yet efficient method thatutilizes the periodic time-invariance of WT in fixing the noise found in wavelet coefficients anddefined as:
( )( )( )1 2^
1
, ,
1, 11 2
1( )
k k
i j i j
i j
s S T T S xk k
θ −
− −
= =
= ∑ (8)
where (k 1,k 2 ) are maximum number of shifts, T the shift variant transform, S i,j is the circulant shift,and θ the threshold operator. CS calls for the suppression of these noises by shifting the signalsin time and computing the estimate. Using different shifts produce different estimates which arenot completely independent; consequently averaging these estimates results in a reduction in thenoise generated in each shift. This results in the denoising of all possible unique circularly shiftedversion of the signal and the creation of the Translation Invariant Wavelet Transform (TIWT)method.
Apart from the use of ICA improvements of WT have been investigated. The idea of Wienerfiltering of individual wavelet coefficient arose from the fact that wavelet transforms tend todecorrelate data. An improved wavelet domain denoising technique was therefore proposed thatutilizes the Wiener filtering of wavelet coefficients [13]. Research shows that this technique has
superior performance over other denoising algorithms using thresholding or shrinkage of waveletcoefficients and has motivated the analysis of many denoising algorithms in terms of optimalfiltering of noisy wavelet coefficients. In 2006 the combination of WT and the Kalman Filter (KF)was a novel idea. In the experiments, researchers found that the combination effectively correctoverlapped spectra and reduce noise [38]. Mastriani et al . [29] created the KalmanShrink for theWT; simulations showed that the threshold had better performance than the most commonly usedfilters [29]. The use of KF and WT combination therefore improved denoising techniques.Research has also shown that the KF outperforms the Wiener Filter when applied to WT [31].UKF is advancement on KF.
Each method aims at improving the other in that(i) WT removes overlapping of noise signals that ICA cannot filter out.
(ii) ICA can distinguish between noise and signals that are nearly the same or higher
amplitude which WT has difficultly with.(iii) WT exhibits serious problems such as pseudo-Gibbs phenomena which CS eliminates
and
(iv) Combination of filters and WT effectively correct overlapped spectra
This paper proposes a merger of all four methodologies.
FIGURE 4: Proposed CTICA - Artifacts Removal System
Design In this paper we are presenting another method to denoising EEG signals using WT and ICAalong with smaller methods to improve their performance. Some of the ideas appear in earlieralgorithms; however the main differences of CTICA are:
(i) the use of CS, and(ii) the merger of WT, UKF and ICA into one ( this has never been done before).
ICADenoising
DecomposedintoWavelet
s
Raw EEG
Filteringusing
UKF Reconstruct
Signal
IndependentComponents
Wavelets Pure EEGFilteredwavelets

8/6/2019 International Journal of Biometrics and Bioinformatics IJBB_V5_I2
http://slidepdf.com/reader/full/international-journal-of-biometrics-and-bioinformatics-ijbbv5i2 118/133
Janett Walters-Williams & Yan Li
International Journal of Biometrics and Bioinformatics Volume (5) : Issue (2) : 2011 137
A block diagram representation of the proposed work is shown in Figure 4. The algorithm can bedivided into the following:
1. Signal CollectionThis algorithm is designed to denoise both natural and artificially noised EEG signals. Theyshould therefore be mathematically defined based on Eq. (1).
2. Apply CS to signalThe number of time shifts is determined; in so doing signals are forcibly shifted so that theirfeatures change positions removing the undesirable oscillations which result in pseudo-Gibbsphenomena. The circulant shift by h is defined as:
( ) ( )( ) ( ) m o dhS f n f n h N = + (9)
where f(n) is the signal, S is time shift operator and N is the number of signals. The time-shiftoperator S is unitary and therefore invertible i.e. (S h )
-1= S -h
3. Decomposition of SignalThe signals are decomposed into 5 levels of DWT using the Symmlet family, separating noiseand true signals. Symmlets are orthogonal and its regularity increases with the increase in thenumber of moments [11]. After experiments the number of vanishing moments chosen is 8(Sym8).
4. Filter CoefficientsPerform UKF on the coefficients to filter out some noise reducing the shrinkage threshold.
5. Choose and Apply Threshold ValueDenoise using the soft-thresholding method discarding all coefficients below the threshold valueusing VisuShrink based on the universal threshold defined by Donoho & Johnstone [9] given as:
2
2 l o gT N σ =
(10)
where N is the number of samples and σ 2
is the noise power.
6. Apply ICA algorithmSignals and noise may have nearly the same frequency characteristics and overlap in time thusproducing noisy coefficients such as beta activity and muscle noise, that WT has not been able todistinguish and remove. ICA is able to look at the underlying distributions thus distinguish noiseand remove them. Research has shown that ICA is a robust denoising method where itsperformance is not affected by the severity of the mixing signals [10]. We implemented asymmetrical fixed-point ICA algorithm based on the Hyvarinen model [19] where the gradientfunction is:
( ) t a n h ( , )g y a y= (11)
A fixed-point algorithm has a cubic or at least a quadratic convergence, is not linear and noparameters have to be chosen for usage which makes it a better choice than other ICA models.
7. Reconstruction of SignalsEEG signals are reconstructed using inverse DWT.
8. Apply CSRevert signals to their original time shift and average the results obtained to produce thedenoised EEG signals.
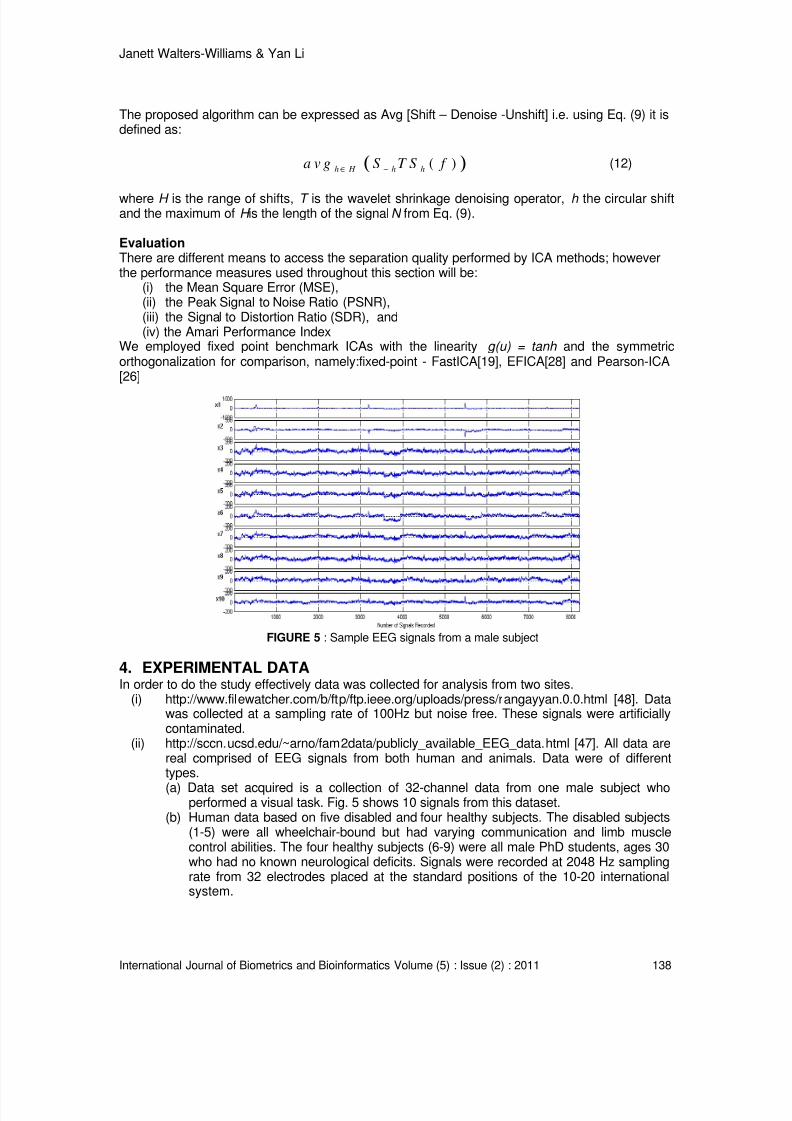
8/6/2019 International Journal of Biometrics and Bioinformatics IJBB_V5_I2
http://slidepdf.com/reader/full/international-journal-of-biometrics-and-bioinformatics-ijbbv5i2 119/133
Janett Walters-Williams & Yan Li
International Journal of Biometrics and Bioinformatics Volume (5) : Issue (2) : 2011 138
The proposed algorithm can be expressed as Avg [Shift – Denoise -Unshift] i.e. using Eq. (9) it isdefined as:
( )( )h H h ha v g S T S f ∈ −
(12)
where H is the range of shifts, T is the wavelet shrinkage denoising operator, h the circular shiftand the maximum of H is the length of the signalN from Eq. (9).
Evaluation There are different means to access the separation quality performed by ICA methods; howeverthe performance measures used throughout this section will be:
(i) the Mean Square Error (MSE),(ii) the Peak Signal to Noise Ratio (PSNR),(iii) the Signal to Distortion Ratio (SDR), and(iv) the Amari Performance Index
We employed fixed point benchmark ICAs with the linearity g(u) = tanh and the symmetricorthogonalization for comparison, namely:fixed-point - FastICA[19], EFICA[28] and Pearson-ICA[26]
FIGURE 5 : Sample EEG signals from a male subject
4. EXPERIMENTAL DATAIn order to do the study effectively data was collected for analysis from two sites.
(i) http://www.filewatcher.com/b/ftp/ftp.ieee.org/uploads/press/rangayyan.0.0.html [48]. Datawas collected at a sampling rate of 100Hz but noise free. These signals were artificiallycontaminated.
(ii) http://sccn.ucsd.edu/~arno/fam2data/publicly_available_EEG_data.html [47]. All data arereal comprised of EEG signals from both human and animals. Data were of differenttypes.
(a) Data set acquired is a collection of 32-channel data from one male subject whoperformed a visual task. Fig. 5 shows 10 signals from this dataset.
(b) Human data based on five disabled and four healthy subjects. The disabled subjects(1-5) were all wheelchair-bound but had varying communication and limb musclecontrol abilities. The four healthy subjects (6-9) were all male PhD students, ages 30who had no known neurological deficits. Signals were recorded at 2048 Hz samplingrate from 32 electrodes placed at the standard positions of the 10-20 internationalsystem.
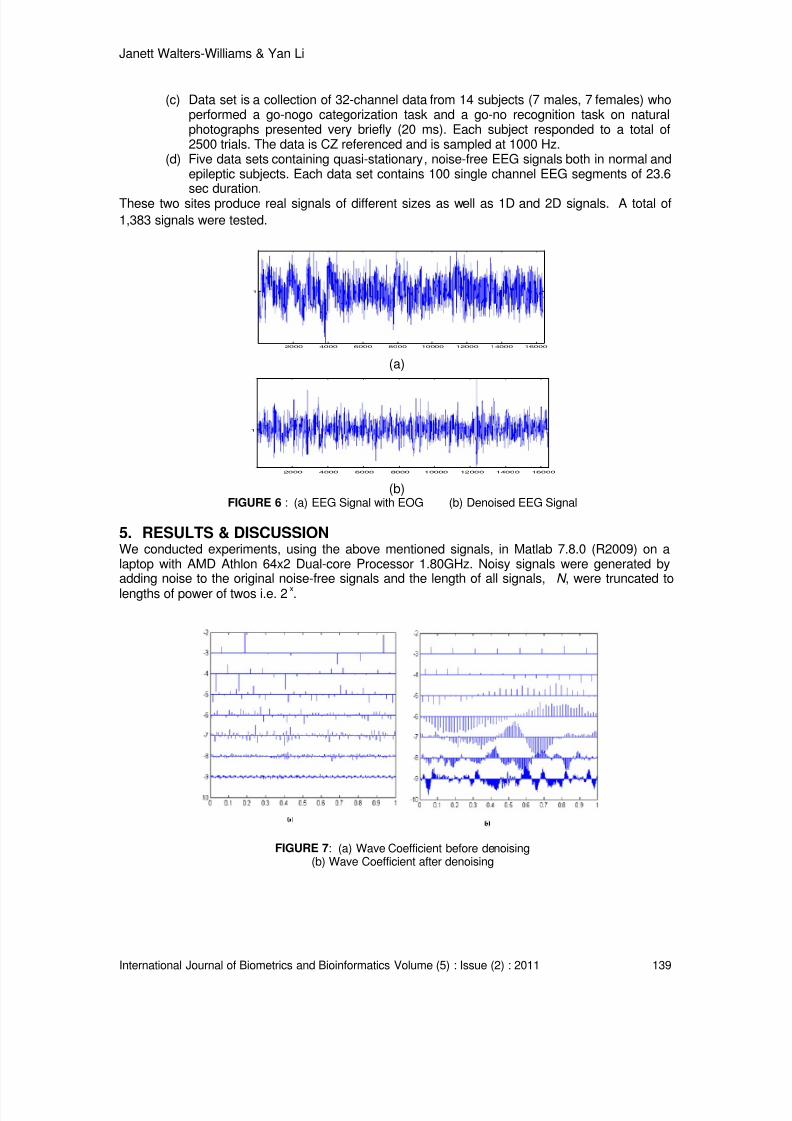
8/6/2019 International Journal of Biometrics and Bioinformatics IJBB_V5_I2
http://slidepdf.com/reader/full/international-journal-of-biometrics-and-bioinformatics-ijbbv5i2 120/133
Janett Walters-Williams & Yan Li
International Journal of Biometrics and Bioinformatics Volume (5) : Issue (2) : 2011 139
(c) Data set is a collection of 32-channel data from 14 subjects (7 males, 7 females) whoperformed a go-nogo categorization task and a go-no recognition task on naturalphotographs presented very briefly (20 ms). Each subject responded to a total of2500 trials. The data is CZ referenced and is sampled at 1000 Hz.
(d) Five data sets containing quasi-stationary, noise-free EEG signals both in normal andepileptic subjects. Each data set contains 100 single channel EEG segments of 23.6sec duration.
These two sites produce real signals of different sizes as well as 1D and 2D signals. A total of
1,383 signals were tested.
2000 4000 6000 8000 10000 12000 14000 16000
1
(a)
2000 4000 6000 8000 10000 12000 14000 16000
1
(b)
FIGURE 6 : (a) EEG Signal with EOG (b) Denoised EEG Signal
5. RESULTS & DISCUSSIONWe conducted experiments, using the above mentioned signals, in Matlab 7.8.0 (R2009) on alaptop with AMD Athlon 64x2 Dual-core Processor 1.80GHz. Noisy signals were generated byadding noise to the original noise-free signals and the length of all signals, N , were truncated to
lengths of power of twos i.e. 2x.
FIGURE 7: (a) Wave Coefficient before denoising(b) Wave Coefficient after denoising
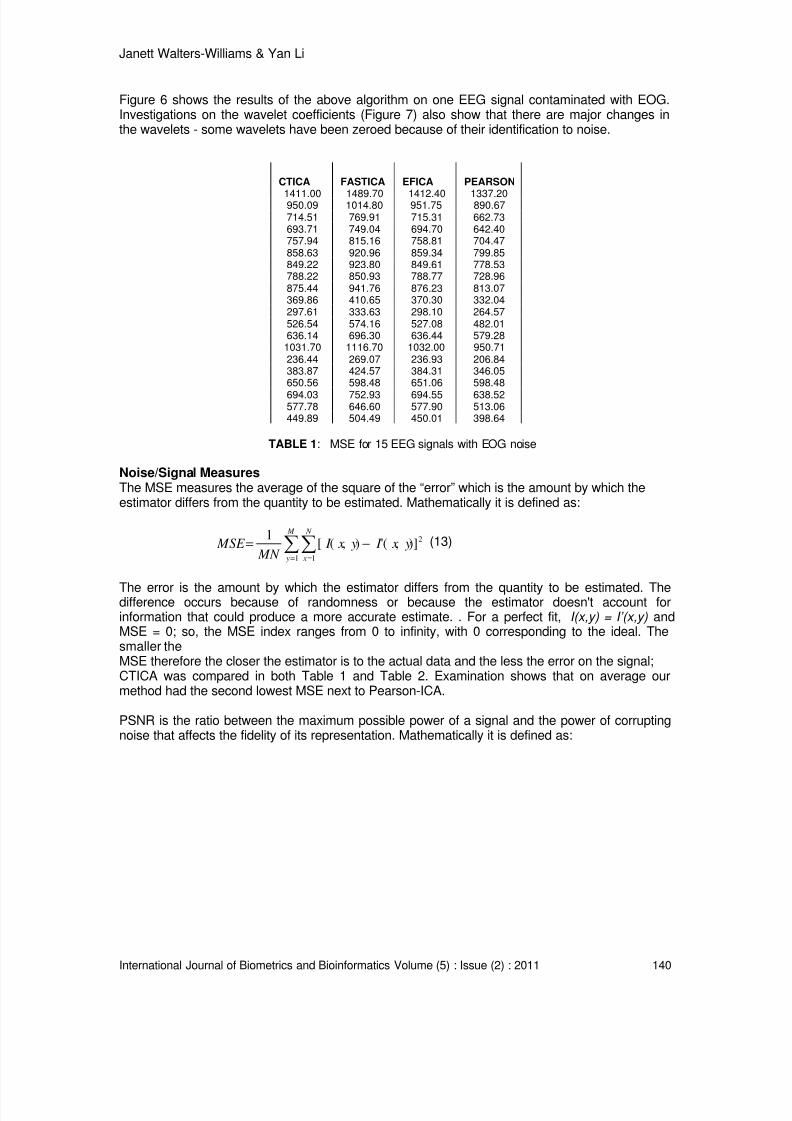
8/6/2019 International Journal of Biometrics and Bioinformatics IJBB_V5_I2
http://slidepdf.com/reader/full/international-journal-of-biometrics-and-bioinformatics-ijbbv5i2 121/133
Janett Walters-Williams & Yan Li
International Journal of Biometrics and Bioinformatics Volume (5) : Issue (2) : 2011 140
Figure 6 shows the results of the above algorithm on one EEG signal contaminated with EOG.Investigations on the wavelet coefficients (Figure 7) also show that there are major changes inthe wavelets - some wavelets have been zeroed because of their identification to noise.
CTICA FASTICA EFICA PEARSON
1411.00 1489.70 1412.40 1337.20950.09 1014.80 951.75 890.67714.51 769.91 715.31 662.73693.71 749.04 694.70 642.40757.94 815.16 758.81 704.47858.63 920.96 859.34 799.85849.22 923.80 849.61 778.53788.22 850.93 788.77 728.96875.44 941.76 876.23 813.07369.86 410.65 370.30 332.04297.61 333.63 298.10 264.57526.54 574.16 527.08 482.01636.14 696.30 636.44 579.281031.70 1116.70 1032.00 950.71236.44 269.07 236.93 206.84383.87 424.57 384.31 346.05650.56 598.48 651.06 598.48
694.03 752.93 694.55 638.52577.78 646.60 577.90 513.06449.89 504.49 450.01 398.64
TABLE 1: MSE for 15 EEG signals with EOG noise
Noise/Signal MeasuresThe MSE measures the average of the square of the “error” which is the amount by which theestimator differs from the quantity to be estimated. Mathematically it is defined as:
2
1 1
1[ ( , ) '( , )]
M N
y x
MSE I x y I x y MN = =
= −∑ ∑ (13)
The error is the amount by which the estimator differs from the quantity to be estimated. Thedifference occurs because of randomness or because the estimator doesn't account forinformation that could produce a more accurate estimate. . For a perfect fit, I(x,y) = I’(x,y) andMSE = 0; so, the MSE index ranges from 0 to infinity, with 0 corresponding to the ideal. Thesmaller theMSE therefore the closer the estimator is to the actual data and the less the error on the signal;CTICA was compared in both Table 1 and Table 2. Examination shows that on average ourmethod had the second lowest MSE next to Pearson-ICA.
PSNR is the ratio between the maximum possible power of a signal and the power of corruptingnoise that affects the fidelity of its representation. Mathematically it is defined as:
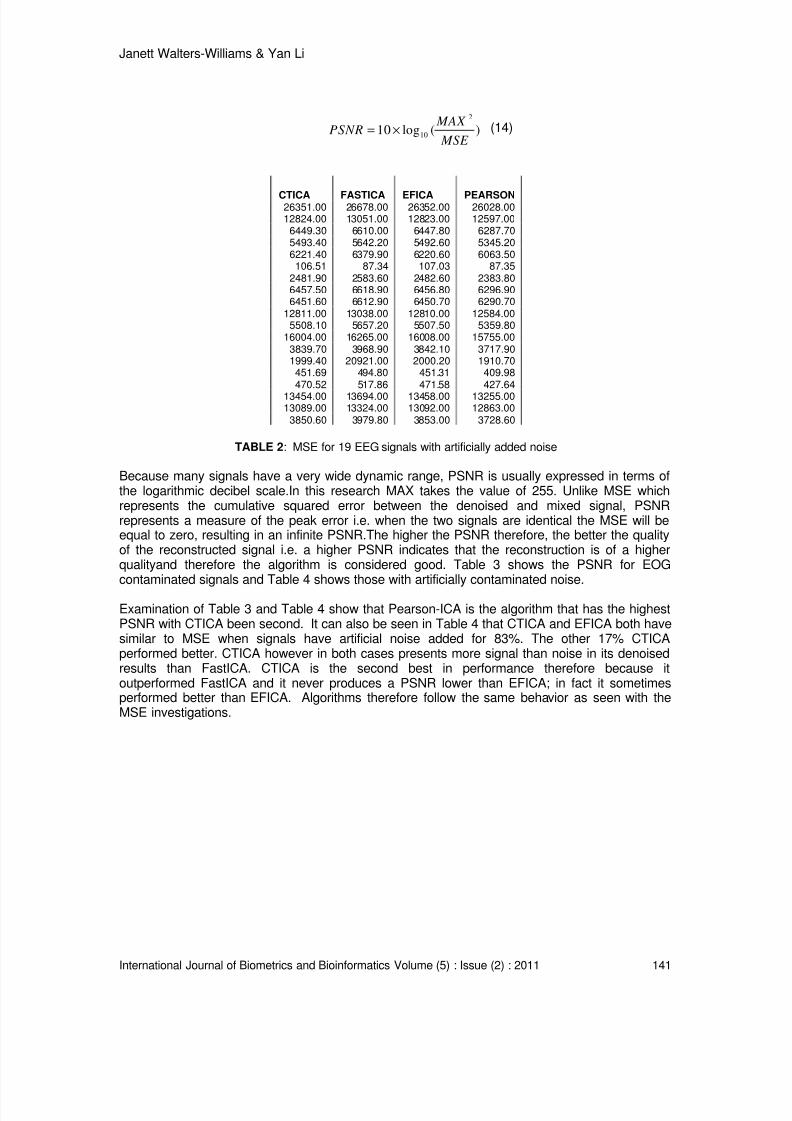
8/6/2019 International Journal of Biometrics and Bioinformatics IJBB_V5_I2
http://slidepdf.com/reader/full/international-journal-of-biometrics-and-bioinformatics-ijbbv5i2 122/133
Janett Walters-Williams & Yan Li
International Journal of Biometrics and Bioinformatics Volume (5) : Issue (2) : 2011 141
2
1010 log ( ) MAX
PSNR MSE
= × (14)
CTICA FASTICA EFICA PEARSON26351.00 26678.00 26352.00 26028.0012824.00 13051.00 12823.00 12597.00
6449.30 6610.00 6447.80 6287.705493.40 5642.20 5492.60 5345.206221.40 6379.90 6220.60 6063.50106.51 87.34 107.03 87.35
2481.90 2583.60 2482.60 2383.806457.50 6618.90 6456.80 6296.906451.60 6612.90 6450.70 6290.70
12811.00 13038.00 12810.00 12584.005508.10 5657.20 5507.50 5359.80
16004.00 16265.00 16008.00 15755.003839.70 3968.90 3842.10 3717.901999.40 20921.00 2000.20 1910.70451.69 494.80 451.31 409.98470.52 517.86 471.58 427.64
13454.00 13694.00 13458.00 13255.0013089.00 13324.00 13092.00 12863.00
3850.60 3979.80 3853.00 3728.60
TABLE 2: MSE for 19 EEG signals with artificially added noise
Because many signals have a very wide dynamic range, PSNR is usually expressed in terms ofthe logarithmic decibel scale.In this research MAX takes the value of 255. Unlike MSE whichrepresents the cumulative squared error between the denoised and mixed signal, PSNRrepresents a measure of the peak error i.e. when the two signals are identical the MSE will beequal to zero, resulting in an infinite PSNR.The higher the PSNR therefore, the better the qualityof the reconstructed signal i.e. a higher PSNR indicates that the reconstruction is of a higherqualityand therefore the algorithm is considered good. Table 3 shows the PSNR for EOGcontaminated signals and Table 4 shows those with artificially contaminated noise.
Examination of Table 3 and Table 4 show that Pearson-ICA is the algorithm that has the highestPSNR with CTICA been second. It can also be seen in Table 4 that CTICA and EFICA both havesimilar to MSE when signals have artificial noise added for 83%. The other 17% CTICAperformed better. CTICA however in both cases presents more signal than noise in its denoisedresults than FastICA. CTICA is the second best in performance therefore because itoutperformed FastICA and it never produces a PSNR lower than EFICA; in fact it sometimesperformed better than EFICA. Algorithms therefore follow the same behavior as seen with theMSE investigations.
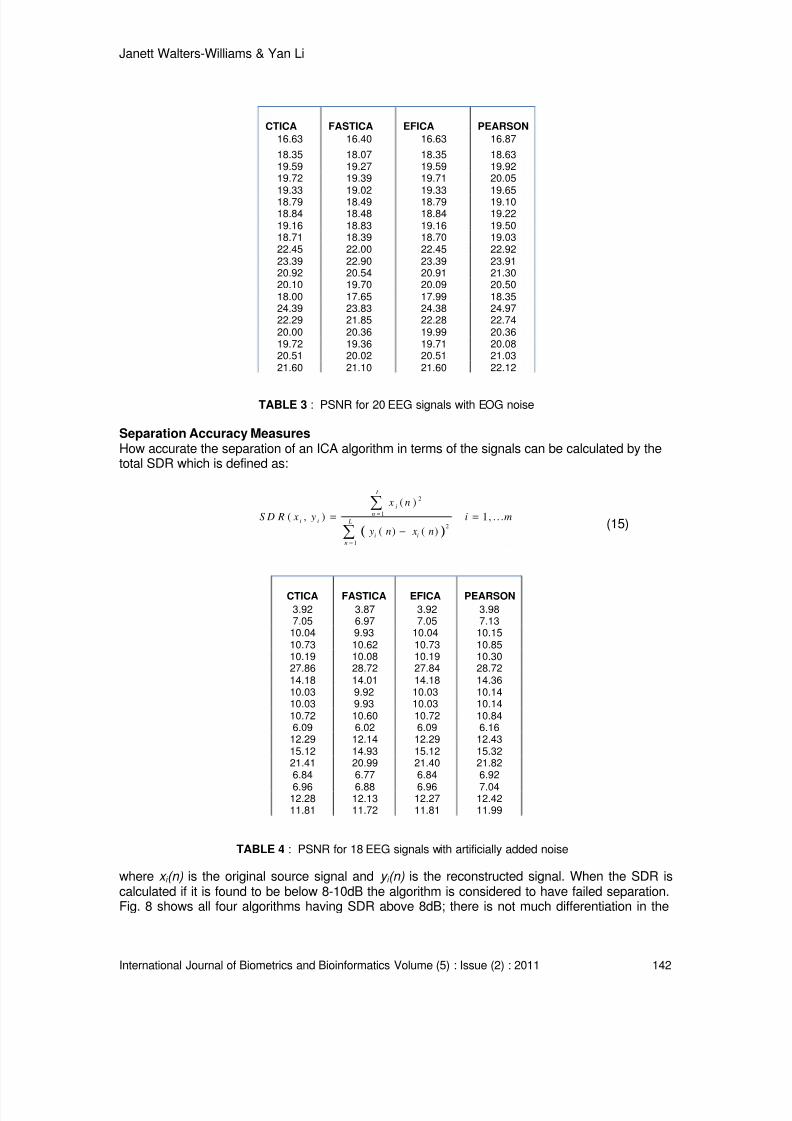
8/6/2019 International Journal of Biometrics and Bioinformatics IJBB_V5_I2
http://slidepdf.com/reader/full/international-journal-of-biometrics-and-bioinformatics-ijbbv5i2 123/133
Janett Walters-Williams & Yan Li
International Journal of Biometrics and Bioinformatics Volume (5) : Issue (2) : 2011 142
CTICA FASTICA EFICA PEARSON
16.63 16.40 16.63 16.87
18.35 18.07 18.35 18.6319.59 19.27 19.59 19.9219.72 19.39 19.71 20.0519.33 19.02 19.33 19.6518.79 18.49 18.79 19.1018.84 18.48 18.84 19.2219.16 18.83 19.16 19.5018.71 18.39 18.70 19.0322.45 22.00 22.45 22.9223.39 22.90 23.39 23.9120.92 20.54 20.91 21.3020.10 19.70 20.09 20.5018.00 17.65 17.99 18.3524.39 23.83 24.38 24.9722.29 21.85 22.28 22.7420.00 20.36 19.99 20.3619.72 19.36 19.71 20.0820.51 20.02 20.51 21.0321.60 21.10 21.60 22.12
TABLE 3 : PSNR for 20 EEG signals with EOG noise
Separation Accuracy MeasuresHow accurate the separation of an ICA algorithm in terms of the signals can be calculated by thetotal SDR which is defined as:
( )
2
1
2
1
( )
( , ) 1, . . .
( ) ( )
L
i
ni i L
i i
n
x n
S D R x y i m
y n x n
=
=
= =
−
∑
∑(15)
CTICA FASTICA EFICA PEARSON
3.92 3.87 3.92 3.987.05 6.97 7.05 7.1310.04 9.93 10.04 10.1510.73 10.62 10.73 10.8510.19 10.08 10.19 10.3027.86 28.72 27.84 28.7214.18 14.01 14.18 14.3610.03 9.92 10.03 10.1410.03 9.93 10.03 10.1410.72 10.60 10.72 10.846.09 6.02 6.09 6.1612.29 12.14 12.29 12.4315.12 14.93 15.12 15.3221.41 20.99 21.40 21.826.84 6.77 6.84 6.92
6.96 6.88 6.96 7.0412.28 12.13 12.27 12.4211.81 11.72 11.81 11.99
TABLE 4 : PSNR for 18 EEG signals with artificially added noise
where x i (n) is the original source signal and y i (n) is the reconstructed signal. When the SDR iscalculated if it is found to be below 8-10dB the algorithm is considered to have failed separation.Fig. 8 shows all four algorithms having SDR above 8dB; there is not much differentiation in the
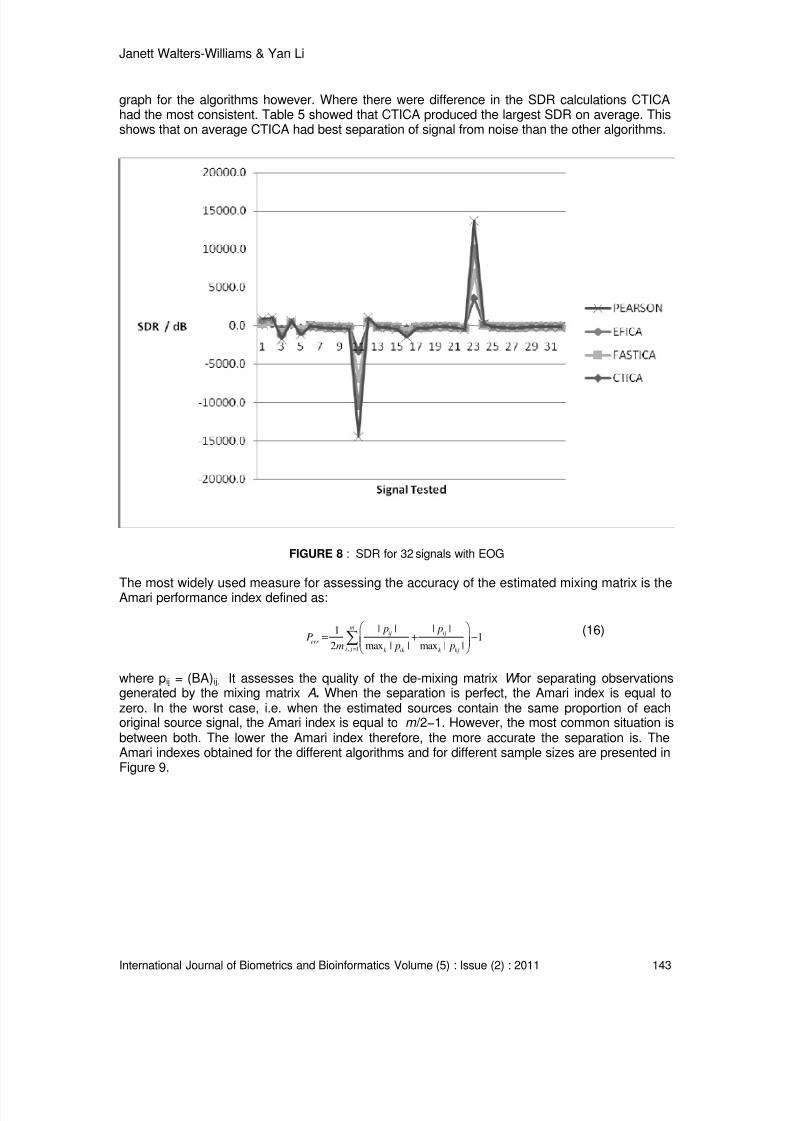
8/6/2019 International Journal of Biometrics and Bioinformatics IJBB_V5_I2
http://slidepdf.com/reader/full/international-journal-of-biometrics-and-bioinformatics-ijbbv5i2 124/133
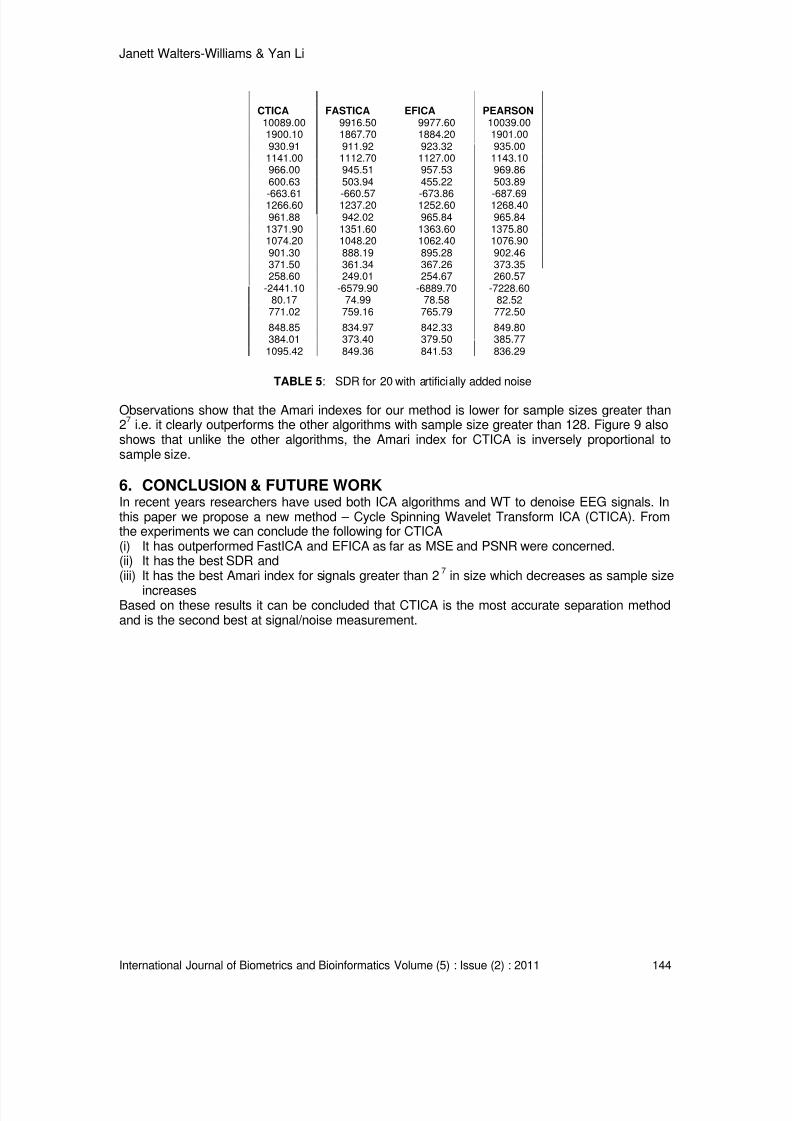
8/6/2019 International Journal of Biometrics and Bioinformatics IJBB_V5_I2
http://slidepdf.com/reader/full/international-journal-of-biometrics-and-bioinformatics-ijbbv5i2 125/133
Janett Walters-Williams & Yan Li
International Journal of Biometrics and Bioinformatics Volume (5) : Issue (2) : 2011 144
CTICA FASTICA EFICA PEARSON10089.00 9916.50 9977.60 10039.001900.10 1867.70 1884.20 1901.00930.91 911.92 923.32 935.001141.00 1112.70 1127.00 1143.10966.00 945.51 957.53 969.86600.63 503.94 455.22 503.89
-663.61 -660.57 -673.86 -687.691266.60 1237.20 1252.60 1268.40961.88 942.02 965.84 965.841371.90 1351.60 1363.60 1375.801074.20 1048.20 1062.40 1076.90901.30 888.19 895.28 902.46371.50 361.34 367.26 373.35258.60 249.01 254.67 260.57
-2441.10 -6579.90 -6889.70 -7228.6080.17 74.99 78.58 82.52771.02 759.16 765.79 772.50
848.85 834.97 842.33 849.80384.01 373.40 379.50 385.771095.42 849.36 841.53 836.29
TABLE 5: SDR for 20 with artificially added noise
Observations show that the Amari indexes for our method is lower for sample sizes greater than2
7i.e. it clearly outperforms the other algorithms with sample size greater than 128. Figure 9 also
shows that unlike the other algorithms, the Amari index for CTICA is inversely proportional tosample size.
6. CONCLUSION & FUTURE WORKIn recent years researchers have used both ICA algorithms and WT to denoise EEG signals. Inthis paper we propose a new method – Cycle Spinning Wavelet Transform ICA (CTICA). Fromthe experiments we can conclude the following for CTICA(i) It has outperformed FastICA and EFICA as far as MSE and PSNR were concerned.(ii) It has the best SDR and(iii) It has the best Amari index for signals greater than 2
7in size which decreases as sample size
increasesBased on these results it can be concluded that CTICA is the most accurate separation methodand is the second best at signal/noise measurement.
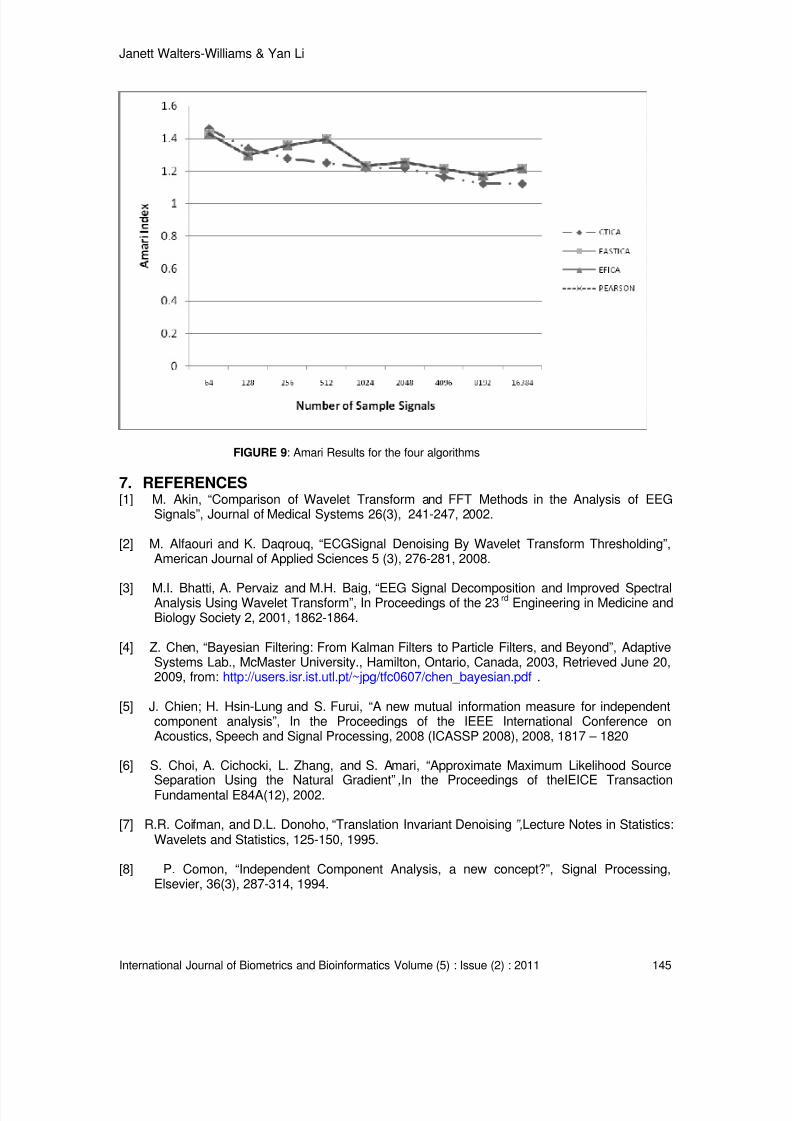
8/6/2019 International Journal of Biometrics and Bioinformatics IJBB_V5_I2
http://slidepdf.com/reader/full/international-journal-of-biometrics-and-bioinformatics-ijbbv5i2 126/133
Janett Walters-Williams & Yan Li
International Journal of Biometrics and Bioinformatics Volume (5) : Issue (2) : 2011 145
FIGURE 9: Amari Results for the four algorithms
7. REFERENCES[1] M. Akin, “Comparison of Wavelet Transform and FFT Methods in the Analysis of EEG
Signals”, Journal of Medical Systems 26(3), 241-247, 2002.
[2] M. Alfaouri and K. Daqrouq, “ECGSignal Denoising By Wavelet Transform Thresholding”,American Journal of Applied Sciences 5 (3), 276-281, 2008.
[3] M.I. Bhatti, A. Pervaiz and M.H. Baig, “EEG Signal Decomposition and Improved SpectralAnalysis Using Wavelet Transform”, In Proceedings of the 23
rdEngineering in Medicine and
Biology Society 2, 2001, 1862-1864.
[4] Z. Chen, “Bayesian Filtering: From Kalman Filters to Particle Filters, and Beyond”, AdaptiveSystems Lab., McMaster University., Hamilton, Ontario, Canada, 2003, Retrieved June 20,2009, from: http://users.isr.ist.utl.pt/~jpg/tfc0607/chen_bayesian.pdf .
[5] J. Chien; H. Hsin-Lung and S. Furui, “A new mutual information measure for independentcomponent analysis”, In the Proceedings of the IEEE International Conference onAcoustics, Speech and Signal Processing, 2008 (ICASSP 2008), 2008, 1817 – 1820
[6] S. Choi, A. Cichocki, L. Zhang, and S. Amari, “Approximate Maximum Likelihood Source
Separation Using the Natural Gradient”,In the Proceedings of theIEICE TransactionFundamental E84A(12), 2002.
[7] R.R. Coifman, and D.L. Donoho, “Translation Invariant Denoising”,Lecture Notes in Statistics:Wavelets and Statistics, 125-150, 1995.
[8] P. Comon, “Independent Component Analysis, a new concept?”, Signal Processing,Elsevier, 36(3), 287-314, 1994.
8/6/2019 International Journal of Biometrics and Bioinformatics IJBB_V5_I2
http://slidepdf.com/reader/full/international-journal-of-biometrics-and-bioinformatics-ijbbv5i2 127/133
Janett Walters-Williams & Yan Li
International Journal of Biometrics and Bioinformatics Volume (5) : Issue (2) : 2011 146
[9] D.L. Donoho and I. Johnstone, “Adapting to unknown smoothness via wavelet shrinkage” ,Journal of American Statistical Association, 90,1200—1224, 1995.
[10] U.E. Emuir, A. Akin, A. Ertuzun, B. Sankur and K. Harmanci, “Wavelet Denoising vs ICADenoising for Functional Optical Imaging”, In the Proceedings of the 1
stInternational IEEE
EMBS Conference on Neural Engineering, 2003, 384-387.
[11] B. Ferguson, D. Abbott, “Denoising Techniques for Terahertz Response of BiologicalSamples” , Microelectronics Journal 32, 943-953, 2001.
[12] N. Gadhok, and W. Kinsner, “Robust ICA for Cognitive Informatics”. International Journal ofCognitive Informatics and Natural Intelligence (IJCINI) 2(4),86-92, 2008.
[13] S. P. Ghael, A. M. Sayeed and R. G. Baraniuk, “Improved Wavelet Denoising via EmpiricalWiener Filtering”, In the Proceedings of theSPIEvol. 3169, 389-399, 1997.
[14] A. Graps, An Introduction to Wavelets. IEEE Journal of Computational Science andEngineering 2(2),1-17, 1995.
[15] Y.M. Hawwar, A.M. Reza, and R.D. Turney, Filtering(Denoising) in the Wavelet Transform
Domain,, Unpublished, Department of Electrical Engineering And Computer Science,University of Wisconsin-Milwaukee, 2002.
[16] C.S. Herrmann, M. Grigutsch and N.A. Busch, (2005). EEG oscillations and wavelet
analysis. Event-related potentials: A methods handbook,MIT Press, 229-259, 2005.
[17] G.G. Herrero, and K. Egiazarian, “Independent Component Analysis by a Resampling
Strategy”, Technical Report 2005, Retrieved September 18, 2009,
fromhttp://www.cs.tut.fi/~gomezher/projects/bss/rica/rica.pdf
[18] S. Hoffman, and M. Falkenstien , “The Correction of Eye Blink Artefacts in the EEG: AComparison of a Two Prominent Methods”, PLoS One 3(8):e3004, 2008
[19] A. Hyvärinen and E. Oja, “A Fast Fixed-Point Algorithm for Independent Component
Analysis” , Neural Computation,9(7), 1483-1492, 1997
[20] A. Hyvarinen, J. Karhunen and E. Oja , Independent Component Analysis, eds. Wiley &
Sons, 2001
[21] G. Inuso, F. La Foresta, N. Mammone, and F.C. Morabito, “Wavelet-ICA methodology for
efficient artifact removal from Electroencephalographic recordings”, In the Proceedings of
the International Conference on Neural Networks,1524-1529, 2007.
[22] N. Jacob, and A. Martin, “Image Denoising in the Wavelet Domain Using Wiener Filtering”,Unpublished course project, University of Wisconsin, Madison, Wisconsin, USA, 2004.
[23] S. Julier, and J.K. Uhlmann, “Unscented Filtering and Nonlinear Estimation”,Proceedings ofthe. IEEE 92(3), 401-421, 2004.
[24] S. Julier, and J.K. Uhlmann, “A New Extension of the Kalman Filter to Nonlinear Systems”In the Proceedingd of AeroSense: 11th Int. Symp. Aerospace/Defense Sensing, Simulationand Controls,182-193, 1997.
8/6/2019 International Journal of Biometrics and Bioinformatics IJBB_V5_I2
http://slidepdf.com/reader/full/international-journal-of-biometrics-and-bioinformatics-ijbbv5i2 128/133
Janett Walters-Williams & Yan Li
International Journal of Biometrics and Bioinformatics Volume (5) : Issue (2) : 2011 147
[25] A. Kallapur, S. Anavatti, and M. Garratt, “Extended and Unscented Kalman Filters forAttitude Estimation of an Unmanned Aerial Vehicle,In the Proceedings of the 27
thIASTED
Int. Conf. Modelling, Identification, and Control (MIC 2008) , 2008
[26] J. Karvanen, J.,Eriksson, and K.V. Pearson, “System Based Method for Blind Separation",In the Proceedings of Second International Workshop on Independent Component Analysisand Blind Signal Separation, Helsinki 2000, 585—590, 2000.
[27] L. Kaur, S. Gupta, and R.C. Chauhan, “Image Denoising using Wavelet Thresholding”, Inthe Proceedings of the 3
rdIndian Conf. Computer Vision, Graphics & Image Processing
(ICVGIP 2002), 22(14), 2002.
[28] Z. Koldovský and P. Tichavský, P., "Time-Domain Blind Audio Source Separation Using
Advanced ICA Methods", In the Proceedings of the 8th Annual Conference of the
International Speech Communication Association (Interspeech 2007), pp. 846-849, 2007.
[29] V. Krishnaveni, S. Jayaraman, A. Gunasekaran, and K. Ramadoss, Automatic Removal of
Ocular Artifacts using JADE Algorithm and Neural Network, International Journal of
Intelligent Systems and Technologies 1(4), 322-333, 2006.
[30] V. Krishnaveni, S. Jayaraman, S. Aravind, V. Hariharasudhan, and K. Ramadoss,
“Automatic Identification and Removal of Ocular Artifacts from EEG using Wavelet
Transform”,Measurement Science Review 6(2, 4), 45-57, 2006.
[31] S. Makeig, J. Anthony, A. J. Bell, T. Jung, and T.J. Sejnowski,. “Independent Component
Analysis of Electroencephalographic data” , Advances in Neural Information Processing
Systems 8, 1996.
[32] M. Mastriani, and A.E. Giraldez, “Kalman’s Shrinkage for Wavelet-Based Despeckling of
SAR Images” , International Journal of Intelligent Systems and Technologies 1(3),190-196,
2006.
[33] N. Nikolaev, A. Gotchev, “ECG Signal Denoising using Wavelet Domain Wiener Filtering” In
the Proceedings of the 10thEuropean Signal Processing Conference (EUSIPCO 2000),
2000
[34] S. Postalcioglu, K. Erkan, E.D. Bolat, “Comparison of Kalman Filter and Wavelet Filter for
Denoising”, In the Proceedings of the International Conference onNeural Networks and
Brain 2005 Vol. 2, 951 – 954, 13-15 Oct. 2005
[35] V.V.K.D.V. Prasad, P. Siddaiah, and B. Prabhaksrs Rao, “A New Wavelet Based Method
for Denoising of Biological Signals”, International Journal of Computer Science and
Network Security 8(1), 2008, 238-244, 2008.
[36] R. Romo-Vazquez, R., Ranta, V. Louis-Dorr, and D. Maquin, “Ocular Artifacts Removal in
Scalp EEG: Combining ICA and Wavelet Denoising”, In the Proceedings of Physics in
Signal and Image Processing (PSISP 07), 2007
[37] R. Sameni, M.B. Shamsollahi, and C. Jutten, “Filtering Electrocardiogram Signals using theExtended Kalman Filter” , In the Proceedings of the 27
thIEEE Engineering in Medicine and
Biology (EMBS) Annual Conference, 5639-5642, 2005.
8/6/2019 International Journal of Biometrics and Bioinformatics IJBB_V5_I2
http://slidepdf.com/reader/full/international-journal-of-biometrics-and-bioinformatics-ijbbv5i2 129/133
Janett Walters-Williams & Yan Li
International Journal of Biometrics and Bioinformatics Volume (5) : Issue (2) : 2011 148
[38] P. Senthil Kumar, R. Arumuganathan, K. Sivakumar, and C. Vimal, “A Wavelet basedStatistical Method for De-noising of Ocular Artifacts in EEG Signals”,IJCSNS InternationalJournal of Computer Science and Network Security. 8(9), 87-92, 2008.
[39] P. Senthil Kumar, R. Arumuganathan, K. Sivakumar, and C. Vimal, “Removal of OcularArtifacts in the EEG through Wavelet Transform without using an EOG ReferenceChannel”, International Journal of Open Problems in Computer Science & Mathematics1(3). 2008
[40] P. Shui, and Y. Zhao, Image Denoising Algorithm using Doubling Local Wiener Filteringwith Block Adaptive Windows in Wavelet Domain, Signal Processing 87(7), 1721-1734,2007.
[41] L. SuWen, L, WenQing, X. PinHua, Z. YuJui, “Application of Kalman Filtering and WaveletTransform in DOAS” , In the Proceedings of the 2006 IEEE International Conference onInformation Acquisition, 748-753, 2006.
[42] M. Unser, and A. Aldroubi, “A Review of Wavelets in Biomedical Applications”, In theProceedings of the IEEE 84(4), 626-638, 1996.

8/6/2019 International Journal of Biometrics and Bioinformatics IJBB_V5_I2
http://slidepdf.com/reader/full/international-journal-of-biometrics-and-bioinformatics-ijbbv5i2 130/133
INSTRUCTIONS TO CONTRIBUTORS
The International Journal of Biometric and Bioinformatics (IJBB) brings together both of theseaspects of biology and creates a platform for exploration and progress of these, relatively newdisciplines by facilitating the exchange of information in the fields of computational molecularbiology and post-genome bioinformatics and the role of statistics and mathematics in the
biological sciences. Bioinformatics and Biometrics are expected to have a substantial impact onthe scientific, engineering and economic development of the world. Together they are acomprehensive application of mathematics, statistics, science and computer science with an aimto understand living systems.
We invite specialists, researchers and scientists from the fields of biology, computer science,mathematics, statistics, physics and such related sciences to share their understanding andcontributions towards scientific applications that set scientific or policy objectives, motivatemethod development and demonstrate the operation of new methods in the fields of Biometricsand Bioinformatics.
To build its International reputation, we are disseminating the publication information throughGoogle Books, Google Scholar, Directory of Open Access Journals (DOAJ), Open J Gate,
ScientificCommons, Docstoc and many more. Our International Editors are working onestablishing ISI listing and a good impact factor for IJBB.
The initial efforts helped to shape the editorial policy and to sharpen the focus of the journal.Starting with volume 5, 2011, IJBB appears in more focused issues. Besides normal publications,IJBB intend to organized special issues on more focused topics. Each special issue will have adesignated editor (editors) – either member of the editorial board or another recognized specialistin the respective field.
We are open to contributions, proposals for any topic as well as for editors and reviewers. Weunderstand that it is through the effort of volunteers that CSC Journals continues to grow andflourish.
LIST OF TOPICS The realm of International Journal of Biometrics and Bioinformatics (IJBB) extends, but notlimited, to the following:
• Bio-grid • Bio-ontology and data mining
• Bioinformatic databases • Biomedical image processing (fusion)
• Biomedical image processing (registration) • Biomedical image processing (segmentation)• Biomedical modelling and computer
simulation• Computational genomics
• Computational intelligence • Computational proteomics
• Computational structural biology • Data visualisation• DNA assembly, clustering, and mapping • E-health
• Fuzzy logic • Gene expression and microarrays• Gene identification and annotation • Genetic algorithms
• Hidden Markov models • High performance computing• Molecular evolution and phylogeny • Molecular modelling and simulation
• Molecular sequence analysis • Neural networks

8/6/2019 International Journal of Biometrics and Bioinformatics IJBB_V5_I2
http://slidepdf.com/reader/full/international-journal-of-biometrics-and-bioinformatics-ijbbv5i2 131/133
CALL FOR PAPERS
Volume: 5 - Issue: 4 - July 2011
i. Paper Submission: July 31, 2011 ii. Author Notification: September 01, 2011
iii. Issue Publication: September / October 2011

8/6/2019 International Journal of Biometrics and Bioinformatics IJBB_V5_I2
http://slidepdf.com/reader/full/international-journal-of-biometrics-and-bioinformatics-ijbbv5i2 132/133
CONTACT INFORMATION
Computer Science Journals Sdn BhDM-3-19, Plaza Damas Sri Hartamas
50480, Kuala Lumpur MALAYSIA
Phone: 006 03 6207 1607006 03 2782 6991
Fax: 006 03 6207 1697
Email: [email protected]
8/6/2019 International Journal of Biometrics and Bioinformatics IJBB_V5_I2
http://slidepdf.com/reader/full/international-journal-of-biometrics-and-bioinformatics-ijbbv5i2 133/133