Embed Size (px)
Citation preview

International Journal of Advance Research in Engineering, Science & Technology
e-ISSN: 2393-9877, p-ISSN: 2394-2444
Volume 5, Issue 4, April-2018
All Rights Reserved, @IJAREST-2018 126
Impact Factor (SJIF): 5.301
STUDY OF DYNAMIC RESISTANCE OF RC BUILDING BY USING TUNED
MASS DAMPERS
MUKESH K. PATEL
1, BHARAT G. BHUDIYA
2, AKASH V. MODI
3
1ME (Structural Engineering) Student, Veerayatan Institute of Engineering, Mandvi-Kutch 2 Assistant Professor, Civil Department, Veerayatan Institute of Engineering, Mandvi-Kutch
3 Assistant Professor, Civil Department, Merchant Engineering College, Basna, Visnagar
Abstract - This paper shows that G + 26 story structures with Plan irregularity of 3 Equal height of the structure system
with and without STMD and MTMD for structural. The Design Procedure has elaborated and the storey displacement,
storey drifts, base shear, storey shear and time period will be studied with comparison of optimum position of mass.
Finally concluding remarks has been highlighted.
Keywords- Tuned Mass Damper, Multiple Tuned Mass Dampers, Vibration Control Device, Mass Ratio, Natural Time
Period, Etabs
I. INTRODUCTION
Earthquake may be defined as a wave like motion generated by forces in constant turmoil under the surface layer of the
earth (lithosphere), travelling through the earth’s crust. It may also be defined as the vibration, sometimes violent, of the
earth’s surface as a result of a release of energy in the earth’s crust. This release of energy can cause by sudden
dislocations of segments of the crust, volcanic eruption, or even explosion created by humans. Dislocations of crust
segments, however, lead to the most destructive quakes. Tuned mass dampers (TMD) have been widely used for
vibration control in mechanical engineering systems. In recent years, TMD theory has been adopted to reduce vibrations of
tall buildings and other civil engineering structures.TMD is attached to a structure in order to reduce the dynamic response
of the structure. The frequency of the damper is tuned to a particular structural frequency so that when that frequency is
excited, the damper will resonate out of phase with the structural motion. The mass is usually attached to the building via a
spring-dashpot system and energy is dissipated by the dashpot as relative motion develops between the mass and the structure. The concept of the tuned mass damper (TMD) dates back to the 1940s (Den Hartog 1947). It consists of a
secondary mass with properly tuned spring and damping elements, providing a frequency-dependent hysteresis that
increases damping in the primary structure. The success of such a system in reducing wind-excited structural vibrations is
now well established. Recently, numerical and experimental studies have been carried out on the effectiveness of TMDs in
reducing seismic response of structures (for instance, Villaverde (1994).The first structure in which tuned mass damper
was installed is the Centre point Tower in Sydney, Australia. Tuned mass damper is attached to a vibrating structure to
reduce undesirable vibrations. Tuned mass damper is a passive energy absorbing device consisting of a mass, a spring and
a viscous damper.
The aim of the present study of G + 26 story structure with Plan irregularity of 3 Equal height of the structure
system with and without STMD and MTMD for structural
II. LITERATURE REVIEW
Fredy Picauly, Hrc. Priyosulistyo[1] are used a passive damper system named tuned mass damper with additional “X –
Shaped Metal” absorber as an additional damper which was applied to the concrete slab having a dimension of 4 m in
length, 0.90m in width and 0.08m in thickness. Result obtained TMD system will be able to reduce the vibration when
TMD frequency is set to near about structure frequency. With the TMD mass ratio of 2.0%, the TMD is able to reduce the
amplitude of the main system (slab) from 18.68 mm to 0.68 mm at the original natural frequency, but it stimulates
additional amplitudes of 12.93 mm at its surroundings.
Dr. Mohan M. Murudi, Mr. Sharadchandra M. Mane[2] the effectiveness of TMD in controlling the seismic response
of structures and the influence of various ground motion parameters on the seismic effectiveness of TMD have been
investigated. Result obtained TMD is effective for controlling structural response to harmonic base excitation.TMD is most effective for lightly damped structure, and its effectiveness decreases as with increase in structural damping. TMD is
more effective for long duration earthquake ground motions.
H. R. Owji, A Hossain Nezhad Shirazi[3] the behavior of a structure equipped with a new type of semiactive tuned mass
damper called SADA-TMD is compared to the behavior of a structure equipped with active tuned mass damper

International Journal of Advance Research in Engineering, Science & Technology (IJAREST) Volume 5, Issue 4, April 2018, e-ISSN: 2393-9877, print-ISSN: 2394-2444
All Rights Reserved, @IJAREST-2018 127
(ATMD).result obtained In this paper the effects of SADA-TMD to control the structural vibration was compared with the
effects of ATMD. It is clear that active actuators needs high amount of power to produce required force to control
structural vibration but SADA needs only a power source like power of a battery, so it is more reliable than active actuator
during sever earthquakes. Finding a method to calculate optimal amount of SADA-TMD characteristics or improvement
the fuzzy logic controller characteristics can be done in future works. Finding another rule to determine the activation time
in order to raise the effects of SADATMD also is a matter of interest.
Tharwat A. Sakr[4] an innovative technique for using partial floor loads as multiple TMDs at limited number of floors.
This technique eliminates complications resulting from the addition of huge masses required for response control and
maintains the mass of the original structure without any added loads. The effects of using partial loads of limited floors
starting from the top as TMDs on the vibration response of buildings to wind and earthquakes are investigated. Result
obtained The existence of multiple-story TMDs significantly reduces the drift, acceleration, and force response of all
examined buildings subjected to sinusoidal dynamic loads. An increase in qi and the number of stories utilized as TMDs
significantly enhances the response of all types of buildings to sinusoidal loads.
Yoyong Arfiadi[5] the optimization of composite tuned mass dampers in reducing the response of structures subject to
earthquake are discussed. Composite tuned mass dampers are mass dampers that consist of two mass dampers connected in
series.result obtained It is found that the ratio of auxiliary mass to the total mass of damper does not affect significantly the
response of the structure. It is also possible that the optimum parameters of the dampers are not unique for a certain mass
ratio of dampers.
Z. Guenidi, M. Abdeddaim[6] the responses of the two buildings are controlled by using two strategies: i) a shared tuned
mass damper (TMD) ii) a hybrid system using both a TMD and a MR damper.result obtained Base shear increases with the
increase in no of stories and there is decrease in base shear for mass ratio Md / M = 0.25. The TMD with mass ratio 0.25 is
most effective in controlling the various parameters in a building when compared with mass ratio 0.5 and 0.75 in the study.
Said Elias, Vasant Matsagar[7] Wind response control of tall buildings installed with a tuned mass damper (TMD) is
investigated. The performance of a TMD installed at the topmost floor of a 76-storey benchmark building is compared
with the TMD installed at different floors (locations) of the building. Result obtained the installation of a TMD is effective
in improving the dynamic performance of the building under the wind excitations. The peak and RMS acceleration
response are reduced up to about 50%.The maximum peak and RMS displacement response reduction in case of the TMD1 installed at the topmost floor and TMD2, TMD3, TMD4, and TMD5, respectively, are 30%, 25%, 15%, 8%, and 4%.
Said Elias, Vasant Matsagar[8] Distributed multiple tuned mass dampers (d-MTMDs) are installed for multimode control
of the chimney including soil-structure interaction (SSI) subjected to along-wind forces is investigated. Comparison of
peak responses is made for the chimney installed with the single tuned mass damper (STMD), distributed multiple tuned
mass dampers all controlling the fundamental modal responses (d-MTMDs-1), arbitrarily distributed tuned mass dampers
(ad-MTMDs), and distributed tuned mass dampers (d-MTMDs) subjected to along-wind forces with different mean wind
velocity. Result obtained The d-MTMDs are more effective than the STMD, d-MTMDs-1, and adMTMDs, while
considering equal total mass of the TMD(s).The responses of tall cylindrical chimneys drastically reduce under along-wind
forces by increasing the foundation flexibility.
III. PROBLEM STATEMENT
The example consists of designing a 27 storey moment resisting RC frame using Etabs. The frame has equal bay width of
5.0m and storey heights of 4.0m. It is located in Zone-IV and Zone-V. The building is assumed to be constructed in hard
soil condition.
Table 1. Structure Data
Structure data
Beam 250 x 600 mm
Story 1 to 9 500 x 1000 mm
Story 10 to 18 500 x 900 mm
Story 19 to 27 500 x 800 mm
Height of each story 4 mm
Thickness of slab 150 mm
Outer wall 230 mm
Internal wall 150 mm
Terrace wall 150 mm

International Journal of Advance Research in Engineering, Science & Technology (IJAREST) Volume 5, Issue 4, April 2018, e-ISSN: 2393-9877, print-ISSN: 2394-2444
All Rights Reserved, @IJAREST-2018 128
Grade of concrete M 25
Density of concrete 25 KN / m2
Grade of steel HYSD 415
Loading data
Live load 3 kN /m2 at all floor
Floor finish load 1 kN /m2 at all floor
Water Proofing 2 kN /m2 at Terrace
Earthquake Data
Zone IV OR V
Response reduction factor R =5 As Par IS:1893-2002 , Page
-23
Importance factor I = 1.5 As Per IS : 1893-2002, P-
18
Zone factor 0.36 For Zone V
0.24 For Zone VI
Type of the site I
Figure 1. Storey 1 to 9 Story plan Figure 2. Storey 10 to 18 Story plan Figure 3. Storey 19 to 27 Story plan
Figure 4. 3-D model of structure
In this study, as per given definition of scale factor for RSA in ETABS manual,
SF= (I x g / 2R)
For this study here,
Importance factor I = 1.5
Response reduction factor R = 5

International Journal of Advance Research in Engineering, Science & Technology (IJAREST) Volume 5, Issue 4, April 2018, e-ISSN: 2393-9877, print-ISSN: 2394-2444
All Rights Reserved, @IJAREST-2018 129
And gravitational acceleration g = 9.81.
So,
For this value of scale factor in this study, Dynamic analysis base shear is less than Static analysis base shear. So
according to clause 7.8.2 of IS 1893-2002.
SF = (I x g / 2R) x 0.8 x (EQ-X Base Shear / RS-X Base Shear)
In present study, following model are compared to each other in to different zone and comparison result are
discuses in below
Figure 5. Models
Table 2. TMD Details
Total Mass Of Structure 729880.3 KN
3 % TMD MASS 21896.409 KN
1.5 % TMD MASS 10948.2045 KN
1% TMD MASS 7298.803 KN
IV. RESULT AND DISCUSSION
The comparative results and graph for time period of All Models is shown in below.
Table 3. Results for time period of All Models
Mode Without
TMD
3%
TMD at
Top
1.5% TMD
at 27 and 18
storey
1.5% TMD
at 27 and 9
storey
1.5% TMD
at 18 and 9
storey
1% TMD at Each
plan irregularity
1 3.023 3.023 3.023 3.023 3.023 3.023
2 2.671 2.479 2.382 2.458 2.534 2.363
3 2.172 2.172 2.172 2.172 2.172 2.172

International Journal of Advance Research in Engineering, Science & Technology (IJAREST) Volume 5, Issue 4, April 2018, e-ISSN: 2393-9877, print-ISSN: 2394-2444
All Rights Reserved, @IJAREST-2018 130
4 1.306 1.306 1.306 1.306 1.306 1.306
5 1.148 1.123 1.123 1.117 1.14 1.116
6 1.113 1.113 1.113 1.113 1.113 1.113
7 0.821 0.821 0.821 0.821 0.821 0.821
8 0.744 0.744 0.744 0.744 0.744 0.744
9 0.71 0.706 0.703 0.705 0.706 0.702
10 0.522 0.522 0.522 0.522 0.522 0.522
11 0.446 0.445 0.445 0.445 0.446 0.445
12 0.43 0.43 0.43 0.43 0.43 0.43
Figure 6. Comparative Time Period of All Models
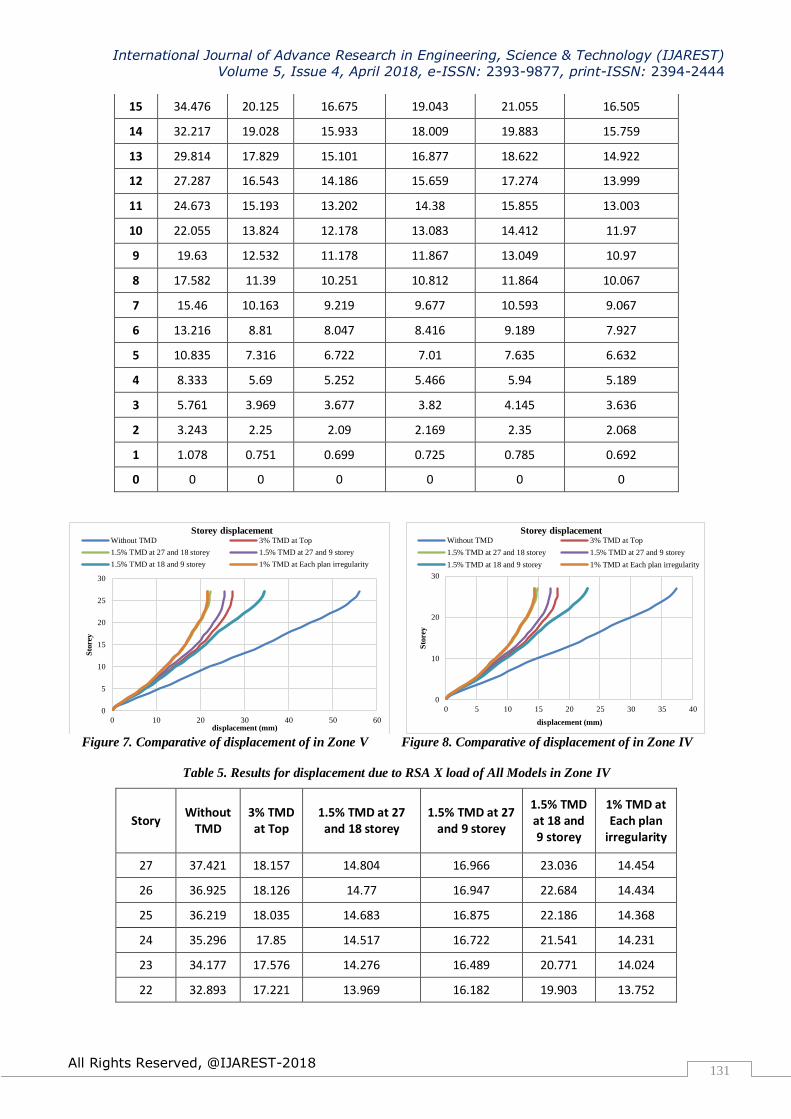
The comparative results and graph for storey displacement of All Models for RSA X load in Zone V
Table 4. Results for displacement due to RSA X load of All Models in Zone V
Story Without
TMD 3% TMD at Top
1.5% TMD at 27 and 18
storey
1.5% TMD at 27 and 9
storey
1.5% TMD at 18 and 9
storey
1% TMD at Each plan irregularity
27 56.132 27.235 22.207 25.449 34.554 21.681
26 55.387 27.189 22.155 25.42 34.026 21.651
25 54.329 27.052 22.024 25.313 33.279 21.552
24 52.943 26.775 21.775 25.083 32.311 21.346
23 51.266 26.364 21.414 24.734 31.157 21.036
22 49.339 25.831 20.954 24.274 29.854 20.628
21 47.208 25.187 20.403 23.708 28.439 20.126
20 44.922 24.441 19.773 23.042 26.952 19.539
19 42.566 23.614 19.091 22.293 25.464 18.889
18 40.359 22.772 18.437 21.519 24.139 18.253
17 38.531 21.993 17.908 20.794 23.154 17.733
16 36.58 21.115 17.331 19.972 22.14 17.16
0
0.5
1
1.5
2
2.5
3
3.5
0 2 4 6 8 10 12 14
Tim
e p
erio
d
Mode
Time period
Without TMD 3% TMD at Top
1.5% TMD at 27 and 18 storey 1.5% TMD at 27 and 9 storey
1.5% TMD at 18 and 9 storey 1% TMD at Each plan irregularity
International Journal of Advance Research in Engineering, Science & Technology (IJAREST) Volume 5, Issue 4, April 2018, e-ISSN: 2393-9877, print-ISSN: 2394-2444
All Rights Reserved, @IJAREST-2018 131
15 34.476 20.125 16.675 19.043 21.055 16.505
14 32.217 19.028 15.933 18.009 19.883 15.759
13 29.814 17.829 15.101 16.877 18.622 14.922
12 27.287 16.543 14.186 15.659 17.274 13.999
11 24.673 15.193 13.202 14.38 15.855 13.003
10 22.055 13.824 12.178 13.083 14.412 11.97
9 19.63 12.532 11.178 11.867 13.049 10.97
8 17.582 11.39 10.251 10.812 11.864 10.067
7 15.46 10.163 9.219 9.677 10.593 9.067
6 13.216 8.81 8.047 8.416 9.189 7.927
5 10.835 7.316 6.722 7.01 7.635 6.632
4 8.333 5.69 5.252 5.466 5.94 5.189
3 5.761 3.969 3.677 3.82 4.145 3.636
2 3.243 2.25 2.09 2.169 2.35 2.068
1 1.078 0.751 0.699 0.725 0.785 0.692
0 0 0 0 0 0 0
Figure 7. Comparative of displacement of in Zone V Figure 8. Comparative of displacement of in Zone IV
Table 5. Results for displacement due to RSA X load of All Models in Zone IV
Story Without
TMD 3% TMD at Top
1.5% TMD at 27 and 18 storey
1.5% TMD at 27 and 9 storey
1.5% TMD at 18 and 9 storey
1% TMD at Each plan
irregularity
27 37.421 18.157 14.804 16.966 23.036 14.454
26 36.925 18.126 14.77 16.947 22.684 14.434
25 36.219 18.035 14.683 16.875 22.186 14.368
24 35.296 17.85 14.517 16.722 21.541 14.231
23 34.177 17.576 14.276 16.489 20.771 14.024
22 32.893 17.221 13.969 16.182 19.903 13.752
0
5
10
15
20
25
30
0 10 20 30 40 50 60
Sto
rey
displacement (mm)
Storey displacement Without TMD 3% TMD at Top
1.5% TMD at 27 and 18 storey 1.5% TMD at 27 and 9 storey
1.5% TMD at 18 and 9 storey 1% TMD at Each plan irregularity
0
10
20
30
0 5 10 15 20 25 30 35 40
Sto
rey
displacement (mm)
Storey displacement Without TMD 3% TMD at Top
1.5% TMD at 27 and 18 storey 1.5% TMD at 27 and 9 storey
1.5% TMD at 18 and 9 storey 1% TMD at Each plan irregularity

International Journal of Advance Research in Engineering, Science & Technology (IJAREST) Volume 5, Issue 4, April 2018, e-ISSN: 2393-9877, print-ISSN: 2394-2444
All Rights Reserved, @IJAREST-2018 132
21 31.472 16.791 13.602 15.805 18.959 13.417
20 29.948 16.294 13.182 15.362 17.968 13.026
19 28.377 15.743 12.728 14.862 16.976 12.593
18 26.906 15.181 12.291 14.346 16.093 12.168
17 25.687 14.662 11.939 13.863 15.436 11.822
16 24.387 14.076 11.554 13.315 14.76 11.44
15 22.984 13.417 11.117 12.695 14.036 11.003
14 21.478 12.685 10.622 12.006 13.255 10.506
13 19.876 11.886 10.068 11.251 12.415 9.948
12 18.191 11.029 9.458 10.44 11.516 9.332
11 16.449 10.129 8.801 9.586 10.57 8.669
10 14.703 9.216 8.119 8.722 9.608 7.98
9 13.087 8.354 7.452 7.911 8.7 7.313
8 11.722 7.594 6.834 7.208 7.91 6.711
7 10.307 6.775 6.146 6.451 7.062 6.045
6 8.81 5.873 5.365 5.61 6.126 5.285
5 7.223 4.878 4.481 4.673 5.09 4.421
4 5.555 3.793 3.502 3.644 3.96 3.459
3 3.84 2.646 2.451 2.547 2.763 2.424
2 2.162 1.5 1.393 1.446 1.566 1.379
1 0.719 0.501 0.466 0.483 0.523 0.461
0 0 0 0 0 0 0
Table 6. Results for Storey drift due to RSA X load of All Models in Zone V
Story Without
TMD 3% TMD at Top
1.5% TMD at 27 and 18
storey
1.5% TMD at 27 and 9
storey
1.5% TMD at 18 and 9
storey
1% TMD at Each plan irregularity
27 0.000262 0.00012 0.000106 0.000113 0.000197 0.0001
26 0.000387 0.000184 0.000163 0.000172 0.000291 0.000152
25 0.000512 0.000246 0.000217 0.000229 0.000383 0.000202
24 0.000617 0.000294 0.000259 0.00027 0.000457 0.000237
23 0.000699 0.000326 0.000286 0.000296 0.000512 0.00026
22 0.000761 0.000347 0.000305 0.000312 0.000551 0.000276
21 0.000805 0.000363 0.000322 0.000326 0.000579 0.000291
20 0.000819 0.000372 0.000333 0.000335 0.000587 0.000303
19 0.000748 0.000347 0.00031 0.000317 0.000529 0.000287
18 0.000583 0.000286 0.000243 0.000266 0.000393 0.000229
17 0.000607 0.00031 0.000256 0.000291 0.000398 0.000245

International Journal of Advance Research in Engineering, Science & Technology (IJAREST) Volume 5, Issue 4, April 2018, e-ISSN: 2393-9877, print-ISSN: 2394-2444
All Rights Reserved, @IJAREST-2018 133
16 0.000639 0.000338 0.000274 0.000319 0.000411 0.000265
15 0.000672 0.000365 0.000292 0.000346 0.000424 0.000284
14 0.000702 0.00039 0.000311 0.000371 0.000437 0.000305
13 0.00073 0.000415 0.000332 0.000396 0.000452 0.000327
12 0.000751 0.000435 0.000351 0.000417 0.000467 0.000349
11 0.00075 0.000442 0.000361 0.000424 0.00047 0.000359
10 0.000686 0.000409 0.000338 0.000391 0.000432 0.000336
9 0.00056 0.000337 0.000284 0.000318 0.000352 0.000278
8 0.000565 0.000344 0.000295 0.000323 0.000358 0.000287
7 0.000583 0.000362 0.000316 0.000339 0.000376 0.000308
6 0.000607 0.000386 0.000343 0.000364 0.000402 0.000336
5 0.000631 0.000412 0.000372 0.000391 0.00043 0.000366
4 0.000645 0.000432 0.000395 0.000413 0.000451 0.00039
3 0.00063 0.00043 0.000397 0.000413 0.000449 0.000392
2 0.000541 0.000375 0.000348 0.000361 0.000391 0.000344
1 0.000269 0.000188 0.000175 0.000181 0.000196 0.000173
0 0 0 0 0 0 0
Figure 9. Comparative of Storey drift of in Zone V Figure 10. Comparative of Storey drift of in Zone IV
Table 7. Results for Storey drift due to RSA X load of All Models in Zone IV
Story Without
TMD 3% TMD at Top
1.5% TMD at 27 and 18
storey
1.5% TMD at 27 and 9
storey
1.5% TMD at 18 and 9
storey
1% TMD at Each plan irregularity
27 0.000175 0.00008 0.000071 0.000075 0.000131 0.000066
26 0.000258 0.000123 0.000109 0.000115 0.000194 0.000101
25 0.000341 0.000164 0.000145 0.000152 0.000255 0.000134
24 0.000411 0.000196 0.000172 0.00018 0.000305 0.000158
23 0.000466 0.000217 0.000191 0.000198 0.000341 0.000173
22 0.000507 0.000231 0.000204 0.000208 0.000368 0.000184
21 0.000537 0.000242 0.000215 0.000217 0.000386 0.000194
0
5
10
15
20
25
30
0 0.0002 0.0004 0.0006 0.0008 0.001
Sto
rey
drift
Storey drift
Without TMD 3% TMD at Top
1.5% TMD at 27 and 18 storey 1.5% TMD at 27 and 9 storey
1.5% TMD at 18 and 9 storey 1% TMD at Each plan irregularity
0
5
10
15
20
25
30
0 0.0001 0.0002 0.0003 0.0004 0.0005 0.0006
Sto
rey
drift
Storey drift
Without TMD 3% TMD at Top
1.5% TMD at 27 and 18 storey 1.5% TMD at 27 and 9 storey
1.5% TMD at 18 and 9 storey 1% TMD at Each plan irregularity

International Journal of Advance Research in Engineering, Science & Technology (IJAREST) Volume 5, Issue 4, April 2018, e-ISSN: 2393-9877, print-ISSN: 2394-2444
All Rights Reserved, @IJAREST-2018 134
20 0.000546 0.000248 0.000222 0.000224 0.000391 0.000202
19 0.000498 0.000232 0.000206 0.000211 0.000353 0.000191
18 0.000389 0.000191 0.000162 0.000177 0.000262 0.000153
17 0.000405 0.000207 0.000171 0.000194 0.000266 0.000163
16 0.000426 0.000225 0.000183 0.000213 0.000274 0.000176
15 0.000448 0.000243 0.000195 0.000231 0.000283 0.00019
14 0.000468 0.00026 0.000207 0.000248 0.000292 0.000203
13 0.000487 0.000277 0.000221 0.000264 0.000302 0.000218
12 0.0005 0.00029 0.000234 0.000278 0.000311 0.000232
11 0.0005 0.000294 0.00024 0.000282 0.000313 0.000239
10 0.000457 0.000272 0.000225 0.000261 0.000288 0.000224
9 0.000373 0.000225 0.000189 0.000212 0.000234 0.000186
8 0.000377 0.000229 0.000196 0.000215 0.000239 0.000191
7 0.000389 0.000241 0.00021 0.000226 0.000251 0.000205
6 0.000405 0.000257 0.000229 0.000243 0.000268 0.000224
5 0.000421 0.000275 0.000248 0.000261 0.000286 0.000244
4 0.00043 0.000288 0.000264 0.000275 0.0003 0.00026
3 0.00042 0.000287 0.000265 0.000276 0.000299 0.000262
2 0.000361 0.00025 0.000232 0.000241 0.000261 0.000229
1 0.00018 0.000125 0.000116 0.000121 0.000131 0.000115
0 0 0 0 0 0 0
Table 8. Results for Storey Shear due to RSA X load of All Models in Zone V
Story Without
TMD 3% TMD at Top
1.5% TMD at 27 and 18
storey
1.5% TMD at 27 and 9
storey
1.5% TMD at 18 and 9
storey
1% TMD at Each plan
irregularity
27 405.3699 250.93 216.1086 240.6232 316.2478 211.0919
26 832.7764 435.626 386.0026 413.3618 643.3987 366.9059
25 1193.7059 613.313 541.747 574.718 910.0055 507.7246
24 1479.4046 739.836 649.6935 684.2386 1109.4368 600.742
23 1696.6788 817.241 715.2256 745.2554 1251.0356 652.1806
22 1864.6954 867.247 761.4945 781.628 1356.7517 687.493
21 2005.5628 917.532 815.00 823.9213 1450.146 736.1519
20 2133.6007 984.496 887.4127 889.636 1543.2779 810.4183
19 2251.1104 1064.68 969.5565 973.0895 1632.2203 898.5396
18 2440.3723 1213.66 1021.1926 1128.7347 1636.1961 958.8583
17 2647.9184 1380.67 1147.1964 1299.1542 1757.534 1095.3388
16 2837.8761 1529.09 1249.1455 1447.5356 1849.4455 1205.6998
15 3006.605 1658.75 1334.2483 1575.6422 1916.6259 1298.6493

International Journal of Advance Research in Engineering, Science & Technology (IJAREST) Volume 5, Issue 4, April 2018, e-ISSN: 2393-9877, print-ISSN: 2394-2444
All Rights Reserved, @IJAREST-2018 135
14 3165.5515 1784.72 1425.2829 1700.3341 1983.5992 1397.7891
13 3326.9908 1919.08 1539.0728 1834.6929 2074.3536 1519.7515
12 3491.4854 2058.28 1670.8733 1975.0782 2192.3648 1659.1978
11 3646.3278 2184.97 1798.3469 2103.5158 2318.2713 1793.6401
10 3776.0836 2282.13 1900.0323 2202.5567 2427.113 1902.025
9 3938.6753 2393.14 2021.463 2230.4507 2467.162 1955.9093
8 4115.7936 2520.83 2165.0488 2352.843 2613.2718 2099.1435
7 4311.4398 2682.86 2347.6258 2514.9675 2792.0921 2284.7098
6 4536.5933 2894.43 2582.1428 2732.469 3018.1317 2525.352
5 4786.5633 3146.59 2855.7775 2994.2973 3283.7681 2806.5423
4 5035.4369 3404.7 3130.7171 3262.5831 3554.7837 3088.5344
3 5244.0304 3622.4 3359.5527 3488.4637 3783.5289 3322.6811
2 5377.2162 3761.35 3504.4402 3632.3663 3929.7081 3470.6762
1 5424.5579 3810.74 3555.7578 3683.4711 3981.698 3523.0527
Figure 11. Comparative of Storey Shear of in Zone V Figure 12. Comparative of Storey Shear of in Zone IV
Table 9. Results for Storey Shear due to RSA X load of All Models in Zone V
Story Without
TMD
3% TMD
at Top
1.5% TMD at
27 and 18
storey
1.5% TMD at
27 and 9
storey
1.5% TMD
at 18 and 9
storey
1% TMD at
Each plan
irregularity
27 270.2466 167.2867 144.0724 160.4155 210.832 140.728
26 555.1843 290.4172 257.335 275.5745 428.932 244.6039
25 795.804 408.8751 361.1647 383.1453 606.67 338.4831
24 986.2698 493.224 433.129 456.1591 739.625 400.4947
23 1131.119 544.8275 476.8171 496.8369 834.024 434.7871
22 1243.13 578.1645 507.663 521.0853 904.501 458.3287
0
5
10
15
20
25
30
0 1000 2000 3000 4000 5000 6000
Sto
rey
Shear (KN)
Storey Shear Without TMD 3% TMD at Top
1.5% TMD at 27 and 18 storey 1.5% TMD at 27 and 9 storey
1.5% TMD at 18 and 9 storey 1% TMD at Each plan irregularity
0
5
10
15
20
25
30
0 500 1000 1500 2000 2500 3000 3500 4000
Sto
rey
Shear (KN)
Storey Shear
Without TMD 3% TMD at Top
1.5% TMD at 27 and 18 storey 1.5% TMD at 27 and 9 storey
1.5% TMD at 18 and 9 storey 1% TMD at Each plan irregularity

International Journal of Advance Research in Engineering, Science & Technology (IJAREST) Volume 5, Issue 4, April 2018, e-ISSN: 2393-9877, print-ISSN: 2394-2444
All Rights Reserved, @IJAREST-2018 136
21 1337.042 611.6882 543.3334 549.2809 966.764 490.7679
20 1422.4 656.3309 591.6085 593.0907 1028.85 540.2789
19 1500.74 709.7846 646.371 648.7264 1088.15 599.0264
18 1626.915 809.1067 680.7951 752.4898 1090.8 639.2389
17 1765.279 920.4481 764.7976 866.1028 1171.69 730.2259
16 1891.917 1019.391 832.7636 965.0237 1232.96 803.7999
15 2004.403 1105.836 889.4989 1050.4282 1277.75 865.7662
14 2110.368 1189.812 950.1886 1133.5561 1322.4 931.8594
13 2217.994 1279.386 1026.0485 1223.1286 1382.9 1013.168
12 2327.657 1372.188 1113.9155 1316.7188 1461.58 1106.132
11 2430.885 1456.647 1198.8979 1402.3439 1545.51 1195.76
10 2517.389 1521.419 1266.6882 1468.3711 1618.08 1268.017
9 2625.784 1595.429 1347.642 1486.9671 1644.77 1303.94
8 2743.862 1680.553 1443.3659 1568.562 1742.18 1399.429
7 2874.293 1788.574 1565.0839 1676.645 1861.39 1523.14
6 3024.396 1929.619 1721.4285 1821.646 2012.09 1683.568
5 3191.042 2097.73 1903.8517 1996.1982 2189.18 1871.028
4 3356.958 2269.801 2087.1447 2175.0554 2369.86 2059.023
3 3496.02 2414.936 2239.7018 2325.6424 2522.35 2215.121
2 3584.811 2507.566 2336.2935 2421.5775 2619.81 2313.784
1 3616.372 2540.491 2370.5052 2455.6474 2654.47 2348.702
V. REMARKS
Analysis of G+26 storey RCC structure with and without TMD in Zone V and Zone IV is carried out by using response
spectrum method. Time period is less, lesser is mass of structure and more is the stiffness of structure. From all model
comparison graph it can be see that 1% TMD at each plan irregularity of structure is reduced 11.53% in time period
compared without TMD structure, indicates that 1% TMD at each plan irregularity of structure has higher stiffness
compared to structure without TMD. From all model comparison graph it seen that 1% TMD at each plan irregularity of
structure is more effective compared to the other types of model, there is 61.37% reduction of story displacement of 1%
TMD at each plan irregularity of structure to without TMD of structure. Also seen that structure without TMD gives
highest displacement for all stories in both zone while incorporate TMD structure gives better result. From graph
it can be seen that in Zone V All parameter of structure has higher than zone IV structure so as seismic zone level increase
then all parameter are also increase. Out of all analysis it is observed that MTMD system is more effective in structure
compare to STMD.
REFERENCES
[1] Fredy Picauly, Hrc. Priyosulistyo, Bambang Suhendre, Andreas Triwiyono “Tuned mass damper on Reinforced
Concrete Slab With Additional “X – Shaped Metal” Absorber” Elsevier (Procedia Engineering 95(2014) 204–212).
[2] Dr. Mohan M. Murudi, Mr. Sharadchandra M. Mane “Seismic Effectiveness of Tuned Mass Damper(TMD) For
Different Ground Motion Parameters” 13 WCEE Canada August 1-6,2014 Paper No. 2325

International Journal of Advance Research in Engineering, Science & Technology (IJAREST) Volume 5, Issue 4, April 2018, e-ISSN: 2393-9877, print-ISSN: 2394-2444
All Rights Reserved, @IJAREST-2018 137
[3] H. R. Owji, A Hossain Nezhad Shirazi, H.Hooshmand Sarvestani. “A Comparison between a New Semi-Active
Tuned Mass Damper and an Active Tuned Mass Damper” Elsevier (Procedia Engineering 14 (2011) 2779–2787).
[4] Tharwat A. Sakr “Vibration control of buildings by using partial floor loads as multiple tuned mass dampers” HBRC
Journal (2017) 13, 133–144.
[5] Yoyong Arfiadi “Reducing Response of Structures by Using Optimum Composite Tuned Mass Dampers” Elsevier (Procedia Engineering 161 ( 2016 ) 67 – 72).
[6] Z. Guenidi, M. Abdeddaim, A. Ounis, M.K. Shrimali, T.K. Datta “Control of Adjacent Buildings Using Shared
Tuned Mass Damper” Elsevier (Procedia Engineering 199 (2017) 1568–1573).
[7] Said Elias, Vasant Matsagar “Wind response control of tall buildings with a tuned mass damper” Journal of Building
Engineering 15 (2018) 51–60.
[8] Said Elias, Vasant Matsagar, T. K. Datta “Distributed Multiple Tuned Mass Dampers for Wind Response Control of
Chimney with Flexible Foundation” Elsevier (Procedia Engineering 199 (2017) 1641 -1646).
[9] Mr. Khemraj S. Deore, Prof. Dr. Rajashekhar S. Talikoti, Prof. Kanhaiya K. Tolani, “Vibration Analysis of Structure
Using Tune Mass Damper” in International Research Journal of Engineering and Technology (IRJET) ISSN: 2395-
0072, Volume-4, Issue-7, July -2017
[10] Midhun Krishnan R, Dr. C K Prasad Varma Thampan, “A Study on Vibration Control of Framed Structures Due to
Seismic Excitation Using Tuned Mass Damper” in International Journal of Scientific & Engineering
Research(IJSER) ISSN 2229-5518, Volume 7, Issue 10, October-2016.
[11] Deepu S. Hegden, Lakshmi P, “Performance Improvement of Multi Storied Buildings Using Multiple Tuned Mass
Dampers” in International Journal Of Innovative Research In Technology (IJIRT) ISSN 2349-6002, Volume 3, Issue
4, September 2016.
[12] Lavanya. G, Muhammed Murad. K, “Dynamic resistance of tall buildings by using tuned mass damper’s” in International Journal of Advance Engineering and Research Development (IJAERD) ISSN: 2348- 4470 Vol. 2 Issue
10, October-2015.
[13] Mudabbir Imran, Dr. B. K. Raghu Prasad, “Seismic response of tall structures using tuned mass dampers” in
International Journal of Research in Engineering and Applied Sciences (IJREAS) ISSN: 2249-3905 Vol. 7 Issue 05,
May-2017.
[14] Raveesh R M, Sahana T. S., “Effect of Tuned Mass Dampers on Multi storey RC Framed Structures” Published in
International Journal of Engineering Research & Technology (IJERT) ISSN: 2278-0181 Volume 03, Issue 08, 2014.
[15] Mr. Ashish A. Mohite, Prof. G.R. Patil, “Earthquake Analysis of Tall Building with Tuned Mass Damper” in IOSR
Journal of Mechanical and Civil Engineering (IOSR-JMCE) ISSN 2278-1684, 2015.
[16] IS: 1893(Part-I)-2002. Criteria for Earthquake Resistant Design of Structures. Bureau of Indian Standard, New Delhi.
[17] IS: 875(Part-1)-1987. Code of practice for design loads (other than earthquake) for buildings and structures, Dead
loads, unit weights of building materials and stored materials. Bureau of Indian Standard, New Delhi.
[18] IS: 875(Part-3)-1987. Code of practice for design loads (other than earthquake) for buildings and structures, wind
loads. Bureau of Indian Standard, New Delhi.
[19] IS 456 2000, plain and reinforced concrete – code of practice