Embed Size (px)
Citation preview


International Journal “Information Theories and Applications”, Vol. 25, Number 4, © 2018
302
International Journal
INFORMATION THEORIES & APPLICATIONS Volume 25 / 2018, Number 4
Editorial board Editor in chief: Krassimir Markov (Bulgaria)
Alberto Arteta (Spain) Lyudmila Lyadova (Russia) Aleksey Voloshin (Ukraine) Martin P. Mintchev (Canada)
Alexander Eremeev (Russia) Natalia Bilous (Ukraine) Alexander Palagin (Ukraine) Natalia Pankratova (Ukraine)
Alfredo Milani (Italy) Olena Chebanyuk (Ukraine) Avtandil Silagadze (Georgia) Rumyana Kirkova (Bulgaria)
Avram Eskenazi (Bulgaria) Stoyan Poryazov (Bulgaria) Dimitar Radev (Bulgaria) Tatyana Gavrilova (Russia) Galina Rybina (Russia) Tea Munjishvili (Georgia)
Giorgi Gaganadize (Georgia) Teimuraz Beridze (Georgia) Hasmik Sahakyan (Armenia) Valeriya Gribova (Russia) Juan Castellanos (Spain) Vasil Sgurev (Bulgaria)
Koen Vanhoof (Belgium) Vitalii Velychko (Ukraine) Krassimira B. Ivanova (Bulgaria) Vitaliy Lozovskiy (Ukraine)
Leonid Hulianytskyi (Ukraine) Vladimir Jotsov (Bulgaria) Levon Aslanyan (Armenia) Vladimir Ryazanov (Russia) Luis F. de Mingo (Spain) Yevgeniy Bodyanskiy (Ukraine)
International Journal “INFORMATION THEORIES & APPLICATIONS” (IJ ITA) is official publisher of the scientific papers of the members of
the ITHEA International Scientific Society
IJ ITA welcomes scientific papers connected with any information theory or its application. IJ ITA rules for preparing the manuscripts are compulsory.
The rules for the papers for IJ ITA are given on www.ithea.org.
Responsibility for papers published in IJ ITA belongs to authors.
International Journal “INFORMATION THEORIES & APPLICATIONS” Vol. 25, Number 4, 2018
Edited by the Institute of Information Theories and Applications FOI ITHEA, Bulgaria, in collaboration with: University of Telecommunications and Posts, Bulgaria, V.M.Glushkov Institute of Cybernetics of NAS, Ukraine,
Universidad Politécnica de Madrid, Spain, Hasselt University, Belgium, University of Perugia, Italy,
Institute for Informatics and Automation Problems, NAS of the Republic of Armenia St. Petersburg Institute of Informatics, RAS, Russia,
Printed in Bulgaria Publisher ITHEA®
Sofia, 1000, P.O.B. 775, Bulgaria. www.ithea.org, e-mail: [email protected] Technical editor: Ina Markova
Copyright © 2018 All rights reserved for the publisher and all authors. ® 1993-2018 "Information Theories and Applications" is a trademark of ITHEA®
® ITHEA is a registered trade mark of FOI-Commerce Co.
ISSN 1310-0513 (printed) ISSN 1313-0463 (online)
International Journal “Information Theories and Applications”, Vol. 25, Number 4, © 2018
303
THE BENEFITS OF EVALUATING THE JORDANIAN SOCIAL SECURITY USING
DECISION MODELING AND NOTATION
Ahmad Zyad Alghzawi, Frank Vanhoenshoven, George Sammour, Koen Vanhoof
Abstract: The main objective of this paper is to analyze the situation of the pensions in the Jordanian
Social Security (JSS) system in order to evaluate it .We will elaborate on Business Process Model and
Notation (BPMN) and Decision Model and Notation (DMN) and the association that exists between the
two. Next we show how BPMN and DMN are able to (1) enhance clarity of JSS procedures and (2)
improve decision making.
Keywords: Business process (BP), Decision Management, Business Process Modeling Notation
(BPMN), Decision Model And Notation (DMN).
Introduction
Today business process models are important for business organizations as they provide an expressive
means to represent their operational model. Work activities, their logical ordering, data, and
organizational responsibilities provide the basic inputs for business process modeling. Using these
models, organizations can improve, control, automatize, and measure their processes effectively [1]. In
our study of business process modeling and decision models and their application to the JSS system,
we will explain the pension presses and decision making, as they exist in this JSS system.
In this paper, we apply process modelling and decision modelling on the pension procedures of the
Jordanian Social Security. We demonstrate how the models can be used to identify gaps,
inconsistencies or ambiguities. Furthermore, we show how decision modeling can help to create
simulations that can be used to support decision making of applicants as well as policy makers. The
information used in this paper is publicly available via the official website of the JSS system.
Business process (BP)
A business process is a structured and coordinated flow of activities. These are carried out by
participating people, who work with and decide on data and knowledge to achieve certain business
objectives(Debevoise, Taylor et al. 2014).
A business process (BP) is a set of one or more linked procedures or activities executed following a
predefined order which collectively realize a business objective or policy goal, normally within the
International Journal “Information Theories and Applications”, Vol. 25, Number 4, © 2018
304
context of an organizational structure defining functional roles or relationships (Chinosi and Trombetta
2012).
A business process can be entirely contained within a single organizational unit as well as it can span
several different organizations (WfMC April 2011). Business process collaboration across enterprise
boundaries is a complex task due to the lack of a unique semantics for the terminology of their BP
models and to the use of various standards in BP modeling and execution.
Business process management (BPM) tries to identify, understand and manage business processes
that support the organization's business model. Ideally, these processes are capable of supporting
adaptations in the business model due to changes in the economy or in customer preferences. Business
practices might be another reason for these changes. The same process model or logic must adapt to
the changes within the rules of decision models (Debevoise, Taylor et al. 2014). It provides governance
of a business's process environment to improve the agility and operational performance of the process.
It is thus a systematic approach to improve any organization's business processes (Chinosi and
Trombetta 2012). BPM is not a technology and it is not related to diagram creation or systems
architecture. Business Process Modeling, instead, is defined as the time period when manual and/or
automated (workflow) descriptions of a process are defined and/or modified electronically (WfMC April
2011). Business Process Modeling is as such the activity of “representing processes of an enterprise,
so that the current (“as is”) process may be analyzed and improved in future (“to be”)” (M. zur Muehlen
2008). Business Process Modeling is typically performed by business analysts and managers who are
trying to improve process efficiency and quality.
Decision Definitions
Business processes can often only be completed if decisions are taken, especially in the decision-
making pattern. Decisions in business processes are made by applying business knowledge to the data
processing. This knowledge may take the form of business principles or any other decision logic
(Debevoise, Taylor et al. 2014, Metsemakers, Morgenstern et al. 2017).
From the BPM perspective, a decision defines a set of terms or business concepts that selects a
particular answer in terms of value for a certain set of possibilities (Debevoise, Taylor et al. 2014,
Metsemakers, Morgenstern et al. 2017).
Decision Management
Decision management allows an organization to control, manage and automate repetitive decisions at
the heart of its business. It does so by effectively applying business rules and by using analytics and
optimization technology (Debevoise, Taylor et al. 2014). Decision Management enables the
development of simpler, smarter and more agile business processes (Debevoise, Taylor et al. 2014,
Hilmi, Safa et al. 2017).
International Journal “Information Theories and Applications”, Vol. 25, Number 4, © 2018
305
Thus business rules are central to decision management. Decision management maximizes the ROI of
these business rules by applying them effectivity. Similarly, data mining and predictive analytics provide
insight management (Debevoise, Taylor et al. 2014). Decision management multiplies the value of
analytics to the business result by focusing mainly on numerous repetitive day-to-day decisions
(Debevoise, Taylor et al. 2014, Hilmi, Safa et al. 2017).
From the perspective of BPM, decision management achieves three end goals (Debevoise, Taylor et al.
2014) :
1. Identifying decisions within business processes, whether these are automated or manual;
2. Precisely and unambiguously representing and populating a decision model to specify how the decision should be made who should do it without adding this information to the process model itself; and
3. Implementing, reporting and updating processes in order to continually refine the effectiveness of decision making as well as improving the efficiency of the processes.
Business Process Modeling and Notation (BPMN)
The primary goal of BPMN is to provide a notation that is readily understandable by business users,
ranging from the business analysts who sketch the initial drafts of the processes to the technical
developers responsible for actually implementing them, and finally to the business staff deploying and
monitoring such processes. BPMN was originally published in 2004 by the Business Process Modeling
Initiative as a graphical notation (partially inspired by UML Activity Diagrams) to represent the graphical
layout of business processes. The ever increasing number of adoptions by companies and the growing
interest for this notation caused the adoption of BPMN as Objective Management Group (OMG)
standard in 2006 (Chinosi and Trombetta 2012, von Rosing, White et al. 2015).
BPMN provides a graphical notation in order to represent a business process as a Business Process
Diagram (BPD). The development of a BPMN is based on a flowcharting technique tailored to creating
graphical models of business process operations. A Business Process Model, then, is a network of
graphical objects, which are active ties (i.e., work) and the flow controls that define their order of
performance. Activities are represented as rectangles and diamonds represent alternative workflow
paths (von Rosing, White et al. 2015).
It should be emphasized that one of the drivers for the development of BPMN is to create a simple
mechanism for creating business process models, while at the same time being able to handle the
complexity inherent to business processes (A.white July, 2004). The approach taken to handle these
two conflicting requirements was to organize the graphical aspects of the notation into specific
categories. This provides a small set of notation categories so that the reader of a BPD can easily
recognize the basic types of elements and understand the diagram. Within the basic categories of
elements, additional variation and information can be added to support the requirements for complexity
International Journal “Information Theories and Applications”, Vol. 25, Number 4, © 2018
306
without dramatically changing the basic look-and-feel of the diagram (Aguilar-Savén 2004, Gabryelczyk
and Jurczuk 2017).
BPMN has several uses. It is used to communicate a wide variety of information to different audiences.
BPMN is designed to cover many types of modeling and allows the creation of process segments as
well as end-to-end business processes, at different levels of fidelity. Within the variety of process
modeling objectives, there are two basic types of models that can be created with a BPD (Gabryelczyk
and Jurczuk 2017):
• Collaborative (Public) B2B Processes and
• Internal (Private) Business Processes
Decision Model and Notation:
In the last few years, the OMG (Object Management Group) proposed a new innovation, which is called
“Decision Model and Notation” (DMN) specification. In February 2014, version 1.0 of the DMN
specification was approved by OMG’s board (OMG: ). Since March 2016, version 1.2 has been
available via their website.
DMN Overview
DMN stands for Decision Model and Notation. The essential goals of DMN is to support a common
notation for decision login that is understandable for business users, business analysts and developers
alike. DMN supplies the constructs for the decision-making process itself and allows to model decision
rules.
A DMN model defines two levels: the decision requirements graph (DRG) and the decision logic. Where
the required information is coming from and how it can be depicted in one or more decision
requirements diagrams (DRDs) is the object of the former, whereas the latter describes the logic behind
the decision, depicted in the Decision Table [15]. The upper half of a decision table indicates all
potential combinations of conditions that may lead to certain actions, while the bottom half describes the
actions to be taken (i.e., outcomes). A minimal scope is specified for the standardization by OMG
because the goal of DMN is to offer support to other decision logic notations (e.g., decision trees) and to
allow for references to other types of models (e.g., SBVR).
Connecting between DMN and BPMN :
Decision Management aims to separate decision logic from the process logic. Large sequences of
gateways and checks, signalling decision logic, will all be removed from the BPMN model and captured
within a single decision step. A decision-driven process then uses the outcome of the evaluation of this
decision logic in several possible ways, including (Debevoise, Taylor et al. 2014):
Changing the sequence of activities that are taken after a decision, including what the next activity or process that is required to meet the directive of the process.
International Journal “Information Theories and Applications”, Vol. 25, Number 4, © 2018
307
Selecting between the paths on the diverging or the splitting side of a gateway.
Deciding who or what participant should perform the needed activity.
Creating data values that will be consumed later in the process.
inputs into the decision include (Debevoise, Taylor et al. 2014):
Data that can identify events or process-relevant conditions.
Data that must be validated for correctness.
Data used in calculations.
The Association Principle between BPMN and DMN (Mertens, Gailly et al. 2015)
BPMN diagrams that display long sequences of gateways often express decision logic instead of
process logic. A better approach would be to focus on process logic in BPMN and move all decision
logic to a single decision task. “Make a decision” is defined as a business rule task which is indicated in
the diagram by a small table symbol in the top left corner of it (Debevoise, Taylor et al. 2014)(see Figure
2.4.1) A DMN diagram will be linked with each decision task.
Fig.4 Business rule task(BPMN)
BPMN + DMN = Separation of concerns
Having two different BPMN and DMN Models presents the advantage of decoupling the decision making
from the process. This is called the separation of concerns (SoC). SoC is an old (1974) best practice
coming from computer science (Dijkstra 1982). Each one of several coupled models can indeed be
developed independently and this process can be done with the support of different stakeholders,
according to their needs and skills ( Business Process or IT people for instance). Each one of these
models (Business Decision or Process) can consider the other one as a black box, exchanging data
between eachother (Biard, Le Mauff et al. 2015).
The two mentioned models respect the main property required for a good Separation of Concerns.
They have their own consistency. In order to understand one model, it is not necessary to know the
other one. Moreover the Decision-making context can be detailed explicitly into the DMN diagram. Sub-
decisions can be reused into several decisions as well. This capitalization can lead to Knowledge
Management (KM) (Biard, Le Mauff et al. 2015, Mertens, Gailly et al. 2015).
Application of BPMN and DMN in JSS
In this section we will introduce the JSS System, the problems it faces and the processes present in the
system. We will describe these elements using BPMN Diagrams.

International Journal “Information Theories and Applications”, Vol. 25, Number 4, © 2018
308
In 1980, the Jordanian government determined to organize the JSS system as a government
organization and system in order to insure Jordanian people after retirement in terms of old-age and in
to give a mourning family some compensation after a loss. There are also provisions for disability,
maternity costs, and health insurance. Furthermore, the JSS system insures against work-related
accidents and job losses. We will focus particularly on retirements that have to be paid by the social
security.
The information for creating the model in Fig. 5 is retrieved from a document written by JSS (Security
2014). The model provides an easy and understandable means of clarifying the process logic to be
followed when applying for JSS. Moreover, the model forces the modeler to think critically about the
process, which is not always enforced by a written text. For example: what exceptions could occur in the
process and what do we need to do when a certain check fails?
The BPMN of the main pension system of the JSS looks as in (Figure 5) (Security 2014) :
The BPMN shows that the main pension process (Fig.5) starts by receiving a pension application from
the applicant. If all the required documents are available, the type of request has to be determined.
There are four different types of pension, which will be presented later on. The JSS process
subsequently verifies the accuracy and reliability of all data and executes the pension calculation. Here,
one possible inefficiency can already be identified. There are separate steps for verifying data. Are both
steps necessary or could they be merged? Would merging these steps yield an improvement in terms of
quality or throughput time? Another remarkable feature is that all types of pensions are treated
differently. It would seem that there is some room to exploit synergies or at least streamline the process
to reduce variations.
Cases of incompleteness can be seen by the absence of alternative paths. The model in Fig. 5 does not
stipulate what should happen when all documents are not confirmed Similarly, there is no indication of
what would happen when the type of request cannot be determined. Furthermore, given the lack of
alternative paths, the model leads to believe that in all cases, a pension will be calculated after it is
confirmed that no documents are missing. This is very likely to be the case in most applications, but it is
doubtful that this process can be followed for every single applicant.
It has to be stated that the answer to these questions cannot be readily derived from the process model.
However, the model provides a convenient starting point for identifying potential issues that could trigger
discussions to ultimately improve the process.
As mentioned above there are four different types of pension in Jordan: the natural death pension, the
permanent physical disability and permanent partial disability pension, the work related death pension
and the retirement pension. In the next Figures BPMN graphs for each of these pension types are
developed.
International Journal “Information Theories and Applications”, Vol. 25, Number 4, © 2018
309
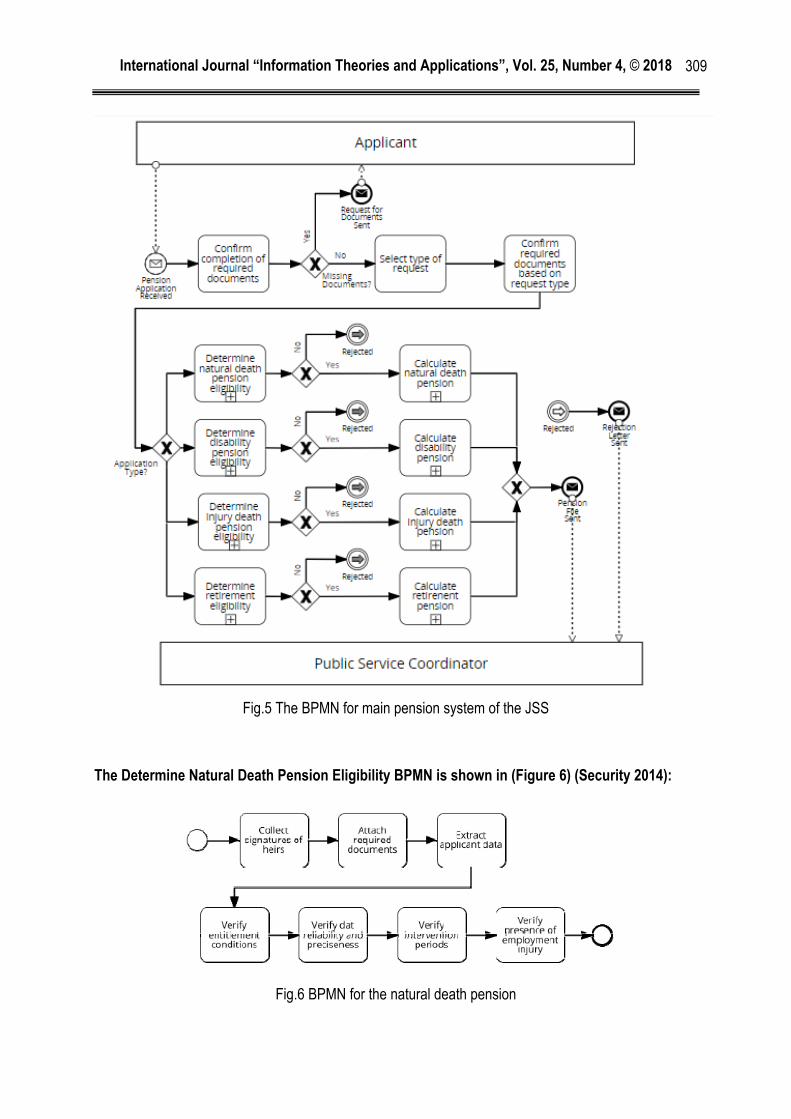
Fig.5 The BPMN for main pension system of the JSS
The Determine Natural Death Pension Eligibility BPMN is shown in (Figure 6) (Security 2014):
Fig.6 BPMN for the natural death pension
International Journal “Information Theories and Applications”, Vol. 25, Number 4, © 2018
310
The natural death pension process (Fig.6) starts by taking the signatures from the heirs who ask for the
pension. Next, all the required documents are attached. Then the JSS system extracts the applicant
data from the system. After that the JSS system verifies the conditions of entitlement in terms of years
of contribution. Then the reliability and accuracy of the data are verified after all necessary data are
collected. Next, it is verified if the applicant has had more than one previous job. Finally, the process
also checks if the person eventually incurred work injuries during their lifetime.
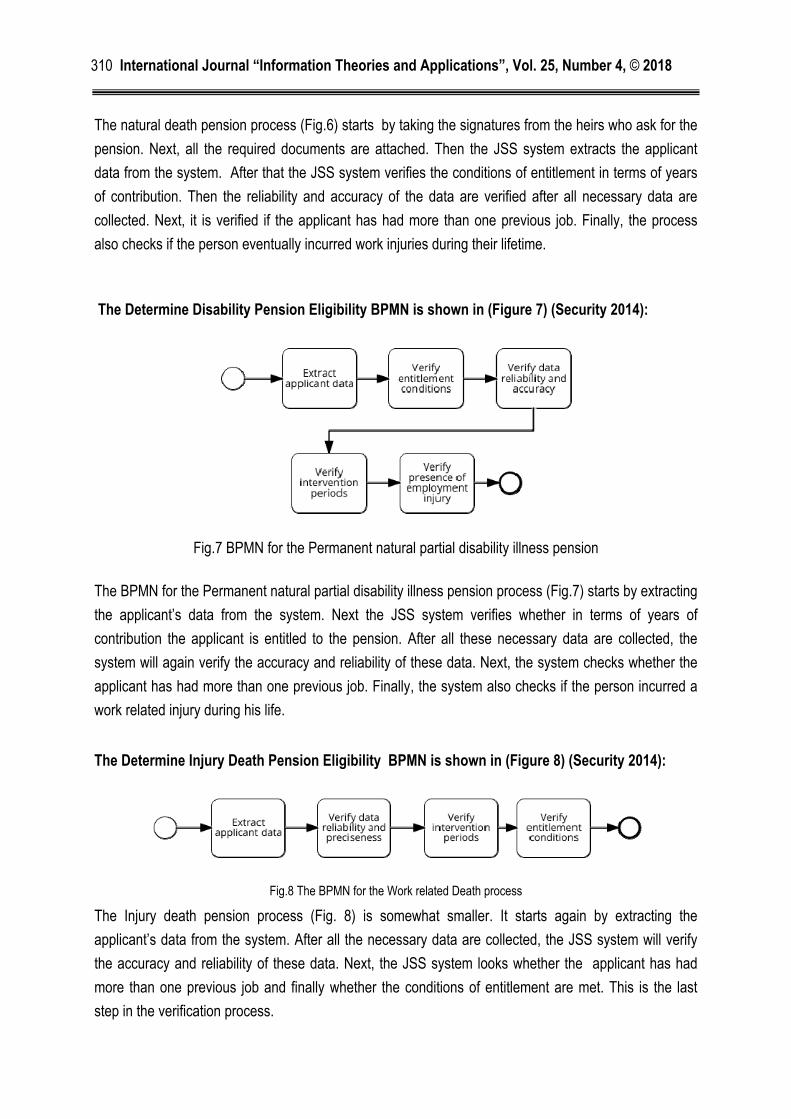
The Determine Disability Pension Eligibility BPMN is shown in (Figure 7) (Security 2014):
Fig.7 BPMN for the Permanent natural partial disability illness pension
The BPMN for the Permanent natural partial disability illness pension process (Fig.7) starts by extracting
the applicant’s data from the system. Next the JSS system verifies whether in terms of years of
contribution the applicant is entitled to the pension. After all these necessary data are collected, the
system will again verify the accuracy and reliability of these data. Next, the system checks whether the
applicant has had more than one previous job. Finally, the system also checks if the person incurred a
work related injury during his life.
The Determine Injury Death Pension Eligibility BPMN is shown in (Figure 8) (Security 2014):
Fig.8 The BPMN for the Work related Death process
The Injury death pension process (Fig. 8) is somewhat smaller. It starts again by extracting the
applicant’s data from the system. After all the necessary data are collected, the JSS system will verify
the accuracy and reliability of these data. Next, the JSS system looks whether the applicant has had
more than one previous job and finally whether the conditions of entitlement are met. This is the last
step in the verification process.
International Journal “Information Theories and Applications”, Vol. 25, Number 4, © 2018
311
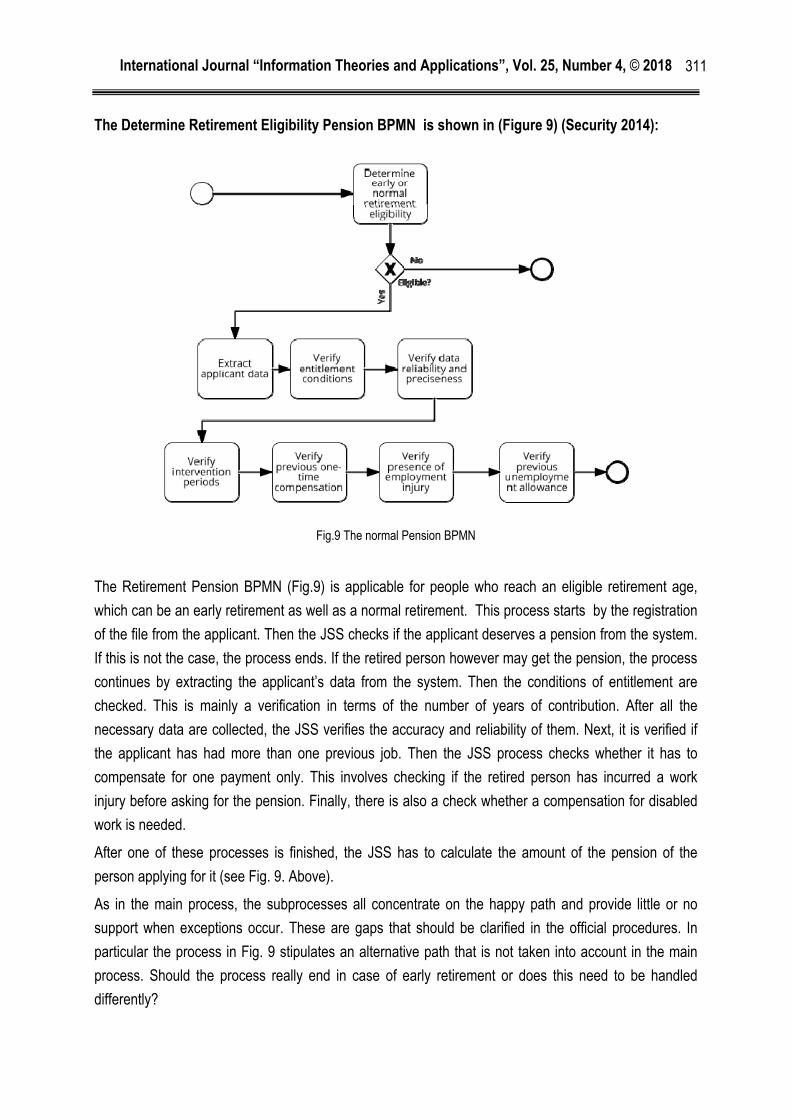
The Determine Retirement Eligibility Pension BPMN is shown in (Figure 9) (Security 2014):
Fig.9 The normal Pension BPMN
The Retirement Pension BPMN (Fig.9) is applicable for people who reach an eligible retirement age,
which can be an early retirement as well as a normal retirement. This process starts by the registration
of the file from the applicant. Then the JSS checks if the applicant deserves a pension from the system.
If this is not the case, the process ends. If the retired person however may get the pension, the process
continues by extracting the applicant’s data from the system. Then the conditions of entitlement are
checked. This is mainly a verification in terms of the number of years of contribution. After all the
necessary data are collected, the JSS verifies the accuracy and reliability of them. Next, it is verified if
the applicant has had more than one previous job. Then the JSS process checks whether it has to
compensate for one payment only. This involves checking if the retired person has incurred a work
injury before asking for the pension. Finally, there is also a check whether a compensation for disabled
work is needed.
After one of these processes is finished, the JSS has to calculate the amount of the pension of the
person applying for it (see Fig. 9. Above).
As in the main process, the subprocesses all concentrate on the happy path and provide little or no
support when exceptions occur. These are gaps that should be clarified in the official procedures. In
particular the process in Fig. 9 stipulates an alternative path that is not taken into account in the main
process. Should the process really end in case of early retirement or does this need to be handled
differently?
International Journal “Information Theories and Applications”, Vol. 25, Number 4, © 2018
312
When analyzing the efficiency of the proposed process models, some apparent characteristics are easy
to derive from the process models. Firstly, there are a lot of steps that involve data extraction or data
validation. It triggers the question why those validations are executed in such a fragmented sequence.
Do some of these steps represent double work or, if not, could they also be merged into a single
activity? A deeper analysis on task-level rather than process-level could reveal some opportunities to
make the process more efficient.
Furthermore, as can be seen in the Table below the subprocesses seem to have some common
activities; It would be beneficial to examine to what extend these tasks really are similar to each other
and whether the four different processes could actually be collapsed into a single model.
Natural death Partial disability Work-related RetirementCollect signature of heirs X Attach documents X Extract data X X X X Verify entitlement X X X X Verify reliability X X X X Verify intervention periods X X X X Verify employment injury X X X Confirm early retirement X Confirm former one-time payment X Confirm former unemployment allowance
X
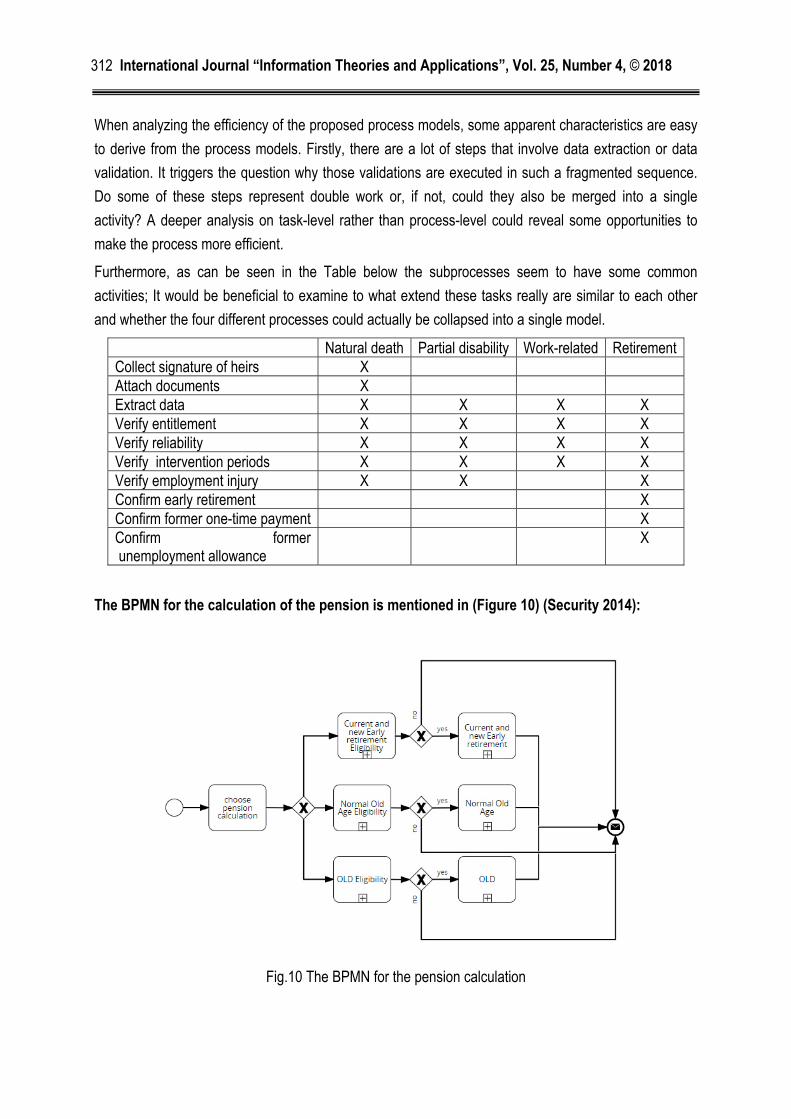
The BPMN for the calculation of the pension is mentioned in (Figure 10) (Security 2014):
Fig.10 The BPMN for the pension calculation
International Journal “Information Theories and Applications”, Vol. 25, Number 4, © 2018
313
The pension calculation process (Fig.10) starts by choosing the right pension calculation. There are
three types of decisions possible in the JSS system according to the type of pension the applicant asks
for. They are shown in Fig.10. We will explain these three decisions later in this section. Finally, JSS
send the pension calculation to the applicant.
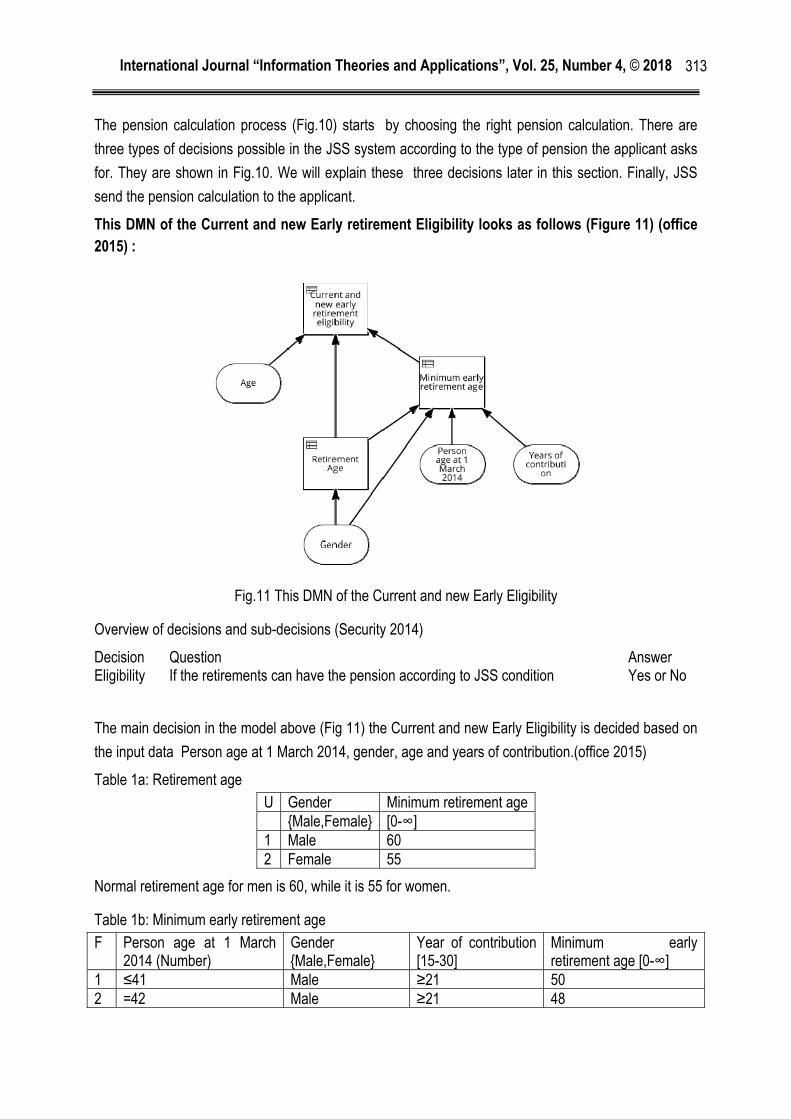
This DMN of the Current and new Early retirement Eligibility looks as follows (Figure 11) (office 2015) :
Fig.11 This DMN of the Current and new Early Eligibility
Overview of decisions and sub-decisions (Security 2014)
Decision Question Answer Eligibility If the retirements can have the pension according to JSS condition Yes or No
The main decision in the model above (Fig 11) the Current and new Early Eligibility is decided based on
the input data Person age at 1 March 2014, gender, age and years of contribution.(office 2015)
Table 1a: Retirement age U Gender Minimum retirement age {Male,Female} [0-∞] 1 Male 60 2 Female 55
Normal retirement age for men is 60, while it is 55 for women.
Table 1b: Minimum early retirement age F Person age at 1 March
2014 (Number) Gender {Male,Female}
Year of contribution [15-30]
Minimum early retirement age [0-∞]
1 ≤41 Male ≥21 50 2 =42 Male ≥21 48
International Journal “Information Theories and Applications”, Vol. 25, Number 4, © 2018
314
3 =43 Male ≥20 47 4 =44 Male ≥19 46 5 ≥45 Male ≥19 45 6 ≤41 Female ≥19 50 7 =42 Female ≥18 48 8 =43 Female ≥17 47 9 =44 Female ≥16 46 10 ≥45 Female ≥16 45 11 - - ≥25 0 12 - - - = Retirement age
Depending on your age in March 2014, your gender and your years of contribution, you are allowed to
retire early from a certain age. People with more than 25 years of contribution are always allowed to
have early retirement. All other people can only retire when they reach the normal retirement age.
Table 1c: Current and new early retirement eligibility F Minimum retirement age [0-∞] Eligibility [Yes, No] 1 = Retirement age No 3 ≤ Age Yes 4 - No
Whenever the minimum early retirement age is determined as being equal to normal retirement, the
person is not eligible for early retirement. In all other cases, the applicant is eligible as soon as they
reach the minimum early retirement age.
The current and new early retirement calculation is shown below in Fig. 12., using DMN.
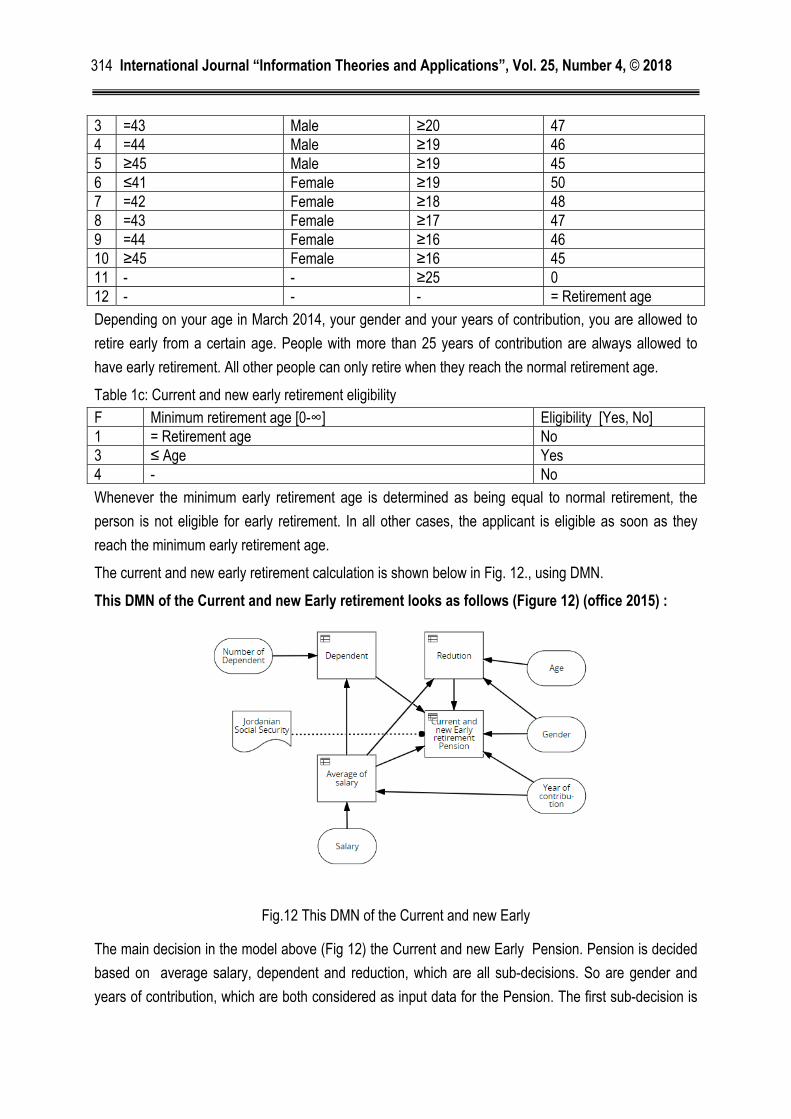
This DMN of the Current and new Early retirement looks as follows (Figure 12) (office 2015) :
Fig.12 This DMN of the Current and new Early
The main decision in the model above (Fig 12) the Current and new Early Pension. Pension is decided
based on average salary, dependent and reduction, which are all sub-decisions. So are gender and
years of contribution, which are both considered as input data for the Pension. The first sub-decision is
International Journal “Information Theories and Applications”, Vol. 25, Number 4, © 2018
315
reduction. Reduction is decided based on the sub-decisions average salary, also age and gender which
are both considered as input data. The second sub-decision is average salary based on the salary
which is considered as input data. The Final sub-decision is the dependent based on the sub-decisions
average salary and the number of dependent which the retirements have and the minima is (0) and the
maximum is (3) (office 2015).
Overview of decisions and sub-decisions (Security 2014)
Decision Question Answer Pension Calculate the pension salary that will be paid out to the
applicant on a monthly basis (Non-negative) Monetary value in JD.
Average salary
Calculate the average salary according to the last 2 years salary the retirements had
(Non-negative) Monetary value in JD.
Dependent how many dependent the retirements have (Non-negative) Number. Redaction How much discount the JSS will do according to the law (Non-negative) Monetary
value in JD. Table 2 explains the pension decision (office 2015).
Pension salary =Average of salary + Dependent-Redaction + 20
Table 2 explains the main decisions shown in the model above (Fig 12). We can see the calculation of
the pension according to this type of decision from the table. The sub-decisions average salary, number
of dependent people and conditions for reduction, which we will explain later in this section. The input
data are gender and years of contribution.
In the left column of the table, three different pension decisions can be found. Also the eligibility,
average salary, dependent and redaction are sub-decision and gender, years of contribution input data
to have the output pension salary.
In our case for the calculation of the DMN of the Current and new Early pension, the decision has more
than one sub-decision In Table 3. we will explain the first sub-decision, namely the average salary
(office 2015).
Table 3: Average salary sub-decision
F Salary (Number) Average Salary (Currency) 1 ≤ 50 JD 50 JD 2 ≤ 1500 JD = 0.025 * Years of contribution * Salary 3 > 1500 JD = 0.025 * Years of contribution * 1500 + Years of contribution * (Salary – 1500)
In this sub-decision as we can see that there are only three conditions, namely the salary before
retirement and the years of contribution. If the salary is either (≤50) or (≤1500) or (≥1500) and years of
contribution are between 15 and 30, the JSS does the average of the pension calculation as we can see
in table (3).
In this Table(4) we will explain the second sub-decision, namely the number of Dependent people (office
2015).
Table 4: Dependent sub-decision
International Journal “Information Theories and Applications”, Vol. 25, Number 4, © 2018
316
U Number of Dependents
Dependent
Number Number 1 = 0 0 2 = 1 = Average Salary * 0.12 3 = 2 = Average Salary * (0.02 + 0.06) 4 ≥ 3 = Average Salary * (0.02 + 0.06 + 0.06)
As we mentioned before and as we can see from Table (4) in the JSS the minimum number of
dependent people is (0) and the maximum is (3). In this case there is only one input data number of
dependent people and based on the other sub-decision, the average salary, retiring people will
according to the number of dependent people get extra’s on their pension.
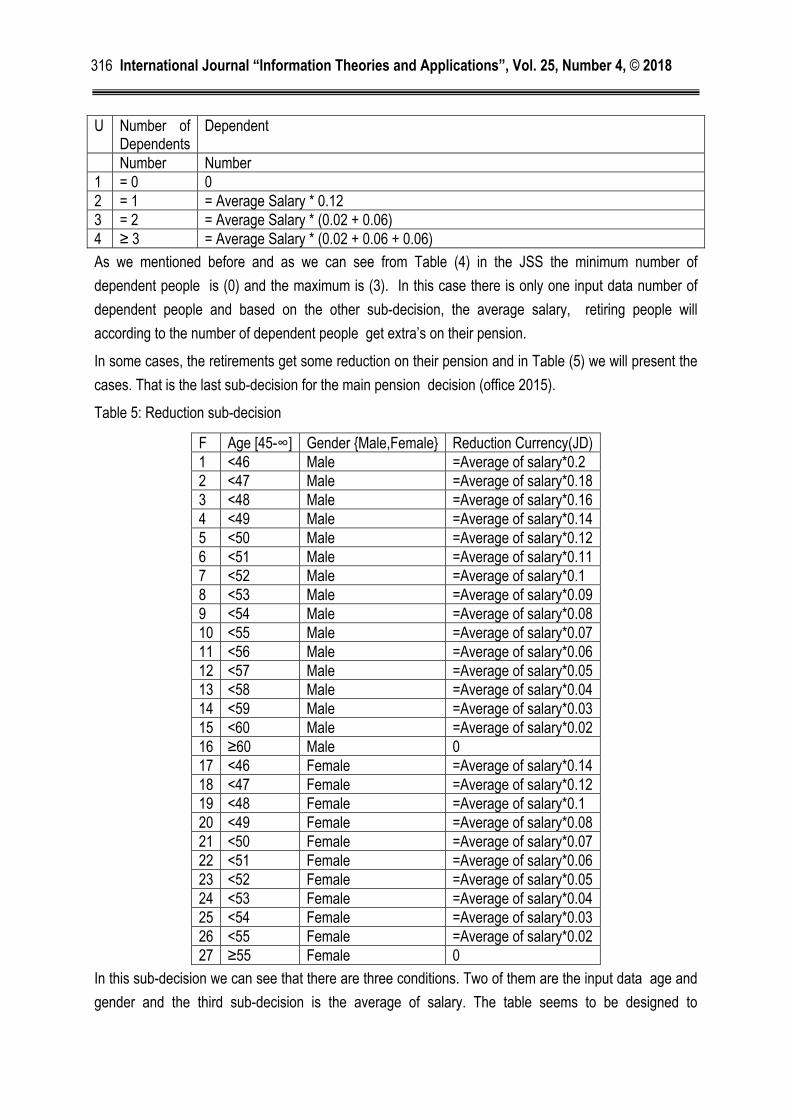
In some cases, the retirements get some reduction on their pension and in Table (5) we will present the
cases. That is the last sub-decision for the main pension decision (office 2015).
Table 5: Reduction sub-decision
F Age [45-∞] Gender {Male,Female} Reduction Currency(JD) 1 <46 Male =Average of salary*0.2 2 <47 Male =Average of salary*0.18 3 <48 Male =Average of salary*0.16 4 <49 Male =Average of salary*0.14 5 <50 Male =Average of salary*0.12 6 <51 Male =Average of salary*0.11 7 <52 Male =Average of salary*0.1 8 <53 Male =Average of salary*0.09 9 <54 Male =Average of salary*0.08 10 <55 Male =Average of salary*0.07 11 <56 Male =Average of salary*0.06 12 <57 Male =Average of salary*0.05 13 <58 Male =Average of salary*0.04 14 <59 Male =Average of salary*0.03 15 <60 Male =Average of salary*0.02 16 ≥60 Male 0 17 <46 Female =Average of salary*0.14 18 <47 Female =Average of salary*0.12 19 <48 Female =Average of salary*0.1 20 <49 Female =Average of salary*0.08 21 <50 Female =Average of salary*0.07 22 <51 Female =Average of salary*0.06 23 <52 Female =Average of salary*0.05 24 <53 Female =Average of salary*0.04 25 <54 Female =Average of salary*0.03 26 <55 Female =Average of salary*0.02 27 ≥55 Female 0
In this sub-decision we can see that there are three conditions. Two of them are the input data age and
gender and the third sub-decision is the average of salary. The table seems to be designed to
International Journal “Information Theories and Applications”, Vol. 25, Number 4, © 2018
317
discourage early retirements by deducting a percentage of the normal pension. As would be expected,
this deduction is larger the further a person is removed from the age of retirement. Generally speaking,
applicant gain 2% of their salary by postponing their retirement by one year. At a certain point in time,
however, this gain decreases. For men aged 49, an additional year in the workforce will only decrease
the reduction by 1% of the average salary. For women, this effect takes place from the age of 46. These
could be considered as the ages before which authorities attempt to discourage retirement.
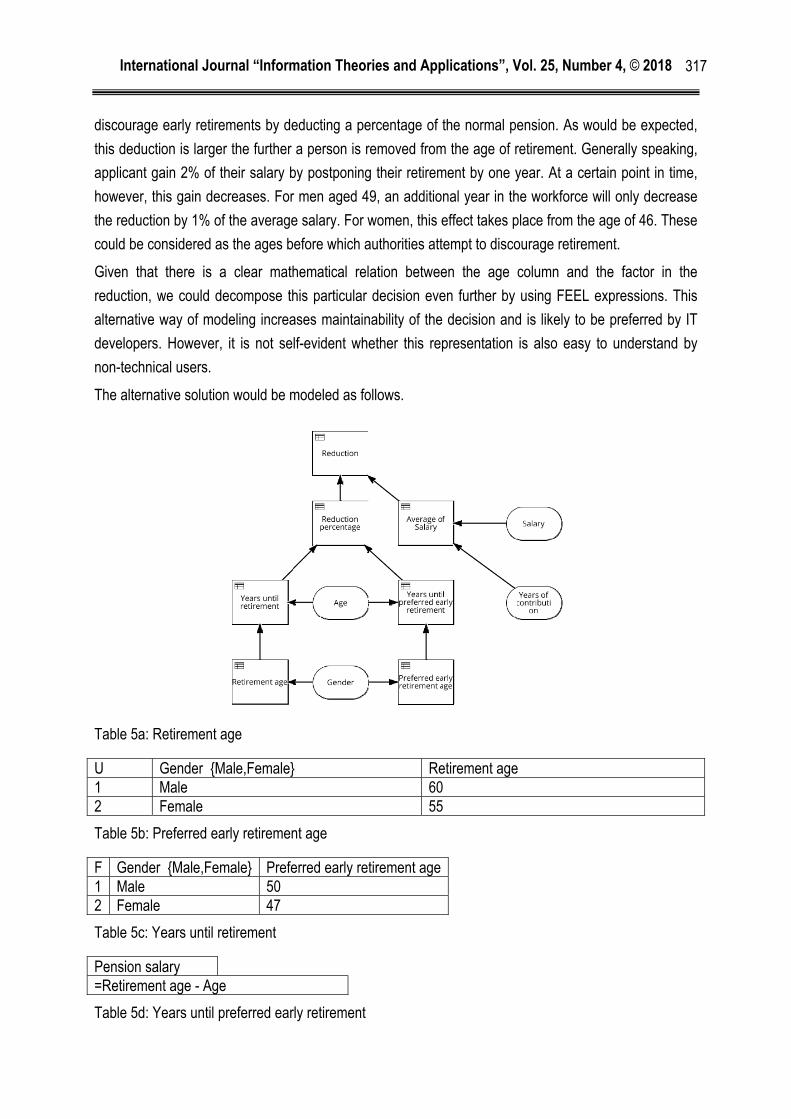
Given that there is a clear mathematical relation between the age column and the factor in the
reduction, we could decompose this particular decision even further by using FEEL expressions. This
alternative way of modeling increases maintainability of the decision and is likely to be preferred by IT
developers. However, it is not self-evident whether this representation is also easy to understand by
non-technical users.
The alternative solution would be modeled as follows.
Table 5a: Retirement age
U Gender {Male,Female} Retirement age 1 Male 60 2 Female 55
Table 5b: Preferred early retirement age
F Gender {Male,Female} Preferred early retirement age1 Male 50 2 Female 47
Table 5c: Years until retirement
Pension salary =Retirement age - Age
Table 5d: Years until preferred early retirement
International Journal “Information Theories and Applications”, Vol. 25, Number 4, © 2018
318
Pension salary =Preferred early retirement age - Age
Table 5e: Reduction percentage
U Years until retirement
Years until preferred early retirement
Reduction percentage Percentage
1 > 0 > 0 =0.10 + 0.02 * Years until preferred early retirement 2 > 0 ≤ 0 =0.01 + 0.01 * Years until retirement 3 ≤ 0 - 0
Table 5f: Reduction
Reduction =Average of salary * Reduction percentage
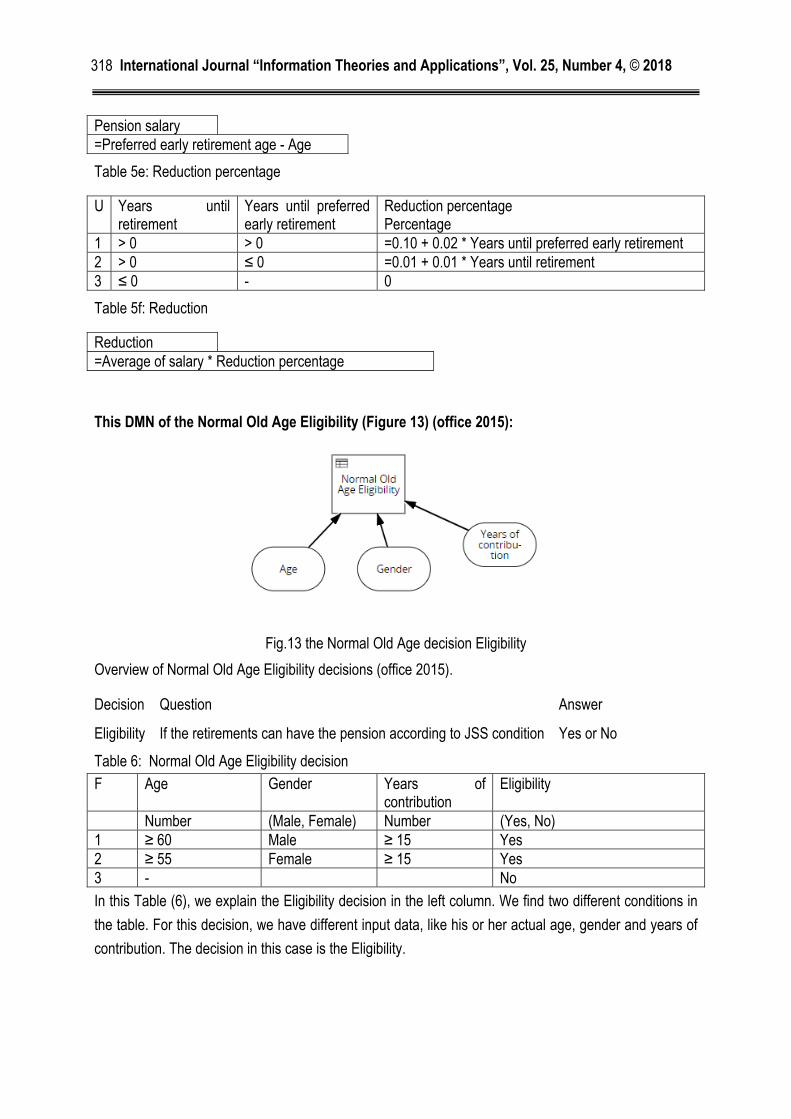
This DMN of the Normal Old Age Eligibility (Figure 13) (office 2015):
Fig.13 the Normal Old Age decision Eligibility
Overview of Normal Old Age Eligibility decisions (office 2015).
Decision Question Answer
Eligibility If the retirements can have the pension according to JSS condition Yes or No
Table 6: Normal Old Age Eligibility decision F Age Gender Years of
contribution Eligibility
Number (Male, Female) Number (Yes, No) 1 ≥ 60 Male ≥ 15 Yes 2 ≥ 55 Female ≥ 15 Yes 3 - No
In this Table (6), we explain the Eligibility decision in the left column. We find two different conditions in
the table. For this decision, we have different input data, like his or her actual age, gender and years of
contribution. The decision in this case is the Eligibility.
International Journal “Information Theories and Applications”, Vol. 25, Number 4, © 2018
319
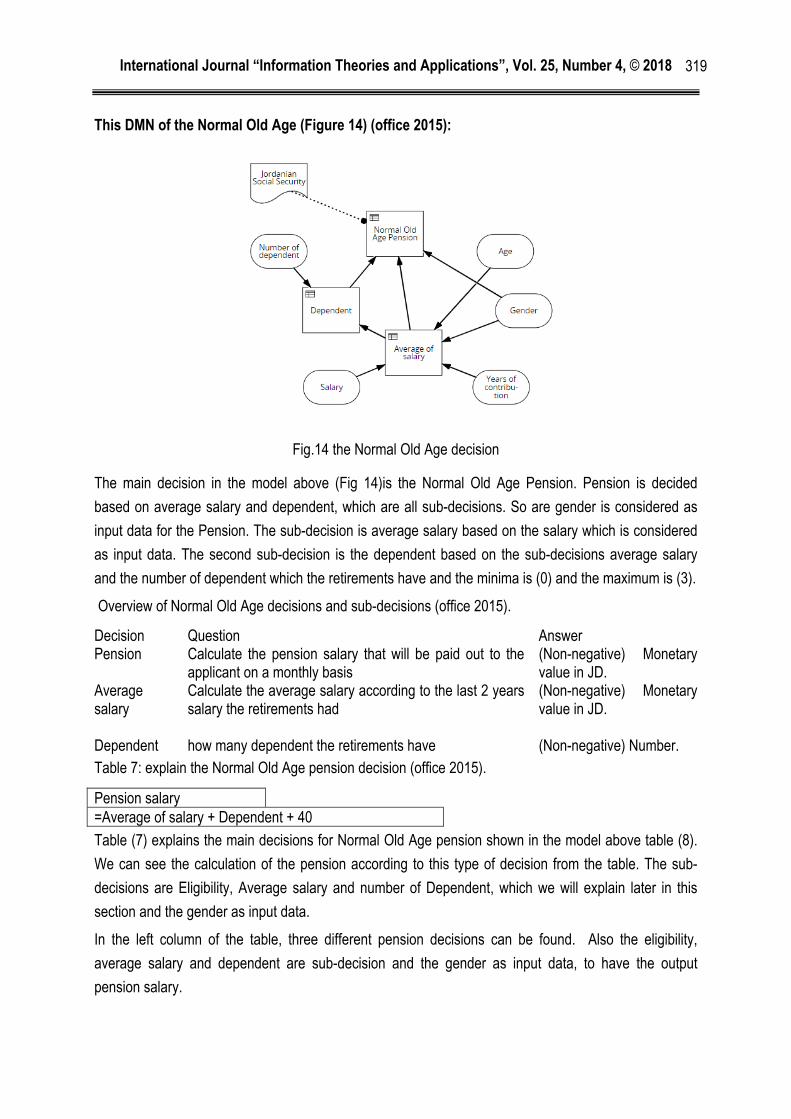
This DMN of the Normal Old Age (Figure 14) (office 2015):
Fig.14 the Normal Old Age decision
The main decision in the model above (Fig 14)is the Normal Old Age Pension. Pension is decided
based on average salary and dependent, which are all sub-decisions. So are gender is considered as
input data for the Pension. The sub-decision is average salary based on the salary which is considered
as input data. The second sub-decision is the dependent based on the sub-decisions average salary
and the number of dependent which the retirements have and the minima is (0) and the maximum is (3).
Overview of Normal Old Age decisions and sub-decisions (office 2015).
Decision Question Answer Pension Calculate the pension salary that will be paid out to the
applicant on a monthly basis (Non-negative) Monetary value in JD.
Average salary
Calculate the average salary according to the last 2 years salary the retirements had
(Non-negative) Monetary value in JD.
Dependent how many dependent the retirements have (Non-negative) Number. Table 7: explain the Normal Old Age pension decision (office 2015).
Pension salary =Average of salary + Dependent + 40
Table (7) explains the main decisions for Normal Old Age pension shown in the model above table (8).
We can see the calculation of the pension according to this type of decision from the table. The sub-
decisions are Eligibility, Average salary and number of Dependent, which we will explain later in this
section and the gender as input data.
In the left column of the table, three different pension decisions can be found. Also the eligibility,
average salary and dependent are sub-decision and the gender as input data, to have the output
pension salary.
International Journal “Information Theories and Applications”, Vol. 25, Number 4, © 2018
320
Also, this decision like the previous decision have a combination of sub-decisions. In table (9) we
explain the Eligibility of one person for a pension according to different decision conditions. And this is
only one of the sub-decisions to be made (office 2015).
In the normal old age for the calculation of the pension, the decision has more than one sub-decision
(not only the Eligibility). In Fig. 18. we will explain the second sub-decision, namely the Average salary
(office 2015).
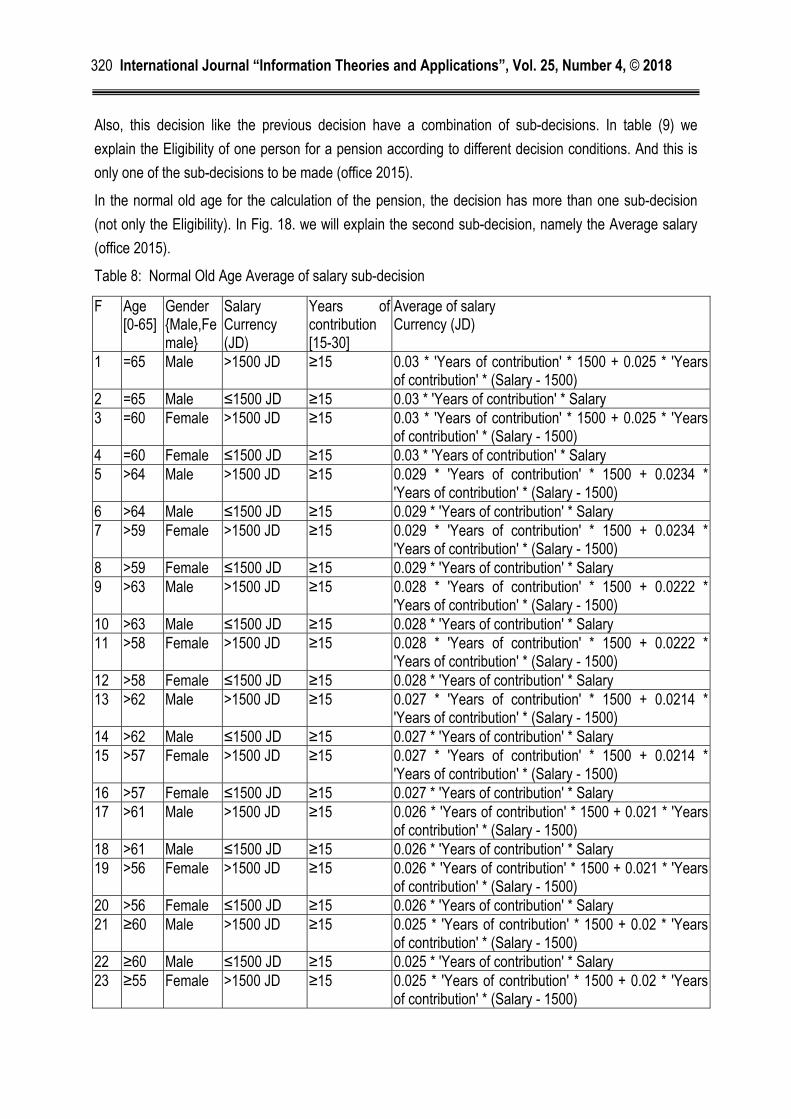
Table 8: Normal Old Age Average of salary sub-decision
F Age [0-65]
Gender {Male,Female}
Salary Currency (JD)
Years of contribution [15-30]
Average of salary Currency (JD)
1 =65 Male >1500 JD ≥15 0.03 * 'Years of contribution' * 1500 + 0.025 * 'Years of contribution' * (Salary - 1500)
2 =65 Male ≤1500 JD ≥15 0.03 * 'Years of contribution' * Salary 3 =60 Female >1500 JD ≥15 0.03 * 'Years of contribution' * 1500 + 0.025 * 'Years
of contribution' * (Salary - 1500) 4 =60 Female ≤1500 JD ≥15 0.03 * 'Years of contribution' * Salary 5 >64 Male >1500 JD ≥15 0.029 * 'Years of contribution' * 1500 + 0.0234 *
'Years of contribution' * (Salary - 1500) 6 >64 Male ≤1500 JD ≥15 0.029 * 'Years of contribution' * Salary 7 >59 Female >1500 JD ≥15 0.029 * 'Years of contribution' * 1500 + 0.0234 *
'Years of contribution' * (Salary - 1500) 8 >59 Female ≤1500 JD ≥15 0.029 * 'Years of contribution' * Salary 9 >63 Male >1500 JD ≥15 0.028 * 'Years of contribution' * 1500 + 0.0222 *
'Years of contribution' * (Salary - 1500) 10 >63 Male ≤1500 JD ≥15 0.028 * 'Years of contribution' * Salary 11 >58 Female >1500 JD ≥15 0.028 * 'Years of contribution' * 1500 + 0.0222 *
'Years of contribution' * (Salary - 1500) 12 >58 Female ≤1500 JD ≥15 0.028 * 'Years of contribution' * Salary 13 >62 Male >1500 JD ≥15 0.027 * 'Years of contribution' * 1500 + 0.0214 *
'Years of contribution' * (Salary - 1500) 14 >62 Male ≤1500 JD ≥15 0.027 * 'Years of contribution' * Salary 15 >57 Female >1500 JD ≥15 0.027 * 'Years of contribution' * 1500 + 0.0214 *
'Years of contribution' * (Salary - 1500) 16 >57 Female ≤1500 JD ≥15 0.027 * 'Years of contribution' * Salary 17 >61 Male >1500 JD ≥15 0.026 * 'Years of contribution' * 1500 + 0.021 * 'Years
of contribution' * (Salary - 1500) 18 >61 Male ≤1500 JD ≥15 0.026 * 'Years of contribution' * Salary 19 >56 Female >1500 JD ≥15 0.026 * 'Years of contribution' * 1500 + 0.021 * 'Years
of contribution' * (Salary - 1500) 20 >56 Female ≤1500 JD ≥15 0.026 * 'Years of contribution' * Salary 21 ≥60 Male >1500 JD ≥15 0.025 * 'Years of contribution' * 1500 + 0.02 * 'Years
of contribution' * (Salary - 1500) 22 ≥60 Male ≤1500 JD ≥15 0.025 * 'Years of contribution' * Salary 23 ≥55 Female >1500 JD ≥15 0.025 * 'Years of contribution' * 1500 + 0.02 * 'Years
of contribution' * (Salary - 1500)
International Journal “Information Theories and Applications”, Vol. 25, Number 4, © 2018
321
24 ≥55 Female ≤1500 JD ≥15 0.025 * 'Years of contribution' * Salary 25 - - - - oJD
In this sub-decision as we can see that there are four input data, his or her actual age, gender, namely
the salary and the years of contribution. the JSS does the average of the pension calculation in this
type of decision as we can see in Fig (14).
In this table (9) we will explain the third sub-decision, namely the number of Dependent people (office
2015).
Table 9: Normal Old Age Dependent sub-decision U Number of dependents Dependent Number Currency 1 = 0 0 JD 2 = 1 = Average of salary * 0.12 3 = 2 = Average of salary * (0.12 + 0.06) 4 ≥ 3 = Average of salary * (0.12 + 0.06 + 0.06)
As we mentioned before and as we can see from Fig (19) in the JSS the minimum number of dependent
people is (0) and the maximum is (3). In this case there is only one input data number of dependent
people and based on the other sub-decision, the average salary, retiring people will according to the
number of dependent people get extra’s on their pension.
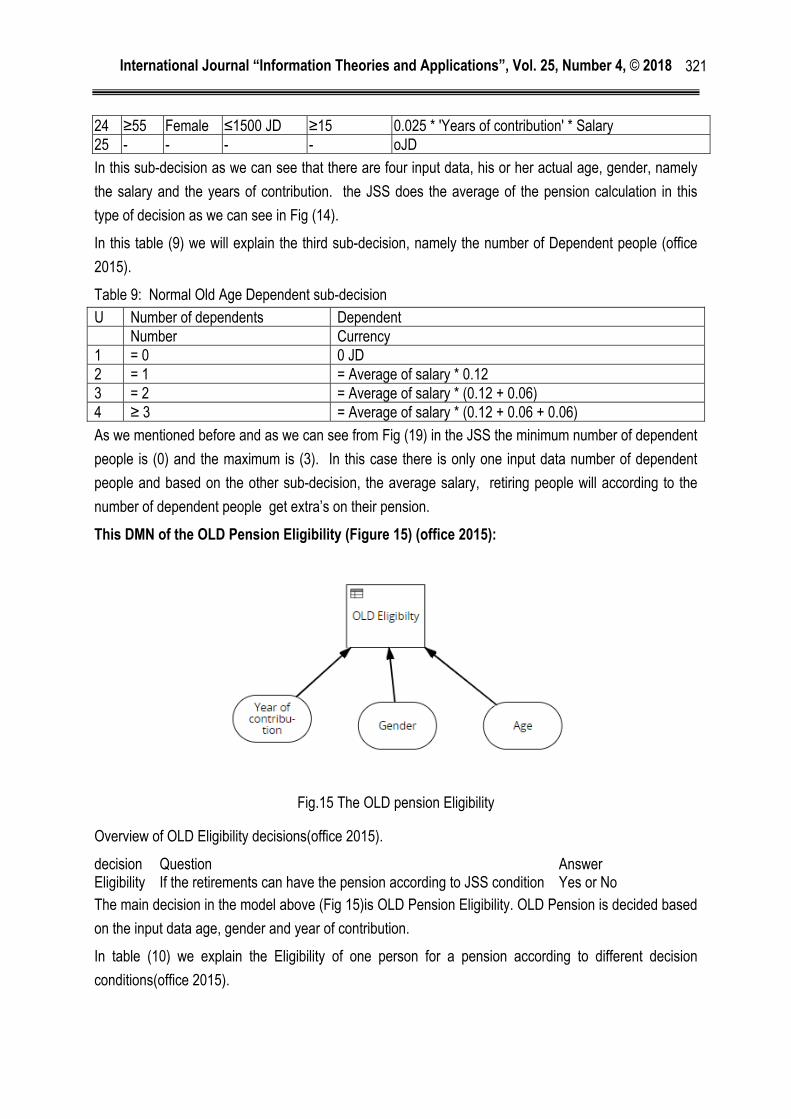
This DMN of the OLD Pension Eligibility (Figure 15) (office 2015):
Fig.15 The OLD pension Eligibility
Overview of OLD Eligibility decisions(office 2015).
decision Question Answer Eligibility If the retirements can have the pension according to JSS condition Yes or No The main decision in the model above (Fig 15)is OLD Pension Eligibility. OLD Pension is decided based
on the input data age, gender and year of contribution.
In table (10) we explain the Eligibility of one person for a pension according to different decision
conditions(office 2015).
International Journal “Information Theories and Applications”, Vol. 25, Number 4, © 2018
322
Table 10: The OLD Eligibility decision F Age Gender Years of
contribution Eligibility
Number (Male, Female) Number (Yes, No) 1 ≥ 45 Male ≥ 18 Yes 2 ≥ 45 Female ≥ 18 Yes 3 - No
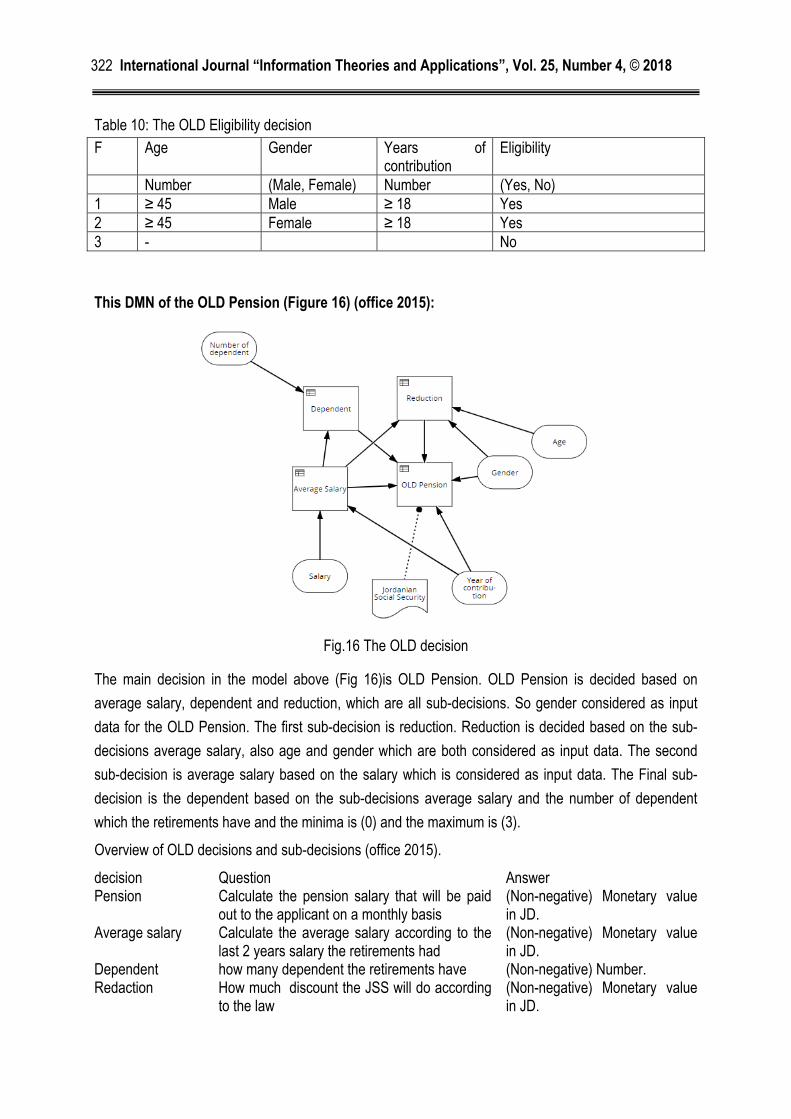
This DMN of the OLD Pension (Figure 16) (office 2015):
Fig.16 The OLD decision
The main decision in the model above (Fig 16)is OLD Pension. OLD Pension is decided based on
average salary, dependent and reduction, which are all sub-decisions. So gender considered as input
data for the OLD Pension. The first sub-decision is reduction. Reduction is decided based on the sub-
decisions average salary, also age and gender which are both considered as input data. The second
sub-decision is average salary based on the salary which is considered as input data. The Final sub-
decision is the dependent based on the sub-decisions average salary and the number of dependent
which the retirements have and the minima is (0) and the maximum is (3).
Overview of OLD decisions and sub-decisions (office 2015).
decision Question Answer Pension
Calculate the pension salary that will be paid out to the applicant on a monthly basis
(Non-negative) Monetary value in JD.
Average salary Calculate the average salary according to the last 2 years salary the retirements had
(Non-negative) Monetary value in JD.
Dependent how many dependent the retirements have (Non-negative) Number. Redaction How much discount the JSS will do according
to the law (Non-negative) Monetary value in JD.
International Journal “Information Theories and Applications”, Vol. 25, Number 4, © 2018
323
Table 11 explain the OLD pension decision (office 2015).
Pension salary = Average of salary + Dependent-Redaction + 20
Table 11 explains the main decisions for Normal Old Age pension shown in the model above (Fig 15).
We can see the calculation of the pension according to this type of decision from the table. The sub-
decisions are Eligibility, Average salary and number of Dependent, which we will explain later in this
section and the Gender as input data.
In the left column of the table, three different pension decisions can be found. Also the eligibility,
average salary and dependent are sub-decision and the gender as input data, to have the output
pension salary.
In the OLD pension calculation, the decision has more than one sub-decision. In table 12 we will explain
the second sub-decision, namely the Average salary (office 2015).
Table 12: OLD Average of salary sub-decision
F Salary Average salary Currency Currency 1 ≤ 50 JD 50 JD 2 > 1500 JD = 0.025 * Years of contribution * 1500 + 0.02 * Years of contribution * (Salary – 1500) 3 ≤ 1500 JD = 0.025 * Years of contribution * Salary
In this sub-decision as we can see that there are only two conditions, namely the salary before
retirement and the years of contribution. If the salary is either (≤50) or (≤1500) or (≥1500) and years of
contribution are between 15 and 30, the JSS does the average of salary calculation as we can see in
table (12).
In this Table (13) we will explain the third sub-decision, namely the number of Dependent people for
OLD decision (office 2015).
Table 13: OLD Dependent sub-decision
F Number of dependents DependentReduction Currency Currency 1 = 0 0 2 = 1 = Average Salary * 0.1 3 = 2 = Average Salary * 0.15 4 ≥ 3 = Average Salary * 0.2
As we can see from table (13) in this decision in the JSS the minimum number of dependent people is
(0) and the maximum is (3). In this case there is only one input data number of dependent people and
based on the other sub-decision, the average salary, retiring people will according to the number of
dependent people get extra’s on their pension.
In this cases, the retirements get some reduction on their pension and in table (14) we will present the
cases. That is the last sub-decision for the main decision (office 2015).
Table 14 OLD Redaction sub-decision
International Journal “Information Theories and Applications”, Vol. 25, Number 4, © 2018
324
F Gender Age OLD Reduction (Male, Female) Number Percentage 1 Male ≥ 59 0.00% 2 Male ≥ 45 =( (59 – Age)*0.01 + (49 – Age)
) * 0.02 * Average Salary 3 Female ≤ 54 5.00% 4 Female ≥ 54 0.00% 5 Female ≤ 50 10.00% 6 - - 0.00%
In this sub-decision, we can see that there are three conditions. Two of them are the input data age and
gender and the third sub-decision is the average of salary. There are five different cases two of them for
male and the rest for female which leads to a final redaction.
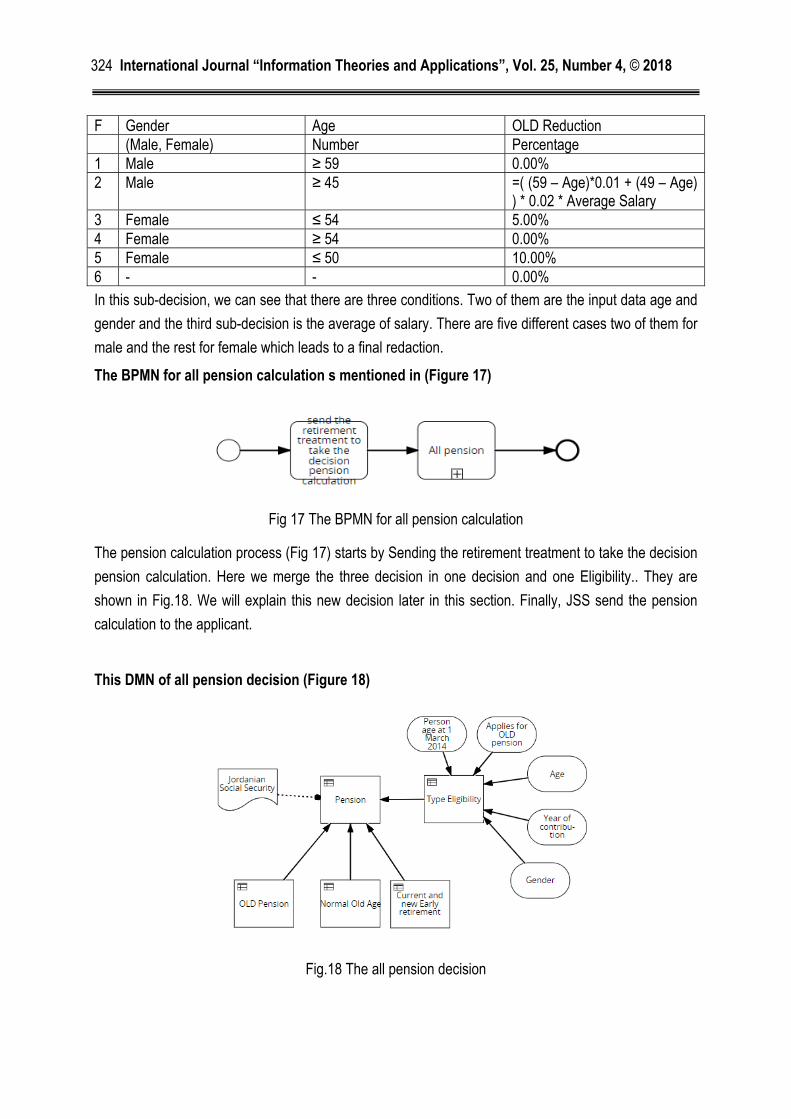
The BPMN for all pension calculation s mentioned in (Figure 17)
Fig 17 The BPMN for all pension calculation
The pension calculation process (Fig 17) starts by Sending the retirement treatment to take the decision
pension calculation. Here we merge the three decision in one decision and one Eligibility.. They are
shown in Fig.18. We will explain this new decision later in this section. Finally, JSS send the pension
calculation to the applicant.
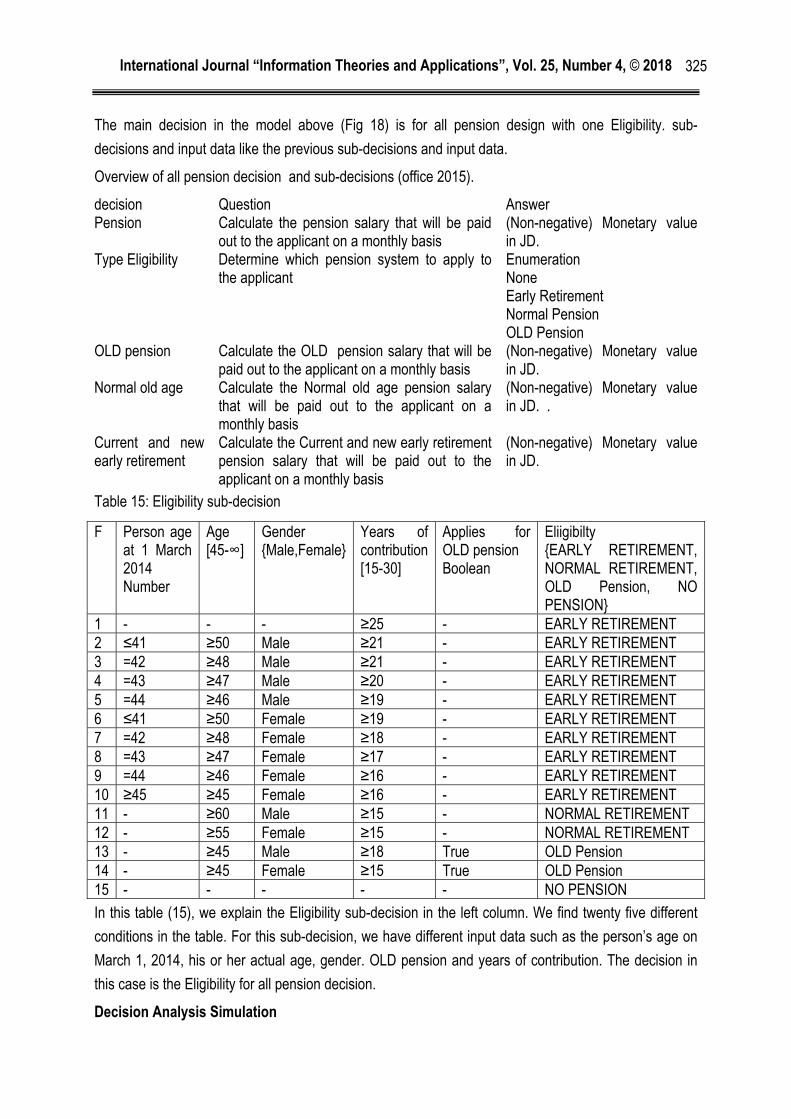
This DMN of all pension decision (Figure 18)
Fig.18 The all pension decision
International Journal “Information Theories and Applications”, Vol. 25, Number 4, © 2018
325
The main decision in the model above (Fig 18) is for all pension design with one Eligibility. sub-
decisions and input data like the previous sub-decisions and input data.
Overview of all pension decision and sub-decisions (office 2015).
decision Question Answer Pension
Calculate the pension salary that will be paid out to the applicant on a monthly basis
(Non-negative) Monetary value in JD.
Type Eligibility Determine which pension system to apply to the applicant
Enumeration None Early Retirement Normal Pension OLD Pension
OLD pension Calculate the OLD pension salary that will be paid out to the applicant on a monthly basis
(Non-negative) Monetary value in JD.
Normal old age Calculate the Normal old age pension salary that will be paid out to the applicant on a monthly basis
(Non-negative) Monetary value in JD. .
Current and new early retirement
Calculate the Current and new early retirement pension salary that will be paid out to the applicant on a monthly basis
(Non-negative) Monetary value in JD.
Table 15: Eligibility sub-decision
F Person age at 1 March 2014 Number
Age [45-∞]
Gender {Male,Female}
Years of contribution[15-30]
Applies for OLD pension Boolean
Eliigibilty {EARLY RETIREMENT, NORMAL RETIREMENT, OLD Pension, NO PENSION}
1 - - - ≥25 - EARLY RETIREMENT 2 ≤41 ≥50 Male ≥21 - EARLY RETIREMENT 3 =42 ≥48 Male ≥21 - EARLY RETIREMENT 4 =43 ≥47 Male ≥20 - EARLY RETIREMENT 5 =44 ≥46 Male ≥19 - EARLY RETIREMENT 6 ≤41 ≥50 Female ≥19 - EARLY RETIREMENT 7 =42 ≥48 Female ≥18 - EARLY RETIREMENT 8 =43 ≥47 Female ≥17 - EARLY RETIREMENT 9 =44 ≥46 Female ≥16 - EARLY RETIREMENT 10 ≥45 ≥45 Female ≥16 - EARLY RETIREMENT 11 - ≥60 Male ≥15 - NORMAL RETIREMENT 12 - ≥55 Female ≥15 - NORMAL RETIREMENT 13 - ≥45 Male ≥18 True OLD Pension 14 - ≥45 Female ≥15 True OLD Pension 15 - - - - - NO PENSION
In this table (15), we explain the Eligibility sub-decision in the left column. We find twenty five different
conditions in the table. For this sub-decision, we have different input data such as the person’s age on
March 1, 2014, his or her actual age, gender. OLD pension and years of contribution. The decision in
this case is the Eligibility for all pension decision.
Decision Analysis Simulation
International Journal “Information Theories and Applications”, Vol. 25, Number 4, © 2018
326
Being a structured and non-ambiguous language, DMN can be executed by a decision engine. This
allows for decisions to be simulated. Simulation gives decision-makers the ability to foresee and quantify
the effect of changing decisions. As such, several possible scenario can be compared and the best
scenario can be selected.
Apart from being executable, the visual representation of decisions in DMN allows for easy
understandability and transparency. Decision-makers can perform visual checks on completeness and
consistency of their decision models.
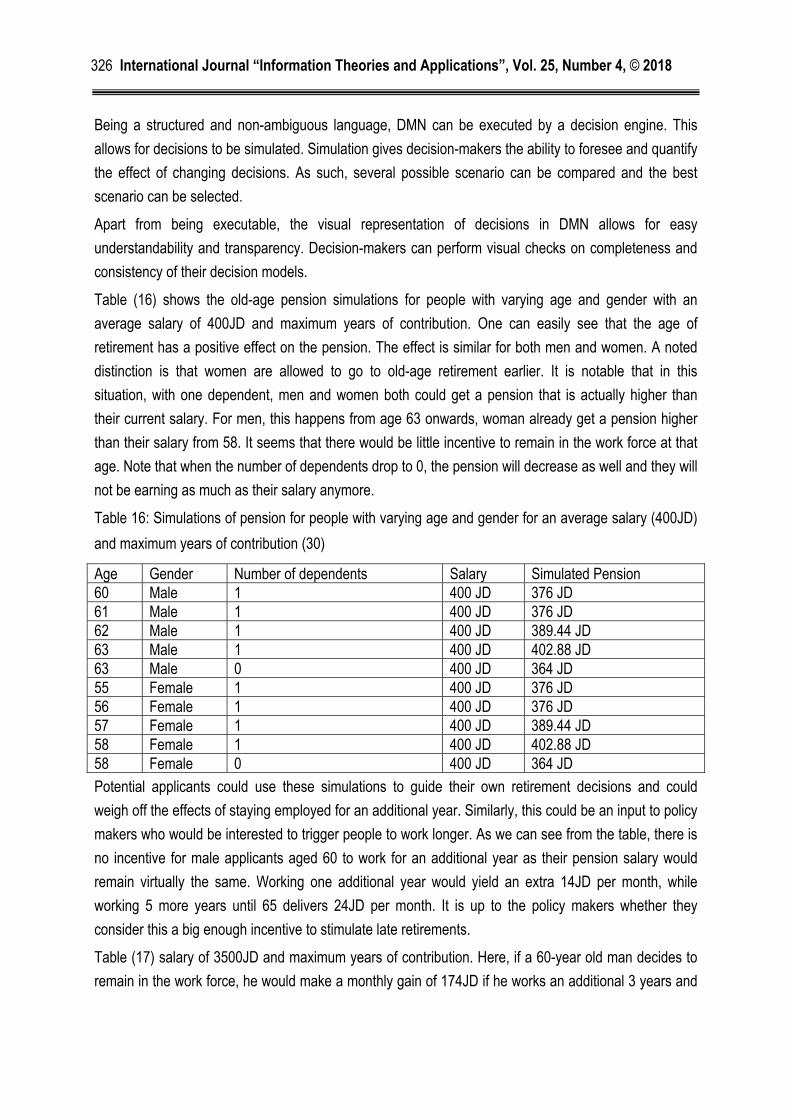
Table (16) shows the old-age pension simulations for people with varying age and gender with an
average salary of 400JD and maximum years of contribution. One can easily see that the age of
retirement has a positive effect on the pension. The effect is similar for both men and women. A noted
distinction is that women are allowed to go to old-age retirement earlier. It is notable that in this
situation, with one dependent, men and women both could get a pension that is actually higher than
their current salary. For men, this happens from age 63 onwards, woman already get a pension higher
than their salary from 58. It seems that there would be little incentive to remain in the work force at that
age. Note that when the number of dependents drop to 0, the pension will decrease as well and they will
not be earning as much as their salary anymore.
Table 16: Simulations of pension for people with varying age and gender for an average salary (400JD)
and maximum years of contribution (30)
Age Gender Number of dependents Salary Simulated Pension 60 Male 1 400 JD 376 JD 61 Male 1 400 JD 376 JD 62 Male 1 400 JD 389.44 JD 63 Male 1 400 JD 402.88 JD 63 Male 0 400 JD 364 JD 55 Female 1 400 JD 376 JD 56 Female 1 400 JD 376 JD 57 Female 1 400 JD 389.44 JD 58 Female 1 400 JD 402.88 JD 58 Female 0 400 JD 364 JD
Potential applicants could use these simulations to guide their own retirement decisions and could
weigh off the effects of staying employed for an additional year. Similarly, this could be an input to policy
makers who would be interested to trigger people to work longer. As we can see from the table, there is
no incentive for male applicants aged 60 to work for an additional year as their pension salary would
remain virtually the same. Working one additional year would yield an extra 14JD per month, while
working 5 more years until 65 delivers 24JD per month. It is up to the policy makers whether they
consider this a big enough incentive to stimulate late retirements.
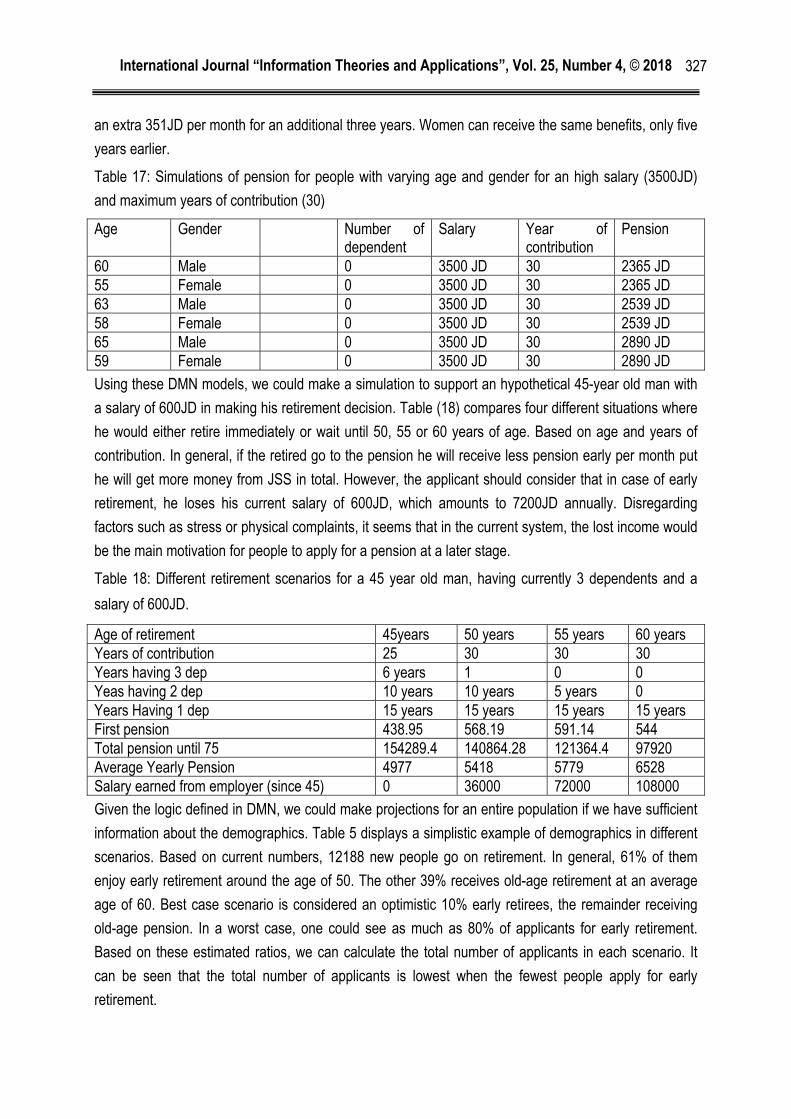
Table (17) salary of 3500JD and maximum years of contribution. Here, if a 60-year old man decides to
remain in the work force, he would make a monthly gain of 174JD if he works an additional 3 years and
International Journal “Information Theories and Applications”, Vol. 25, Number 4, © 2018
327
an extra 351JD per month for an additional three years. Women can receive the same benefits, only five
years earlier.
Table 17: Simulations of pension for people with varying age and gender for an high salary (3500JD)
and maximum years of contribution (30)
Age Gender Number of dependent
Salary Year of contribution
Pension
60 Male 0 3500 JD 30 2365 JD 55 Female 0 3500 JD 30 2365 JD 63 Male 0 3500 JD 30 2539 JD 58 Female 0 3500 JD 30 2539 JD 65 Male 0 3500 JD 30 2890 JD 59 Female 0 3500 JD 30 2890 JD
Using these DMN models, we could make a simulation to support an hypothetical 45-year old man with
a salary of 600JD in making his retirement decision. Table (18) compares four different situations where
he would either retire immediately or wait until 50, 55 or 60 years of age. Based on age and years of
contribution. In general, if the retired go to the pension he will receive less pension early per month put
he will get more money from JSS in total. However, the applicant should consider that in case of early
retirement, he loses his current salary of 600JD, which amounts to 7200JD annually. Disregarding
factors such as stress or physical complaints, it seems that in the current system, the lost income would
be the main motivation for people to apply for a pension at a later stage.
Table 18: Different retirement scenarios for a 45 year old man, having currently 3 dependents and a
salary of 600JD.
Age of retirement 45years 50 years 55 years 60 years Years of contribution 25 30 30 30 Years having 3 dep 6 years 1 0 0 Yeas having 2 dep 10 years 10 years 5 years 0 Years Having 1 dep 15 years 15 years 15 years 15 years First pension 438.95 568.19 591.14 544 Total pension until 75 154289.4 140864.28 121364.4 97920 Average Yearly Pension 4977 5418 5779 6528 Salary earned from employer (since 45) 0 36000 72000 108000
Given the logic defined in DMN, we could make projections for an entire population if we have sufficient
information about the demographics. Table 5 displays a simplistic example of demographics in different
scenarios. Based on current numbers, 12188 new people go on retirement. In general, 61% of them
enjoy early retirement around the age of 50. The other 39% receives old-age retirement at an average
age of 60. Best case scenario is considered an optimistic 10% early retirees, the remainder receiving
old-age pension. In a worst case, one could see as much as 80% of applicants for early retirement.
Based on these estimated ratios, we can calculate the total number of applicants in each scenario. It
can be seen that the total number of applicants is lowest when the fewest people apply for early
retirement.
International Journal “Information Theories and Applications”, Vol. 25, Number 4, © 2018
328
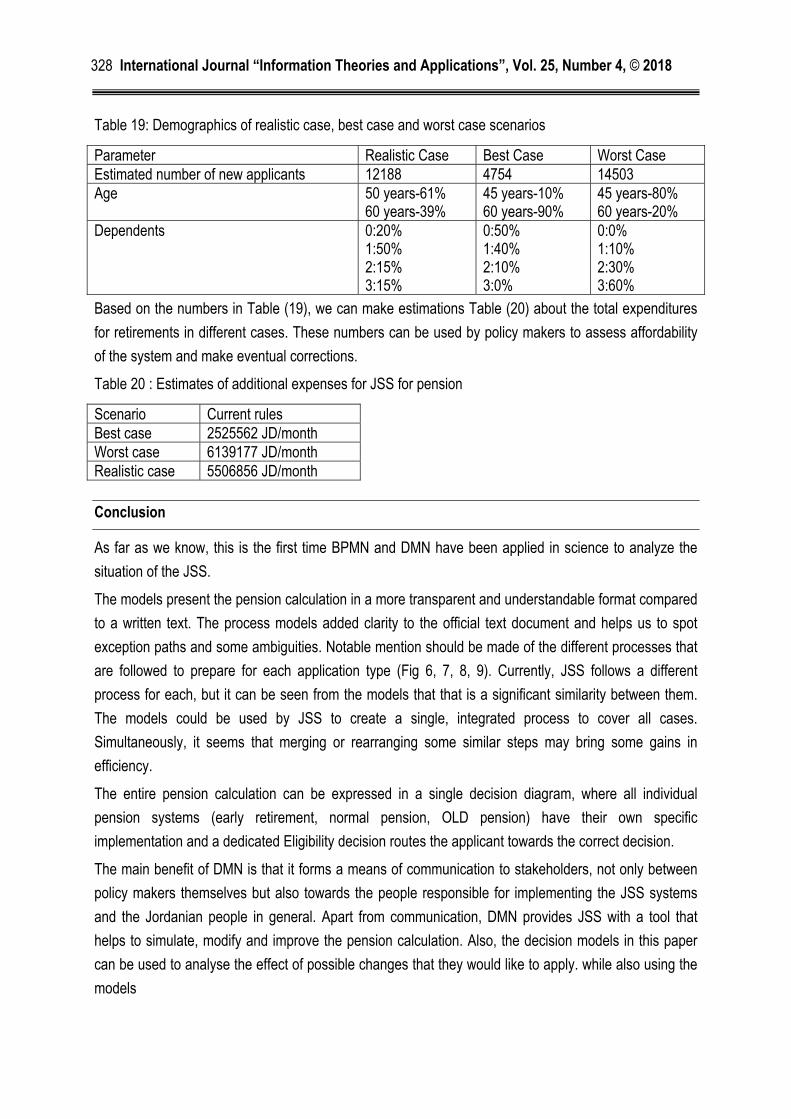
Table 19: Demographics of realistic case, best case and worst case scenarios
Parameter Realistic Case Best Case Worst Case Estimated number of new applicants 12188 4754 14503 Age 50 years-61%
60 years-39% 45 years-10% 60 years-90%
45 years-80% 60 years-20%
Dependents 0:20% 1:50% 2:15% 3:15%
0:50% 1:40% 2:10% 3:0%
0:0% 1:10% 2:30% 3:60%
Based on the numbers in Table (19), we can make estimations Table (20) about the total expenditures
for retirements in different cases. These numbers can be used by policy makers to assess affordability
of the system and make eventual corrections.
Table 20 : Estimates of additional expenses for JSS for pension
Scenario Current rules Best case 2525562 JD/month Worst case 6139177 JD/month Realistic case 5506856 JD/month
Conclusion
As far as we know, this is the first time BPMN and DMN have been applied in science to analyze the
situation of the JSS.
The models present the pension calculation in a more transparent and understandable format compared
to a written text. The process models added clarity to the official text document and helps us to spot
exception paths and some ambiguities. Notable mention should be made of the different processes that
are followed to prepare for each application type (Fig 6, 7, 8, 9). Currently, JSS follows a different
process for each, but it can be seen from the models that that is a significant similarity between them.
The models could be used by JSS to create a single, integrated process to cover all cases.
Simultaneously, it seems that merging or rearranging some similar steps may bring some gains in
efficiency.
The entire pension calculation can be expressed in a single decision diagram, where all individual
pension systems (early retirement, normal pension, OLD pension) have their own specific
implementation and a dedicated Eligibility decision routes the applicant towards the correct decision.
The main benefit of DMN is that it forms a means of communication to stakeholders, not only between
policy makers themselves but also towards the people responsible for implementing the JSS systems
and the Jordanian people in general. Apart from communication, DMN provides JSS with a tool that
helps to simulate, modify and improve the pension calculation. Also, the decision models in this paper
can be used to analyse the effect of possible changes that they would like to apply. while also using the
models
International Journal “Information Theories and Applications”, Vol. 25, Number 4, © 2018
329
We have shown how simulations can help the Jordanian people decide on their retirement age. This
knowledge can be used by policy makers to change rules so that desired behavior can be awarded and
stimulated.
Bibliography
A.white, s. (July, 2004). Introduction to BPMN. BPTrends, IBM Corporation.
Aguilar-Savén, R. S. (2004). "Business process modelling: Review and framework." International
Journal of Production Economics 90(2): 129-149.
Biard, T., A. Le Mauff, M. Bigand and J.-P. Bourey (2015). Separation of Decision Modeling from
Business Process Modeling Using New “Decision Model and Notation” (DMN) for Automating
Operational Decision-Making. Risks and Resilience of Collaborative Networks: 16th IFIP WG 5.5
Working Conference on Virtual Enterprises, PRO-VE 2015, Albi, France,, October 5-7, 2015,
Proceedings. L. M. Camarinha-Matos, F. Bénaben and W. Picard. Cham, Springer International
Publishing: 489-496.
Chinosi, M. and A. Trombetta (2012). "BPMN: An introduction to the standard." Computer Standards &
Interfaces 34(1): 124-134.
Debevoise, T., J. Taylor, J. Sinur and R. Geneva (2014). The MicroGuide to Process and Decision
Modeling in BPMN/DMN: Building More Effective Processes by Integrating Process Modeling with
Decision Modeling, CreateSpace Independent Publishing Platform.
Dijkstra, E. W. (1982). On the Role of Scientific Thought. Selected Writings on Computing: A personal
Perspective. New York, NY, Springer New York: 60-66.
Gabryelczyk, R. and A. Jurczuk (2017). "Does Experience Matter? Factors Affecting the
Understandability of the Business Process Modelling Notation." Procedia Engineering
182(Supplement C): 198-205.
Hilmi, N., A. Safa, U. R. Sumalia and M. Cinar (2017). "Coral reefs management and decision making
tools." Ocean & Coastal Management 146(Supplement C): 60-66.
M. zur Muehlen (2008). Getting started with business process modeling. IIR BPM Conference,. Orlando,
Florida,.
Mertens, S., F. Gailly and G. Poels (2015). Enhancing Declarative Process Models with DMN Decision
Logic. Enterprise, Business-Process and Information Systems Modeling: 16th International
Conference, BPMDS 2015, 20th International Conference, EMMSAD 2015, Held at CAiSE 2015,
International Journal “Information Theories and Applications”, Vol. 25, Number 4, © 2018
330
Stockholm, Sweden, June 8-9, 2015, Proceedings. K. Gaaloul, R. Schmidt, S. Nurcan, S. Guerreiro
and Q. Ma. Cham, Springer International Publishing: 151-165.
Metsemakers, W. J., M. Morgenstern, M. A. McNally, T. F. Moriarty, I. McFadyen, M. Scarborough, N.
A. Athanasou, P. E. Ochsner, R. Kuehl, M. Raschke, O. Borens, Z. Xie, S. Velkes, S. Hungerer, S. L.
Kates, C. Zalavras, P. V. Giannoudis, R. G. Richards and M. H. J. Verhofstad (2017). "Fracture-
related infection: A consensus on definition from an international expert group." Injury.
office, i. l. (2015). Jordan Actuarial bases and assumptions for the 8th Actuarial review of social securty
corporation as at 31 December 2013. a. a. s. b. s. s. d. Regional office for Arab states public finance.
Jordan.
OMG:. "Decision Model and Notation (DMN).", from http://www.omg.org/spec/DMN/.
Security, J. S. (2014). Pension law.
von Rosing, M., S. White, F. Cummins and H. de Man (2015). Business Process Model and Notation—
BPMN. The Complete Business Process Handbook. Boston, Morgan Kaufmann: 433-457.
WfMC. (April 2011). "Workflowmanagement coalition —terminology & glossary." from
http://www.wfmc.org/wfmc-standards-framework.html.
Authors' Information
Ahmad Zyad Alghzawi – Department of Business Informatics, Hasselt University, Belgium; e-mail: [email protected]
Frank Vanhoenshoven – Department of Business Informatics, Hasselt University, Belgium; e-mail: [email protected]
George Sammour – Department of Management Information system, Princess Sumaya University for Technology, Jordan; e-mail: [email protected]
Koen Vanhoof – Department of Business Informatics, Hasselt University, Belgium; e-mail: [email protected]
International Journal “Information Theories and Applications”, Vol. 25, Number 4, © 2018
331
RECONSTRUCTION OF BINARY IMAGES FROM THEIR HORIZONTAL AND
DIAGONAL PROJECTIONS1
Hasmik Sahakyan, Vladimir Ryazanov, Ani Margaryan
Abstract: In this paper we consider the problem of reconstruction of binary images from their horizontal
and diagonal projections. A large number of publications is devoted to analysis of straight horizontal
and/or vertical projections. But reconstruction by the use of incorporated diagonal projections is of a
principal difference.
Keywords: Discrete tomography, inverse problem, horizontal and diagonal projections.
ITHEA Keywords: F.2.2 Nonnumerical Algorithms and Problems: G.2.1 Combinatorics
Introduction
Discrete Tomography aims at recovering of discrete sets from their projections composed along the
given set of directions. Discrete sets or lattice sets are finite subsets of vertices of the integer lattice .
The lattice directions are those, represented by any nonzero vectors of . A line in -dimensional
Euclidean space is a lattice line if it is parallel to a lattice direction and passes through at least one point
in . A projection of a lattice set in a lattice direction is a function giving the number of its points on
each line parallel to the direction ([HermanKuba, 1999]).
Given a set of lattice directions { , ,⋯ , } and projections along those directions: , , ⋯ , ,
we consider Consistency, uniqueness and reconstruction problems in Discrete Tomography.
Consistency: Does there exist a discrete set ∈ with given projections , , ⋯ , in lattice directions { , , ⋯ , }?
Uniqueness: Is a discrete set ∈ uniquely determined by the given projections , , ⋯ , ?
Reconstruction: Construct a discrete set ∈ from its projections , , ⋯ , .
1 Partially supported by grants № 18RF-144, and № 18T-1B407 of the Science Committee of the Ministry of Education and Science of
Armenia
International Journal “Information Theories and Applications”, Vol. 25, Number 4, © 2018
332
If we are given dimension count ≥ 2, and ≥ 3 non-parallel projections in the integer lattice ,
then the consistency, reconstruction and uniqueness problems are NP-hard ([GardGrizmPran, 1999]).
Discrete sets of vertices in can be considered also as binary images or binary matrices. In the
simplest case of horizontal and vertical projections the existence and construction problems of discrete
sets by their projections is considered and solved in 1957 in terms of binary matrices ([Ryser 1957],
[Gale, 1957]). But in this case, the number of solutions can be exponentially large ([Lungo, 1994).
A commonly used idea to reduce the set of possible solutions is the use of an a priori
information/property of the set to be recovered, if such property exists. Two commonly used in this
context geometrical properties are convexity and connectivity. The existence problem of a binary matrix
is NP-complete for horizontal or vertical convex, as well as for horizontal or vertical convex and
connected matrices ([BarcDLungoNivatPinz, 1996]). NP-completeness of the case of 4-connected
matrices, as well as of horizontal and vertical convex matrices is proved in [Woeginger, 2001]. The case
of horizontal and vertical convex and connected matrices is solvable in polynomial time ([DurrChobrak,
1999]; [Kuba 1999]).
Another idea to reduce the size of set of possible solutions is to take further projections along different
lattice directions. Reconstruction problem for the case of horizontal, vertical and diagonal projections is
considered and NP-completeness is proved in [GardGrizmPran, 1999]). For some cases (horizontal,
vertical, diagonal connected and convex matrices) the problem is solvable in polynomial time
([BarcBrunDeLunNivat, 2001]).
The uniqueness and reconstruction problems for the case of diagonal and anti-diagonal projections are
considered in ([SrivansVerma, 2013]).
In this paper, we consider discrete sets in and study the reconstruction problem with respect to two
directions: one horizontal and one diagonal. In Section 2 we derive necessary conditions for existence
of a binary matrix with the given horizontal and diagonal projections. Section 3 introduces a heuristic
algorithm of reconstruction of binary matrices from given horizontal and diagonal projections.
Experimental results are given in Section 4.
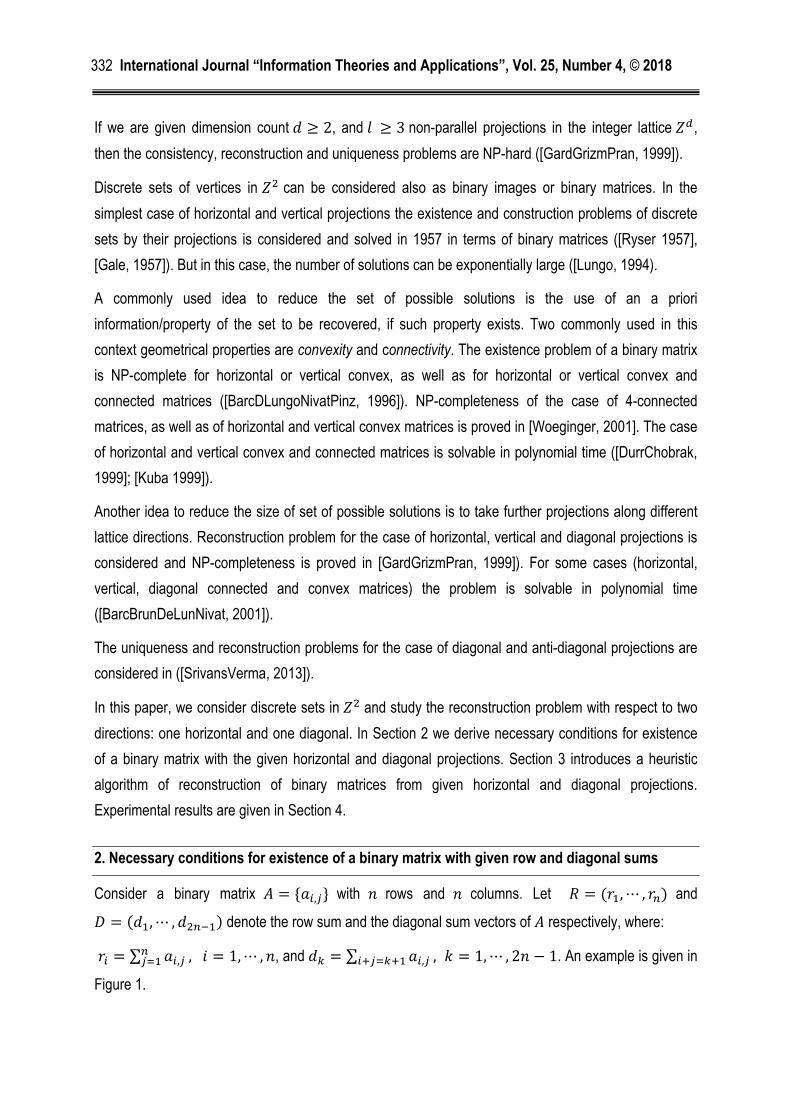
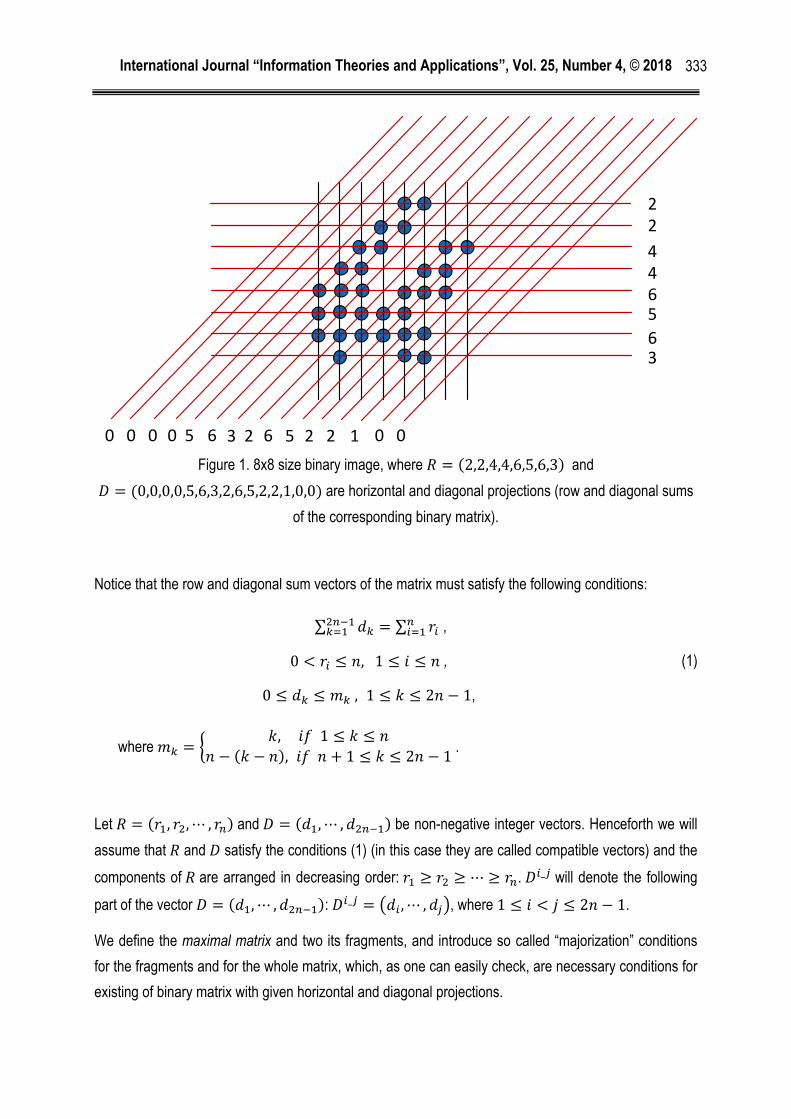
2. Necessary conditions for existence of a binary matrix with given row and diagonal sums
Consider a binary matrix = { , } with rows and columns. Let = ( ,⋯ , ) and = ( ,⋯ , ) denote the row sum and the diagonal sum vectors of respectively, where:
= ∑ , , = 1,⋯ , , and = ∑ , , = 1,⋯ , 2 − 1. An example is given in
Figure 1.
International Journal “Information Theories and Applications”, Vol. 25, Number 4, © 2018
333
Figure 1. 8x8 size binary image, where = (2,2,4,4,6,5,6,3) and = (0,0,0,0,5,6,3,2,6,5,2,2,1,0,0) are horizontal and diagonal projections (row and diagonal sums
of the corresponding binary matrix).
Notice that the row and diagonal sum vectors of the matrix must satisfy the following conditions: ∑ = ∑ , 0 < ≤ ,1 ≤ ≤ , 0 ≤ ≤ , 1 ≤ ≤ 2 − 1,
(1)
where = , 1 ≤ ≤− ( − ), + 1 ≤ ≤ 2 − 1 .
Let = ( , ,⋯ , ) and = ( ,⋯ , ) be non-negative integer vectors. Henceforth we will
assume that and satisfy the conditions (1) (in this case they are called compatible vectors) and the
components of are arranged in decreasing order: ≥ ≥ ⋯ ≥ . _ will denote the following
part of the vector = ( ,⋯ , ): _ = ,⋯ , , where 1 ≤ < ≤ 2 − 1.
We define the maximal matrix and two its fragments, and introduce so called “majorization” conditions
for the fragments and for the whole matrix, which, as one can easily check, are necessary conditions for
existing of binary matrix with given horizontal and diagonal projections.
5
244
56
63
6 3 6 5 2 2 1
2
2000 0 00

International Journal “Information Theories and Applications”, Vol. 25, Number 4, © 2018
334
Maximal matrix
Let us compose the binary matrix = { , } of size × whose rows have the following structure:
1,1,⋯ ,1 0,0,⋯ ,0, for 1 ≤ ≤ . is called maximal matrix and is unique for given = ( , ,⋯ , ) ([Ryser, 1957]).
Let = ,⋯ , denote the diagonal sum vector of . 1 - Fragment 1.
For every , 1 ≤ ≤ let 1 denote the left part of bounded by the -th diagonal line as shown in
Figure 2. 1 has rows and columns. = ( , ,⋯ , ) denotes the column sum vector
of 1 , where = ∑ ,( ) , 1 ≤ ≤ .
Figure 2. An example of Fragment 1 .
M1 - Majorization condition for the fragment 1.
For a given , 1 ≤ ≤ we say that the column sum of the fragment 1 of the maximal matrix majorizes _ (and use the following notation: ≽ _ ) if for each 1 ≤ ≤ the following
conditions hold:

International Journal “Information Theories and Applications”, Vol. 25, Number 4, © 2018
335
≤ , + ≤ + , … + +⋯+ ≤ + +⋯+ .
2 - Fragment 2.
For every , ≤ ≤ 2 − 1 let 2 denote the left part of , bounded by the -th anti-diagonal line as
shown in the Figure 3, where components of anti-diagonal sum vector are defined as:
= ∑ , , 1 ≤ ≤ ∑ , , + 1 ≤ ≤ 2 − 1 .
Figure 3. An example of Fragment 2 2 has (2 − ) rows and (2 − ) columns. = ( , ,⋯ , ) denotes the column
sum vector of 2 where = ∑ , , 1 ≤ ≤ 2 − .
International Journal “Information Theories and Applications”, Vol. 25, Number 4, © 2018
336
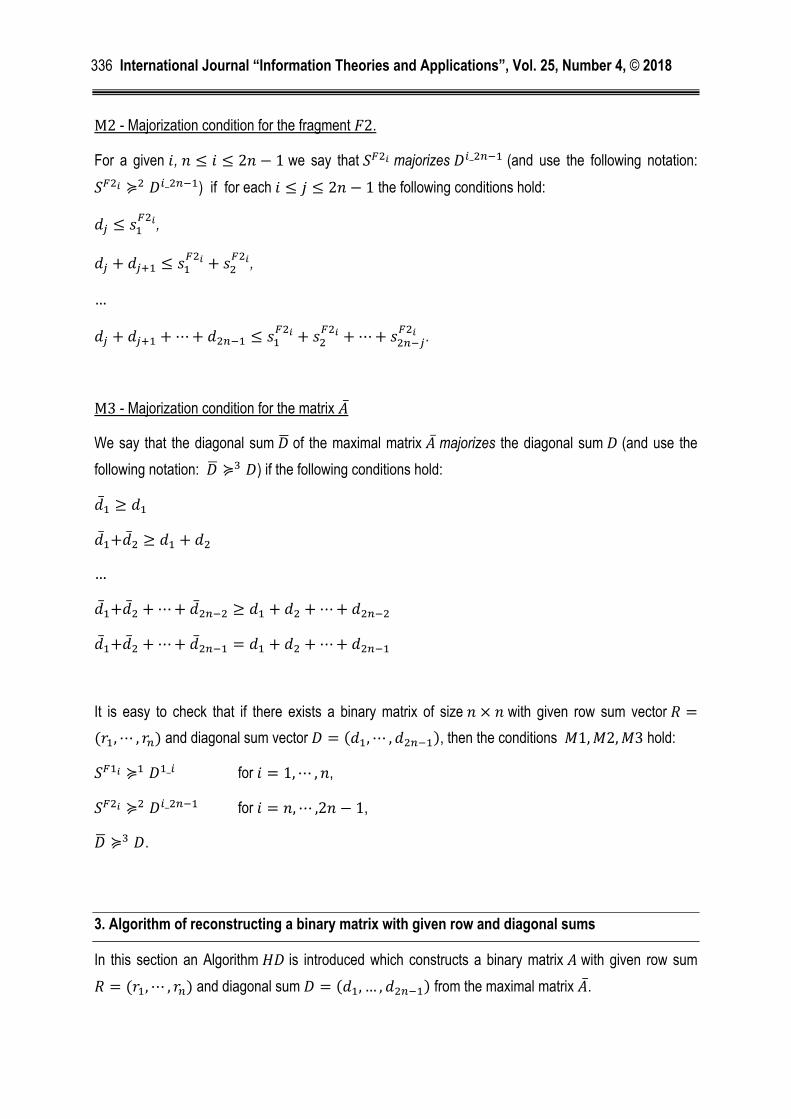
M2 - Majorization condition for the fragment 2.
For a given , ≤ ≤ 2 − 1 we say that majorizes _ (and use the following notation: ≽ _ ) if for each ≤ ≤ 2 − 1 the following conditions hold: ≤ , + ≤ + , … + +⋯+ ≤ + +⋯+ .
M3 - Majorization condition for the matrix We say that the diagonal sum of the maximal matrix majorizes the diagonal sum (and use the
following notation: ≽ ) if the following conditions hold: ≥ + ≥ + … + + ⋯+ ≥ + +⋯+ + + ⋯+ = + +⋯+
It is easy to check that if there exists a binary matrix of size × with given row sum vector =( ,⋯ , ) and diagonal sum vector = ( ,⋯ , ), then the conditions 1, 2, 3 hold: ≽ _ for = 1,⋯ , , ≽ _ for = ,⋯ ,2 − 1, ≽ .
3. Algorithm of reconstructing a binary matrix with given row and diagonal sums
In this section an Algorithm is introduced which constructs a binary matrix with given row sum = ( ,⋯ , ) and diagonal sum = ( ,… , ) from the maximal matrix .
International Journal “Information Theories and Applications”, Vol. 25, Number 4, © 2018
337
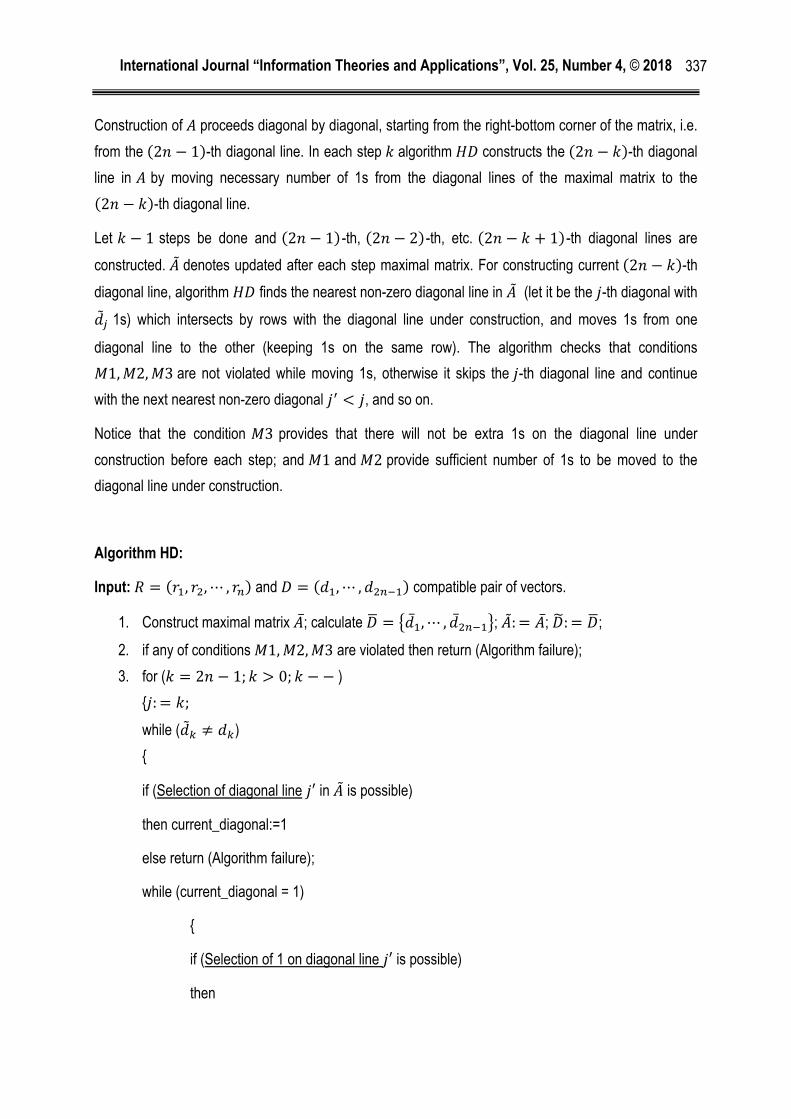
Construction of proceeds diagonal by diagonal, starting from the right-bottom corner of the matrix, i.e.
from the (2 − 1)-th diagonal line. In each step algorithm constructs the (2 − )-th diagonal
line in by moving necessary number of 1s from the diagonal lines of the maximal matrix to the (2 − )-th diagonal line.
Let − 1 steps be done and (2 − 1)-th, (2 − 2)-th, etc. (2 − + 1)-th diagonal lines are
constructed. denotes updated after each step maximal matrix. For constructing current (2 − )-th
diagonal line, algorithm finds the nearest non-zero diagonal line in (let it be the -th diagonal with
1s) which intersects by rows with the diagonal line under construction, and moves 1s from one
diagonal line to the other (keeping 1s on the same row). The algorithm checks that conditions 1, 2, 3 are not violated while moving 1s, otherwise it skips the -th diagonal line and continue
with the next nearest non-zero diagonal < , and so on.
Notice that the condition 3 provides that there will not be extra 1s on the diagonal line under
construction before each step; and 1 and 2 provide sufficient number of 1s to be moved to the
diagonal line under construction.
Algorithm HD:
Input: = ( , ,⋯ , ) and = ( ,⋯ , ) compatible pair of vectors.
1. Construct maximal matrix ; calculate = ,⋯ , ; : = ; : = ;
2. if any of conditions 1, 2, 3 are violated then return (Algorithm failure);
3. for ( = 2 − 1; > 0; − −) { : = ; while ( ≠ )
{
if (Selection of diagonal line ′ in is possible)
then current_diagonal:=1
else return (Algorithm failure);
while (current_diagonal = 1)
{
if (Selection of 1 on diagonal line ′ is possible)
then
International Journal “Information Theories and Applications”, Vol. 25, Number 4, © 2018
338
{
if ( 3 is violated after replacing selected 1 with 0) return (Algorithm failure);
if ( > )
if ( ′ > )
if ( 2 holds after replacing selected 1 with 0)
then { move the selected 1; update ;}
else {current_diagonal:=0; : = − 1;} else
if ( 2& 1 hold after replacing selected 1 with 0)
then { move the selected 1; update ;}
else {current_diagonal:=0; : = − 1;} else
if ( 1 holds after replacing selected 1 with 0)
then { move the selected 1; update ;}
else {current_diagonal:=0; : = − 1;} }
else {current_diagonal:=0; : = − 1;} }
}
}
Output: matrix .
Selection of diagonal line ′ in is possible: if it can be found diagonal line ′, 1 ≤ < in
(nearest possible to the current -th diagonal line is chosen) which has 1s in those rows intersecting
withthe -th diagonal line.
Selection of 1 on diagonal line ′ is possible: if it can be found 1 on the diagonal line ′ (smallest
index of row is chosen), which is possible to move to the -th diagonal line.

International Journal “Information Theories and Applications”, Vol. 25, Number 4, © 2018
339
Note. 1, 2, 3 conditions have been checking in each step for relevant parts of fragments.
Consider performance of the algorithm on an example: let = 6 , = (5,5,4,3,2,2) and =(0,2,2,3,3,5,4,1,0,1,0). First the maximal matrix is constructed:
=1 1 1 1 1 01 1 1 1 1 01 1 1 1 0 01 1 1 0 0 01 1 0 0 0 01 1 0 0 0 0
= (1,2,3,4,5,5,1,0,0,0,0) is the diagonal sum of . = 0, and hence there is nothing to reconstruct on the 11-th diagonal line. For constructing the next
10-th diagonal with = 1 the nearest non-zero diagonal line is the 7-th diagonal line with = 1
and the algorithm will move the corresponding 1. Below is matrix after that step. 1 1 1 1 1 01 1 1 1 1 01 1 1 1 0 01 1 1 0 0 01 1 0 0 0 01 0 0 0 1 0
The next non-zero diagonal line to be constructed is the 8-th with = 1; and first non-zero diagonal
line from which 1-s will be moved is the 6-th with = 5. Next diagonal line for reconstruction will be
the 7-th with = 4 , and first non-zero diagonal in after previous step is = 4. Below are
matrices after those steps. 1 1 1 1 1 01 1 1 1 1 01 1 1 0 0 11 1 1 0 0 01 1 0 0 0 01 0 0 0 1 0
1 1 1 1 1 01 1 1 1 0 11 1 1 0 0 11 1 0 1 0 01 0 1 0 0 00 1 0 0 1 0
We will skip detailed descriptions of all steps and below is the final reconstructed matrix by Algorithm
HD.
=0 1 1 1 1 11 0 1 1 1 11 0 1 1 0 11 0 1 1 0 00 1 1 0 0 00 1 0 0 1 0

International Journal “Information Theories and Applications”, Vol. 25, Number 4, © 2018
340
4. Experimental results
In this section experimental results for the provided algorithm are presented.
Software system is created which implements Algorithm , and different experiments to check its
performance are conducted for the following cases:
1. Input is a pair of random vectors;
In this case random vectors are generated, and then compatibility of the vectors, as well as necessary
conditions are checked. For keeping randomness there is an option to insert matrix size and rate of
each component of row and diagonal sum vectors comparative to its maximal value.
2. Input is row and diagonal sum vectors of random binary matrices.
For this purpose random matrices are generated and then row and diagonal sums are calculated. To
keep randomness in generating process an option is created to insert matrix size and probability of each
matrix cell (to be 1).
3. Input is row and diagonal sum vectors inserted manually.
The purpose here is to check the algorithm performance for specially created test cases of row and
diagonal sums.
Algorithm performance is checked for up to 50x50 size matrixes, filled by different probabilities
between 0.1 and 0.9.
Experiments for the case 2.
The algorithm is run for more than 1000 samples /random matrices/.
Below in Figure 5 is visualization of an example:
(a) (b) (c)
Figure 5. Stages of algorithm performance (a) generated random matrix, (b) created maximal matrix, (c) reconstructed matrix
International Journal “Information Theories and Applications”, Vol. 25, Number 4, © 2018
341
Algorithm has failed only for two samples: it couldn’t reconstruct existing matrix from its given
projections. Below is an example:
= (17,14,14,14,14,13,13,13,13,12,12,11,11,11,11,10,10,10,10,10) = (1,2,2,3,2,4,4,5,2,7,5,9,9,14,7,15,12,15,11,13,11,9,9,9,8,6,7,6,5,6,7,4,2,3,2,2,2,2,1)
Experiments for the case 1.
Only 30% of generated vectors passed all conditions ( 1, 2, 3). For most of them algorithm failed
because one of the conditions get violated during some step. For small samples it was possible to check
manually and make sure that there is no matrix with given row and diagonal sums.
Conclusion
An algorithm of reconstruction of binary images from their horizontal and diagonal projections is
introduced; experimental results are given to measure the algorithm performances.
Bibliography
[HermanKuba, 1999] G.T. Herman and A. Kuba, editors, Discrete Tomography: Foundations, Algorithms
and Applications, BirkhÄauser, Boston, 1999.
[GardGrizmPran, 1999] Gardner R. J., Gritzmann P., Prangenberg D., On the computational complexity
of reconstructing lattice sets from their X-rays, Discrete Mathematics 202 (1999) 45-71.
[Ryser, 1957] Ryser H.J., Combinatorial properties of matrices of zeros and ones, Canad. J. Math. 9
(1957) 371–377.
[Gale, 1957]Gale D., A theorem on flows in networks, Pacific J. Math., 7 (1957), pp. 1073–1082.
[Lungo, 1994] Del Lungo A., Polyominoes defined by two vectors, Theoretical Computer Science, 127,
187-198 (1994).
[BarcDLungoNivatPinz, 1996] Barcucci E., Del Lungo A., Nivat M., and Pinzani R.: Reconstructing
convex polyominoes from horizontal and vertical projections. Theor. Comput. Sci. 155, 321–347
(1996).
[Woeginger, 2001] Woeginger G.J., The reconstruction of polyominoes from their orthogonal
projections, Inform. Process. Lett., 77, pp. 225-229, 2001.
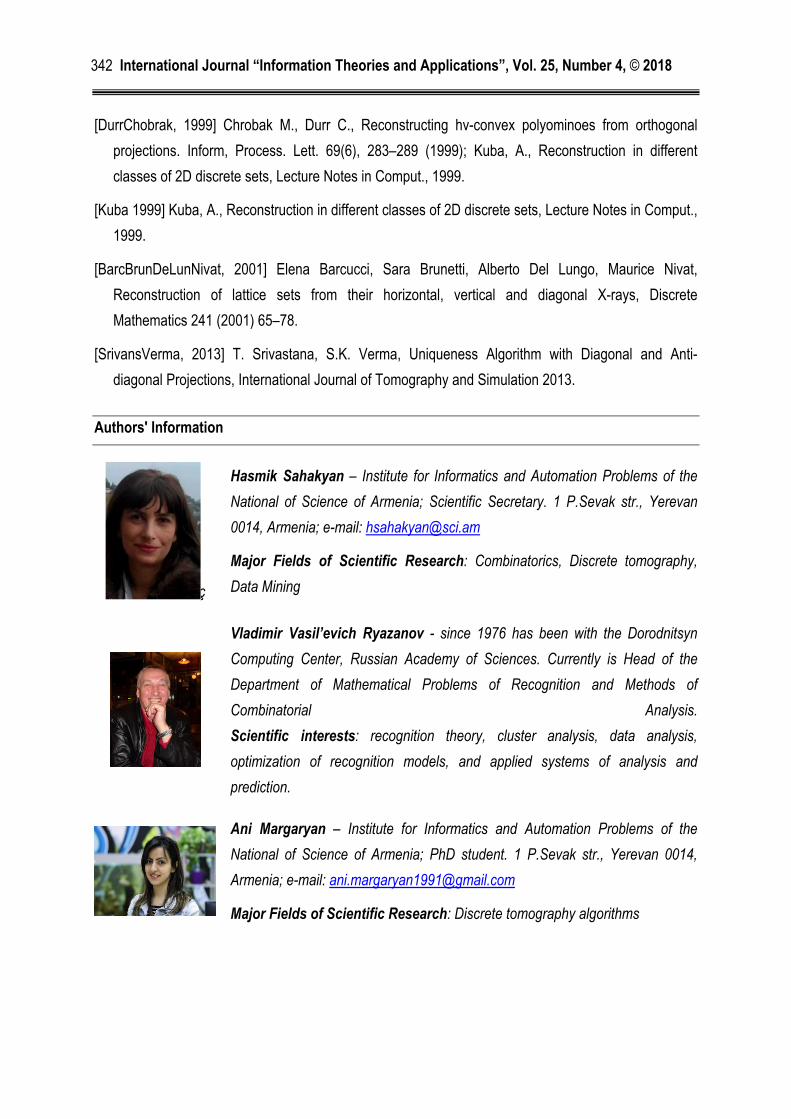
International Journal “Information Theories and Applications”, Vol. 25, Number 4, © 2018
342
[DurrChobrak, 1999] Chrobak M., Durr C., Reconstructing hv-convex polyominoes from orthogonal
projections. Inform, Process. Lett. 69(6), 283–289 (1999); Kuba, A., Reconstruction in different
classes of 2D discrete sets, Lecture Notes in Comput., 1999.
[Kuba 1999] Kuba, A., Reconstruction in different classes of 2D discrete sets, Lecture Notes in Comput.,
1999.
[BarcBrunDeLunNivat, 2001] Elena Barcucci, Sara Brunetti, Alberto Del Lungo, Maurice Nivat,
Reconstruction of lattice sets from their horizontal, vertical and diagonal X-rays, Discrete
Mathematics 241 (2001) 65–78.
[SrivansVerma, 2013] T. Srivastana, S.K. Verma, Uniqueness Algorithm with Diagonal and Anti-
diagonal Projections, International Journal of Tomography and Simulation 2013.
Authors' Information
ç
Hasmik Sahakyan – Institute for Informatics and Automation Problems of the
National of Science of Armenia; Scientific Secretary. 1 P.Sevak str., Yerevan
0014, Armenia; e-mail: [email protected]
Major Fields of Scientific Research: Combinatorics, Discrete tomography,
Data Mining
Vladimir Vasil’evich Ryazanov - since 1976 has been with the Dorodnitsyn
Computing Center, Russian Academy of Sciences. Currently is Head of the
Department of Mathematical Problems of Recognition and Methods of
Combinatorial Analysis.
Scientific interests: recognition theory, cluster analysis, data analysis,
optimization of recognition models, and applied systems of analysis and
prediction.
Ani Margaryan – Institute for Informatics and Automation Problems of the
National of Science of Armenia; PhD student. 1 P.Sevak str., Yerevan 0014,
Armenia; e-mail: [email protected]
Major Fields of Scientific Research: Discrete tomography algorithms
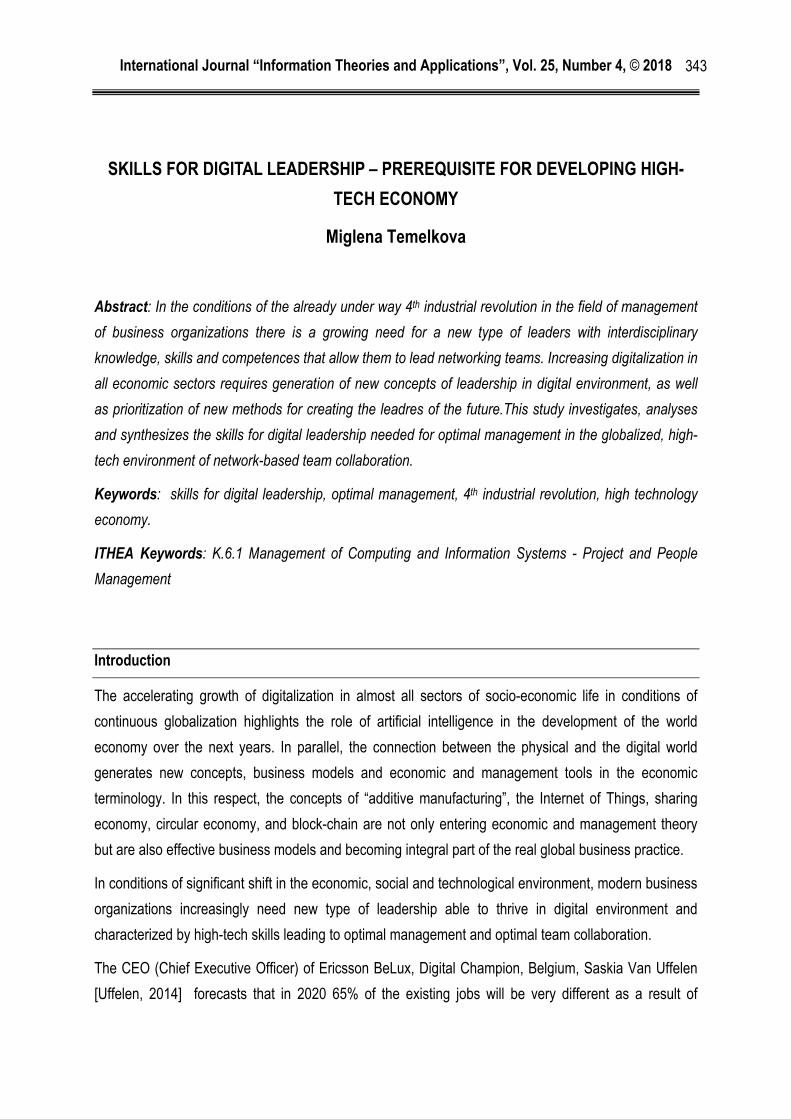
International Journal “Information Theories and Applications”, Vol. 25, Number 4, © 2018
343
SKILLS FOR DIGITAL LEADERSHIP – PREREQUISITE FOR DEVELOPING HIGH-
TECH ECONOMY
Мiglena Temelkova
Abstract: In the conditions of the already under way 4th industrial revolution in the field of management
of business organizations there is a growing need for a new type of leaders with interdisciplinary
knowledge, skills and competences that allow them to lead networking teams. Increasing digitalization in
all economic sectors requires generation of new concepts of leadership in digital environment, as well
as prioritization of new methods for creating the leadres of the future.This study investigates, analyses
and synthesizes the skills for digital leadership needed for optimal management in the globalized, high-
tech environment of network-based team collaboration.
Keywords: skills for digital leadership, optimal management, 4th industrial revolution, high technology
economy.
ITHEA Keywords: K.6.1 Management of Computing and Information Systems - Project and People
Management
Introduction
The accelerating growth of digitalization in almost all sectors of socio-economic life in conditions of
continuous globalization highlights the role of artificial intelligence in the development of the world
economy over the next years. In parallel, the connection between the physical and the digital world
generates new concepts, business models and economic and management tools in the economic
terminology. In this respect, the concepts of “additive manufacturing”, the Internet of Things, sharing
economy, circular economy, and block-chain are not only entering economic and management theory
but are also effective business models and becoming integral part of the real global business practice.
In conditions of significant shift in the economic, social and technological environment, modern business
organizations increasingly need new type of leadership able to thrive in digital environment and
characterized by high-tech skills leading to optimal management and optimal team collaboration.
The CEO (Chief Executive Officer) of Ericsson BeLux, Digital Champion, Belgium, Saskia Van Uffelen
[Uffelen, 2014] forecasts that in 2020 65% of the existing jobs will be very different as a result of
International Journal “Information Theories and Applications”, Vol. 25, Number 4, © 2018
344
technological developments, and individuals should develop their skills and competences in order to
remain competitive in the digital economy. According to Maria Laura Fornaci, Executive Director at
Triple Helix Association, Italy, modern business organizations need new leaders with high-tech skills.
This is confirmed by the European Commissions’ statement regarding the need for a greater number of
IT professionals with competences to sustain innovation and competitiveness in the world market
[Communication from the Commission to the Council, the European Parliament, the European
Economic and Social Committee and the Committee of the Regions, 2007]. Additional calculations
suggest that until 2025 each year the EU will need to develop around 50 000 professionals with
leadership skills for high-tech environments, i.e. between 2018-2025 Europe will need a total of 400 000
such leaders. In a survey for the purposes of the current study amongst 35 Bulgarian business
organizations, 75% of the respondents point to a significant shortage in their employees of leaders
capable of operating in a digital environment, which impedes growth in their business units, and 51%
think that the lack of digital leadership skills in human resources has a negative influence on the
development options of business organizations.
The data confirms the defined need by the European Commission of a new type of leaders operating in
a digital environment. This need results mainly from:
multidisciplinarity, which results from the combination of digital and main basic
technologies;
rapid development of innovations, robotics and sensory techologies;
enhanced competition in the IT sector;
unpredictable global market environment.
The need for a new type of leadership is also confirmed in the McKinsey Global Survey in 2016, which
shows the growing importance of automation and improvements in business processes, and thus of
individuals’ acquisition of new knowledge, skills and competences.
Consequently, it is timely to investigate and synthesize the main competences for digital leadership that
can enable business organizations in the future to achieve optimal management and optimal team
collaboration, which in turn are crucial for the development of high-tech global economy. Wide
digitalization of the material world, as well as the transition from ‘asset ownership’ to ‘access to assets’
condition the transformation of the economic reality from ‘economy of ownership’ to ‘sharing economy’,
and require from individuals new leadership skills and competences. The linear model for resource use
based on the principle of ‘take – produce – throw away’ needs to be effectively restructured into a new,
modern model of circular economy, which creates serious challenges for the development of individuals’
new leadership skills and competences. Linking the search for new type of leaders to the innovative
nature of IT technologies, volume data of the Internet of Things and avant-garde technologies, requires
International Journal “Information Theories and Applications”, Vol. 25, Number 4, © 2018
345
new leadership skills in the circular and sharing economy than those for the development of the
economy of ownership.
This study investigates digital leadership as developed and applied in a digital environment and how it
leads to optimal management and optimal team collaboration. In particular It is focused on the skills for
digital leadership which, in the conditions of the 4th industrial revolution, are essential for the
development of high-tech global macroeconomic system.
The objective of this study is to synthesize those high-tech leadership skills that are a prerequisite for
the development of high-tech economy. Specific tasks of this paper:
to investigate, analyse and synthesize definitions and concepts related to the researched area;
to account for the influence of the 4th industrial revolution on the development of leadership in
digital environments;
to examine and analyse the relation ‘skills for digital leadership – high-tech economic system’.
The limitations of the study are:
the terms ‘digital leadership’ and ‘leadership in digital environments’ are considered equivalent
and overlapping;
studies are lacking on specific measurements of digital leadership;
it is beyond the scope of this study to provide definitions of leadership styles applied in digital
environments.
Investigation of the Link between High-Tech Economy and optimal Management
The high-tech economy is based on the global industrial and technological process that started with the
4th industrial revolution and finds its roots in the development of science, digital technologies and
innovations. The high-tech economic system is interlinked with registered higher added value obtained
with the production of certain goods, which in turn results from:
the development of internet connectivity and interaction of cybernetic-physical systems without
human involvement;
processing and analysing of large data sets;
decision-making by artificial intelligence;
the introduction of robotics in the production processes;
the use of digital clouds, digital modelization and simulation of production processes through
virtual reality;
intelligent automation;
mass production of individualized products;
International Journal “Information Theories and Applications”, Vol. 25, Number 4, © 2018
346
development of new technologies;
creation of new business models.
On the basis of the above, high-tech economy can be defined as the combination of interrelated digital
technological decisions assisting the development of the automation, the integration and the exchange
of data in real time in the production processes, delivering several times higher norm of added value
compared to the traditional economic system. The added value of the high-tech economy derives from
the possibilities of the cybernetic-physical systems to optimize production processes in the entire value
chain by applying the principles of:
resource effectiveness–minimizing expenses for the production of units;
resource productiveness – maximizing production on the basis of available resources.
Typical of high-tech economy is rapid and large-scale development leading to a radical change of
traditional business models and value chains. Key feature of the high-tech economic system is the
striking development of technologies, innovations, robotics and artificial intelligence, giving rise to new
forms of value creation and employment.
The main characteristics of the high-tech economy – monumental development, high level of
digitalization, significant technological and innovation progress, high rate of added value, require the
implementation of optimal management of economic processes. The optimization of the management
process derives from the options for optimization of high-tech production processes
(L= cost per item min; L = number of produced items of one type max).
These criteria for optimization of high-tech economy are directly proportional to the need for:
reducing the time for managerial decision-making;
reducing the time for production;
reducing the use of resources;
reducing the use of energy;
reducing the use of labour;
increasing the volume of production.
On this basis it can be deducted that the optimal management of high-tech economy is linked to:
the possibility for analysis and processing of big data and real-time decision-making using
information and analytical systems with in-built artificial intelligence, which leads to a greater
flexibility in process management, reduction in the time needed for managerial decisions, and
as a result to reduction in the cost of the produced items;
the possibility for dynamic organization of business processes in terms of quality, time, risk,
durability, price, and environmental impact, which leads to reducing the cost of production of
International Journal “Information Theories and Applications”, Vol. 25, Number 4, © 2018
347
each item as a result of reduction in expenses for resources, energy, labour, and time needed
for production;
the possibility for maintaining a permanent balance between materials and logistics chains,
which leads to reducing the costs of resources and production organization, in turn resulting in
reduction of costs of the produced items;
the possibility for fast design and organization of processes, change in production operations
and compensation for losses in technology time, which leads to reduction of production time
and thus of the costs of the produced items;
the possibility for continuous optimization and adaptation of the production capacities with in-
built artificial intelligence, leading to reduction of the expenses for resources, energy, polluting
emissions, and thus of the costs of the production;
the possibility for return on investment of individual and specific orders reflecting customer
requirements in terms of design, configuration, order, planning, production, functioning,
deadlines and changes in deadlines, which is linked to increases of production of specific
individual orders, thus leading to a greater competitiveness and market stability for the business
organization.
The research conducted so far allows for defining optimal management as the systematic integration of
economic, technical and organizational activities which aim to increasing the effectiveness of functioning
of a given economic system with non-technological methods that lead to rationalization of the
management system. On this basis optimal management of the high-tech economy can be defined as a
purposeful activity with the aim of getting the best result in certain conditions.
The necessary steps for achieving optimal management are:
choice and formulation of an objective;
definition of limits – realistic possibilities for achieving the chosen objective;
finding an appropriate means for reaching the goal within the identified limits (model);
The formulated objective (economic effect) in optimal management is linked to achieving the desired
level of perfection of the economic system and is determined as a criterion for optimality (target
function). The target function is a quantitative evaluation of the condition of the optimized object. The
best value of the target function in the economic literature is called extremum or optimum.
The management as an object for optimization has several characteristics, depending on the aspect
studied. They are function of its parameters and are allocated a defined in advance value according to
the optimization targets and results, do not go higher than the defined in advance limit, and do not go
beyond the limits of the defined interval for change. On this basis the limits for the implementation of
optimal management can be mathematical formulae of object characteristics in the form of equations
International Journal “Information Theories and Applications”, Vol. 25, Number 4, © 2018
348
and inequalities. The respect of the requirements pre-defined in the limits guarantees the real existence
of the management process, its proper functioning, and reaching the objectives defined in the
optimization model.
The scope and reach of the ongoing technological transformation will trigger economic, social and
cultural changes and dissonance on a scale difficult to predict. The emerging impact on the global
economy entails both a difficult differentiation of one effect from another and the impact on all
fundamental macro-variables - Gross Domestic Product, inflation, investment, consumption,
employment, unemployment, trade balance. This impact undoubtedly stems from the high level of
technology and innovation of economic processes. The upcoming difficult macroeconomic projections
impose optimal management of the high-tech economy by high-tech leaders to minimize the negative
effects of subordinate technological specifics.
The high technology of an economic system is of a dual nature - it creates real prerequisites for
deflationary processes, but also for stronger consumption sustainability, resulting in greater volume of
consumption at lower prices. Optimal management of the high-tech macroeconomic system requires
that predicted impacts on growth be addressed in the context of current economic trends and factors.
Productivity is one of the main indicators of high-tech economy, as well as a major factor for long-term
growth and high living standards. Optimal management of a high-tech economy requires management
of the functionality and quality of produced goods, their marketing strategy to offer highly competitive
markets through digital platforms, and the strategy to reduce marginal costs. In fact, the transition from
property and asset economy to sharing economy differentiates the integration of structural and systemic
factors, which can create a real prerequisite for increasing economic growth and driving the principles of
the circular economy even more intensively.
Optimal management is also needed in the labour market in conditions of high-tech economic
development, as information-communication systems, robotics and artificial intelligence drastically
change the nature of human labour and the need for it. However, it should not be overlooked that in a
highly technologically advanced economy two effects on employment are possible:
Effect of disappearance of certain occupations leading to unemployment - in it the subversive
factors related to the technological development of the economy replace the human labor with
capital;
A capitalization effect conducive to the creation of new jobs, business organizations and
industries - it is a consequence of the effect of eliminating specific professions and leads to
increased demand for new goods, which creates conditions for revitalizing the labor market.
International Journal “Information Theories and Applications”, Vol. 25, Number 4, © 2018
349
The technologically developed economy is subject to risks associated with the technological boom. At
the same time, technology improves productivity and living standards, which in turn creates conditions
for increased demand for goods and hence encourages job creation. This peculiar contradiction of the
high-tech economic system imposes its optimal management by prepared leaders of the future in order
to prevent global crises and cataclysms resulting from inequality and poverty.
In the context of the Fourth Industrial Revolution, the optimization of the management process in the
high-tech economy is essential due to the dynamics and the wide range of changes that have an
economic, social and public aspect. Equally important is the development of leaders of a new type to
manage both the highly technological and innovative economic environment and the human potential
and capacity.
The shakeup effect of the external to the economic subjects’ environment, characterized by high
technology, innovation, robotics, artificial intelligence, would have a strong undermining effect on any
organization if the global macroeconomic system does not aim for optimal parameters of its governance
process. On the other hand, the strong subversive influences of the high-tech economy lead to specific
technological changes to the general public, and economic subjects cannot remain isolated from these
global processes that are conducive to a highly digitized and hyperlinked economic system. It is this that
requires the optimal management of the high-tech macroeconomic system and the achievement of
multidimensional model-based forecasting management.
Synthesis and Definition of the Factors Driving the High-The Economy
According to a study by the World Economic Forum in Davos in 2015, the factors that propel the Fourth
Industrial Revolution can generally be divided into three main groups: Physical, Digital and Biological
[Schwab, 2016]. Among the factors driving industry 4.0 are also the sensory technologies, robotics,
innovative manufacturing systems, logistics, information and communication technologies, cloud
companies and large data sets [Wischmann, Wangler, Botthof, 2015]. The factors leading to the
success of the new technological revolution can be summarized mainly in three: qualification, process
speed, infrastructure [Beste, 2014]. Other authors [Talin, 2018] assume that the factors determining the
success of Industry 4.0 are five:
Decentralization of decision-making from different physical and virtual systems;
Large datasets allowing their rapid assessment in decision making;
Interoperability, connecting in common communication machines, people, computers and
sensors to exchange information and data among themselves;
Technical support, in support of decision-making or in tasks that put at risk human life;
International Journal “Information Theories and Applications”, Vol. 25, Number 4, © 2018
350
Information transparency, assisted by data, sensors and virtual reality, allowing us to easily
perceive our surrounding reality.
Factors influencing the development of high technology [Lefenda, Pöchhacker - Tröscher, Wagner,
2016] are:
Integration of the physical and digital world in the context of the productive economy;
The destructive potential of technologies;
The evolution of the progressive digitization of production.
The exponential rate at which the Fourth Industrial Revolution is evolving leads to rapid upgrading of the
achievements of the digital revolution, to the combination of many innovative and intelligent
technologies, to new technological breakthroughs. This leads to both unprecedented changes in the
paradigm in the economy, business and society, and a profound and long-term transformation of the
whole economic model and the related tools.In this regard, the hi-tech economy of the future will be
based essentially on two fundamental concepts that guarantee both its development and the
conservation of resources for future new consumption. These concepts mark the transition from one
type of economic system (asset-ownership economy) to another innovative type of economic relations
(based on the relationship between the main contractors through technology platforms) and from one
type of economic model (linear) to a qualitatively new (circular). The philosophy of these concepts
generates the system of added value, largely characteristic of high-tech economic systems:
Concept of sharing economy:
- an economic system where people, assets and data are gathered in the virtual space,
characterized by an entirely new way of consumption, resulting in a drastic reduction in
transaction and friction costs based on lowering barriers to the production of material goods;
- a result of the widespread penetration of the digital into the material sphere;
- an innovative economic model, a reflection of the transition from "ownership of assets" to
"access to assets"
Concept of circular economy:
- a circular model based on the "design - production / processing - distribution - use / sharing /
loan / reuse / repair - waste collection - recycling" principle, effectively restructuring the linear
resource consumption model based on the take - produce - throw away;
- a new, modern model in which innovative value is created and shared on the basis of optimal
interaction between materials, energy, labor and information [Temelkova, 2017];
- a new business model ensuring sustainable development by preserving the planet's resources
while maintaining economic and technological progress;
- a system based on the concept of "sharing economy";
International Journal “Information Theories and Applications”, Vol. 25, Number 4, © 2018
351
- a strategy in which growth and prosperity do not have a negative impact on natural resources
and do not lead to a decline in ecosystems.
The study of the factors underlying the Fourth Industrial Revolution indicates that there is still no single
opinion in the literature on the number, specificity and concrete effects of these factors. Moreover, the
diversity of the research and the scientific investigations of various authors highlights a wide range of
factors that need to be systematized. At the same time, this multi-dimensionality of the defined factors
testifies to the extremely broad scope of the technological transformation of the global economic
system. Some authors [Schwab, 2016] argue that much of the industry-driven 4.0 premise will change,
and others are still not yet known. Due to the connectivity of the processes determined by the Fourth
Industrial Revolution and the concrete practical manifestations of the hi-tech economy of the future, the
prerequisites that are its basis are not sufficiently studied in theoretical literature. Summaries of the
factors that are a prerequisite for building a high-tech economy are scarce in the scientific doctrine. This
makes the task of the present study extremely complex and associated with numerous investigations of
various theoretical and practical applications. Thus, based on the method of analysis and synthesis, the
following global factors driving the high-tech economy can be defined by their basic characteristics:
Ecosystem "man - machine":
- hybrid type ecosystem created to perform certain tasks on certain conditions in which most
frequently interact human factors and robotic systems based on artificial intelligence and
sensor technologies;
- result of the automation of business processes and the use of collaboration tools and
productivity in order to reduce communication latency;
AI:
- cyber-physical system having the ability to analyze the environment and take actions that
increase the possibility of achieving certain goals;
- robotic model, supporting the hypothesis that a fundamental human quality such as
intelligence can be accurately described by an algorithm and simulated by a machine;
- technology, based on sensors that use abstract symbols for trying to restore human thinking
at hierarchically logical level or that mimic the human brain through neurons and neural
networks organized in layers connected by simulated lines, these neural networks having the
ability to build knowledge acquired by collecting experience and grow;
Virtual reality:
- branch of physical reality, representing interactive graphics in real time with three-
dimensional models in combination with a display, that gives the user the ability to dip
directly into a modeled world;
- stereoscopic system, relying on computer simulations that use 3D graphics and devices;
International Journal “Information Theories and Applications”, Vol. 25, Number 4, © 2018
352
- illusion in synthetic environment pertaining to immersion in something that is interactive,
multisensory, visually oriented towards three-dimensional computer-generated environment
in combination with technologies needed to build this environment, whilst allowing to
navigate and observe the world with three dimensions in real time;
Augmented reality:
- system integrating elements of real and virtual world, representing an improved version of
reality, in which given objects or environment is enriched with virtual images superimposed
on the real, thereby improving the current perception of reality;
- new improved world located in the middle of a mixed spectrum - between real and virtual
world using the existing natural environment around us, covering it with a layer of virtual
information by which to our natural world are added graphics, sounds and feedback;
- virtual information used as a tool that helps us in our daily activities;
3D printing:
- additive manufacturing, creating a real good, by digital printing of a material in an amorphous
form layer by layer, based on the digitized 3D model, which easily allows customization of
the printed product - i.e. there is an opportunity to meet specific customer requirements;
- group of technologies allowing rapid prototyping and rapid manufacturing of goods;
4D production:
- process of creating a new generation of goods that have the ability to change over time and
following changes in the environment;
- technology, whereby a two-dimensional printed article may be transformed into three-
dimensional, and a 3D shape can be transformed another, whereby different particles of the
projected geometry have different material properties;
Big Data:
- large and complex datasets that are difficult to process atanalytical level, search, share,
store, transfer, display, privacy with traditional applications;
- concept characterized by three dimensions - volume growth, increase the speed of data
exchange, a wide variety of information;
- large data, the size of which exceeds the capabilities of typical database for storage,
management and analysis of information [Manyika, Chui, Brown, Bughin, Dobbs, Roxburgh,
Byers, 2011];
- technologies allowing a large volume of diverse information that is updated frequently and is
located in a variety of sources, the goal being to create new products and enhance the
efficiency and competitiveness;
International Journal “Information Theories and Applications”, Vol. 25, Number 4, © 2018
353
Internet of things:
- system based on interrelated technologies and platforms through interconnection and
interaction between products, services, places, buildings and people;
- a network of physical devices, vehicles, buildings and other elements that have embedded
electronics, software, sensors, mechanisms, and are connected to the Internet network, and
all this allows these objects to collect and share data with each other;
- connection between the physical and digital world in which smart devices and technologies
are interconnected and are managed from a distance on the basis of interaction with the
global network.
Block-chain networks:
- particular block chains that combine powerful cryptographic algorithms with systemic
decentralized computing power, constituting means for the transfer of content (information);
- a network of computers that together track, analyze and design the development of
processes, that build the system architecture during their work through their ability to analyze
the environment and take actions that increase the possibility of achieving certain goals;
- technology based on the principles: mutuality, programmability, cryptographic protection and
reliability;
- knowledge with accurate recording of time and space, giving information about the values,
assets, premises and hazards of the environment (internal and external);
- technologically organized cyber opportunity to register, monitor and optimize assets and
operations in fine details, to use effectively underused assets, to reduce costs in certain
activities, processes and operations (transactional, frictional and limited), increase their
competitiveness, to optimize time to perform an activity, a process, an operation, to increase
the speed and scale the change for business and economics, to generate significant value,
to apply collaborative innovation.
These factors have a driving effect on high-tech economy, but at the same time impose a need for a
new generation of leaders holding high-tech knowledge, digital skills and competences that enable them
to tackle global economic challenges, transforming the actual production in additive and linear traditional
economy based on ownership of assets as well as in a circular economy based on the sharing of
assets.
Importance of Digital Leadership Skills for the Economy
The speed and dynamics with which technological changes occur in the global economy require more
tangible synthesis of qualitatively new concepts of leadership in the digital environment. This is
particularly relevant as high-tech economy needs individuals capable of generating new business
International Journal “Information Theories and Applications”, Vol. 25, Number 4, © 2018
354
models and tools with which they use and optimally manage the available opportunities and resources
to create value based on new economic concepts. In fact, to date were considered key skills and
competencies those associated with the introduction and use of digital technologies in the development
of robotic cyber-physical systems and networks, as well as with generating software programs and
products. Ignoring the entrepreneurship, management and leadership of a number of educational
institutions, including in Bulgaria, has led to a lack of trained professionals, who in a digital market and
smart specialization can lead to the creation of profitable high-tech economic system, job creation and
social progress through new skills, knowledge, innovation, entrepreneurial spirit and economic thought.
Indeed, the European Council has long pointed to the lack of 400 000 leaders by 2025 with not only
digital, but also managerial and entrepreneurial skills. The conclusion is that there is a crisis in
European economies with regard to finding professionals with interdisciplinary knowledge.
In Bulgaria the crisis is even more tangible because of the strict regulation in training and education at
Bachelor and Master levels referring specialists to specific professional fields. This statutory restriction
hinders the development of multidisciplinarity and creation of hybrid specializations. Thus Bulgarian
professionals are unprepared for the labor market, which requires and looks for individuals with
knowledge and expertise in various fields of science and applied fields.
The need for professionals with skills in digital leadership emerges in all hierarchical levels of business
organizations and the economy. The success of a business strategy and economic transformation
depends on the key role not only of the strategic management but also middle management. Thus
people with vision and potential for innovation, creative thinking and a strong ambition, with motivated
behavior and knowing how to optimally manage not only physical but also human resources, are
especially valuable in the development of high-tech economic system. A survey for the purposes of this
study shows that 85% of 110 surveyed businesses in Bulgaria, Greece and Turkey do not have
programs to develop skills for leadership in the digital environment for their employees.
The level of technological advancement of the economy of a country is a direct result of the strong
technological advancement of the businesses operating in it. The degree of technological and
innovative development of economic operators, however, is in direct relation with the knowledge, skills,
abilities, competencies, preparedness, experience and potential of their managers at strategic and
operational level. Therefore, to achieve a high level of technological advancement of an economic
system it is essential to have those leadership skills that propel organizations to achieve optimum long-
term success.
The multidisciplinary nature of spectacularly developing fields of micro and nanoelectronics,
nanotechnology, biotechnology, photonics, robotics, smart materials and smart technologies, the
intense competition for industrial goods and the hardly predictable market environment, require that
International Journal “Information Theories and Applications”, Vol. 25, Number 4, © 2018
355
labor resources have not only expertise in digital technologies, but and skills to work in a dynamic,
difficult to predict environment, while motivating effective teams working from different geographical
locations in a network. This trend, and existing educational models, create clear discrepancy and skills
shortages of digital leadership.
If until recently we were saying that the world needed leaders who operate in a global market
environment, today it can be argued very strongly that the emerging high tech global economic
environment as a result of the Fourth industrial revolution leads to a need for leaders able to operate in
a global digital environment. This leadership is a direct consequence of receding economic ownership of
assets and the development of the economy of sharing, based on a giant digital platforms that are the
result of increasingly strong:
implementation of cloud technology, artificial intelligence and robotics;
imposition of systems such as the Internet of Things, virtual and augmented reality;
generating large datasets and different additive industries.
In the coming years, economic activity gradually but increasingly clearly will shift to cyberspace and
thereby will enhance the growing shortage of individuals with the skills and potential of digital
leadership.
In the eve of the fourth industrial revolution there has been a radical change in the paradigm of
leadership, because leadership has increasingly lost its characteristic as a group process. In conditions
of IT globalization, it becomes a process defining the mission, vision, values, goals and activities of the
business organization which plays an essential role in the functioning of the high-tech economy. The
familiar to us traditional leadership takes place from inside outward, but today the conceptual doctrine of
leadership is changing radically due to global challenges and increased competition. The new type of
leadership is digital that evolves in the digital environment, does not require communication face to face
and appears from the outside to the inside environment – i.e. SMART (Specific, Measurable, Agreed,
Realistic, Time limited). It must withstand the shocks of new economic and social realities.
Leadership in the digital environment requires combining the model of competence of the leader with
the systems of the organization to plan, organize and control activities and management of business
processes. It is based not only on effective organization, but also to the security of fundamental factors
that condition the meeting of expectations and needs of customers, employees, investors, partners and
the society, and thus realizing the power of added utility. On this basis, in high-tech economy, effective
leadership in the digital environment is the result of:
team perfection (optimal in terms of cost, productivity and quality of work processes);
International Journal “Information Theories and Applications”, Vol. 25, Number 4, © 2018
356
attitudes of subjects with which the leader partners (satisfaction, commitment to the strategic
goals of the organization, to company culture, etc.).
Effective team collaboration is an essential prerequisite for achieving optimal management in business
organizations. In a high-tech economy, the ability to manage optimally team interaction is fundamental
to the range of skills required of the digital leader. In this sense, the definition of team collaboration in
digital environment is essential not only for the development of science, but the exact fleshing skills for
digital leadership. In this sense, of content with the skills of digital leadership. In this sense, defining
team interactions in a digital environment is of utmost importance not only for the development of
science but also for the accurate fleshing out of the vision of digital skills leadership.
Team interaction is defined as the relationship between the main factors that affect group work,
including the organizational context, the borders and the development of the team [Gladstein, 1984]. At
the same time it represents the relation between the structure of the working team and implementation
[Campion, Medsker, Higgs,1993], playing the role of entrance to the organizational system, where there
is a reciprocal relationship between the performance criteria of the team process and performance
criteria defined at the entrance of the very organizational system [Cohen, 1994].
Тhose definitions of team interaction serve as а foundation for defining it in a digital environment. In this
paper they warrant that team interaction in a digital environment is a process:
involving interpersonal communication and coordination, implemented in the digital environment
affecting directly or indirectly the performance and efficiency of the organizational business
system;
creating a link between the performance indicators of the team and the organization on the one
hand, and the satisfaction indicators of the members of the digital team on the other.
Team interaction is determined cumulatively by the factors external to the team environment
and the internal processes in it and, through the created team product, establishes the
brand and maintains the reputation of the business organization in its macro environment. The
team processes are factors that directly affect both team and organizational excellence, as well
as the added value in terms of the organization's brand image in a market niche, segment or
region.
Achieving effective team interaction in a digital environment is a skill for digital leadership whose
expression is strongly dependent on the structure of the workflow,the interdependence between tasks,
objectives, feedback, motivation, characteristics of the team, the strategic and operational context and
process.
Efficiency criteria defining the effectiveness of team interaction in the external organizational
environment should be productivity, teamwork satisfaction,the assessment of consumers who use
International Journal “Information Theories and Applications”, Vol. 25, Number 4, © 2018
357
groupware products,services, information or managerial solutions. Thus the viability of the team is
determined in the long run.
The importance of the economy of skills for digital human resources leadership has emerged as a key
priority given that overcoming subversive technology trends is only possible if economic processes are
managed by leaders trained to work in a digital environment. Thus inequality and poverty, which would
have appeared as a consequence of the technology boom, would be overcome using a set of measures
balancing technological, social and moral-ethical aspect of the intensive development of technology and
innovation.
Synthesis of Digital Skills for Leadership Needed for Professionals in a Digital Environment
The exponential growth rate at which the Fourth industrial revolution develops leads to rapid building on
the achievements of the digital revolution, to combining of many innovative and intelligent technologies,
to new technological breakthroughs, covering areas such as artificial intelligence, robotics, the Internet
of Things, autonomous vehicles without a driver, 3D and 4D manufacturing, nanotechnology,
biotechnology, photonics, materials science, energy storage, quantum computation. This leads to
unprecedented changes in the paradigm in economics, business and society as well as a profound and
long-term transformation of the whole conceptual doctrine of leadership and its provisioning tools.
Against the backdrop of this radical change, leaders of the future operating in a digital environment
should possess skills that enable long-term development of a high-tech economy. These skills should
include both complex interdisciplinary competences such as teamwork, communication, planning,
forecasting, project management, network and platform architectures, cryptic thinking, programming,
robotics and others, and competence to understand and communicate with multiple cyber-physical
systems in different platforms, environments and networks.
According to the needs of fast-growing small and medium-sized enterprises, leaders of the future need
skills in three areas [www.skills-lead.eu]:
strategic leadership;
business entrepreneurship;
digital technologies.
These three areas form the leadership in the digital environment and enable business organizations to
develop as high-tech economic entities optimally benefiting from the opportunities provided by digital
technologies.
A high-tech economy requires the building of leaders, capable of operating in a digital environment.
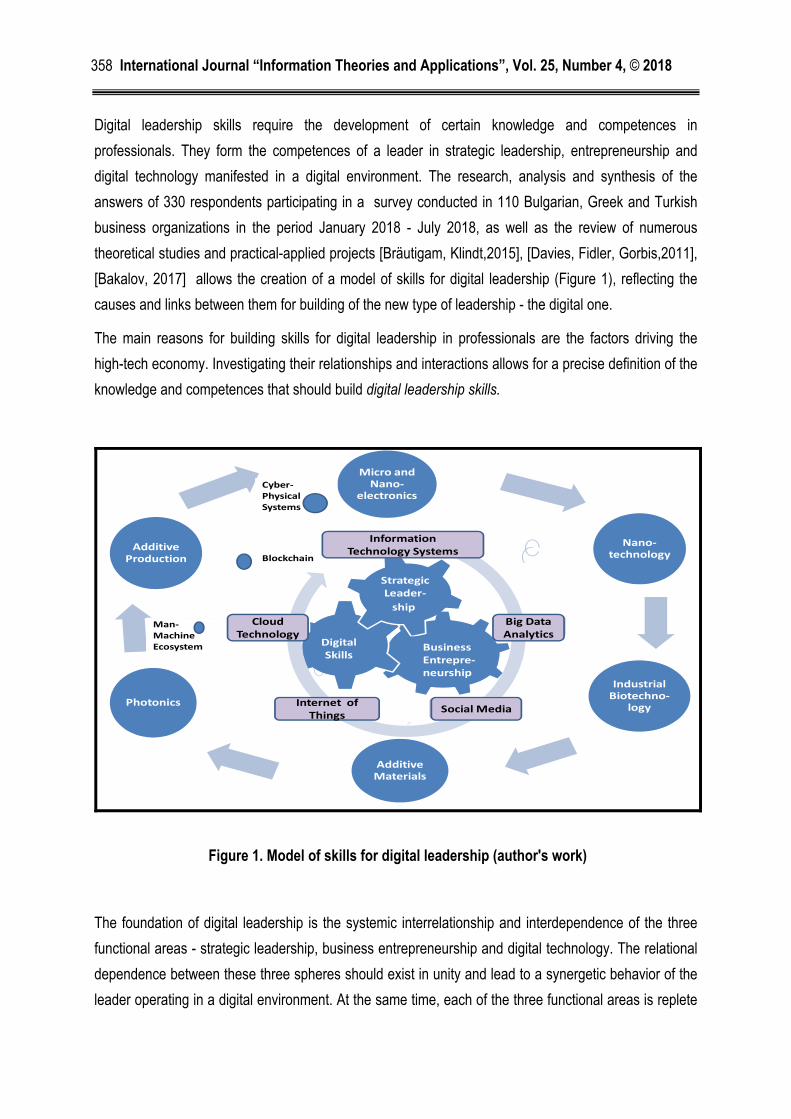
International Journal “Information Theories and Applications”, Vol. 25, Number 4, © 2018
358
Digital leadership skills require the development of certain knowledge and competences in
professionals. They form the competences of а leader in strategic leadership, entrepreneurship and
digital technology manifested in а digital environment. The research, analysis and synthesis of the
answers of 330 respondents participating in a survey conducted in 110 Bulgarian, Greek and Turkish
business organizations in the period January 2018 - July 2018, as well as the review of numerous
theoretical studies and practical-applied projects [Bräutigam, Klindt,2015], [Davies, Fidler, Gorbis,2011],
[Bakalov, 2017] allows the creation of a model of skills for digital leadership (Figure 1), reflecting the
causes and links between them for building of thе new type of leadership - the digital one.
The main reasons for building skills for digital leadership in professionals are the factors driving the
high-tech economy. Investigating their relationships and interactions allows for a precise definition of the
knowledge and competences that should build digital leadership skills.
бизнес пред-приема-чество
цифрови умения
страте-гическо
лидерство
информационно-технологични системи
социални медии
социални медии
интернет на нещата
облачни технологии
кибернетично-физически системи
блокчейн
екосистема “човек –машина”
Micro and Nano-
electronics
Nano-technology
IndustrialBiotechno-
logy
Additive Materials
Photonics
Additive Production
Cyber-Physical Systems
Strategic Leader-
ship
Digital Skills
Business Entrepre-neurship
Internet of Things Social Media
Cloud Technology
Big Data Analytics
Blockchain
Information Technology Systems
Man-Machine Ecosystem
Figure 1. Model of skills for digital leadership (author's work)
The foundation of digital leadership is the systemic interrelationship and interdependence of the three
functional areas - strategic leadership, business entrepreneurship and digital technology. The relational
dependence between these three spheres should exist in unity and lead to a synergetic behavior of the
leader operating in a digital environment. At the same time, each of the three functional areas is replete
International Journal “Information Theories and Applications”, Vol. 25, Number 4, © 2018
359
with certain basic knowledge and skills that determine the scale and capacity of the digital leadership.
Strategic Leadership Thinking aims at managing interdisciplinary, increasingly international teams, and
focuses on direct impact and influence on employees, customers, suppliers, investors, shareholders,
society. It is directly dependent on the availability of knowledge in the field of:
management;
controlling;
finance;
marketing;
logistics;
organizational structure;
communication.
At the same time, strategic leadership is a consequence of the ability for:
collecting information;
analyzing information;
planning;
forecasting;
generating strategic alternatives;
searching for and finding optimal solutions
creativity;
verbal and nonverbal communication;
managing teams;
motivation of human resources;
control.
Strategic leadership as a functional area that determines the effectiveness of the digital leader should
also be based on clearly defined cultural, moral and ethical values and models.
Business entrepreneurship is aimed at generating innovative operational and manufacturing business
models through which a higher added value is realized. As a functional area of digital leadership,
"business entrepreneurship" integrates knowledge about:
market and its principles;
marketing strategies;
business analysеs;
innovation;
investment.
International Journal “Information Theories and Applications”, Vol. 25, Number 4, © 2018
360
The competences that accompany the "entrepreneurial spirit" are related to:
building and maintaining customer relationships;
realization of sales;
establishing partnerships;
project management;
process optimization;
analyzing the environment, processes and operations;
financial management;
implementation of flexible methodology.
The "digital" functional area is associated with a vision of synergic, cutting-edge, high-tech results
achieved on the basis of innovation, and scientific development. This requires knowledge in the field of:
large datasets and tools for analyzing them
information technology tools;
complex business systems;
cyber-physical systems;
artificial Intelligence;
information technology architectures;
platform architectures;
Internet of Things;
Cloud technologies.
The skills characterizing the competence of a leader working in a digital environment, in the functional
area "digital technologies" requires abilities for:
analysis of large data sets;
work in a blockchain network
virtualization;
creation and development of mobile applications;
creation and development of web pages;
creation and development of IT architectures and platforms;
ensuring cybersecurity;
work with social media.
Based on a survey conducted in 110 business organizations from Bulgaria, Greece and Turkey, a group
of skills for digital leadership can be synthesized. They are a prerequisite for sustainable management
and conduct of the leaders of the future. Generally speaking, these skills for leadership in a digital
International Journal “Information Theories and Applications”, Vol. 25, Number 4, © 2018
361
environment are the foundation on which the leadership potential of professionals in the high-tech
economic system develops:
an ability to work with digital technologies - the basis of high-tech economy are information
and communication technologies, digital tools, programs, platforms, cyber-physical systems
and this requires good knowledge and manipulation;
an ability to communicate effectively - the relationship between different hierarchical levels
and human resources, as well as the optimal management of the business organization,
requires maintaining communication processes that ensure the achievement of organizational
goals;
an ability to build knowledge and competence throughout life - the new economic and social
realities entail continuous updating and upgrading of knowledge and competences in a
multidisciplinary perspective.
an ability to analyze dynamic processes - the intensity with which the external and internal
organizational environment develops requires monitoring of a number of factors that
determine them in order to highlight trends in their development;
an ability to apply a sustainable and non-traditional flexibility and adaptability - the pace of
change requires not only fast analysis but also a timely response to changes in the
environment in order to transform the emerging or already occurring economic, social, socio-
cultural and other changes in competitive advantage.
an ability to implement innovative and creative solutions, methods, technologies, instruments
at moderate risk - the high-tech economy requires high-tech business units in which
innovation-aware and open to innovation entities should work, capable of taking a measured
and balanced risk;
an ability for optimal management of team interaction - the development of a high-tech
economy requires organizing and maintaining an effective process between people located at
different spatial points but working in a network to find resources and information, manage and
transfer interdependent activities to achieve an immediate result.
A summary of synthesized skills for digital leadership leads to to defining the essence of the term "digital
leader" - namely a person operating in a digital environment, possessing unique and distinctive abilities,
skills and competencies, enabling them on the basis of their knowledge in the field of digital
technologies to transform the specialized knowledge, to bring together the scarce organizational
production, financial, tangible and intangible resources, and generate an effective and competitive
strategy and team interaction, leading to higher added value for organizations and their employees,
partners, society and the entire economic system.
International Journal “Information Theories and Applications”, Vol. 25, Number 4, © 2018
362
The essential advantages of digital leadership skills should be sought in achieving optimal management
that, according to research and analysis, is associated with cumulative fulfillment of three targeted
functions:
minimizing the cost of producing one unit of good
maximizing productivity;
efficiency of team interaction.
Conclusion
Nowadays skills for digital leadership are an important prerequisite for achieving high technology in the
economy, because technological development in the future will increasingly be based on the
development of the knowledge of leaders in the field of digital technology. Research shows that at least
in the next five years, the focus will be primarily on the skills of a digital leader for analyzing large data
sets, aligning business aspects with IT trends, handling digital products, systems and networks.
Combining these capabilities with the requirements of the entrepreneurial concept leads to building a
new type of a leader who monitors the development of the digital environment and the digital sector and
skilfully generates innovations. Thus, the leader needs to have commercial, investment and financial
skills, project management skills, skills for market penetration, skills for undertaking effective marketing
moves and countermoves.
Skills for digital leadership led to the construction of:
effective business organization representing a network-based organizational structure;
high-tech economy based on knowledge, scientific achievements and development.
The leader in a digital environment should be established as an interdisciplinary hybrid, in charge of
multistage international teams and implementing effective digital and information technology strategies
and effective leadership skills should be a prerequisite for:
acceleration of economic growth;
increasing the innovativeness of the economy;
increasing the competitiveness of the economic system;
increasing the financial and trade turnover;
optimizing global production processes.
International Journal “Information Theories and Applications”, Vol. 25, Number 4, © 2018
363
Bibliography
[Bakalov, 2017] Bakalov, Nikola. Schlüsselqualifikationen der Lehrkräfte und Arbeitsressourcen in der
Realität der Vierten Industrierevolution. Journal L`Association 1901 SEPIKE. 2017.
[Beste, 2014] Beste, Dieter. Erfolgsfaktoren für die Industrie 4.0. Springer Professional. 2014.
[Bräutigam, Klindt,2015] Bräutigam, Peter, Klindt, Thomas. Digitalisierte Wirtschaft /Industrie 4.0.
Bundesverband der Deutschen Industrie. 2015.
[Campion, Medsker, Higgs,1993] Campion, Michael, Medsker, Gina, Higgs, Catherine. Relations
between work group characteristics and effectiveness: Implications for designing effective work
groups. Personal Psychology, 46, 1993.
[Cohen, 1994] Cohen, Susan. Designing effective self-managing work teams. JAI Press. London, 1994.
[Communication from the Commission to the Council, the European Parliament, the European
Economic and Social Committee and the Committee of the Regions] Communication from the
Commission to the Council, the European Parliament, the European Economic and Social
Committee and the Committee of the Regions. E-skills in the 21st century: promoting
competitiveness, growth and jobs.
[Davies, Fidler, Gorbis,2011] Davies, Anna, Fidler, Devin, Gorbis, Marina. Future Work Skills 2020.
Institute for the Future for University of Phoenix Research Institute. 2011.
[Gladstein, 1984] Gladstein, Deborah. Groups in context: A model of task group effectiveness.
Administrative Science Quarterly, 29(4), 1984.
[Lefenda, Pöchhacker - Tröscher, Wagner,2016] Lefenda, Johann, Pöchhacker - Tröscher, Gerlinde,
Wagner, Karina. Einfluss- und Erfolgsfaktoren von Industrie 4.0 für den Standort Niederösterreich.
Industriellenvereinigung NÖ, Wirtschaftskammer NÖ, Land NÖ. 2016.
[Manyika, Chui, Brown, Bughin, Dobbs, Roxburgh, Byers, 2011] Manyika, James, Chui, Michael, Brown,
Brad, Bughin, Jacques, Dobbs, Richard, Roxburgh, Charles, Byers, Angela. Big data: The next
frontier for innovation, competition and productivity. McKinsey Institute. 2011.
[Otsetova, 2017] Otsetova, Anna. Relationship between logistics service quality, customer satisfaction
and loyalty in courier services industry. Management and Education, Vol. II, (2) 2017, pp. 51-57,
ISSN: 13126121.
[Schwab, 2016] Schwab, Klaus. The Fourth Industrial Revolution. Word Economic Forum. Cologny,
Switzerland, 2016.
International Journal “Information Theories and Applications”, Vol. 25, Number 4, © 2018
364
[Spath, Ganschar, Gerlach, Hämmerle, Krause, Schlund, 2013] Spath, Dieter, Ganschar, Oliver,
Gerlach, Stefan, Hämmerle, Moritz, Krause, Tobias, Schlund, Sebastian. Produktionsarbeit der
Zukunft – industrie 4.0. Fraunhofer Verlag. 2013.
[Stoyanov, 2017] Stoyanov, Ivaylo. Management of Human Resources. Avangard Prima. 2017.
[Talin, 2018] Talin, Benjamin. Was ist Industrie 4.0? – Grundlagen erklärt. More than Digital. 2018.
[Temelkova, 2017] Temelkova, Miglena. Development of Controlling in the Organizations from the
Service Sector under the Conditions of the Forth Industrial Revolution. International Journal of
Advanced Research in Management and Social Sciences, Volume 6, Issue 3, 2017.
[Temelkova, 2017] Temelkova, Мiglena. A Model determining Leadership in the Business Organizations
under the Conditions of the Forth Industrial Revolution. Current Scientific Resarch - Collection of
scientific articles. Monreal, Canada, 2017. ISВN 978-617-7214-49-5.
[Temelkova, 2018] Temelkova, Мiglena. Studying the leadership style of business organizations’
management under the conditions of the Fourth Industrial Revolution. Asia Pacific Journal of
Research in Business Management, Volume 9,Issue 2, February-2018 2018. ISSN : 2229-4104.
[Uffelen, 2014] Uffelen, Saskia. Tous Patron!: De la coopération entre quatre générations. Lannoo
Campus. 2014.
[Wischmann, Wangler, Botthof, 2015] Wischmann, Steffen, Wangler, Leo, Botthof, Alfons. Industrie 4.0.
Volks- und betriebswirtschaftliche Faktoren für den Standort Deutschland. Bundesministerium für
Wirtschaft und Energie. 2015.
[www.skills-lead.eu] e-Leadership
Authors' Information
Prof. Dr. Miglena Temelkova – University of Telecommunications and Post; Vice-Rector;
e-mail: [email protected]
Major Fields of Scientific Research: management, leadership, controlling
International Journal “Information Theories and Applications”, Vol. 25, Number 4, © 2018
365
MARKET LEADERSHIP IN BULGARIA TELECOMMUNICATION SECTOR
Anna Otsetova, Georgi Georgiev, Dimitar Kolev, Gergana Dimcheva
Abstract: This research paper is dedicated to market leadership in telecommunication sector in
Bulgaria with a scope on mobile data. A theoretical framework about market leadership and its specifics
in the field of telecommunications have been drown. In order to determine the overall performance of
the organizations involved in this economics sector a methodological framework has been established.
On that basis, analysis has been done and some key conclusions about the role of mobile data in
maintaining market leadership have been drown.
Keywords: telecommunication, services, providers, mobile data, market leadership.
ITHEA Keywords: K.6.1 Management of Computing and Information Systems - Project and People
Management
Introduction
Modern business reality is based on the uncertainty of the organization's environment, and this
necessitates a frequent change of strategy, structure, leadership, change of policies and practices
related to motivation of its employees, brand management, changes in production and product supply
and services. The communication strategy of the organization as well as the communication channels
are redefined by the rapid development of information and communication technologies. This leads to
the vital part of internet and the substitution of the broadband connection by Wi-Fi or mobile data.
In correspondence, the telecommunication operators have offered large amount of data and high speed
mobile internet to satisfy their customers. This vast environment pushes the companies to provide the
next generation of services from 3G to 4 and 5G to retain market share. The current regulations,
especially in the EU, allow customers to switch between providers easily, which makes customer’s
satisfaction a priority to the mobile service providers. It is obvious that mobile data would be the key
factor for keeping market share and leadership role, which makes it a very good field for research and a
main purpose for this paper.
The main goals are:
― To make a theoretical review of market leadership;
― To examine the key factors for market leadership in telecommunications;

International Journal “Information Theories and Applications”, Vol. 25, Number 4, © 2018
366
― To establish methodology for research mobile data providing as a factor for market leadership
in telecommunication sector;
― To conduct the research and analyze obtained data;
― To make some key conclusions.
I. Market Leadership
In contemporary business conditions characterized by extreme volatility, uncertainty, dynamism, and
intense competition the question of market leadership has been a subject of great interest to
organizations and researchers alike. Nowadays, market leadership is perhaps the most critical
challenge in today’s business environment. It is the ability of a company to dominate and shape its
business system. Market leadership has long been recognized as sought-after source of business
power and profitability.
Definitions of market leadership have been an active area of debates and research among economists
and marketing scholars. This section presents some of the frequently cited definitions and other
schemes that are used to identify market leadership.
Market leadership can be defined as the position of a company with the largest market share or highest
profitability margin in a particular market. Market leader dominates the market by influencing the
customer loyalty towards it quality, distribution, pricing, etc.
Market leadership or leading market companies is defined as those with the highest market share in
particular industry. These companies are able to create completive advantages that can be translated
into performance advantages over their competitors. The competitive advantages associated with
market leadership could be explained theoretically as emerging from positive network externalities, first
mover advantages and superior resources and capabilities [Asimakopoulos, Whalley, 2017].
Market leaders have a commanding market share and attract superior customer value for theirs product
or services. Commanding market share is achieved through competitive advantages and by delivering
differentiated benefits to customer [Dariush Rafinejad, 2007].
Market leadership is the process of identifying and creating attractive, profitable market opportunities
and developing the market plan that will lead the company to capture a dominant and profitable share of
the market [Adrian Ryans et al, 2000].
The concept of market leadership is multidimensional. Three dimensions are identified that characterize
market leadership: dominant position in the market; global reach and innovativeness in
products/processes [Malerba et al, 2017].
International Journal “Information Theories and Applications”, Vol. 25, Number 4, © 2018
367
In the majority of industries, there is one firm that is generally recognized to be the market leader. It
typically has the largest market share and, by virtue of its pricing, advertising intensity, distribution
coverage, technological advance and rate of new product introductions, it determines the nature, pace
and bases of competition. It is this dominance that typically provides the benchmark for other companies
in the industry. However, it needs to be emphasized that market leadership, although often associated
with size, is in reality a more complex concept and should instead be seen in terms of an organization’s
ability to determine the nature and bases of competition within the market.
In the conditions of new digital economy consumer behavior has fundamentally changed, almost all
products and services have a crucial digital component and many old business models are threatened.
As executives and marketing professionals seek to develop new ways of being market leader, they must
quickly focus on developing fresh customer insight and establishing digital channel leadership that will
allow them to transform customer experience, open new markets and reduce organizational complexity.
There are three categories of market leaders:
1) Customer insight leaders – companies that optimize data analysis, transform it into something
useful and create measurable value.
2) Digital channel leaders – companies that use new methods of creating value through customer
interactions and new products, services and business models in an always-on digital world.
3) New era leaders – companies that incorporate the best practices of each [Carolyn Heller Baird
and Cristene Gonzalez-Wertz, 2011].
The strategies of market leaders must be comprised of the following objectives: to establish the
company`s desired position; to assess the industry structure, market forces and competitors; to develop
a plan for achieving the desired position. At the same time market leaders must articulate a strategic
direction so all employees are on the same page in helping the company achieve its goals. A good
business strategy must sound convincing and inspire people to help the company move into the future
[Sathit Parniangtong, 2017].
Achieving market leadership requires the companies to practice a repeating cycle of continuous
improvement cycle plan: do, act and check (Figure 1).
In the strategy and planning phase, the results of self-assessment are analyzed. The analysis provides
the organization with insights into the strengths and weaknesses in its organizational capability.
The process management is critical to achieving market leadership. Three elements of process
management can be identified: process design, process management and process improvement.
The self-assessment process identifies and tracks all the important organizational results, and provides
feedback on organizational capability and results to the strategy and planning process.
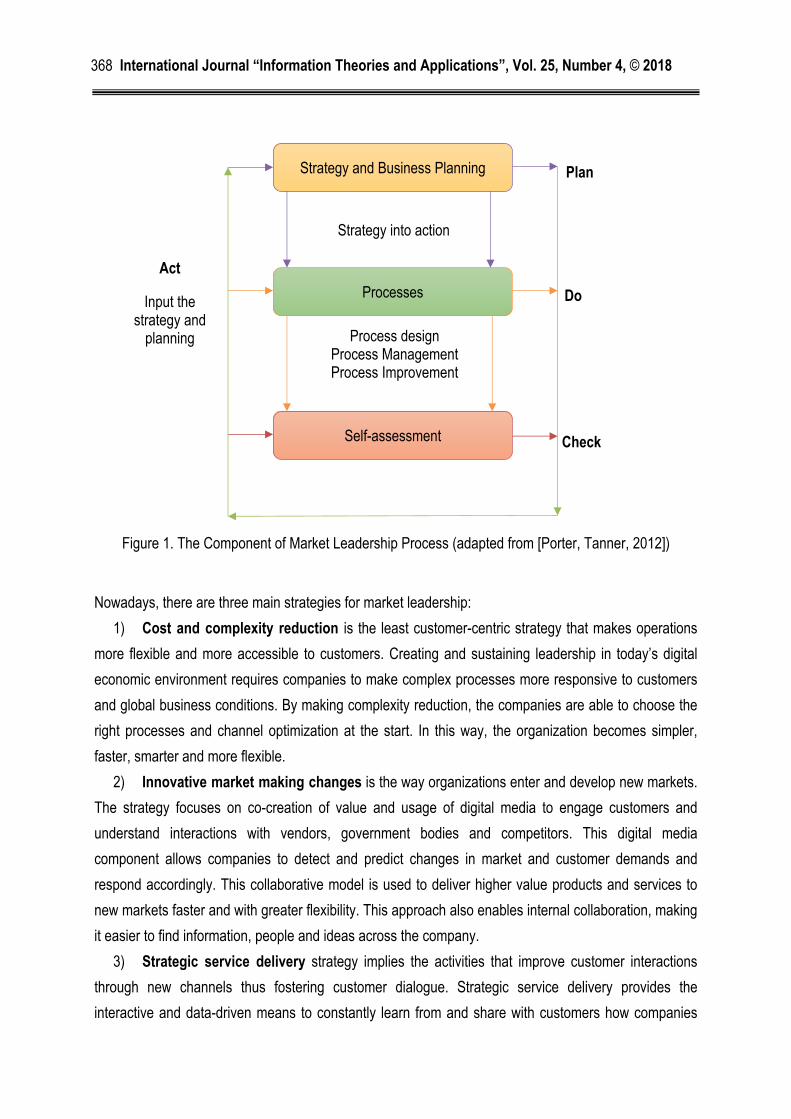
International Journal “Information Theories and Applications”, Vol. 25, Number 4, © 2018
368
Figure 1. The Component of Market Leadership Process (adapted from [Porter, Tanner, 2012])
Nowadays, there are three main strategies for market leadership:
1) Cost and complexity reduction is the least customer-centric strategy that makes operations
more flexible and more accessible to customers. Creating and sustaining leadership in today’s digital
economic environment requires companies to make complex processes more responsive to customers
and global business conditions. By making complexity reduction, the companies are able to choose the
right processes and channel optimization at the start. In this way, the organization becomes simpler,
faster, smarter and more flexible.
2) Innovative market making changes is the way organizations enter and develop new markets.
The strategy focuses on co-creation of value and usage of digital media to engage customers and
understand interactions with vendors, government bodies and competitors. This digital media
component allows companies to detect and predict changes in market and customer demands and
respond accordingly. This collaborative model is used to deliver higher value products and services to
new markets faster and with greater flexibility. This approach also enables internal collaboration, making
it easier to find information, people and ideas across the company.
3) Strategic service delivery strategy implies the activities that improve customer interactions
through new channels thus fostering customer dialogue. Strategic service delivery provides the
interactive and data-driven means to constantly learn from and share with customers how companies
Strategy and Business Planning
Processes
Self-assessment
Strategy into action
Process design Process Management Process Improvement
Plan
Do
Check
Act
Input the strategy and
planning
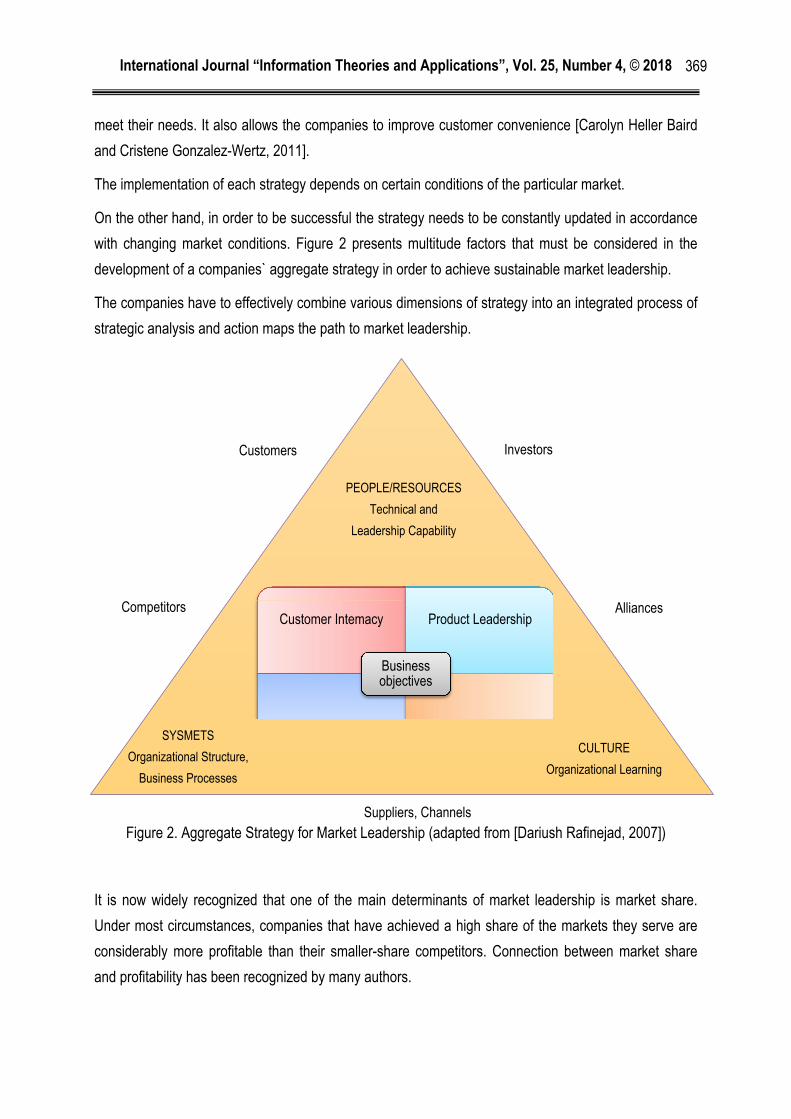
International Journal “Information Theories and Applications”, Vol. 25, Number 4, © 2018
369
meet their needs. It also allows the companies to improve customer convenience [Carolyn Heller Baird
and Cristene Gonzalez-Wertz, 2011].
The implementation of each strategy depends on certain conditions of the particular market.
On the other hand, in order to be successful the strategy needs to be constantly updated in accordance
with changing market conditions. Figure 2 presents multitude factors that must be considered in the
development of a companies` aggregate strategy in order to achieve sustainable market leadership.
The companies have to effectively combine various dimensions of strategy into an integrated process of
strategic analysis and action maps the path to market leadership.
Figure 2. Aggregate Strategy for Market Leadership (adapted from [Dariush Rafinejad, 2007])
It is now widely recognized that one of the main determinants of market leadership is market share.
Under most circumstances, companies that have achieved a high share of the markets they serve are
considerably more profitable than their smaller-share competitors. Connection between market share
and profitability has been recognized by many authors.
Customer Intemacy Product Leadership
Business objectives
PEOPLE/RESOURCES
Technical and
Leadership Capability
SYSMETS
Organizational Structure,
Business Processes
CULTURE
Organizational Learning
Customers
Competitors
Investors
Alliances
Suppliers, Channels
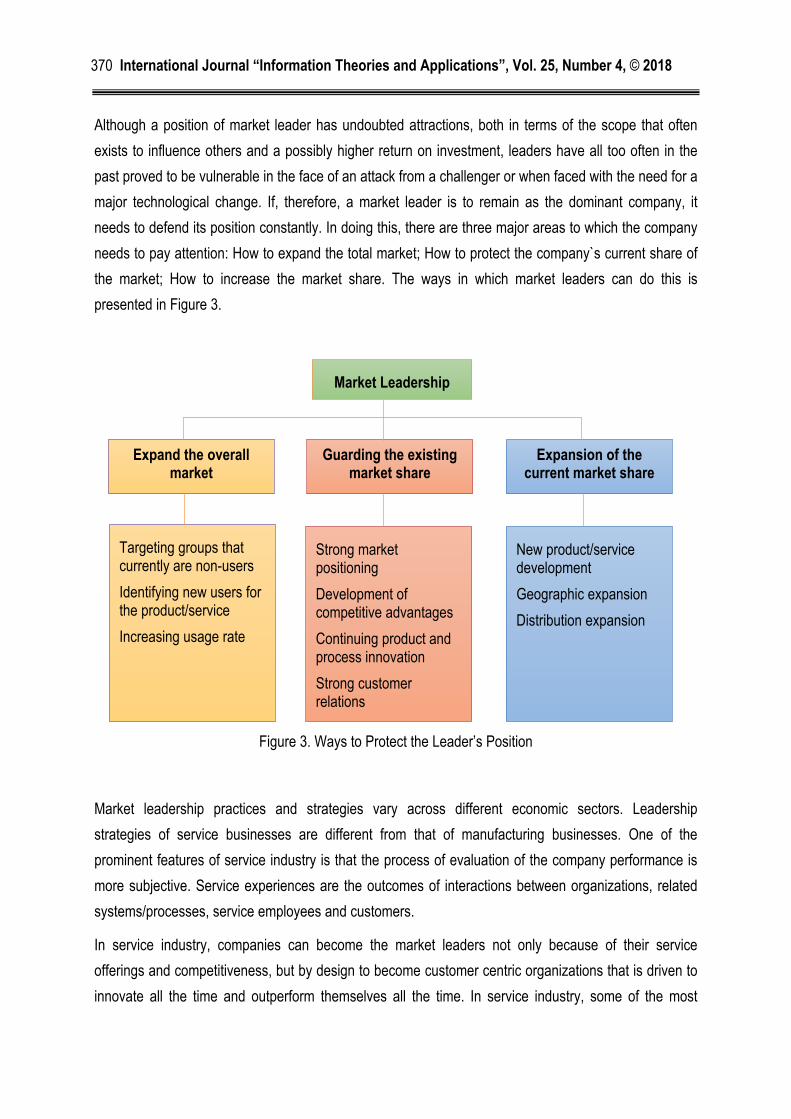
International Journal “Information Theories and Applications”, Vol. 25, Number 4, © 2018
370
Although a position of market leader has undoubted attractions, both in terms of the scope that often
exists to influence others and a possibly higher return on investment, leaders have all too often in the
past proved to be vulnerable in the face of an attack from a challenger or when faced with the need for a
major technological change. If, therefore, a market leader is to remain as the dominant company, it
needs to defend its position constantly. In doing this, there are three major areas to which the company
needs to pay attention: How to expand the total market; How to protect the company`s current share of
the market; How to increase the market share. The ways in which market leaders can do this is
presented in Figure 3.
Figure 3. Ways to Protect the Leader’s Position
Market leadership practices and strategies vary across different economic sectors. Leadership
strategies of service businesses are different from that of manufacturing businesses. One of the
prominent features of service industry is that the process of evaluation of the company performance is
more subjective. Service experiences are the outcomes of interactions between organizations, related
systems/processes, service employees and customers.
In service industry, companies can become the market leaders not only because of their service
offerings and competitiveness, but by design to become customer centric organizations that is driven to
innovate all the time and outperform themselves all the time. In service industry, some of the most
Market Leadership
Expand the overall market
Targeting groups that currently are non-users
Identifying new users for the product/service
Increasing usage rate
Guarding the existing market share
Strong market positioning
Development of competitive advantages
Continuing product and process innovation
Strong customer relations
Expansion of the current market share
New product/service development
Geographic expansion
Distribution expansion
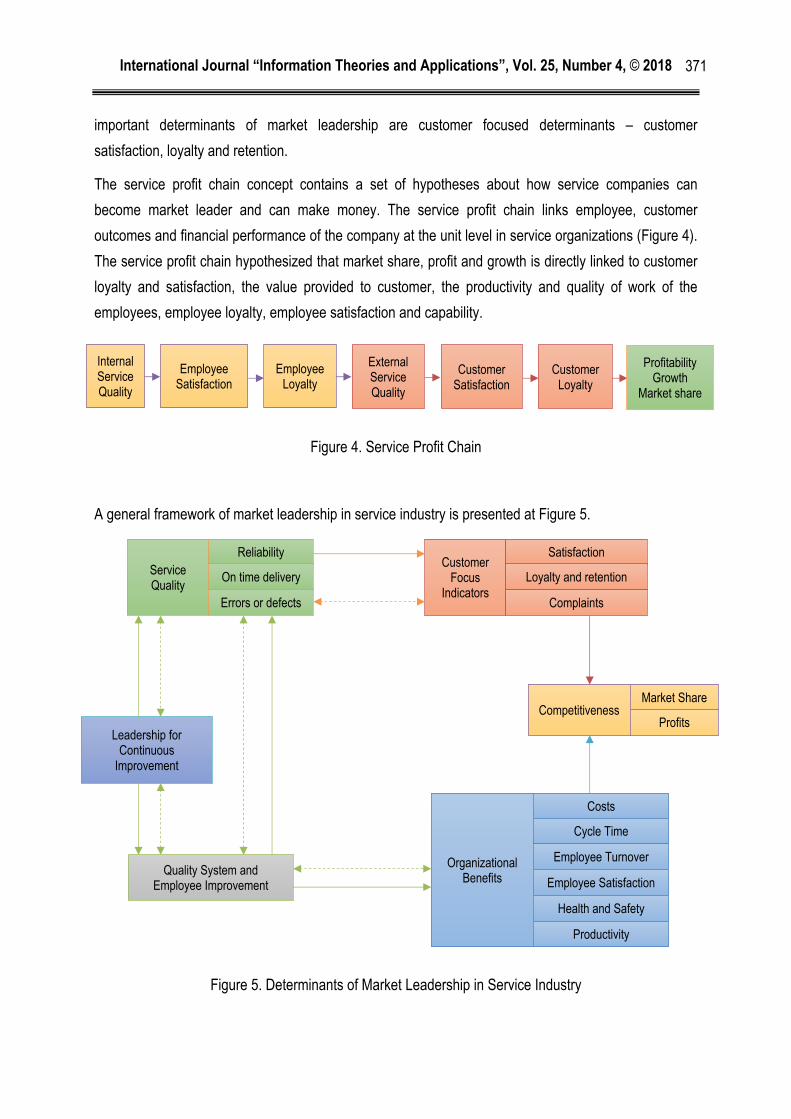
International Journal “Information Theories and Applications”, Vol. 25, Number 4, © 2018
371
important determinants of market leadership are customer focused determinants – customer
satisfaction, loyalty and retention.
The service profit chain concept contains a set of hypotheses about how service companies can
become market leader and can make money. The service profit chain links employee, customer
outcomes and financial performance of the company at the unit level in service organizations (Figure 4).
The service profit chain hypothesized that market share, profit and growth is directly linked to customer
loyalty and satisfaction, the value provided to customer, the productivity and quality of work of the
employees, employee loyalty, employee satisfaction and capability.
Figure 4. Service Profit Chain
A general framework of market leadership in service industry is presented at Figure 5.
Figure 5. Determinants of Market Leadership in Service Industry
Service Quality
Reliability
On time delivery
Errors or defects
Customer Focus
Indicators
Satisfaction
Loyalty and retention
Complaints
Competitiveness Market Share
Profits
Organizational Benefits
Costs
Cycle Time
Employee Turnover
Employee Satisfaction
Health and Safety
Productivity
Quality System and Employee Improvement
Leadership for Continuous
Improvement
Internal Service Quality
Employee Satisfaction
Employee Loyalty
External Service Quality
Customer Satisfaction
Customer Loyalty
Profitability Growth
Market share
International Journal “Information Theories and Applications”, Vol. 25, Number 4, © 2018
372
II. Market Leadership in Telecommunications
Recent years have shown a growing interest in customer loyalty. Actually all industries suffer from
voluntary churn – the decision by the customer to switch to another company or service provider. This is
particularly true for telecommunication companies. Annual churn rates for telecommunications
companies average between 10 and 67 per cent [Hughes, 2007].
Virtual work settings may cause some organizational challenges such as maintaining remote leadership,
managing cultural differences, and developing trust relationships among the teams. Suggested other
challenges that virtual teams need to deal with such as communication difficulties, decreased cohesion,
and high level of conflicts among teams. Added the handling of technological issues such as adaptation
and regular use of communication tools as another challenge that faces virtual teams. Those challenges
may pose a threat to the performance of any virtual teams. Leaders of support organizations need to
overcome the challenges of distributed settings to resolve technical problems and satisfy their
customers.
Leaders stimulate followers to be high performers through effective use of motivational and
communication skills on individual and group levels. Virtual team leaders may need different leadership
characteristics from leaders of traditional teams when setting goals, offering support and guidance, and
inspiring team members. Leaders in support environment need to address challenges facing their teams
in addition to technical problems reported by their customer, which increases their responsibilities to
include satisfying their leaders, subordinates, and external customers [Saafein, Shaykhian 2014].
In [Varblane, 2009] it is mentioned that traditionally there are two approaches to treating customer
loyalty. Some researchers have investigated the nature of different levels of loyalty; others have
explored the influence of individual factors on loyalty. Both treatments are combined to investigate which
specific factors in the telecommunication sector influence the loyalty rate of the various customers
segmented by loyalty. The potential for establishing loyalty depends on the object (i.e. product or
vendor), on the subject (customer) or on the environment (market, other suppliers, etc.).
Different approaches allow customers to be distinguished as either behaviorally or emotionally loyal.
Behaviorally loyal customers act loyal but have no emotional bond with the brand or the supplier,
whereas emotionally loyal customers do. These two kinds of loyalty accordingly false or true long-term
loyalty. Divide customers into loyal (behavioral) or committed (emotional). Emotional loyalty is much
stronger and longer lasting than behavioral loyalty. It is an enduring desire to maintain a valued
relationship. The relationship is so important for the customer that he or she makes maximum efforts to
maintain. Highly bonded customers will buy repeatedly from a provider, to which they are bonded,
recommending the provider to others, and strongly defending these choices to others – insisting that
they have chosen the “best” product or service.
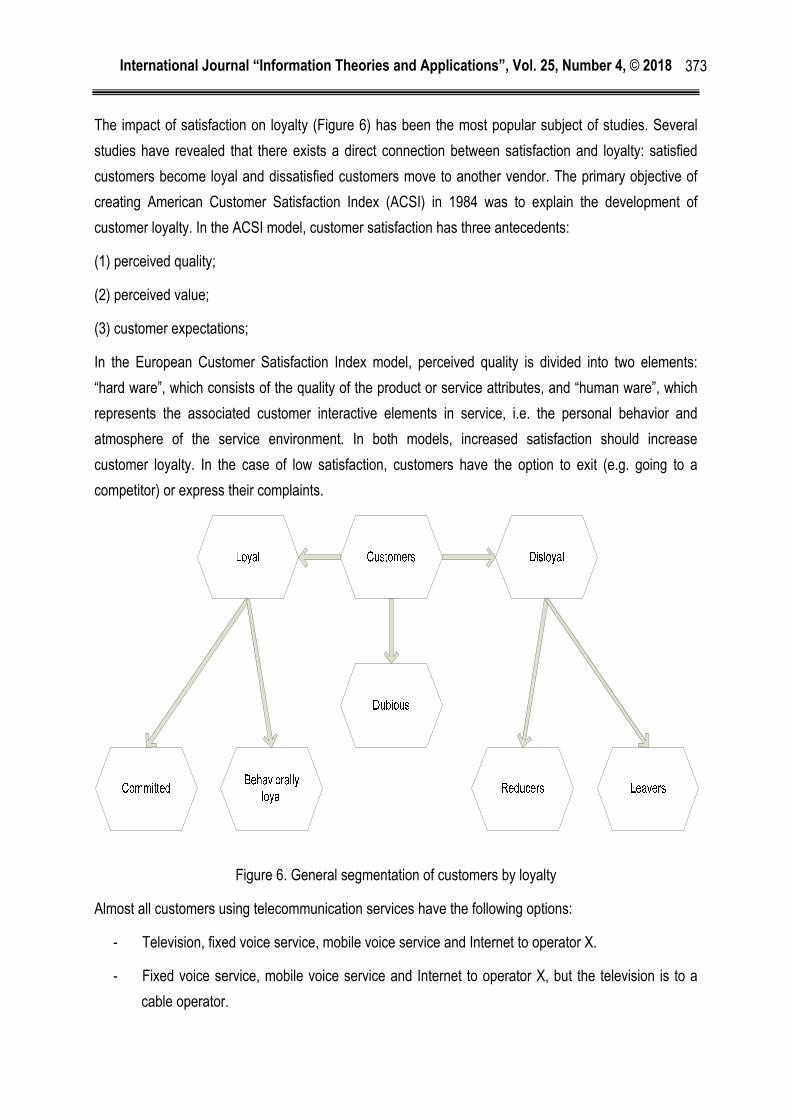
International Journal “Information Theories and Applications”, Vol. 25, Number 4, © 2018
373
The impact of satisfaction on loyalty (Figure 6) has been the most popular subject of studies. Several
studies have revealed that there exists a direct connection between satisfaction and loyalty: satisfied
customers become loyal and dissatisfied customers move to another vendor. The primary objective of
creating American Customer Satisfaction Index (ACSI) in 1984 was to explain the development of
customer loyalty. In the ACSI model, customer satisfaction has three antecedents:
(1) perceived quality;
(2) perceived value;
(3) customer expectations;
In the European Customer Satisfaction Index model, perceived quality is divided into two elements:
“hard ware”, which consists of the quality of the product or service attributes, and “human ware”, which
represents the associated customer interactive elements in service, i.e. the personal behavior and
atmosphere of the service environment. In both models, increased satisfaction should increase
customer loyalty. In the case of low satisfaction, customers have the option to exit (e.g. going to a
competitor) or express their complaints.
Figure 6. General segmentation of customers by loyalty
Almost all customers using telecommunication services have the following options:
- Television, fixed voice service, mobile voice service and Internet to operator X.
- Fixed voice service, mobile voice service and Internet to operator X, but the television is to a
cable operator.
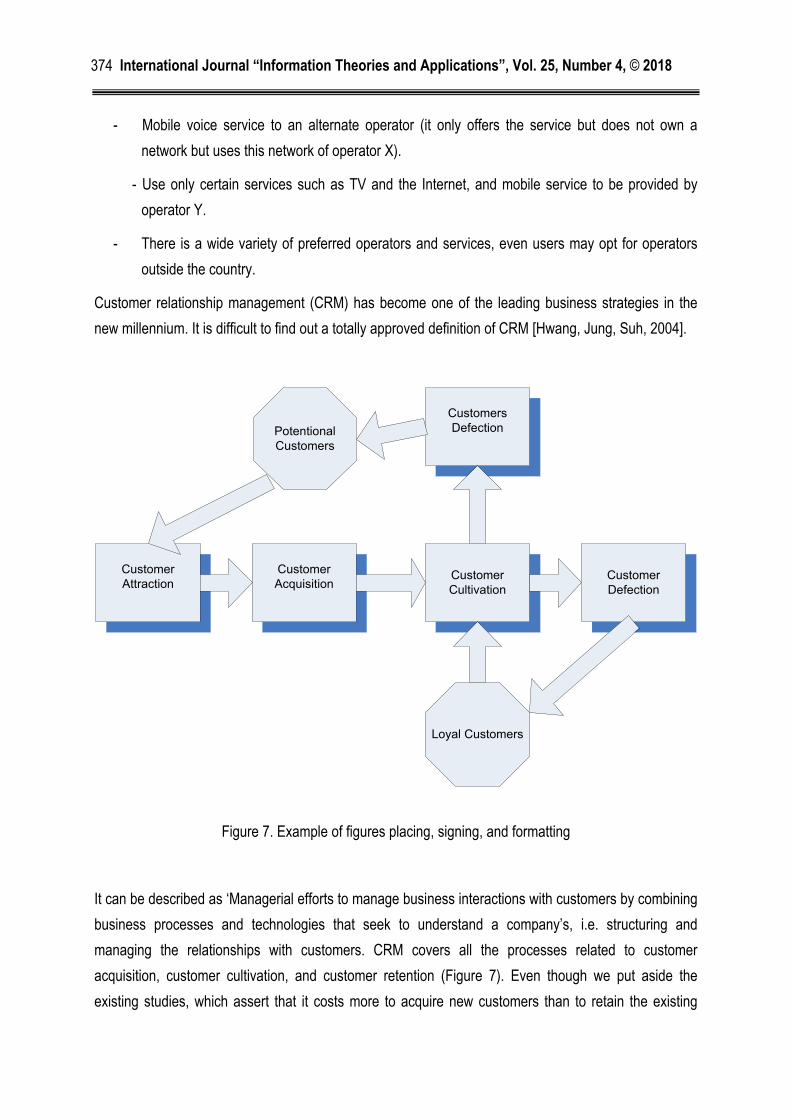
International Journal “Information Theories and Applications”, Vol. 25, Number 4, © 2018
374
- Mobile voice service to an alternate operator (it only offers the service but does not own a
network but uses this network of operator X).
- Use only certain services such as TV and the Internet, and mobile service to be provided by
operator Y.
- There is a wide variety of preferred operators and services, even users may opt for operators
outside the country.
Customer relationship management (CRM) has become one of the leading business strategies in the
new millennium. It is difficult to find out a totally approved definition of CRM [Hwang, Jung, Suh, 2004].
Loyal Customers
Potentional Customers
Customer Attraction
Customers Defection
Customer Defection
Customer Acquisition
Customer Cultivation
Figure 7. Example of figures placing, signing, and formatting
It can be described as ‘Managerial efforts to manage business interactions with customers by combining
business processes and technologies that seek to understand a company’s, i.e. structuring and
managing the relationships with customers. CRM covers all the processes related to customer
acquisition, customer cultivation, and customer retention (Figure 7). Even though we put aside the
existing studies, which assert that it costs more to acquire new customers than to retain the existing
International Journal “Information Theories and Applications”, Vol. 25, Number 4, © 2018
375
customers, we can imagine that customer cultivation and retention are more important than customer
acquisition because lack of information on new customers makes it difficult to select target customers
and this will cause inefficient marketing efforts.
Customer value has been studied under the name of LTV, Customer Lifetime Value, Customer Equity,
and Customer Profitability. The previous researches contain several definitions of LTV.
The concept of situation dependency that applies features specific to mobile computing is one approach
in improving the acceptance of mobile services. It takes advantage of the strong relationship between a
user and his mobile terminal, which makes it easy to identify the user by knowing the technical address
of the mobile terminal. Furthermore, it is possible to determine the position of the user by locating the
mobile terminal. While location-dependent services only focus on the position of a user, the concept of
situation dependency goes even further by determining the whole context in which a user accesses a
service. It can offer, therefore, information that suits the user’s actual demand [Figge, 2004].
Situation dependency may be conceived as a three-dimensional space, with user identity, access
position, and access time as its axes. This space describes the set of possible service access
situations. The actual usage of a service by a specific user can then be seen as one point in that space.
To accomplish situation dependency, it is necessary to determine the three components—identity,
position, and time—in order to locate the user’s access point in the situation space.
To realize situation-dependent services, four process steps are running sequentially:
- the service invocation by the user,
- the situation determination to provide the three situation components,
- the context computation that generates further information, and
- finally, the service presentation at the mobile terminal of the user in the shape of the adapted
service.
The situation process starts with a user accessing a service through a client application on a mobile
terminal. The application is based on a certain mobile application environment, e.g., the WAP or the
short message service (SMS). Depending on this environment, the request is transmitted through a
different set of protocols, bearers, and gateways. Finally, it arrives as a service invocation on an Internet
application server in the shape of a protocol request. The request usually contains a reference that
enables the application server to obtain more information about the user.
Very important for mobile network operators, for instance, is always to have access to the current
position of their subscribers for technical reasons. If this information were not safe with the operators,
subscribers would lose their trust and terminate their economic relationship with the mobile network

International Journal “Information Theories and Applications”, Vol. 25, Number 4, © 2018
376
operator. For the sake of their own business, the mobile network operator has to guarantee the safety of
the network data. The same mechanism should be applicable in the case of the situation provider and
the user can allow the situation provider to access his/her personal profiles.
From the last few years, it has been witnessed that transformational and charismatic leadership are very
important aspects of leadership that are highly associated with individual as well as organizational
performance. Effectiveness of leadership measures the ability of leaders to provoke the followers
towards the collective goals.
Actually, scholars have described transformational leadership by taking motivational effect regarding the
followers, which should lead to a greater number of attracted customers and a higher market share.
Early research of transformational leadership was about the features of the leaders and their
relationship with the followers. Further research on the behaviors of transformational leaders proposes
that transformational leadership is intervened by the leader’s activities the aptitude to create a common
vision, to coherent clear and expressive goals, to permit employees, and dependable behavior [Ahmad,
Abbas, Latif, Rasheed, 2014].
The main components of transformational leadership are Idealized Influence, Individual Consideration,
Intellectual Stimulation and Inspirational Motivation.
Here, we have to ask one question, all these factors stimulating employees influence the market share.
In our opinion, things are also related to increasing the employability of the employees will lead to the
expansion of the market share in different sizes (Figure 8).
A core responsibility for organizational leaders is to direct followers towards achieving organizational
purposes by articulating the organization’s mission, vision, strategy, and goals. Leaders at all levels are
responsible for the dissemination of strategic organizational goals, as well as for convincing their
constituents to effectively implement those goals. Indicated that transformational leaders form
relationships with followers that may make it easier for them to disseminate and implement strategic
goals. It is explored how transformational and transactional leadership styles, communication style, and
goal articulation were related to the dissemination of strategic goals across several organizational levels
in a large complex telecommunications company [Bersona, Avoliob, 2004].
Transformational leadership theorists have argued that transformational leadership is more proactive
and ultimately more effective than transactional, corrective, or avoidant leadership in terms of motivating
followers to achieve higher performance. This pattern of results has been supported in a number of
studies over the last decade. It has been argued that transformational leaders are more capable of
sensing their environment and then forming and disseminating strategic goals that capture the attention
and interest of their followers. Followers of transformational leaders have been shown to exhibit higher
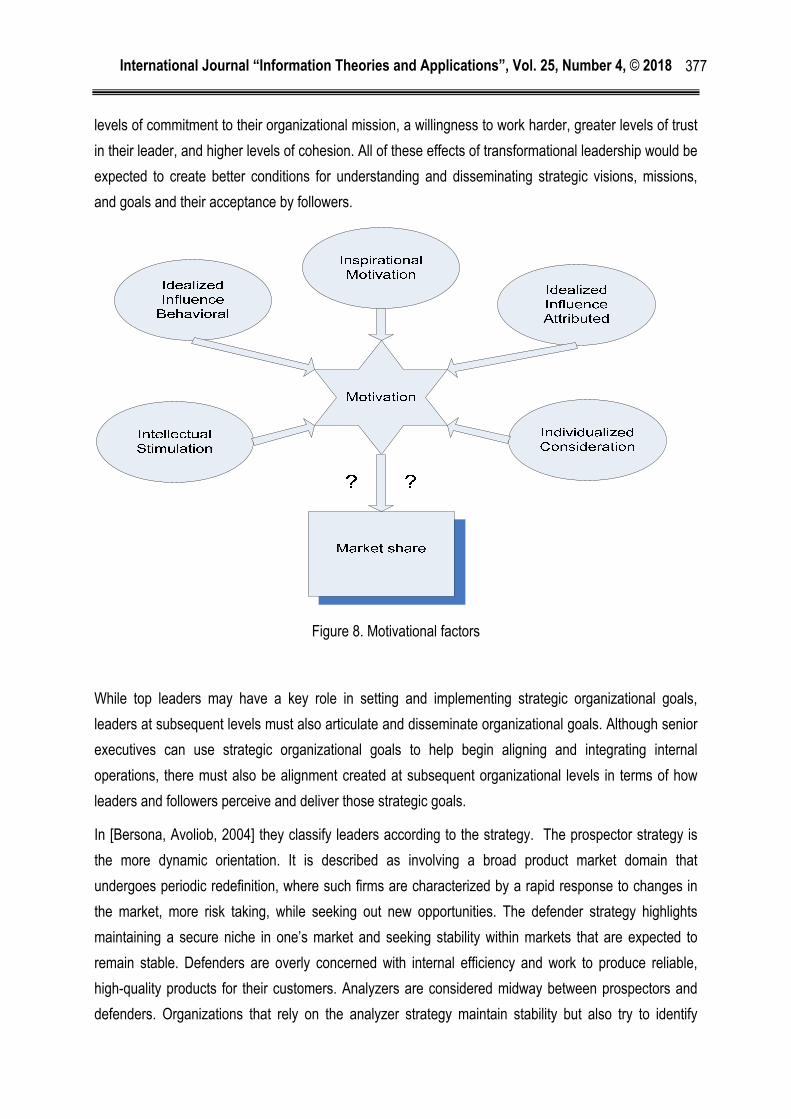
International Journal “Information Theories and Applications”, Vol. 25, Number 4, © 2018
377
levels of commitment to their organizational mission, a willingness to work harder, greater levels of trust
in their leader, and higher levels of cohesion. All of these effects of transformational leadership would be
expected to create better conditions for understanding and disseminating strategic visions, missions,
and goals and their acceptance by followers.
Figure 8. Motivational factors
While top leaders may have a key role in setting and implementing strategic organizational goals,
leaders at subsequent levels must also articulate and disseminate organizational goals. Although senior
executives can use strategic organizational goals to help begin aligning and integrating internal
operations, there must also be alignment created at subsequent organizational levels in terms of how
leaders and followers perceive and deliver those strategic goals.
In [Bersona, Avoliob, 2004] they classify leaders according to the strategy. The prospector strategy is
the more dynamic orientation. It is described as involving a broad product market domain that
undergoes periodic redefinition, where such firms are characterized by a rapid response to changes in
the market, more risk taking, while seeking out new opportunities. The defender strategy highlights
maintaining a secure niche in one’s market and seeking stability within markets that are expected to
remain stable. Defenders are overly concerned with internal efficiency and work to produce reliable,
high-quality products for their customers. Analyzers are considered midway between prospectors and
defenders. Organizations that rely on the analyzer strategy maintain stability but also try to identify
International Journal “Information Theories and Applications”, Vol. 25, Number 4, © 2018
378
potential new developments, but take a less risky approach than prospectors. Finally, because the
reactor strategy is usually not regarded as a strategic approach, it was dropped from further
consideration in this study.
III. Methodology
According to a previous research [Otsetova, A., Kolev, D., Dimcheva, G., Georgiev, G., 2018] mobile
data service will play a pivot role in telecommunications and would be a vital part for sustaining market
leadership role, thus making it a priority for researchers and management in the respected field. The
main methodology for observation and key indicators analysis is empirical data research by
questionnaire. This is done by descriptive statistical methods. Descriptive statistics, and more precisely
descriptive methods, are most commonly used to collect and evaluate primary and/or subjective
information - opinions, preferences, assessments, attitudes, and so on. Besides qualitative, they also
allow the evaluation of quantitative information that is appropriate for subsequent statistical and
mathematical processing and analysis. Usually, it is done by a sample of respondents, which is the
current case in this research paper.
In the analysis of the obtained data, frequency distributions are used. These are the simplest and most
common way to aggregate data in an array. The most commonly used frequency distributions are one-
dimensional and two-dimensional distributions.
One-dimensional distributions are the most elementary groups in processing information for market
research. The main parameters are the frequencies and shares of the studied signs. The frequencies
describe the absolute distributions of the cases under the different meanings of the studied
characteristics. The relative shares represent them in relative value, most often in percentages
[Banchev, P., 2012]. For the purpose of this study, appraisals in relative value and ranks are applied to
assess the significance of each individual factor. The current ranks used are so called “Likert scales” as
you can see below.
Two-dimensional distributions represent the distribution of the values of each case by two variables
simultaneously. The main task of the two-dimensional distributions is to prove the existence of any
relationship between the two variables or to determine the type and direction of the cause-and-effect
relationship. Most often, the basic variable of these distributions is the so-called passport characteristics
determined by different groups like gender, age, education, etc.
The questions in the current research are divided into several groups by their purpose. In the first
group, are the questions that make it possible to divide the respondents. They are placed at the
beginning or end of the questionnaire, but they can also be in the main part of it as long as the logic is
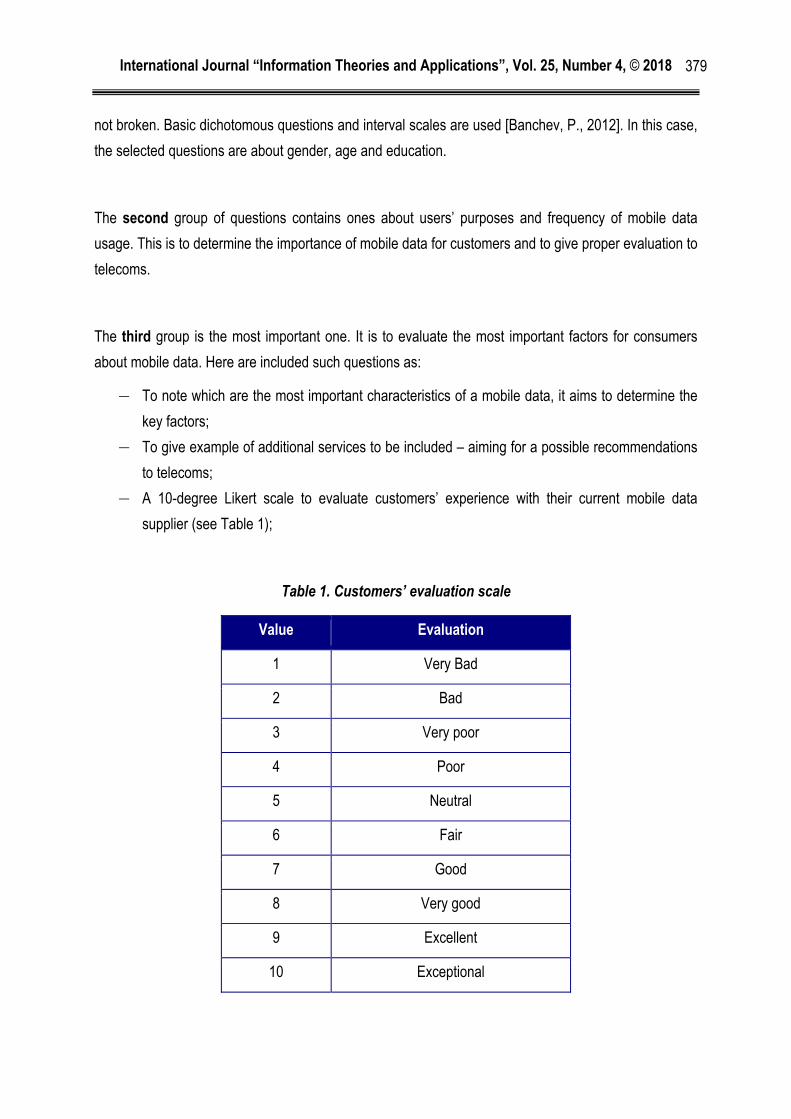
International Journal “Information Theories and Applications”, Vol. 25, Number 4, © 2018
379
not broken. Basic dichotomous questions and interval scales are used [Banchev, P., 2012]. In this case,
the selected questions are about gender, age and education.
The second group of questions contains ones about users’ purposes and frequency of mobile data
usage. This is to determine the importance of mobile data for customers and to give proper evaluation to
telecoms.
The third group is the most important one. It is to evaluate the most important factors for consumers
about mobile data. Here are included such questions as:
― To note which are the most important characteristics of a mobile data, it aims to determine the
key factors;
― To give example of additional services to be included – aiming for a possible recommendations
to telecoms;
― A 10-degree Likert scale to evaluate customers’ experience with their current mobile data
supplier (see Table 1);
Table 1. Customers’ evaluation scale
Value Evaluation
1 Very Bad
2 Bad
3 Very poor
4 Poor
5 Neutral
6 Fair
7 Good
8 Very good
9 Excellent
10 Exceptional
International Journal “Information Theories and Applications”, Vol. 25, Number 4, © 2018
380
― To state which is the most important characteristic of their current mobile data – this question
aims to further quantify and determine key factors for the aforementioned Likert scale
evaluation;
― To refer what kind of mobile services they use – aims to find the specific limitations of the
current mobile services used by customers and to get a more broader perspective about their
satisfaction evaluation;
― Finally, is the question about telecommunication operator used by customers – aiming to find
which telecom has a greater evaluation by customers, thus holding the leading position on the
market.
The selection of respondents very often is a limited process. Most researches mainly use students who
are not always a suitable category on which to draw conclusions. For this reason as respondents in the
present study are attracted people with different social status and from different age groups. They are
selected in three main ways:
― Completion of questionnaire cards by random persons located near the points of sale;
― Filing of questionnaire cards by persons selected electronically via social media and e-mail;
― Completion of questionnaires from students from the University of Telecommunication and Post
- Sofia.
The first group is people who are close to the point of sale related to the selected category.
Telecommunication services and more over mobile data can most often be purchased in specific
telecom operator’s stores. It is for this reason that we are looking for and selecting respondents who are
located near such commercial sites in major cities in Bulgaria. Respondents were randomly selected
because this research does not seek to identify any specific intentions of users before and after
purchase, but rather to observe and analyze general tendencies.
The second group is electronically selected respondents by applying the "snowball" method, i.e., each
person is asked to forward questionnaires to others from his / her social environment. The main
channels chosen for this are the social network - Facebook and e-mail. The questionnaire form is also
done online by Google analytics, which makes it easy to be spread.
The third group are students from the University of Telecommunication and Post - Sofia. The
completion of the questionnaires is part of the seminars on marketing and after filling in the
questionnaire, the questions used in the questionnaires are discussed. In this case, the selected
students are good focus group because they have professional interest in field of telecommunication
and should be aware of the future tendencies and leadership strategies for the market.
The social status of the respondents (profession, education), age and gender are not taken into account
because they are not key factor for the research. The main goal is to make general conclusions about
the importance of mobile data for telecoms and their market strategy, which makes one-dimensional
International Journal “Information Theories and Applications”, Vol. 25, Number 4, © 2018
381
distributions the best suitable way of research. However, it is possible for further studies of the authors
to take into account the aforementioned characteristics.
IV. Analysis
To confirm that the research has a good outreach and the selected respondents are from various
backgrounds, brief information about their social status and mobile services preferences would be
given. The research has been done from July to September 2018 among 194 respondents, 57% male
and 43% female. The age distribution is mainly in two big groups – 50% between 19 and 30 years old
and 34% between 31 and 40 years old. It is very good age groups, because they are the main
customers of mobile services and mobile data in particular.
On the one hand, young people under the age of 18 are could also be considered as users of mobile
data, but usually they do not pay or select the service as it is done by their parents. On the other hand,
the people above the age of 51 are generally not using new technologies such as smart phones and
mobile internet access. Thus, making the aforementioned two groups irrelevant to the research.
According to the education status – 52% have university degree and 44% have graduated from
secondary school, which means that the participants have enough knowledge to provide adequate
information for the survey. Moreover, 98.7% of all have stated they use mobile data, which is the key
observation factor in the research.
Figure 9. Why do you use mobile internet
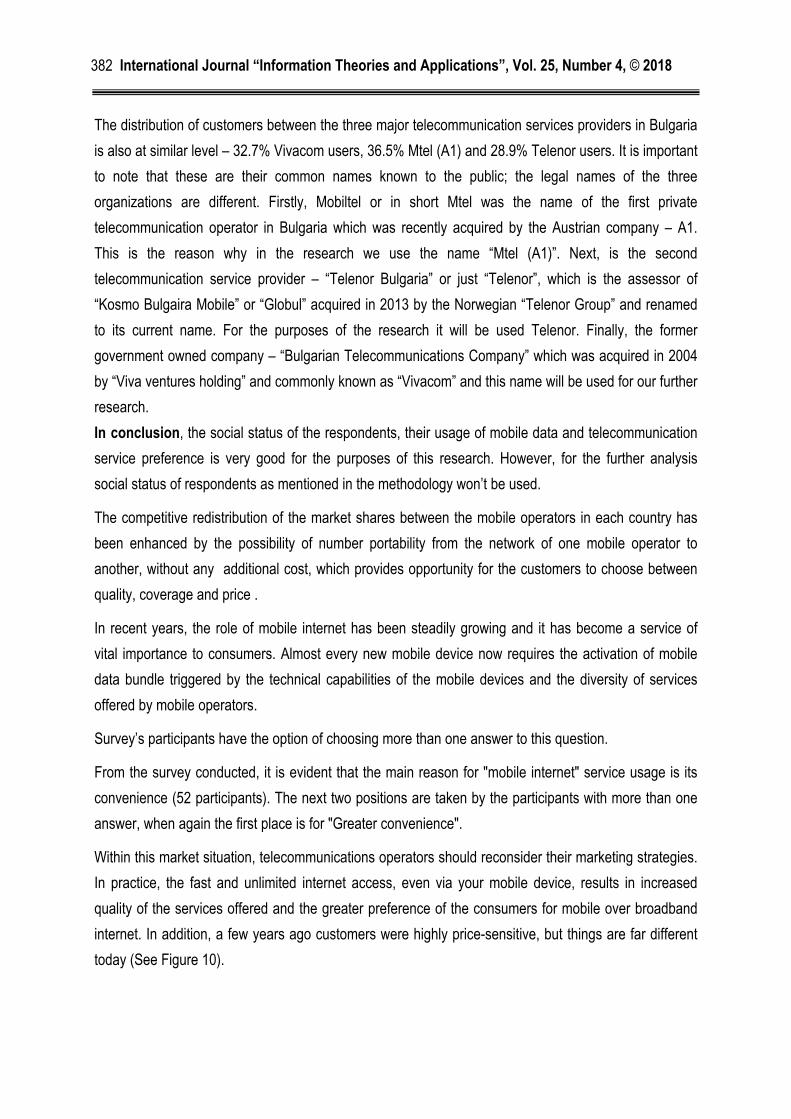
International Journal “Information Theories and Applications”, Vol. 25, Number 4, © 2018
382
The distribution of customers between the three major telecommunication services providers in Bulgaria
is also at similar level – 32.7% Vivacom users, 36.5% Mtel (A1) and 28.9% Telenor users. It is important
to note that these are their common names known to the public; the legal names of the three
organizations are different. Firstly, Mobiltel or in short Mtel was the name of the first private
telecommunication operator in Bulgaria which was recently acquired by the Austrian company – A1.
This is the reason why in the research we use the name “Mtel (A1)”. Next, is the second
telecommunication service provider – “Telenor Bulgaria” or just “Telenor”, which is the assessor of
“Kosmo Bulgaira Mobile” or “Globul” acquired in 2013 by the Norwegian “Telenor Group” and renamed
to its current name. For the purposes of the research it will be used Telenor. Finally, the former
government owned company – “Bulgarian Telecommunications Company” which was acquired in 2004
by “Viva ventures holding” and commonly known as “Vivacom” and this name will be used for our further
research.
In conclusion, the social status of the respondents, their usage of mobile data and telecommunication
service preference is very good for the purposes of this research. However, for the further analysis
social status of respondents as mentioned in the methodology won’t be used.
The competitive redistribution of the market shares between the mobile operators in each country has
been enhanced by the possibility of number portability from the network of one mobile operator to
another, without any additional cost, which provides opportunity for the customers to choose between
quality, coverage and price .
In recent years, the role of mobile internet has been steadily growing and it has become a service of
vital importance to consumers. Almost every new mobile device now requires the activation of mobile
data bundle triggered by the technical capabilities of the mobile devices and the diversity of services
offered by mobile operators.
Survey’s participants have the option of choosing more than one answer to this question.
From the survey conducted, it is evident that the main reason for "mobile internet" service usage is its
convenience (52 participants). The next two positions are taken by the participants with more than one
answer, when again the first place is for "Greater convenience".
Within this market situation, telecommunications operators should reconsider their marketing strategies.
In practice, the fast and unlimited internet access, even via your mobile device, results in increased
quality of the services offered and the greater preference of the consumers for mobile over broadband
internet. In addition, a few years ago customers were highly price-sensitive, but things are far different
today (See Figure 10).
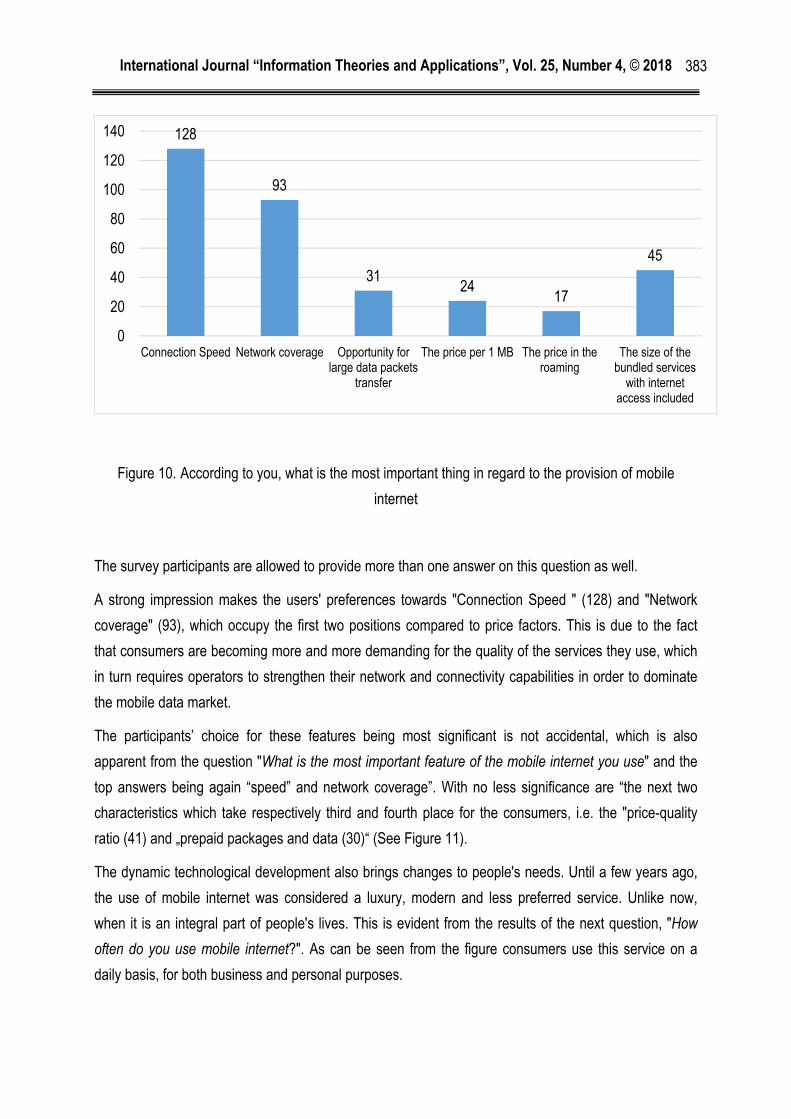
International Journal “Information Theories and Applications”, Vol. 25, Number 4, © 2018
383
Figure 10. According to you, what is the most important thing in regard to the provision of mobile
internet
The survey participants are allowed to provide more than one answer on this question as well.
A strong impression makes the users' preferences towards "Connection Speed " (128) and "Network
coverage" (93), which occupy the first two positions compared to price factors. This is due to the fact
that consumers are becoming more and more demanding for the quality of the services they use, which
in turn requires operators to strengthen their network and connectivity capabilities in order to dominate
the mobile data market.
The participants’ choice for these features being most significant is not accidental, which is also
apparent from the question "What is the most important feature of the mobile internet you use" and the
top answers being again “speed” and network coverage”. With no less significance are “the next two
characteristics which take respectively third and fourth place for the consumers, i.e. the "price-quality
ratio (41) and „prepaid packages and data (30)“ (See Figure 11).
The dynamic technological development also brings changes to people's needs. Until a few years ago,
the use of mobile internet was considered a luxury, modern and less preferred service. Unlike now,
when it is an integral part of people's lives. This is evident from the results of the next question, "How
often do you use mobile internet?". As can be seen from the figure consumers use this service on a
daily basis, for both business and personal purposes.
128
93
3124
17
45
0
20
40
60
80
100
120
140
Connection Speed Network coverage Opportunity for large data packets
transfer
The price per 1 MB The price in the roaming
The size of the bundled services
with internet access included
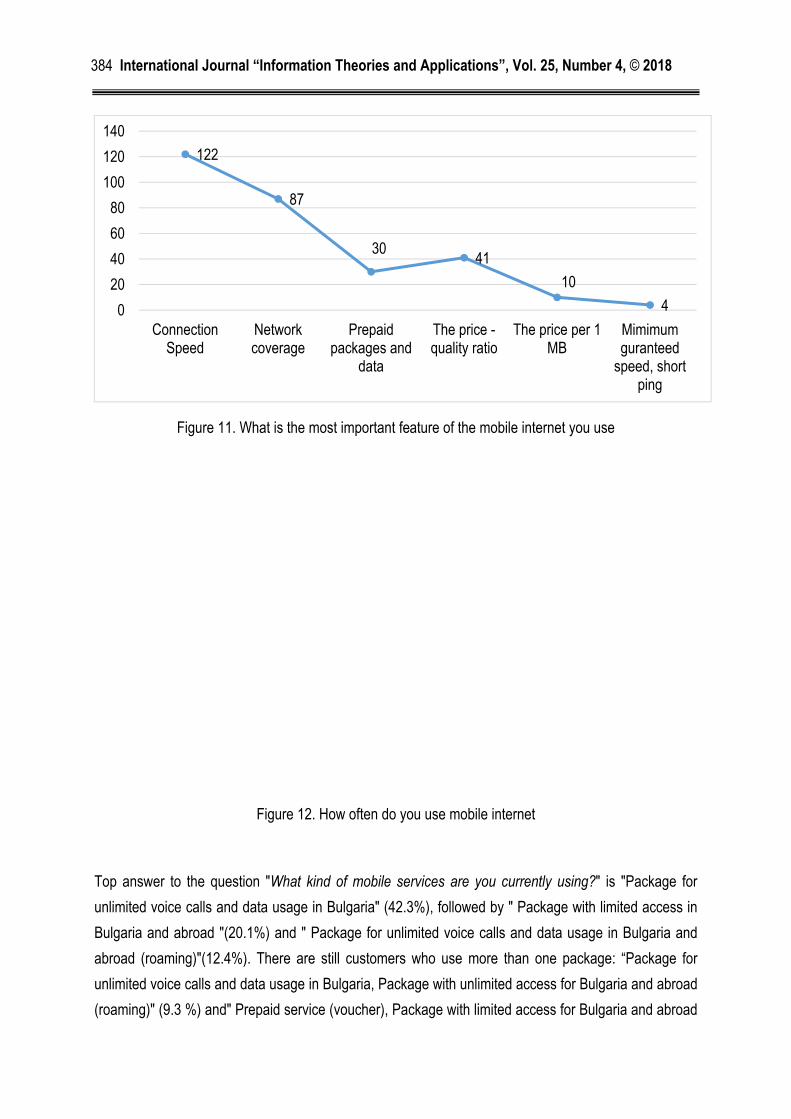
International Journal “Information Theories and Applications”, Vol. 25, Number 4, © 2018
384
Figure 11. What is the most important feature of the mobile internet you use
Figure 12. How often do you use mobile internet
Top answer to the question "What kind of mobile services are you currently using?" is "Package for
unlimited voice calls and data usage in Bulgaria" (42.3%), followed by " Package with limited access in
Bulgaria and abroad "(20.1%) and " Package for unlimited voice calls and data usage in Bulgaria and
abroad (roaming)"(12.4%). There are still customers who use more than one package: “Package for
unlimited voice calls and data usage in Bulgaria, Package with unlimited access for Bulgaria and abroad
(roaming)" (9.3 %) and" Prepaid service (voucher), Package with limited access for Bulgaria and abroad
122
87
3041
10
40
20
40
60
80
100
120
140
Connection Speed
Network coverage
Prepaid packages and
data
The price -quality ratio
The price per 1 MB
Mimimum guranteed
speed, short ping
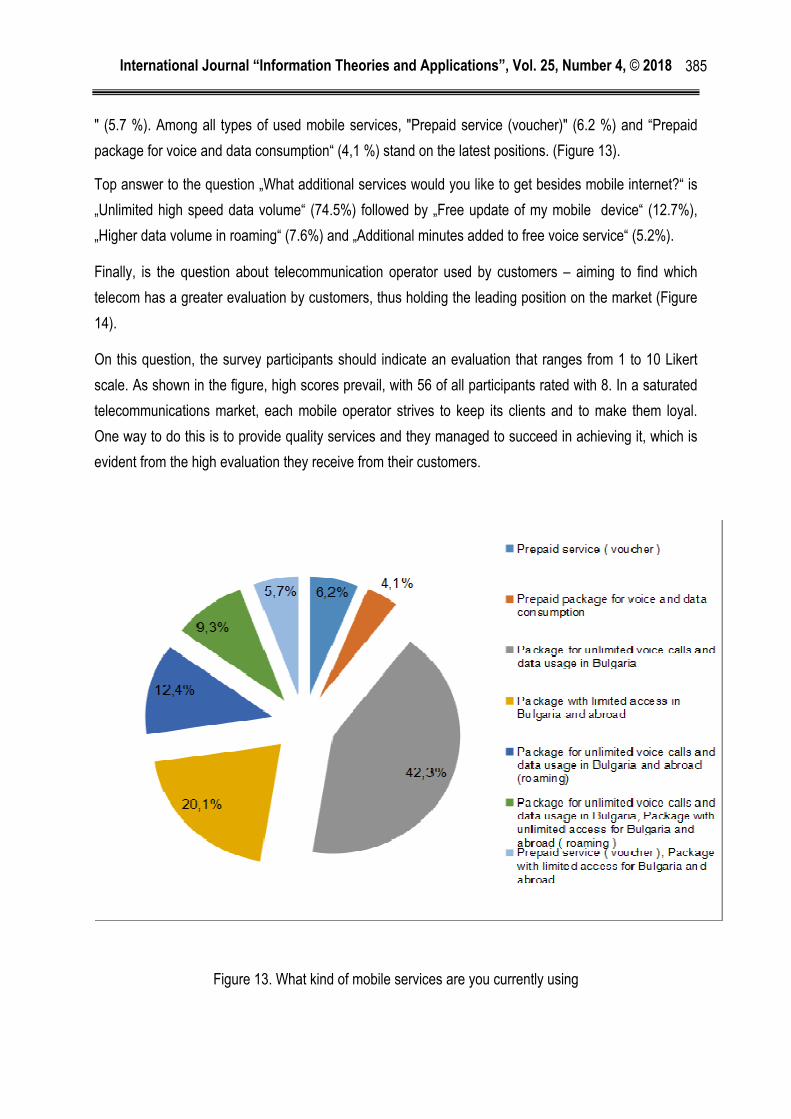
International Journal “Information Theories and Applications”, Vol. 25, Number 4, © 2018
385
" (5.7 %). Among all types of used mobile services, "Prepaid service (voucher)" (6.2 %) and “Prepaid
package for voice and data consumption“ (4,1 %) stand on the latest positions. (Figure 13).
Top answer to the question „What additional services would you like to get besides mobile internet?“ is
„Unlimited high speed data volume“ (74.5%) followed by „Free update of my mobile device“ (12.7%),
„Higher data volume in roaming“ (7.6%) and „Additional minutes added to free voice service“ (5.2%).
Finally, is the question about telecommunication operator used by customers – aiming to find which
telecom has a greater evaluation by customers, thus holding the leading position on the market (Figure
14).
On this question, the survey participants should indicate an evaluation that ranges from 1 to 10 Likert
scale. As shown in the figure, high scores prevail, with 56 of all participants rated with 8. In a saturated
telecommunications market, each mobile operator strives to keep its clients and to make them loyal.
One way to do this is to provide quality services and they managed to succeed in achieving it, which is
evident from the high evaluation they receive from their customers.
Figure 13. What kind of mobile services are you currently using
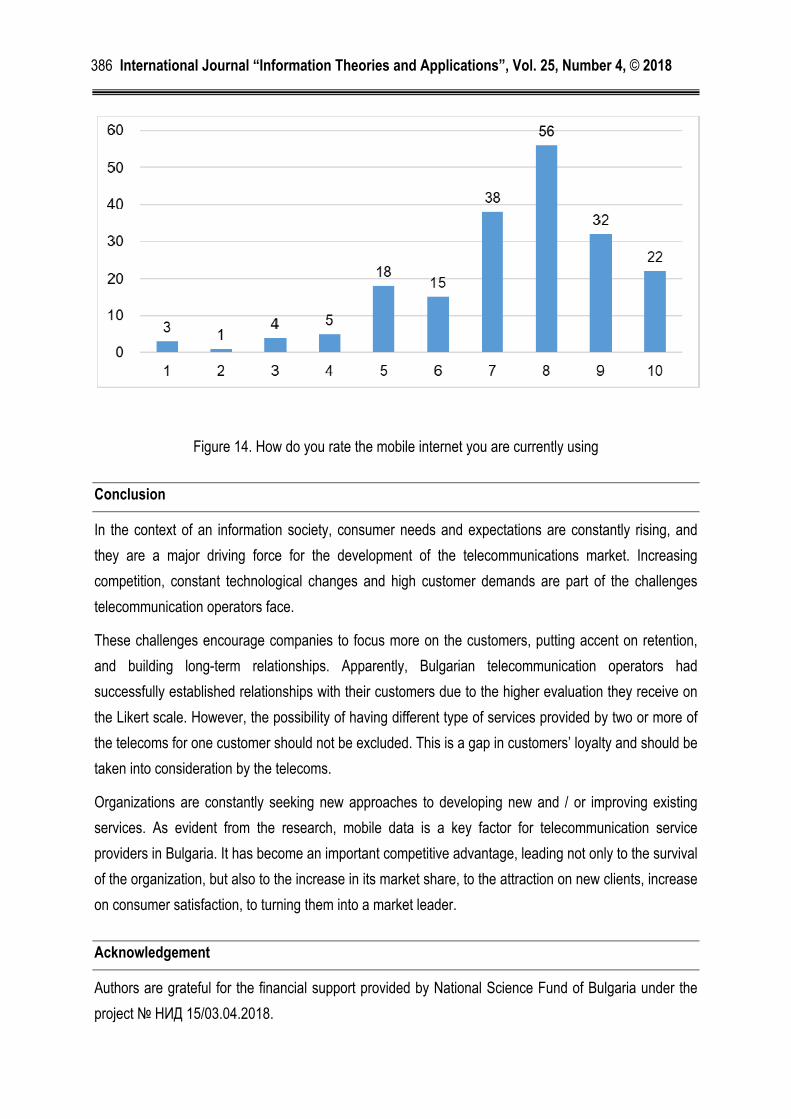
International Journal “Information Theories and Applications”, Vol. 25, Number 4, © 2018
386
Figure 14. How do you rate the mobile internet you are currently using
Conclusion
In the context of an information society, consumer needs and expectations are constantly rising, and
they are a major driving force for the development of the telecommunications market. Increasing
competition, constant technological changes and high customer demands are part of the challenges
telecommunication operators face.
These challenges encourage companies to focus more on the customers, putting accent on retention,
and building long-term relationships. Apparently, Bulgarian telecommunication operators had
successfully established relationships with their customers due to the higher evaluation they receive on
the Likert scale. However, the possibility of having different type of services provided by two or more of
the telecoms for one customer should not be excluded. This is a gap in customers’ loyalty and should be
taken into consideration by the telecoms.
Organizations are constantly seeking new approaches to developing new and / or improving existing
services. As evident from the research, mobile data is a key factor for telecommunication service
providers in Bulgaria. It has become an important competitive advantage, leading not only to the survival
of the organization, but also to the increase in its market share, to the attraction on new clients, increase
on consumer satisfaction, to turning them into a market leader.
Acknowledgement
Authors are grateful for the financial support provided by National Science Fund of Bulgaria under the
project № НИД 15/03.04.2018.
International Journal “Information Theories and Applications”, Vol. 25, Number 4, © 2018
387
Bibliography
[Adrian Ryans et al, 2000] Adrian Ryans, Roger More, Donald Barcley, Terry Deutscher, Winning
market leadership. Strategic market planning for technology-driven business. John Wiley & Sons
Canada, Ltd, 2000.
[Ahmad, Abbas, Latif, Rasheed, 2014] Farid Ahmad, Tasawar Abbas, Shahid Latif, Abdul Rasheed.
Impact of Transformational Leadership on Employee Motivation in Telecommunication Sector,
Journal of Management Policies and Practices June 2014, Vol. 2, No. 2, pp. 11-25, ISSN: 2333-6048
(Print), 2333-6056 (Online).
[Asimakopoulos, Whalley, 2017] Grigorios Asimakopoulos, Jason Whalley, Market leadership,
technological progress and relative performance in the mobile telecommunications industry,
Technological Forecasting and Social Change, 2017, DOI: 10.1016/j.techfore.2017.06.021.
[Banchev, P., 2012] Banchev, P. Marketing research, Veliko Tarnovo, 2012, p. 153, 182, ISBN 978-954-
400-661-7.
[Bersona, Avoliob, 2004] Yair Bersona, Bruce Avoliob. Transformational leadership and the
dissemination oforganizational goals: A case study of a telecommunication firm, The Leadership
Quarterly 15 (2004), pp. 625–646, doi:10.1016/j.leaqua.2004.07.003.
[Carolyn Heller Baird and Cristene Gonzalez-Wertz, 2011] Carolyn Heller Baird and Cristene Gonzalez-
Wertz, "How top performers achieve customer-focused market leadership", Strategy & Leadership,
2011, Vol. 39 Iss 1, pp. 16-23.
[Dariush Rafinejad, 2007] Dariush Rafinejad, Innovation, Product Development and Commercialization.
Case Studies and Key Practices for Market Leadership, Ross Publishing, 2007.
[Figge, 2004] Stefan Figge, Situation-dependent services—a challenge for mobile network operators,
Journal of Business Research 57 (2004), pp.1416– 1422, doi:10.1016/S0148-2963(02)00431-9.
[Hughes, 2007] Hughes, Churn reduction in the telecom industry, available at: www.telecommarketing.
com/index.php?q = node/29 (accessed 1 March 2008).
[Hwang, Jung, Suh, 2004] Hyunseok Hwang, Taesoo Jung, Euiho Suh. An LTV model and customer
segmentation based on customer value: a case study on the wireless telecommunication industry,
Expert Systems with Applications 26 (2004), pp. 181–188, doi:10.1016/S0957-4174(03)00133-7.
[Malerba et al, 2017] Franco Malerba, Sunil Mani, Pamela Adams, 2017, The Rise to Market
Leadership: New Leading Firms from Emerging Countries, Edward Elgar, USA, 2017.
[Otsetova, A., Kolev, D., Dimcheva, G., Georgiev, G., 2018] Otsetova, A., Kolev, D., Dimcheva, G.,
Georgiev, G., Telecommunication services market in Bulgaria in: Company diagnostics, controlling
International Journal “Information Theories and Applications”, Vol. 25, Number 4, © 2018
388
and logistics, 9th international scientific conference proceedings, University of Žilina, Faculty of
Operation and Economics of Transport and Communications, Department of Communications,
Zilina, Slovakia, 2018, ISBN 978-80-554-1464-5, pp.164-172.
[Porter, Tanner, 2012] Porter, L.J., Tanner, S. J., Assessing Business Excellence. A guide to business
excellence and self-assessment, Routledge, New York, USA, 2012.
[Saafein, Shaykhian, 2014] Oussama Saafein, Gholam Shaykhian. Factors affecting virtual team
performance in telecommunication support environment, Telematics and Informatics 31 (2014), pp.
459–462., http://dx.doi.org/10.1016/j.tele.2013.10.004.
[Sathit Parniangtong, 2017] Sathit Parniangtong, Competitive Advantage of Customer Centricity,
Springer Nature Singapore Pte Ltd. 2017.
[Varblane, 2009] Andres Kuusik Urmas Varblane. How to avoid customers leaving: the case of the
Estonian telecommunication industry, Baltic Journal of Management (2009), Vol. 4 Iss 1 pp. 66 - 79,
http://dx.doi.org/10.1108/17465260910930458
Authors' Information
Anna Otsetova – University of Telecommunications and Post, Sofia, 1 Acad. St.
Mladenov Str, Sofia 1700, Bulgaria, E-mail: [email protected]
Major Fields of Scientific Research: Postal services, Quality of services, Loyalty,
Product Leadership, Customer satisfaction, Operation management, Supply Chain
Management, Marketing of Services
Dimitar Kolev – University of Telecommunications and Post – Sofia;, Sofia-1700,
Bulgaria; e-mail: [email protected]
Major Fields of Scientific Research: Economics, Marketing, Management.
Georgi Georgiev – Department of Telecommunications at University of
Telecommunications and Post, Sofia, Bulgaria, tel.: +359889813894 е-mail:
Major Fields of Scientific Research: IP networks, Measurement of internet traffic,
Planning of telecommunications networks.
Gergana Dimcheva – University of Telecommunications and Post, Sofia, 1 Acad.
St. Mladenov Str, Sofia 1700, Bulgaria, Е-mail: [email protected]
Major Fields of Scientific Research: Economics, Management,
Telecommunications.

International Journal “Information Theories and Applications”, Vol. 25, Number 4, © 2018
389
THE STAKEHOLDERWIDE ASSESSMENT OF THE IMPACTS OF ACCEPTED
VALUES OF STOCHASTIC FUNCTIONS OF PROJECT IMPLEMENTATION ON THEIR
SUCCESS
Nataliia Oberemok, Ivan Oberemok
Abstract: The article suggests an approach of decision-making, which increases the probability of
successful implementation of the project. The use of process-stochastic project management under
dynamic economic and social conditions is argued. The method of calculation of the probability of
project function realization is based on feedback of stakeholders.
Keywords: project management, stakeholders, process-stochastic management, homeostatic
management.
ITHEA Keywords: K.6.1 Management of Computing and Information Systems - Project and People
Management
Introduction
The development of technical progress, the emergence of new technologies and materials, free
movement of products and information across the borders results in increased competition. In the
struggle for clients, companies adopt client-oriented approach introducing the project approach. As a
result, new project management approaches and methods, aimed at satisfying the needs of changing
needs of stakeholders, emerge. One should also take into account the dynamics of the appearance of
new values and the division of stakeholder groups. Each new group of stakeholders is related to values
accepted in the society.
The aforementioned prerequisites give rise to new methodologies and project management systems.
The most famous among them are flexible project management methodologies Scrum and Agile. The
leader in the implementation of flexible methodologies is the IT industry. The basic principles of flexible
methodologies are the orientation towards the wishes of stakeholders and the flexibility of using project
management methods and tools. The attitude of stakeholders to the product and its implementation
technology are the determining factors for the success of the project. The selection of functions with a
high degree of probability will lead to the successful completion of the project is the main task of the
project manager.
International Journal “Information Theories and Applications”, Vol. 25, Number 4, © 2018
390
Related work
An analysis of the impact of stakeholders on the project and the development of methodologies and
systems with a focus on meeting the needs of stakeholders is a research topic of great scientific
interest. In the first place, the methods and approaches for defining and describing project stakeholders,
as well as ways of their interaction, are analysed [Belokon 2016]. In addition, the analysis concerns not
only the interaction of stakeholders within the project, but also their interaction with the external
environment, in the first place, with representatives of the organization implementing the project.
[Finogeeva 2017]. The general principles of working with both project teams and all of the other
specialists in the organization are developed [Grabar 2014]. All of these studies offer methods and tools
for working with stakeholders in a relatively sustainable environment when stakeholders do not have to
radically change their wishes or significantly influence the course of project implementation. The
dynamics of changes in the economy and society increases greatly, therefore, there is the need for new
methods and tools which ensure the successful implementation of projects under these conditions.
Task and challenges:
The purpose of the article is to develop the method of decision-making under the conditions of
stakeholder influence. The objectives of the research are:
- The substantiation of process-stochastic project management.
- The description of different types of relations between project stakeholders and their influence
on the project.
- The description of the method of evaluation of the project function realisation taking account of
the feedback from stakeholders.
Task and challenges
The classic way of project realisation is the definition of the technological process of product
development and business process of project management of the process realization. Given that the
technological process is unstable and can change depending on the influence of stakeholders, the
project management business process changes as well. The processes of project implementation and
management are not sustainable, as they are formed in the process of project implementation,
depending on the wishes of the stakeholders regarding the product of the project and the process of its
creation.
Within the process of stochastic project management, a set of functions for creating a project product
development and management is formed. The analysis of the wishes of stakeholders enables to
calculate the probability of realization of particular functions. The calculation of the required values of

International Journal “Information Theories and Applications”, Vol. 25, Number 4, © 2018
391
stochastic functions in the process of project implementation increases the likelihood of success of
projects. But now the question is how to form these values with project management methods. It
requires:
1. Finding the value of stochastic functions of project management (baseline values), which increase the
probability of getting accepted values. For example, if the accepted value of completion of physical
works on the project is 30.06.2018 (where the probability of success is 0,9), the probability of the
completion of the works by 30.06.2018, while maintaining the equipment supply by 01.04.2018, is 0,8.
In case the equipment supply is not maintained by the stated period, the probability of the completion of
the works is only 0,2.
2. Defining the management decisions, which will allow changing the division of stochastic functions
probability in order to maximise the probability of getting accepted values.
The process-stochastic project management is based on the accepted values of stochastic functions.
The method of determining accepted values of stochastic functions hinges on a general assessment of
the project success. In fact, such an assessment as it follows from this method can only be based on
the certainty of the success of projects for stakeholders. This implies the need to develop a method that
integrates the target functions of individual stakeholders in the general assessment of the project
success. Let us consider these tasks.
In order to implement process-stochastic project management, it is necessary to determine the
relationship between accepted values of stochastic functions of project implementation and the success
of projects from the standpoint of all stakeholders. This will determine the success of projects through
decision-making, which affect the accepted values of stochastic functions.
The association of stakeholders in the decision-making process is a common practice. There is an
association at the expense of the common values, which are formed as a result of the implementation or
non-implementation of a particular function. The duration of the association of the stakeholders depends
on the divergence of their values. The larger the set of values is, the longer is the duration of the
association of stakeholders.
The types of interaction between stakeholders during the solving issues related to the project can be
different. The types of interaction are as follows:
- Cooperation. Two stakeholders can be interested in taking the same decision, which would
lead to the creation of a value in which both stakeholders vest interest. For example, the
decrease of contracted works costs, in which both the developer and the project investor are
interested.
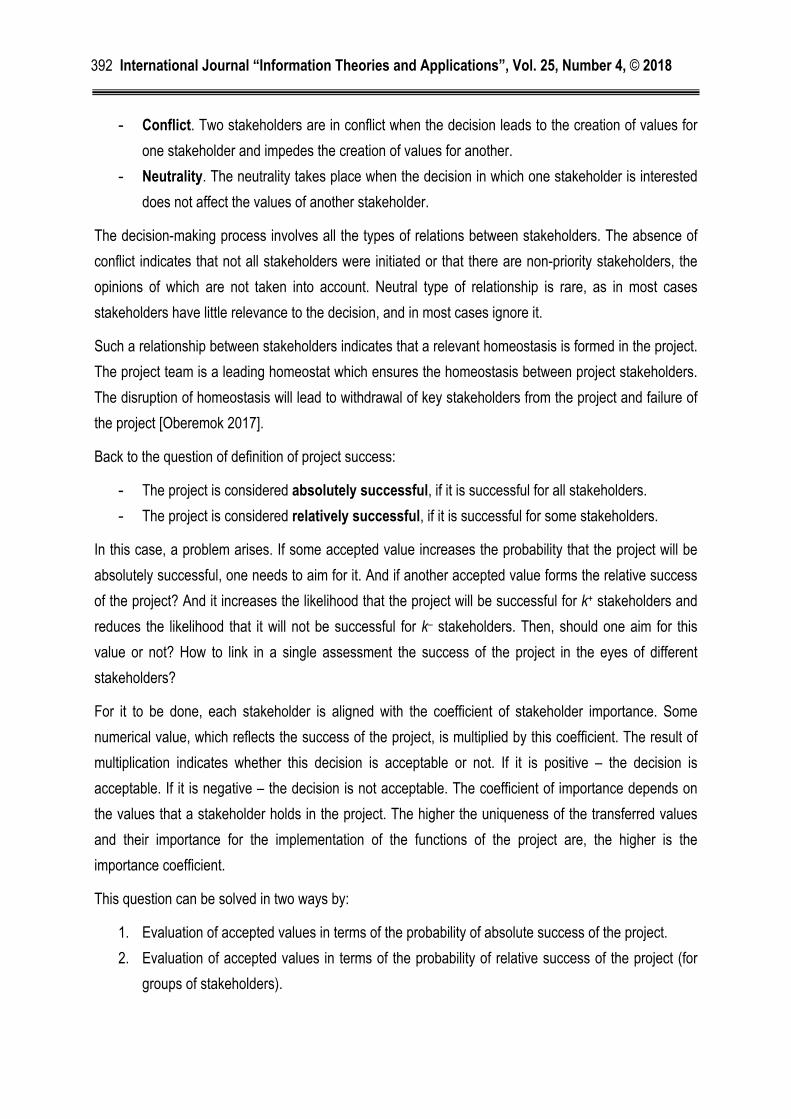
International Journal “Information Theories and Applications”, Vol. 25, Number 4, © 2018
392
- Conflict. Two stakeholders are in conflict when the decision leads to the creation of values for
one stakeholder and impedes the creation of values for another.
- Neutrality. The neutrality takes place when the decision in which one stakeholder is interested
does not affect the values of another stakeholder.
The decision-making process involves all the types of relations between stakeholders. The absence of
conflict indicates that not all stakeholders were initiated or that there are non-priority stakeholders, the
opinions of which are not taken into account. Neutral type of relationship is rare, as in most cases
stakeholders have little relevance to the decision, and in most cases ignore it.
Such a relationship between stakeholders indicates that a relevant homeostasis is formed in the project.
The project team is a leading homeostat which ensures the homeostasis between project stakeholders.
The disruption of homeostasis will lead to withdrawal of key stakeholders from the project and failure of
the project [Oberemok 2017].
Back to the question of definition of project success:
- The project is considered absolutely successful, if it is successful for all stakeholders.
- The project is considered relatively successful, if it is successful for some stakeholders.
In this case, a problem arises. If some accepted value increases the probability that the project will be
absolutely successful, one needs to aim for it. And if another accepted value forms the relative success
of the project? And it increases the likelihood that the project will be successful for k+ stakeholders and
reduces the likelihood that it will not be successful for k– stakeholders. Then, should one aim for this
value or not? How to link in a single assessment the success of the project in the eyes of different
stakeholders?
For it to be done, each stakeholder is aligned with the coefficient of stakeholder importance. Some
numerical value, which reflects the success of the project, is multiplied by this coefficient. The result of
multiplication indicates whether this decision is acceptable or not. If it is positive – the decision is
acceptable. If it is negative – the decision is not acceptable. The coefficient of importance depends on
the values that a stakeholder holds in the project. The higher the uniqueness of the transferred values
and their importance for the implementation of the functions of the project are, the higher is the
importance coefficient.
This question can be solved in two ways by:
1. Evaluation of accepted values in terms of the probability of absolute success of the project.
2. Evaluation of accepted values in terms of the probability of relative success of the project (for
groups of stakeholders).
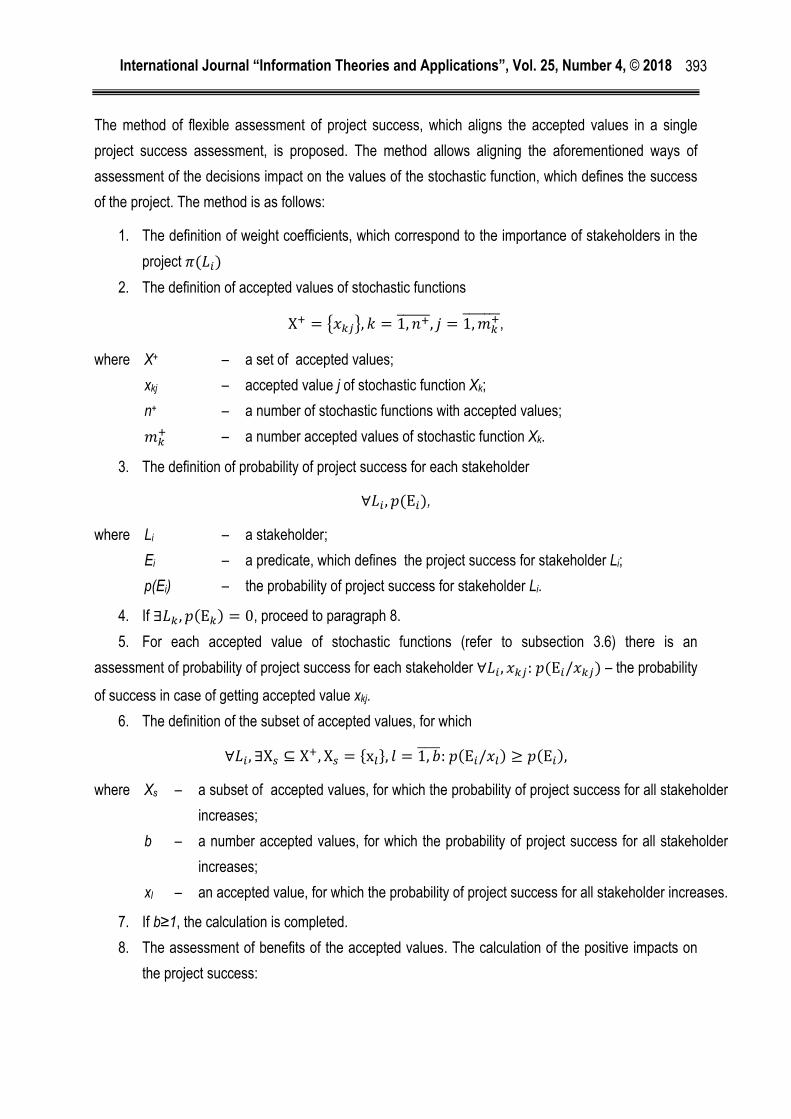
International Journal “Information Theories and Applications”, Vol. 25, Number 4, © 2018
393
The method of flexible assessment of project success, which aligns the accepted values in a single
project success assessment, is proposed. The method allows aligning the aforementioned ways of
assessment of the decisions impact on the values of the stochastic function, which defines the success
of the project. The method is as follows:
1. The definition of weight coefficients, which correspond to the importance of stakeholders in the
project ( ) 2. The definition of accepted values of stochastic functions Х = , = 1, , = 1, ,
where X+ – a set of accepted values;
xkj – accepted value j of stochastic function Хk;
n+ – a number of stochastic functions with accepted values;
– a number accepted values of stochastic function Хk.
3. The definition of probability of project success for each stakeholder ∀ , (Е ), where Li – a stakeholder;
Еi – a predicate, which defines the project success for stakeholder Li;
p(Еi) – the probability of project success for stakeholder Li.
4. If ∃ , (Е ) = 0, proceed to paragraph 8.
5. For each accepted value of stochastic functions (refer to subsection 3.6) there is an
assessment of probability of project success for each stakeholder ∀ , : (Е / ) – the probability
of success in case of getting accepted value хkj.
6. The definition of the subset of accepted values, for which ∀ , ∃Х ⊆ Х , Х = {х }, = 1, : (Е / ) ≥ (Е ), where Xs – a subset of accepted values, for which the probability of project success for all stakeholder
increases;
b – a number accepted values, for which the probability of project success for all stakeholder
increases;
хl – an accepted value, for which the probability of project success for all stakeholder increases.
7. If b≥1, the calculation is completed.
8. The assessment of benefits of the accepted values. The calculation of the positive impacts on
the project success:
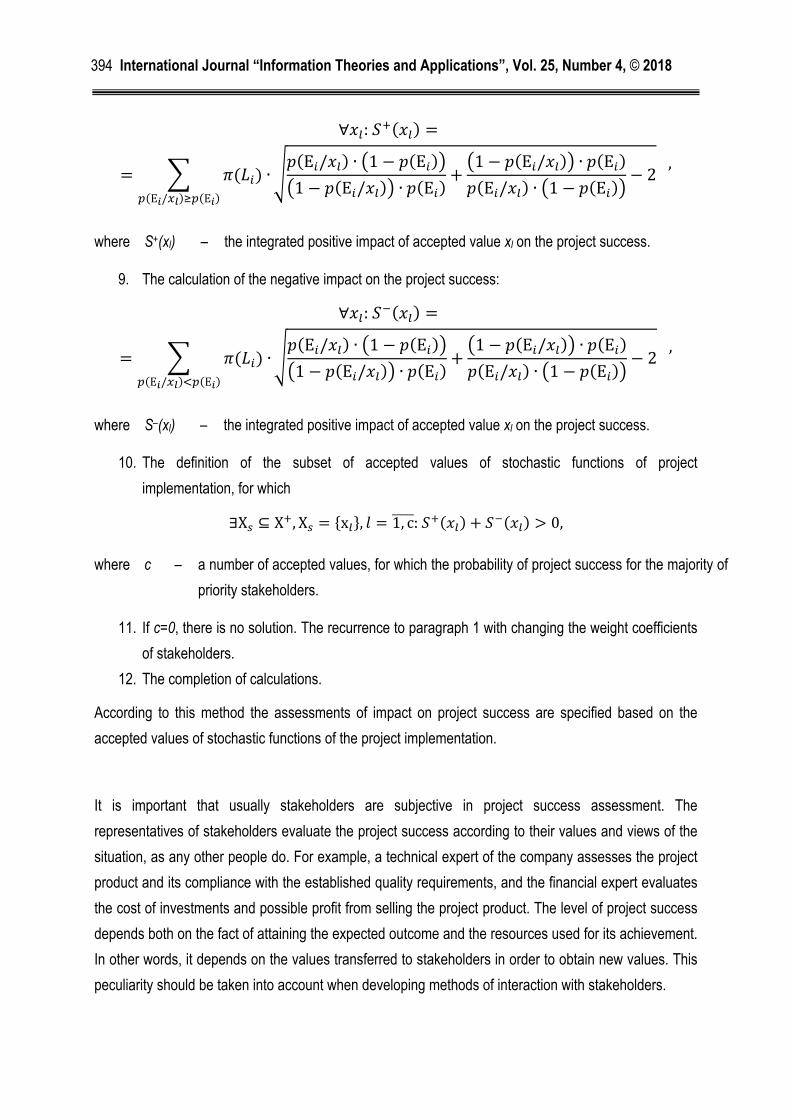
International Journal “Information Theories and Applications”, Vol. 25, Number 4, © 2018
394
∀ : ( ) == ( ) ∙(Е / ) (Е )(Е / ) ∙ 1 − (Е )1 − (Е / ) ∙ (Е ) + 1 − (Е / ) ∙ (Е )(Е / ) ∙ 1 − (Е ) − 2 ,
where S+(xl) – the integrated positive impact of accepted value xl on the project success.
9. The calculation of the negative impact on the project success: ∀ : ( ) == ( ) ∙(Е / ) (Е )(Е / ) ∙ 1 − (Е )1 − (Е / ) ∙ (Е ) + 1 − (Е / ) ∙ (Е )(Е / ) ∙ 1 − (Е ) − 2 ,
where S–(xl) – the integrated positive impact of accepted value xl on the project success.
10. The definition of the subset of accepted values of stochastic functions of project
implementation, for which ∃Х ⊆ Х , Х = {х }, = 1, с: ( ) + ( ) > 0, where c – a number of accepted values, for which the probability of project success for the majority of
priority stakeholders.
11. If с=0, there is no solution. The recurrence to paragraph 1 with changing the weight coefficients
of stakeholders.
12. The completion of calculations.
According to this method the assessments of impact on project success are specified based on the
accepted values of stochastic functions of the project implementation.
It is important that usually stakeholders are subjective in project success assessment. The
representatives of stakeholders evaluate the project success according to their values and views of the
situation, as any other people do. For example, a technical expert of the company assesses the project
product and its compliance with the established quality requirements, and the financial expert evaluates
the cost of investments and possible profit from selling the project product. The level of project success
depends both on the fact of attaining the expected outcome and the resources used for its achievement.
In other words, it depends on the values transferred to stakeholders in order to obtain new values. This
peculiarity should be taken into account when developing methods of interaction with stakeholders.
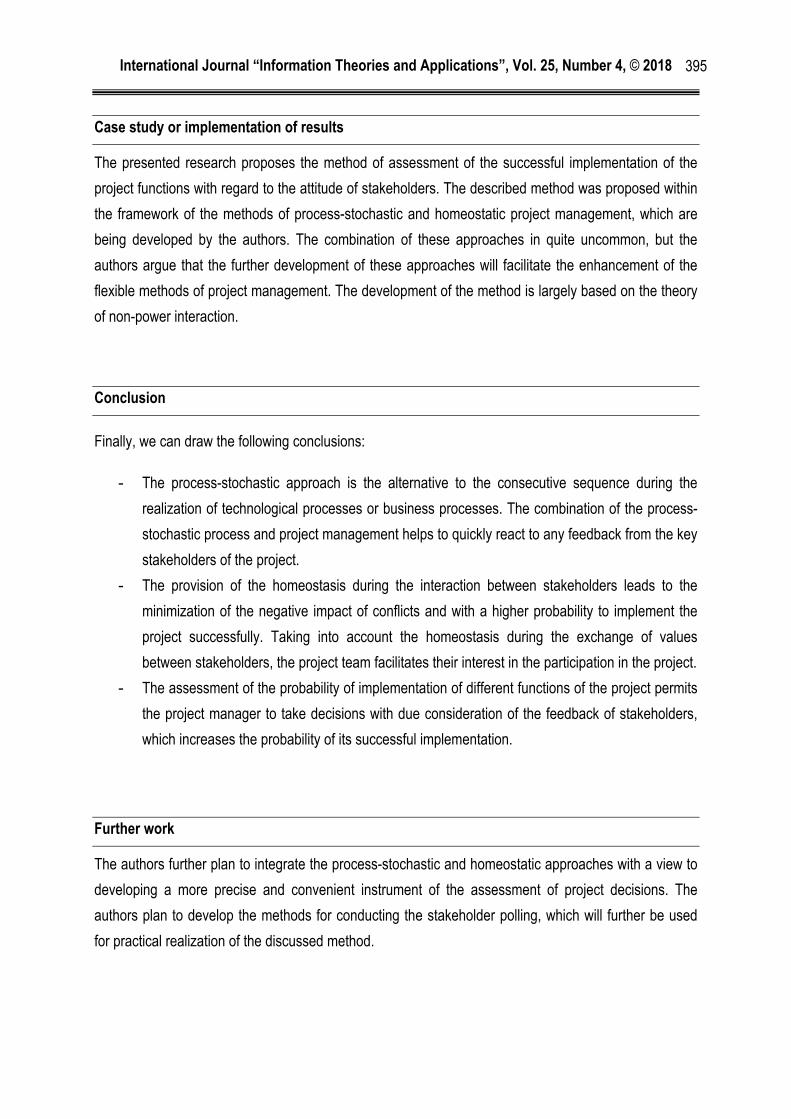
International Journal “Information Theories and Applications”, Vol. 25, Number 4, © 2018
395
Case study or implementation of results
The presented research proposes the method of assessment of the successful implementation of the
project functions with regard to the attitude of stakeholders. The described method was proposed within
the framework of the methods of process-stochastic and homeostatic project management, which are
being developed by the authors. The combination of these approaches in quite uncommon, but the
authors argue that the further development of these approaches will facilitate the enhancement of the
flexible methods of project management. The development of the method is largely based on the theory
of non-power interaction.
Conclusion
Finally, we can draw the following conclusions:
- The process-stochastic approach is the alternative to the consecutive sequence during the
realization of technological processes or business processes. The combination of the process-
stochastic process and project management helps to quickly react to any feedback from the key
stakeholders of the project.
- The provision of the homeostasis during the interaction between stakeholders leads to the
minimization of the negative impact of conflicts and with a higher probability to implement the
project successfully. Taking into account the homeostasis during the exchange of values
between stakeholders, the project team facilitates their interest in the participation in the project.
- The assessment of the probability of implementation of different functions of the project permits
the project manager to take decisions with due consideration of the feedback of stakeholders,
which increases the probability of its successful implementation.
Further work
The authors further plan to integrate the process-stochastic and homeostatic approaches with a view to
developing a more precise and convenient instrument of the assessment of project decisions. The
authors plan to develop the methods for conducting the stakeholder polling, which will further be used
for practical realization of the discussed method.
International Journal “Information Theories and Applications”, Vol. 25, Number 4, © 2018
396
Bibliography
[Belokon 2016]. Belokon A.I., Malanchy S.A., Alcubalayt T.D. Theoretical aspects of the definition and
interaction of interested groups of persons in projects. Herald of Pridnіprovskoe State Academy of
Architecture and Architecture, №1 (214), 72-78. (in Russian)
[Finogeeva 2017]. Finogeeva A.I., Improvement of the mechanism of interaction of the company with
interested parties. Management of economic systems: electronic scientific journal, №3(97), 8. (in
Russian)
[Grabar 2014]. Grabar V.V., Salmakov M.M. Analysis of project stakeholders: methodology,
methodology, tools. ARS ADMINISTRANDI, № 2, 36-44. (in Russian)
[Oberemok 2017]. Oberemok I.I. Oberemok N.V. Development of mathematical model of decision
making based on analysis of values of stakeholders. Technology audit and production reserves. №
2(33), 13-18. (in Ukrainian)
Author’s information:
Nataliia Oberemok, PhD in PM, Associate Professor, Department of Management Technologies. Taras
Shevchenko National University of Kyiv
E-mail: [email protected]
Major Fields of Scientific Research: Project Management
Ivan Oberemok, PhD, Associate Professor, Project Management Department, Kiev National University
of Construction and Architecture
E-mail: [email protected]
Major Fields of Scientific Research: Project Management
International Journal “Information Theories and Applications”, Vol. 25, Number 4, © 2018
397
TABLE OF CONTENTS IJ ITA VOL. 25, NO.:1
Traffic Modeling and Simulation for NGN with Markov Reward Model and Neural Networks
Svetla Radeva and Dimitar Radev ....................................................................................................... 3
Hybrid Gmdh-Neuro-Fuzzy System and Its Training Scheme
Yuriy Zaychenko, Yevgeniy Bodyanskiy, Oleksii Tyshchenko, Olena Boiko, Galib Hamidov ............ 18
Polynomial Time Algorithm for a Sub-Problem of SUBSET SUM with Exponentially Growing Input
Tatiana Kosovskaya ........................................................................................................................... 34
On Multiple Hypotheses LAO Testing With Liberty of Rejection of Decision for two Independent Objects
Evgueni Haroutunian, Parandzem Hakobyan, Aram Yesayan, Narine Harutyunyan ......................... 38
Information-Theoretic Estimations of Cover Distortion by Adaptive Message Embedding ........................
Dmytro Progonov ............................................................................................................................... 47
Cloud Technologies - Services, Architectures and Simulations1 ................................................................
Georgi Petrov Georgiev ..................................................................................................................... 63
Application of Theoretical Numerical Transformations to Digital Signal Processing Algorithms1 ..............
Antonio Andonov, Ilka Stefanova ....................................................................................................... 78
Risk Management for Mobile Services1
Dimitar Kolev ...................................................................................................................................... 88
Forecasting Activity of the Kilaua Volcane Using Intelligent Methods of Data Analysis
Stanislav Zabielin ............................................................................................................................... 94
International Journal “Information Theories and Applications”, Vol. 25, Number 4, © 2018
398
TABLE OF CONTENTS IJ ITA VOL. 25, NO.:2
A Multi-Criteria Approach to the Resource Distributuon
Albert Voronin, Yuriy Ziatdinov, Igor Varlamov................................................................................. 103
Economic Analysis of Influence of Implementation of International Environmental
O.Voloshyn, V.Kudin, A. Onyshchenko, Y. Tverdokhlib ................................................................... 117
Leadership and leadership styles in managing higher education institutions in the republic of Bulgaria
and the republic of Turkey
Мiglena Temelkova .......................................................................................................................... 133
Information Interactions in the Meta-Methodology of Project Management
Iurii Teslia, Iuliia Khlevna, Oleksii Yehorchenkov ............................................................................. 140
Universal Postal Service Market in Bulgaria: State and Challenges
Anna Otsetova, Lian Nedelchev ....................................................................................................... 159
FAKE NEWS, Telecommunications and Information Security
Diana Ilieva ...................................................................................................................................... 174
ITHEA® Doctoral Consortium
Impact of Information Technologies on Social Capital and Foreign Direct Investment in Developing
Countries
Natia Aghladze ................................................................................................................................. 181
Do Trendy Technologies Facilitate Money Laundering
Aleksandre Mikeladze ...................................................................................................................... 190
International Journal “Information Theories and Applications”, Vol. 25, Number 4, © 2018
399
TABLE OF CONTENTS IJ ITA VOL. 25, NO.:3
Solving Optimization Functions using Artificial Bee Colony algorithms
Nuria Gómez Blas, Luis Fernando de Mingo López, Juan Castellanos Peñuela ............................. 203
Functional Safety and Information Security Sensor Network Application
Volodymyr Romanov, Igor Galelyuka, Oleksandr Voronenko .......................................................... 218
Energy Efficiency in Automation of Dyeing Process and Waste Water Heat Utilization
Nikolay Zlatov, Christiyan Iliev, Michael Velikanov ........................................................................... 235
Optimization of deposition of thin photoanisotropic films for holographic data storage
Lian Nedelchev, Georgi Mateev, Anna Otsetova, Dimana Nazarova, Elena Stoykova .................... 245
Opportunities to determine the effectiveness of sensor networks
Filip Tsvetanov, Ivanka Georgieva ................................................................................................... 255
Composite Wavelength Tunable Interferential Wedged Structures in Optical Communications and
Spectroscopy
Marin Nenchev, Margarita Deneva, Elena Stoykova ........................................................................ 268
Scaling and Optimizing Cloud Storage
Stefan Vlaev, Strahil Sokolov and Mihail Vukadinoff ........................................................................ 280
Studies of Synthesized and Implemented Digital Frequency Modulator-Demodulator
Boyan Karapenev ............................................................................................................................ 289
International Journal “Information Theories and Applications”, Vol. 25, Number 4, © 2018
400
TABLE OF CONTENTS IJ ITA VOL. 25, NO.:4
The Benefits of Evaluating the Jordanian Social Security Using Decision Modeling and Notation
Ahmad Zyad Alghzawi, Frank Vanhoenshoven, George Sammour, Koen Vanhoof ......................... 303
Reconstruction of binary images from their horizontal and diagonal projections
Hasmik Sahakyan, Vladimir Ryazanov, Ani Margaryan ................................................................... 331
Skills for Digital Leadership – Prerequisite for Developing High-Tech Economy
Мiglena Temelkova .......................................................................................................................... 343
Market Leadership in Bulgaria Telecommunication Sector
Anna Otsetova, Georgi Georgiev, Dimitar Kolev, Gergana Dimcheva ............................................. 365
The stakeholderwide assessment of the impacts of accepted values of stochastic functions of project
implementation on their success
Nataliia Oberemok, Ivan Oberemok ................................................................................................. 389
Table of contents IJ ITA Vol. 25, No.:1 ................................................................................................. 397
Table of contents IJ ITA Vol. 25, No.:2 ................................................................................................. 398
Table of contents IJ ITA Vol. 25, No.:3 ................................................................................................. 399
Table of contents IJ ITA Vol. 25, No.:4 ................................................................................................. 400