Embed Size (px)
Citation preview
Issu
es P
aper
Ju
ly 2
011
International Freight Transport Services
ii Productivity Commission
The Productivity Commission aims to
provide insightful, well-informed and
accessible advice that leads to the best
possible improvement in the wellbeing
of New Zealanders. The Commission wishes
to gather ideas, opinions and information
to ensure that its inquiries are well-informed
and relevant. To this end, the Commission
invites submissions on the questions posed
in this issues paper and on any other matters
relevant to the inquiry’s Terms of Reference.
iInternational Freight Transport Services | Issues Paper
International Freight Transport ServicesIssues Paper – July 2011

ii Productivity Commission
The ProducTIvITy commIssIon
The New Zealand Productivity Commission is an independent Crown Entity. The Commission completes in-depth inquiry reports on topics selected by the Government, carries out productivity-related research that assists improvement in productivity over time, and promotes understanding in order to increase support for improving productivity. The Commission’s independence is underpinned by an Act of Parliament — the New Zealand Productivity Commission Act 2010. Its work is guided by its statutory purpose to improve the wellbeing of the community as a whole.
Information on the Productivity Commission can be found on www.productivity.govt.nz or by contacting +64 4 903 5150.
iiiInternational Freight Transport Services | Issues Paper
ContentsThe Issues Paper .................................................................................................................... iv
Key inquiry dates ...........................................................................................................ivInquiry contacts ..............................................................................................................ivWhy you should make a submission .............................................................................vHow to make a submission ............................................................................................vWhat the Commission will do with submissions ..........................................................v
1. What has the Commission been asked to do? .............................................................12. The Commission’s approach ............................................................................................2
2.1 Why inquire into international freight transport services? ................................... 22.2 An overall wellbeing perspective ........................................................................... 3
3. Context ...............................................................................................................................43.1 The importance of international freight ................................................................ 43.2 A framework for considering the issues ................................................................ 63.3 New Zealand’s international freight services ...................................................... 103.4 Freight economics ................................................................................................. 173.5 Regulation .............................................................................................................. 183.6 What affects logistics costs? ................................................................................. 19
4. Efficiency of individual components ............................................................................234.1 Ports........................................................................................................................ 244.2 Within-port activities ............................................................................................. 334.3 International sea freight ........................................................................................ 344.4 Airports ................................................................................................................... 384.5 International air freight ......................................................................................... 414.6 Biosecurity and customs ....................................................................................... 454.7 Domestic freight .................................................................................................... 484.8 Freight forwarding and consolidation ................................................................. 50
5. Efficiency of interfaces between components ...........................................................515.1 Common characteristics ....................................................................................... 515.2 Sea freight interfaces ............................................................................................ 535.3 Air freight interfaces .............................................................................................. 55
6. Efficiency of the logistics chain .....................................................................................566.1 Logistics performance ........................................................................................... 566.2 Sea freight logistics chain ..................................................................................... 586.3 Air freight logistics chain ...................................................................................... 606.4 Accessibility of services ......................................................................................... 616.5 Likely future trends in markets and technology .................................................. 616.6 Strategic planning ................................................................................................ 626.7 Logistics cost and productivity information ........................................................ 63
7. Next steps ........................................................................................................................647.1 Asking the right questions .................................................................................... 647.2 Submissions and next steps ................................................................................. 64
Appendix 1 – Terms of Reference ......................................................................................71Appendix 2 – Relevant legislation .....................................................................................73References ..............................................................................................................................75
Page
iv Productivity Commission
The Issues PaperThis issues paper is intended to assist individuals and organisations to prepare submissions to the inquiry into international freight transport services. It outlines the background to the inquiry and the matters about which the Commission is seeking comment and information.
This paper is not intended to limit comment. The Commission wishes to receive information and comment on any issues which participants consider relevant to the Terms of Reference.
Key InquIry dATes
Receipt of Terms of Reference: 1 April 2011
Issues paper submissions due: 31 August 2011
Release of draft report: December 2011
Draft report submissions due: February 2012
Final report to Government: 1 April 2012
InquIry conTAcTs
For further information about the inquiry please contact:
Inquiry contact details: T: +64 4 903 5167 [email protected]
Other matters: Geoff Lewis, Inquiry Director T: +64 4 903 5157 [email protected]
Commission website: www.productivity.govt.nz
Postal address for submissions: International Freight Transport Services inquiry New Zealand Productivity Commission Level 15, Fujitsu Tower 141 The Terrace PO Box 8036 Wellington 6143 New Zealand
vInternational Freight Transport Services | Issues Paper
Why you should mAKe A submIssIon
The Commission aims to provide insightful, well-informed and accessible advice that leads to the best possible improvement in the wellbeing of New Zealanders. It strives to be ‘in touch’ so advice is relevant, credible and workable in practice. In keeping with these principles, the Commission recognises the significant amount of existing research, knowledge and skills which will be relevant and beneficial to its work. The submission process is an important method that the Commission will use to gather ideas, opinions and information to ensure that inquiries are well-informed and relevant.
hoW To mAKe A submIssIon
Anyone can make a submission. A submission may take a number of forms, ranging from a short letter on a single issue to a much more substantial document covering a range of issues. Where possible, you should provide relevant facts, figures, data, examples and documentation to support your views. While every submission is welcome, multiple, identical submissions do not carry any more weight than the merits of an argument in a single submission. Submissions may incorporate material made available to other reviews or inquiries that are relevant to this inquiry.
The issues paper contains a number of specific questions. Please regard these as a guide only. In your submission you may answer as few or as many questions as you wish, and should feel free to identify and comment on any other issues relevant to the Terms of Reference.
Submissions may be made electronically (preferred) or by post. Electronic submissions should be in Microsoft Word or Adobe PDF format, and submitted via the form provided on the Commission’s website (www.productivity.govt.nz). Postal submissions should include your name and contact details, and the details of any organisation you represent. Where possible, an electronic copy of postal submissions should also be sent to [email protected]. In circumstances where the content of submissions is deemed inappropriate or defamatory, the Commission may choose not to accept particular submissions.
WhAT The commIssIon WIll do WITh submIssIons
Submissions will play an important role in shaping the nature and focus of this inquiry. Submissions will be used to gauge the position and preferences of relevant stakeholders with regards to aspects of the inquiry. Where relevant, such information, along with other evidence (such as facts, figures, data or examples) may be cited or used directly in the inquiry report. The Commission seeks to put as much information as possible on the public record. Submissions will become publicly available documents once placed on the Commission’s website. This will occur shortly after receipt of the submission. ‘In confidence’ material can be accepted only under special circumstances. You should contact the Commission before submitting such material.
vi Productivity Commission
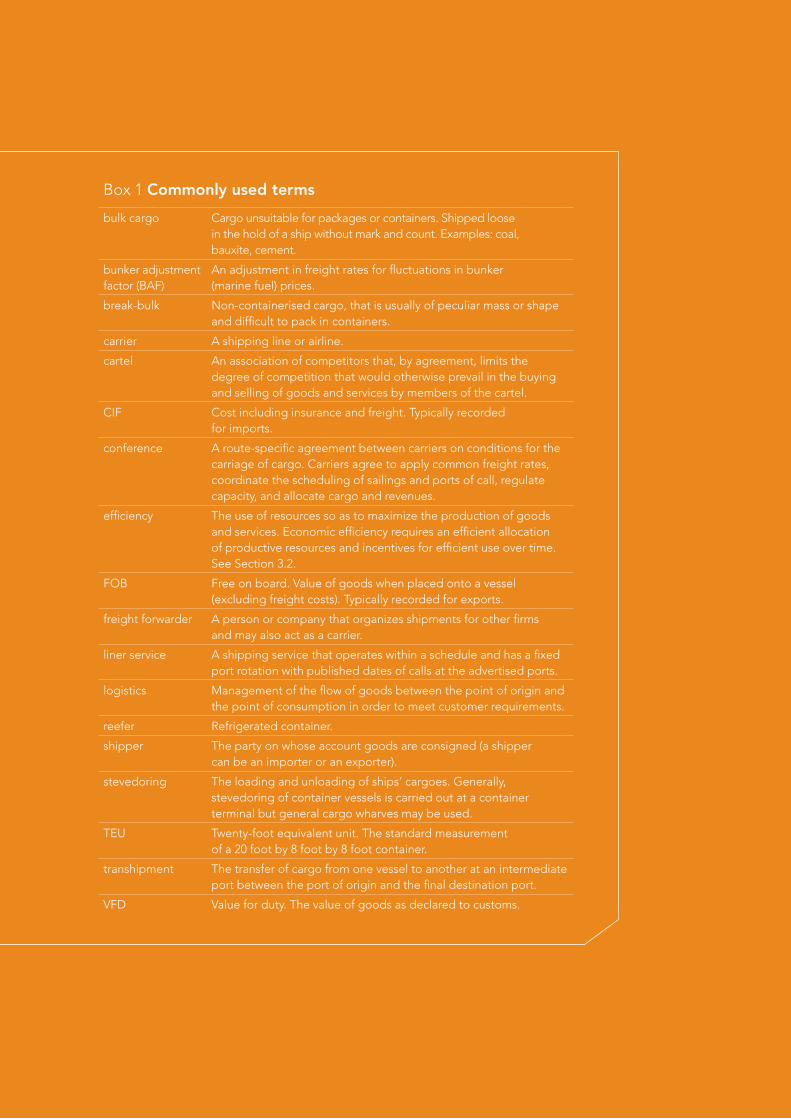
Box 1 commonly used terms
bulk cargo Cargo unsuitable for packages or containers. Shipped loose in the hold of a ship without mark and count. Examples: coal, bauxite, cement.
bunker adjustment factor (BAF)
An adjustment in freight rates for fluctuations in bunker (marine fuel) prices.
break-bulk Non-containerised cargo, that is usually of peculiar mass or shape and difficult to pack in containers.
carrier A shipping line or airline.
cartel An association of competitors that, by agreement, limits the degree of competition that would otherwise prevail in the buying and selling of goods and services by members of the cartel.
CIF Cost including insurance and freight. Typically recorded for imports.
conference A route-specific agreement between carriers on conditions for the carriage of cargo. Carriers agree to apply common freight rates, coordinate the scheduling of sailings and ports of call, regulate capacity, and allocate cargo and revenues.
efficiency The use of resources so as to maximize the production of goods and services. Economic efficiency requires an efficient allocation of productive resources and incentives for efficient use over time. See Section 3.2.
FOB Free on board. Value of goods when placed onto a vessel (excluding freight costs). Typically recorded for exports.
freight forwarder A person or company that organizes shipments for other firms and may also act as a carrier.
liner service A shipping service that operates within a schedule and has a fixed port rotation with published dates of calls at the advertised ports.
logistics Management of the flow of goods between the point of origin and the point of consumption in order to meet customer requirements.
reefer Refrigerated container.
shipper The party on whose account goods are consigned (a shipper can be an importer or an exporter).
stevedoring The loading and unloading of ships’ cargoes. Generally, stevedoring of container vessels is carried out at a container terminal but general cargo wharves may be used.
TEU Twenty-foot equivalent unit. The standard measurement of a 20 foot by 8 foot by 8 foot container.
transhipment The transfer of cargo from one vessel to another at an intermediate port between the port of origin and the final destination port.
VFD Value for duty. The value of goods as declared to customs.
1
1International Freight Transport Services | Issues Paper
What has the Commission been asked to do?The Government has asked the Productivity Commission to undertake an inquiry into international freight transport services. As set out in the Terms of Reference1, the key high-level questions for the inquiry are:
• what are the factors influencing the accessibility and efficiency of international freight transport services available to New Zealand firms; and
• are there opportunities for changes in New Zealand’s infrastructure and regulatory regimes that could increase the accessibility and efficiency of international freight transport services for New Zealand firms?
In answering these questions the Commission has been asked to pay particular attention to:
• the effects of New Zealand’s distance from overseas markets and reliance on overseas providers of international freight transport services;
• the costs, efficiency, productivity level and growth of all components of New Zealand’s international freight services supply chain, with international comparisons; and
• the effectiveness of current regulatory regimes (including those in the Civil Aviation Act 1990 and Shipping Act 1987) and the potential costs and benefits of alternative regulatory arrangements, with international comparisons.
To set the scene for the inquiry and to guide individuals and groups who would like to make submissions, the Commission has produced this issues paper. The Commission invites responses to the questions posed in this issues paper and to any other matters relevant to the Terms of Reference.
1 See Appendix 1 for the full Terms of Reference.
1
2 Productivity Commission
The Commission’s approach2.1 Why InquIre InTo InTernATIonAl
freIghT TrAnsPorT servIces?
Freight costs inhibit trade. They have the effect of increasing the price New Zealanders pay for imported goods and reducing the net price New Zealand exporters receive for the goods they export. A consequence of being relatively distant from other centres of economic activity is that increases in freight transport costs have a more severe impact on New Zealand than on more centrally-located countries.
In addition to the on-going importance of international freight to New Zealand, there are some more immediate considerations that make this inquiry timely:
• The regulatory settings in other countries for international freight services have changed in recent years with the aim of promoting competition and lowering the prices paid by firms that export and/or import freight (freight shippers). It is timely that New Zealand re-examine its regulatory settings in the light of these changes and international experience as to their efficacy.
• Recent cases of international air-freight cartels that set prices above competitive levels are a reminder that trade practices outside the country can have a domestic impact. Such cases raise questions as to whether New Zealand’s regulatory arrangements are sufficiently flexible to deal with cross-border issues.
• International freight volumes to and from New Zealand have risen significantly over recent decades. There is some evidence that the rate of productivity improvements achieved in the 1990s in these sectors levelled out in the 2000s. Ownership and regulatory settings for international freight gateways – ports and airports – have remained relatively static, inviting the question as to whether these arrangements remain fit for purpose.
• In 2008 oil prices rose to their highest level (in real terms) for nearly 30 years. Prices remain above their longer-term average and are generally expected to stay high for the foreseeable future. Since transport fuels are a significant component of the cost structure of air and sea transport services, improvements in the efficiency of freight services can help to mitigate the impact of fuel price rises.
• The size of ocean-going freight ships has increased significantly in recent years, partly to improve efficiency in response to increasing fuel prices. This trend is likely to continue. However, New Zealand’s port infrastructure and trade volumes may be unsuited to very large ships.
2
3International Freight Transport Services | Issues Paper
These recent and upcoming changes offer potential threats and opportunities for New Zealand trade. Perhaps the biggest of these is the importance of New Zealand becoming more closely integrated with the faster-growing parts of the world economy in order to raise productivity and income for future prosperity. This will not happen without healthy growth in trade (both exports and imports).
2.2 An overAll WellbeIng PersPecTIve
In keeping with the purpose set out in legislation, the Commission will examine international freight transport services from the perspective of improving productivity in a way that supports the overall wellbeing of New Zealanders. The Commission’s view is that, in the case of the subject of this inquiry, overall wellbeing is best served by promoting the economic efficiency of the logistics supply chain for New Zealand importers and exporters. Efficiency improvements should result in lower prices for imported goods and higher profits for exporting industries. Lower import prices directly benefit New Zealand consumers and firms, and higher returns for exporters are also likely to benefit employees through better wages and opportunities.
q1 Are there important issues that may be overlooked as a result of adopting an economic efficiency perspective for this inquiry?
4 Productivity Commission
Context3.1 The ImPorTAnce of InTernATIonAl freIghT
Freight costs are part and parcel of international trade. If international freight costs can be reduced then trade will be enhanced, the economy can be more productive and New Zealanders more prosperous.
While the rationale for trade is widely known, it is worth – for the purposes of a dedicated inquiry – setting out its importance and features:
• Trade enables economies of specialisation (improved productivity through concentrating on a narrow range of activities) and economies of scale (large up-front or fixed costs can be distributed over a larger volume of production). Moreover, a nation typically benefits from these economies when they occur in other countries because it can import goods and services from them at lower prices and/or higher quality.
• Trade allows access to resources and products that would otherwise be unavailable locally.
• Trade is an important channel that expands the range of technologies available to local firms and consumers.
• International trade is particularly relevant for a small and distant island nation such as New Zealand.
• International trade promotes productivity growth because competition with foreign firms spurs local firms to be more efficient and innovative.
Trade costs
New Zealand exporters will only be successful if either:
• the local cost of the goods exported plus trade costs are lower or equal in the destination market to the similarly-calculated costs of goods from competing sources; or
• the quality of their goods is sufficiently superior to outweigh any price disadvantage.
In either case trade costs directly impact the profitability of exporting industries, and if too high they may preclude a business from exporting at all. Where imported goods (e.g. farm machinery) are used in the production of goods for export, trade effects compound to lower exporter profitability even further.
An effect of inefficiently high trade costs on imports is that more resources may be allocated to import-competing domestic firms. Such firms benefit from the decreased competitiveness of imports, and are profitable at lower levels of productivity than would be required with lower trade costs. This inefficiency represents a cost to local consumers.
Trade costs include the direct costs of freight, but are much wider than that. Examples of additional costs include customs and biosecurity charges, tariffs and the financing costs of goods unavailable while in transit. One of the tasks of this inquiry is to identify all significant sources of trade costs.
3
5International Freight Transport Services | Issues Paper
Some trade costs (such as marketing and distribution in another country) apply to both physical and intangible goods. Intangible goods2 are those products and services which can be delivered to consumers without significant freight costs. As such, they are outside the scope of this inquiry, which concerns physical goods transported via sea and air.
logistics
From the perspective of an importer or exporter, the key issue is the costs of the total supply chain, rather than simply freight costs. Logistics – the term for this – is the process of efficiently moving goods from their point of production to their point of consumption in order to meet customer requirements, which typically include the quantity and quality of goods as well as the time and place of delivery. Freight is only one component of this logistics equation. Logistics management aims to meet customer requirements at minimum cost.
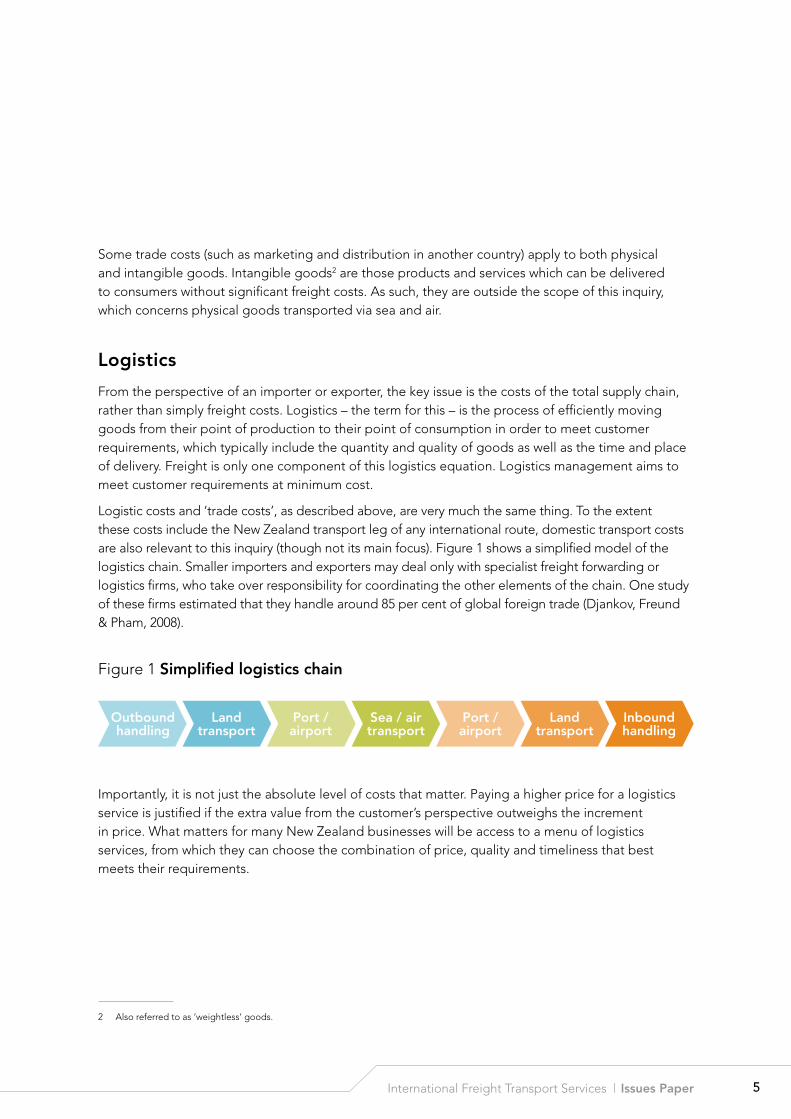
Logistic costs and ‘trade costs’, as described above, are very much the same thing. To the extent these costs include the New Zealand transport leg of any international route, domestic transport costs are also relevant to this inquiry (though not its main focus). Figure 1 shows a simplified model of the logistics chain. Smaller importers and exporters may deal only with specialist freight forwarding or logistics firms, who take over responsibility for coordinating the other elements of the chain. One study of these firms estimated that they handle around 85 per cent of global foreign trade (Djankov, Freund & Pham, 2008).
Figure 1 simplified logistics chain
Importantly, it is not just the absolute level of costs that matter. Paying a higher price for a logistics service is justified if the extra value from the customer’s perspective outweighs the increment in price. What matters for many New Zealand businesses will be access to a menu of logistics services, from which they can choose the combination of price, quality and timeliness that best meets their requirements.
2 Also referred to as ‘weightless’ goods.
outbound handling
land transport
Port / airport
sea / air transport
Port / airport
land transport
Inbound handling
6 Productivity Commission
economic geography
The field of economic geography considers the distribution of population, wealth and economic activity given the existence of trade costs. In general there are significant benefits to agglomeration: mobile economic activity is preferentially located near centres of consumer demand, enabling higher wages, fostering specialisation and attracting further labour and capital which reinforces these effects (Krugman, 1991).
Agglomeration forces create substantial challenges for small isolated economies (Redding & Venables, 2002; McCann, 2009). While New Zealand cannot match, as a general rule, the agglomeration benefits available in countries with larger populations, lowering trade costs may assist in meeting these challenges (Krugman & Venables, 1995). International evidence suggests that a 10 per cent reduction in transport costs could lead to a 1 to 2 per cent increase in trade3.
On the other hand, there are important economic activities that are effectively immobile – tied to specific locations because of natural resources such as mineral deposits, hydro-electric potential, tourist attractions and harbours. New Zealand’s key export industries of dairy, meat, wool and forestry are based on a climate-related natural advantage in growing grass and other plants. Here again, freight and other trade costs are critical because of the need to transport goods and services to and from the location of the natural resource.
3.2 A frAmeWorK for consIderIng The Issues
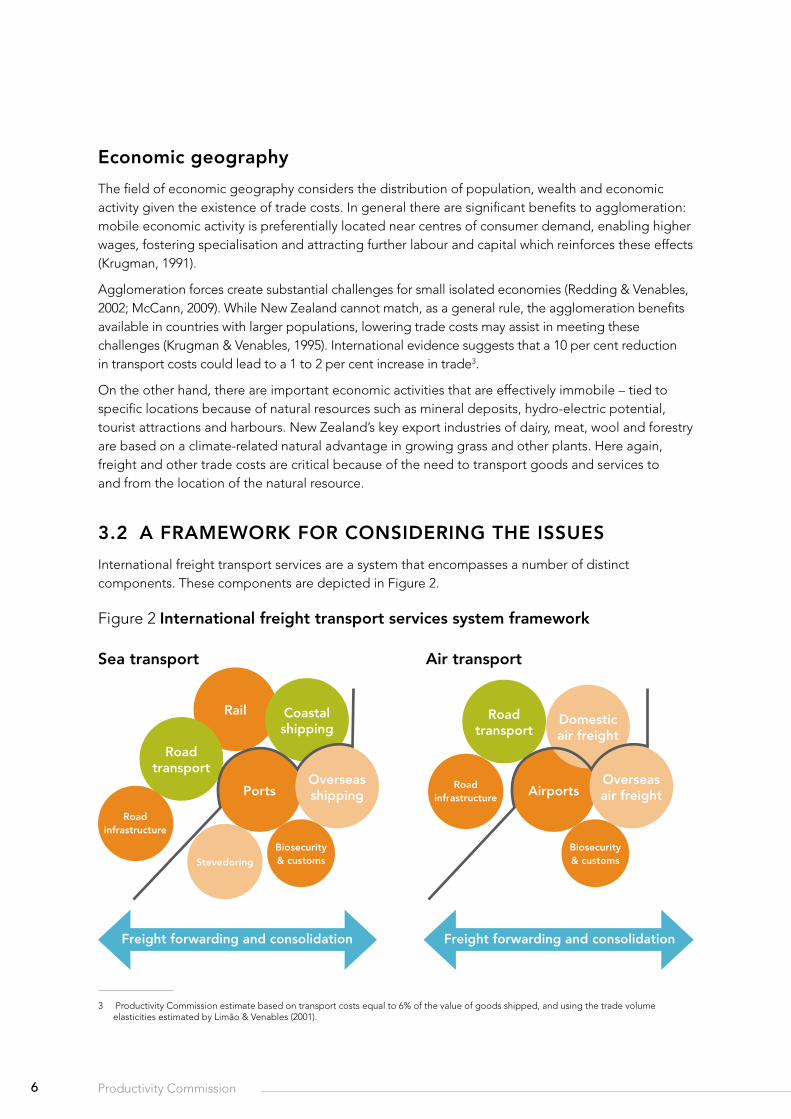
International freight transport services are a system that encompasses a number of distinct components. These components are depicted in Figure 2.
Figure 2 International freight transport services system framework
3 Productivity Commission estimate based on transport costs equal to 6% of the value of goods shipped, and using the trade volume elasticities estimated by Limão & Venables (2001).
Ports
rail
road transport
coastal shipping
overseas shipping
road infrastructure
stevedoring
biosecurity & customs
sea transport
freight forwarding and consolidation
Air transport
Airports
road transport
domestic air freight
overseas air freight
road infrastructure
biosecurity & customs
freight forwarding and consolidation
7International Freight Transport Services | Issues Paper
In the diagram, adjacent circles indicate a logistics interface between components; in essence a handover point. An overlap between two circles indicates that, in addition to a point of interface, some competition exists between those components. For example, rail sometimes competes with road and coastal shipping transport; but at other times it connects with them as part of an overall logistics chain.
The circles are coloured to reflect an assignment of components into those with natural monopoly characteristics (orange), those with the characteristics of competitive industries (green), and those that have the potential to be competitive (light orange) but where competition may be limited4.
The black line represents the boundary between the main focus of the Terms of Reference (the specifically international components to the right of the line), and other directly relevant components.
Freight forwarders interact with all other components and are shown spanning them. While not depicted in the diagram, it is noted that air and sea are alternative international freight modes. Thus, to some extent, ports compete with airports and international sea-freight services compete with air-freight services.
efficiency
The Commission’s approach for this inquiry is to evaluate the economic efficiency of international freight transport services (Box 2).
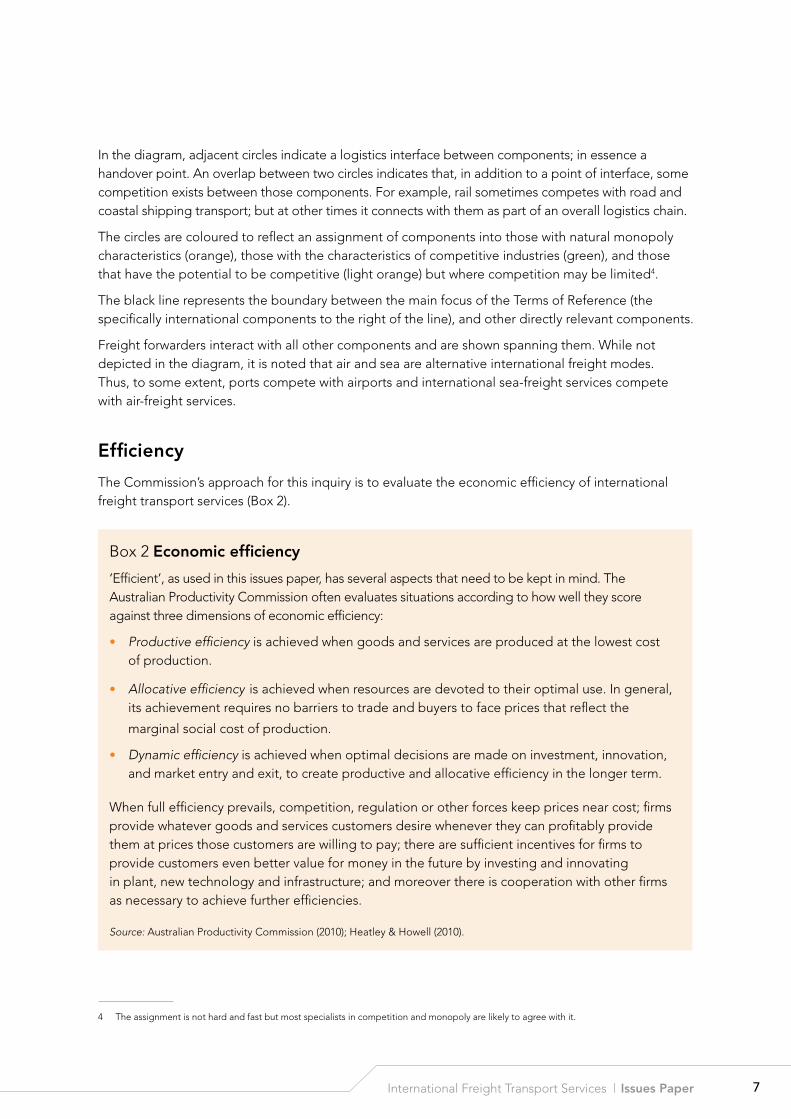
Box 2 economic efficiency
‘Efficient’, as used in this issues paper, has several aspects that need to be kept in mind. The Australian Productivity Commission often evaluates situations according to how well they score against three dimensions of economic efficiency:
• Productive efficiency is achieved when goods and services are produced at the lowest cost of production.
• Allocative efficiency is achieved when resources are devoted to their optimal use. In general, its achievement requires no barriers to trade and buyers to face prices that reflect the
marginal social cost of production.
• Dynamic efficiency is achieved when optimal decisions are made on investment, innovation, and market entry and exit, to create productive and allocative efficiency in the longer term.
When full efficiency prevails, competition, regulation or other forces keep prices near cost; firms provide whatever goods and services customers desire whenever they can profitably provide them at prices those customers are willing to pay; there are sufficient incentives for firms to provide customers even better value for money in the future by investing and innovating in plant, new technology and infrastructure; and moreover there is cooperation with other firms as necessary to achieve further efficiencies.
Source: Australian Productivity Commission (2010); Heatley & Howell (2010).
4 The assignment is not hard and fast but most specialists in competition and monopoly are likely to agree with it.
8 Productivity Commission
In many industries, competitive forces drive firms towards efficient outcomes. In some cases, however, a market may not be competitive because it has few sellers or, for some other reason, sellers are able to ‘collude’, i.e. coordinate their actions to raise prices above their costs. If this sort of market power exists along the international freight routes that serve New Zealand, it could mean New Zealand firms face inefficiently high prices and/or poor services.
Factors such as high fixed costs, barriers to competitive entry, and network effects5 can also impair competition, making it more difficult to achieve efficiency. As these factors commonly occur in transport industries, it is typical for governments to play a significant regulatory role.
Given the framework in Figure 2, economic efficiency can be investigated from three different perspectives:
1. Are the individual components efficient?
2. Are the interfaces between components efficient?
3. Is the freight system efficient when viewed as a whole?
Perspective one: efficiency of individual components
For each component, efficiency is enhanced by maximising competition between firms, or through other mechanisms to substitute for competition where natural monopoly or network characteristics impair or limit competition.
Perspective two: efficiency at the interface between components
It is possible for two component industries to each be efficient, but to be inefficient in their interaction. Typically firms both cooperate and compete at component interfaces. Cooperation – via the exchange of information and contractual linkages – can lead to operational efficiencies and the coordination of investment required for dynamic efficiency. The firms may simultaneously compete: both for available profits (through bargaining over prices) and for business (to the extent that they are able to offer substitute products).
Perspective three: efficiency of the whole logistics chain
From the perspective of the freight chain user, it is the efficiency of the overall system that matters. For example the way that air freight efficiently interfaces with airports has to fit with the way that airports in turn interface with road transport and infrastructure. Users are affected by the price and performance of the system as a whole rather than its components.
Having each component and each interface individually efficient helps but is not a guarantee of efficient outcomes at the system level.
5 A network effect is the effect that one user of a good or service has on the value of that product to other users or potential users.
9International Freight Transport Services | Issues Paper
Many potential opportunities for efficiency improvements in international freight logistics are based on increased cooperation across components. The challenge is to ensure that the overall institutional and regulatory arrangements prompt decision makers in the various components to undertake the right combination of cooperation and competition to give the biggest overall gain for exporters and importers.
q2 Is the framework described in Section 3.2 appropriate for this inquiry? Are there any important issues that might be missed?
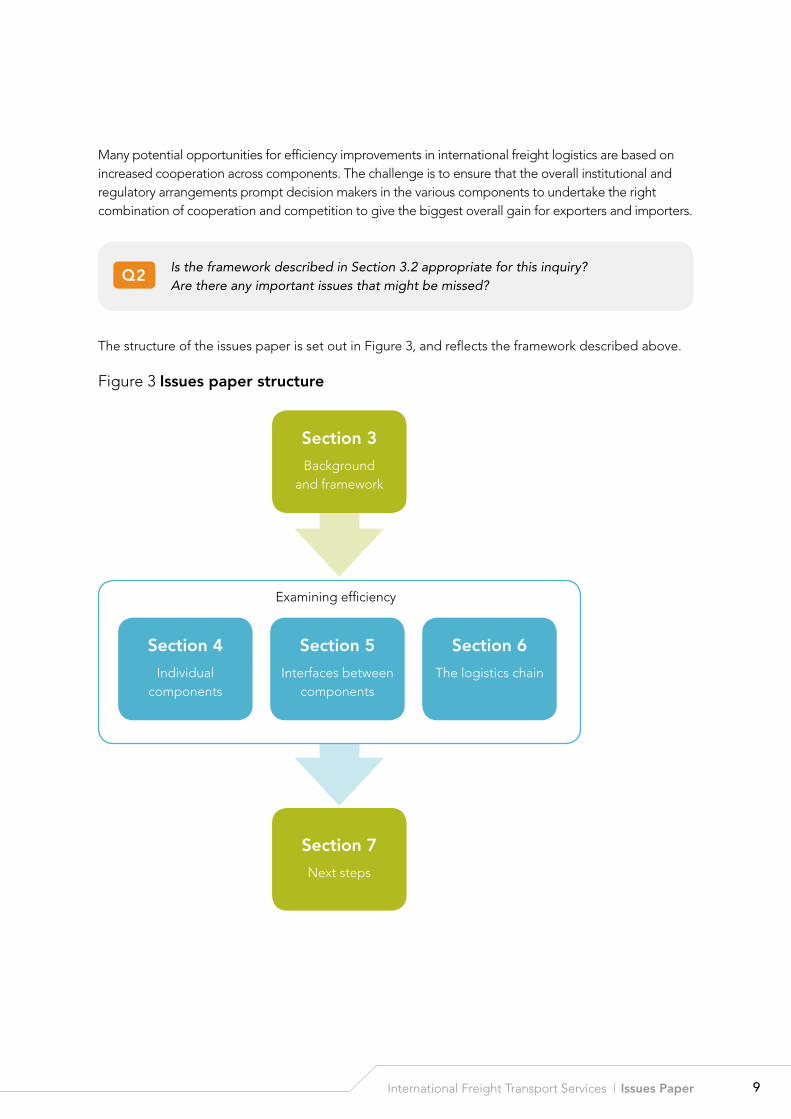
The structure of the issues paper is set out in Figure 3, and reflects the framework described above.
Figure 3 Issues paper structure
Examining efficiency
section 4
Individual components
section 7
Next steps
section 5
Interfaces between components
section 6
The logistics chain
section 3
Background and framework
10 Productivity Commission
Prioritising the inquiry’s efforts
The Australian Productivity Commission has conducted ten separate inquiries over the last 20 years into seven components of the overall international freight transport system in Australia6. This indicates the relatively wide scope of this inquiry and the need for some prioritisation.
The Commission’s general approach will be to focus on components and interfaces where the potential gains from changing the status quo are highest relative to the costs that are likely to be incurred. For example, if perspective one applied to a particular component indicates a healthy state of competition, then there are already likely to be efficient outcomes in that component.
Conversely the components that more commonly fall short of their efficiency potential are those in which competition fails to work well for one reason or another. The Commission is therefore inclined to give relatively more attention to these components – the oranges and the light oranges in Figure 2 – especially those components lying to the right of the black line.
q3 Which components and component interfaces warrant greater attention? What is the evidence that they are inefficient? What contribution could changes make to an improvement in the overall efficiency of the freight system?
3.3 neW ZeAlAnd’s InTernATIonAl freIghT servIces
The remoteness ‘problem’
As a small, remote economy, New Zealand faces a ‘long, thin routes’ problem. Small trade volumes mean that transport services are relatively infrequent, requiring shipments to wait longer for the next available ship or aircraft than would be the case in less remote or larger countries. These delays are additional to the longer transit times implied by greater distance from markets.
New Zealand is the most remote advanced economy in the world in terms of average distance from economic activity (Ewing & Battersby, 2005). While this could be interpreted as grounds for pessimism, average distance does not tell the whole story. For example, the following factors act in New Zealand’s favour:
• New Zealand is a coastal nation, every part of which is close (by world standards) to natural ports. As average land transport costs per unit distance are around seven times those of sea transport (Limão & Venables, 2001), coastal countries are significantly advantaged in trade relative to landlocked nations (Redding & Venables, 2002).
• Trade costs do not increase linearly with distance. Some costs are fixed (relative to distance), for example customs and biosecurity charges. Transport costs per tonne shipped taper with distance – a doubling of distance leads to only a 41 per cent increase in costs (McCann, 2001).
• New Zealand is relatively unaffected by problems of corruption and imperfect contract enforcement (World Bank, 2010) that can dramatically reduce international trade (Anderson & Marcouiller, 2002). For example, New Zealand meets world-best-practice benchmarks in biosecurity functions and this helps establish a premium reputation for its food exports.
6 These inquiries were: International Liner Cargo Shipping (1999 and 2005), Airport Services (2002 and 2007), Road and Rail Freight Infrastructure (2007), Harbour Towage (2003), Rail Transport (1991 and 2000), International Air Services (1999), and Port Authorities (1993).
11International Freight Transport Services | Issues Paper
characteristics of new Zealand’s trade
New Zealand’s international freight connections are largely concentrated in the northern half of the North Island. However, the South Island contributes a significant proportion of exports. The market shares of seaports and airports are detailed in Sections 4.1 and 4.4 respectively.
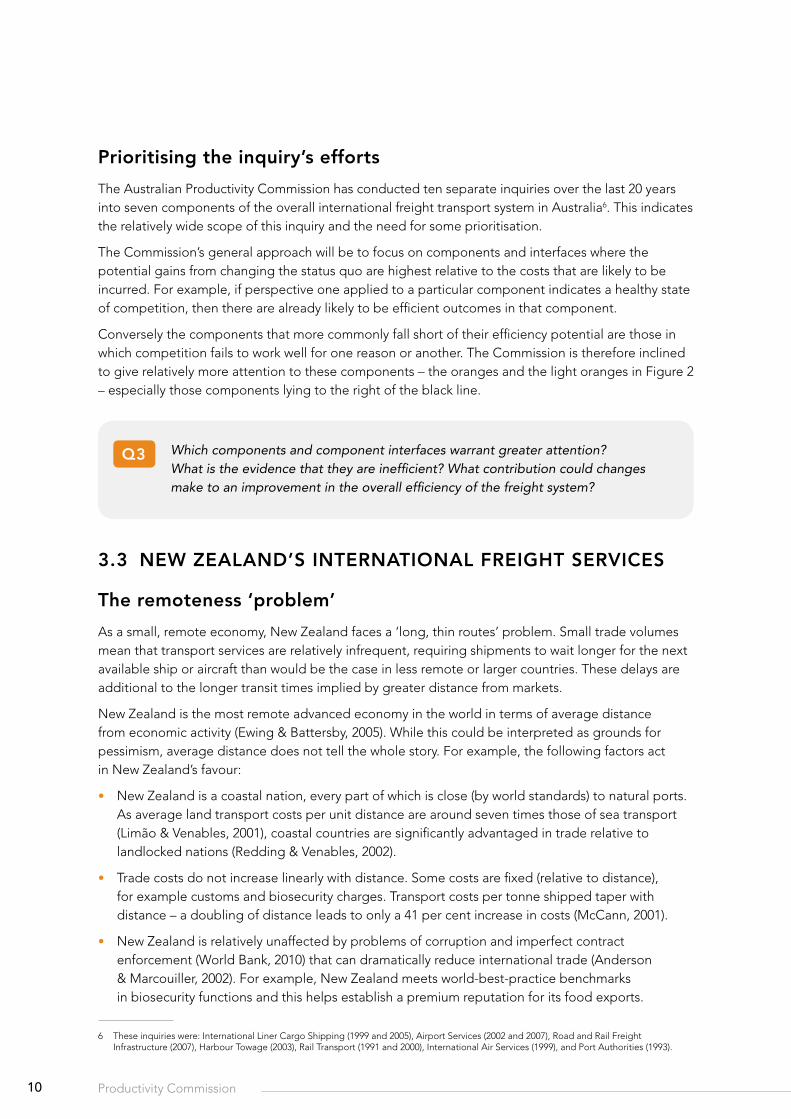
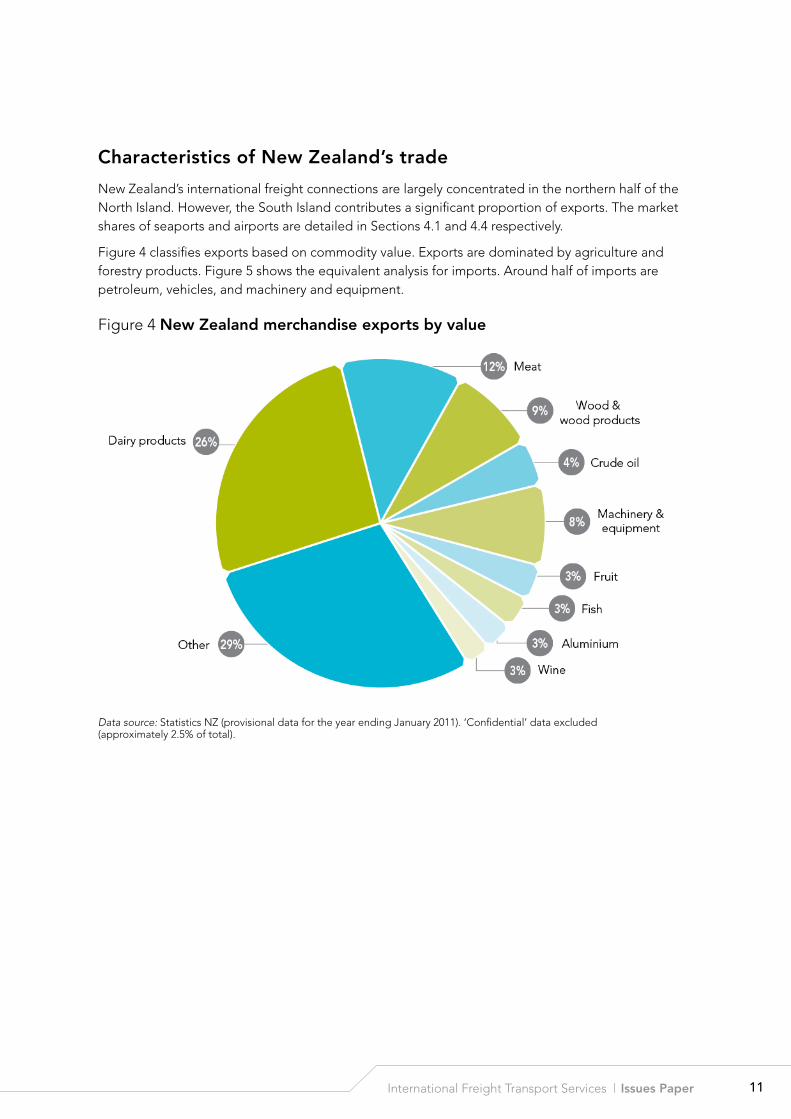
Figure 4 classifies exports based on commodity value. Exports are dominated by agriculture and forestry products. Figure 5 shows the equivalent analysis for imports. Around half of imports are petroleum, vehicles, and machinery and equipment.
Figure 4 new Zealand merchandise exports by value
Data source: Statistics NZ (provisional data for the year ending January 2011). ‘Confidential’ data excluded (approximately 2.5% of total).
12 Productivity Commission
Figure 5 new Zealand merchandise imports by value
Data source: Statistics NZ (provisional data year ending January 2011). ‘Confidential’ data excluded (approximately 0.7% of total).
International commercial cargo ships make around 3300 calls per year at New Zealand ports (Rockpoint, 2009). These ships can be classified as container, general cargo (break-bulk) and bulk carriers. Approximately 27 per cent of imports and exports (by weight) are shipped in containers7, with much of the remainder shipped in bulk carriers designed or configured for specific cargos (e.g. oil, logs, bauxite, iron sands).
Far more containers leave New Zealand full of exports than are needed for imports. This imbalance between containerised exports and imports at New Zealand ports creates extra costs within New Zealand’s supply chain. This issue is discussed in Section 6.2.
One significant characteristic of New Zealand trade is the high proportion of refrigerated exports; indeed 28 per cent of (full) containers exported are refrigerated (Cubic, 2009).
Given the dominance of some specific products in exports, and the dominance of some exporting firms (e.g. Fonterra in dairy production), it can be expected that the logistics decisions made by the largest firms will have significant impacts on the configuration of logistics chains. Specific impacts on other shippers could be either positive or negative, depending on circumstances.
7 Productivity Commission estimate using Statistics New Zealand 2008 trade data; container totals from Cubic (2009); and an assumed average net weight of 10 tonnes per TEU as estimated in Rockpoint (2009)
13International Freight Transport Services | Issues Paper
Trends
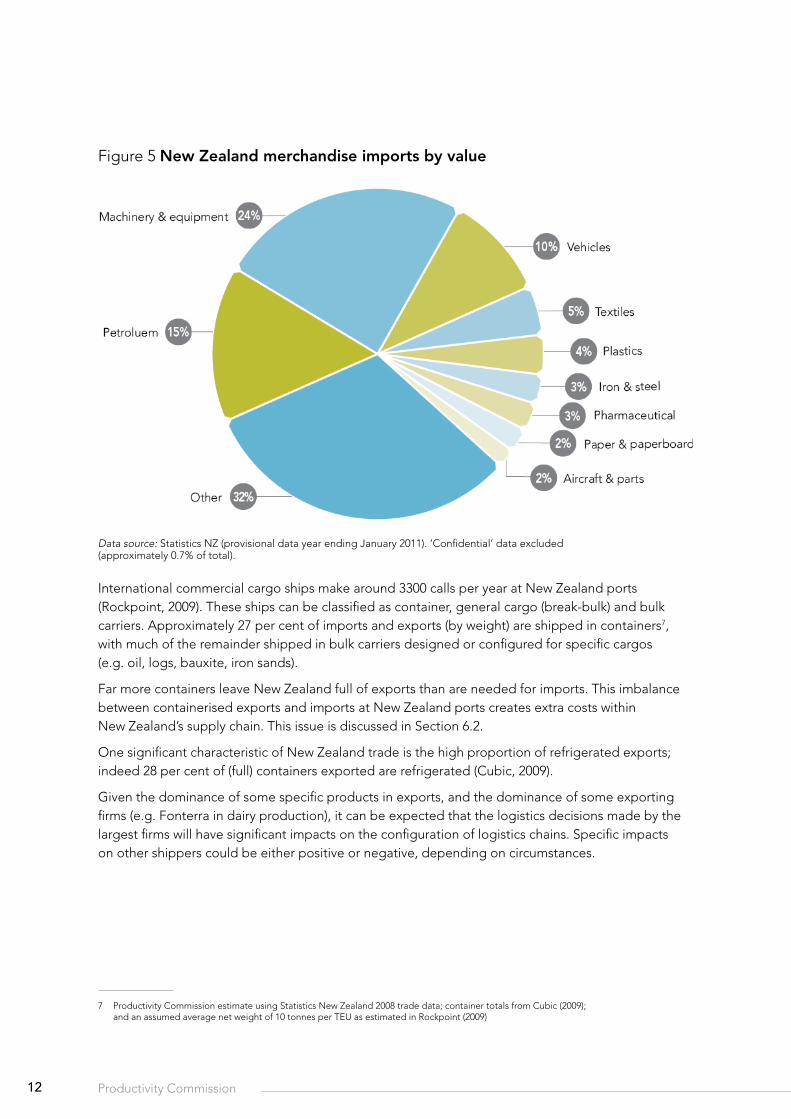
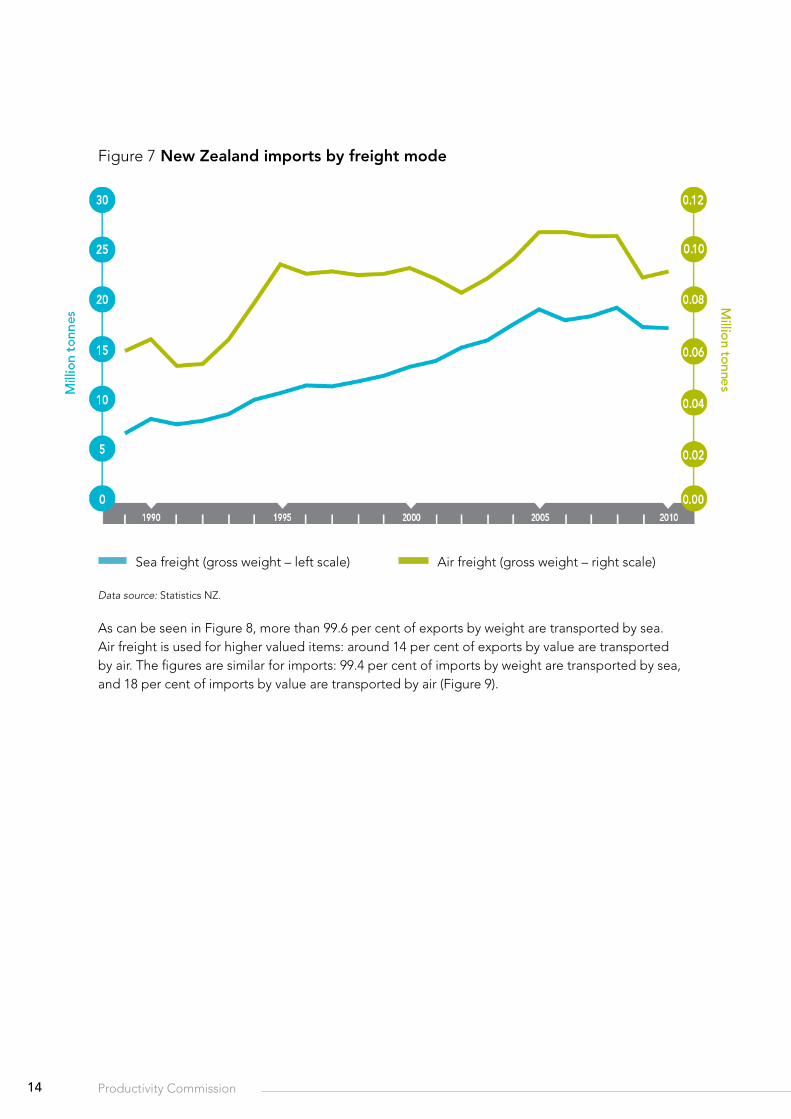
The past two decades have seen a substantial increase in the amount of trade. Sea freight exports have nearly tripled in weight over this period, while air freight exports have increased by approximately two-thirds (Figure 6). Imports have also increased, though not as dramatically (Figure 7).
Figure 6 new Zealand exports by freight mode
Source: Statistics NZ.
Air freight (gross weight – right scale)Sea freight (gross weight – left scale)
14 Productivity Commission
Figure 7 new Zealand imports by freight mode
Data source: Statistics NZ.
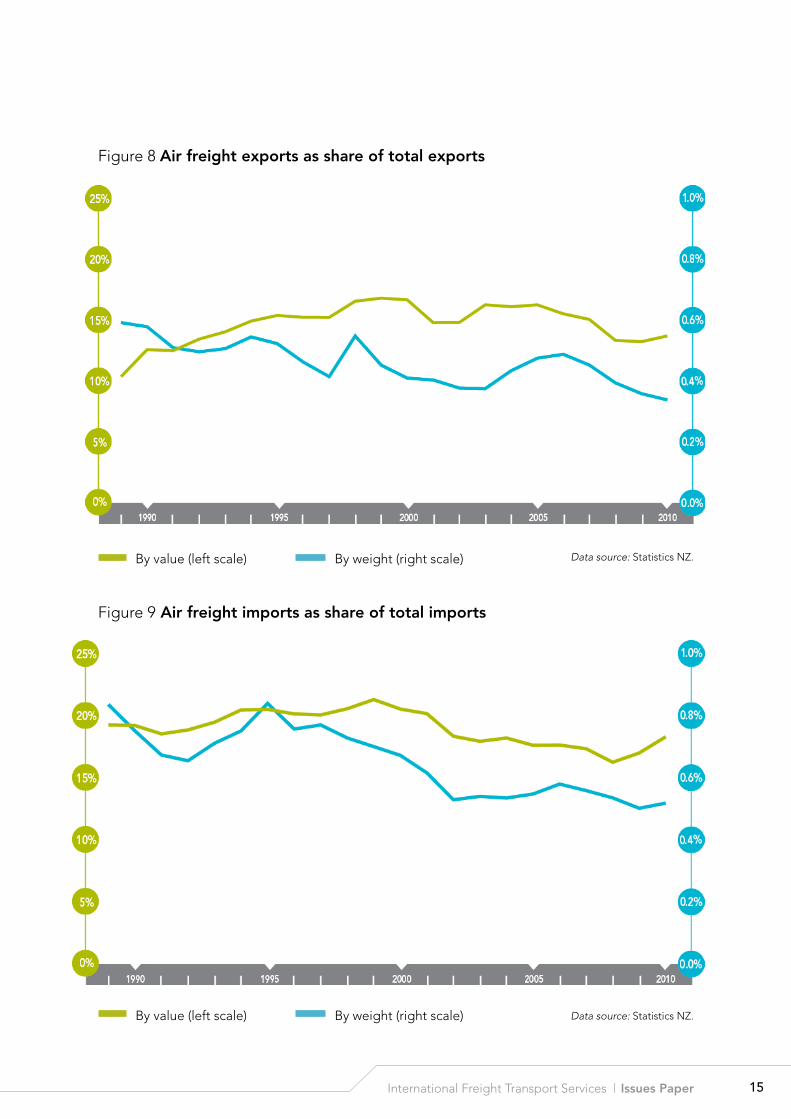
As can be seen in Figure 8, more than 99.6 per cent of exports by weight are transported by sea. Air freight is used for higher valued items: around 14 per cent of exports by value are transported by air. The figures are similar for imports: 99.4 per cent of imports by weight are transported by sea, and 18 per cent of imports by value are transported by air (Figure 9).
Air freight (gross weight – right scale)Sea freight (gross weight – left scale)
15International Freight Transport Services | Issues Paper
Figure 8 Air freight exports as share of total exports
Data source: Statistics NZ.
Figure 9 Air freight imports as share of total imports
Data source: Statistics NZ. By weight (right scale)By value (left scale)
By weight (right scale)By value (left scale)
16 Productivity Commission
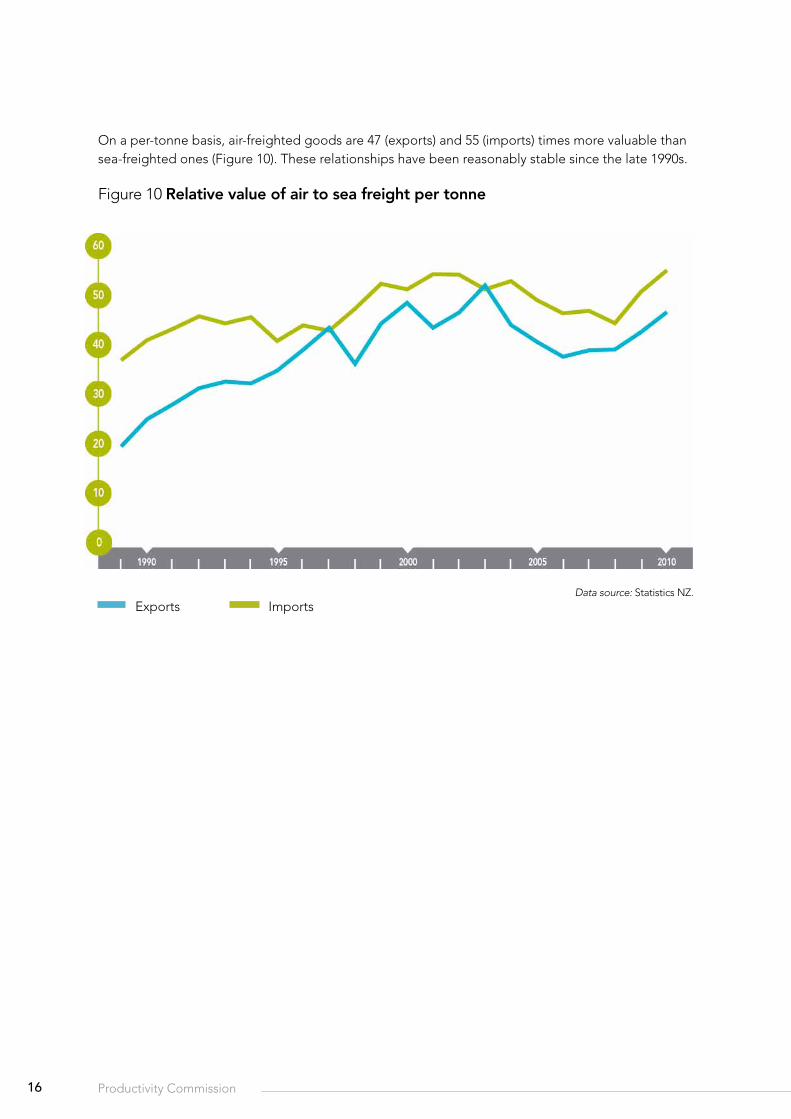
On a per-tonne basis, air-freighted goods are 47 (exports) and 55 (imports) times more valuable than sea-freighted ones (Figure 10). These relationships have been reasonably stable since the late 1990s.
Figure 10 relative value of air to sea freight per tonne
Data source: Statistics NZ.
ImportsExports
17International Freight Transport Services | Issues Paper
3.4 freIghT economIcs
An important feature of transport networks is the nature of their capital requirements. Planes and ships – and the airports and ports that service them – are very expensive items. Furthermore they are inherently ‘lumpy’ – half of a ship or an airport is of little practical use. The requirement for large, lumpy investments means that not all services can be efficiently provided (e.g. services with low volume).
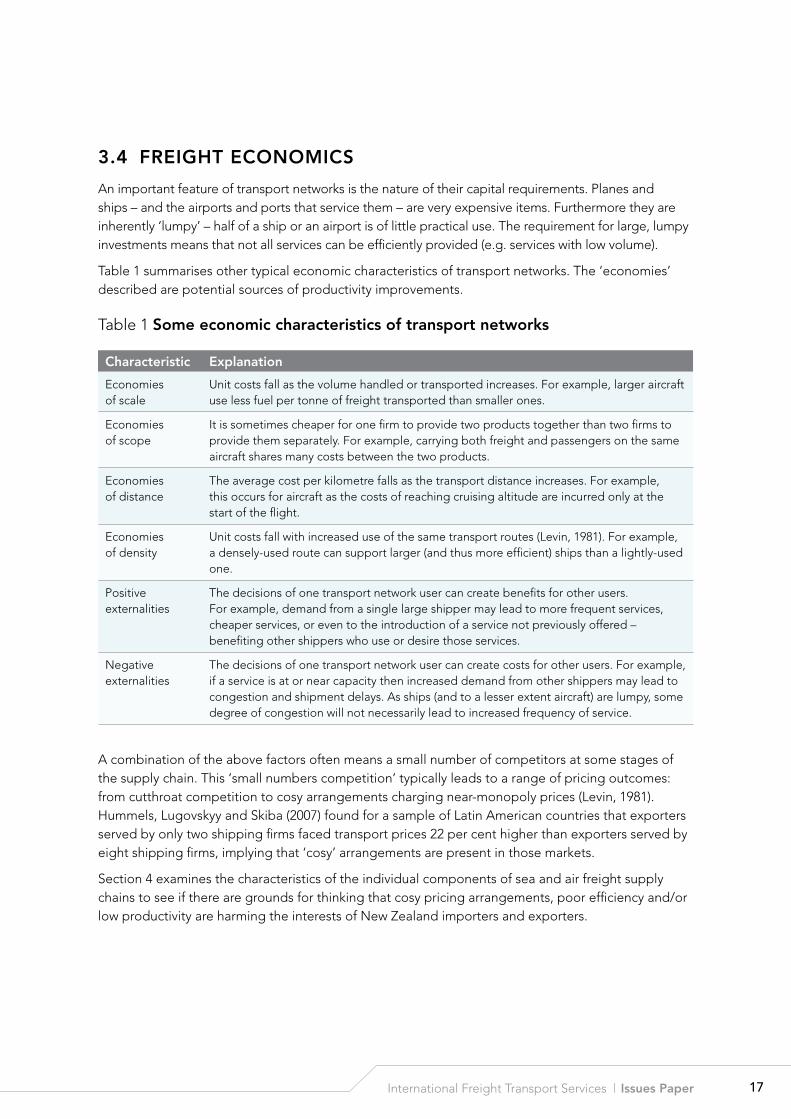
Table 1 summarises other typical economic characteristics of transport networks. The ‘economies’ described are potential sources of productivity improvements.
Table 1 some economic characteristics of transport networks
characteristic explanation
Economies of scale
Unit costs fall as the volume handled or transported increases. For example, larger aircraft use less fuel per tonne of freight transported than smaller ones.
Economies of scope
It is sometimes cheaper for one firm to provide two products together than two firms to provide them separately. For example, carrying both freight and passengers on the same aircraft shares many costs between the two products.
Economies of distance
The average cost per kilometre falls as the transport distance increases. For example, this occurs for aircraft as the costs of reaching cruising altitude are incurred only at the start of the flight.
Economies of density
Unit costs fall with increased use of the same transport routes (Levin, 1981). For example, a densely-used route can support larger (and thus more efficient) ships than a lightly-used one.
Positive externalities
The decisions of one transport network user can create benefits for other users. For example, demand from a single large shipper may lead to more frequent services, cheaper services, or even to the introduction of a service not previously offered – benefiting other shippers who use or desire those services.
Negative externalities
The decisions of one transport network user can create costs for other users. For example, if a service is at or near capacity then increased demand from other shippers may lead to congestion and shipment delays. As ships (and to a lesser extent aircraft) are lumpy, some degree of congestion will not necessarily lead to increased frequency of service.
A combination of the above factors often means a small number of competitors at some stages of the supply chain. This ‘small numbers competition’ typically leads to a range of pricing outcomes: from cutthroat competition to cosy arrangements charging near-monopoly prices (Levin, 1981). Hummels, Lugovskyy and Skiba (2007) found for a sample of Latin American countries that exporters served by only two shipping firms faced transport prices 22 per cent higher than exporters served by eight shipping firms, implying that ‘cosy’ arrangements are present in those markets.
Section 4 examines the characteristics of the individual components of sea and air freight supply chains to see if there are grounds for thinking that cosy pricing arrangements, poor efficiency and/or low productivity are harming the interests of New Zealand importers and exporters.
18 Productivity Commission
environmental costs
Freight transport is fuel-intensive, and transport infrastructure competes with other uses and amenities provided by land. If environmental costs are incorporated in input prices (e.g. carbon costs via the New Zealand Emissions Trading System), then individual decision makers seeking to lower their own costs should also lower environmental costs. Under these circumstances, an economically-efficient outcome should also be environmentally efficient: reflecting the lowest-cost balance between the relative value to society of environmental benefits and freight transport services. The quest for improved productivity – increased output for the same inputs – is entirely compatible with environmental considerations.
Problems can be expected when prices do not adequately reflect environmental costs. One obvious anomaly is that the transport fuels used for domestic transport in New Zealand incur a carbon charge through the Emissions Trading System, whereas the fuels used for international shipping and aviation do not.
q4 What environmental considerations should fall within the scope of this inquiry? What issues are of particular importance?
3.5 regulATIon
International airports, ports, airlines and shipping lines are all subject to industry-specific regulation in New Zealand. These regimes have arisen over time in response to the particular history and characteristics of these industries.
A common regulatory issue in transportation is getting the right balance between coordination and competition. A single transport operator is in the best position to coordinate actions so as to optimise technical performance of the supply chain: minimising unused space, finding the optimum trade-off between ship/aircraft size and frequency of service, and allocating investment where the largest gains are to be found. However a single operator faces no competition, thus it could also be expected to charge higher prices and invest less in cost reduction, improved service and new technology.
On the other hand, when there are multiple competing operators, each has an incentive to improve services, reduce costs and lower prices to customers. However effective competition needs limits on firms cooperating and coordinating their actions. Without such limits, a group of firms could be tempted to collude to restrict output and raise prices to the detriment of customers.
The challenge, from a regulatory perspective, is to implement rules and mechanisms that offer the best balance between competition and coordination.
Shipping conferences, airline code sharing and similar schemes arose historically as mechanisms that attempted to strike this balance. For freight customers, these schemes potentially offer:
• increased frequency of service (freight can be shipped on the next available service);
• published rates (carriers cannot opportunistically charge a higher than normal price knowing the customer has no alternative); and
• reduced costs (shipping firms and airlines can better utilise capacity).
19International Freight Transport Services | Issues Paper
On the other hand, conferences and code sharing can be a means for competitors to collude by sharing information and using their market power to the detriment of customers, for example by raising prices above their competitive level.
The main responsibility in New Zealand for scrutinising businesses to ensure that they do not exercise damaging market power lies with the Commerce Commission. The Commerce Act 1986 specifies a standard set of competition provisions. However, there are regulatory exemptions in the Commerce Act8 and Shipping Act 1987 for international sea freight, and the Civil Aviation Act 1990 provides a non-standard process to consider regulatory exemptions for international air freight. Exemptions from normal competition rules for sea and air freight services are common to a number of countries, but this does not make them necessarily right or wrong.
The specific regulatory regimes for component industries are discussed below: ports (Section 4.1), shipping lines (Section 4.3), international airports (Section 4.4) and airlines (Section 4.5).
3.6 WhAT AffecTs logIsTIcs cosTs?
Transport costs for New Zealand exporters and importers vary according to the product and a range of other factors. On average, transport and freight insurance costs amount to 5.9 per cent of freight value for a New Zealand importer9. Data are lacking to estimate an equivalent figure for exports, but it is likely to be similar10.
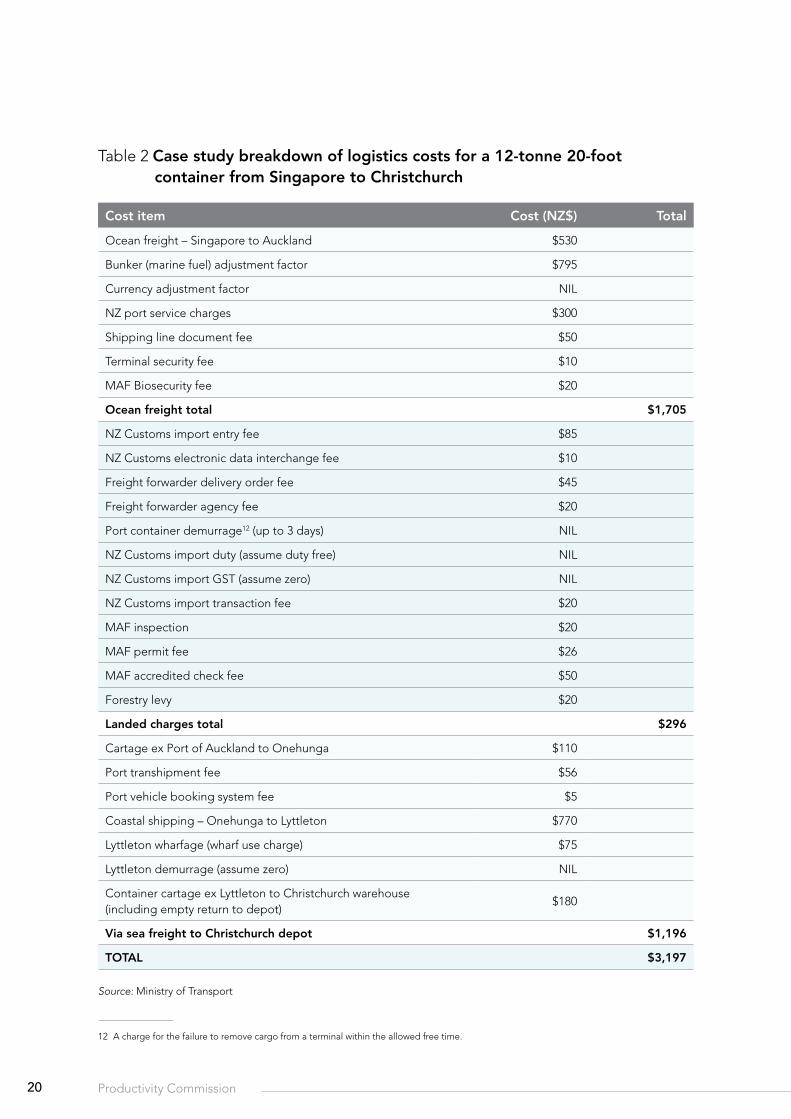
As noted previously, transport is only one component of the overall international supply chain. Other components such as port charges, warehousing and customs and biosecurity charges add to the overall logistics costs of exporters and importers. Table 2 shows the breakdown for a 2008 case study of the import of a single container from Singapore to Auckland. Of note is the significant proportion of total cost associated with the domestic transport leg11. Also evident are the large number of individual charges imposed by New Zealand customs and biosecurity. While this case study is only one example of the relative costs of different parts of the logistics chain, it does illustrate where costs occur and their order of magnitude.
8 Please refer to Appendix 2 for relevant sections of the Commerce Act and other legislation.9 Costs of transport and insurance (CIF-VFD) as a proportion of the purchase price of the goods (VFD). Transport costs are typically much
larger than insurance. Productivity Commission estimate based on preliminary Statistics NZ data for the 12 months ending January 2011.10 Available evidence for sea freight at a commodity level suggests that for trans-Tasman freight, the ratio of transport cost to freight value
for exports is similar to that for imports. This relationship does not hold for trade with the US, where exports appear to attract significantly lower relative transport costs than do imports (MOT, 2010b). The data are therefore insufficient to draw an overall conclusion.
11 The domestic-leg costs would have been higher had rail or road transport been chosen. See Section 4.7.
20 Productivity Commission
Table 2 case study breakdown of logistics costs for a 12-tonne 20-foot container from singapore to christchurch
cost item cost (nZ$) Total
Ocean freight – Singapore to Auckland $530
Bunker (marine fuel) adjustment factor $795
Currency adjustment factor NIL
NZ port service charges $300
Shipping line document fee $50
Terminal security fee $10
MAF Biosecurity fee $20
ocean freight total $1,705
NZ Customs import entry fee $85
NZ Customs electronic data interchange fee $10
Freight forwarder delivery order fee $45
Freight forwarder agency fee $20
Port container demurrage12 (up to 3 days) NIL
NZ Customs import duty (assume duty free) NIL
NZ Customs import GST (assume zero) NIL
NZ Customs import transaction fee $20
MAF inspection $20
MAF permit fee $26
MAF accredited check fee $50
Forestry levy $20
landed charges total $296
Cartage ex Port of Auckland to Onehunga $110
Port transhipment fee $56
Port vehicle booking system fee $5
Coastal shipping – Onehunga to Lyttleton $770
Lyttleton wharfage (wharf use charge) $75
Lyttleton demurrage (assume zero) NIL
Container cartage ex Lyttleton to Christchurch warehouse (including empty return to depot)
$180
via sea freight to christchurch depot $1,196
ToTAl $3,197
Source: Ministry of Transport12
12 A charge for the failure to remove cargo from a terminal within the allowed free time.
21International Freight Transport Services | Issues Paper
Transport fuel costs
Oil-based transport fuels make a significant contribution to the overall cost of freight transport. Fuel represents at least 50 per cent of total ship operation costs, and around 30 per cent of total shipping costs (Notteboom & Vernimmen, 2009). In the case of airlines, fuel costs rose to nearly 30 per cent of operating expenses in 2008 (Hummels, 2009). The fuel-cost share of New Zealand road and rail transport was around 14 per cent of operating expenses in 2007 (Heatley, 2009).
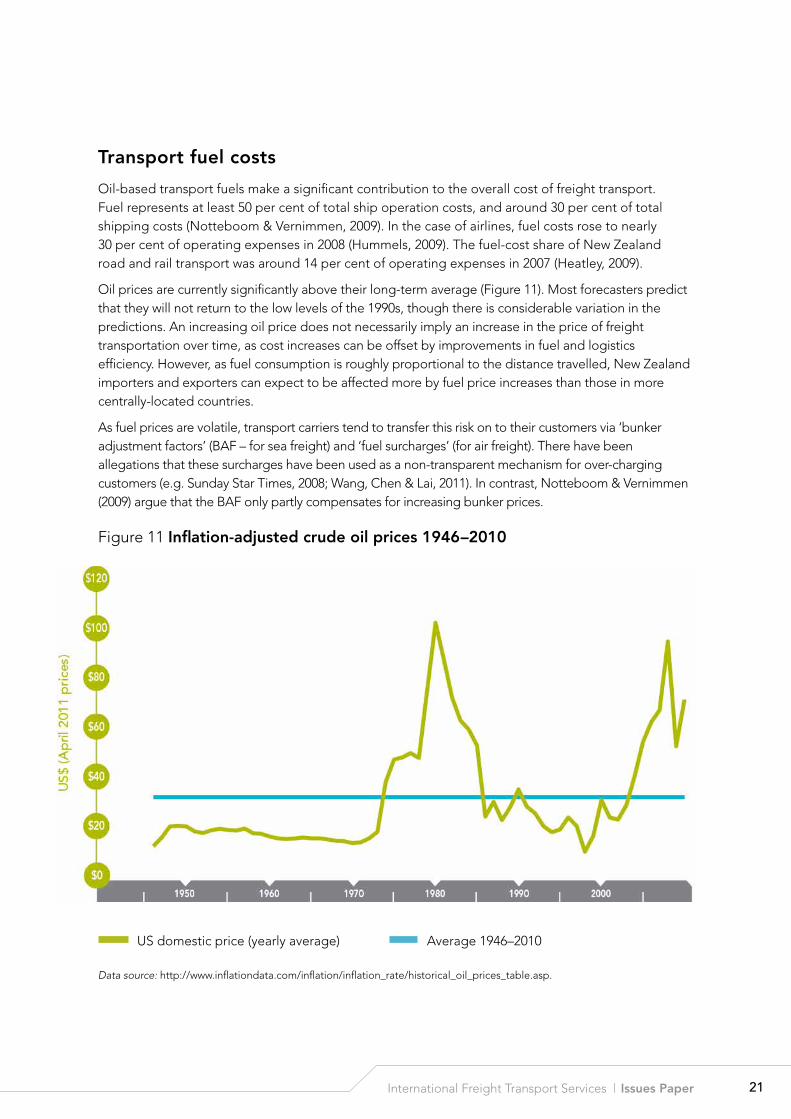
Oil prices are currently significantly above their long-term average (Figure 11). Most forecasters predict that they will not return to the low levels of the 1990s, though there is considerable variation in the predictions. An increasing oil price does not necessarily imply an increase in the price of freight transportation over time, as cost increases can be offset by improvements in fuel and logistics efficiency. However, as fuel consumption is roughly proportional to the distance travelled, New Zealand importers and exporters can expect to be affected more by fuel price increases than those in more centrally-located countries.
As fuel prices are volatile, transport carriers tend to transfer this risk on to their customers via ‘bunker adjustment factors’ (BAF – for sea freight) and ‘fuel surcharges’ (for air freight). There have been allegations that these surcharges have been used as a non-transparent mechanism for over-charging customers (e.g. Sunday Star Times, 2008; Wang, Chen & Lai, 2011). In contrast, Notteboom & Vernimmen (2009) argue that the BAF only partly compensates for increasing bunker prices.
Figure 11 Inflation-adjusted crude oil prices 1946–2010
Data source: http://www.inflationdata.com/inflation/inflation_rate/historical_oil_prices_table.asp.
US domestic price (yearly average) Average 1946–2010
22 Productivity Commission
Productivity
Productivity in freight transport also affects logistics costs.
Productivity is a measure of the output of a valued good or service per unit of an input that is used to produce it. The input measure can be a single input such as an hour of labour or a hectare of land, or a composite measure of a collection of inputs (e.g. labour and capital). Higher productivity across the economy generally means higher GDP, incomes and living standards.
Productivity levels and growth rates are affected by a whole range of factors such as investments in plant, buildings and infrastructure; institutions and policy settings such as property rights, regulations and taxes; and by geography, skills and technology.
23International Freight Transport Services | Issues Paper
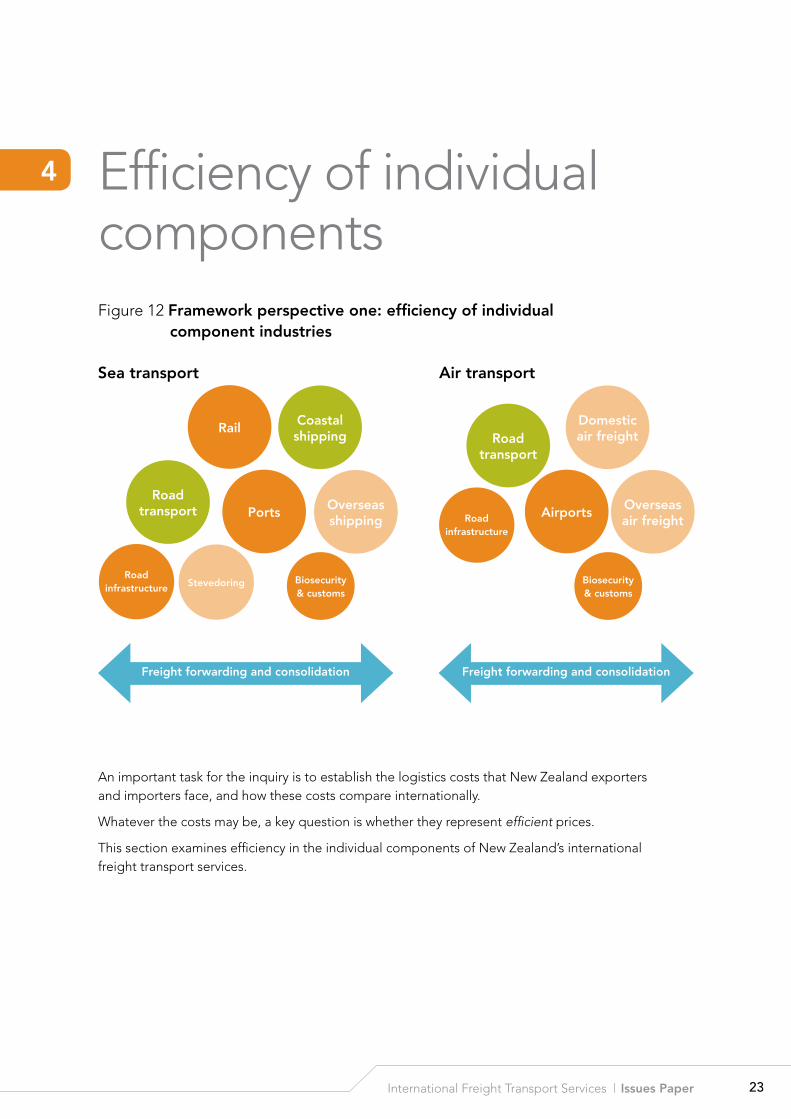
Efficiency of individual componentsFigure 12 framework perspective one: efficiency of individual
component industries
An important task for the inquiry is to establish the logistics costs that New Zealand exporters and importers face, and how these costs compare internationally.
Whatever the costs may be, a key question is whether they represent efficient prices.
This section examines efficiency in the individual components of New Zealand’s international freight transport services.
4
Ports
rail
road transport
coastal shipping
overseas shipping
road infrastructure stevedoring biosecurity
& customs
sea transport
Airports
road transport
domestic air freight
overseas air freightroad
infrastructure
biosecurity & customs
Air transport
freight forwarding and consolidation freight forwarding and consolidation
24 Productivity Commission
4.1 PorTs
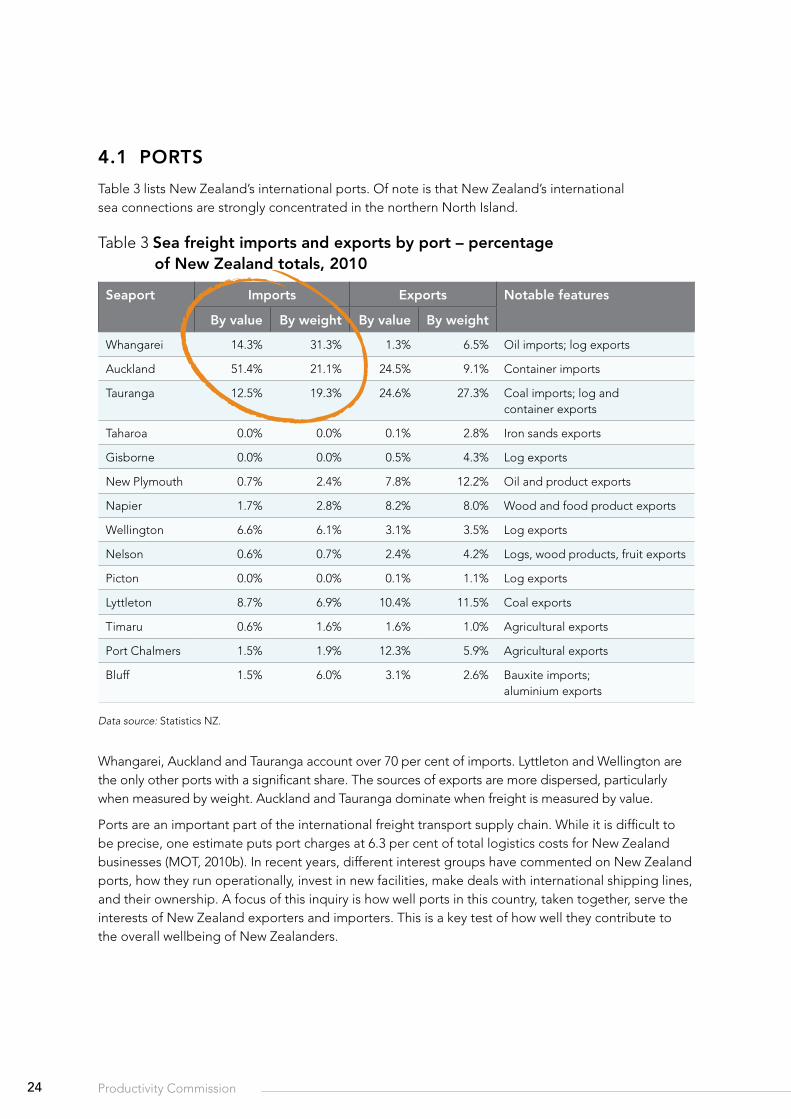
Table 3 lists New Zealand’s international ports. Of note is that New Zealand’s international sea connections are strongly concentrated in the northern North Island.
Table 3 sea freight imports and exports by port – percentage of new Zealand totals, 2010
seaport Imports exports notable features
by value by weight by value by weight
Whangarei 14.3% 31.3% 1.3% 6.5% Oil imports; log exports
Auckland 51.4% 21.1% 24.5% 9.1% Container imports
Tauranga 12.5% 19.3% 24.6% 27.3% Coal imports; log and container exports
Taharoa 0.0% 0.0% 0.1% 2.8% Iron sands exports
Gisborne 0.0% 0.0% 0.5% 4.3% Log exports
New Plymouth 0.7% 2.4% 7.8% 12.2% Oil and product exports
Napier 1.7% 2.8% 8.2% 8.0% Wood and food product exports
Wellington 6.6% 6.1% 3.1% 3.5% Log exports
Nelson 0.6% 0.7% 2.4% 4.2% Logs, wood products, fruit exports
Picton 0.0% 0.0% 0.1% 1.1% Log exports
Lyttleton 8.7% 6.9% 10.4% 11.5% Coal exports
Timaru 0.6% 1.6% 1.6% 1.0% Agricultural exports
Port Chalmers 1.5% 1.9% 12.3% 5.9% Agricultural exports
Bluff 1.5% 6.0% 3.1% 2.6% Bauxite imports; aluminium exports
Data source: Statistics NZ.
Whangarei, Auckland and Tauranga account over 70 per cent of imports. Lyttleton and Wellington are the only other ports with a significant share. The sources of exports are more dispersed, particularly when measured by weight. Auckland and Tauranga dominate when freight is measured by value.
Ports are an important part of the international freight transport supply chain. While it is difficult to be precise, one estimate puts port charges at 6.3 per cent of total logistics costs for New Zealand businesses (MOT, 2010b). In recent years, different interest groups have commented on New Zealand ports, how they run operationally, invest in new facilities, make deals with international shipping lines, and their ownership. A focus of this inquiry is how well ports in this country, taken together, serve the interests of New Zealand exporters and importers. This is a key test of how well they contribute to the overall wellbeing of New Zealanders.
25International Freight Transport Services | Issues Paper
competition between ports
New Zealand’s ports perform different functions. Each port generally has a large degree of geographical monopoly over bulk cargo sourced from, or destined to, that port’s hinterland. Many of the smaller ports are specialised for particular bulk cargos (e.g. oil at Marsden Point, bauxite at Bluff).
Land transport enables ports to compete for higher-valued goods, typically containerised cargo. The main enabler of competition between ports is rail, since rail transports goods from one port’s natural hinterland into another’s (see Section 5.2). A consequence of the generally low quality of New Zealand’s rail network (PriceWaterhouseCoopers, 2004) may be reduced competition between ports.
The Port of Tauranga has a railhead in Auckland that acts as an ‘inland port’. Inland ports can increase the reach of a port and hence the size of its effective hinterland. Inland ports also can improve efficiency of port operations in instances where there are bottlenecks at the port due to land transport, land area (for storage) or border-clearance issues. Ports of Auckland operate an inland port at Wiri for these sorts of reasons.
q5 To what extent is there effective competition for customers between New Zealand ports? Has this led to lower prices and incentives for productivity improvements?
Port efficiency
How operationally efficient are New Zealand’s ports? This is not a simple question for several reasons:
• There are a number of recognised measures of port performance, and no single measure captures all relevant aspects.
• It can be difficult to select appropriate comparison ports. Since New Zealand ports are relatively small by international standards, it may be unrealistic to expect equivalent performance.
• There is a lack of information about New Zealand port efficiency in the public domain.
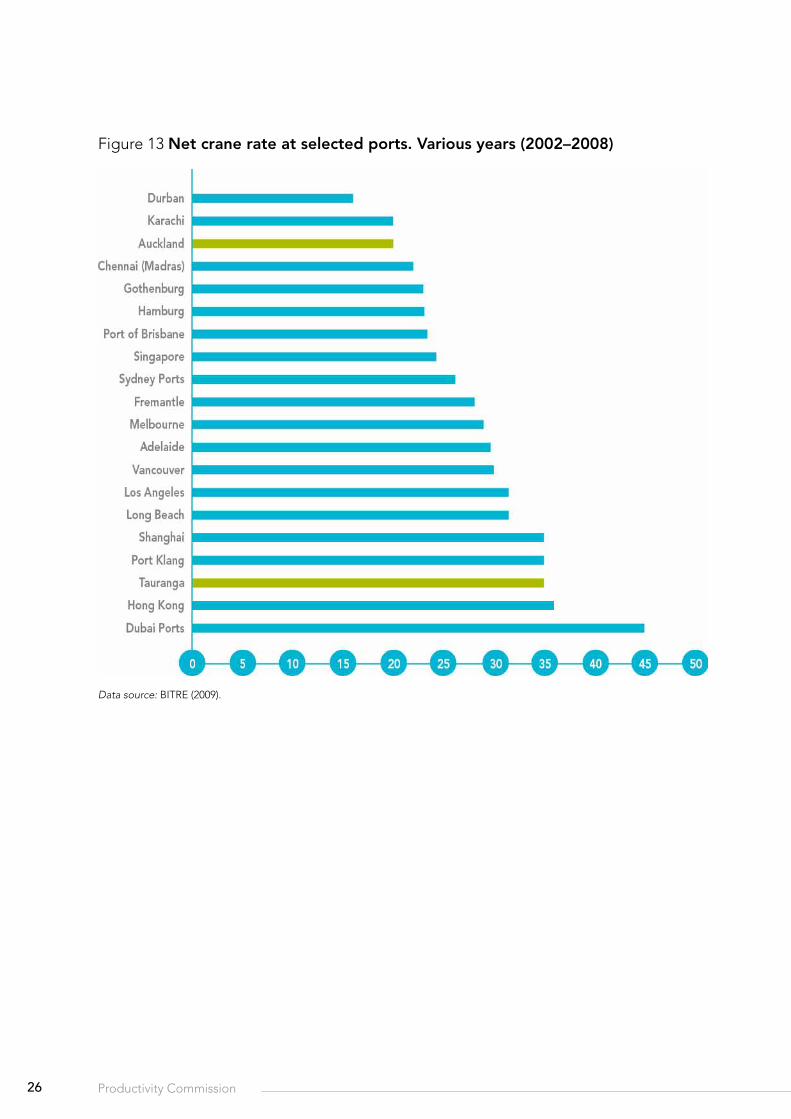
The most common measures of port performance relate to container handling. The net crane rate is the number of (twenty-foot equivalent) containers unloaded or loaded per hour by an operating container crane. Figure 13 shows a comparison between the two largest New Zealand container ports and selected other international ports.
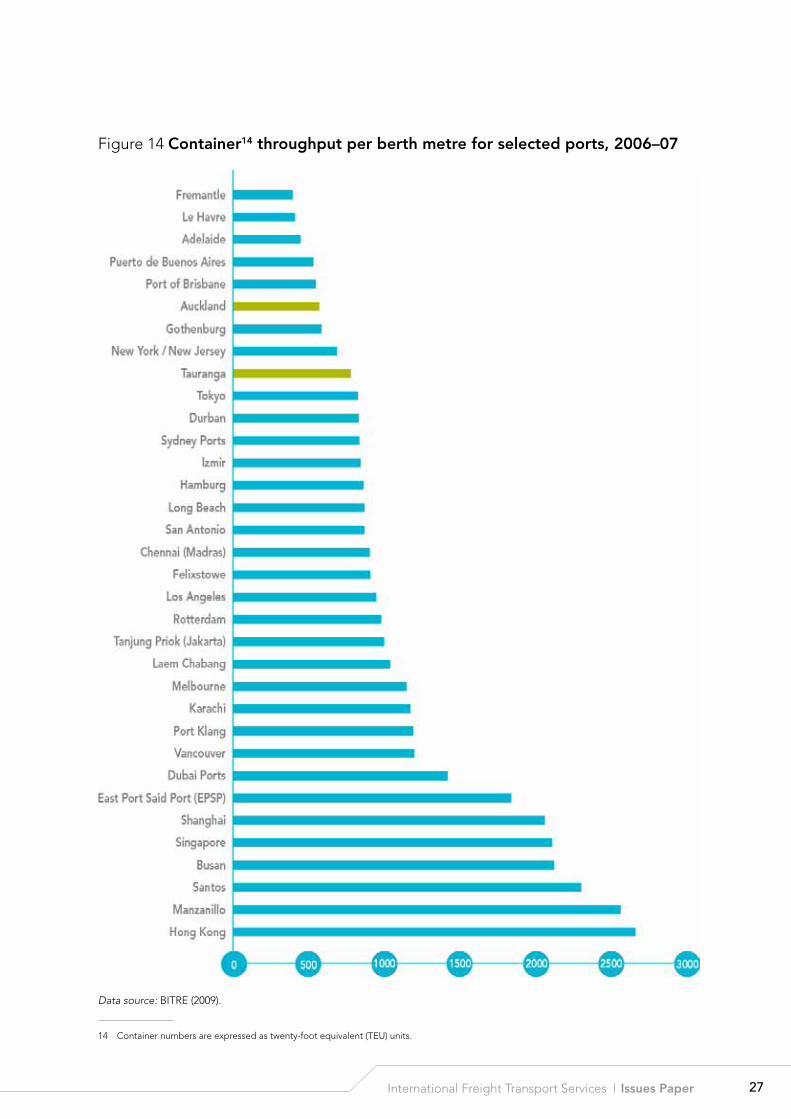
Figure 14 shows a similar comparison for a different performance measure – the throughput of containers per metre of ship berthing length at the port. These data, together with two further measures13 reported by the Australian Bureau of Infrastructure, Transport and Regional Economics (BITRE, 2009), suggest that the performance of Auckland and Tauranga was in most cases below the median of the comparator ports (though Tauranga’s reported net crane rate was among the best). This is consistent with an international comparison provided by Maersk (Figure 15).
13 The additional performance measures are vessel turnaround times and yard utilisation.
26 Productivity Commission
Figure 13 net crane rate at selected ports. various years (2002–2008)
Data source: BITRE (2009).
27International Freight Transport Services | Issues Paper
Figure 14 container14 throughput per berth metre for selected ports, 2006–07
Data source: BITRE (2009).
14 Container numbers are expressed as twenty-foot equivalent (TEU) units.
28 Productivity Commission
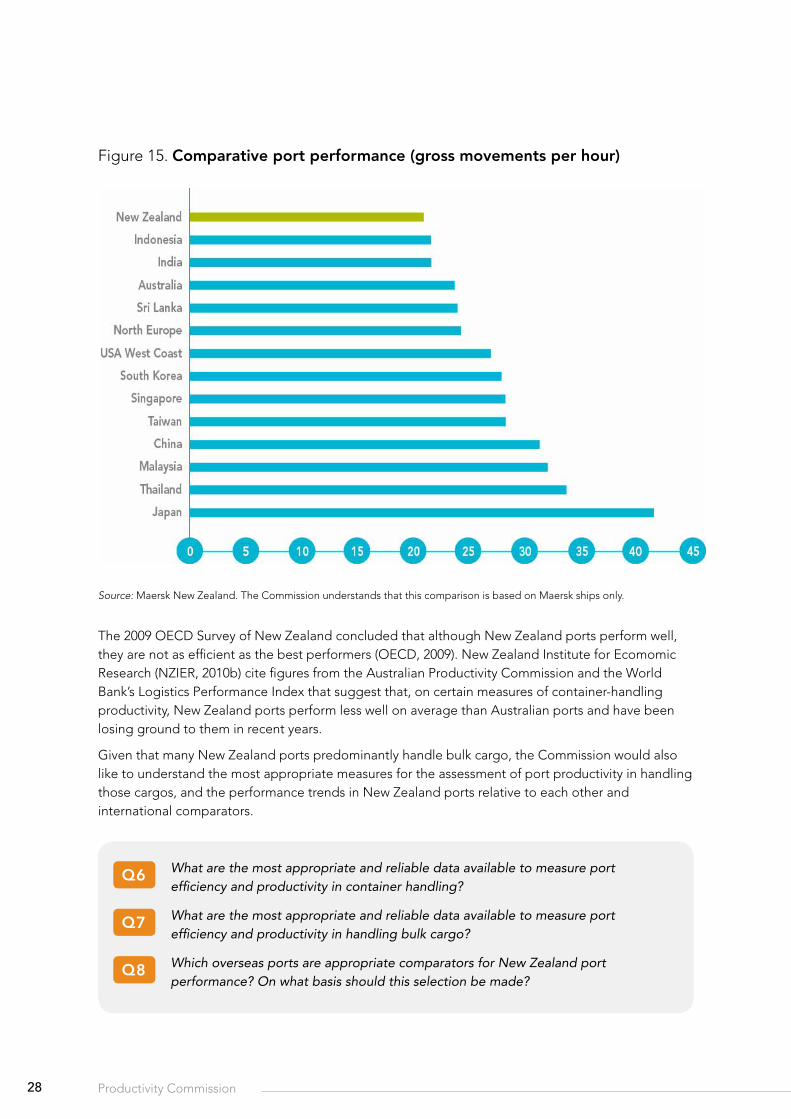
Figure 15. comparative port performance (gross movements per hour)
Source: Maersk New Zealand. The Commission understands that this comparison is based on Maersk ships only.
The 2009 OECD Survey of New Zealand concluded that although New Zealand ports perform well, they are not as efficient as the best performers (OECD, 2009). New Zealand Institute for Ecomomic Research (NZIER, 2010b) cite figures from the Australian Productivity Commission and the World Bank’s Logistics Performance Index that suggest that, on certain measures of container-handling productivity, New Zealand ports perform less well on average than Australian ports and have been losing ground to them in recent years.
Given that many New Zealand ports predominantly handle bulk cargo, the Commission would also like to understand the most appropriate measures for the assessment of port productivity in handling those cargos, and the performance trends in New Zealand ports relative to each other and international comparators.
q6 What are the most appropriate and reliable data available to measure port efficiency and productivity in container handling?
q7 What are the most appropriate and reliable data available to measure port efficiency and productivity in handling bulk cargo?
q8 Which overseas ports are appropriate comparators for New Zealand port performance? On what basis should this selection be made?
29International Freight Transport Services | Issues Paper
It has been suggested to the Commission that, while there were substantial gains following the port reform programme of the late 1980s and early 1990s, performance improvements have been relatively flat during the 2000s. The Commission is particularly interested in obtaining data on, and understanding trends in, port productivity.
q9 Did port productivity improve during the 1990s? What were the drivers of those improvements?
q10 Did the rate of productivity improvements flatten during the 2000s? Why? What might reinvigorate performance improvement?
Port profitability
Auckland Regional Holdings (the 100 per cent owner of Ports of Auckland) released a report in October 2009 that argued that the commercial returns to New Zealand ports are inadequate (Auckland Regional Holdings Ltd, 2009). For example, their report concluded that the profits of the major ports in 2008 fell $138 million short of what would be required to achieve a return on equity of 10 per cent. However, using a measure of economic returns on historic cost, NZIER (2010b) found the quite different result that all four major container ports made positive economic returns (i.e. they more than covered the cost of the equity and debt capital employed by the ports) in every year from the mid-1990s to 2009.
q11 What is the most appropriate way to measure port profitability? What is an appropriate rate of return on assets and equity?
q12 Is there evidence of a systemic problem of low port profitability? Or conversely, excessive profitability?
Port investment and rationalisation
Some have suggested that New Zealand has too many ports for a small country and that a more strategic and directed approach to shaping and investing in future port capacity is desirable. In this view, the current system results in investments being too big or too small in specific cases relative to what would occur if they were planned for the system overall.
One suggested risk is that individual ports over-invest in capacity in order to attract port calls from the larger shipping lines – lines that are in a position to play off individual ports against each other in order to extract a larger profit share. This latter outcome has been linked to the declines in port profitability described in the previous subsection. On the other hand, NZIER (2010b) estimate that ports investment in new capacity since the mid-1990s has been relatively modest and grown at a slower rate than the growth in the volume of containers handled by ports.
30 Productivity Commission
q13 What levels of investment have ports undertaken in recent years? Are they consistent with accessible and efficient services to exporters and importers? Is there an over- or under-investment problem in ports?
These different views pose the question of whether current arrangements are generating the size and shape of port facilities that maximise benefits for New Zealand as a whole? Or does the system and the approach need to change?
Strategic planning that spans multiple ports could occur via different approaches including:
• coordinated planning undertaken by two or more ports, backed by contractual agreements between those ports;
• internal planning following a merger of two or more ports; or
• regional or centralised planning.
Current ownership arrangements would appear to discourage port mergers (see next subsection) and may similarly discourage contractual agreements that could have the effect of shifting economic activity between regions. The Commerce Act might also prevent mergers between the larger ports, and negotiations between ports may risk being deemed anti-competitive behaviour. Strategic planning is considered further in Section 6.6.
q14 Does New Zealand have too many ports for a small country? If so, what barriers are inhibiting rationalisation?
Port ownership
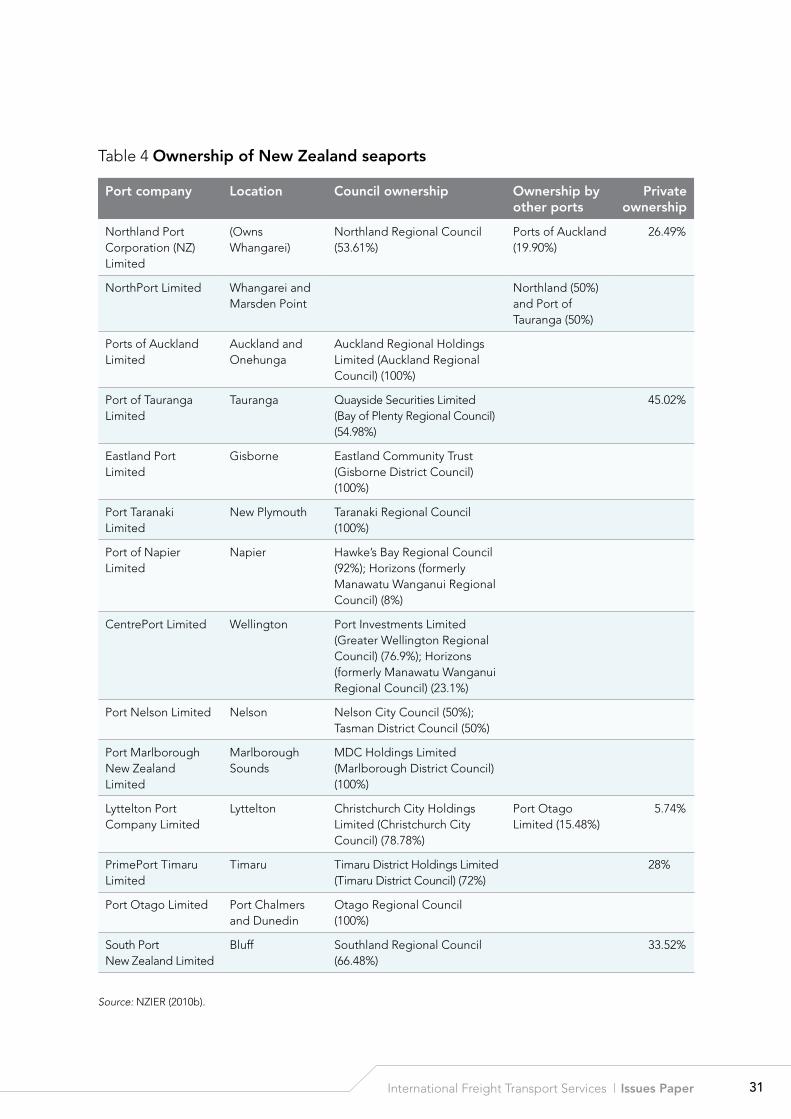
All commercial ports in New Zealand are majority owned by a local authority within whose territory the port is located (Table 4). Despite some changes in ownership since port companies were established in the late 1980s, this feature has remained in place15. This ownership pattern naturally raises some questions about its effects on the development and performance of the ports sector. For example, how might it affect major investment decisions, the introduction of new work practices, setting strategic priorities, or moves to partner or merge with other owners or new entrants to the New Zealand port industry?
15 Strictly, until Banks Peninsula District Council was merged with Christchurch City Council a few years ago, Lyttelton Port was not in the area of the local authority that owned the majority of its shares.
31International Freight Transport Services | Issues Paper
Table 4 Ownership of New Zealand seaports
Port company Location Council ownership Ownership by other ports
Private ownership
Northland Port Corporation (NZ) Limited
(Owns Whangarei)
Northland Regional Council (53.61%)
Ports of Auckland (19.90%)
26.49%
NorthPort Limited Whangarei and Marsden Point
Northland (50%) and Port of Tauranga (50%)
Ports of Auckland Limited
Auckland and Onehunga
Auckland Regional Holdings Limited (Auckland Regional Council) (100%)
Port of Tauranga Limited
Tauranga Quayside Securities Limited (Bay of Plenty Regional Council) (54.98%)
45.02%
Eastland Port Limited
Gisborne Eastland Community Trust (Gisborne District Council) (100%)
Port Taranaki Limited
New Plymouth Taranaki Regional Council (100%)
Port of Napier Limited
Napier Hawke’s Bay Regional Council (92%); Horizons (formerly Manawatu Wanganui Regional Council) (8%)
CentrePort Limited Wellington Port Investments Limited (Greater Wellington Regional Council) (76.9%); Horizons (formerly Manawatu Wanganui Regional Council) (23.1%)
Port Nelson Limited Nelson Nelson City Council (50%); Tasman District Council (50%)
Port Marlborough New Zealand Limited
Marlborough Sounds
MDC Holdings Limited (Marlborough District Council) (100%)
Lyttelton Port Company Limited
Lyttelton Christchurch City Holdings Limited (Christchurch City Council) (78.78%)
Port Otago Limited (15.48%)
5.74%
PrimePort Timaru Limited
Timaru Timaru District Holdings Limited (Timaru District Council) (72%)
28%
Port Otago Limited Port Chalmers and Dunedin
Otago Regional Council (100%)
South Port New Zealand Limited
Bluff Southland Regional Council (66.48%)
33.52%
Source: NZIER (2010b).
32 Productivity Commission
Port companies operate as commercial entities under the Port Companies Act 1988. The Act sets their principal objective which is to ‘operate as a successful business’. The local authority shareholder(s) and other shareholders appoint the directors of port companies. This is one channel through which it is possible that local politicians, reflecting a wider set of interests than simply the commercial profitability of their port company, could be influencing outcomes in a way that is different from what would happen under private-sector owners. NZIER (2010b) argues that there is some evidence that this has been the case particularly in relation to ownership restructuring and negotiations with foreign shipping lines, but not in relation to other aspects such as investment or exercising market power.
The Local Government Act 2002 (LGA) automatically deems any equity shareholding by a local authority in a port to be a ‘strategic asset’ and places conditions on the purchase and sale of such assets (even when they amount to a minority stake-holding). While arguably not onerous, these conditions make it less likely that ownership structures will evolve in response to changes in the external environment.
Furthermore the LGA requires that local authorities balance multiple objectives (e.g. social and environmental as well as financial) in all their decision-making. This means, among other things, that the business performance of specific assets cannot be prioritised over other objectives. There is therefore a risk that local authority ownership under these LGA provisions will sometimes lead to decisions that are not conducive to long-term efficient operation of ports, either individually or when viewed as a system. Interviews with port-owning local authorities conducted by Rockpoint (2009) detected little evidence ’of a preparedness to subjugate regional interests to a perceived national interest by accepting a lesser role for the regional port’.
The Commission is interested in understanding what effects local authorities’ ownership of majority shares in port companies has had on port performance, as measured by the provision of accessible, reliable, responsive and efficient services for New Zealand exporters and importers.
q15 Has local-authority ownership of majority stakes in New Zealand’s commercial ports inhibited, enhanced or been neutral for the development of a more efficient and productive port sector?
q16 What changes in governance, regulations or ownership would offer the best means to improve port performance for exporters and importers?
33International Freight Transport Services | Issues Paper
4.2 WIThIn-PorT AcTIvITIes
Port operations cover a number of distinct activities including warehousing, stevedoring and marshalling. Stevedoring is the process of loading and unloading ships and stowing cargo. Marshalling is the distinct activity of receiving cargo from road or rail transport and loading and assembling it on the wharf ready for export. In the case of imports, marshallers remove cargo from the wharves and prepare it for dispatching. A number of factors influence the efficiency and productivity of within port activities including investment in technology and equipment, management quality, skills and labour relations. Port companies have the choice of undertaking these activities directly with their own equipment and workforces, or to contract them out to independent providers.
Somewhat unusually (in New Zealand), the Port of Tauranga allows exporters, importers and shipping lines a choice among competing container stevedoring firms that work alongside each other at the port (NZIER, 2010b)16. The Commission is interested to know how well this arrangement works in terms of providing better value for money for customers, especially compared with ports that employ labour directly for this activity.
A variation on the Tauranga arrangement is for a port company periodically to seek tenders for the supply of container stevedoring for a fixed term. The logical limit of this approach would be for the port owner to follow a ‘landlord’ business model as opposed to an operational port company that undertakes all the main port activities itself.
Historically, the ‘wharves’ in New Zealand have been the setting for difficult industrial relations, with disputes over terms and conditions, and the adoption of new work practices. While days lost as a result of industrial disputes have declined markedly in recent years, tensions arguably remain at some ports.
q17 How much variation in the efficiency and productivity performance of ports is explained by the way that within-port activities are organised? Do ‘contracting out’ and ‘landlord’ models offer a way to increase competition for the benefit of exporters and importers?
q18 To what extent do inflexible labour practices and difficulties in employer-union relationships remain an obstacle to lifting efficiency and productivity at New Zealand ports?
16 Other ports have competition for general stevedoring and marshalling but not container stevedoring.
34 Productivity Commission
4.3 InTernATIonAl seA freIghT
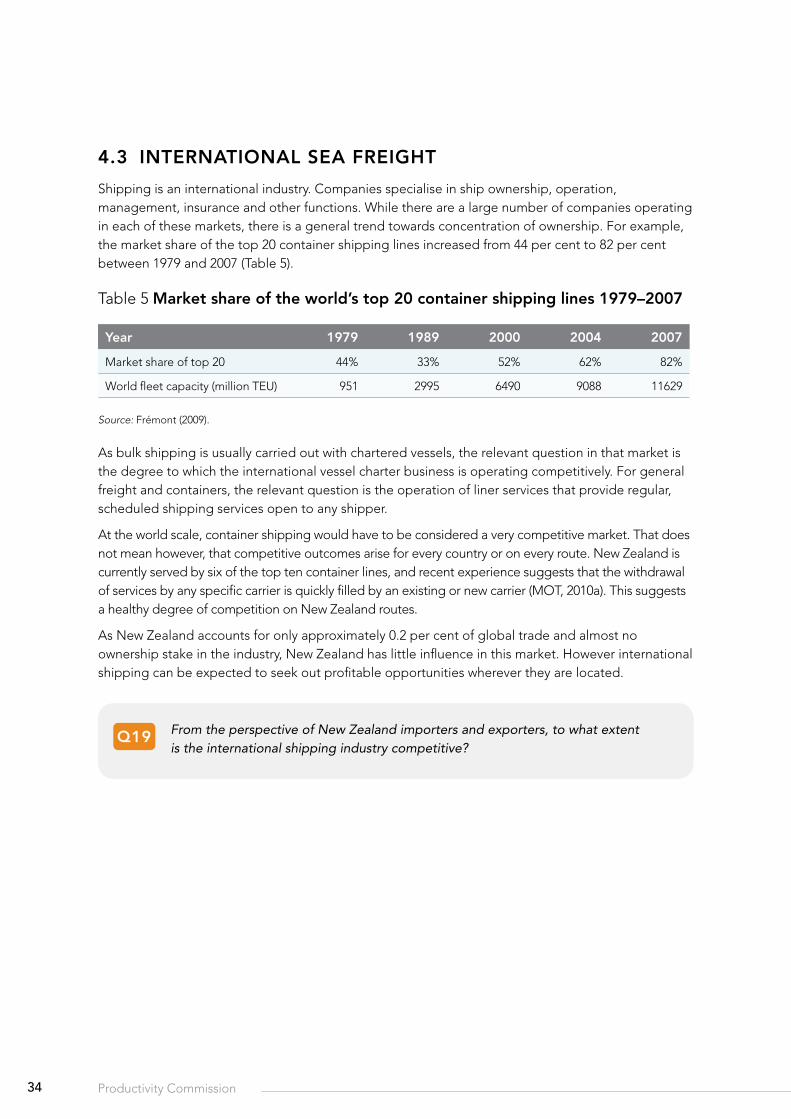
Shipping is an international industry. Companies specialise in ship ownership, operation, management, insurance and other functions. While there are a large number of companies operating in each of these markets, there is a general trend towards concentration of ownership. For example, the market share of the top 20 container shipping lines increased from 44 per cent to 82 per cent between 1979 and 2007 (Table 5).
Table 5 market share of the world’s top 20 container shipping lines 1979–2007
year 1979 1989 2000 2004 2007
Market share of top 20 44% 33% 52% 62% 82%
World fleet capacity (million TEU) 951 2995 6490 9088 11629
Source: Frémont (2009).
As bulk shipping is usually carried out with chartered vessels, the relevant question in that market is the degree to which the international vessel charter business is operating competitively. For general freight and containers, the relevant question is the operation of liner services that provide regular, scheduled shipping services open to any shipper.
At the world scale, container shipping would have to be considered a very competitive market. That does not mean however, that competitive outcomes arise for every country or on every route. New Zealand is currently served by six of the top ten container lines, and recent experience suggests that the withdrawal of services by any specific carrier is quickly filled by an existing or new carrier (MOT, 2010a). This suggests a healthy degree of competition on New Zealand routes.
As New Zealand accounts for only approximately 0.2 per cent of global trade and almost no ownership stake in the industry, New Zealand has little influence in this market. However international shipping can be expected to seek out profitable opportunities wherever they are located.
q19 From the perspective of New Zealand importers and exporters, to what extent is the international shipping industry competitive?
35International Freight Transport Services | Issues Paper
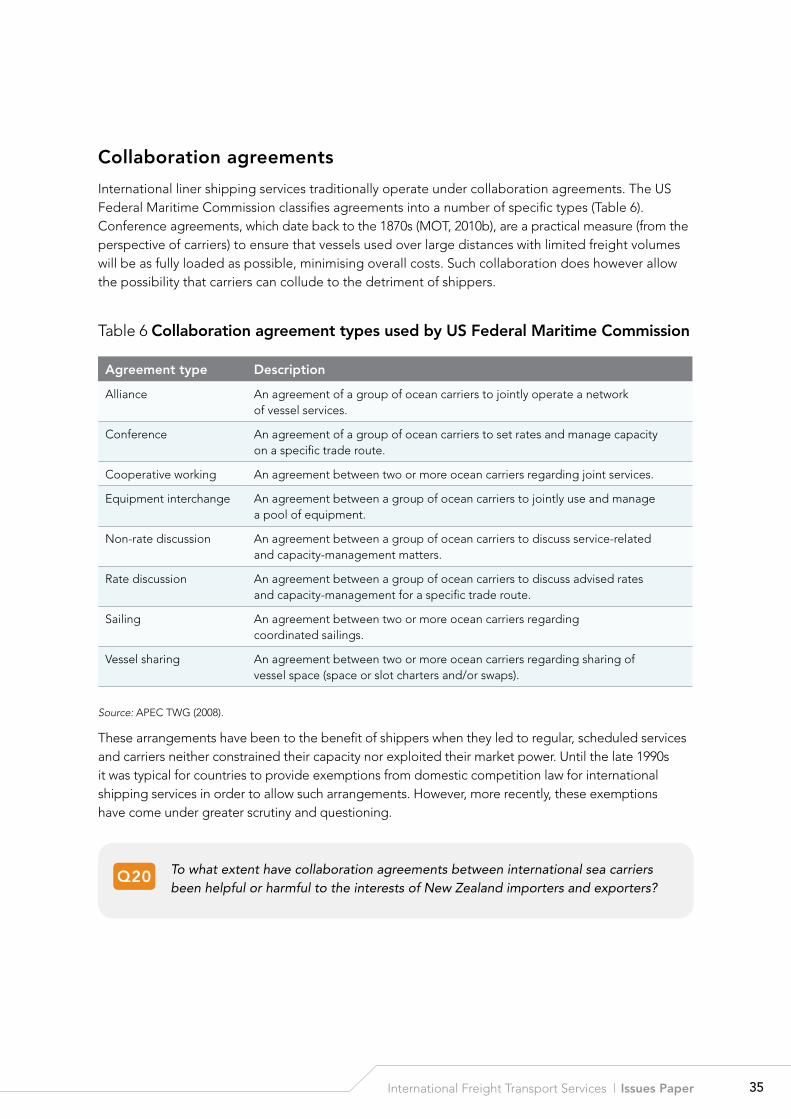
collaboration agreements
International liner shipping services traditionally operate under collaboration agreements. The US Federal Maritime Commission classifies agreements into a number of specific types (Table 6). Conference agreements, which date back to the 1870s (MOT, 2010b), are a practical measure (from the perspective of carriers) to ensure that vessels used over large distances with limited freight volumes will be as fully loaded as possible, minimising overall costs. Such collaboration does however allow the possibility that carriers can collude to the detriment of shippers.
Table 6 collaboration agreement types used by us federal maritime commission
Agreement type description
Alliance An agreement of a group of ocean carriers to jointly operate a network of vessel services.
Conference An agreement of a group of ocean carriers to set rates and manage capacity on a specific trade route.
Cooperative working An agreement between two or more ocean carriers regarding joint services.
Equipment interchange An agreement between a group of ocean carriers to jointly use and manage a pool of equipment.
Non-rate discussion An agreement between a group of ocean carriers to discuss service-related and capacity-management matters.
Rate discussion An agreement between a group of ocean carriers to discuss advised rates and capacity-management for a specific trade route.
Sailing An agreement between two or more ocean carriers regarding coordinated sailings.
Vessel sharing An agreement between two or more ocean carriers regarding sharing of vessel space (space or slot charters and/or swaps).
Source: APEC TWG (2008).
These arrangements have been to the benefit of shippers when they led to regular, scheduled services and carriers neither constrained their capacity nor exploited their market power. Until the late 1990s it was typical for countries to provide exemptions from domestic competition law for international shipping services in order to allow such arrangements. However, more recently, these exemptions have come under greater scrutiny and questioning.
q20 To what extent have collaboration agreements between international sea carriers been helpful or harmful to the interests of New Zealand importers and exporters?
36 Productivity Commission
new Zealand regulation
Regulation is a key lever that governments can and do use to influence how markets and market participants operate and behave. In a market economy, competition is the main means to promote good outcomes with respect to costs, resource allocation and innovation. The Commerce Act 1986 is the principle statute in New Zealand that promotes competitive markets.
Port companies, road-haulage firms, firms that consolidate and forward freight are generally subject to the Commerce Act. However, international shipping lines that run freight services to and from New Zealand have exemptions from the Commerce Act that affect the way in which their services are supplied. Part 2 of the Act, which deals with restrictive trade practices, specifically excludes from consideration contracts that are ‘exclusively for inwards or outwards international carriage of goods by sea’. This exclusion does not apply if the contract relates to the carriage of goods to or from a ship or the loading or unloading of a ship.
While the exclusion applying to imports is quite circumscribed, the exclusions applying to exports are more wide-ranging. The Shipping Act 1987 covers exports and aims to create a ‘satisfactory balance of advantage’ between shippers and carriers (and associations of carriers). It also covers any land transport within New Zealand preliminary to export. This Act overrides both Parts 2 (‘restrictive trade practices’) and 4 (‘regulated goods or services’) of the Commerce Act. It provides a customised regulatory framework that allows conferences and other forms of collaboration between international carriers.
Part 2 of the Shipping Act defines unfair practices as:
• abuse of dominant position;
• failure to give reasonable notice to shippers of changes to terms and conditions;
• refusal or failure to negotiate with shippers; and
• collusion in tendering.
The Minister of Transport can initiate investigations into suspected unfair practices. If, following such an investigation, the Minister is satisfied that a carrier has engaged in unfair practices, he or she can direct a carrier to supply details of agreements, give reasonable notice to shippers, or enter into negotiations.
As far as the Commission is aware, there have been no Ministerial investigations under Part 2 of the Act. Accordingly these arrangements must be regarded as untested, though it is possible that they act as a deterrent to unfair practices. This would be consistent with original intentions that shipper and carrier relations would ‘continue to be largely self-regulating’, underpinned by a ‘safety net’ (Minister of Transport, 1983).
One criticism of the Shipping Act is that current arrangements blur the distinction between the Government’s role as policy-maker and regulator (OECD, 2011). Given this and its ability to closely cooperate with foreign regulatory agencies, the Commerce Commission may be better placed to perform the regulatory role.
37International Freight Transport Services | Issues Paper
q21 What is the basis for the different regulatory treatment of imports and exports under the Commerce Act and Shipping Act? Is this differential treatment justified?
q22 Have any actions (foreshadowed or actual) been undertaken under the Shipping Act 1987? Does the Act deter unfair practices?
q23 Would the Commerce Commission be better placed than the Minister of Transport to oversee the regulation of international shipping services?
International regulatory trends
While collaboration agreements are traditional in international shipping, it has been argued that these arrangements are directly anti-competitive, lead to higher prices and work against the interests of New Zealand shippers and consumers (e.g. Sunday Star Times, 2008). Moreover, some foreign regulators have recently toughened their stance towards shipping conferences by bringing carriers more within the scope of their main competition regimes.
The European Union competition regime provided two exemptions from competition policy, covering conferences and consortia. The general conference exemption was abolished as of October 2008; however the consortia exemption has been retained.
The Australian Productivity Commission recommended abolition of the Australian competition policy exemptions in 2005 (Australian Productivity Commission, 2005). Government decided instead to narrow their application, removing discussion agreements. Exemption arrangements in the US and Singapore are under active review.
Unlike New Zealand, the US and other countries require the registration and public release of all agreements. Such disclosure requirements may go some way to limiting the scope for their misuse.
q24 To what extent do the current regulatory and competition regimes that affect international sea freight transport services work well or not for New Zealand exporters and importers?
q25 How do international shipping conferences permitted under the Shipping Act 1987 affect the accessibility and efficiency of sea freight services available to New Zealand exporters and importers? How strong or weak is the case for the exemption of conferences from the competition provisions of the Commerce Act?
q26 What lessons can New Zealand learn from the different ways that competition law and regulators in other jurisdictions deal with international sea freight services?
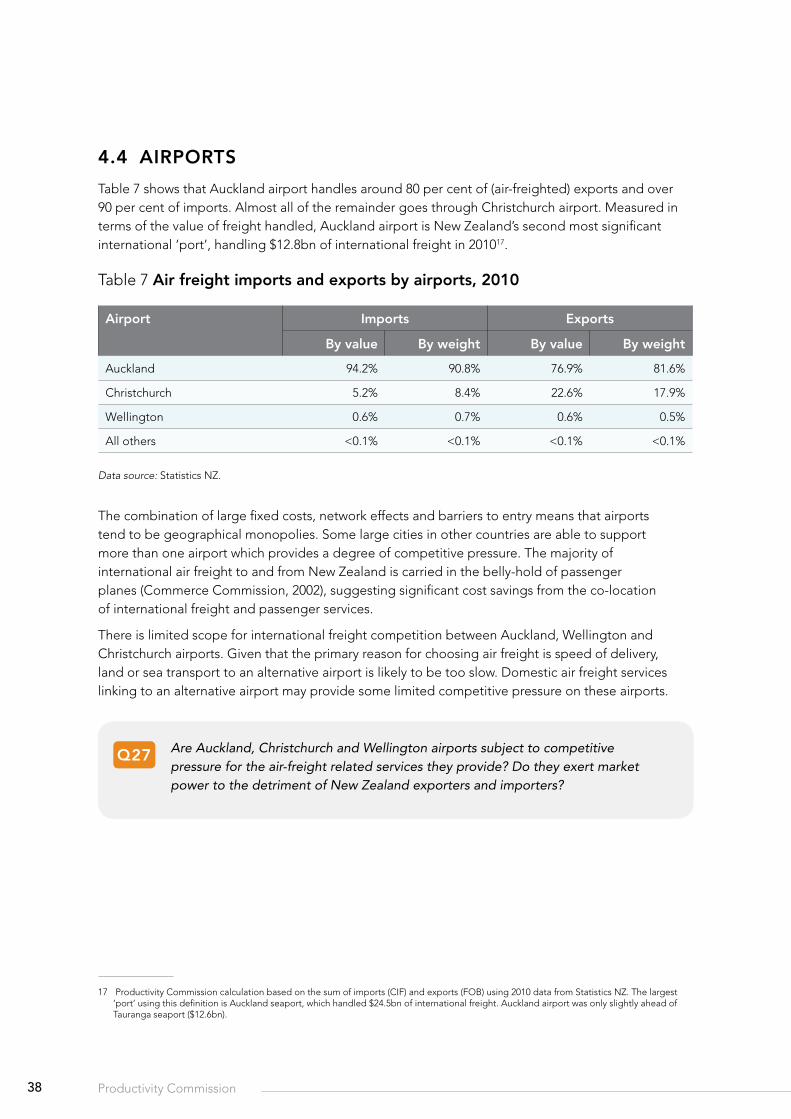
38 Productivity Commission
4.4 AIrPorTs
Table 7 shows that Auckland airport handles around 80 per cent of (air-freighted) exports and over 90 per cent of imports. Almost all of the remainder goes through Christchurch airport. Measured in terms of the value of freight handled, Auckland airport is New Zealand’s second most significant international ‘port’, handling $12.8bn of international freight in 201017.
Table 7 Air freight imports and exports by airports, 2010
Airport Imports exports
by value by weight by value by weight
Auckland 94.2% 90.8% 76.9% 81.6%
Christchurch 5.2% 8.4% 22.6% 17.9%
Wellington 0.6% 0.7% 0.6% 0.5%
All others <0.1% <0.1% <0.1% <0.1%
Data source: Statistics NZ.
The combination of large fixed costs, network effects and barriers to entry means that airports tend to be geographical monopolies. Some large cities in other countries are able to support more than one airport which provides a degree of competitive pressure. The majority of international air freight to and from New Zealand is carried in the belly-hold of passenger planes (Commerce Commission, 2002), suggesting significant cost savings from the co-location of international freight and passenger services.
There is limited scope for international freight competition between Auckland, Wellington and Christchurch airports. Given that the primary reason for choosing air freight is speed of delivery, land or sea transport to an alternative airport is likely to be too slow. Domestic air freight services linking to an alternative airport may provide some limited competitive pressure on these airports.
q27 Are Auckland, Christchurch and Wellington airports subject to competitive pressure for the air-freight related services they provide? Do they exert market power to the detriment of New Zealand exporters and importers?
17 Productivity Commission calculation based on the sum of imports (CIF) and exports (FOB) using 2010 data from Statistics NZ. The largest ‘port’ using this definition is Auckland seaport, which handled $24.5bn of international freight. Auckland airport was only slightly ahead of Tauranga seaport ($12.6bn).
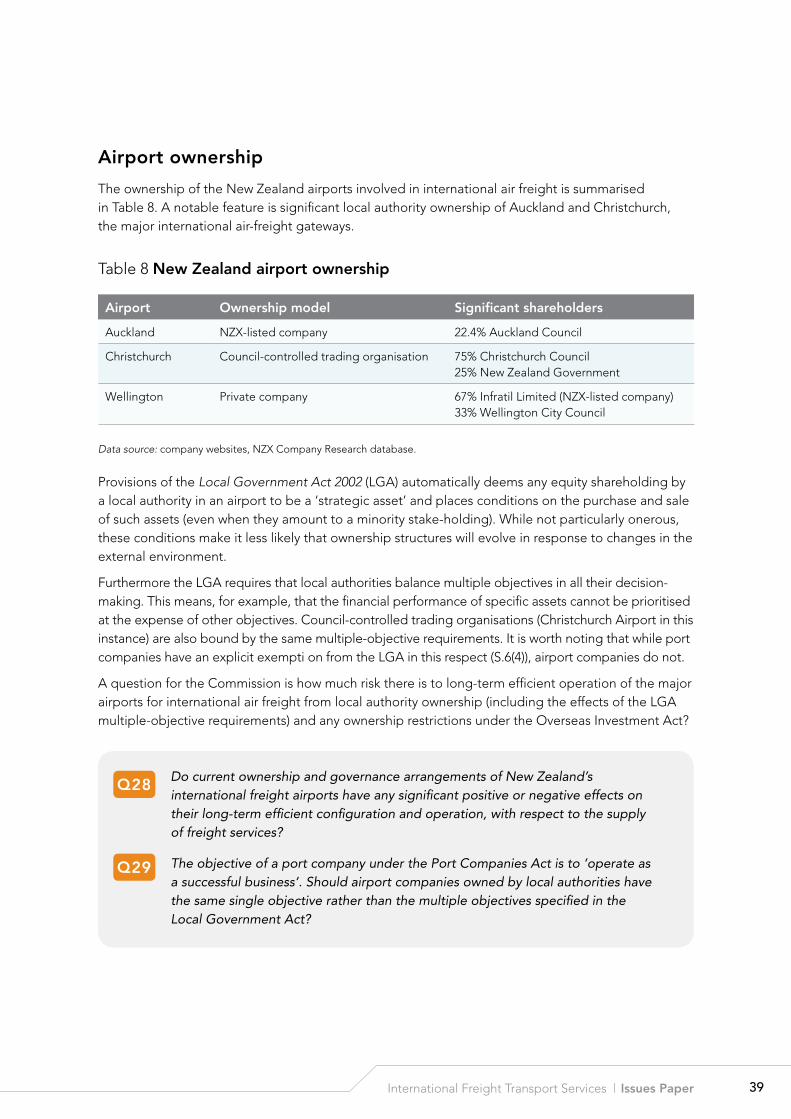
39International Freight Transport Services | Issues Paper
Airport ownership
The ownership of the New Zealand airports involved in international air freight is summarised in Table 8. A notable feature is significant local authority ownership of Auckland and Christchurch, the major international air-freight gateways.
Table 8 new Zealand airport ownership
Airport ownership model significant shareholders
Auckland NZX-listed company 22.4% Auckland Council
Christchurch Council-controlled trading organisation 75% Christchurch Council 25% New Zealand Government
Wellington Private company 67% Infratil Limited (NZX-listed company) 33% Wellington City Council
Data source: company websites, NZX Company Research database.
Provisions of the Local Government Act 2002 (LGA) automatically deems any equity shareholding by a local authority in an airport to be a ‘strategic asset’ and places conditions on the purchase and sale of such assets (even when they amount to a minority stake-holding). While not particularly onerous, these conditions make it less likely that ownership structures will evolve in response to changes in the external environment.
Furthermore the LGA requires that local authorities balance multiple objectives in all their decision-making. This means, for example, that the financial performance of specific assets cannot be prioritised at the expense of other objectives. Council-controlled trading organisations (Christchurch Airport in this instance) are also bound by the same multiple-objective requirements. It is worth noting that while port companies have an explicit exempti on from the LGA in this respect (S.6(4)), airport companies do not.
A question for the Commission is how much risk there is to long-term efficient operation of the major airports for international air freight from local authority ownership (including the effects of the LGA multiple-objective requirements) and any ownership restrictions under the Overseas Investment Act?
q28 Do current ownership and governance arrangements of New Zealand’s international freight airports have any significant positive or negative effects on their long-term efficient configuration and operation, with respect to the supply of freight services?
q29 The objective of a port company under the Port Companies Act is to ‘operate as a successful business’. Should airport companies owned by local authorities have the same single objective rather than the multiple objectives specified in the Local Government Act?
40 Productivity Commission
Airport investment
One risk associated with monopoly provision of services is underinvestment. With only two major international freight airports, each with potential market power, a question is whether they are investing in capacity, facilities and technology to the right level in order to provide an efficient service for exporters and importers, not only now but into the future.
On the other hand, as with ports, there is the possibility that pressure from regional owners can lead to overinvestment. For example, it has been suggested that some regional airports have over-invested in the provision of international passenger services in recent years (e.g. McGregor & Company, 2006; Local Government Rates Inquiry Panel, 2007). The Commission is interested in understanding whether this has also occurred in an attempt to attract international air freight.
Although commentators have been less vocal in offering views on airports than seaports, there is also the issue of whether decisions about the future development of New Zealand’s airport capacity to handle international freight are best left to individual regional and private-sector interests or should be subject to a more deliberately coordinated approach.
q30 What levels of investment have Auckland and Christchurch airports undertaken in international freight, and are they consistent with accessible and efficient services for New Zealand exporters and importers?
q31 Should the future size and shape of New Zealand air freight services be left to market forces and individual airport owners, or do lumpiness and interdependence (including with investments in connecting parts of the overall supply chain) call for a more deliberately coordinated approach?
Airport operating efficiency
Given that New Zealand’s international airports have significant monopoly power in air freight services, they may – depending on the efficacy of the existing regulatory regime – lack the incentives to operate efficiently. The Commission is interested in understanding the productivity of the parts of the international supply chain that are the responsibility of airports.
q32 What are the most appropriate measures of airport performance in international air freight? Can you assist the Commission by providing data that compares New Zealand airports against others?
q33 Are there opportunities to introduce or increase competition in the provision of air freight-related services at airports? Would such competition lead to better outcomes?
41International Freight Transport Services | Issues Paper
Airport regulation
S.56–56A of the Commerce Act 1986 provides for regulation of Auckland, Wellington and Christchurch Airports, including the international freight activities of those airports. These airports are required to disclose a significant quantity of tightly-specified information about their operations. A Commerce Commission review of the effectiveness of the information-disclosure regime will be triggered by the first price change for specified airport services in or after 2012.
q34 Is the existing and planned Commerce Commission regulation of airports sufficient to restrain monopoly pricing and induce an efficient level of investment? If not, what should change?
4.5 InTernATIonAl AIr freIghT
Air freight is an international industry. Unlike shipping, international flights are regulated by a network of bilateral agreements between individual countries.
Most international air freight to and from New Zealand is transported in the belly hold of scheduled passenger services, with a relatively smaller proportion transported in dedicated air freighters. Dedicated air freighters are able to ship some freight items – such as large live animals – that are unsuited to belly holds.
Recent data from the Australian Bureau of Infrastructure, Transport and Regional Economics shows air freight spread across five main carriers and a number of smaller ones on trans-Tasman routes (Figure 16). This suggests the existence of a competitive market for air freight on these routes.
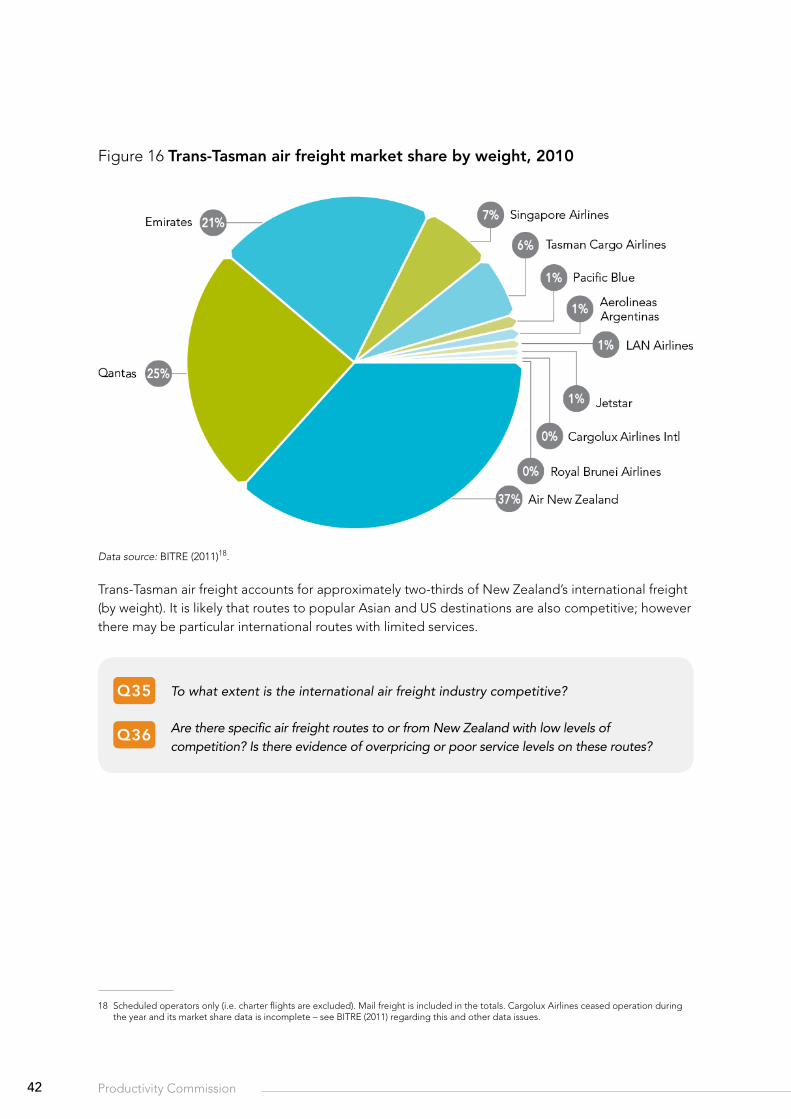
42 Productivity Commission
Figure 16 Trans-Tasman air freight market share by weight, 2010
Data source: BITRE (2011)18.
Trans-Tasman air freight accounts for approximately two-thirds of New Zealand’s international freight (by weight). It is likely that routes to popular Asian and US destinations are also competitive; however there may be particular international routes with limited services.
q35 To what extent is the international air freight industry competitive?
q36 Are there specific air freight routes to or from New Zealand with low levels of competition? Is there evidence of overpricing or poor service levels on these routes?
18 Scheduled operators only (i.e. charter flights are excluded). Mail freight is included in the totals. Cargolux Airlines ceased operation during the year and its market share data is incomplete – see BITRE (2011) regarding this and other data issues.
43International Freight Transport Services | Issues Paper
regulation of international air freight services
Unlike the more general exemptions from the Commerce Act provided to sea carriers, the provisions of Part 9 the Civil Aviation Act 1990 require Ministerial approval. This makes the regime somewhat more transparent than the sea freight regime.
International air transport services are provided within a network of bilateral agreements between countries. A typical air service agreement allocates to the airlines specified by the signatories the right to fly across borders, and may restrict the capacity and frequency of services and other constraints. Relatively less restrictive ‘open skies’ agreements have become common in recent years, and New Zealand is a signatory to a number of these. Twenty-five international airlines currently serve New Zealand.
q37 How do bilateral air services agreements affect the accessibility and efficiency of air freight services available to New Zealand exporters and importers?
ministerial authorisations under the civil Aviation Act 1990
Part 9 of the Civil Aviation Act overrides the Commerce Act under specific circumstances. S.88 permits the Minister of Transport to authorise contracts, arrangements, or understandings between two or more parties relating to international carriage by air. If he or she does so then such contracts, arrangements or understandings are declared to be specific authorisations under S.43 of the Commerce Act, which exempts them from the normal restraints on restrictive trade practices in that Act.
According to the Ministry of Transport’s website, there have been two major applications under S.8819. These were for a network agreement between Qantas and Air New Zealand in 2006 and an alliance between Air New Zealand and the Virgin Blue group in 2010. The former application was withdrawn after the agreement failed to win competition-authority approval in Australia and New Zealand. The latter application was approved by the Minister of Transport.
A criticism of Part 9 the Civil Aviation Act is that, with the government as the majority owner of Air New Zealand, the current arrangements blur the distinction between the Government’s role as policy-maker, regulator and owner (OECD, 2011). Given this and its ability to closely cooperate with foreign regulatory agencies, the Commerce Commission may be better placed to perform the regulatory role.
19 See: http://www.transport.govt.nz/ourwork/air/internationalaircarriagecompetition/. Accessed June 18, 2011.
44 Productivity Commission
q38 What explanations exist for the different treatment of international air freight in the Civil Aviation Act compared with the normal competition requirements of the Commerce Act? Do the objectives of the current regulatory treatment continue to be justified?
q39 Should the regulatory functions in Part 9 of the Civil Aviation Act be the responsibility of the Commerce Commission rather than the Minister of Transport?
commission regimes and tariffs under the civil Aviation Act 1990
S.89 permits the Minister of Transport also to issue a ‘commission regime’, specifying agency commissions that apply for international carriage by air, and a ‘tariff’ (S.90). These issuances under the Act are declared to be specific authorisations under S.43 of the Commerce Act, which exempts them from the normal restraints on restrictive trade practices in that Act.
According to the Ministry of Transport, two commission regimes have been issued under the Act20, both in 1983. These specify a Cargo Agents’ Commission Regime and a Passenger Agents’ Commission Regime. The Productivity Commission is not aware of any tariffs issued under S.90.
q40 Does the Cargo Agents’ Commission Regime perform an active and useful function in international air freight services? Who does it benefit? Is the exemption from the Commerce Act required to achieve that function?
q41 Has S.90 of the Civil Aviation Act been used in practice? What are the arguments for retention of the ability of the Minister to issue a tariff?
20 The regimes are available at: http://www.transport.govt.nz/legislation/acts/Documents/NZ-Gazette-1983.pdf. Accessed June 18, 2011.
45International Freight Transport Services | Issues Paper
collusive behaviour
The Commerce Commission has recently prosecuted certain international air freight carriers over collusion to raise the price of air freight by fixing fuel surcharges (e.g. see Commerce Commission, 2011a). Actions against a further ten carriers will be heard in 2012 (Commerce Commission, 2011c).
q42 To what extent are the current regulatory arrangements adequate to deal with the investigation and prosecution of collusive behaviour in international air freight services?
q43 Do the current regulatory and competition regimes that affect international air freight transport services work well, or not, for New Zealand exporters and importers?
q44 Is there a case for the different regulatory treatment of air freight services vs. sea freight services?
q45 What lessons can New Zealand learn from the different ways that competition law and regulators in other countries deal with international air freight services?
4.6 bIosecurITy And cusToms
Biosecurity is managed by the Ministry of Agriculture and Forestry (MAF). Desired outcomes are jointly agreed by MAF, the Ministry of Health, Ministry of Fisheries, Department of Conservation and Te Puni Ko-kiri, which are the lead government agencies with biosecurity interests.
While policy, standards-setting and enforcement are undertaken by these agencies, many actual operational activities such as screening are undertaken by accredited firms (including importers and exporters) under a ‘co-management’ model21. Some of these activities take place away from the physical border, and may even occur in other countries.
The enforcement of border security is largely the responsibility of the New Zealand Customs Service (e.g. collection of duties, detection of prohibited substances) and MAF Biosecurity.
The case study presented in Table 2 suggests that costs arising from customs and biosecurity could be of the order of 10% of overall shipping and logistics costs. These are relatively large costs and the Commission is interested in gaining a better understanding of their size and what drives them. The Commission is also interested in hearing ideas about ways to reduce these costs, while balancing the benefits of reduced costs against any loss in the effectiveness of the services that they fund – the purpose of these services being to safeguard the security and integrity of New Zealand’s inward and outward trade flows.
21 See http://www.biosecurity.govt.nz/files/biosec/sys/new-border-system.pdf. Accessed June 24, 2011.
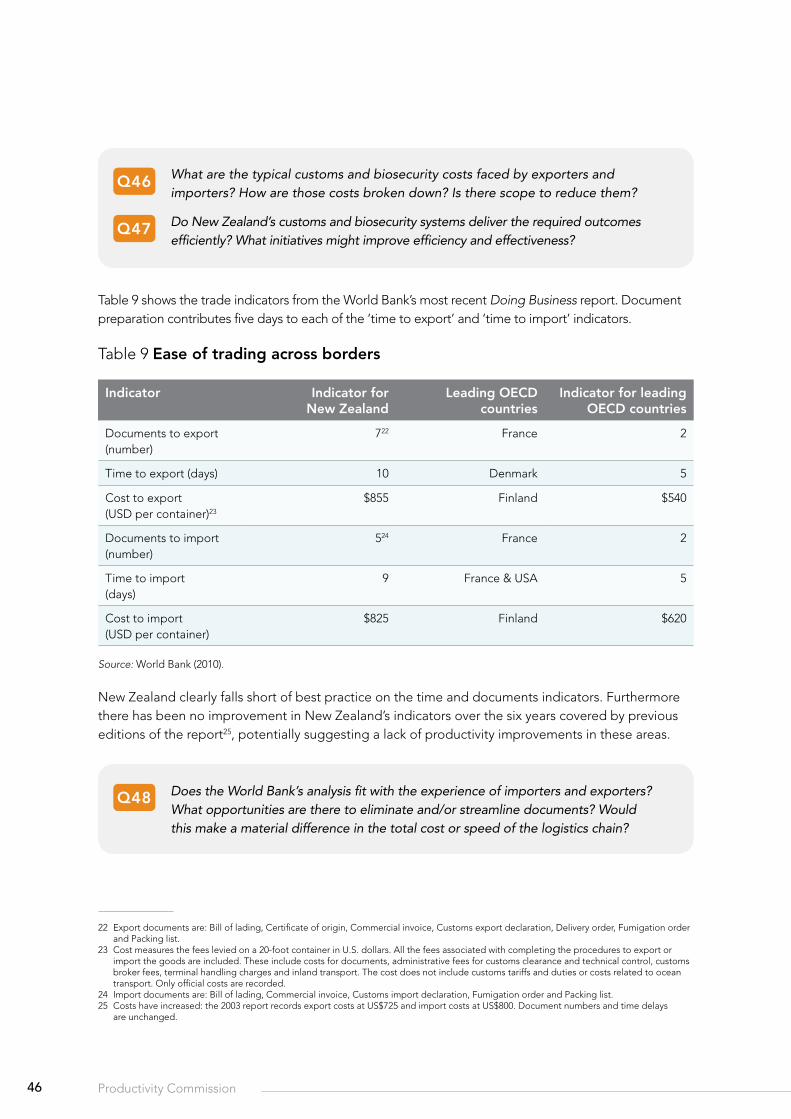
46 Productivity Commission
q46 What are the typical customs and biosecurity costs faced by exporters and importers? How are those costs broken down? Is there scope to reduce them?
q47 Do New Zealand’s customs and biosecurity systems deliver the required outcomes efficiently? What initiatives might improve efficiency and effectiveness?
Table 9 shows the trade indicators from the World Bank’s most recent Doing Business report. Document preparation contributes five days to each of the ‘time to export’ and ‘time to import’ indicators.
Table 9 ease of trading across borders
Indicator Indicator for new Zealand
leading oecd countries
Indicator for leading oecd countries
Documents to export (number)
722 France 2
Time to export (days) 10 Denmark 5
Cost to export (USD per container)23
$855 Finland $540
Documents to import (number)
524 France 2
Time to import (days)
9 France & USA 5
Cost to import (USD per container)
$825 Finland $620
Source: World Bank (2010).222324
New Zealand clearly falls short of best practice on the time and documents indicators. Furthermore there has been no improvement in New Zealand’s indicators over the six years covered by previous editions of the report25, potentially suggesting a lack of productivity improvements in these areas.
q48 Does the World Bank’s analysis fit with the experience of importers and exporters? What opportunities are there to eliminate and/or streamline documents? Would this make a material difference in the total cost or speed of the logistics chain?
22 Export documents are: Bill of lading, Certificate of origin, Commercial invoice, Customs export declaration, Delivery order, Fumigation order and Packing list.
23 Cost measures the fees levied on a 20-foot container in U.S. dollars. All the fees associated with completing the procedures to export or import the goods are included. These include costs for documents, administrative fees for customs clearance and technical control, customs broker fees, terminal handling charges and inland transport. The cost does not include customs tariffs and duties or costs related to ocean transport. Only official costs are recorded.
24 Import documents are: Bill of lading, Commercial invoice, Customs import declaration, Fumigation order and Packing list.25 Costs have increased: the 2003 report records export costs at US$725 and import costs at US$800. Document numbers and time delays
are unchanged.
47International Freight Transport Services | Issues Paper
Wider security costs
In addition to customs and biosecurity costs, exporters also face wider security costs. This has become a major issue post 9/11. Security costs for exporters are driven particularly by new US Government requirements, some of which have been described as excessive (e.g. Mueller & Stewart, 2011). The New Zealand Customs Services has negotiated a ‘trusted partner’ arrangement with the US Department of Homeland Security that has reduced the cost of some of the requirements.
For example, manifests26 and X-ray images of cargo must be provided before loading prior to export to the US. In the case of airfreight, shippers are often not in a position to know what will be loaded in advance of actual loading – as cargo fills up the weight and space left over after passengers are accounted for.
q49 Are there any measures that New Zealand could undertake to reduce the security-related costs imposed on exporters and importers?
Tariffs
Tariffs are a component of total trade costs on imports and have a similar economic effect to transport costs. New Zealand has relatively low tariffs by world standards: an average weighted tariff of 2.2 per cent (NZIER, 2010a). Peak rates are around 10 per cent on some categories of imports. While there may be productivity benefits for New Zealand from the removal of its remaining tariffs on imports, the Commission views this issue as largely outside the scope of this inquiry.
Tariffs imposed on New Zealand exports by other countries are a significant negative influence on the wellbeing of New Zealanders. New Zealand efforts to reduce these barriers remain important, but also fall outside of the scope of this inquiry.
A more relevant point for this inquiry is that New Zealand’s remaining tariffs create transaction costs for importers because the applicable items and rates need to be identified for each shipment. The New Zealand Customs Service also incurs administrative and implementation costs in collecting tariffs and ensuring compliance.
q50 What transaction costs are associated with import tariffs? Are there administrative or other changes that could improve the efficiency of tariff collection?
26 A manifest is a document giving the details of a ship and its cargo, passengers, and crew for the use of customs officers.
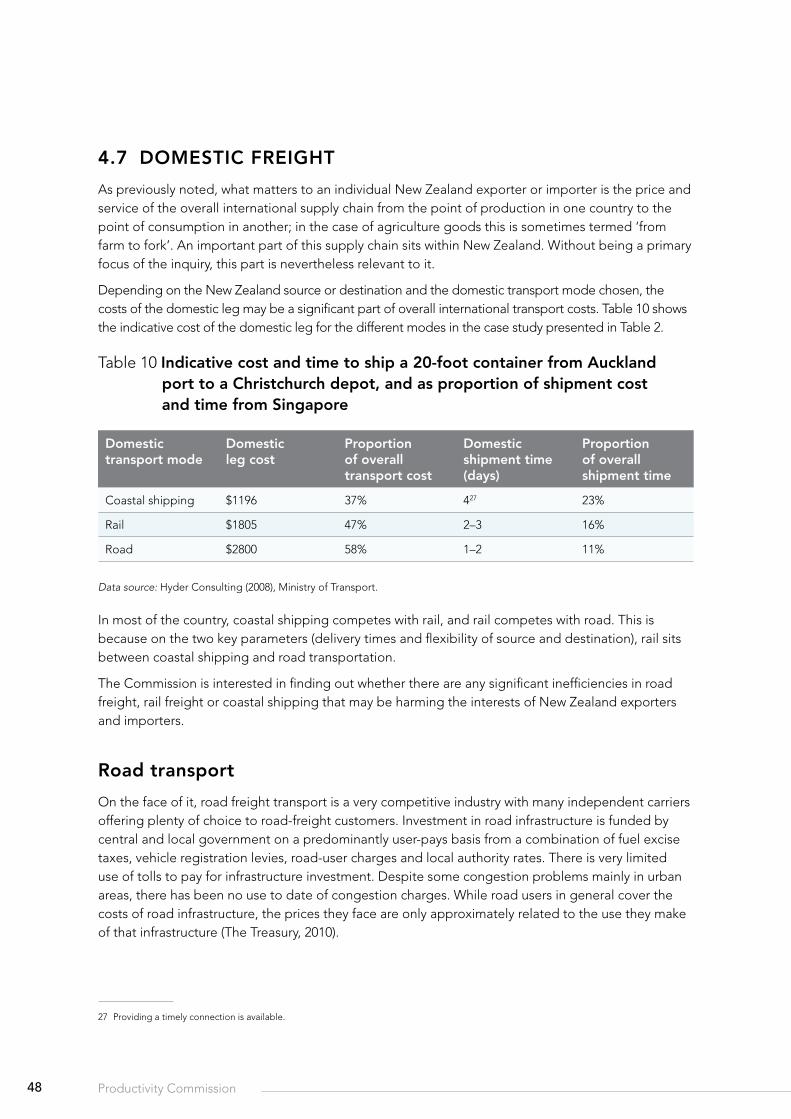
48 Productivity Commission
4.7 domesTIc freIghT
As previously noted, what matters to an individual New Zealand exporter or importer is the price and service of the overall international supply chain from the point of production in one country to the point of consumption in another; in the case of agriculture goods this is sometimes termed ‘from farm to fork’. An important part of this supply chain sits within New Zealand. Without being a primary focus of the inquiry, this part is nevertheless relevant to it.
Depending on the New Zealand source or destination and the domestic transport mode chosen, the costs of the domestic leg may be a significant part of overall international transport costs. Table 10 shows the indicative cost of the domestic leg for the different modes in the case study presented in Table 2.
Table 10 Indicative cost and time to ship a 20-foot container from Auckland port to a christchurch depot, and as proportion of shipment cost and time from singapore
domestic transport mode
domestic leg cost
Proportion of overall transport cost
domestic shipment time (days)
Proportion of overall shipment time
Coastal shipping $1196 37% 427 23%
Rail $1805 47% 2–3 16%
Road $2800 58% 1–2 11%
Data source: Hyder Consulting (2008), Ministry of Transport.27
In most of the country, coastal shipping competes with rail, and rail competes with road. This is because on the two key parameters (delivery times and flexibility of source and destination), rail sits between coastal shipping and road transportation.
The Commission is interested in finding out whether there are any significant inefficiencies in road freight, rail freight or coastal shipping that may be harming the interests of New Zealand exporters and importers.
road transport
On the face of it, road freight transport is a very competitive industry with many independent carriers offering plenty of choice to road-freight customers. Investment in road infrastructure is funded by central and local government on a predominantly user-pays basis from a combination of fuel excise taxes, vehicle registration levies, road-user charges and local authority rates. There is very limited use of tolls to pay for infrastructure investment. Despite some congestion problems mainly in urban areas, there has been no use to date of congestion charges. While road users in general cover the costs of road infrastructure, the prices they face are only approximately related to the use they make of that infrastructure (The Treasury, 2010).
27 Providing a timely connection is available.
49International Freight Transport Services | Issues Paper
rail transport
New Zealand rail transport infrastructure and services are supplied by a single state-owned enterprise – KiwiRail. Its objective is to operate as a successful business including covering its operating costs and earning a return on capital. However, KiwiRail is not generating enough commercial revenue to fully cover its costs and currently relies on capital grants and operating subsidies from the taxpayer. Rail freight offers a cheaper alternative to road freight in some instances particularly for long-distance bulk goods and imports and exports from the major ports. Arguably it is a ‘greener’ alternative to road transport in terms of relieving congestion and lower emissions.
coastal shipping
As Table 10 indicates, coastal shipping may well offer the cheapest alternative out of the three domestic modes. Yet it accounts for only 15% of domestic freight movements (measured in tonne-km). While the majority of coastal cargo is bulky and heavy, it also includes a significant volume of containers either in transit between retail distribution depots in Auckland and Christchurch, or on international cargo ships that call at several New Zealand ports as part of the service they offer.
Disadvantages of coastal shipping relative to other domestic transport modes include fewer and slower services, and double-handling costs. But it is also argued that policy discriminates against coastal shipping because it does not receive the explicit and implicit government subsidies that road and rail transport enjoy. Coastal shipping imposes fewer environmental costs than rail and far fewer than road transport28.
q51 What changes in domestic transport institutions, policies and regulations might lead to the greatest improvements in the economic efficiency of the international logistics chain?
28 The estimated figures in this subsection are taken from Rockpoint (2009).
50 Productivity Commission
4.8 freIghT forWArdIng And consolIdATIon
There is a large number of international freight forwarding companies operating in New Zealand. The website of the Customs Brokers and Freight Forwarders Federation of New Zealand (CBAFF) lists over one hundred firms. Based on this figure, the industry would appear to be competitive.
However, the Commerce Commission has prosecuted a number of international freight forwarders operating in New Zealand (e.g. see Commerce Commission, 2011b) over collusion to raise the price of air freight. In his High Court judgement accepting the penalties, Justice Allan noted that the conduct occurred in ‘a market of fundamental importance to New Zealand’.
q52 How competitive is the freight forwarding industry that serves New Zealand exporters and importers? Do the recent Commerce Commission investigations of a number of firms indicate that there are systemic problems, or that the regulatory and competition regime is working well?
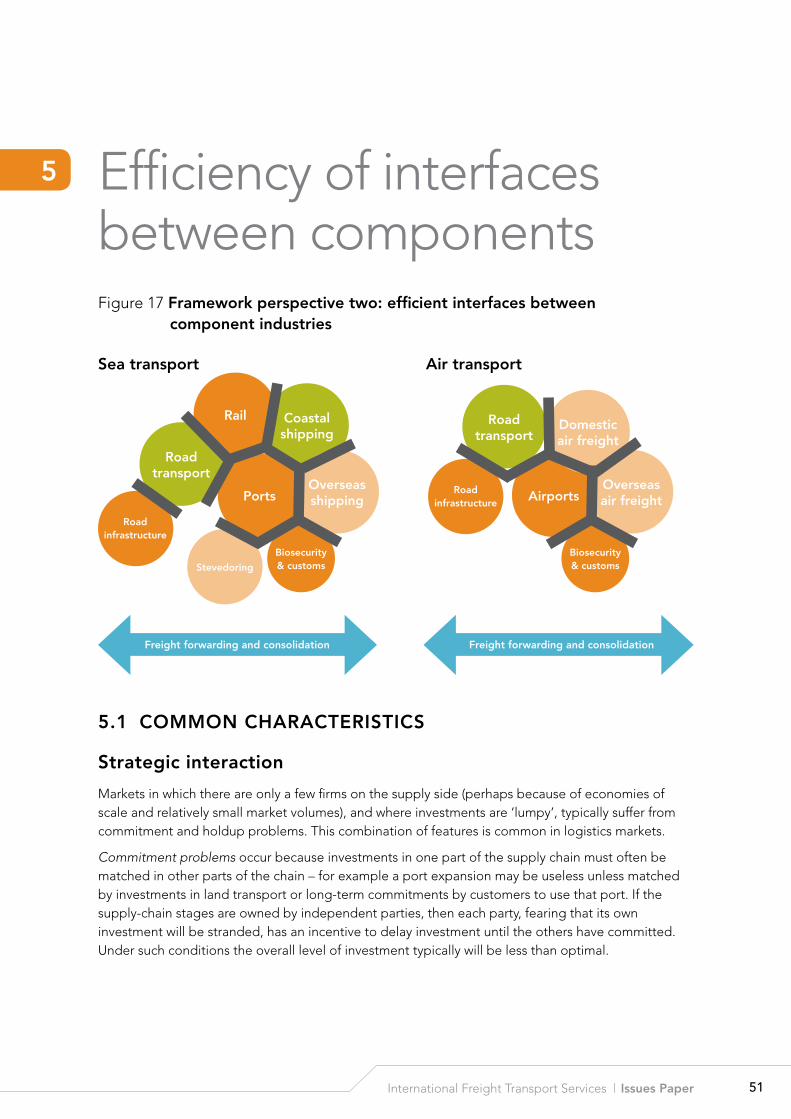
51International Freight Transport Services | Issues Paper
Efficiency of interfaces between componentsFigure 17 framework perspective two: efficient interfaces between
component industries
5.1 common chArAcTerIsTIcs
strategic interaction
Markets in which there are only a few firms on the supply side (perhaps because of economies of scale and relatively small market volumes), and where investments are ‘lumpy’, typically suffer from commitment and holdup problems. This combination of features is common in logistics markets.
Commitment problems occur because investments in one part of the supply chain must often be matched in other parts of the chain – for example a port expansion may be useless unless matched by investments in land transport or long-term commitments by customers to use that port. If the supply-chain stages are owned by independent parties, then each party, fearing that its own investment will be stranded, has an incentive to delay investment until the others have committed. Under such conditions the overall level of investment typically will be less than optimal.
5
Ports
rail
road transport
coastal shipping
overseas shipping
road infrastructure
stevedoring
biosecurity & customs
sea transport
freight forwarding and consolidation
Air transport
Airports
road transport
domestic air freight
overseas air freight
road infrastructure
biosecurity & customs
freight forwarding and consolidation
52 Productivity Commission
Holdup problems occur when parties have assets that cannot be deployed to an alternative use. Potential users of these assets can negotiate favourable prices that do not cover the full costs of providing those assets. Anticipating holdups, firms may underinvest in such assets.
Strategic interaction between firms will determine the prices that apply between stages of the supply chain. Bargaining power is typically determined by the number of choices each player has: those with no alternatives may find themselves unable to shift prices and conditions in their favour. A shipper with a choice of two ports has bargaining power over both the ports. Conversely a port with a captive customer (one who has no economic alternative but to use that port) has bargaining power over both the customer and the carriers that service that customer.
The Commission is interested in how well domestic freight transport integrates with ports, airports and beyond. As noted, there are important interdependencies between the design, location and investment in road and rail networks and the ports and airports that they connect with.
costs of time in transit
Time in transit is a significant source of cost. While it does not matter too much for many bulk commodities, transit time is critical in two cases: when demand for goods is uncertain and when goods are subject to rapid deterioration (Hummels et al, 2007). For non-perishable products with predictable demand, the major source of time costs is financing the goods while they are unavailable for use.
Air transport provides an effective way of dealing with uncertain demand and rapid deterioration, but at a substantially higher transport cost. It is estimated that each additional day that a product is delayed reduces trade in that product by more than one per cent (Djankov, Freund & Pham, 2008). While it can be difficult or expensive29 to reduce transit times while shipments are actually in motion, a significant amount of total transit time is spent in waiting, particularly at the interfaces between different transport modes.
Given New Zealand’s distance from world markets, the cost of time in transit can be very high. Hummels et al (2007) calculated New Zealand time costs of 1 per cent of value per day for imports and 0.6 per cent of value per day for exports.
Some data relating to transit time delays in sea freight are presented in Section 6.2.
q53 What are the costs of transit time to importers and exporters?
q54 What sources of delay contribute to transit time? How might those delays be efficiently reduced?
29 According to a cost model reported Notteboom & Vernimmen (2009) using a bunker fuel price of US$450/ton, a speed increase for a 4000 TEU vessel from 20 to 24 knots results in container transport costs increasing by 8%. This effect would be more substantial at current bunker fuel prices (US$650-$675 per metric tonne as at 11 June 2001, according to http://www.bunkerworld.com/prices/).
53International Freight Transport Services | Issues Paper
5.2 seA freIghT InTerfAces
vertical integration and unbundling
Notteboom (2008) documents patterns of sea-freight competition in Europe, where shipping lines compete through owning terminal operations at ports, and ports compete through owning land transport companies that service port hinterlands. In particular, port investment in rail infrastructure to create inland ports servicing the hinterland of competing ports can create vigorous competition in markets that were previously geographic monopolies.
Local authority ownership of ports and preferences regarding within-port competition, along with government ownership of rail, would appear to reduce the likelihood of these forms of vertical integration in New Zealand.
In other cases efficiency can be enhanced through the opposite approach: the vertical unbundling of components, or activities within components. This involves:
• separation of contestable activities from those with natural monopoly characteristics;
• opening the contestable activities to entry and competition; and
• (in many cases) regulation to facilitate access to natural-monopoly infrastructure on competitively-neutral terms.
q55 Are there potential efficiency gains from vertical integration in New Zealand’s international sea freight services? What are the disadvantages? What might need to change in order to allow or encourage greater vertical integration?
q56 Are there potential efficiency gains from the vertical unbundling of specific components or activities in New Zealand’s international sea freight services? What are the disadvantages?
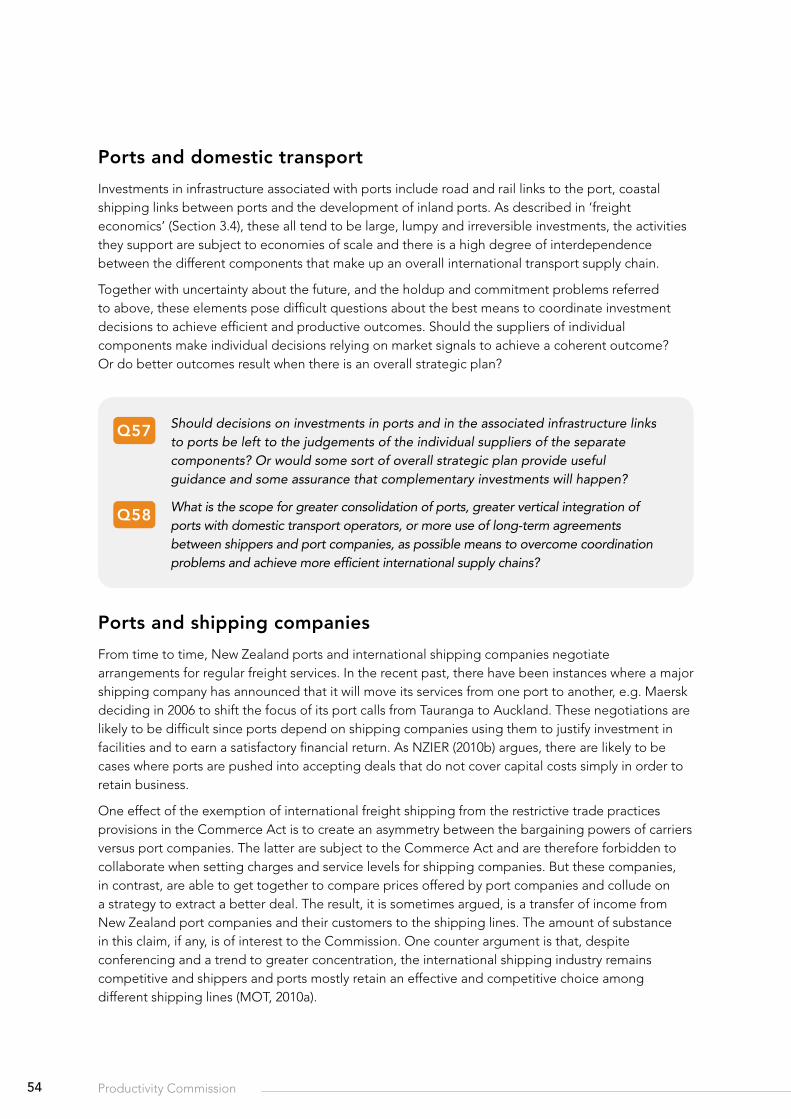
54 Productivity Commission
Ports and domestic transport
Investments in infrastructure associated with ports include road and rail links to the port, coastal shipping links between ports and the development of inland ports. As described in ‘freight economics’ (Section 3.4), these all tend to be large, lumpy and irreversible investments, the activities they support are subject to economies of scale and there is a high degree of interdependence between the different components that make up an overall international transport supply chain.
Together with uncertainty about the future, and the holdup and commitment problems referred to above, these elements pose difficult questions about the best means to coordinate investment decisions to achieve efficient and productive outcomes. Should the suppliers of individual components make individual decisions relying on market signals to achieve a coherent outcome? Or do better outcomes result when there is an overall strategic plan?
q57 Should decisions on investments in ports and in the associated infrastructure links to ports be left to the judgements of the individual suppliers of the separate components? Or would some sort of overall strategic plan provide useful guidance and some assurance that complementary investments will happen?
q58 What is the scope for greater consolidation of ports, greater vertical integration of ports with domestic transport operators, or more use of long-term agreements between shippers and port companies, as possible means to overcome coordination problems and achieve more efficient international supply chains?
Ports and shipping companies
From time to time, New Zealand ports and international shipping companies negotiate arrangements for regular freight services. In the recent past, there have been instances where a major shipping company has announced that it will move its services from one port to another, e.g. Maersk deciding in 2006 to shift the focus of its port calls from Tauranga to Auckland. These negotiations are likely to be difficult since ports depend on shipping companies using them to justify investment in facilities and to earn a satisfactory financial return. As NZIER (2010b) argues, there are likely to be cases where ports are pushed into accepting deals that do not cover capital costs simply in order to retain business.
One effect of the exemption of international freight shipping from the restrictive trade practices provisions in the Commerce Act is to create an asymmetry between the bargaining powers of carriers versus port companies. The latter are subject to the Commerce Act and are therefore forbidden to collaborate when setting charges and service levels for shipping companies. But these companies, in contrast, are able to get together to compare prices offered by port companies and collude on a strategy to extract a better deal. The result, it is sometimes argued, is a transfer of income from New Zealand port companies and their customers to the shipping lines. The amount of substance in this claim, if any, is of interest to the Commission. One counter argument is that, despite conferencing and a trend to greater concentration, the international shipping industry remains competitive and shippers and ports mostly retain an effective and competitive choice among different shipping lines (MOT, 2010a).
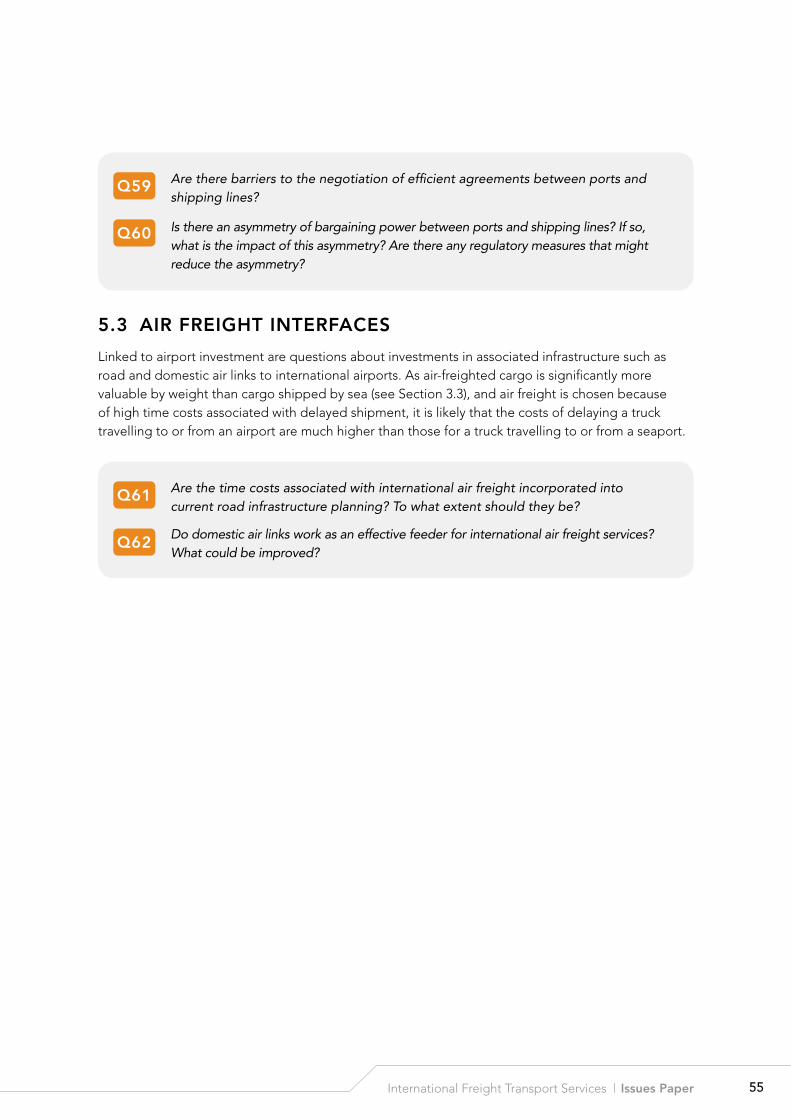
55International Freight Transport Services | Issues Paper
q59 Are there barriers to the negotiation of efficient agreements between ports and shipping lines?
q60 Is there an asymmetry of bargaining power between ports and shipping lines? If so, what is the impact of this asymmetry? Are there any regulatory measures that might reduce the asymmetry?
5.3 AIr freIghT InTerfAces
Linked to airport investment are questions about investments in associated infrastructure such as road and domestic air links to international airports. As air-freighted cargo is significantly more valuable by weight than cargo shipped by sea (see Section 3.3), and air freight is chosen because of high time costs associated with delayed shipment, it is likely that the costs of delaying a truck travelling to or from an airport are much higher than those for a truck travelling to or from a seaport.
q61 Are the time costs associated with international air freight incorporated into current road infrastructure planning? To what extent should they be?
q62 Do domestic air links work as an effective feeder for international air freight services? What could be improved?
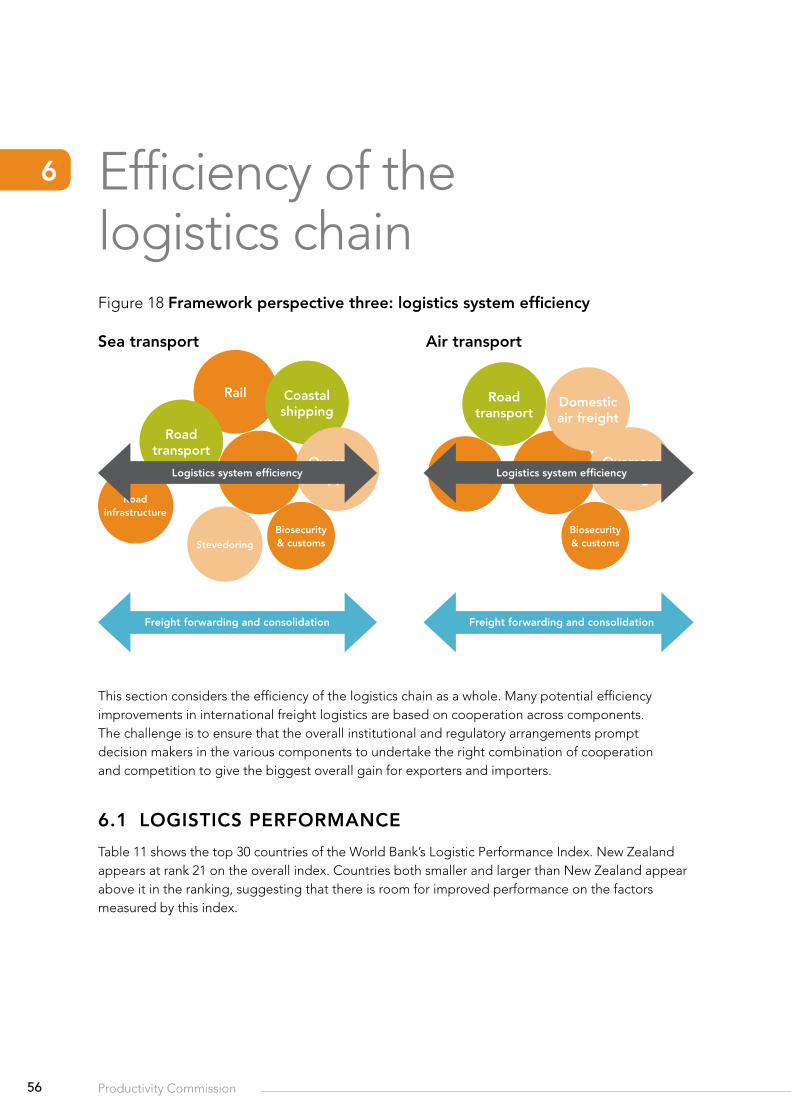
56 Productivity Commission
Efficiency of the logistics chainFigure 18 framework perspective three: logistics system efficiency
This section considers the efficiency of the logistics chain as a whole. Many potential efficiency improvements in international freight logistics are based on cooperation across components. The challenge is to ensure that the overall institutional and regulatory arrangements prompt decision makers in the various components to undertake the right combination of cooperation and competition to give the biggest overall gain for exporters and importers.
6.1 logIsTIcs PerformAnce
Table 11 shows the top 30 countries of the World Bank’s Logistic Performance Index. New Zealand appears at rank 21 on the overall index. Countries both smaller and larger than New Zealand appear above it in the ranking, suggesting that there is room for improved performance on the factors measured by this index.
6
Ports
rail
road transport
coastal shipping
overseas shipping
road infrastructure
stevedoring
biosecurity & customs
sea transport
freight forwarding and consolidation
Air transport
Airports
road transport
domestic air freight
overseas air freight
road infrastructure
biosecurity & customs
freight forwarding and consolidation
logistics system efficiency logistics system efficiency
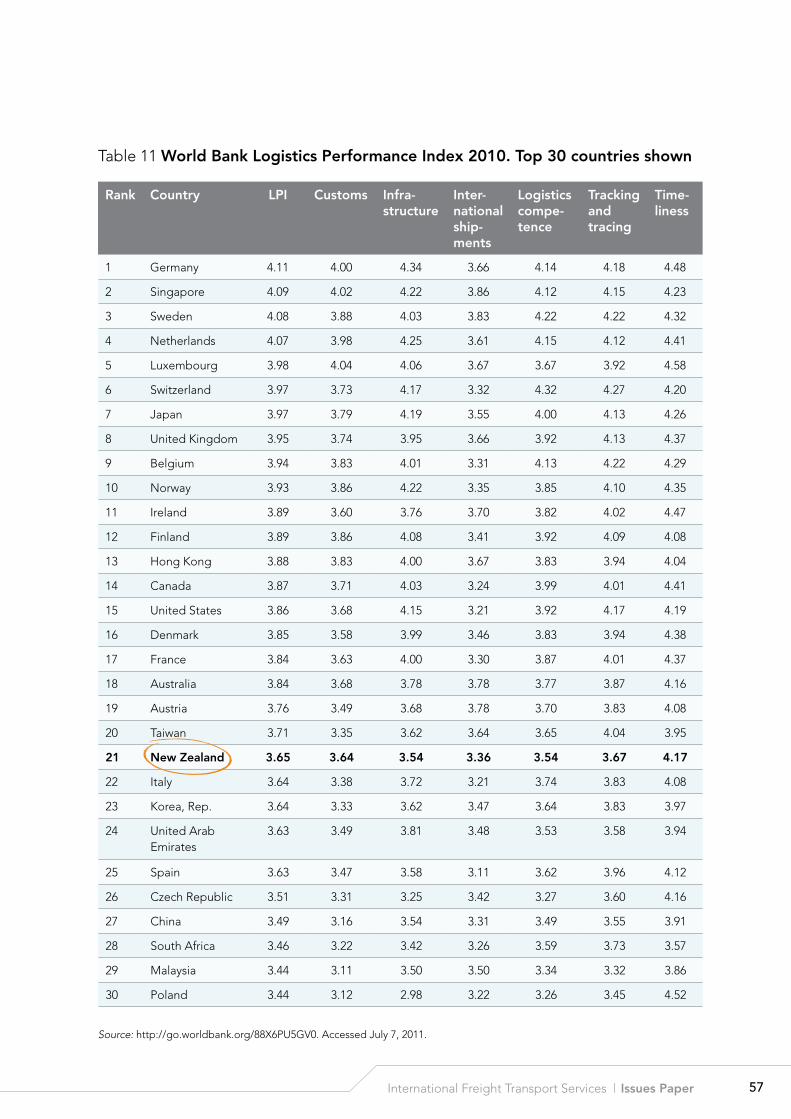
57International Freight Transport Services | Issues Paper
Table 11 World bank logistics Performance Index 2010. Top 30 countries shown
rank country lPI customs Infra-structure
Inter-national ship-ments
logistics compe-tence
Tracking and tracing
Time-liness
1 Germany 4.11 4.00 4.34 3.66 4.14 4.18 4.48
2 Singapore 4.09 4.02 4.22 3.86 4.12 4.15 4.23
3 Sweden 4.08 3.88 4.03 3.83 4.22 4.22 4.32
4 Netherlands 4.07 3.98 4.25 3.61 4.15 4.12 4.41
5 Luxembourg 3.98 4.04 4.06 3.67 3.67 3.92 4.58
6 Switzerland 3.97 3.73 4.17 3.32 4.32 4.27 4.20
7 Japan 3.97 3.79 4.19 3.55 4.00 4.13 4.26
8 United Kingdom 3.95 3.74 3.95 3.66 3.92 4.13 4.37
9 Belgium 3.94 3.83 4.01 3.31 4.13 4.22 4.29
10 Norway 3.93 3.86 4.22 3.35 3.85 4.10 4.35
11 Ireland 3.89 3.60 3.76 3.70 3.82 4.02 4.47
12 Finland 3.89 3.86 4.08 3.41 3.92 4.09 4.08
13 Hong Kong 3.88 3.83 4.00 3.67 3.83 3.94 4.04
14 Canada 3.87 3.71 4.03 3.24 3.99 4.01 4.41
15 United States 3.86 3.68 4.15 3.21 3.92 4.17 4.19
16 Denmark 3.85 3.58 3.99 3.46 3.83 3.94 4.38
17 France 3.84 3.63 4.00 3.30 3.87 4.01 4.37
18 Australia 3.84 3.68 3.78 3.78 3.77 3.87 4.16
19 Austria 3.76 3.49 3.68 3.78 3.70 3.83 4.08
20 Taiwan 3.71 3.35 3.62 3.64 3.65 4.04 3.95
21 new Zealand 3.65 3.64 3.54 3.36 3.54 3.67 4.17
22 Italy 3.64 3.38 3.72 3.21 3.74 3.83 4.08
23 Korea, Rep. 3.64 3.33 3.62 3.47 3.64 3.83 3.97
24 United Arab Emirates
3.63 3.49 3.81 3.48 3.53 3.58 3.94
25 Spain 3.63 3.47 3.58 3.11 3.62 3.96 4.12
26 Czech Republic 3.51 3.31 3.25 3.42 3.27 3.60 4.16
27 China 3.49 3.16 3.54 3.31 3.49 3.55 3.91
28 South Africa 3.46 3.22 3.42 3.26 3.59 3.73 3.57
29 Malaysia 3.44 3.11 3.50 3.50 3.34 3.32 3.86
30 Poland 3.44 3.12 2.98 3.22 3.26 3.45 4.52
Source: http://go.worldbank.org/88X6PU5GV0. Accessed July 7, 2011.
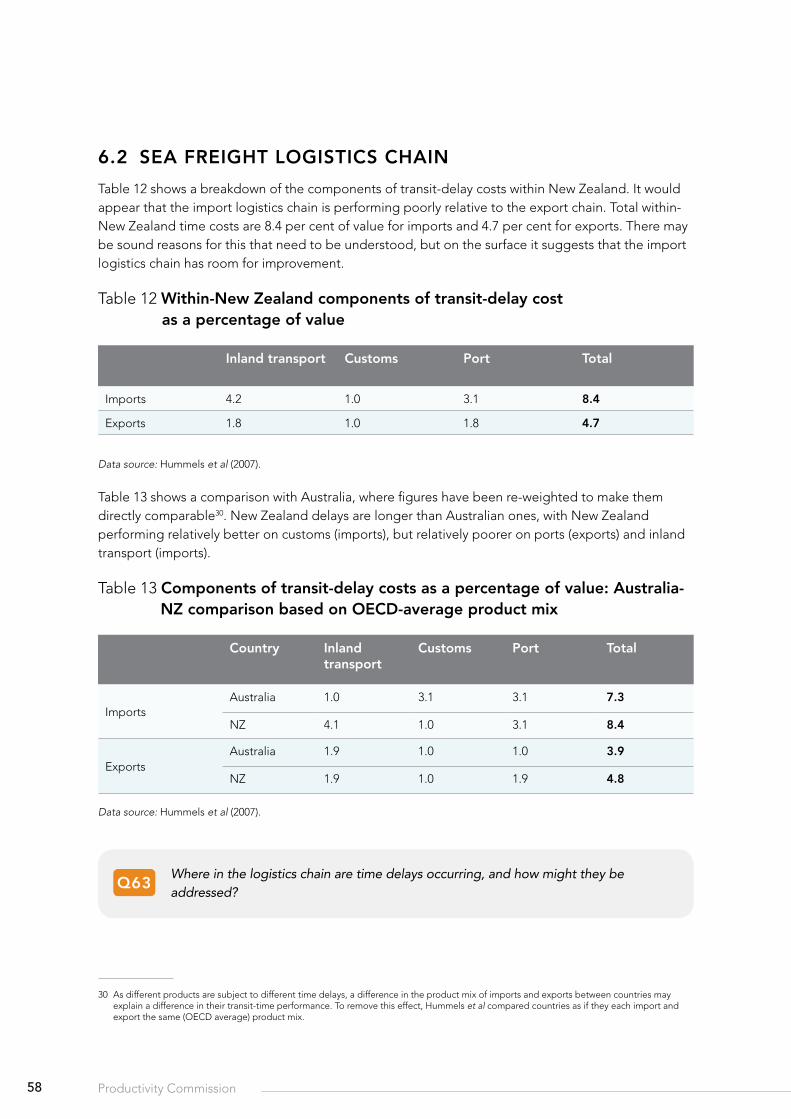
58 Productivity Commission
6.2 seA freIghT logIsTIcs chAIn
Table 12 shows a breakdown of the components of transit-delay costs within New Zealand. It would appear that the import logistics chain is performing poorly relative to the export chain. Total within-New Zealand time costs are 8.4 per cent of value for imports and 4.7 per cent for exports. There may be sound reasons for this that need to be understood, but on the surface it suggests that the import logistics chain has room for improvement.
Table 12 Within-new Zealand components of transit-delay cost as a percentage of value
Inland transport customs Port Total
Imports 4.2 1.0 3.1 8.4
Exports 1.8 1.0 1.8 4.7
Data source: Hummels et al (2007).
Table 13 shows a comparison with Australia, where figures have been re-weighted to make them directly comparable30. New Zealand delays are longer than Australian ones, with New Zealand performing relatively better on customs (imports), but relatively poorer on ports (exports) and inland transport (imports).
Table 13 components of transit-delay costs as a percentage of value: Australia-nZ comparison based on oecd-average product mix
country Inland transport
customs Port Total
ImportsAustralia 1.0 3.1 3.1 7.3
NZ 4.1 1.0 3.1 8.4
ExportsAustralia 1.9 1.0 1.0 3.9
NZ 1.9 1.0 1.9 4.8
Data source: Hummels et al (2007).
q63 Where in the logistics chain are time delays occurring, and how might they be addressed?
30 As different products are subject to different time delays, a difference in the product mix of imports and exports between countries may explain a difference in their transit-time performance. To remove this effect, Hummels et al compared countries as if they each import and export the same (OECD average) product mix.
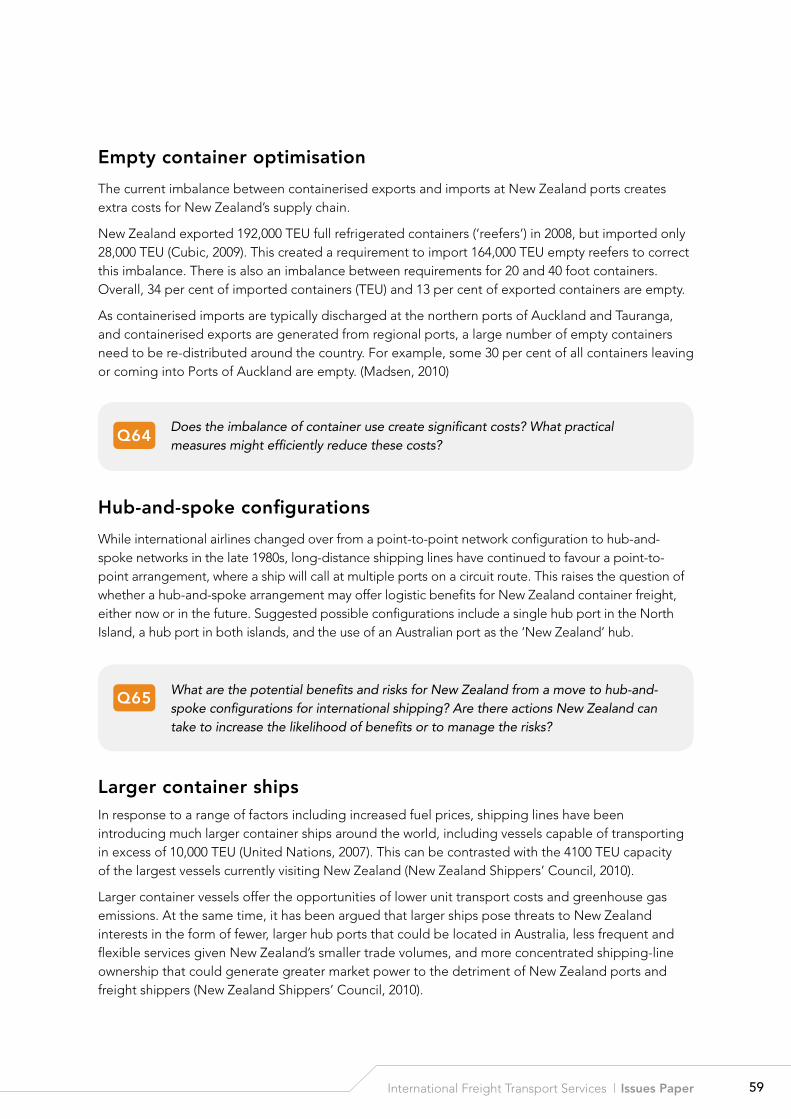
59International Freight Transport Services | Issues Paper
empty container optimisation
The current imbalance between containerised exports and imports at New Zealand ports creates extra costs for New Zealand’s supply chain.
New Zealand exported 192,000 TEU full refrigerated containers (‘reefers’) in 2008, but imported only 28,000 TEU (Cubic, 2009). This created a requirement to import 164,000 TEU empty reefers to correct this imbalance. There is also an imbalance between requirements for 20 and 40 foot containers. Overall, 34 per cent of imported containers (TEU) and 13 per cent of exported containers are empty.
As containerised imports are typically discharged at the northern ports of Auckland and Tauranga, and containerised exports are generated from regional ports, a large number of empty containers need to be re-distributed around the country. For example, some 30 per cent of all containers leaving or coming into Ports of Auckland are empty. (Madsen, 2010)
q64 Does the imbalance of container use create significant costs? What practical measures might efficiently reduce these costs?
hub-and-spoke configurations
While international airlines changed over from a point-to-point network configuration to hub-and-spoke networks in the late 1980s, long-distance shipping lines have continued to favour a point-to-point arrangement, where a ship will call at multiple ports on a circuit route. This raises the question of whether a hub-and-spoke arrangement may offer logistic benefits for New Zealand container freight, either now or in the future. Suggested possible configurations include a single hub port in the North Island, a hub port in both islands, and the use of an Australian port as the ‘New Zealand’ hub.
q65 What are the potential benefits and risks for New Zealand from a move to hub-and-spoke configurations for international shipping? Are there actions New Zealand can take to increase the likelihood of benefits or to manage the risks?
larger container shipsIn response to a range of factors including increased fuel prices, shipping lines have been introducing much larger container ships around the world, including vessels capable of transporting in excess of 10,000 TEU (United Nations, 2007). This can be contrasted with the 4100 TEU capacity of the largest vessels currently visiting New Zealand (New Zealand Shippers’ Council, 2010).
Larger container vessels offer the opportunities of lower unit transport costs and greenhouse gas emissions. At the same time, it has been argued that larger ships pose threats to New Zealand interests in the form of fewer, larger hub ports that could be located in Australia, less frequent and flexible services given New Zealand’s smaller trade volumes, and more concentrated shipping-line ownership that could generate greater market power to the detriment of New Zealand ports and freight shippers (New Zealand Shippers’ Council, 2010).
60 Productivity Commission
The New Zealand Shippers’ Council have identified four ports that could be upgraded (at considerable cost) to handle larger vessels in the 5000–7000 TEU range. One identified risk is that uncoordinated action by port owners could lead to a non-optimal outcome: either too few or too many ports are upgraded to handle vessels of this size.
The land transport connections to ports and freight storage facilities will also require upgrades to handle larger ships; otherwise land transport congestion will likely negate cost and environmental improvements.
It has been argued that government coordination is required to avoid these identified risks. The role of government as an infrastructure coordinator is explored further in Section 6.6.
6.3 AIr freIghT logIsTIcs chAIn
The existence of a large number of ‘flag carriers’ – airlines backed by specific national governments – means that there are more international airlines than might otherwise be the case, many with preferential access to specific airports or routes. This increases the likelihood that international freight will need to swap from one carrier to another en route. As with passenger air travel, alliances between airlines can provide a valuable service by providing timely and seamless connections between flights. Alliances can, however, reduce transparency and provide opportunities to raise prices above competitive rates.
q66 To what extent do formal and informal alliances between airlines improve or detract from the efficiency of international air freight services? Are there opportunities to improve outcomes?
As discussed in Section 5.3, air freight is likely to be much more sensitive to time delays than sea freight. This means that the costs of poor coordination in the air freight logistics chain will typically be higher. While the costs of these delays create some powerful incentives for cooperation in their reduction, it is possible that further improvements to systems are available.
q67 What measures might improve the overall system efficiency of the logistics chain for international air freight?
61International Freight Transport Services | Issues Paper
6.4 AccessIbIlITy of servIces
In an efficient system, firms provide whatever goods and services customers desire whenever they can profitably provide them at prices those customers are willing to pay.
An accessibility problem exists if a good or service is not supplied, even though demand exists and it could be efficiently provided. While accessibility has been addressed in various ways throughout this issues paper, the Commission would like to know if anything important has been overlooked.
q68 Are import and export opportunities excluded or constrained by the lack of access to international freight transport services? Are there changes in institutions, policies or regulations that could lead to better outcomes?
6.5 lIKely fuTure Trends In mArKeTs And Technology
Improved logistics information systems have allowed freight to be tracked across the supply chain, transport supply to be more closely matched to demand, and better use made of spare capacity. There is potential scope for such systems to further increase supply chain efficiency by sharing data across transport modes and between transport suppliers and consumers. For example the websites www.findatruckload.co.nz and www.backload4u.co.nz are designed to fill otherwise empty trucks on return journeys.
Sharing operational data across firms does, however, create some complex issues of data ownership, and the potential for misuse – including the stifling of competition.
q69 Is there scope for increased sharing of operational data between transport firms to achieve improved coordination and efficiency? How might this be achieved?
q70 Do the restrictive trade practices provisions of the Commerce Act deter the efficient sharing of operational data?
Competition between ports has been encouraged in Australia through requirements to disclose performance measures on a regular basis to enable easy benchmarking of port efficiency. These data are collected and published on a regular basis by the Bureau of Infrastructure, Transport and Regional Economics (e.g. BITRE, 2010). BITRE also collates and publishes benchmarking data on other components such as international airline activity (e.g. BITRE, 2011).
q71 Is there a role for government to require the disclosure of performance measures in specific components, and to collate and publish that data?
62 Productivity Commission
New technology continues to change the face of international transport. Containerisation has allowed cargo to be moved more quickly and efficiently than the break-bulk system it replaced. Larger and more fuel-efficient ships and aircraft have, to at least some extent, offset increasing liquid fuel prices (Hummels, 2009).
A potential risk facing New Zealand is missing out on the benefits of the latest technologies which rely heavily on larger ships and associated economies of scale.
For this inquiry, the Commission is interested in what future changes are likely in international freight transport and how New Zealand can best position itself to make the most of the opportunities and protect against threats.
q72 Given likely future trends in trading patterns and transport technology, will the reliability, speed and efficiency of international logistics services be adequate for New Zealand’s interests? If not, what can be done to leverage opportunities and mitigate risks?
6.6 sTrATegIc PlAnnIng
As described in the Section 3.4 on freight economics, many investments in the components of international supply chains are large, lumpy and irreversible, the activities they support are subject to economies of scale, and there is a high degree of interdependence between the different components. Should the suppliers of the individual components make individual decisions relying on market signals to achieve a coherent outcome? Or are there likely to be coordination failures that could be mitigated with some sort of overall strategic plan?
Strategic planning that spans multiple ports, airports and other components of the logistics chain could occur via different approaches including:
• coordinated planning undertaken by two or more firms, backed by contractual agreements between those firms;
• internal planning following a merger of two or more firms; or
• planning led by central or regional governments.
Current ownership arrangements would appear to discourage port and airport mergers and may similarly discourage contractual agreements that could have the effect of shifting economic activity between regions (see Sections 4.1 and 4.4). The Commerce Act might also prevent mergers between the larger ports and airports, and negotiations between individual firms risk being deemed anti-competitive behaviour.
63International Freight Transport Services | Issues Paper
q73 What is the best way to achieve efficient decisions and coordination for the large, lumpy and interdependent investments that typically occur along international freight supply chains?
q74 What factors would favour the choice of decentralised vs. centralised strategic planning?
6.7 logIsTIcs cosT And ProducTIvITy InformATIon
A task for the Commission, laid down in the inquiry’s Terms of Reference, is to establish the total logistics costs faced by New Zealand exporters and importers, understand the components and their relative importance, and to make relevant international comparisons.
There is a similar task in relation to establishing the level and growth of productivity in all components of New Zealand’s international freight transport supply chain with international comparisons.
While the Commission has made progress in these tasks, a lot of gaps remain.
q75 What costs exist in the various components of the international freight transport supply chain and how have they been changing over time? How do these figures compare with those for other relevant comparator countries?
q76 What productivity levels exist in the various components of the international freight transport supply chain and how have they been changing over time? How do these figures compare with those for other relevant comparator countries?
q77 Are you able to contribute data that would assist the Commission?
64 Productivity Commission
Next steps7.1 AsKIng The rIghT quesTIons
The release of this issues paper marks the second formal stage of the Commission’s inquiry into international freight transport services (following the Terms of Reference). The primary purpose of the issues paper is to survey the landscape of the inquiry topic, identify significant issues and ask questions that stakeholders and other interested parties can help to answer. Submissions in response to the issues paper are welcome at any time up to 31 August 2011.
The Commission plans to further develop the subject matter covered in this issues paper in response to submissions and in light of further research. This stage of an inquiry is also a valuable opportunity to check whether any important issues have been missed.
q78 Has this issues paper covered the key issues? What other questions need to be asked?
q79 What are the most important issues for the Commission to focus on to achieve the greatest improvements in the efficiency and productivity of New Zealand’s international freight transport services?
7.2 submIssIons And nexT sTePs
The Commission invites submissions on this issues paper by 31 August 2011. Before and after then, the Commission expects to consult with a wide range of people and organisations interested in international freight transport services.
The Commission expects to issue a draft inquiry report in December 2011. There will be an opportunity for public submissions on the draft report. The inquiry’s final report will be presented to the Government in April 2012.
7

65International Freight Transport Services | Issues Paper
A summary of the questions
What environmental considerations
should fall within the scope of this inquiry?
Are there important issues that may be
overlooked as a result of adopting an economic efficiency perspective
for this inquiry? What changes in governance, regulations or ownership
would offer the best means to improve port performance for exporters and importers?
What has the commission been asked to do?
q1 Are there important issues that may be overlooked as a result of adopting an economic efficiency perspective for this inquiry?
context
q2 Is the framework described in Section 3.2 appropriate for this inquiry? Are there any important issues that might be missed?
q3 Which components and component interfaces warrant greater attention? What is the evidence that they are inefficient? What contribution could changes make to an improvement in the overall efficiency of the freight system?
q4 What environmental considerations should fall within the scope of this inquiry? What issues are of particular importance?
efficiency of individual components
q5 To what extent is there effective competition for customers between New Zealand ports? Has this led to lower prices and incentives for productivity improvements?
q6 What are the most appropriate and reliable data available to measure port performance and productivity in container handling?
q7 What are the most appropriate and reliable data available to measure port efficiency and productivity in handling bulk cargo?
q8 Which overseas ports are appropriate comparators for New Zealand port performance? On what basis should this selection be made?
q9 Did port productivity improve during the 1990s? What were the drivers of those improvements?
q10 Did the rate of productivity improvements flatten during the 2000s? Why? What might reinvigorate performance improvement?
66 Productivity Commission
What lessons can New Zealand learn from the different ways
that competition law and regulators in other jurisdictions
deal with international sea freight services?
To what extent is the international air freight industry competitive?
q11 What is the most appropriate way to measure port profitability? What is an appropriate rate of return on assets and equity?
q12 Is there evidence of a systemic problem of low port profitability? Or conversely, excessive profitability?
q13 What levels of investment have ports undertaken in recent years? Are they consistent with accessible and efficient services to exporters and importers? Is there an over- or under-investment problem in ports?
q14 Does New Zealand have too many ports for a small country? If so, what barriers are inhibiting rationalisation?
q15 Has local-authority ownership of majority stakes in New Zealand’s commercial ports inhibited, enhanced or been neutral for the development of a more efficient and productive port sector?
q16 What changes in governance, regulations or ownership would offer the best means to improve port performance for exporters and importers?
q17 How much variation in the efficiency and productivity performance of ports is explained by the way that within-port activities are organised? Do ‘contracting out’ and ‘landlord’ models offer a way to increase competition for the benefit of exporters and importers?
q18 To what extent do inflexible labour practices and difficulties in employer-union relationships remain an obstacle to lifting efficiency and productivity at New Zealand ports?
q19 From the perspective of New Zealand importers and exporters, to what extent is the international shipping industry competitive?
q20 To what extent have collaboration agreements between international sea carriers been helpful or harmful to the interests of New Zealand importers and exporters?
q21 What is the basis for the different regulatory treatment of imports and exports under the Commerce Act and Shipping Act? Is this differential treatment justified?
q22 Have any actions (foreshadowed or actual) been undertaken under the Shipping Act 1987? Does the Act deter unfair practices?
q23 Would the Commerce Commission be better placed than the Minister of Transport to oversee the regulation of international shipping services?
q24 To what extent do the current regulatory and competition regimes that affect international sea freight transport services work well or not for New Zealand exporters and importers?
To what extent have collaboration agreements between international sea carriers been helpful or harmful
to the interests of New Zealand importers and exporters?
67International Freight Transport Services | Issues Paper
Do New Zealand’s customs and biosecurity systems deliver the required outcomes efficiently? What initiatives might improve efficiency and effectiveness?
What are the costs of transit time to importers
and exporters?
q25 How do international shipping conferences permitted under the Shipping Act 1987 affect the accessibility and efficiency of sea freight services available to New Zealand exporters and importers? How strong or weak is the case for the exemption of conferences from the competition provisions of the Commerce Act?
q26 What lessons can New Zealand learn from the different ways that competition law and regulators in other jurisdictions deal with international sea freight services?
q27 Are Auckland, Christchurch and Wellington airports subject to competitive pressure for the air-freight related services they provide? Do they exert market power to the detriment of New Zealand exporters and importers?
q28 Do current ownership and governance arrangements of New Zealand’s international freight airports have any significant positive or negative effects on their long-term efficient configuration and operation, with respect to the supply of freight services?
q29 The objective of a port company under the Port Companies Act is to ‘operate as a successful business’. Should airport companies owned by local authorities have the same single objective rather than the multiple objectives specified in the Local Government Act?
q30 What levels of investment have Auckland and Christchurch airports undertaken in international freight, and are they consistent with accessible and efficient services for New Zealand exporters and importers?
q31 Should the future size and shape of New Zealand air freight services be left to market forces and individual airport owners, or do lumpiness and interdependence (including with investments in connecting parts of the overall supply chain) call for a more deliberately coordinated approach?
q32 What are the most appropriate measures of airport performance in international air freight? Can you assist the Commission by providing data that compares New Zealand airports against others?
q33 Are there opportunities to introduce or increase competition in the provision of air freight-related services at airports? Would such competition lead to better outcomes?
q34 Is the existing and planned Commerce Commission regulation of airports sufficient to restrain monopoly pricing and induce an efficient level of investment? If not, what should change?
q35 To what extent is the international air freight industry competitive?
q36 Are there specific air freight routes to or from New Zealand with low levels of competition? Is there evidence of overpricing or poor service levels on these routes?
q37 How do bilateral air services agreements affect the accessibility and efficiency of air freight services available to New Zealand exporters and importers?
68 Productivity Commission
Are there barriers to the negotiation of efficient agreements between
ports and shipping lines?
Do the restrictive trade practices provisions of the Commerce Act
deter the efficient sharing of operational data?
q38 What explanations exist for the different treatment of international air freight in the Civil Aviation Act compared with the normal competition requirements of the Commerce Act? Do the objectives of the current regulatory treatment continue to be justified?
q39 Should the regulatory functions in Part 9 of the Civil Aviation Act be the responsibility of the Commerce Commission rather than the Minister of Transport?
q40 Does the Cargo Agents’ Commission Regime perform an active and useful function in international air freight services? Who does it benefit? Is the exemption from the Commerce Act required to achieve that function?
q41 Has S.90 of the Civil Aviation Act been used in practice? What are the arguments for retention of the ability of the Minister to issue a tariff?
q42 To what extent are the current regulatory arrangements adequate to deal with the investigation and prosecution of collusive behaviour in international air freight services?
q43 Do the current regulatory and competition regimes that affect international air freight transport services work well, or not, for New Zealand exporters and importers?
q44 Is there a case for the different regulatory treatment of air freight services vs. sea freight services?
q45 What lessons can New Zealand learn from the different ways that competition law and regulators in other countries deal with international air freight services?
q46 What are the typical customs and biosecurity costs faced by exporters and importers? How are those costs broken down? Is there scope to reduce them?
q47 Do New Zealand’s customs and biosecurity systems deliver the required outcomes efficiently? What initiatives might improve efficiency and effectiveness?
q48 Does the World Bank’s analysis fit with the experience of importers and exporters? What opportunities are there to eliminate and/or streamline documents? Would this make a material difference in the total cost or speed of the logistics chain?
q49 Are there any measures that New Zealand could undertake to reduce the security-related costs imposed on exporters and importers?
q50 What transaction costs are associated with import tariffs? Are there administrative or other changes that could improve the efficiency of tariff collection?
q51 What changes in domestic transport institutions, policies and regulations might lead to the greatest improvements in the economic efficiency of the international logistics chain?
69International Freight Transport Services | Issues Paper
What measures might improve the overall system efficiency
of the logistics chain for international air freight?
What are the most important issues for the Commission to focus on to achieve the
greatest improvements in the efficiency and productivity of New Zealand’s international freight transport services?
q52 How competitive is the freight forwarding industry that serves New Zealand exporters and importers? Do the recent Commerce Commission investigations of a number of firms indicate that there are systemic problems, or that the regulatory and competition regime is working well?
efficiency of interfaces between components
q53 What are the costs of transit time to importers and exporters?
q54 What sources of delay contribute to transit time? How might those delays be efficiently reduced?
q55 Are there potential efficiency gains from vertical integration in New Zealand’s international sea freight services? What are the disadvantages? What might need to change in order to allow or encourage greater vertical integration?
q56 Are there potential efficiency gains from the vertical unbundling of specific components or activities in New Zealand’s international sea freight services? What are the disadvantages?
q57 Should decisions on investments in ports and in the associated infrastructure links to ports be left to the judgements of the individual suppliers of the separate components? Or would some sort of overall strategic plan provide useful guidance and some assurance that complementary investments will happen?
q58 What is the scope for greater consolidation of ports, greater vertical integration of ports with domestic transport operators, or more use of long-term agreements between shippers and port companies, as possible means to overcome coordination problems and achieve more efficient international supply chains?
q59 Are there barriers to the negotiation of efficient agreements between ports and shipping lines?
q60 Is there an asymmetry of bargaining power between ports and shipping lines? If so, what is the impact of this asymmetry? Are there any regulatory measures that might reduce the asymmetry?
q61 Are the time costs associated with international air freight incorporated into current road infrastructure planning? To what extent should they be?
q62 Do domestic air links work as an effective feeder for international air freight services? What could be improved?
efficiency of the logistics chain
q63 Where in the logistics chain are time delays occurring, and how might they be addressed?
q64 Does the imbalance of container use create significant costs? What practical measures might efficiently reduce these costs?
70 Productivity Commission
Are you able to contribute data that would assist
the Commission?
Given likely future trends in trading patterns and transport technology,
will the reliability, speed and efficiency of international logistics
services be adequate for New Zealand’s interests?
q65 What are the potential benefits and risks for New Zealand from a move to hub-and-spoke configurations for international shipping? Are there actions New Zealand can take to increase the likelihood of benefits or to manage the risks?
q66 To what extent do formal and informal alliances between airlines improve or detract from the efficiency of international air freight services? Are there opportunities to improve outcomes?
q67 What measures might improve the overall system efficiency of the logistics chain for international air freight?
q68 Are import and export opportunities excluded or constrained by the lack of access to international freight transport services? Are there changes in institutions, policies or regulations that could lead to better outcomes?
q69 Is there scope for increased sharing of operational data between transport firms to achieve improved coordination and efficiency? How might this be achieved?
q70 Do the restrictive trade practices provisions of the Commerce Act deter the efficient sharing of operational data?
q71 Is there a role for government to require the disclosure of performance measures in specific components, and to collate and publish that data?
q72 Given likely future trends in trading patterns and transport technology, will the reliability, speed and efficiency of international logistics services be adequate for New Zealand’s interests? If not, what can be done to leverage opportunities and mitigate risks?
q73 What is the best way to achieve efficient decisions and coordination for the large, lumpy and interdependent investments that typically occur along international freight supply chains?
q74 What factors would favour the choice of decentralised vs. centralised strategic planning?
q75 What costs exist in the various components of the international freight transport supply chain and how have they been changing over time? How do these figures compare with those for other relevant comparator countries?
q76 What productivity levels exist in the various components of the international freight transport supply chain and how have they been changing over time? How do these figures compare with those for other relevant comparator countries?
q77 Are you able to contribute data that would assist the Commission?
next steps
q78 Has this issues paper covered the key issues? What other questions need to be asked?
q79 What are the most important issues for the Commission to focus on to achieve the greatest improvements in the efficiency and productivity of New Zealand’s international freight transport services?.
71International Freight Transport Services | Issues Paper
Appendix 1 – Terms of ReferenceneW ZeAlAnd ProducTIvITy commIssIon InquIry InTo InTernATIonAl freIghT TrAnsPorT servIces
Issued by the Minister of Finance, the Minister of Commerce, the Minister of Transport, and the Minister for Regulatory Reform (‘the referring Ministers’).
Pursuant to sections 9 and 11 of the New Zealand Productivity Commission Act 2010, we hereby request that the New Zealand Productivity Commission (‘the Commission’) undertake an inquiry into international freight transport services.
context
Increasing international trade is a critical part of achieving productivity growth in New Zealand. Given that freight transport costs (including port charges) currently represent a sizeable proportion of international trading costs for New Zealand firms, it is important to ensure that New Zealand’s infrastructure and regulatory regimes are effective in promoting accessibility and efficiency in international freight transport services, while continuing to meet New Zealand’s international obligations. Currently, certain aspects of international carriage by air and sea are exempted from parts of the Commerce Act 1986 and subject to industry-specific regimes under Part IX of the Civil Aviation Act 1990 and Part 1 of the Shipping Act 1987 respectively.
scope
Having regard to the context outlined above, the referring Ministers request that the Commission undertake an inquiry to evaluate the factors influencing the accessibility and efficiency of international freight transport services available to New Zealand firms, and opportunities to increase the accessibility and efficiency of these services. For the purposes of this evaluation the Commission should:
• identify and analyse the cost of all components of the international freight transport supply chain for New Zealand importers and exporters;
• identify any impediments to the accessibility of the international freight transport services, and to competition within and between the components of the international freight transport supply chain; and
• identify mechanisms available to improve the accessibility and efficiency of the international transport supply chain.
72 Productivity Commission
Particular attention should be given, without limitation, to the following matters:
a) the nature of New Zealand’s international trade, including the effects of distance from overseas markets and reliance on overseas providers of international freight transport services;
b) factors influencing the accessibility, cost and efficiency of New Zealand’s international freight transport supply chain, with international comparisons;
c) the level and growth of productivity in all components of New Zealand’s international freight transport supply chain, with international comparisons; and
d) the effectiveness of current regulatory regimes (including those noted above in the Civil Aviation Act 1990 and the Shipping Act 1987) affecting international freight transport services in promoting accessibility and competition, and the potential costs and benefits of alternative regulatory arrangements with international comparisons.
consultation requirements
In undertaking this review, the Commission should consult with key interest groups and affected parties.
Timeframe
The Commission must publish a draft report and/or discussion paper(s) on the inquiry for public comment, followed by a final report, which must be submitted to each of the referring Ministers by 1 April 2012.
Bill English, Minister Of Finance
Simon Power, Minister Of Commerce
Steven Joyce, Minister Of Transport
Rodney Hide, Minister For Regulatory Reform
30 March 2011
73International Freight Transport Services | Issues Paper
Appendix 2 – Relevant legislationSeveral Acts of Parliament provide specialised arrangements for international air and sea freight, for ports, and for firms controlled by local authorities. This Appendix provides a summary of some relevant sections of those Acts31.
commerce Act 1986
Part 2 (‘restrictive trade practices’) does not apply to contracts exclusively for inwards or outwards international carriage of goods by sea (S.44(2)). This exclusion does not apply if the contract relates to the carriage of goods to or from a ship or the loading or unloading of a ship.
S.56–56A of the Act provides for regulation of Auckland, Wellington and Christchurch Airports, including the international freight activities of those airports. These airports are subject to information disclosure requirements as specified by the Commerce Commission. A review of the effectiveness of the information-disclosure regime will be triggered by the first price change for specified airport services in or after 2012 (S.56G).
shipping Act 1987
This Act covers outwards international shipping and the behaviour of carriers (and associations of carriers) towards shippers. Outwards shipping includes any land transport sector within New Zealand. The Act overrides Parts 2 (‘restrictive trade practices’) and 4 (‘regulated goods or services’) of the Commerce Act, providing a customised competition framework that permits conferences and other forms of arrangements between carriers.
Part 2 defines unfair practices as: abuse of dominant position; failure to give reasonable notice to shippers of changes to terms and conditions; refusal or failure to negotiate with shippers; and collusion in tendering. The Minister of Transport can initiate investigations into suspected unfair practices. Following such investigations and being satisfied that a carrier has engaged in unfair practices, the Minister can direct a carrier to: supply details of agreements; give reasonable notice; or enter into negotiations.
civil Aviation Act 1990
Part 9 (‘international air carriage competition’) overrides the Commerce Act under specific circumstances.
S.88 permits the Minister of Transport to authorise contracts, arrangements, or understandings between two or more parties relating to international carriage by air. The negotiation of such contracts, arrangements, or understandings is exempt from S.27–29 (‘practices substantially lessening competition’) of the Commerce Act.
31 Full copies of the Acts may be viewed at www.legislation.govt.nz.
74 Productivity Commission
S.89 permits the Minister to issue a commission regime, specifying agency commissions that apply for international carriage by air.
S.90 permits the Minister to authorise a tariff.
Authorisations and issues under S.88–90 are declared to be specific authorisations under S.43 of the Commerce Act, which exempts them from Part 2 (‘restrictive trade practices’) of that Act.
local government Act 2002
S.10(a) defines the purpose of local government ‘to promote the social, economic, environmental, and cultural well-being of communities, in the present and for the future’
S.5(1) defines a strategic asset as any asset held by a local authority which is deemed necessary for maintaining that authority’s capacity to achieve or promote any outcome that it determines to be important to the current or future wellbeing of its community. All shares held in ports and airports are deemed to be strategic assets (even when they amount to a minority stake-holding).
S.97(1) requires community consultation via a long-term plan before any decision to buy or sell a strategic asset.
S.6(1) defines a council controlled-organisation (CCO) to be an organisation in which one or more councils hold 50 per cent or more of the control rights. That Section further defines a council-controlled trading organisation (CCTO) to be CCO that operates a trading undertaking for the purpose of making a profit.
S.6(4) states that port companies are not CCOs (and therefore cannot be CCTOs)32.
S.59(1) assigns four objectives to CCTOs: to achieve the objectives of its shareholders; to be a good employer; to exhibit a sense of social and environmental responsibility; and to conduct its affairs in accordance with sound business practice.
S.64–65 covers statements of corporate intent. It requires each CCO to create and regularly revise a statement of intent specifying both its commercial and non-commercial outcomes. Council shareholders have the responsibility of considering the statement and the right to modify it.
Port companies Act 1988
S.5 states the principal objective of every port company shall be to operate as a successful business.
S.8–12 covers statements of corporate intent. It requires each port company to create and regularly revise a statement of intent specifying its commercial outcomes. Shareholders have the responsibility of considering the statement and the right to modify it.
S.13–14 provides a mechanism for listed port companies and those with less than 50 per cent council ownership or control to be exempted from the statement of corporate intent process.
32 This exemption does not apply to airport companies. In the context of this inquiry, Christchurch International Airport Limited, along with its 75% owner Christchurch City Holdings Limited, are likely to be the only CCTOs with a significant involvement in the international freight transport industry.
75International Freight Transport Services | Issues Paper
ReferencesAnderson, J.E. & Marcouiller, D. (2002). Insecurity and the pattern of trade – an empirical
investigation. Review of Economics and Statistics. 84 2. pp.342–352.
APEC TWG (2008). Liner Shipping Competition Policy: Non-Ratemaking Agreements Study (Stages 1). APEC Transport Working Group. May. Retrieved June 22, 2011 from: http://www.apec-tptwg.org.cn/new/Archives/tpt-wg32/Maritime/Final/08_tpt_Liner_Stage1.pdf.
Auckland Regional Holdings Ltd (2009). Long-term Optimisation of the New Zealand Port Sector. October 2009. Retrieved June 8, 2011 from: http://www.poal.co.nz/news_media/publications/2009.10.07%20ARH%20Discussion%20Paper%20-%20NZ%20Port%20Sector%20FINAL.pdf.
Australian Productivity Commission (2005). Review of Part X of the Trade Practices Act 1974: International Liner Cargo Shipping, Report No. 32, Productivity Commission, March. Retrieved May 26, 2011 from: http://www.pc.gov.au/__data/assets/pdf_file/0004/33691/shipping.pdf.
Australian Productivity Commission (2010). Australia’s Urban Water Sector, Productivity Commission Issues Paper, September. Retrieved June 27, 2011 from: http://www.pc.gov.au/__data/assets/pdf_file/0017/102680/urban-water-issues.pdf.
BITRE (2009). Australian container ports in an international context. Information paper. 65. Bureau of Infrastructure, Transport and Regional Economics. Canberra. Retrieved June 7, 2011 from: http://www.bitre.gov.au/publications/29/Files/IP65_AUSTRALIAN_PORTS.pdf.
BITRE (2010). Waterline. 48. Bureau of Infrastructure, Transport and Regional Economics Statistical Report. Retrieved June 3, 2011 from: http://www.bitre.gov.au/publications/81/Files/Waterline48.pdf.
BITRE (2011). International Airline Activity 2010. Bureau of Infrastructure, Transport and Regional Economics Statistical Report. Retrieved June 3, 2011 from: http://www.bitre.gov.au/publications/04/Files/CY10.pdf.
Commerce Commission (2002). Final Report Part IV Inquiry into Airfield Activities at Auckland, Wellington, and Christchurch International Airports. Retrieved June 2, 2011 from: http://www.med.govt.nz/upload/7518/airports-full.pdf.
Commerce Commission (2011a). Judgement of Allan J. Commerce Commission vs. Qantas Airways Limited. 11 May 2011. Retrieved June 15, 2011 from: http://www.comcom.govt.nz/assets/Business-Competition/Enforcement-Outcomes/Commerce-Commission-vs-Qantas-Judgment-of-Allan-J-High-Court-Auckland-11-May-2011.pdf.
Commerce Commission (2011b). Judgement of Allan J. Commerce Commission vs. Deutsche Bahn Ag and Others. 13 June 2011. Retrieved June 15, 2011 from: http://www.comcom.govt.nz/assets/Business-Competition/Enforcement-Outcomes/Commerce-Commission-vs-Deutsche-Bahn-AG-and-others-Judgment-of-Allan-J-High-Court-Auckland-13-June-2011.pdf.
76 Productivity Commission
Commerce Commission (2011c). ‘$7.6 million in penalties imposed against two airlines in air cargo cartel case’. [Media release]. 5 April 2011. Retrieved June 27, 2011 from: http://www.comcom.govt.nz/business-competition-media-releases/detail/2011/commerce-commission-narrows-focus-of-air-cargo-cartel-case-before-trial
Cubic (2009). Domestic container supply study. Cubic Transport Services Ltd. Retrieved June 10, 2011 from: http://www.nzta.govt.nz/resources/domestic-sea-freight-development-fund/domestic-container-supply-study/docs/domestic-container-supply-study.pdf.
Djankov, S., Freund, C. & Pham, S.C. (2008). Trading on Time. Review of Economics and Statistics. November 2008. Retrieved May 17, 2011 from: http://www.doingbusiness.org/~/media/FPDKM/Doing%20Business/Documents/Methodology/Supporting-Papers/DB-Methodology-Trading-On-Time.pdf.
Ewing, R. & Battersby, B. (2005). Measuring Recent Trends in Australia’s Economic Remoteness. Economic Round-up. Summer 2005: 21–31. Retrieved May 10, 2011 from: http://www.treasury.gov.au/documents/958/pdf/03_remoteness.pdf.
Frémont, A. (2009). Empirical Evidence for Integration and Disintegration of Maritime Shipping Port and Logistics Activities. Discussion Paper No. 2009–1. OECD/ITF Joint Transport Research Centre. December. Retrieved June 21, 2011 from: http://www.internationaltransportforum.org/jtrc/discussionpapers/DP200901.pdf.
Heatley, D. (2009). The history and future of rail in New Zealand. ISCR Research Report. New Zealand Institute for the Study of Competition and Regulation. Retrieved June 13, 2011 from: http://www.iscr.org.nz/f511,14914/14914_The_history_and_future_of_rail_in_New_Zealand_RR_.pdf.
Heatley, D. & Howell, B. (2010). Overseas Investment: Is New Zealand ‘Open for Business’? ISCR Working Paper. New Zealand Institute for the Study of Competition and Regulation. Retrieved May 23, 2011 from: http://www.iscr.org.nz/f578,16550/16550_Overseas_Investment_Act_paper_v20_15Jun10_final_.pdf.
Hummels, D. (2009). Globalization and freight transport costs in maritime shipping and aviation. International Transport Forum. Forum Paper. 2009–3. OECD/ITF, Paris. Retrieved May 12, 2011 from: http://www.internationaltransportforum.org/Pub/pdf/09FP03.pdf.
Hummels, D., Lugovskyy, V. & Skiba, A. (2007). The trade reducing effects of market power in international shipping. NBER Working Paper. 12914. February. National Bureau of Economic Research.
Hummels, D., Minor, P., Reisman, M. & Endean, E. (2007). Calculating Tariff Equivalents for Time in Trade. USAID/Nathan Associates. Retrieved May 12, 2011 from: http://pdf.usaid.gov/pdf_docs/PNADK051.pdf.
Hyder Consulting (2008). Understanding Transport Costs and Charges Phase 1. Report to the Ministry of Transport. Retrieved June 15, 2011 from: http://www.transport.govt.nz/research/Documents/UTCCPhase1finalreportSept08.pdf.
Krugman, P. (1991). Increasing Returns and Economic Geography. Journal of Political Economy. 99 3. pp.483–499.
Krugman, P. & Venables, A.J. (1995). Globalization and the inequality of nations. The Quarterly Journal of Economics. 110 4. November. pp.857–880.
77International Freight Transport Services | Issues Paper
Levin, R.C. (1981). Railroad Rates, Profitability, and Welfare under Deregulation. The Bell Journal of Economics. 12 1. Spring. pp.1–26.
Limão, N. & Venables, A.J. (2001). Infrastructure, Geographic Disadvantage Transport Costs & Trade. The World Bank Economic Review. 15 3. pp.45–479.
Local Government Rates Inquiry Panel (2007). Funding Local Government. Retrieved June 28, 2011 from: http://www.dia.govt.nz/Pubforms.nsf/URL/RatesInquiryFullReport.pdf/$file/RatesInquiryFullReport.pdf.
McCann, P. (2001). A proof of the relationship between optimal vehicle size, haulage length and the structure of distance-transport costs. Transportation Research Part A. 35 8. pp.671–693.
McCann, P. (2009). Economic geography, globalisation and New Zealand’s productivity paradox. New Zealand Economic Papers. 43 3. pp.279–314.
Madsen, J. (2010). Developing sustainable and efficient ports at the doorstep of business and industry. Speech to Transport New Zealand Summit, Rendezvous Hotel, Auckland, 2 June 2010. Retrieved June 8, 2011 from: http://www.poal.co.nz/news_media/speeches_presentations/20100602_TransportNZSummitspeech.pdf.
McGregor & Company (2006). Transport Sector Strategic Directions and an Integrated Approach to Planning. Think Piece. Ministry of Transport, New Zealand. Retrieved June 28, 2011 from: http://sh20mountroskill.co.nz/content_files/planning/iap/Think-piece-McGregors-and-co.pdf.
Minister of Transport (1983). White Paper on New Zealand Shipping Policy. December. Government Printer, Wellington.
MOT (2010a). Sector Report: International Shipping and New Zealand. Ministry of Transport, Wellington. November.
MOT (2010b). Understanding Transport Costs and Charges Phase Two. Transport costs in freight logistics. Financial and Economic Analysis Team, Ministry of Transport. November. ISSN 1173-6712. Retrieved May 13, 2011 from: http://www.transport.govt.nz/research/Documents/UTCC-Phase-2-Transport-and-freight-logistics-final-report-Nov2010.pdf.
Mueller, J. & Stewart, M.G. (2011). Terror, Security, and Money: Balancing the Risks, Benefits, and Costs of Homeland Security. Prepared for presentation at the panel “Terror and the Economy: Which Institutions Help Mitigate the Damage?” at the Annual Convention of the Midwest Political Science Association Chicago, IL, April 1, 2011. Retrieved June 11, 2011 from: http://polisci.osu.edu/faculty/jmueller/MID11TSM.PDF.
Notteboom, T. (2008). The relationship between seaports and the intermodal hinterland in light of global supply chains – European challenges. OECD/ITF Joint Transportation Research Centre. Discussion Paper No. 2008–10, March 2008. Retrieved June 3, 2011 from: http://www.internationaltransportforum.org/jtrc/DiscussionPapers/DP200810.pdf.
Notteboom, T. E. & Vernimmen, B. (2009). The effect of high fuel costs on liner service configuration in container shipping. Journal of Transport Geography. 17. pp.325–337.
New Zealand Shippers’ Council (2010). The Question of Bigger Ships. Securing New Zealand’s International Supply Chain. August. Retrieved May 27, 2011 from: http://www.shipperscouncil.co.nz/documents/The_Question_of_Bigger_Ships.pdf.

78 Productivity Commission
NZIER (2010a). Tariffs in New Zealand. The economic impacts of retaining tariffs in New Zealand. A dynamic CGE analysis. NZIER viewpoint | Working paper 2010/1. New Zealand Institute for Economic Research. Retrieved May 11, 2011 from: http://nzier.org.nz/sites/nzier.org.nz/files/WP%202010-1%20Tariffs%20in%20New%20Zealand.pdf.
NZIER (2010b). Port Performance and Ownership. An assessment of the evidence. Report to the Local Government Forum. New Zealand Institute for Economic Research. Retrieved May 11, 2011 from: http://www.businessnz.co.nz/file/1947/100813%20Port%20Performance%20and%20Ownership.pdf.
OECD (2009). OECD Economic Surveys: New Zealand 2009. OECD Publishing. doi: 10.1787/eco_surveys-nzl-2009-en.
OECD (2011). OECD Economic Surveys: New Zealand 2011. OECD Publishing. http://dx.doi.org/10.1787/eco_surveys-nzl-2011-en.
PriceWaterhouseCoopers (2004). Infrastructure Audit. Infrastructure Stocktake. Ministry of Economic Development. Retrieved June 22, 2011 from http://www.med.govt.nz/upload/17774/pwc-audit.pdf.
Redding, S. & Venables, A.J. (2002). The Economics of Isolation and Distance. Nordic Journal of Political Economy. 28. pp.93– 108.
Rockpoint (2009). Coastal shipping and modal freight choice. Rockpoint Corporate Finance Ltd, July 2009. Retrieved June 10, 2011 from: http://www.rockpoint.co.nz/publications/Rockpoint%20Coastal%20Shipping.pdf.
Sunday Star Times (2008). Price fixing: The regulators are all at sea. Sunday Star Times. December 20. Retrieved May 24, 2011 from: http://www.stuff.co.nz/sunday-star-times/business/770075/Price-fixing-The-regulators-are-all-at-sea.
The Treasury (2010). National Infrastructure Plan. Retrieved June 23, 2011 from http://www.infrastructure.govt.nz/plan/mar2010/nip-mar10.pdf.
United Nations (2007). Regional Shipping and Port Development: Container Traffic Forecast 2007 Update. ST/ESCAP/2484. United Nations Economic and Social Commission for Asia and the Pacific and Korea Maritime Institute. http://www.unescap.org/ttdw/Publications/TIS_pubs/pub_2484/pub_2484_fulltext.pdf.
Wang, D., Chen, C. & Lai, C. (2011). The rationale behind and effects of Bunker Adjustment Factors. Journal of Transport Geography. 19. pp.467–474.
World Bank (2010). Doing Business 2011: Making a difference for entrepreneurs. World Bank, Washington. Retrieved May 17, 2011 from: http://www.doingbusiness.org/~/media/FPDKM/Doing%20Business/Documents/Annual-Reports/English/DB11-FullReport.pdf. Data retrieved from: http://www.doingbusiness.org/reforms/~/media/FPDKM/Doing%20Business/Documents/Simulators/DoingBusiness/DB11-Simulator.xls.