Embed Size (px)
DESCRIPTION
3. The Balance of Payments. Chapter Three. Chapter Objective: This chapter serves to introduce you to the balance of payments. How it is constructed and how balance of payments data may be interpreted. INTERNATIONAL FINANCIAL MANAGEMENT. Fourth Edition. EUN / RESNICK. Outline. - PowerPoint PPT Presentation
Citation preview

Copyright © 2007 by The McGraw-Hill Companies, Inc. All rights reserved. 3-1
INTERNATIONALFINANCIAL
MANAGEMENT
EUN / RESNICK
Fourth Edition
Chapter Objective:
This chapter serves to introduce you to the balance of payments. How it is constructed and how balance of payments data may be interpreted.
3Chapter Three
The Balance of Payments

Copyright © 2007 by The McGraw-Hill Companies, Inc. All rights reserved. 3-2
Outline
Balance of Payments Accounting Balance of Payments Accounts
The Current Account The Capital Account Official Reserves Account Statistical Discrepancy
The Balance of Payments Identity

Copyright © 2007 by The McGraw-Hill Companies, Inc. All rights reserved. 3-3
The balance of payments accounts are those that record all transactions between the residents of a country and residents of all foreign nations.
They are composed of the following: The Current Account The Capital Account The Official Reserves Account Statistical Discrepancy
Balance of Payments Accounts

Copyright © 2007 by The McGraw-Hill Companies, Inc. All rights reserved. 3-4
Balance of Payments (BOP)
BOP = cash flow of the country
Sources of the cash flow:1) earned income from trade in goods and services
2) donated money
3) foreign loans and investment
1) + 2) Current Account (cannot be taken back)
3) Capital Account (can be taken back)

Copyright © 2007 by The McGraw-Hill Companies, Inc. All rights reserved. 3-5
The Current Account (CA)
Mainly consist of 4 types of transactions:1. Exports and imports of goods
2. Exports and imports of services
3. Interest payments received and paid out on international investments
4. Unilateral transfers
If the debits exceed the credits, then a country is running a current account deficit.
If the credits exceed the debits, then a country is running a current account surplus.

Copyright © 2007 by The McGraw-Hill Companies, Inc. All rights reserved. 3-6
The Capital Account (KA)
KA primarily tracks transactions involving buying and selling of financial and non-financial assets.
Can be divided into 3 categories:
1. Direct investment
2. Portfolio investment
3. Other investments (mostly loans, currencies)
Purchase of residents assets by non-residents (i.e. inflows) are credits. Purchases of non-residents assets by residents (i.e. outflows) are
debits
Copyright © 2007 by The McGraw-Hill Companies, Inc. All rights reserved. 3-7
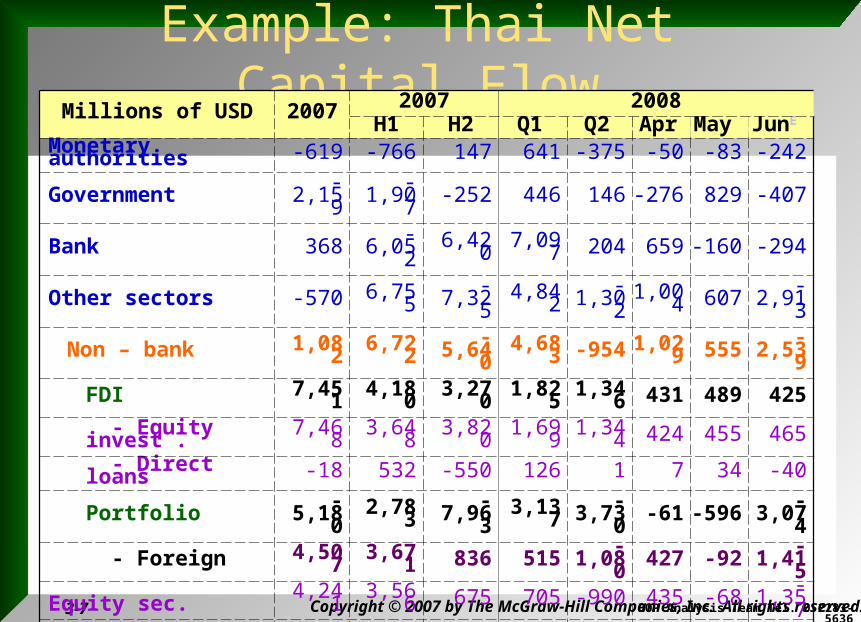
Example: Thai Net Capital FlowMillions of USD 200
72007 2008
H1 H2 Q1 Q2 Apr May JunE
Monetary authorities -619 -766 147 641 -375 -50 -83 -242
Government -2,159
-1,90
7-252 446 146 -276 829 -407
Bank 368-
6,052
6,420 7,097 204 659 -160 -294
Other sectors -570 6,755
-7,325 4,842
-1,30
21,00
4 607-
2,913
Non – bank 1,082
6,722
-5,64
04,68
3 -954 1,029 555
-2,53
9
FDI 7,451
4,180
3,270
1,825
1,346 431 489 425
- Equity invest . 7,468 3,64
8 3,820 1,699 1,344 424 455 465
- Direct loans -18 532 -550 126 1 7 34 -40
Portfolio-
5,180
2,783
-7,96
33,13
7-
3,730
-61 -596
-3,07
4
- Foreign 4,507
3,671 836 515
-1,08
0427 -92
-1,41
5 Equity sec. 4,241 3,56
6 675 705 -990 435 -68-
1,357
Debt sec. 267 105 162 445 -90 -9 -24 -57
-Thai-
9,687
-888-
8,799
2,621
-2,65
0-
488-
504-
1,659
Loans (foreign)
1,356 422 933
-1,41
4362 311 171 -120
Others-
2,544
-663-
1,881
1,136
1,068 348 491 230
State enterprises
-1,65
233
-1,68
5159 -348 -25 52 -375
Total capital flow -2,980
-1,97
0-
1,01013,02
6-
1,3271,33
71,19
3-
3,856
BOP Analysis Team Tel. 0-2283-5636

Copyright © 2007 by The McGraw-Hill Companies, Inc. All rights reserved. 3-8
The Official Reserves Account (RA)
Reports the net change in FX reserves.
Increases in FX reserves held by a central bank count as debits to the RA
FX reserves = BOP + Valuation

Copyright © 2007 by The McGraw-Hill Companies, Inc. All rights reserved. 3-9
Statistical Discrepancy
There’s going to be some omissions and misrecorded transactions—so we use a “plug” figure to get things to balance.

Copyright © 2007 by The McGraw-Hill Companies, Inc. All rights reserved. 3-10
The Balance of Payments Identity
Most important feature of the BOP is a double-entry system of accounts: a positive entry in BOP has a corresponding negative entry elsewhere in the BOP, and vice versa.
In general,
Under a pure flexible exchange rate regime,
CA + KA = 0
CA + KA + RA = 0

Copyright © 2007 by The McGraw-Hill Companies, Inc. All rights reserved. 3-11
Example: U.S. Balance of Payments Data
Credits DebitsCurrent Account
1 Exports $1,516.2
2 Imports ($2,109.1)
3 Unilateral Transfers $16.4 ($89.4)
Balance on Current Account ($665.9)Capital Account
4 Direct Investment $115.5 ($248.5)
5 Portfolio Investment $794.4 ($90.8)
6 Other Investments $524.3 ($483.7)
Balance on Capital Account $611.2
7 Statistical Discrepancies
Overall Balance $2.8 Official Reserve Account $2.8
51.9

Copyright © 2007 by The McGraw-Hill Companies, Inc. All rights reserved. 3-12
U.S. Balance of Payments Data
Including the statistical discrepancies, the balance of payments identity should hold:
CA + KA = – RA
($665.9) + $611.2 + $51.9 = ($2.8)
Credits DebitsCurrent Account
1 Exports $1,516.2
2 Imports ($2,109.1)
3 Unilateral Transfers $16.4 ($89.4)
Balance on Current Account ($665.9)Capital Account
4 Direct Investment $115.5 ($248.5)
5 Portfolio Investment $794.4 ($90.8)
6 Other Investments $524.3 ($483.7)
Balance on Capital Account $611.2
7 Statistical Discrepancies
Overall Balance $2.8 Official Reserve Account $2.8
51.9

Copyright © 2007 by The McGraw-Hill Companies, Inc. All rights reserved. 3-13
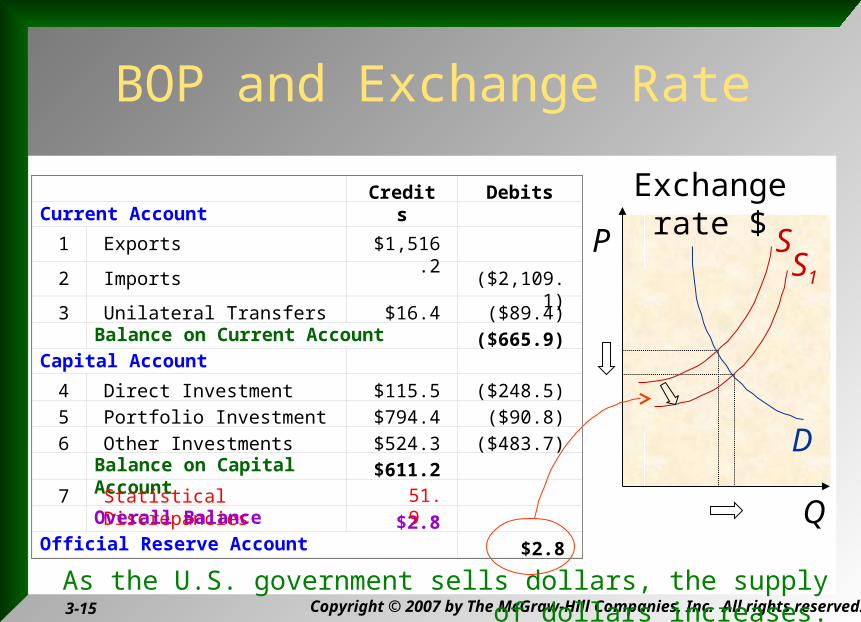
BOP and Exchange Rate
Q
P
As U.S. citizens import, they are supply dollars to the FOREX market.
Exchange rate $
S
D
Credits DebitsCurrent Account
1 Exports $1,516.2
2 Imports ($2,109.1)
3 Unilateral Transfers $16.4 ($89.4)
Balance on Current Account ($665.9)Capital Account
4 Direct Investment $115.5 ($248.5)
5 Portfolio Investment $794.4 ($90.8)
6 Other Investments $524.3 ($483.7)
Balance on Capital Account $611.2
7 Statistical Discrepancies
Overall Balance $2.8 Official Reserve Account $2.8
51.9

Copyright © 2007 by The McGraw-Hill Companies, Inc. All rights reserved. 3-14
BOP and Exchange Rate
Q
P
As U.S. citizens export, others demand dollars at the FOREX market.
Exchange rate $
S
D
Credits DebitsCurrent Account
1 Exports $1,516.2
2 Imports ($2,109.1)
3 Unilateral Transfers $16.4 ($89.4)
Balance on Current Account ($665.9)Capital Account
4 Direct Investment $115.5 ($248.5)
5 Portfolio Investment $794.4 ($90.8)
6 Other Investments $524.3 ($483.7)
Balance on Capital Account $611.2
7 Statistical Discrepancies
Overall Balance $2.8 Official Reserve Account $2.8
51.9
Copyright © 2007 by The McGraw-Hill Companies, Inc. All rights reserved. 3-15
BOP and Exchange Rate
Q
P S
D
As the U.S. government sells dollars, the supply of dollars increases.
S1
Exchange rate $ Credits DebitsCurrent Account
1 Exports $1,516.2
2 Imports ($2,109.1)
3 Unilateral Transfers $16.4 ($89.4)
Balance on Current Account ($665.9)Capital Account
4 Direct Investment $115.5 ($248.5)
5 Portfolio Investment $794.4 ($90.8)
6 Other Investments $524.3 ($483.7)
Balance on Capital Account $611.2
7 Statistical Discrepancies
Overall Balance $2.8 Official Reserve Account $2.8
51.9

Copyright © 2007 by The McGraw-Hill Companies, Inc. All rights reserved. 3-16
BOP adjustments
Suppose CA deficit > KA surplus (at some point in time)
Under flexible regime: Currency depreciates
CA improves (more exports, less imports)
KA improves (more inflows, less outflows)
Under fixed regime: FX reserves decrease
If not enough reserves, then BOP crisis

Copyright © 2007 by The McGraw-Hill Companies, Inc. All rights reserved. 3-17
CA and KA of the United States
Source: IMF International Financial Statistics Yearbook, various issues
U.S. Balance of Payments Trend: 1982-2004
-1000
-800
-600
-400
-200
0
200
400
600
800
1000
1982 1987 1992 1997 2002 2007
Year
(bil
lio
n U
SD
)
U.S. CA
U.S. KA

Copyright © 2007 by The McGraw-Hill Companies, Inc. All rights reserved. 3-18
CA and KA of China
Source: IMF International Financial Statistics Yearbook, various issues
-50
0
50
100
150
200
250
300
350
400
1982
1984
1986
1988
1990
1992
1994
1996
1998
2000
2002
2004
2006
(billio
n U
SD
)
China CAChina KA

Copyright © 2007 by The McGraw-Hill Companies, Inc. All rights reserved. 3-19
CA and KA of Thailand
Thailand Balance of Payments Trend: 1991-2007
-20
-15
-10
-5
0
5
10
15
20
25
1990 1992 1994 1996 1998 2000 2002 2004 2006
Year
(bil
lio
n U
SD
)
Thai CA
Thai KA
Source: BOT

Copyright © 2007 by The McGraw-Hill Companies, Inc. All rights reserved. 3-20
100.5110.0 109.8 108.9 105.7
4.6 3.8
6.9
9.5
12.9
19.1
21.9
23.3
21.1 20.4 18.818.4
92.8
49.8 52.1
67.073.0
87.580.7
40
60
80
100
120
140
2004 2005 2006 H1-07 Q3-07 Q4-07 Jan-08
Feb-08
Mar-08
Apr-08
May-08
Jun-08
Reserves Net Forward Position
Billion USD
Thailand’s International Reserves
54.4 55.9
Source: BOT