Embed Size (px)
Citation preview

www.eia.gov U.S. Energy Information Administration Independent Statistics & Analysis
International energy markets
For
Cheung Kong Graduate School of Business
July 29, 2015 | Beijing, China
by
Adam Sieminski, Administrator
U.S. Energy Information Administration

International energy markets
July 29, 2015 2
Mandate: EIA collects, analyzes, and disseminates independent and impartial
energy information to promote sound policymaking, efficient markets, and public
understanding of energy and its interaction with the economy and the environment
Independence: EIA, an element of the Department of Energy, is one of 14 federal
statistical agencies; by law, its data, analyses, and forecasts are independent of
approval by any other officer or employee of the United States Government
Mission: EIA provides data and analysis to help stakeholders understand the
rapidly changing energy sector in areas such as:
• Oil and gas production
• Changing energy trade flows
• Oil price volatility and projections
• Vehicle, building, and manufacturing consumption trends
• Distributed renewables generation
• Coal and nuclear power outlooks

EIA principles
International energy markets
July 29, 2015 3
• Provide relevant energy statistics and analysis as a public
good
• Be accurate and objective
• Protect the confidentiality of respondents
• Maintain the public trust
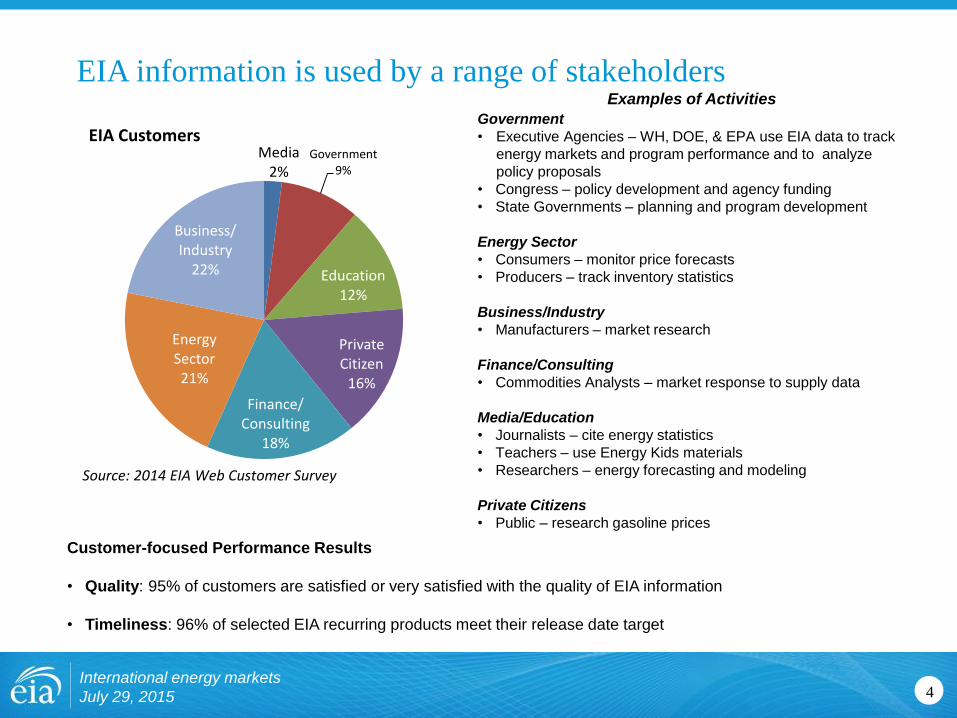
EIA information is used by a range of stakeholders
International energy markets
July 29, 2015 4
Government
• Executive Agencies – WH, DOE, & EPA use EIA data to track
energy markets and program performance and to analyze
policy proposals
• Congress – policy development and agency funding
• State Governments – planning and program development
Energy Sector
• Consumers – monitor price forecasts
• Producers – track inventory statistics
Business/Industry
• Manufacturers – market research
Finance/Consulting
• Commodities Analysts – market response to supply data
Media/Education
• Journalists – cite energy statistics
• Teachers – use Energy Kids materials
• Researchers – energy forecasting and modeling
Private Citizens
• Public – research gasoline prices
Customer-focused Performance Results
• Quality: 95% of customers are satisfied or very satisfied with the quality of EIA information
• Timeliness: 96% of selected EIA recurring products meet their release date target
Examples of Activities
Media 2%
Government 9%
Education 12%
Private Citizen
16%
Finance/ Consulting
18%
Energy Sector 21%
Business/ Industry
22%
EIA Customers
Source: 2014 EIA Web Customer Survey

The importance of China in the global
energy markets
International energy markets
July 29, 2015 5

By 2040, China’s energy use will be double the U.S. level;
India’s a little more than half despite its faster GDP growth
6
energy consumption by selected country
quadrillion Btu
Source: EIA, International Energy Outlook 2013
0
50
100
150
200
250
1990 1995 2000 2005 2010 2015 2020 2025 2030 2035 2040
China
United States
India
History Projections 2010
International energy markets
July 29, 2015

Net oil imports: Trends in the largest consuming countries
7
million barrels per day (MMb/d)
Source: EIA, Short-Term Energy Outlook, July 2015
0
1
2
3
4
5
6
7
8
9
10
2011 2012 2013 2014 2015 2016
China net imports
U.S. net imports
Forecast History
International energy markets
July 29, 2015

Current oil and gas markets
International energy markets
July 29, 2015 8

For oil prices, the market-implied confidence band is very wide
9
WTI price
dollars per barrel
Source: EIA, Short-Term Energy Outlook, July 2015
0
25
50
75
100
125
150
Jan Apr Jul Oct Jan Apr Jul Oct Jan Apr Jul Oct Jan Apr Jul Oct
Historical Spot Price
STEO Forecast
NYMEX Futures Price
Current 95% NYMEX futures price confidence interval
June 2014 95% NYMEX futures price confidence interval
2013 2014 2015 2016
International energy markets
July 29, 2015

The U.S. has experienced a rapid increase in natural gas and oil
production from shale and other tight resources
10
Sources: EIA derived from state administrative data collected by DrillingInfo Inc. Data are through May 2015 and represent
EIA’s official tight oil & shale gas estimates, but are not survey data. State abbreviations indicate primary state(s).
International energy markets
July 29, 2015
0.0
0.5
1.0
1.5
2.0
2.5
3.0
3.5
4.0
4.5
5.0Eagle Ford (TX)
Bakken (MT & ND)
Spraberry (TX & NM Permian)
Bonespring (TX & NM Permian)
Wolfcamp (TX & NM Permian)
Delaware (TX & NM Permian)
Yeso-Glorieta (TX & NM Permian)
Niobrara-Codell (CO, WY)
Haynesville
Utica (OH, PA & WV)
Marcellus
Woodford (OK)
Granite Wash (OK & TX)
Austin Chalk (LA & TX)
Monterey (CA)
U.S. tight oil production
million barrels of oil per day
0
5
10
15
20
25
30
35
40
45Marcellus (PA & WV)
Haynesville (LA & TX)
Eagle Ford (TX)
Fayetteville (AR)
Barnett (TX)
Woodford (OK)
Bakken (ND)
Antrim (MI, IN, & OH)
Utica (OH, PA & WV)
Rest of US 'shale'
U.S. dry shale gas production
billion cubic feet per day

Production growth in top crude producing regions (Permian,
Bakken, Niobrara, and Eagle Ford) reverses in early 2015
11
monthly percent change
three month rolling average
Source: EIA, Drilling Productivity Report, July 2015
International energy markets
July 29, 2015
-2.0%
-1.0%
0.0%
1.0%
2.0%
3.0%
4.0%
Jan 2012 Jan 2013 Jan 2014 Jan 2015
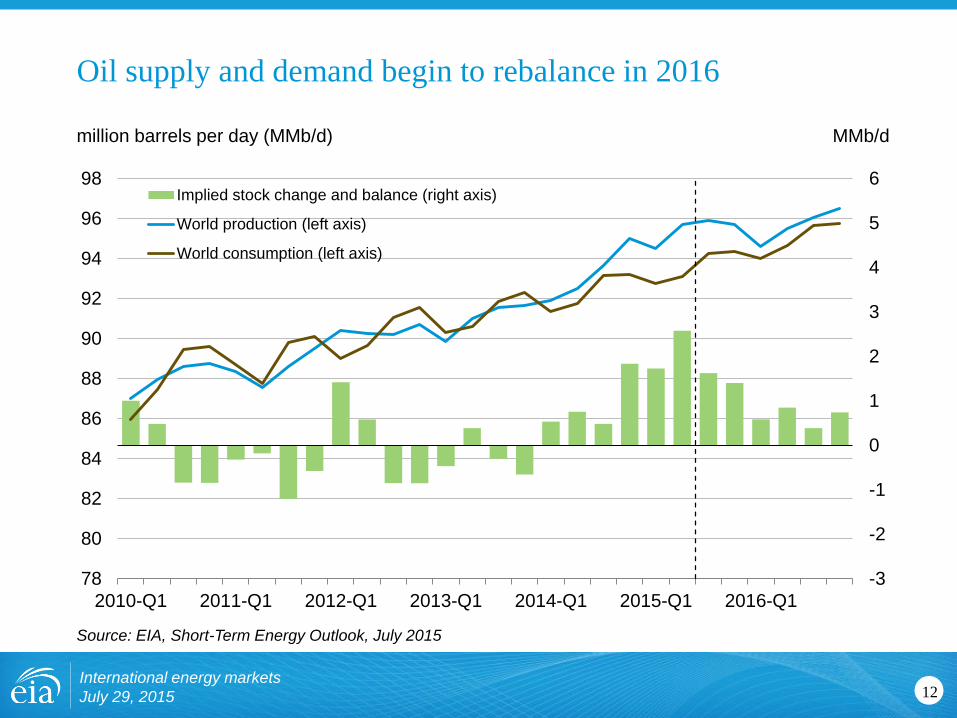
Oil supply and demand begin to rebalance in 2016
12
million barrels per day (MMb/d) MMb/d
Source: EIA, Short-Term Energy Outlook, July 2015
International energy markets
July 29, 2015
-3
-2
-1
0
1
2
3
4
5
6
78
80
82
84
86
88
90
92
94
96
98
2010-Q1 2011-Q1 2012-Q1 2013-Q1 2014-Q1 2015-Q1 2016-Q1
Implied stock change and balance (right axis)
World production (left axis)
World consumption (left axis)

Surprises in liquid fuel demand to the upside are rare
13
world liquid fuels consumption
million barrels per day (MMb/d)
Source: EIA, Short-Term Energy Outlook, July 2015
annual change
million barrels per day
Forecast
-2
-1
0
1
2
3
4
5
6
7
8
76
78
80
82
84
86
88
90
92
94
96
2008 2009 2010 2011 2012 2013 2014 2015 2016
Change in U.S. consumption (right axis)
Change in China consumption (right axis)
Change in other consumption (right axis)
Total world consumption (left axis)
International energy markets
July 29, 2015

OPEC surplus crude oil production capacity remains moderate
to low
14
million barrels per day (MMb/d)
Source: EIA, Short-Term Energy Outlook, July 2015
International energy markets
July 29, 2015
0
1
2
3
4
5
6
2004 2005 2006 2007 2008 2009 2010 2011 2012 2013 2014 2015 2016
Forecast
Note: Shaded area represents 2004-2014 average (2.2 MMb/d)

OECD commercial petroleum stocks remain high
15
days of supply
Source: EIA, Short-Term Energy Outlook, July 2015
International energy markets
July 29, 2015
Forecast
45
50
55
60
65
70
Jan 2010 Jan 2011 Jan 2012 Jan 2013 Jan 2014 Jan 2015 Jan 2016
Note: Shaded area represents the range between the minimum
and maximum from Jan 2010 to Dec 2014

Long-term U.S. energy projections
International energy markets
July 29, 2015 16
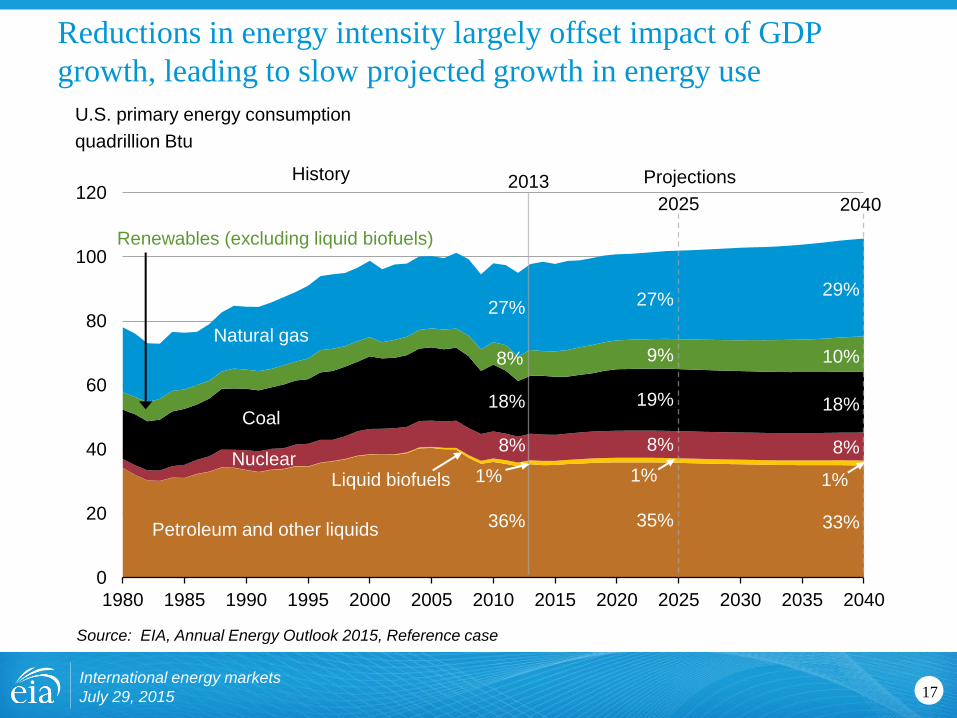
Reductions in energy intensity largely offset impact of GDP
growth, leading to slow projected growth in energy use
17
0
20
40
60
80
100
120
1980 1985 1990 1995 2000 2005 2010 2015 2020 2025 2030 2035 2040
U.S. primary energy consumption
quadrillion Btu
Source: EIA, Annual Energy Outlook 2015, Reference case
History Projections 2013
36%
18%
27%
8%
8%
1%
33%
10%
18%
29%
8%
1% Nuclear
Petroleum and other liquids
Natural gas
Coal
Renewables (excluding liquid biofuels)
2025
35%
19%
27%
8%
9%
1% Liquid biofuels
2040
International energy markets
July 29, 2015

U.S. crude oil production: Supply rises above previous historical highs
before 2020 in all AEO2015 cases, with a range of longer-term outcomes
dependent on prices, resources and technology
18
U.S. crude oil production
million barrels per day (MMb/d)
Source: EIA, Annual Energy Outlook 2015
0
5
10
15
20
1990 2000 2010 2020 2030 2040 2020 2030 2040 2020 2030 2040
Tight oil
Alaska
Lower 48 offshore
History 2013 2013 2013
U.S. maximum production level of
9.6 million barrels per day in 1970
Other lower 48 onshore
Reference High Oil and Gas
Resource Low Oil Price
International energy markets
July 29, 2015

U.S. natural gas imports and exports
trillion cubic feet
-8
-4
0
4
8
12
16
2000 2010 2020 2030 2040 2020 2030 2040 2020 2030 2040
LNG imports
19
billion cubic feet per day
Projections History 2013
-10
0
10
20
2013 2013
30
40
-20 Reference Low Oil Price High Oil and Gas
Resource
Pipeline exports
to Mexico
Lower 48 states
LNG exports
Pipeline exports to Canada Pipeline imports from Canada
Alaska LNG exports
International energy markets
July 29, 2015
U.S. natural gas trade: Projected U.S. natural gas trade reflects the spread
between domestic natural gas prices and world energy prices, along with
resource outcomes
Source: EIA, Annual Energy Outlook 2015

U.S. energy trade
20
• Net exporter of petroleum products since 2010
• Crude oil export policy debate underway
• Net exporter of natural gas by 2017
• Net exports of coal are small and steady
• Net imports of electricity are small
International energy markets
July 29, 2015
Source: EIA, Annual Energy Outlook 2015, Reference case

Long-term international outlook
International energy markets
July 29, 2015 21

Renewable energy and nuclear power are the fastest growing
source of energy consumption
22
world energy consumption by fuel
quadrillion Btu
Source: EIA, International Energy Outlook 2013
0
50
100
150
200
250
1990 1995 2000 2005 2010 2015 2020 2025 2030 2035 2040
liquids
(including biofuels)
renewables
(excluding biofuels)
natural gas
coal
nuclear
History Projections 2010
34%
28%
22%
11%
5%
28%
27%
23%
7%
15%
share of
world total
International energy markets
July 29, 2015

Non-OPEC petroleum and other liquids production
23
million barrels per day (MMb/d)
Source: EIA, International Energy Outlook 2013, Reference case
Russia
United States
China
Brazil
rest of non-OECD
International energy markets
July 29, 2015
0
10
20
30
40
50
60
70
2010 2015 2020 2025 2030 2035 2040
Canada
rest of OECD

World natural gas production
24
trillion cubic feet
MENA
Russia
rest of OECD
Canada
United States
0
20
40
60
80
100
120
140
160
180
200
2010 2015 2020 2025 2030 2035 2040
China
rest of non-OECD
Note: The MENA region consists of the Middle East and North Africa countries
Source: EIA, International Energy Outlook 2013, Reference case
International energy markets
July 29, 2015

World coal production
25
billion short tons
Note: Indonesia accounted for 72 percent of the total coal production in Other non-OECD Asia in 2010, rising from 52
percent in 2000. Throughout the projection period, Indonesia continues dominating the region's coal production.
Source: EIA, International Energy Outlook 2013, Reference case
0
2
4
6
8
10
12
14
2010 2015 2020 2025 2030 2035 2040
other non-OECD Asia Australia
United States
China
world total
India
International energy markets
July 29, 2015

World net hydropower and other renewable electricity generation
26
trillion killowatthours
Source: EIA, International Energy Outlook 2013, Reference case
China
rest of OECD
Canada
United States 0
2
4
6
8
10
12
2010 2015 2020 2025 2030 2035 2040
Brazil
India
rest of non-OECD
International energy markets
July 29, 2015

World net nuclear electricity generation
27
trillion killowatthours
Source: EIA, International Energy Outlook 2013, Reference case
Russia
OECD Europe
other Asia
Japan
United States
0
1
2
3
4
5
6
2010 2015 2020 2025 2030 2035 2040
India
rest of world
China
International energy markets
July 29, 2015

For more information
28
U.S. Energy Information Administration home page | www.eia.gov
Annual Energy Outlook | www.eia.gov/aeo
Short-Term Energy Outlook | www.eia.gov/steo
International Energy Outlook | www.eia.gov/ieo
Monthly Energy Review | www.eia.gov/mer
Today in Energy | www.eia.gov/todayinenergy
State Energy Profiles | www.eia.gov/state
Drilling Productivity Report | www.eia.gov/petroleum/drilling/
International Energy Portal | www.eia.gov/beta/international/?src=home-b1
International energy markets
July 29, 2015