Embed Size (px)
Citation preview
International Diversification Gains and Home Bias in Banking
First version: May 2006 This version: October 2006
Alicia García-Herrero1 and Francisco Vázquez2
Abstract
This paper assembles a bank-level dataset covering the operations of 38 international banks from eight industrial countries and their 399 subsidiaries overseas during 1995-2004, and studies the extent of the diversification gains from their local operations in industrial and emerging economies. Linking parent banks with their foreign subsidiaries and classifying the latter by their location, the paper finds that increasing the assets allocated to their foreign subsidiaries, enhances the risk-adjusted profitability of international banks. These gains are reduced—but by no means depleted—when they concentrate their subsidiaries in specific geographical regions, which tends to be the pattern of international bank expansion. Using the mean-variance portfolio model, the paper also finds a substantial home bias in the international allocation of bank assets. Overall, the results indicate that international diversification gains in banking are substantial, albeit largely unexploited by current bank expansion strategies. The results support the notion that risk weighting in the single factor model under Basel II may be excessively penalizing because it weighs international bank exposures only on the basis of the idiosyncratic risk of the recipient countries without accounting for cross-country diversification gains,.
JEL Classification [G11, G21, E44, F40]
Keywords: International Banking, Home Bias, Portfolio Diversification, Basel II.
1 Bank for International Settlements. [email protected]. 2 International Monetary Fund. [email protected]. The views expressed in this article are those of the authors’ and not necessarily those of the institutions they are affiliated with. The authors whish to thank, without implicating, Nicolás Amoroso, Sergio Gavilá, Robert McCauley, Pedro Rodríguez, Rafael Romeu, Daniel Santabárbara and Miguel Segoviano for early discussions. Excellent assistance in data collection was provided by Enrique Martínez Casillas and Kalin Tintchev.
- 2 -
I. INTRODUCTION
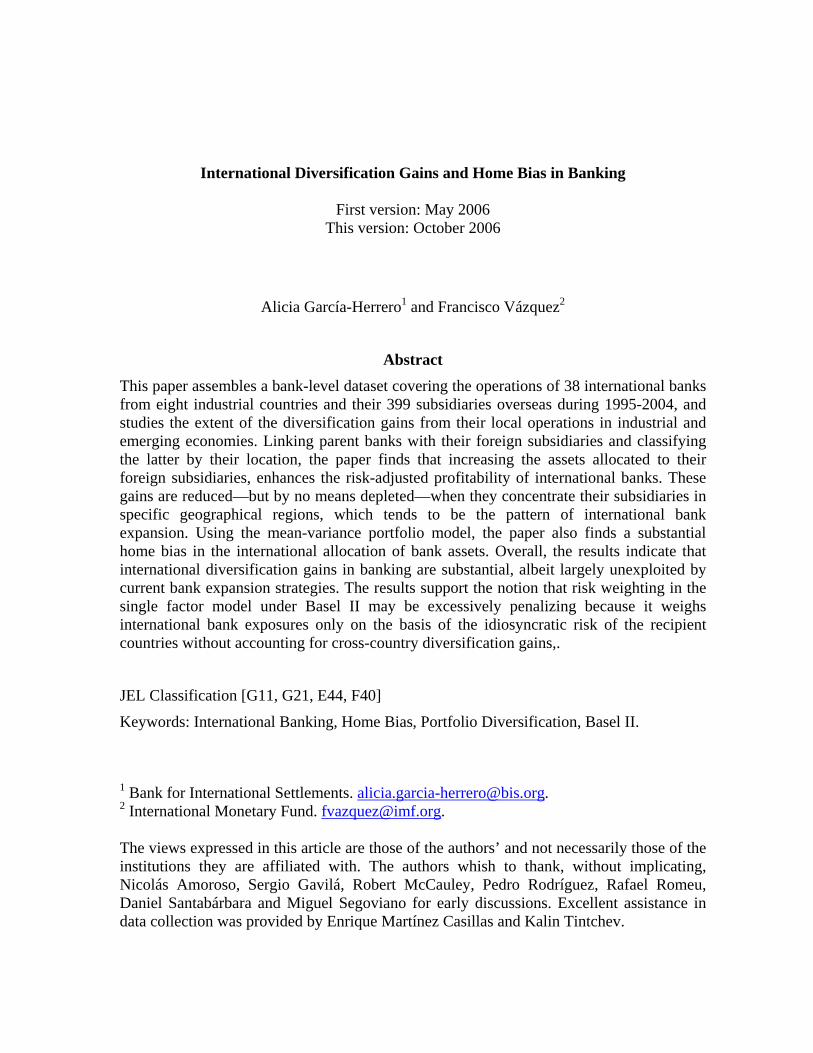
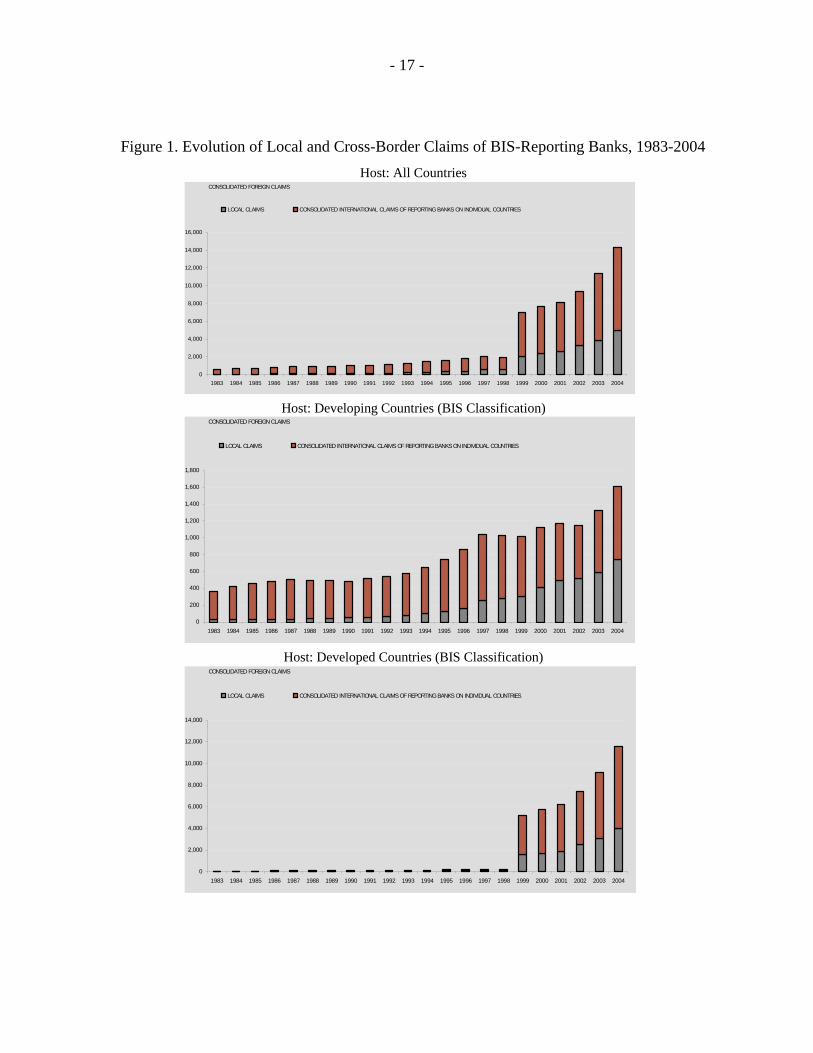
Since the mid-1990s, financial globalization has been characterized by a massive expansion of international bank activities worldwide. Following banking sector liberalization in emerging economies and a large increase in cross-border merger and acquisitions worldwide, the foreign claims of BIS-reporting banks (which include both local and cross-border claims), rose from 1.3 trillion dollars in 1990 to 2.7 trillion dollars in 2006. Since business cycles are imperfectly correlated across countries, a bank with broad global exposures—particularly in its lending portfolio—should, in principle, be better able to diversify away country-specific risks. International diversification in banking, however, is barely understood, as shown by the fact that it was neglected by the single factor model under Basel II.
Following the pioneering work of Markovitz (1952, 1959) on portfolio optimization, and subsequent extensions to the international context by Grubel (1968), Levy and Sarnat (1970), and Lessard (1973), a large body of literature in finance has studied the effects of international diversification in securities portfolios. Not surprisingly, since portfolio diversification depends on the correlations between return distributions of individual securities, which tend to be lower between- than within-countries, the gains from international diversification have been found to be large. However, there is also robust evidence that international diversification gains have not been fully exploited by investors due to the so-called “home bias”—or an excessive investment in domestic securities relative to the efficient portfolios.1
A parallel literature addressing the benefits of geographical diversification in banking is only incipient. A few studies have assessed the benefits of diversification within countries (local geographical diversification), yielding inconclusive results. Using data for Italian banks during 1993-1999, Acharya, Hasan, and Saunders (2002) found that local geographical diversification did not necessarily improve the risk-return trade-off of banks. For the U.S., Morgan and Samolyk (2003) found that broader geographical presence of banks within the U.S. has not been associated with higher return or lower risk. These findings suggest that the benefits of local geographical diversification may be limited due to the strong output co-movement among countries. On the other hand, since banks carry a considerable degree of country-specific risks in their lending portfolios and economic cycles are imperfectly correlated between countries, the benefits of international diversification in banking could be potentially large. This is particularly the case of a bank operating in both industrial and emerging economies since economic cycles between these
1 The evidence indicates that unexploited diversification gains within developed countries’ securities have been decreasing over time.
- 3 -
two groups of countries tend to be less synchronized (Griffith-Jones, Segoviano, and Spratt, 2002).
This paper studies the diversification gains associated with the operations of international bank subsidiaries overseas. It assembles a bank-level dataset covering the operations of 38 international banks incorporated in eight industrial countries and their 399 subsidiaries overseas, during 1995-2004. Linking each international bank with its subsidiaries, and classifying the latter by their location, in industrial vs. emerging economies, the paper finds that larger asset allocation to foreign subsidiaries improves the risk-adjusted returns of the consolidated group. These gains, however, have been partially eroded by the concentration of foreign subsidiaries in specific geographical regions implied by the observed patterns of international bank expansion.
Using the mean-variance portfolio model as a normative benchmark, the paper also finds that the actual allocation of international bank assets across borders displays a substantial home bias. In fact, the data show that the local operations of international banks overseas are small relative to the scale of their operations at home and mainly located in other industrial countries. On average, the typical international bank in the sample allocated 82.4 percent of its assets at home, 12.6 percent in subsidiaries located in other industrial countries, and 5 percent in subsidiaries in emerging economies. In contrast, the return-equivalent efficient portfolios entailed a 60.1 percent of assets at home, 28.9 percent in other industrial countries, and 11 percent in emerging economies, with an estimated reduction in risk of about 30 percent and a doubling of average Sharpe ratios, from 1.7 to 3.1. Notably, the estimated gains from international diversification presented in this paper are extremely conservative, since they are based on the correlation of return distributions between country groups—not individual countries. A more precise computation would be likely to produce even larger estimates of diversification benefits and, thereby, a larger home bias.
These results are qualitatively consistent with the findings of Buch, Discroll, and Ostrgaard (2005), who apply the mean-variance portfolio model to study international diversification gains in banking. Their work, however, uses aggregate data on cross-border claims of banks in four industrial countries during 1995-1999. Such country data cannot capture different behavior across banks as regards the operations of their international subsidiaries. Such generalization is obviously a very strong assumption for the question as stake.
In our case, by exploiting information from financial statements of international banks, we can obtain profitability measures which reflect each bank’s diversification gains originating from operations abroad. There is, however, a limitation associated with the data. Both parent and subsidiary information is provided but not that of cross-border operations of individual banks. The same is true for branches since they do not have their own financial
- 4 -
statements and are treated as part of the parent in our dataset.2. Such data constraints introduce a potential bias, which we shall tackle later.
The rest of the paper is as follows. Section II provides an overview of the data, discussing some stylized facts on the international allocation of bank assets and the behavior of bank returns across groups of countries. Section III uses regression analysis to assess the effects of cross-border asset allocation of international banks on their risk-adjusted returns. Section IV uses the mean-variance portfolio model as a benchmark to assess the optimality of the observed cross-border asset allocation of international banks. Section V concludes.
II. DATA AND STYLIZED FACTS
The dataset covers 38 international banks incorporated in eight industrial countries: Canada, France, Germany, Italy, Japan, Spain, U.K., and the U.S. (i.e., G-7 plus Spain).. The latter was added due to the large international exposures of its two major banks). The 38 parent banks also have 399 subsidiaries overseas. While data exists for as many as 60 large banks, those which hardly have international operations are excluded. The paper, thus, concentrates on the potential diversification gains for banks which are pursuing an internationalization strategy already. Bank-level data is gathered from the Bankscope for the period 1995–2004. Yearly frequency is used. The nationality of parent banks is based on their country of incorporation, regardless of the nationality of its shareholders, and thus parallels the regulatory criteria of home and host supervisors under the Basel Accord. Foreign subsidiaries are restricted to those with at least 50 percent ownership by their parent banks. We also crosscheck Bankscope ownership information with the Zephir dataset on mergers and acquisitions to track the time evolution of bank subsidiaries overseas.
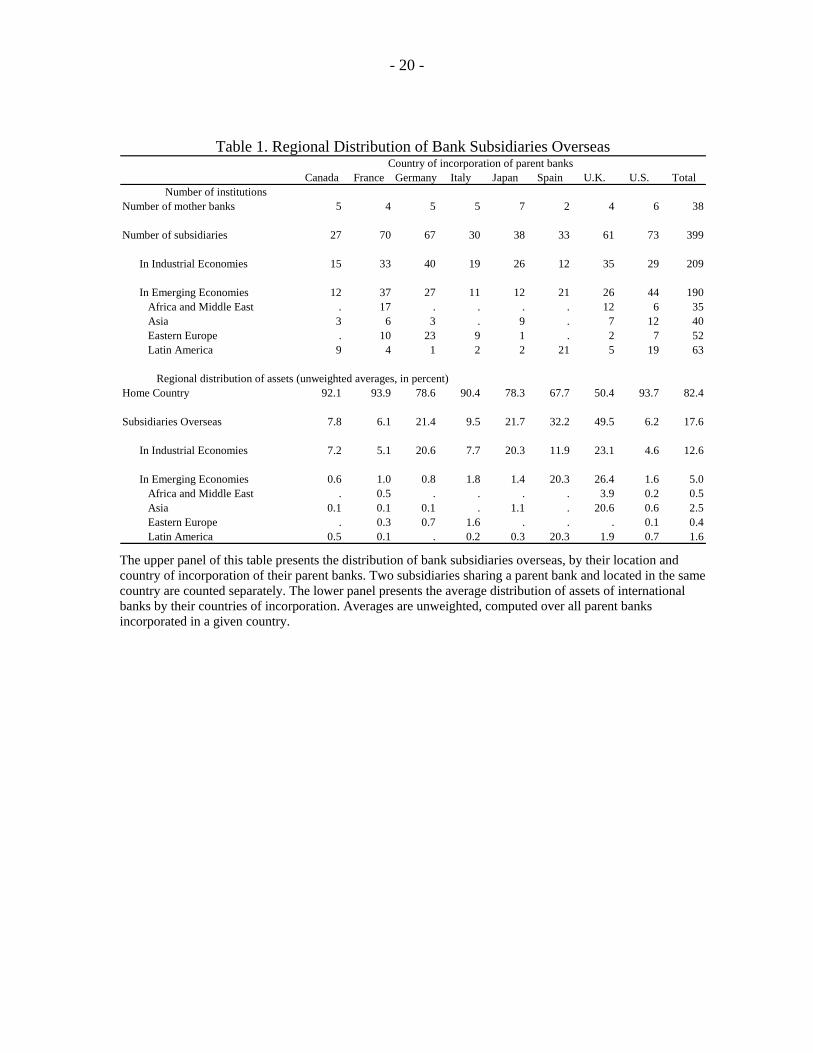
Overall, the sampled banks had 209 subsidiaries in industrial countries and 190 in emerging countries during the sampled period (Table 1). For each bank, we compute the share of assets at each point in time in three groups of countries: (i) home, (ii) other industrial countries, and (iii) emerging countries. Using unconsolidated financial data to avoid double counting, we then take the average assets of each parent bank in each region across time. We, then, compute unweighted averages of international banks’ assets, grouped by their countries of incorporation. This should give a rough idea of the general distribution of bank assets across regions. From this calculation, the typical international bank has 82.4 percent of its assets at home, 12.6 percent in subsidiaries located in other industrial countries and a mere 5 percent in subsidiaries operating in emerging countries. While this distribution varies widely across parent banks, there are some common characteristics. Parent banks tend to have a significant share of their assets in their home
2 Still, some banks’ subsidiaries also have their own branches. In those cases, international branches would correctly be treated as operations abroad.
- 5 -
countries and in subsidiaries located in other industrial countries. With the exceptions of British and Spanish banks, the average share of assets in emerging economies tends to be very small, below 2 percent in most cases. The sample of British banks is heavily influenced by the large presence of HSBC in Asia and the same is true for Spain in Latin America. International bank expansion into emerging economies also displays strong regional patterns that seem to reflect historic and cultural ties. For example, Spanish and Canadian banks tend to concentrate in Latin America, French banks in Africa and the Middle East, German and Italian banks on Eastern European countries, and British and Japanese banks focus in emerging Asia.
For each institution, we measure profitability using the after-tax return on assets (ROA), and risk by its standard deviation. An alternative metric of profitability, based on the after-tax return on equity (ROE) would provide a better measure of shareholders’ return, but has the drawback of being potentially affected by cross-country differences in the treatment of net worth and differences in accounting definitions.
In all the tests conducted, the measurement of bank profitability at the level of subsidiaries is based on unconsolidated financial statements to help examine their individual contribution to the risk-return of their financial group. Admittedly, the use of unconsolidated figures also introduces noise in the aggregation of profits at the group level, as it ignores the effects of mutually canceling transactions between parent banks and their subsidiaries. However, this problem may not be critical, since there are no obvious reasons to believe that this noise is systematic.
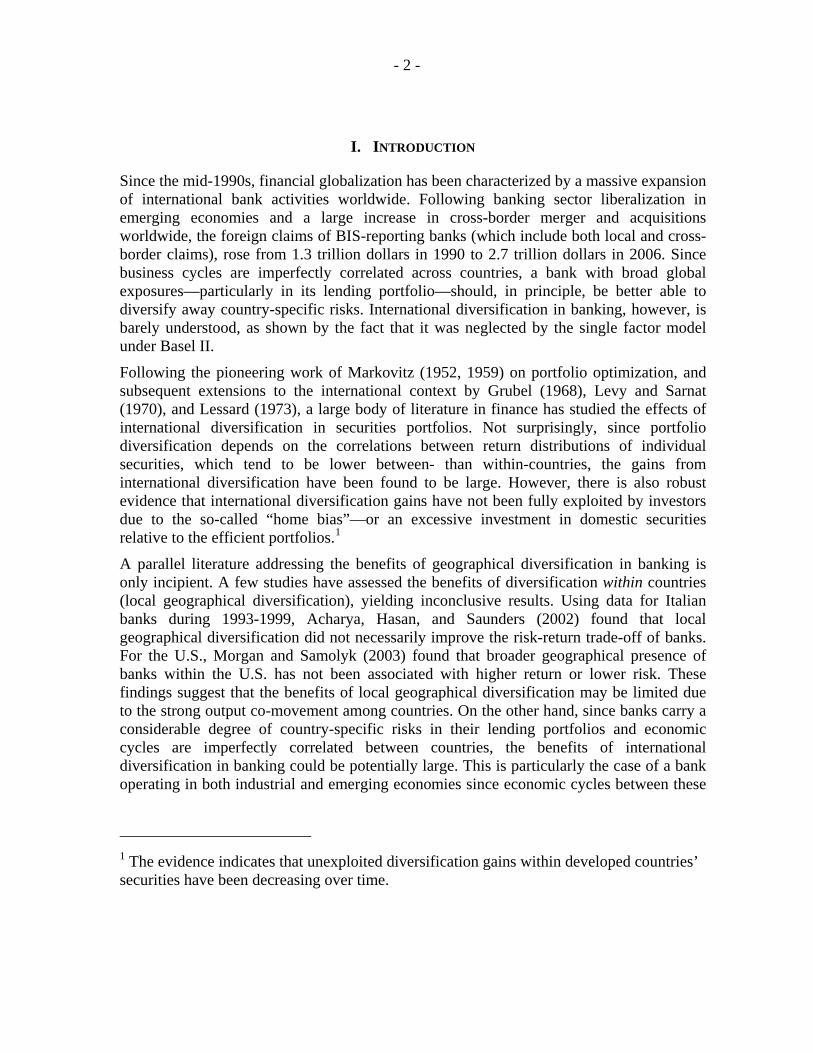
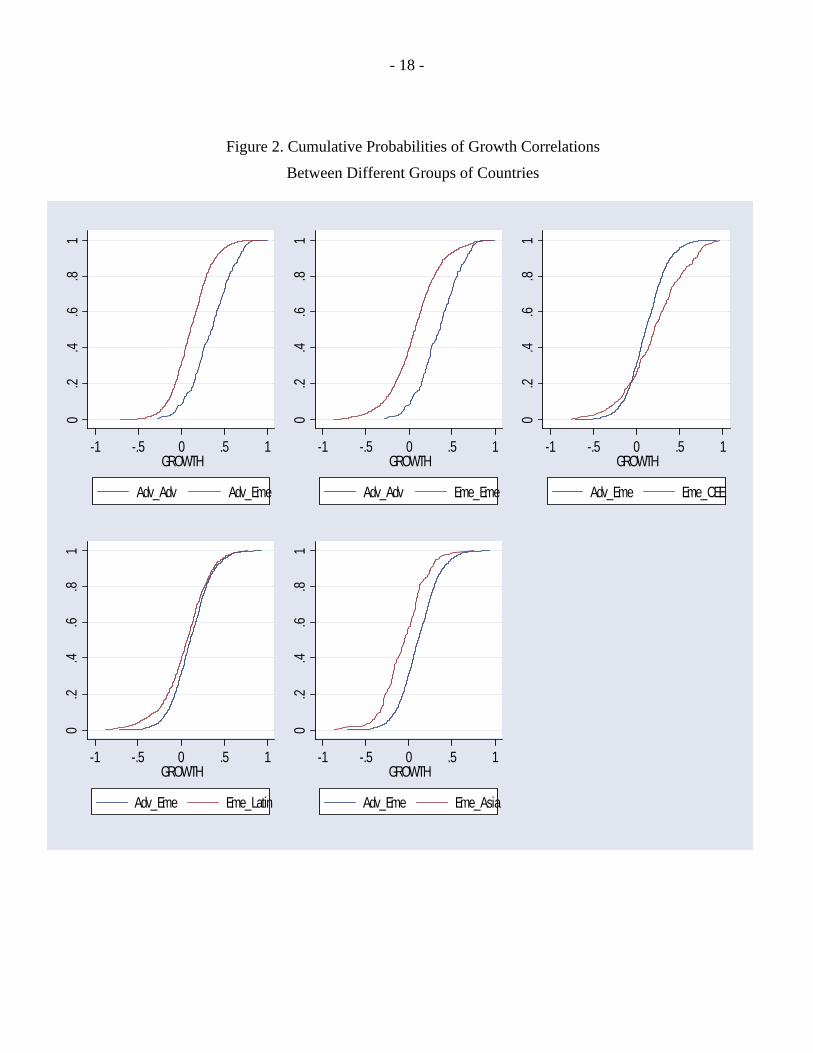
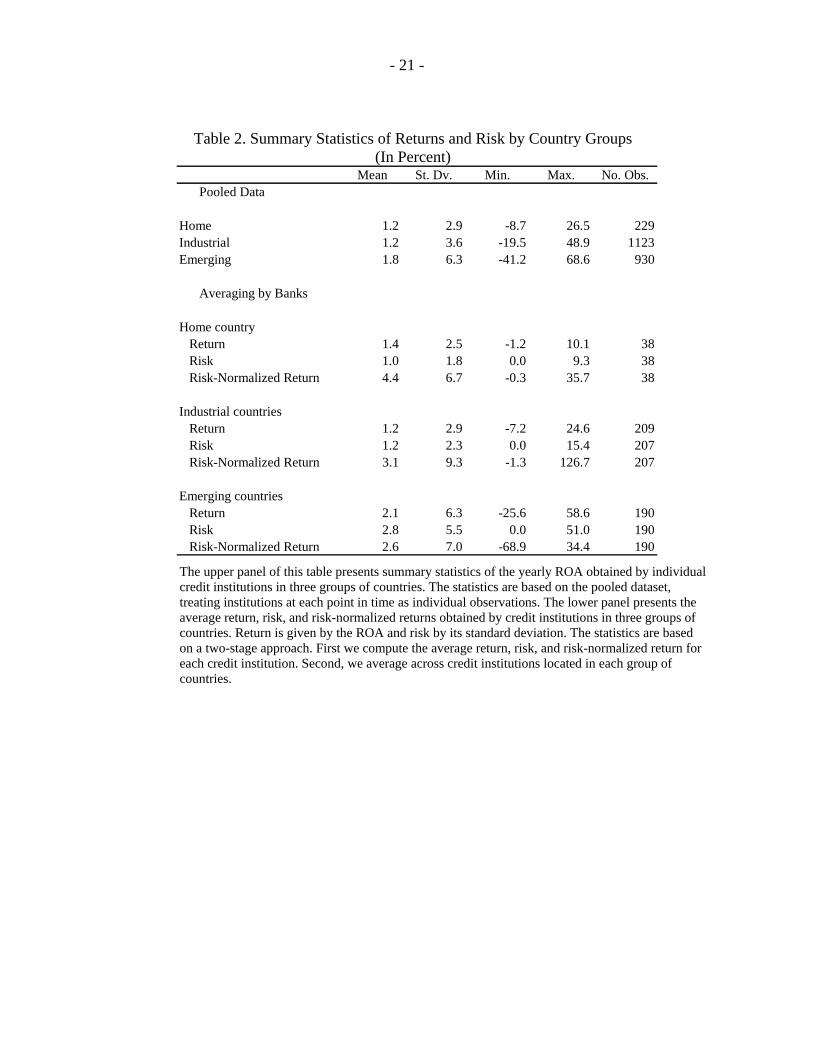
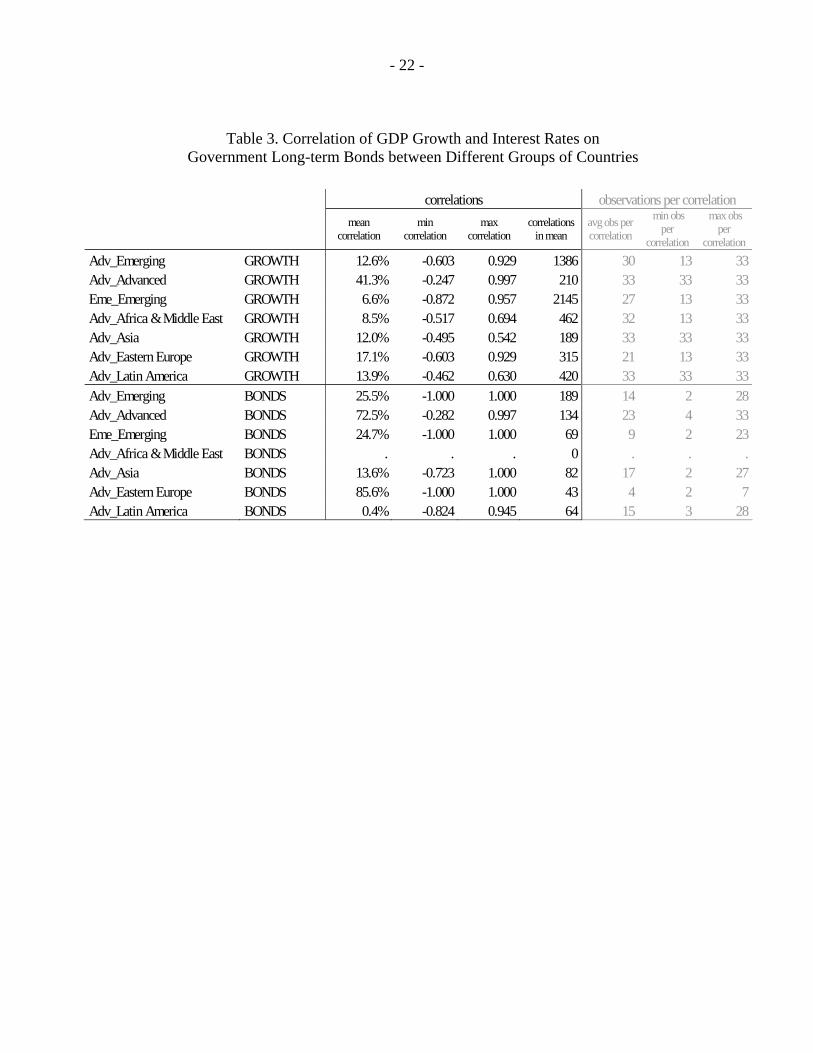
Summary statistics of the return and risk of international banks and their subsidiaries overseas are provided in Table 2. To explore for differences across groups of countries, the population of subsidiaries is divided in two groups, separating those located in industrial from those in emerging economies, on the conjecture that the latter may tend to be more profitable on average, but also riskier. This partition is also relevant for the analysis, since economic cycles between industrial and emerging economies tend to be less synchronized than between emerging countries only. This is confirmed in Table 3 where correlations in economic growth and interest rates between advanced and emerging countries are much lower than between advanced countries alone. In the same vein, Figure 2 shows that the cumulative probabilities of the correlation of GDP growth between emerging countries is consistently lower than that between advanced countries. These pieces of evidence point to the idea that international bank operations in emerging economies may offer larger diversification gains.
The results in the upper panel are based on the pooled dataset, that is, they refer to the entire distribution of yearly returns obtained by individual banks. Not surprisingly, the figures show a clear trade-off between return and risk: Subsidiaries located in emerging countries seem to be more profitable on average but also substantially riskier, as the standard deviation of their ROA is roughly two-times larger than the standard deviation attained in industrial countries. The high volatility of ROA in emerging countries reflects several episodes of economic and financial crisis during the sampled period. In turn, the profitability of the parent banks in their home separately countries roughly compares to the profitability of their subsidiaries in other industrial countries.
- 6 -
These results, however, are very crude, because the observations are not independent within banks (and possibly not even within countries) as assumed. To present a more refined picture, we compute a second set of summary statistics using a two-stage approach. First, we obtain the mean ROA and its standard deviation for each bank over the entire period (i.e., subsidiaries overseas are treated as individual entities), and compute the risk-normalized returns. Second, we average across banks in the three groups of countries considered (i.e., home, other industrial, and emerging). The results, presented in the lower panel, are similar to those discussed above in qualitative terms. The returns of parent banks at home tend to be lower than the returns obtained by their foreign subsidiaries in emerging countries, but also less volatile. However, when risk-normalized returns are used, international bank operations in their home countries dominate those obtained by their foreign subsidiaries, particularly those located in emerging countries. However, this result does not imply a negative contribution of foreign subsidiaries to the performance of the consolidated portfolio of international banks, since the later depends on the entire correlations of profit distributions. This will be investigated below.
III. BANK INTERNATIONALIZATION AND RISK-NORMALIZED RETURNS
In this section, we use regression analysis to assess the contribution of foreign subsidiaries to the risk-return performance of international banks. In particular, we consider the following specification:
titcEti
Iti
Eti
Iti
Htiti macroHHsharesharesharesharpe ,
',,2,1,2,1,0, εδββααα ++++++= (1)
Where the dependent variable, sharpei,t, is a measure of the risk-adjusted profitability obtained by international bank i, during year t, computed by dividing the yearly ROA of each parent bank over its standard deviation. The index i goes from 1 to 37 (i.e., the number of international banks in the sample), and covers the period 1995-2004. This implies an unbalanced panel of 399 observations. Our measure of profitability is the risk-normalized ROA obtained by each international bank, computed by dividing the yearly ROA over its standard deviation. The series were computed using data from the consolidated financial statements international banks, so they reflect the combined result of the operations of international banks in their home countries, including cross-border transactions, and the operations of their subsidiaries overseas.
The target explanatory variables are the relative allocation of bank assets in three regions: their home countries, sharei,t
H, their subsidiaries located in other industrial countries sharei,t
I, and their subsidiaries in emerging economies sharei,tE. The asset shares are based
on data from the unconsolidated financial statements to avoid double counting. Since these three variables add-up to one, the regression does not include a constant term. Under this specification, the coefficients associated with the regional distribution of assets provide a way to assess whether international banks with larger exposure overseas obtain any significantly different risk-adjusted returns, on average, during the sample period. In particular, we want to individually test whether α1≥ α0, and α2≥ α0.
- 7 -
To the extent that the shares of assets abroad are a choice variable for international banks, they bring in potential endogeneity. Arguably, a subsidiary with higher (observed or prospective) profitability would tend to receive a larger capital allocation and end up with a bigger size in relative terms, introducing a bias toward finding beneficial effects of international diversification (i.e., banks with larger assets abroad having better risk-adjusted returns). We deal with this issue by using lagged values of the asset shares as instruments in the regressions. A look at the data, however, indicates that this problem may not be serious, as the share of bank assets in a particular subsidiary is fairly stable.
In addition, there is a potential omitted variable bias due to lack of data on the size of the cross-border exposures of parent banks. Arguably, international diversification gains would originate both from local operations abroad and cross-border operations. The former are rightly captured by the shares of bank assets in foreign subsidiaries, but the later are implicitly taken as part of the regular operations of the parent banks in their home countries, thus introducing a potential bias to the estimates. The direction of this bias would depend on whether local operations abroad and cross-border operations are substitutes or complements. Under the plausible assumption that local and cross-border operations were substitutes, the results would be biased against finding international diversification gains. This is because the international diversification of banks with relatively low local operations abroad (and more heavily reliant on cross-border operations) will be incorrectly attributed to their activities at home. On the other hand, if local and cross-border operations were complements, the results would be biased in the other direction, overestimating the diversification gains of local operations abroad. Below, we propose a strategy to overcome this problem.
Going back to the specification, the regression includes two Herfindhal indexes measuring the concentration of the assets of each international bank within industrial and emerging countries as a way to capture the effect of international diversification within country groups:
∑∈
=Gj
tjiG
ti sH 2,,, (2)
Where HGi indicates the Herfindhal index of parent bank i in country group G (either
industrial or emerging), and si,j is the average share of assets of parent bank i in country j in year t. The Herfindhal indexes vary in the interval {0, 1}, were a larger value indicates a less diversified portfolio (i.e., a higher concentration within industrial or emerging economies). The shares are computed relative to the assets of the corresponding bank in both industrial and emerging areas and, thus, the maximum value of the Herfindhal in each group of countries is one (indicating that the bank operates in just one country in that particular group). The hypothesis that international diversification brings positive benefits in terms of the risk-return achieved by international banks is consistent with negative coefficients associated with the concentration indexes.
The regressions also include a vector of macroeconomic controls, macroc,t, which are intended to isolate the influence of macroeconomic conditions in the home countries of the
- 8 -
international banks on their overall performance. In our preferred specification, the vector contains money market rates, expressed in US$, and GDP growth. These variables vary along the time dimension and are common to all international banks incorporated in the same country. The regressions also contain a set of home-country dummies to control for time-invariant differences in the average profitability of international banks across their countries of incorporation.
A. Baseline Results
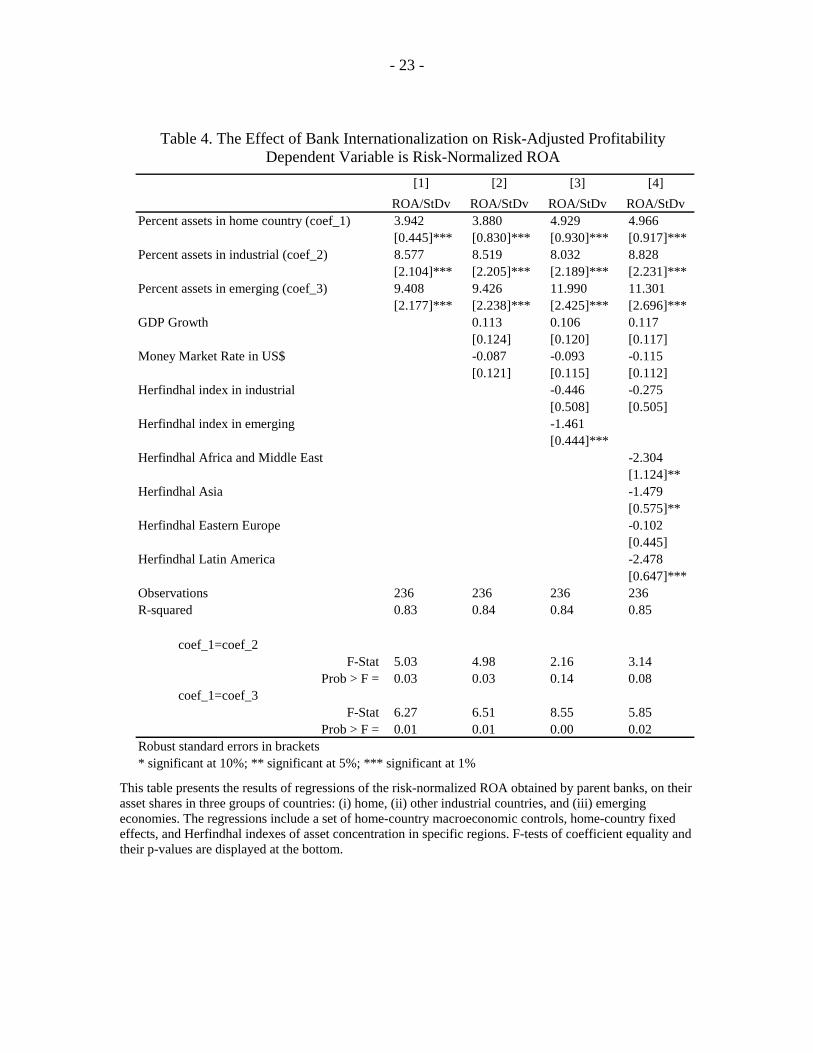
The regressions are computed with robust standard errors and presented in Table 4. The specification in the first column does not include any controls, other than home-country dummies, and thus provides an exploratory comparison of the risk-adjusted returns across international banks with varying levels of exposures overseas. On average, after adjusting for differences in risk-adjusted profitability between home countries, the sampled international banks obtained an overall risk-adjusted ROA of 3.9 percent during the sampled period. International banks with larger allocation of assets overseas, particularly in emerging economies, obtained substantially higher risk-normalized returns. In particular, the coefficient associated with the share of assets in emerging markets is significantly larger than the coefficient associated with the share of assets at home, as indicated by the probability values of the tests of coefficient equality presented at the bottom. At the same time, there is also evidence that international banks with a larger share of assets in subsidiaries located in industrial countries were able to obtain better risk-adjusted returns, albeit the difference is not statistically significant.
These results remain valid after the inclusion of the macroeconomic controls, as shown in the second column. Overall, they support the notion that subsidiaries overseas allow international banks to diversify risk (i.e., to increase on their risk-adjusted return) and point to an important underinvestment in emerging countries, at least from the pure risk-return perspective. These tests, however, are not well suited to compare profitability across parent banks with different international diversification profiles, as they ignore differences in the actual patterns of international asset allocation. For example, two banks with the same share of assets in industrial countries are treated similarly in these tests, regardless of the number of countries involved (and the same applies to bank exposures to emerging economies). The next section looks into this issue.
B. The Effects of Geographical Concentration on Risk-Adjusted Returns
To explore the effects of international diversification on risk-adjusted profitability, the previous regressions are computed again after adding a measure of asset concentration within country groups. The results are presented in the third row of Table 4. Adding information on the international concentration of bank operations to the set of explanatory increases the point estimates of the coefficients associated with the asset shares, but does not change their relative order in terms of magnitude. Consistent with this, the coefficients
- 9 -
of the Herfindhal indexes are negative, indicating that the regional concentration of the operations of international banks has been detrimental to their risk-adjusted profitability.
The marginal effect of regional concentration is particularly severe for international bank operations in emerging economies, as the associated coefficient is two times larger that its counterpart in industrial countries. This probably reflects the higher volatility of economic conditions in emerging countries, and also the clustering of crisis episodes due to exposure to common risk factors and international contagion. To some extent, however, this has been compensated by the fact that international bank operations in emerging economies are relatively less concentrated, as the corresponding Herfindhal index averaged 0.40 during the sampled period, against with 0.61 for industrial countries. Using these values, the average drop in risk-adjusted ROA originated by the regional concentration of bank activities overseas is 0.59 percent for emerging economies and 0.27 percent for industrial countries.
C. A Further Decomposition of Concentration Indexes in Emerging Countries
We now explore the consequences of international diversification in a more specific way. In particular, we want to assess whether the erosion in risk-adjusted profitability originates from specific geographic regions. This conjecture builds from the strong geographical patterns of international bank expansion, and the fact that macroeconomic conditions tend to move in tandem within geographical regions. To test this, we split the sample of emerging economies in four regions denoted by R: Asia, Africa and the Middle East, Eastern Europe, and Latin America. Based on this partition, we linearly decompose the Herfindhal index of each parent bank in emerging economies, HE
i, in its regional parts using:
∑∈
=ER
tRitRiEti HwH ,,
2,,, for i=1,2,...,37 (3)
Which indicates that the Herfindhal index in emerging economies for a given parent bank equals the sum of the Herfindhal indexes of its component geographical regions, Hi,t.R, weighted by their squared asset shares, wi,t,R.
Using this, we re-estimate the regression after replacing the Herfindhal index in emerging economies by its weighted components. All the previous results on the coefficients of the asset shares in the three regions hold, as shown in the fourth column of Table 4, so they do not merit further comments. The coefficients of the disaggregated concentration indexes, show some differences in the marginal costs of geographical concentration across regions. The effects have been roughly similar in Africa-Middle East and Latin America, with a percentage point increase in the respective Herfindhal indexes causing an estimated drop of 2.2 percent in the risk-normalized ROA of international banks. In turn, a percentage point
- 10 -
increase in the Herfindhal index of emerging Asia results in a 1.2 percent drop in the risk-normalized ROA of international banks operating in that region.
Overall, the results are consistent with the notion that larger presence overseas increases the risk-adjusted profitability of international banks. These diversification gains, however, are reduced –although not depleted - by asset concentration within regions. This is more the case for the Africa/Middle East and Latin America than for emerging Asia. These results, however, could be challenged on two grounds. First, as discussed above, our inability to disentangle the cross-border operations of international banks from their regular operations in their home countries creates a potential source of bias. Besides, since the regressions do not include bank-level controls, the results could be also driven by other omitted variables at the bank-level. For example, differences in business strategies across banks could have an impact on their profitability, influencing at the same time the nature of their international exposures in a systematic way. Unfortunately, typical controls used in the banking literature (i.e., size, capitalization, or liquidity) offer little help to tackle these issues, as they convey no information of the characteristics of bank businesses.
D. Omitted Variables
In this section, we develop a novel strategy to control for the potential omitted variable bias described before. It exploits differences in the information content of the consolidated and unconsolidated financial statements of parent banks. In particular, unconsolidated financial statements convey information on the activities of parent banks in their home countries, plus their cross-border activities (including cross-border lending to their subsidiaries and other financial institutions). On the other hand, the consolidated financial statements of parent banks include the above plus those of their subsidiaries, netting out intra-group transactions. Since both consolidation levels refer to the same institution, taking the difference between consolidated and unconsolidated data serves to isolate the contribution of foreign subsidiaries to the risk-return profile of parent banks. This also removes unwarranted cross-sectional differences between parent banks, notably including time-varying unobservable variables such as risk appetite and business strategies.
To implement this idea, we compute the risk-adjusted ROA for each parent bank using both consolidated and unconsolidated data, and obtained the difference between the two (consolidated minus unconsolidated). A positive value of the resulting metric indicates that foreign subsidiaries contributed to improve the risk-return profile of their parent banks. A practical drawback of this approach is the decrease in sample size, since there are parent banks for which we do not have parallel information at the two consolidated levels. This includes all U.S. and Canadian banks.
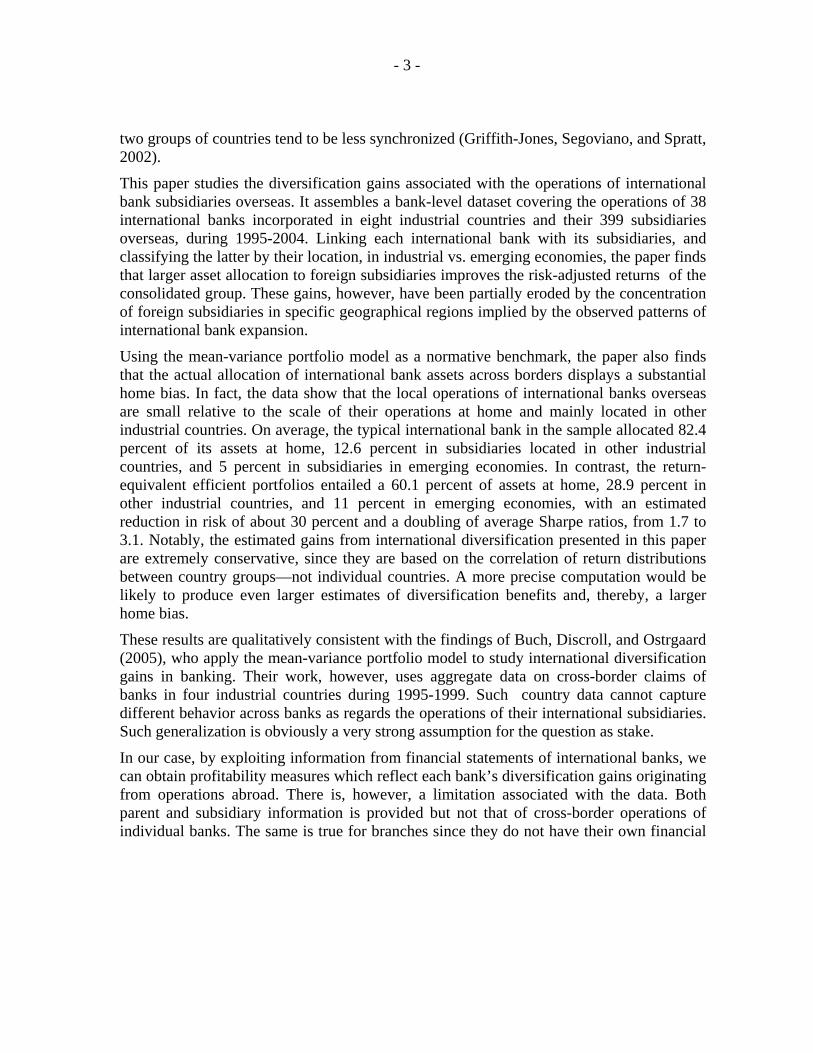
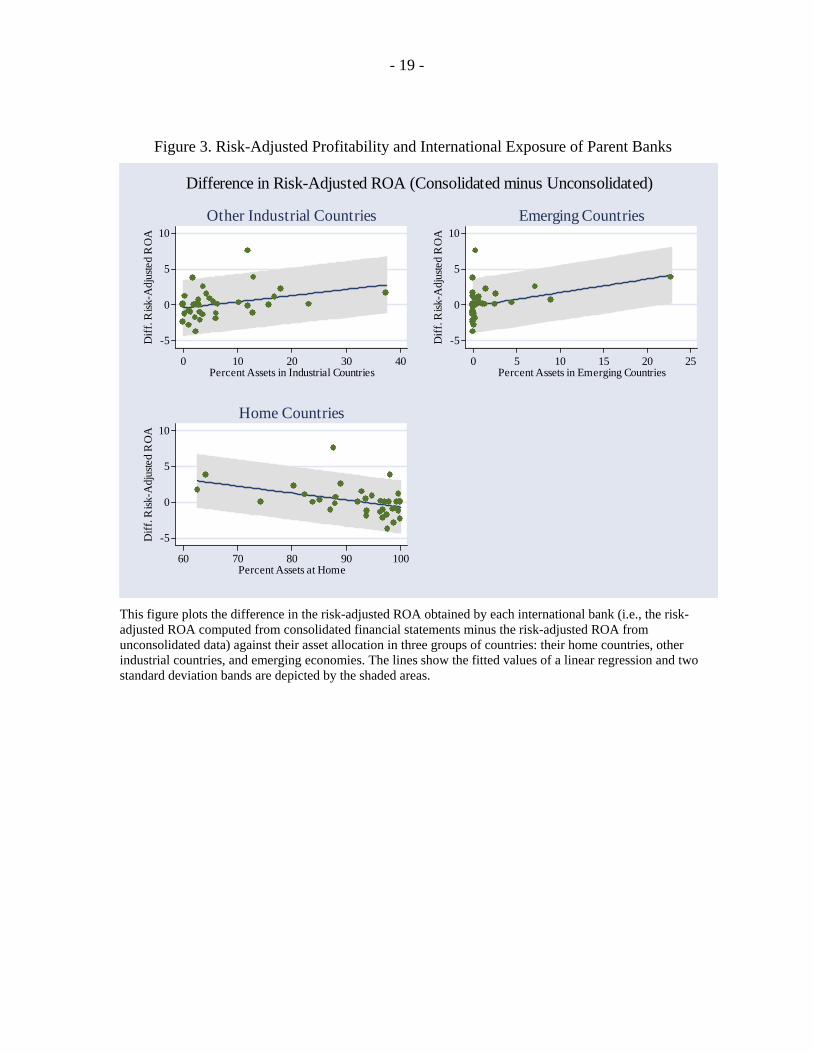
To illustrate the resulting data, Figure 3 plots the difference in risk-adjusted ROA of each parent bank against the average share of their assets in the three groups of countries: (i) home (at the bottom), (ii) other industrial countries (upper-left), and (iii) emerging economies (upper-right). Surprisingly, the graphs show that the average risk adjusted-return obtained by parent banks on a solo basis is not consistently below the risk adjusted-return obtained at the consolidated level, as should be expected by the effects of
- 11 -
diversification. In fact, roughly half of the differences in risk-adjusted ROA are negative. However, there is strong evidence that higher international exposure is positively correlated with risk-adjusted returns, which is consistent with the previous results.
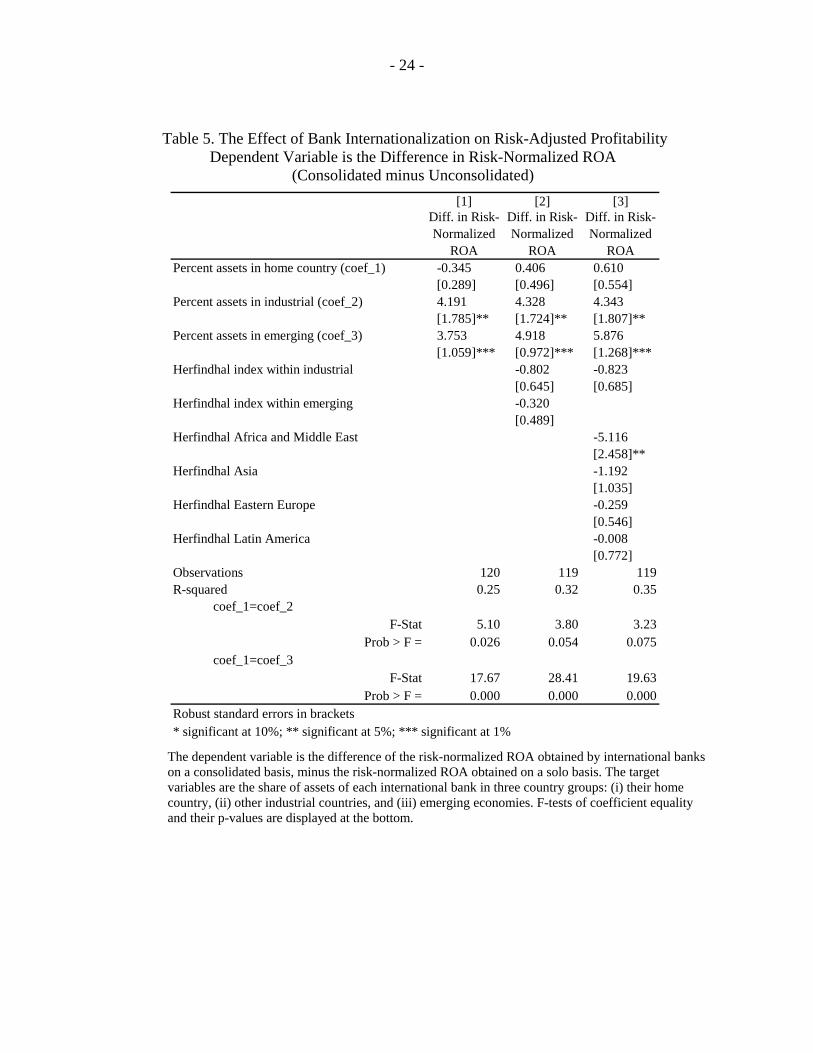
A more formal test of the relationship between the difference in risk-adjusted ROA and the international exposure of parent banks is obtained by running a set of regressions similar to those reported previously but excluding the country fixed effects and the macro-controls (as these are removed by differencing, together with other bank-level idiosyncrasies).
The results are presented in Table 5. Due to incomplete data at the two consolidation levels for some parent banks, the sample size drops to 23 international banks and a total of 122 observations. Overall, the results indicate that foreign subsidiaries had a positive contribution to the risk-adjusted returns of their parent banks. The coefficient of the share of assets at home is close to zero and not statistically significant, implying that, on average, the risk-adjusted returns obtained by parent banks on their consolidated operations are no different from those obtained on a solo basis. On the other hand, parent banks with a larger share of their assets abroad, particularly in emerging economies, have been able to obtain gains in terms of their risk-adjusted returns. These results are roughly unchanged after the inclusion of the Herfindhal indexes. While the signs of the coefficients associated with the Herfindhal indexes are consistent with those reported previously, their standard errors are too large, a result possibly due to the relatively small sample size.
Summarizing, there is strong evidence that a larger allocation of bank activities overseas has contributed to increase the risk-adjusted returns of international banks, albeit regional concentration has reduced such gains.3 However, the tests conducted so far are largely silent with respect to the optimality of the observed international asset allocation. The next section studies this issue in more detail using a portfolio approach as a normative framework to study international diversification in banking.
IV. A PORTFOLIO APPROACH
Following Markovitz (1952), the return and risk of a portfolio of n assets can be decomposed into the contributions of its individual components. Let r denote the n×1 vector of expected returns of individual assets, w the n×1 vector of their corresponding weights in the portfolio, and Σ the n×n variance-covariance matrix of asset returns in the portfolio. The expected return and variance of the portfolio are given by rw'=μ , and , respectively. Applying quadratic programming techniques to this set up, it ww Σ= '2σ
3 [Similar results were obtained using a sub-sample restricted to the larger international banks (not reported here).]
- 12 -
is possible to obtain the vector of non-negative weights that minimize the variance required to attain a given return, and obtain a set of efficient portfolios in the risk-return space.
This framework appears suitable to analyze international diversification in the banking context, treating the operations of international banks in specific countries as individual assets in a global portfolio. However, this direct translation raises some caveats. While securities are treated as perfect substitutes in the context of portfolio theory, applying a similar criterion to the foreign subsidiaries of international banks does not seem to be appropriate. Launching banking operations in a foreign country entails multiple frictions—generated by legal, cultural, and historic differences between countries—and is costly from the economic and managerial perspectives. These frictions and costs are likely to differ across international banks depending, for example, on their country of origin and other bank-specific characteristics. However, for a given international bank, the costs of internal capital relocation across its existing subsidiaries overseas are likely to be significantly lower. This suggests that a more suitable application could restrict portfolio theory to study diversification gains within the observed set of foreign subsidiaries of international banks, on a case-by-case basis. This is the approach pursued below.
Applied in this context, portfolio theory provides a tool to assess the contributions of specific bank subsidiaries (or a subset of them) to the overall risk-return performance of international banks. It also provides a benchmark to assess the optimality of the observed global asset allocation of international banks. Unfortunately, studying the diversification of bank portfolios at the level of individual countries poses some practical limitations. As the collection of foreign subsidiaries (and host countries) of each international bank evolves over time, the yearly coverage of portfolio components tends to be uneven, affecting our ability to compute the variances and covariance’s of the returns obtained in individual countries. To circumvent this problem, we work at the level of country groups, splitting the operations of each international bank in three groups G, as we did before (G={home, other industrial countries, emerging economies}).
In particular, let πi,c,t denote the unconsolidated after-tax profits obtained by international bank i (or its subsidiaries) in country c during year t, and Ai,c,t denote the corresponding unconsolidated assets.4 We calculate the return on assets ri,G,t obtained by international bank i in country group G as:
∑∑
∈
∈=Gc tci
Gc tcitGi A
r,,
,,,,
π (4)
4 Unconsolidated figures provide a closer (albeit imperfect) measure of the profitability of individual business units, since each bank is treated as an independent entity.
- 13 -
Using this, we compute the first two moments of the return distributions obtained by each international bank in the three groups of countries (i.e., the 3×1 vector of expected returns ri and the 3×3 associated variance-covariance matrix Σi), and corresponding the vector of asset shares wi. We estimate the efficient mean-variance portfolios for each international bank by solving (bank indexes are omitted for brevity):
www Σ=≥ 'min 0σ s.t. μ≥rw' (5)
For varying values of target portfolio returns μ. The efficient frontier of each international bank is the set of points in the risk-return space {σ*(μ), μ}, where σ*(μ) is the solution to (5).
This provides a benchmark to assess the optimality of the observed allocation of international bank assets. Since all the portfolios along the frontier are efficient, picking a particular combination would require a measure of the risk appetite of international banks, or the return of a risk-free asset. We use an alternative criteria, picking a point consistent with the observed ROA. More precisely, we select an efficient portfolio with a return equal to (or slightly higher than) the observed ROA.5 We then measure the optimality of international bank portfolios using the horizontal distance between the observed risk-return attained by each international bank (σ0, μ0) and its frontier, d=σ0 – σ*(μ0). Thus, the resulting metric reflects the reduction in risk associated with an efficient relocation of international bank assets within its existing subsidiaries. Finally, we compute the efficient asset allocation and the implied Sharpe ratios, comparing them with the observed values for each international bank.
It is important to notice that the approach described above understates the potential gains of international diversification for three reasons. First, restricting the analysis to diversification using the observed network of foreign subsidiaries of each international bank neglects potential diversification gains from operating in a different, potentially broader, set of countries. Second, the regional grouping of bank operations prevents us from assessing the potential diversification gains of alternative asset allocations within regions. Thus, for example, the sub-portfolio in emerging countries reflects the diversification achieved by the observed asset allocation, underestimating the diversification gains associated with an alternative allocation within this group. These two effects operate in the same direction, introducing an unambiguous and potentially large underestimation of the diversification gains of cross-border operations. The next section applies this approach to all the international banks on a case-by-case basis.
5 In most cases, the ROA of the selected efficient allocation is larger than the ROA of the actual portfolio due to approximation, as the frontier is based on a grid of 20 points.
- 14 -
A. Results
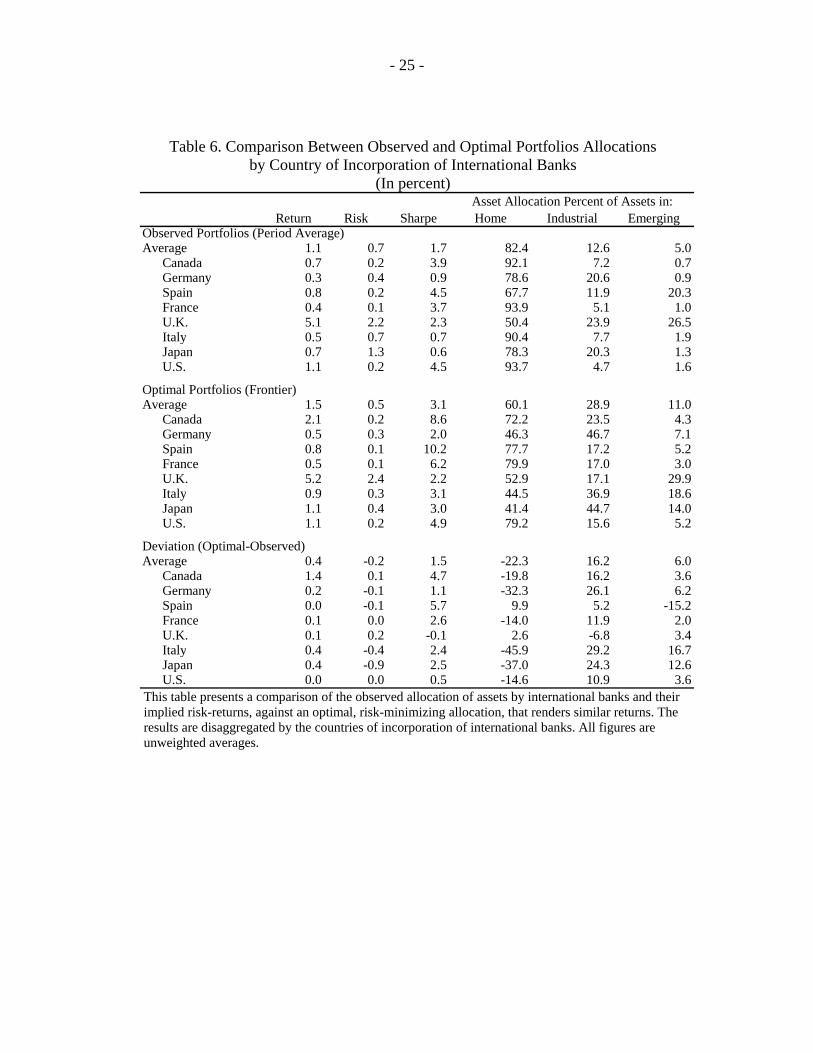
Summary results are presented in Table 6, comparing the actual asset allocation of international banks worldwide and their associated risk-returns, against the alternative, risk-minimizing portfolios. The reported figures are unweighted averages of the results obtained for individual banks, classified by their countries of incorporation, so they convey information on the profile of the typical international banks. As discussed previously, the observed asset allocation is heavily tilted toward the home countries of international banks. Overall, the sampled banks had 82.4 percent of their assets at home, 12.6 percent in subsidiaries located in other industrial countries and 5 percent in subsidiaries located in emerging countries. With the exception of Spanish and British banks, the average exposures to emerging markets are considerably lower, below 2 percent of assets. To the extent that economic cycles are imperfectly correlated across countries, these numbers are, by themselves, suggestive of a home bias in international asset allocation. This presumption is strongly supported by the results. The optimal allocation matching the observed returns implies an average of 60.1 percent of assets at home, 28.9 percent in other industrial countries, and 11.0 percent in emerging markets. This home bias holds qualitatively for all the countries studied, except for Spain, probably reflecting the combined effect of robust domestic economic performance during the period, and the large volatility in Latin America.
The results also indicate that international diversification gains are large and unexploited. In particular, under the observed asset allocation, international banks obtained an average ROA of 1.0 percent over the entire period, with a standard deviation of 1.0 percent. In contrast, the risk-minimizing allocation for a comparable ROA of 1.2 percent entails a 40 percent reduction in volatility. This result is significant from the financial stability perspective, entailing potentially large reductions in economic and regulatory capital that could be taken into account in the prudential framework.
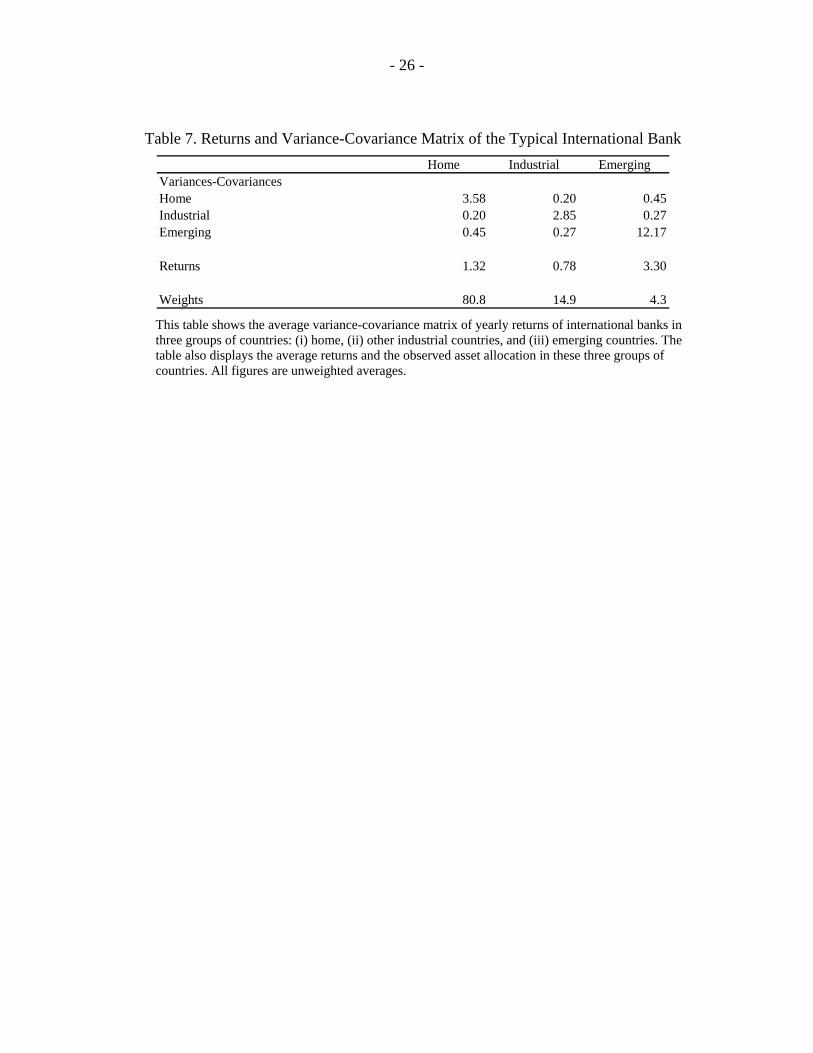
To analyze the sources of these international diversification gains, we take vectors of expected returns in the three groups of countries for each international bank, and their corresponding variance-covariance matrices. Table 7 presents the results for the typical international bank, computed by taking unweighted averages across the entire sample of international banks. The figures indicate that the expected returns at home are roughly in line with the expected returns of subsidiaries located in other industrial countries, but substantially lower than average returns in emerging economies. The volatilities of the returns at home and in other industrial countries are also similar, roughly four-times smaller than the volatility of returns in emerging economies. The diversification gains from the operations of subsidiaries abroad, including in emerging economies, originate from the extremely low return covariances.
- 15 -
V. CONCLUDING REMARKS
This paper provides evidence that international diversification gains in banking, through the opening up of subsidiaries, are large and not entirely exploited. Our results show robust systematic differences in the risk-return performance of international bank operations in their home countries against their subsidiaries overseas, indicating that the later are more profitable, on average, but also riskier, particularly in emerging economies. Larger systematic risks abroad, however, do not prevent the generation of international diversification gains, stemming from the generally low correlations of returns across-countries, especially with emerging economies. The fact that banking activities in emerging economies tend to be concentrated in a single region has eroded somewhat the gains from international diversification but has by no means depleted them.
Using the mean-variance portfolio model as a benchmark, the results show a substantial home bias in the international allocation of bank assets. Notably, these results come from a test that substantially underestimates the gains from international diversification, as it is restricted to diversification gains within the observed set of subsidiaries of each international bank. This implies that—notwithstanding the current regional concentration for emerging economies—the potential gains are still sizable.
These finding have two important sets of policy implications. The first one concerns bank regulation. Risk weighting in the single factor model under Basel II penalizes international bank exposures only on the basis of the idiosyncratic risk of the recipient countries. The potential consequences of this directive on the size and volatility of international capital flows has triggered substantial discussion. The results presented here confirm that the single factor model could be excessively penalizing. In this regard, regulators may want to consider the entire contribution of foreign exposures to the overall risk performance of bank assets, which depends on return correlations. The second relates to the importance of reducing home bias in international banking. This would not only improve risk-adjusted profitability for international banks but would also facilitate the financing of growth in emerging economies as well, as industrial ones, as long as returns are not highly correlated.
There are a number of issues to take into account regarding these results. First, due to data limitations, the test is based on diversification gains between country groups, and not at the level of individual countries. Future research on this topic, based on more complete bank-level data, will probably find even larger unexploited benefits. Second, our dataset deals with bank internationalization through subsidiaries but we lack information on branches and cross-border loans. Such comprehensive data would allow us to draw firmer conclusions on the issues but it is unfortunately not available. One possible venue for future research might be case studies for which cross-border bank lending is available.
- 16 -
VI. REFERENCES
Acharya, V.V., I. Hasan, and A. Saunders (2002). “The Effects of Focus and Diversification on Bank Risk and Return: Evidence from Individual Bank Loan Portfolios.” CEPR Working Paper No. 3252. Buch, C., J. Driscoll, and C. Ostergaard (2005). “Cross-Border Diversification in Bank Asset Portfolios.” European Central Bank Working Paper No. 429, January. Griffith-Jones, S., M. Segoviano, and S. Spratt (2002). “Basel II and Developing Countries: Diversification and Portfolio Effects.” Working Paper, The London School of Economics. Grubel, H. (1968) “Internationally Diversified Portfolios: Welfare gains and Capital Flows.” The American Economic Review, Vol. 58, 1299-1314. Lessard, D. (1973) “International Portfolio Diversification: A Multivariate Analysis for a Group of Latin American Countries.” Journal of Finance (June), 619-633. Levy, H. and M. Sarnat (1970) “International Diversification Gains of Investment Portfolios.” The American Economic Review, Vol. 60, No. 4, 668-675. Markowitz, H. (1952). “Portfolio Selection.” Journal of Finance 7, 77-91. Markowitz, H. (1959). Portfolio Selection: Efficient Diversification of investments. John Wiley, New York. Morgan, D. and K. Samolik. “Geographic Diversification in Banking and its Implications for Bank Portfolio Choice and Performance.” Working Paper, Federal Reserve Bank of New York. Stiroh, K. (2005). “Bank Risk and revenue Diversification: An Assessment Using Equity Returns.” Working Paper, Federal Reserve Bank of New York.
- 17 -
Figure 1. Evolution of Local and Cross-Border Claims of BIS-Reporting Banks, 1983-2004 Host: All Countries
Host: Developing Countries (BIS Classification)
Host: Developed Countries (BIS Classification)
CONSOLIDATED FOREIGN CLAIMS
0
2,000
4,000
6,000
8,000
10,000
12,000
14,000
16,000
1983 1984 1985 1986 1987 1988 1989 1990 1991 1992 1993 1994 1995 1996 1997 1998 1999 2000 2001 2002 2003 2004
LOCAL CLAIMS CONSOLIDATED INTERNATIONAL CLAIMS OF REPORTING BANKS ON INDIVIDUAL COUNTRIES
CONSOLIDATED FOREIGN CLAIMS
0
200
400
600
800
1,000
1,200
1,400
1,600
1,800
1983 1984 1985 1986 1987 1988 1989 1990 1991 1992 1993 1994 1995 1996 1997 1998 1999 2000 2001 2002 2003 2004
LOCAL CLAIMS CONSOLIDATED INTERNATIONAL CLAIMS OF REPORTING BANKS ON INDIVIDUAL COUNTRIES
CONSOLIDATED FOREIGN CLAIMS
0
2,000
4,000
6,000
8,000
10,000
12,000
14,000
1983 1984 1985 1986 1987 1988 1989 1990 1991 1992 1993 1994 1995 1996 1997 1998 1999 2000 2001 2002 2003 2004
LOCAL CLAIMS CONSOLIDATED INTERNATIONAL CLAIMS OF REPORTING BANKS ON INDIVIDUAL COUNTRIES
- 18 -
Figure 2. Cumulative Probabilities of Growth Correlations
Between Different Groups of Countries
0.2
.4.6
.81
-1 -.5 0 .5 1GROWTH
Adv_Adv Adv_Eme
0.2
.4.6
.81
-1 -.5 0 .5 1GROWTH
Adv_Adv Eme_Eme
0.2
.4.6
.81
-1 -.5 0 .5 1GROWTH
Adv_Eme Eme_CEE
0.2
.4.6
.81
-1 -.5 0 .5 1GROWTH
Adv_Eme Eme_Latin
0.2
.4.6
.81
-1 -.5 0 .5 1GROWTH
Adv_Eme Eme_Asia
- 19 -
Figure 3. Risk-Adjusted Profitability and International Exposure of Parent Banks
-5
0
5
10
Diff
. Risk
-Adj
uste
d R
OA
0 10 20 30 40Percent Assets in Industrial Countries
Other Industrial Countries
-5
0
5
10
Diff
. Risk
-Adj
uste
d R
OA
0 5 10 15 20 25Percent Assets in Emerging Countries
Emerging Countries
-5
0
5
10
Diff
. Risk
-Adj
uste
d R
OA
60 70 80 90 100Percent Assets at Home
Home Countries
Difference in Risk-Adjusted ROA (Consolidated minus Unconsolidated)
This figure plots the difference in the risk-adjusted ROA obtained by each international bank (i.e., the risk-adjusted ROA computed from consolidated financial statements minus the risk-adjusted ROA from unconsolidated data) against their asset allocation in three groups of countries: their home countries, other industrial countries, and emerging economies. The lines show the fitted values of a linear regression and two standard deviation bands are depicted by the shaded areas.
- 20 -
Table 1. Regional Distribution of Bank Subsidiaries Overseas Country of incorporation of parent banks
Canada France Germany Italy Japan Spain U.K. U.S. TotalNumber of institutions
Number of mother banks 5 4 5 5 7 2 4 6
Number of subsidiaries 27 70 67 30 38 33 61 73 399
In Industrial Economies 15 33 40 19 26 12 35 29 2
In Emerging Economies 12 37 27 11 12 21 26 44 1Africa and Middle East . 17 . . . . 12 6Asia 3 6 3 . 9 . 7 12Eastern Europe . 10 23 9 1 . 2 7 52Latin America 9 4 1 2 2 21 5 19 63
Regional distribution of assets (unweighted averages, in percent)Home Country 92.1 93.9 78.6 90.4 78.3 67.7 50.4 93.7 82.
Subsidiaries Overseas 7.8 6.1 21.4 9.5 21.7 32.2 49.5 6.2 17.6
In Industrial Economies 7.2 5.1 20.6 7.7 20.3 11.9 23.1 4.6 12.6
In Emerging Economies 0.6 1.0 0.8 1.8 1.4 20.3 26.4 1.6 5.0Africa and Middle East . 0.5 . . . . 3.9 0.2Asia 0.1 0.1 0.1 . 1.1 . 20.6 0.6 2.5Eastern Europe . 0.3 0.7 1.6 . . . 0.1 0.4Latin America 0.5 0.1 . 0.2 0.3 20.3 1.9 0.7 1.6
38
09
903540
4
0.5
The upper panel of this table presents the distribution of bank subsidiaries overseas, by their location and country of incorporation of their parent banks. Two subsidiaries sharing a parent bank and located in the same country are counted separately. The lower panel presents the average distribution of assets of international banks by their countries of incorporation. Averages are unweighted, computed over all parent banks incorporated in a given country.
- 21 -
Table 2. Summary Statistics of Returns and Risk by Country Groups (In Percent)
Mean St. Dv. Min. Max. No. Obs.Pooled Data
Home 1.2 2.9 -8.7 26.5 229Industrial 1.2 3.6 -19.5 48.9 1123Emerging 1.8 6.3 -41.2 68.6 930
Averaging by Banks
Home countryReturn 1.4 2.5 -1.2 10.1 38Risk 1.0 1.8 0.0 9.3 38Risk-Normalized Return 4.4 6.7 -0.3 35.7 38
Industrial countriesReturn 1.2 2.9 -7.2 24.6 209Risk 1.2 2.3 0.0 15.4 207Risk-Normalized Return 3.1 9.3 -1.3 126.7 207
Emerging countriesReturn 2.1 6.3 -25.6 58.6 190Risk 2.8 5.5 0.0 51.0 190Risk-Normalized Return 2.6 7.0 -68.9 34.4 190
The upper panel of this table presents summary statistics of the yearly ROA obtained by individual credit institutions in three groups of countries. The statistics are based on the pooled dataset, treating institutions at each point in time as individual observations. The lower panel presents the average return, risk, and risk-normalized returns obtained by credit institutions in three groups of countries. Return is given by the ROA and risk by its standard deviation. The statistics are based on a two-stage approach. First we compute the average return, risk, and risk-normalized return for each credit institution. Second, we average across credit institutions located in each group of countries.
- 22 -
Table 3. Correlation of GDP Growth and Interest Rates on Government Long-term Bonds between Different Groups of Countries
correlations observations per correlation
mean
correlation min
correlation max
correlation correlations
in mean avg obs per correlation
min obs per
correlation
max obs per
correlation
Adv_Emerging GROWTH 12.6% -0.603 0.929 1386 30 13 33Adv_Advanced GROWTH 41.3% -0.247 0.997 210 33 33 33Eme_Emerging GROWTH 6.6% -0.872 0.957 2145 27 13 33Adv_Africa & Middle East GROWTH 8.5% -0.517 0.694 462 32 13 33Adv_Asia GROWTH 12.0% -0.495 0.542 189 33 33 33Adv_Eastern Europe GROWTH 17.1% -0.603 0.929 315 21 13 33Adv_Latin America GROWTH 13.9% -0.462 0.630 420 33 33 33Adv_Emerging BONDS 25.5% -1.000 1.000 189 14 2 28Adv_Advanced BONDS 72.5% -0.282 0.997 134 23 4 33Eme_Emerging BONDS 24.7% -1.000 1.000 69 9 2 23Adv_Africa & Middle East BONDS . . . 0 . . .Adv_Asia BONDS 13.6% -0.723 1.000 82 17 2 27Adv_Eastern Europe BONDS 85.6% -1.000 1.000 43 4 2 7Adv_Latin America BONDS 0.4% -0.824 0.945 64 15 3 28
- 23 -
Table 4. The Effect of Bank Internationalization on Risk-Adjusted Profitability Dependent Variable is Risk-Normalized ROA
[1] [2] [3] [4]ROA/StDv ROA/StDv ROA/StDv ROA/StDv
Percent assets in home country (coef_1) 3.942 3.880 4.929 4.966[0.445]*** [0.830]*** [0.930]*** [0.917]***
Percent assets in industrial (coef_2) 8.577 8.519 8.032 8.828[2.104]*** [2.205]*** [2.189]*** [2.231]***
Percent assets in emerging (coef_3) 9.408 9.426 11.990 11.301[2.177]*** [2.238]*** [2.425]*** [2.696]***
GDP Growth 0.113 0.106 0.117[0.124] [0.120] [0.117]
Money Market Rate in US$ -0.087 -0.093 -0.115[0.121] [0.115] [0.112]
Herfindhal index in industrial -0.446 -0.275[0.508] [0.505]
Herfindhal index in emerging -1.461[0.444]***
Herfindhal Africa and Middle East -2.304[1.124]**
Herfindhal Asia -1.479[0.575]**
Herfindhal Eastern Europe -0.102[0.445]
Herfindhal Latin America -2.478[0.647]***
Observations 236 236 236 236R-squared 0.83 0.84 0.84 0.85
coef_1=coef_2F-Stat 5.03 4.98 2.16 3.14
Prob > F = 0.03 0.03 0.14 0.08coef_1=coef_3
F-Stat 6.27 6.51 8.55 5.85Prob > F = 0.01 0.01 0.00 0.02
Robust standard errors in brackets* significant at 10%; ** significant at 5%; *** significant at 1%
This table presents the results of regressions of the risk-normalized ROA obtained by parent banks, on their asset shares in three groups of countries: (i) home, (ii) other industrial countries, and (iii) emerging economies. The regressions include a set of home-country macroeconomic controls, home-country fixed effects, and Herfindhal indexes of asset concentration in specific regions. F-tests of coefficient equality and their p-values are displayed at the bottom.
- 24 -
Table 5. The Effect of Bank Internationalization on Risk-Adjusted Profitability Dependent Variable is the Difference in Risk-Normalized ROA
(Consolidated minus Unconsolidated)
[1] [2] [3]Diff. in Risk-Normalized
ROA
Diff. in Risk-Normalized
ROA
Diff. in Risk-Normalized
ROAPercent assets in home country (coef_1) -0.345 0.406 0.610
[0.289] [0.496] [0.554]Percent assets in industrial (coef_2) 4.191 4.328 4.343
[1.785]** [1.724]** [1.807]**Percent assets in emerging (coef_3) 3.753 4.918 5.876
[1.059]*** [0.972]*** [1.268]***Herfindhal index within industrial -0.802 -0.823
[0.645] [0.685]Herfindhal index within emerging -0.320
[0.489]Herfindhal Africa and Middle East -5.116
[2.458]**Herfindhal Asia -1.192
[1.035]Herfindhal Eastern Europe -0.259
[0.546]Herfindhal Latin America -0.008
[0.772]Observations 120 119 119R-squared 0.25 0.32 0.35
coef_1=coef_2F-Stat 5.10 3.80 3.23
Prob > F = 0.026 0.054 0.075coef_1=coef_3
F-Stat 17.67 28.41 19.63Prob > F = 0.000 0.000 0.000
Robust standard errors in brackets* significant at 10%; ** significant at 5%; *** significant at 1%
The dependent variable is the difference of the risk-normalized ROA obtained by international banks on a consolidated basis, minus the risk-normalized ROA obtained on a solo basis. The target variables are the share of assets of each international bank in three country groups: (i) their home country, (ii) other industrial countries, and (iii) emerging economies. F-tests of coefficient equality and their p-values are displayed at the bottom.
- 25 -
Table 6. Comparison Between Observed and Optimal Portfolios Allocations by Country of Incorporation of International Banks
(In percent)
Return Risk Sharpe Home Industrial EmergingObserved Portfolios (Period Average)Average 1.1 0.7 1.7 82.4 12.6 5.0
Canada 0.7 0.2 3.9 92.1 7.2 0.7Germany 0.3 0.4 0.9 78.6 20.6 0.9Spain 0.8 0.2 4.5 67.7 11.9 20.3France 0.4 0.1 3.7 93.9 5.1 1.0U.K. 5.1 2.2 2.3 50.4 23.9 26.5Italy 0.5 0.7 0.7 90.4 7.7 1.9Japan 0.7 1.3 0.6 78.3 20.3 1.3U.S. 1.1 0.2 4.5 93.7 4.7 1.6
Optimal Portfolios (Frontier)Average 1.5 0.5 3.1 60.1 28.9 11.0
Canada 2.1 0.2 8.6 72.2 23.5 4.3Germany 0.5 0.3 2.0 46.3 46.7 7.1Spain 0.8 0.1 10.2 77.7 17.2 5.2France 0.5 0.1 6.2 79.9 17.0 3.0U.K. 5.2 2.4 2.2 52.9 17.1 29.9Italy 0.9 0.3 3.1 44.5 36.9 18.6Japan 1.1 0.4 3.0 41.4 44.7 14.0U.S. 1.1 0.2 4.9 79.2 15.6 5.2
Deviation (Optimal-Observed)Average 0.4 -0.2 1.5 -22.3 16.2 6.0
Canada 1.4 0.1 4.7 -19.8 16.2 3.6Germany 0.2 -0.1 1.1 -32.3 26.1 6.2Spain 0.0 -0.1 5.7 9.9 5.2 -15.2France 0.1 0.0 2.6 -14.0 11.9 2.0U.K. 0.1 0.2 -0.1 2.6 -6.8 3.4Italy 0.4 -0.4 2.4 -45.9 29.2 16.7Japan 0.4 -0.9 2.5 -37.0 24.3 12.6U.S. 0.0 0.0 0.5 -14.6 10.9 3.6
Asset Allocation Percent of Assets in:
This table presents a comparison of the observed allocation of assets by international banks and their implied risk-returns, against an optimal, risk-minimizing allocation, that renders similar returns. The results are disaggregated by the countries of incorporation of international banks. All figures are unweighted averages.
- 26 -
Table 7. Returns and Variance-Covariance Matrix of the Typical International Bank Home Industrial Emerging
Variances-CovariancesHome 3.58 0.20 0.45Industrial 0.20 2.85 0.27Emerging 0.45 0.27 12.17
Returns 1.32 0.78 3.30
Weights 80.8 14.9 4.3 This table shows the average variance-covariance matrix of yearly returns of international banks in three groups of countries: (i) home, (ii) other industrial countries, and (iii) emerging countries. The table also displays the average returns and the observed asset allocation in these three groups of countries. All figures are unweighted averages.


![CHAPTER 9: THE STRATEGIC GAINS FROM …1].pdf · organisations linked into a varying ... estimated the impact of the degree of firm unrelated diversification and ... company to gain](https://img.pdfslide.us/doc/110x75/5b5657d97f8b9ac31e8c4276/chapter-9-the-strategic-gains-from-1pdf-organisations-linked-into-a-varying.jpg)


![Biased Graphs. I. Bias, Balance, and Gains* - core.ac.uk · by Simdes-Pereira. It is based on the bias in which no circle is balanced. Dowling’s lattices of a group [4], which for](https://img.pdfslide.us/doc/110x75/5c9d3a1b88c993ab348c5137/biased-graphs-i-bias-balance-and-gains-coreacuk-by-simdes-pereira.jpg)