Embed Size (px)
Citation preview
International Conference
The many dimensionsof poverty
Brasilia, Brazil – 29-31 August 2005Carlton Hotel
Conference paper
The
many dimensions of poverty
Multidimensional Poverty inthe Philippines: Trend, Patterns,and Determinants
Geoffrey M. DucanesUniversity of the Philippines, Diliman
Arsenio M. BalisacanUniversity of the Philippines, Diliman
Preliminary Draft
Multidimensional Poverty in the Philippines:
Trend, Patterns, and Determinants
Geoffrey M. Ducanes
and Arsenio M. Balisacan
Abstract This paper gives a brief survey of the literature on multidimensional poverty in the Philippines. Then using provincial-level indices, including the HDI and the HPI, shows that there is a geographic pattern in the levels of the welfare indicators across provinces. In particular northern provinces, especially in the vicinity of Metro Manila appear to dominate those in the southern provinces, particularly provinces in the Autonomous Region of Muslim Mindanao. Regression results show that geography, infrastructure, and political factors play a role in explaining variation in multidimensional poverty levels.
Paper prepared for presentation at the International Conference on Multidimensinal Poverty, International Poverty Centre, DFID-Brazil
and IBD/BID Carlton Hotel – Brasília, Brazil
29-31 August 2005 Arsenio M. Balisacan is Professor of Economics, University of the Philippines, and Director of the Southeast Asian Regional Center for Graduate Study and Research in Agriculture (SEARCA). Geoffrey M. Ducanes is Research Associate at the Asia-Pacific Policy Center, School of Economics, University of the Philippines-Diliman. For correspondence: [email protected]
1. Introduction
At least nominally, poverty in its multiple facets and not just
income poverty has been the stated concern of the Philippine
government since 1992. All the Medium Term Philippine
Development Plans (MTPDP) – a document presented by the
president at the beginning of his/her term in office that sets out
his/her government’s development goals as well as its poverty
reduction framework – from this period referred to human
development goals and not just income poverty targets.1
More recently, in the current administration’s flagship poverty
project, acronymed KALAHI-CIDSS, loosely translated as Arm-in-
Arm Against Poverty, the use of a composite index based on
income, food consumption, clothing, shelter, disaster vulnerability,
and citizen’s participation was utilized to come up with a ranking
that is used to pick the communities that will be covered by the
project. The project involves community funding support for the
likes of road, water, classroom, health and day care center projects.
Yet, despite its conceptual and practical importance, the literature
devoted to multidimensional poverty in the country lags, especially
compared to income poverty, although a growing literature is
increasingly becoming available (see for examples HDN 1994, 1997,
2000, 2002, Balisacan and Fujisaki 1999, Reyes 2003) ADB 2005.
Data constraint has bee one important reason for this. For
instance, whereas the main data source for income poverty studies
– the Family Income and Expenditures Survey (FIES) conducted by
the National Statistics Office – is conducted regularly at relatively
frequent intervals (every 3 years beginning 1985),2 many of what
are considered important non-income indicators of well-being such 1 The implementations of which have been criticized as weak and too politicized (ADB 2005). 2 The FIES, however, also contains some non-income indicators at the household level such as the type of housing, sanitation, and access to water, and education of the household head.
2
as literacy rates, mortality rates, life expectancy, and nutrition
status of children, access to health and education facilities are
obtained either at long intervals of time (in the case of information
from the full census which is conducted only every 10 years in the
country, although a partial one is conducted on the 5th year) or
irregularly such as in the case of the literacy surveys (held only
twice in the last 15 years) and the nutrition surveys (held thrice in
the last 15 years by two different agencies). Another important
reason is the many more complications that accompanies
multidimensional poverty studies as opposed to income poverty
studies, especially when a composite index is one of the end goals,
these includes the choice of dimensions to consider, the thresholds
to use (particularly for categorical indicators), the appropriate
weighting to be utilized, etc.
The Philippine Human Development Network’s Philippine
Human Development Report (PHDR) maybe considered the
pioneering work on multidimensional poverty in the country,
particularly in terms of capturing a broad spectrum of welfare
dimensions and arriving at a composite index at the sub-national
level. The Philippines is currently comprised of 79 provinces
grouped into 17 regions.3 The first PHDR themed ‘Human
Development and People’s Partcipation in Governance’ was
published in 1994. Following United Nation Developent
Programme’s methodology in the global Human Development
Reports, the 1994 PHDR came up with a regional human
development index (HDI)4, including of course its sub-indices on life
3 Currently, because every so often new provinces and regions are created from the division of old ones. In the mid-1980s there were only 13 regions in the country and 70 provinces. The regions, however, except for one – the Autonomous Region of Muslim Mindanao, are merely geographical groupings with no administrative or political relevance. On the other hand, a province is a political subdivision headed by a governor. 4 The HDI here is computed is an equal-weighted average of sub-indices on achievement in life expectancy, education (enrolment rate of primary and secondary school-age population and functional literacy – the latter replaced in more recent computations by the high school graduate ratio for lack of new data), and income. Note that this differs from the global HDR in its use of enrollment rates only for primary and secondary levels, the use of functional literacy instead of simple literacy, and in the
3
expectancy, education, and income. The second PHDR themed
‘Women and Gender in Development’, which came out in 1997,
extended the indicators included in the report by including also
regional indices on the HDI, the human poverty index (HPI)5, and
the gender-related HDI (GRDI)6. The third PHDR published in
2000, with the theme ‘Quality, Access, and Relevance in Basic
Education’, took it a step further by computing for a provincial HDI.
This localized human development indicator was deemed important
particularly in making local leaders and the people more
accountable for their performance (HDN 2000). In 2002, the fourth
PHDR with the theme ‘Work and Well-being’ was published. This
was a further extension, as the computation of provincial-level HPI
and GRDI was added to provincial HDI. A fifth PHDR, with a theme
on human security, is set to be launched later this year.
Other attempts to come up with sub-national multi-
dimensional poverty estimates for the country include the Social
Watch Philippines’ Quality of Life Index comprising of three
indicators, namely, under-5 nutrition rate, attended births, and
elementary cohort survival rate. Similar to the PHDR computed
indices, this index was also computed at the level of provinces. The
Minimum Basic Needs (MBN) Indicator System, developed by the
Philippine Institute for Development Studies and the University of
the Philippines School of Economics was another effort towards a
multidimensional view of poverty. The MBN Indicators System
more recent ones in the use of the high school graduate ratio. The reasons for these differences are both conceptual and practical: tertiary level was excluded in the enrolment rates as students there are more mobile and more likely to study in provinces other than their home possibly leading to misleading figures, especially considering there are only a few areas that maybe classified as centers of education in the country; functional literacy was preferred to simple literacy as it appears to be the more relevant concept for human development; and the high school graduate ratio was used because literacy rates ceased to be generated by government (HDN 2000). 5 The HPI is a weighted average of deprivations in 3 dimensions of human development as given by a long and healthy life (measured by probability at birth of not surviving to age 40), knowledge (measured by functional illiteracy), and a decent standard of living (as measured by the equally-weighted average of percent population not using improved water sources and percent of underweight children under five). 6 The GRDI is the HDI adjusted for inequality between the sexes, with a higher GRDI indicating a more equitable distribution of human development .
4
comprised of a set of 33 indicators covering a) survival needs, as
given by food and nutrition, health, water and sanitation, and
clothing, b) security needs, as given by shelter, public safety,
income and employment, and c) enabling needs, as given by basic
education and literacy, people’s participation, and family care, and
psychosocial needs (Constantino 1999). The Micro Impacts of
Macroeconomic Adjustment Policies (MIMAP) Indicator System is
similar to the MBN Indicator System but the indicators were pared
down to 16 instead of 33, covering health, nutrition, water and
sanitation, income, shelter, peace and order, basic education and
literacy, and community participation. However, in contrast to the
PHDR computed indices and the Quality of Life Index, the MBN and
MIMAP Indicators were not aggregated to a single composite index
other than in the simple case of counting the number of indicators a
community is deemed to have failed. Moreover, both the MBN
Indicators System and the MIMAP indicators system, unlike the HDI,
HPI, GRDI , and even the Quality of Life Index were never
generated in a consistent manner across regions and provinces but
were utilized mainly for small community monitoring. More
recently, a number of the indicators in the MBN were adopted in the
nationwide Annual Poverty Indicators Survey, began in 1998 and to
be conducted every year the FIES is not, thus enabling consistent
comparisons for these indicators across regions and provinces
Other multidimensional welfare studies in the country take the form
of Millenium Development Goals (MDG) studies, (see for examples
Monsod et al 2004, Manasan 2002, NEDA 2005). These studies
conclude that the country as a whole is on track to achieve some of
the goals such as on access to water, gender disparity in education,
under 5 mortality rate, the spread of diseases, and unlikely to
achieve others such as on underweight children, maternal mortality,
completion of primary education. Results on the income poverty
goal are ambiguous. On the other hand, and perhaps more
5
importantly, the studies also find that there is very wide disparity
across regions and provinces in terms of achieving these goals, and
that a pattern to these disparities exist such as that climate,
topography, and other spatial factors as well as a history of conflict
in the locality are highly correlated to levels of achievement
(Monsod et al 2004).
The rest of the paper is structured as follows. The next
section presents some stylized facts about the trend and patterns of
poverty in its different aspects in the Philippines based on existing
measures. The third section, via regression analysis, makes an
attempt to identify the determinants of the observed patterns of
disparity at the provincial level. The last section concludes.
2. Trend and Patterns
2.1. National
Based on the United Nation Development Programme’s
various Human Development Reports (HDR) the Philippines is a
country that is classified as poor in income but relatively better off
than most similarly situated countries in other non-income
indicators of welfare, particularly those pertaining to education.
The 2004 HDR, for instance, ranks the Philippines 83rd in terms of
the HDI, which puts it in the upper half of the medium human
development countries. A closer examination of the index’s
components reveals, however, that the per capita GDP of the
country is actually slightly lower (2%) than the average for medium
human development countries, its life expectancy only a bit higher
(4%), but its adult literacy rates and combined gross enrollment
ratio are very much higher (15% and 27%, respectively) thereby
driving its ranking upwards.
The same is true if one looks at the HPI, where the country is
ranked 28th among about 95 developing countries, again enabled
mainly by the country’s relatively lower education deprivation (adult
6
illiteracy) as well as lower proportion of people expected to die
before the age of 40. These are no small consolation for a country
whose culture places great value on education, while its economy
appears trapped in an endless cycle of boom and bust (De Dios
2000), although doubts have been cast on the validity and value of
even this ‘achievement’.7 Across time, the indicators for the
country are improving but lagging behind improvement in other
countries, as evidence by its deteriorating ranking in the HDI index,
from say 77th in the 1999 report to 83rd in the 2004 report.
2.2. Sub-national
The Philippines is an archipelago of about 7,100 islands
grouped, for political administration purposes into three island
groups subdivided into 17 regions, seventy-eight (79) provinces,
eighty-two (82) cities, 1525 municipalities and 41,939 villages or
“barangays”. The three island groups are Luzon, Visayas, and
Mindanao. Luzon is divided into 8 regions, Visayas into 3 regions,
and Mindanao into 6. In Luzon are Northern Luzon or “Ilocos”
(Region 1), the Cordillera Administrative Region (CAR) or the
“Cordilleras”, Cagayan Valley (Region 2), Central Luzon (Region 3),
CALABARZON (Region 4A), MIMAROPA (Region 4B), the Bicol
Peninsula (Region 5) and the National Capital Region (NCR), or
Metro Manila, the commercial and political center of the country. In
the Visayas are Western Visayas (Region 6), Central Visayas
(Region 7) and Eastern Visayas (Region 8). Mindanao hosts Western
Mindanao (Region 9), Northern Mindanao (Region 10), Southern
Mindanao (Region 11), Central Mindanao (Region 12), CARAGA
(Region 13), and the Autonomous Region of Muslim Mindanao or
ARMM.
The Philippines is one of the few countries in the region where
poverty, and especially human development statistics are generated
7 The Philippine Human Development Report 2000 is devoted in large part to analyzing the many things wrong with the country’s education system, particularly its quality.
7
at the level of provinces (or its equivalent in other countries)8. As
mentioned in the previous section, this is of more than academic
interest as these statistics are used as vital inputs in the allocation
of the budget. For instance, in the previously mentioned flagship
poverty project of the current administration (the KALAHI), the 20
provinces that made the cut-off eligibility for the project (at least
initially) were the poorest 20 provinces according to official income
poverty rankings. This was the subject of some criticism as
alternative poverty rankings, even that using income poverty also
(but using differently computed poverty lines, see Balisacan 2003),
yield a significantly different set of 20 provinces.
Table 1 presents Spearman rank correlations of 4 different
welfare indicators, the HDI, HPI, GRDI, and income poverty
incidence with provinces as the unit of analysis. The provincial
level indicators are in Appendix Tables 1 and 2. The only really high
correlation was between HDI and GRDI, which is of course to be
expected except in the extreme case of stark gender disparities
across provinces. On the other hand, the correlation between HDI
and HPI, two alternative multidimensional welfare rankings, is quite
low at only -0.53. The correlation between HPI and income poverty
is even lower at only 0.39. These tells us that the ranking across
different dimensions of poverty across provinces vary significantly.
Furthermore, from a policy viewpoint, these indicate that using
these different rankings for targeting purposes would yield different
sets of priority provinces. In fact, a simple experiment of counting
the intersecting bottom 20 provinces using the different indicators
shows that the HDI and HPI identify a common 12 provinces only,
the HDI and income poverty only 13 provinces, and the HPI and
income poverty only 9 provinces – less than half the total.
8 It must be noted that criticisms have been put forward on the reliability of the statistics at this level.
8
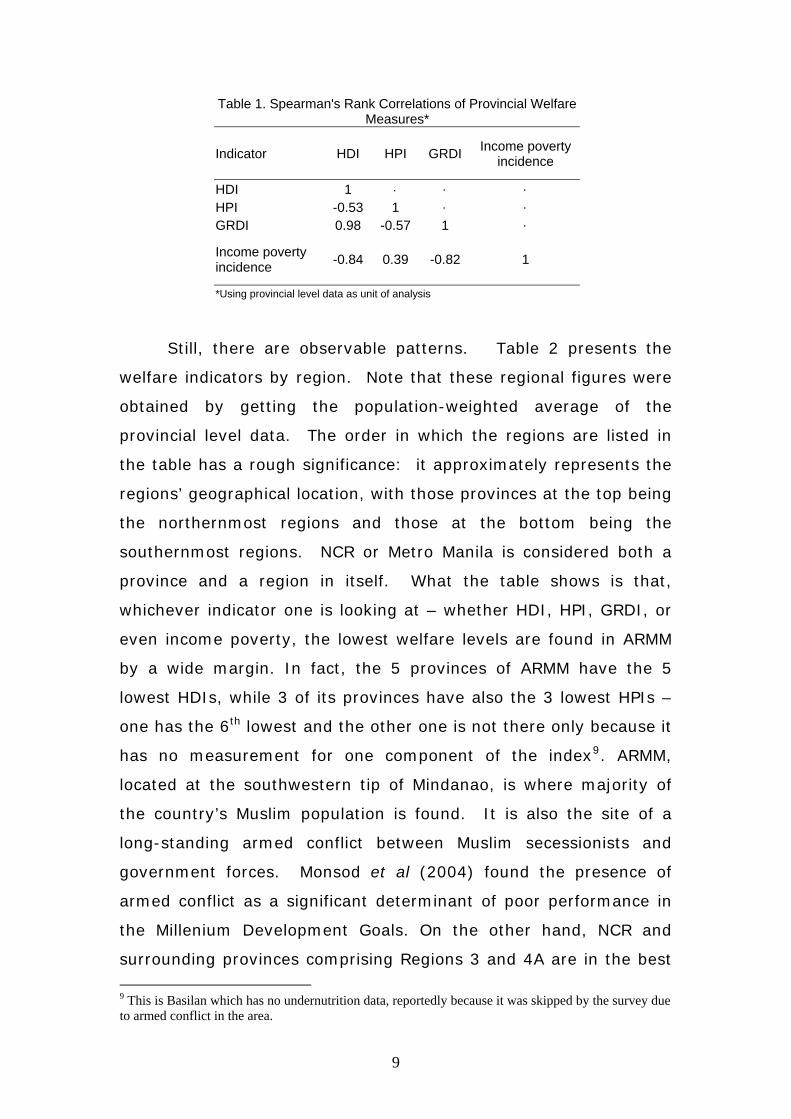
Table 1. Spearman's Rank Correlations of Provincial Welfare Measures*
Indicator HDI HPI GRDI Income poverty incidence
HDI 1 ⋅ ⋅ ⋅ HPI -0.53 1 ⋅ ⋅ GRDI 0.98 -0.57 1 ⋅
Income poverty incidence -0.84 0.39 -0.82 1
*Using provincial level data as unit of analysis
Still, there are observable patterns. Table 2 presents the
welfare indicators by region. Note that these regional figures were
obtained by getting the population-weighted average of the
provincial level data. The order in which the regions are listed in
the table has a rough significance: it approximately represents the
regions’ geographical location, with those provinces at the top being
the northernmost regions and those at the bottom being the
southernmost regions. NCR or Metro Manila is considered both a
province and a region in itself. What the table shows is that,
whichever indicator one is looking at – whether HDI, HPI, GRDI, or
even income poverty, the lowest welfare levels are found in ARMM
by a wide margin. In fact, the 5 provinces of ARMM have the 5
lowest HDIs, while 3 of its provinces have also the 3 lowest HPIs –
one has the 6th lowest and the other one is not there only because it
has no measurement for one component of the index9. ARMM,
located at the southwestern tip of Mindanao, is where majority of
the country’s Muslim population is found. It is also the site of a
long-standing armed conflict between Muslim secessionists and
government forces. Monsod et al (2004) found the presence of
armed conflict as a significant determinant of poor performance in
the Millenium Development Goals. On the other hand, NCR and
surrounding provinces comprising Regions 3 and 4A are in the best
9 This is Basilan which has no undernutrition data, reportedly because it was skipped by the survey due to armed conflict in the area.
9
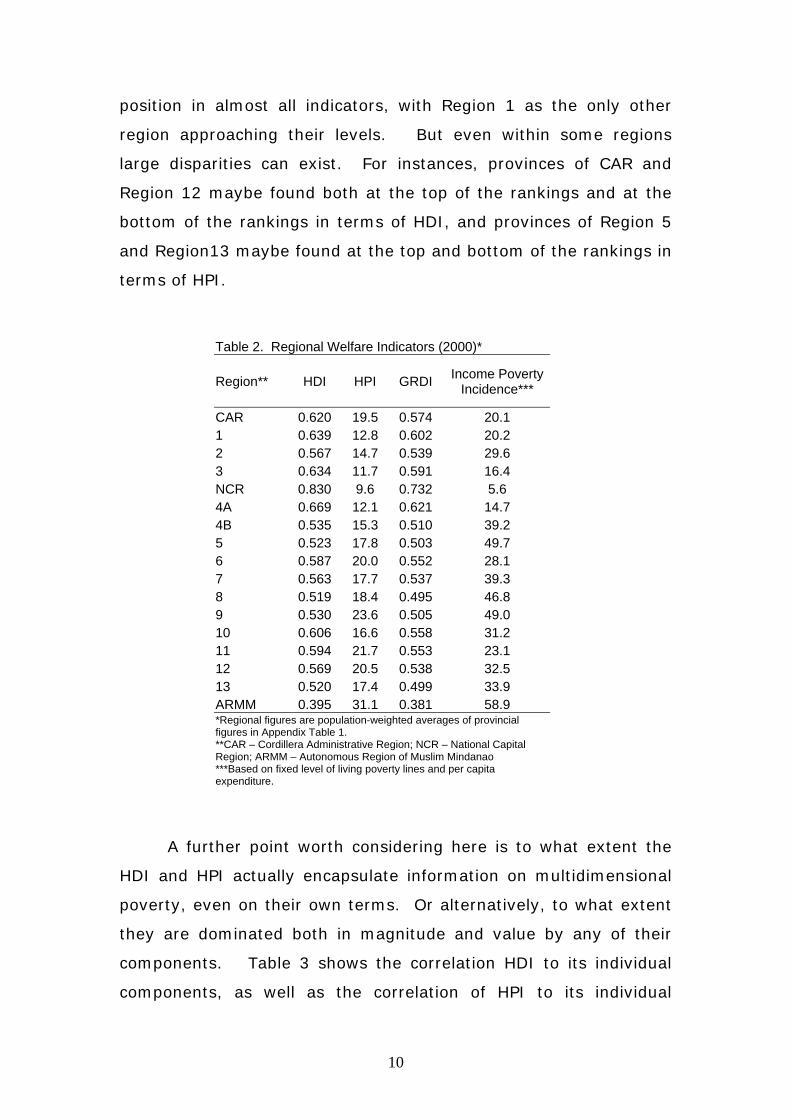
position in almost all indicators, with Region 1 as the only other
region approaching their levels. But even within some regions
large disparities can exist. For instances, provinces of CAR and
Region 12 maybe found both at the top of the rankings and at the
bottom of the rankings in terms of HDI, and provinces of Region 5
and Region13 maybe found at the top and bottom of the rankings in
terms of HPI.
Table 2. Regional Welfare Indicators (2000)*
Region** HDI HPI GRDI Income Poverty Incidence***
CAR 0.620 19.5 0.574 20.1 1 0.639 12.8 0.602 20.2 2 0.567 14.7 0.539 29.6 3 0.634 11.7 0.591 16.4 NCR 0.830 9.6 0.732 5.6 4A 0.669 12.1 0.621 14.7 4B 0.535 15.3 0.510 39.2 5 0.523 17.8 0.503 49.7 6 0.587 20.0 0.552 28.1 7 0.563 17.7 0.537 39.3 8 0.519 18.4 0.495 46.8 9 0.530 23.6 0.505 49.0 10 0.606 16.6 0.558 31.2 11 0.594 21.7 0.553 23.1 12 0.569 20.5 0.538 32.5 13 0.520 17.4 0.499 33.9 ARMM 0.395 31.1 0.381 58.9 *Regional figures are population-weighted averages of provincial figures in Appendix Table 1. **CAR – Cordillera Administrative Region; NCR – National Capital Region; ARMM – Autonomous Region of Muslim Mindanao ***Based on fixed level of living poverty lines and per capita expenditure.
A further point worth considering here is to what extent the
HDI and HPI actually encapsulate information on multidimensional
poverty, even on their own terms. Or alternatively, to what extent
they are dominated both in magnitude and value by any of their
components. Table 3 shows the correlation HDI to its individual
components, as well as the correlation of HPI to its individual
10
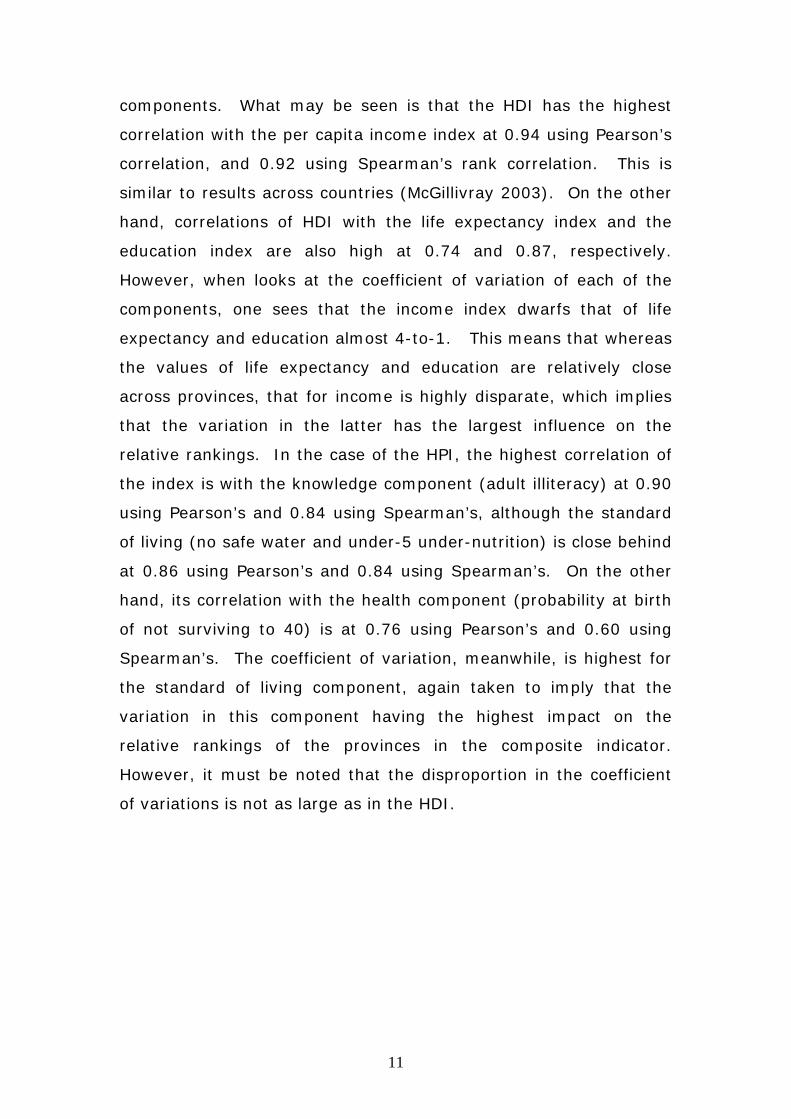
components. What may be seen is that the HDI has the highest
correlation with the per capita income index at 0.94 using Pearson’s
correlation, and 0.92 using Spearman’s rank correlation. This is
similar to results across countries (McGillivray 2003). On the other
hand, correlations of HDI with the life expectancy index and the
education index are also high at 0.74 and 0.87, respectively.
However, when looks at the coefficient of variation of each of the
components, one sees that the income index dwarfs that of life
expectancy and education almost 4-to-1. This means that whereas
the values of life expectancy and education are relatively close
across provinces, that for income is highly disparate, which implies
that the variation in the latter has the largest influence on the
relative rankings. In the case of the HPI, the highest correlation of
the index is with the knowledge component (adult illiteracy) at 0.90
using Pearson’s and 0.84 using Spearman’s, although the standard
of living (no safe water and under-5 under-nutrition) is close behind
at 0.86 using Pearson’s and 0.84 using Spearman’s. On the other
hand, its correlation with the health component (probability at birth
of not surviving to 40) is at 0.76 using Pearson’s and 0.60 using
Spearman’s. The coefficient of variation, meanwhile, is highest for
the standard of living component, again taken to imply that the
variation in this component having the highest impact on the
relative rankings of the provinces in the composite indicator.
However, it must be noted that the disproportion in the coefficient
of variations is not as large as in the HDI.
11
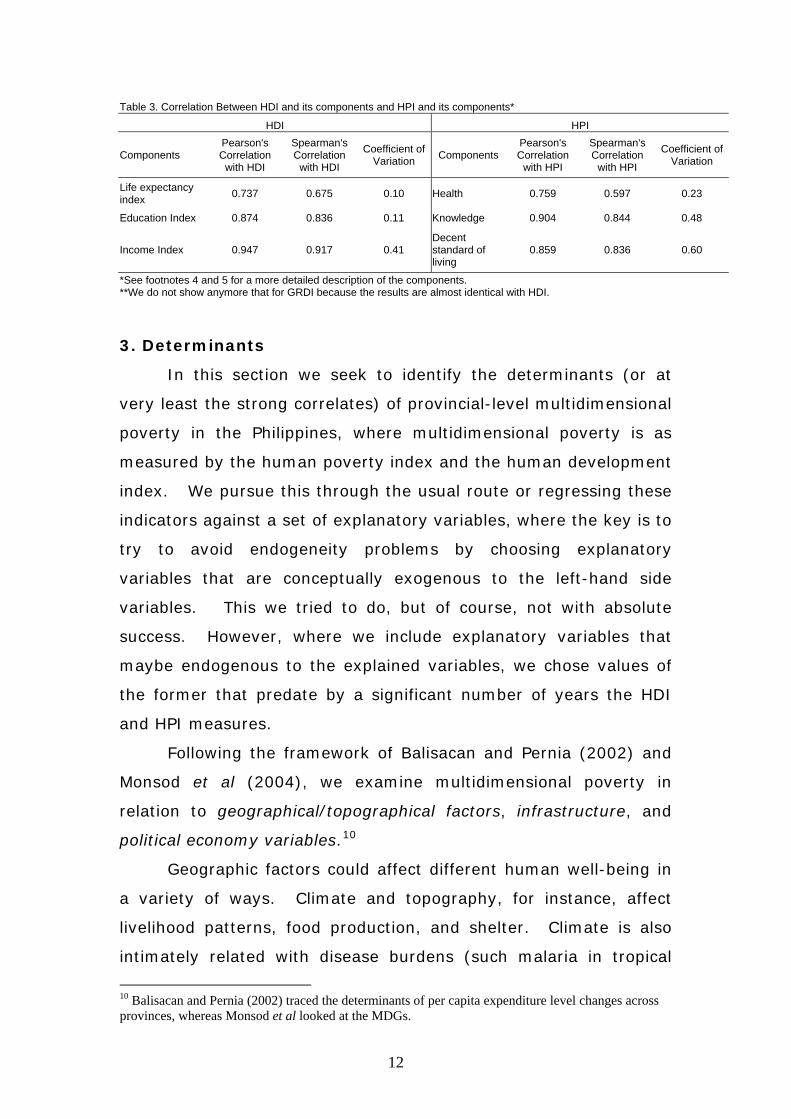
Table 3. Correlation Between HDI and its components and HPI and its components*
HDI HPI
Components Pearson's Correlation
with HDI
Spearman's Correlation
with HDI
Coefficient of Variation Components
Pearson's Correlation
with HPI
Spearman's Correlation
with HPI
Coefficient of Variation
Life expectancy index 0.737 0.675 0.10 Health 0.759 0.597 0.23
Education Index 0.874 0.836 0.11 Knowledge 0.904 0.844 0.48
Income Index 0.947 0.917 0.41 Decent standard of living
0.859 0.836 0.60
*See footnotes 4 and 5 for a more detailed description of the components. **We do not show anymore that for GRDI because the results are almost identical with HDI. 3. Determinants
In this section we seek to identify the determinants (or at
very least the strong correlates) of provincial-level multidimensional
poverty in the Philippines, where multidimensional poverty is as
measured by the human poverty index and the human development
index. We pursue this through the usual route or regressing these
indicators against a set of explanatory variables, where the key is to
try to avoid endogeneity problems by choosing explanatory
variables that are conceptually exogenous to the left-hand side
variables. This we tried to do, but of course, not with absolute
success. However, where we include explanatory variables that
maybe endogenous to the explained variables, we chose values of
the former that predate by a significant number of years the HDI
and HPI measures.
Following the framework of Balisacan and Pernia (2002) and
Monsod et al (2004), we examine multidimensional poverty in
relation to geographical/topographical factors, infrastructure, and
political economy variables.10
Geographic factors could affect different human well-being in
a variety of ways. Climate and topography, for instance, affect
livelihood patterns, food production, and shelter. Climate is also
intimately related with disease burdens (such malaria in tropical
10 Balisacan and Pernia (2002) traced the determinants of per capita expenditure level changes across provinces, whereas Monsod et al looked at the MDGs.
12
areas, meningitis in mountainous areas) and health. Difficult
terrain, as well as frequent inclement weather also makes children’s
access to school more grueling. One may thus expect that the more
severe the environment, the worse poverty is in its different aspects
in an area. In our regressions below, geography is represented by
dummies for climate type (4 types, see Appendix Table 3), as well
as dummies for whether a province is predominantly mountainous
or predominantly coastal.11
Infrastructure, meanwhile, facilitates trade and travel, raising
income levels. Infrastructure, say in the form of a good road
network also facilitates the construction of, and transport to, further
infrastructure such as markets, school buildings, and health centers.
One would thus expect that the better the infrastructure in an area,
the lower its multidimensional poverty. Here, infrastructure is
represented by road density and an indicator variable for the
presence of international ports in the province. In addition, the
population density, which is closely linked to the level of
urbanization in an area, is included as an additional proxy
infrastructure variable.
It is also easy to imagine that political factors would affect
well-being. Good governance, for instance, should lead to better
welfare for the constituents. On the other hand, the presence of
armed conflict in an area, insofar as it represents a direct threat to
life and health, impedes access to education and health facilities,
and represents a grave psychological burden, should be detrimental
to well-being. In our regressions, as measures of good governance,
we include a measure for the extent of local political dynasty and
also provincial per capita budget expenditure on education. To
represent conflict, we include a dummy for the presence communist
armed insurgence (CPP-NPA) in the area and also a dummy for the
11 See Appendix Table 3 for a complete list and description of the regression variables.
13
Autonomous Region of Muslim Mindanao, a historically contentious
region and the base of Muslim insurgents.
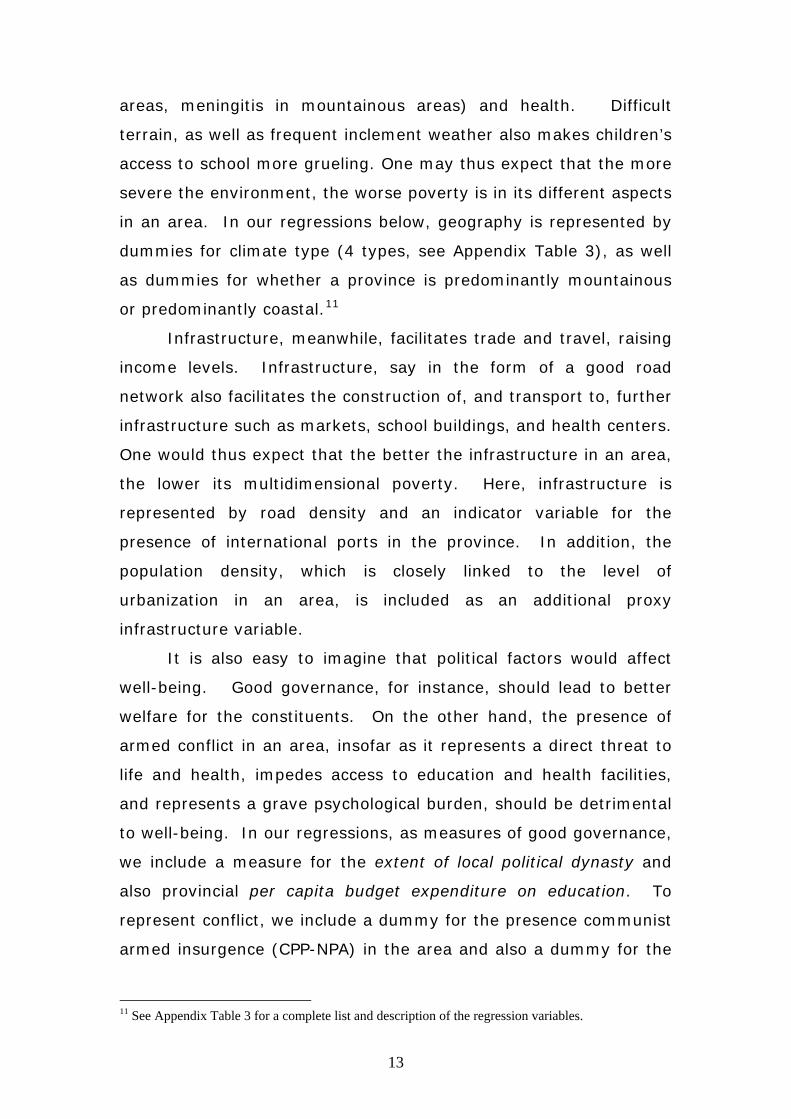
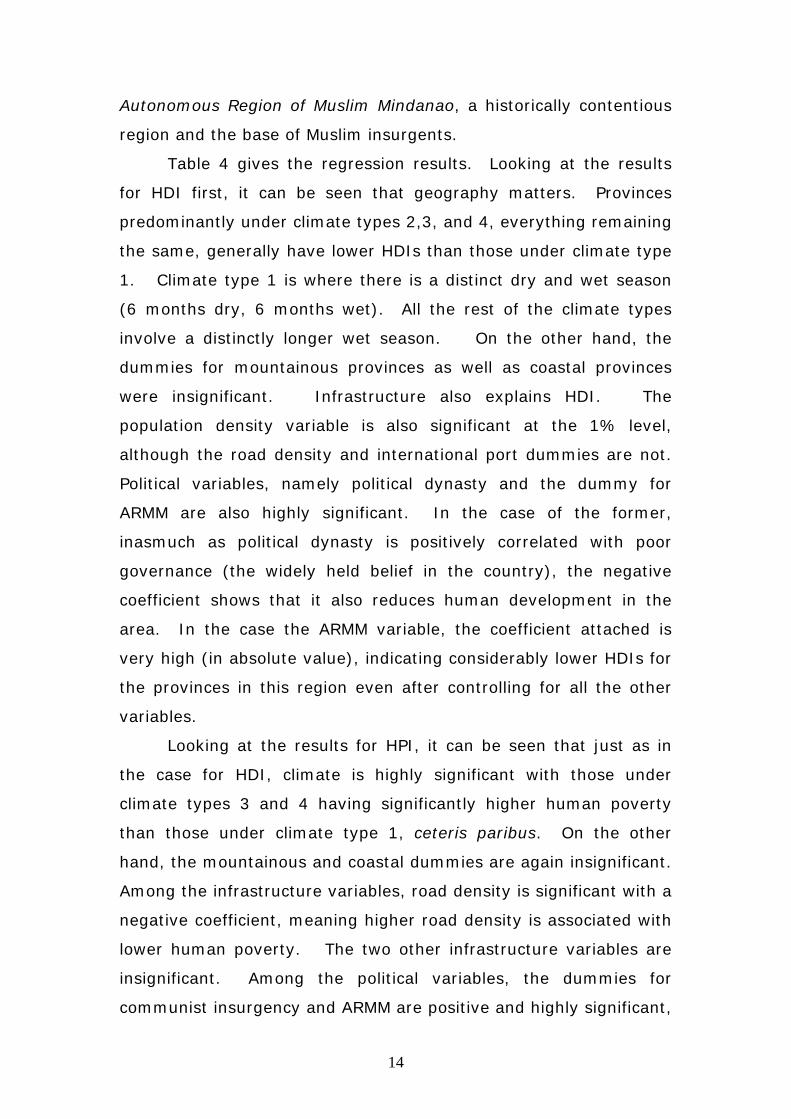
Table 4 gives the regression results. Looking at the results
for HDI first, it can be seen that geography matters. Provinces
predominantly under climate types 2,3, and 4, everything remaining
the same, generally have lower HDIs than those under climate type
1. Climate type 1 is where there is a distinct dry and wet season
(6 months dry, 6 months wet). All the rest of the climate types
involve a distinctly longer wet season. On the other hand, the
dummies for mountainous provinces as well as coastal provinces
were insignificant. Infrastructure also explains HDI. The
population density variable is also significant at the 1% level,
although the road density and international port dummies are not.
Political variables, namely political dynasty and the dummy for
ARMM are also highly significant. In the case of the former,
inasmuch as political dynasty is positively correlated with poor
governance (the widely held belief in the country), the negative
coefficient shows that it also reduces human development in the
area. In the case the ARMM variable, the coefficient attached is
very high (in absolute value), indicating considerably lower HDIs for
the provinces in this region even after controlling for all the other
variables.
Looking at the results for HPI, it can be seen that just as in
the case for HDI, climate is highly significant with those under
climate types 3 and 4 having significantly higher human poverty
than those under climate type 1, ceteris paribus. On the other
hand, the mountainous and coastal dummies are again insignificant.
Among the infrastructure variables, road density is significant with a
negative coefficient, meaning higher road density is associated with
lower human poverty. The two other infrastructure variables are
insignificant. Among the political variables, the dummies for
communist insurgency and ARMM are positive and highly significant,
14
and as these two variables indicate the presence of long-standing
(even if intermittently dormant) armed conflict, maybe taken to
mean that conflict leads to higher human poverty. On the other
hand, the dynasty and education expenditure variables are
insignificant.
Table 4. Regression Results HDI 2000 HPI 2000 Variable Coeff p-value Coeff p-value Climate type 2 -0.0771 0.00 *** 1.86 0.25 Climate type 3 -0.0478 0.01 *** 3.48 0.02 ** Climate type 4 -0.0654 0.00 *** 4.18 0.01 *** Mountainous 0.0052 0.80 0.58 0.59 Coastal 0.0104 0.56 1.35 0.45 International port 0.0095 0.69 0.20 0.86 Road density 1990 0.0178 0.54 -4.64 0.02 ** Population density 1990 0.0002 0.01 *** 0.00 0.44 Dynasty -0.0581 0.02 ** 1.04 0.65 Education expenditure per capita 0.0000 0.17 0.00 0.80 Communist insurgency -0.0195 0.16 2.44 0.06 * ARMM -0.1541 0.00 *** 18.57 0.00 *** Intercept 0.5499 0.00 16.32 0.00 No. of observations 72 72 R2 0.673 0.668 *significant at the 10% level **significant at the 5% level ***significant at the 1% level ****Regressions were done in Stata 8 using the robust method, which uses White’s adjusted standard error estimates. Diagnostic tests on multicollinearity, omitted variables, and normality of residuals were made and except in the case of the normality of residuals in the HDI regression, all were passed.
4. Summary and Conclusion
This paper has given a brief survey of the limited but growing
literature in the Philippines on multidimensional poverty. The
pioneering and most extensive work on this area in the country is
by the Philippine Human Development Network in coordination with
the United Nations Development Programme in the recurring
Philippine Human Development Reports (PHDR). The PHDR reports
HDI, HPI, GRDI and other welfare indicators in the country at the
15
provincial level. This is noteworthy as the government of the
Philippines uses poverty indicators as an input in its budget
allocation, particularly in its flagship poverty project.
If one measures multidimensional poverty by the HDI, GRDI,
and the HPI, then on the basis of these, one may conclude that
there is a geographical pattern in the multidimensional poverty in
the Philippines. Those in the southern provinces (although there
are significant exceptions), especially in the ARMM have lower
welfare levels than those in the northern provinces, particularly
compared to Metro Manila and surrounding provinces.
Looking at the indicators themselves, it was observed that the
correlation between HDI, HPI, and income poverty, while highly
significant, is not very high. This means that if one is concerned
with getting a broad picture of the different facets of poverty across
provinces, merely looking at income poverty will not suffice. From a
policy standpoint, for government targeting purposes, significantly
different sets of poorest provinces will be selected depending on the
poverty measure used, whether HDI, HPI, or income poverty. On
the other hand, it was also shown that the per capita income
component appears to dominate the relative rankings of the HDI,
while no such observation on any component can be made about
the HPI.
Regression results show the geography, infrastructure, and
political factors are strongly related to multidimensional welfare
levels. For policy, geographical features maybe made one basis for
targeting, although a closer study must be made to trace the exact
path/paths through which geographical factors are transmitted to
welfare levels, and then design interventions appropriately.
Infrastructure investment, good governance, and a quick and
peaceful resolution to the armed conflicts must all be pursued to
improve multidimensional welfare in the lagging provinces.
16
References:
Balisacan, Arsenio (2001). “Poverty in the Philippines: An Update
and Reexamination,” Philippine Review of Economics 38
(June): 15-52.
Balisacan, Arsenio and Ernesto Pernia (2002). “Probing Beneath
Cross-national Averages: Poverty, Inequality, and Growth in
the Philippines,” ERD Working Paper Series No. 7, Asian
Development Bank, Manila, Philippines.
Constantino, Winifrida (1999). “A Survey of Poverty-Related
Researches and Monitoring Systems in the Philippines,” paper
presented during the East Asia Partnership for Poverty
Reduction Network Meeting on 13 May 1999 in Kuala Lumpur,
Malaysia.
De Dios, Emmanuel (2000). “The Boom-Bust Cycle (Will It Ever
End?).” In: D. Canlas and H. Fujisaki (eds.), The Philippine
Economy: Alternatives for the 21st Century. Tokyo: Institute
of Developing Economies.
Manasan, Rosario (2002). “Philippines Country Study on Meeting
the Millennium Development Goals,” paper prepared for
International Conference on Financing for Development on
18-20 March 2002 in Monterey, Mexico.
McGillivray, Mark (2003). “Capturing non-Economic Dimensions of
Human Well-being,” paper presented at the WIDER
Conference on Inequality, Poverty, and Well-being on 30-31
May 2003 in Helsinki, Finland.
Monsod, Solita C., and T. C. Monsod (1999). “International and
Intranational
Comparisons of Philippine Poverty.“ In: A. M. Balisacan and S.
Fujisaki (eds.), Causes of Poverty : Myths, Facts & Policies.
Quezon City: University of the Philippines Press.
Monsod, Solita C., T.C. Monsod, and G. Ducanes (2004).
"Philippines' progress : towards the Millennium Development
17
Goals : geographical and political correlates of subnational
outcomes, "Journal of Human Development 5 (1): 121-149.
NEDA (2005). Second Philippines Progress Report on the Millenium
Development Goals. Pasig City.
Reyes, Celia M. (2003). The Poverty Fight: Has it Made an Impact.
Philippine Institute for Development Studies.
Social Watch (2004). Fear and Want Obstacles to Human Security:
Social Watch Annual Report 2004. Montevideo: Instituto del
Tercer Mundo.
United Nations Development Programme (2004). Human
Development Report: Cultural Diversity in Today’s Diverse
World. New York: Oxford University Press.
18
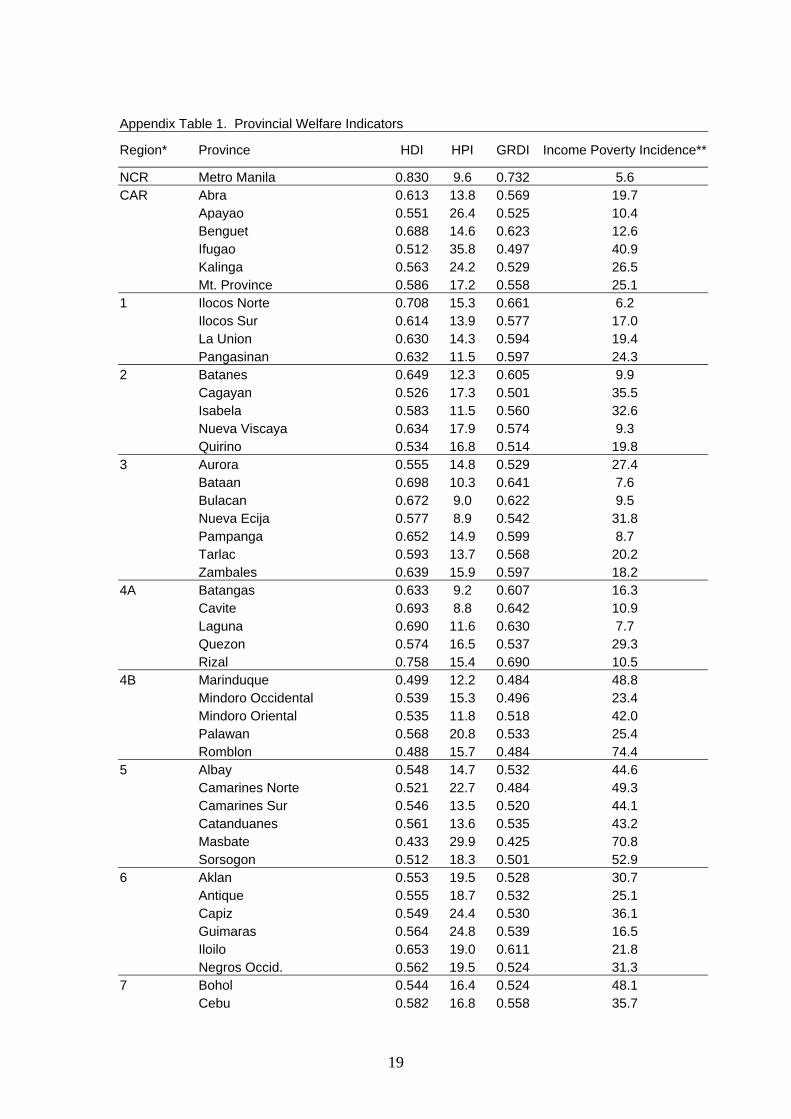
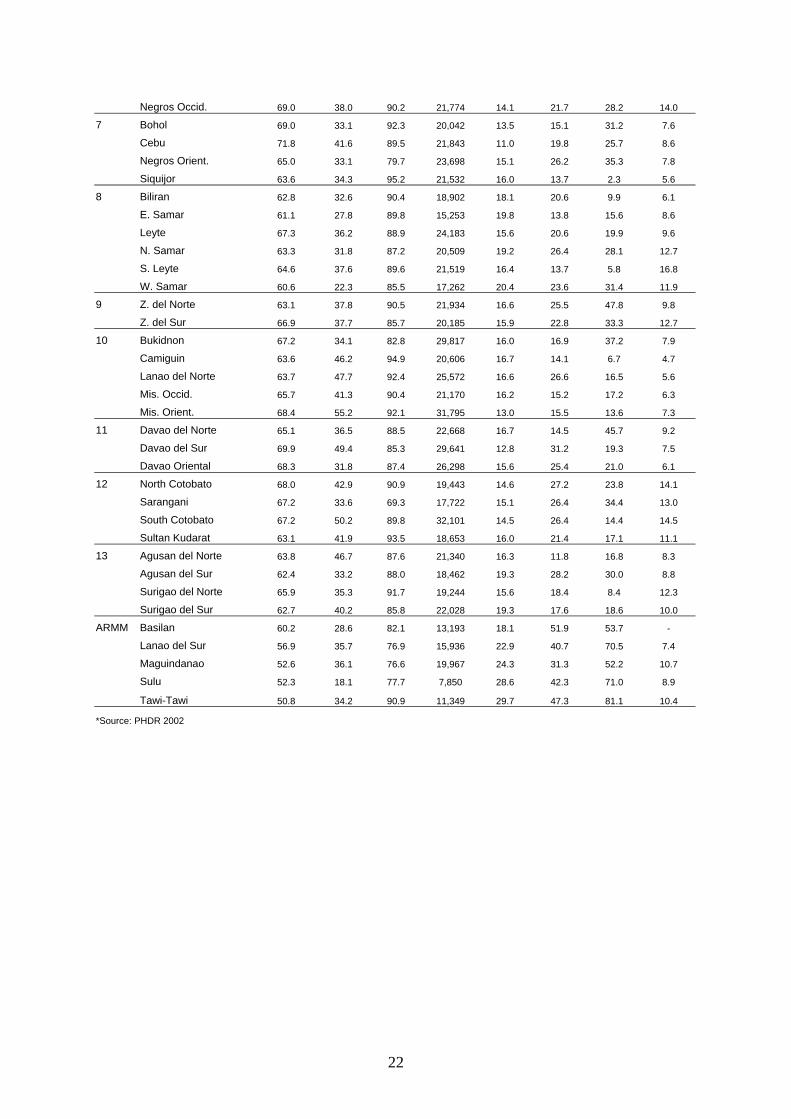
Appendix Table 1. Provincial Welfare Indicators
Region* Province HDI HPI GRDI Income Poverty Incidence**
NCR Metro Manila 0.830 9.6 0.732 5.6 CAR Abra 0.613 13.8 0.569 19.7 Apayao 0.551 26.4 0.525 10.4 Benguet 0.688 14.6 0.623 12.6 Ifugao 0.512 35.8 0.497 40.9 Kalinga 0.563 24.2 0.529 26.5 Mt. Province 0.586 17.2 0.558 25.1 1 Ilocos Norte 0.708 15.3 0.661 6.2 Ilocos Sur 0.614 13.9 0.577 17.0 La Union 0.630 14.3 0.594 19.4 Pangasinan 0.632 11.5 0.597 24.3 2 Batanes 0.649 12.3 0.605 9.9 Cagayan 0.526 17.3 0.501 35.5 Isabela 0.583 11.5 0.560 32.6 Nueva Viscaya 0.634 17.9 0.574 9.3 Quirino 0.534 16.8 0.514 19.8 3 Aurora 0.555 14.8 0.529 27.4 Bataan 0.698 10.3 0.641 7.6 Bulacan 0.672 9.0 0.622 9.5 Nueva Ecija 0.577 8.9 0.542 31.8 Pampanga 0.652 14.9 0.599 8.7 Tarlac 0.593 13.7 0.568 20.2 Zambales 0.639 15.9 0.597 18.2 4A Batangas 0.633 9.2 0.607 16.3 Cavite 0.693 8.8 0.642 10.9 Laguna 0.690 11.6 0.630 7.7 Quezon 0.574 16.5 0.537 29.3 Rizal 0.758 15.4 0.690 10.5 4B Marinduque 0.499 12.2 0.484 48.8 Mindoro Occidental 0.539 15.3 0.496 23.4 Mindoro Oriental 0.535 11.8 0.518 42.0 Palawan 0.568 20.8 0.533 25.4 Romblon 0.488 15.7 0.484 74.4 5 Albay 0.548 14.7 0.532 44.6 Camarines Norte 0.521 22.7 0.484 49.3 Camarines Sur 0.546 13.5 0.520 44.1 Catanduanes 0.561 13.6 0.535 43.2 Masbate 0.433 29.9 0.425 70.8 Sorsogon 0.512 18.3 0.501 52.9 6 Aklan 0.553 19.5 0.528 30.7 Antique 0.555 18.7 0.532 25.1 Capiz 0.549 24.4 0.530 36.1 Guimaras 0.564 24.8 0.539 16.5 Iloilo 0.653 19.0 0.611 21.8 Negros Occid. 0.562 19.5 0.524 31.3 7 Bohol 0.544 16.4 0.524 48.1 Cebu 0.582 16.8 0.558 35.7
19
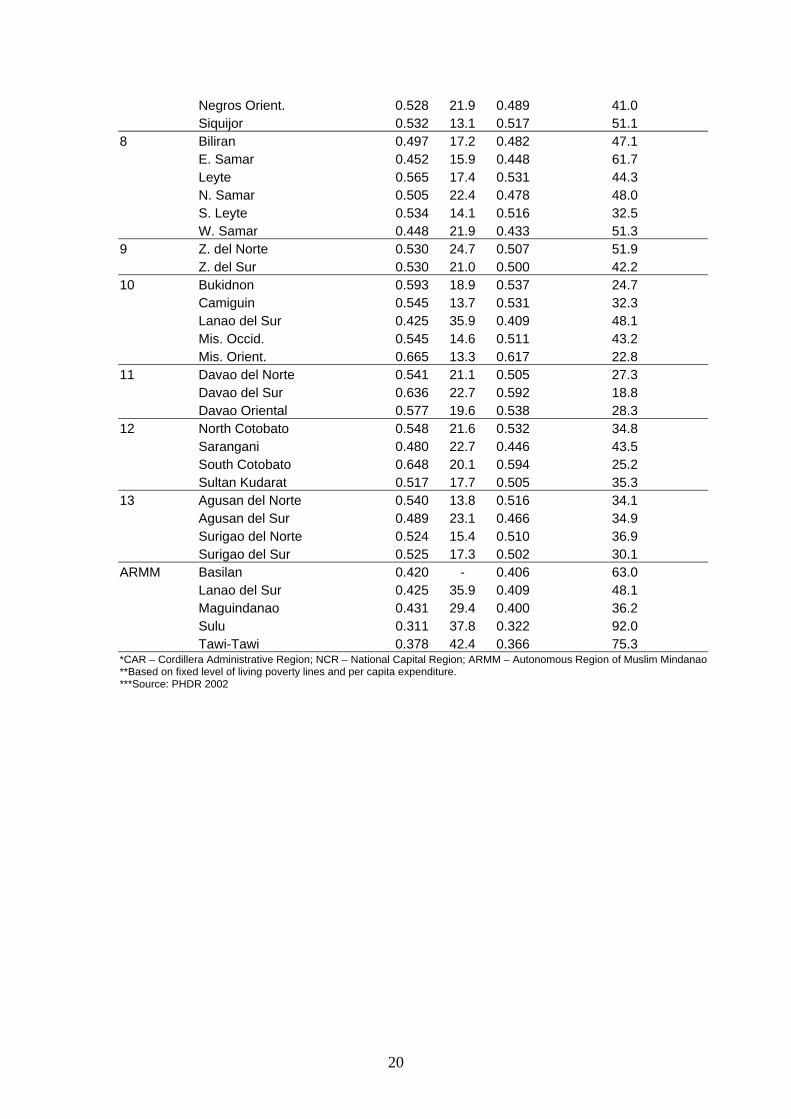
Negros Orient. 0.528 21.9 0.489 41.0 Siquijor 0.532 13.1 0.517 51.1 8 Biliran 0.497 17.2 0.482 47.1 E. Samar 0.452 15.9 0.448 61.7 Leyte 0.565 17.4 0.531 44.3 N. Samar 0.505 22.4 0.478 48.0 S. Leyte 0.534 14.1 0.516 32.5 W. Samar 0.448 21.9 0.433 51.3 9 Z. del Norte 0.530 24.7 0.507 51.9 Z. del Sur 0.530 21.0 0.500 42.2 10 Bukidnon 0.593 18.9 0.537 24.7 Camiguin 0.545 13.7 0.531 32.3 Lanao del Sur 0.425 35.9 0.409 48.1 Mis. Occid. 0.545 14.6 0.511 43.2 Mis. Orient. 0.665 13.3 0.617 22.8 11 Davao del Norte 0.541 21.1 0.505 27.3 Davao del Sur 0.636 22.7 0.592 18.8 Davao Oriental 0.577 19.6 0.538 28.3 12 North Cotobato 0.548 21.6 0.532 34.8 Sarangani 0.480 22.7 0.446 43.5 South Cotobato 0.648 20.1 0.594 25.2 Sultan Kudarat 0.517 17.7 0.505 35.3 13 Agusan del Norte 0.540 13.8 0.516 34.1 Agusan del Sur 0.489 23.1 0.466 34.9 Surigao del Norte 0.524 15.4 0.510 36.9 Surigao del Sur 0.525 17.3 0.502 30.1 ARMM Basilan 0.420 - 0.406 63.0 Lanao del Sur 0.425 35.9 0.409 48.1 Maguindanao 0.431 29.4 0.400 36.2 Sulu 0.311 37.8 0.322 92.0 Tawi-Tawi 0.378 42.4 0.366 75.3 *CAR – Cordillera Administrative Region; NCR – National Capital Region; ARMM – Autonomous Region of Muslim Mindanao**Based on fixed level of living poverty lines and per capita expenditure. ***Source: PHDR 2002
20
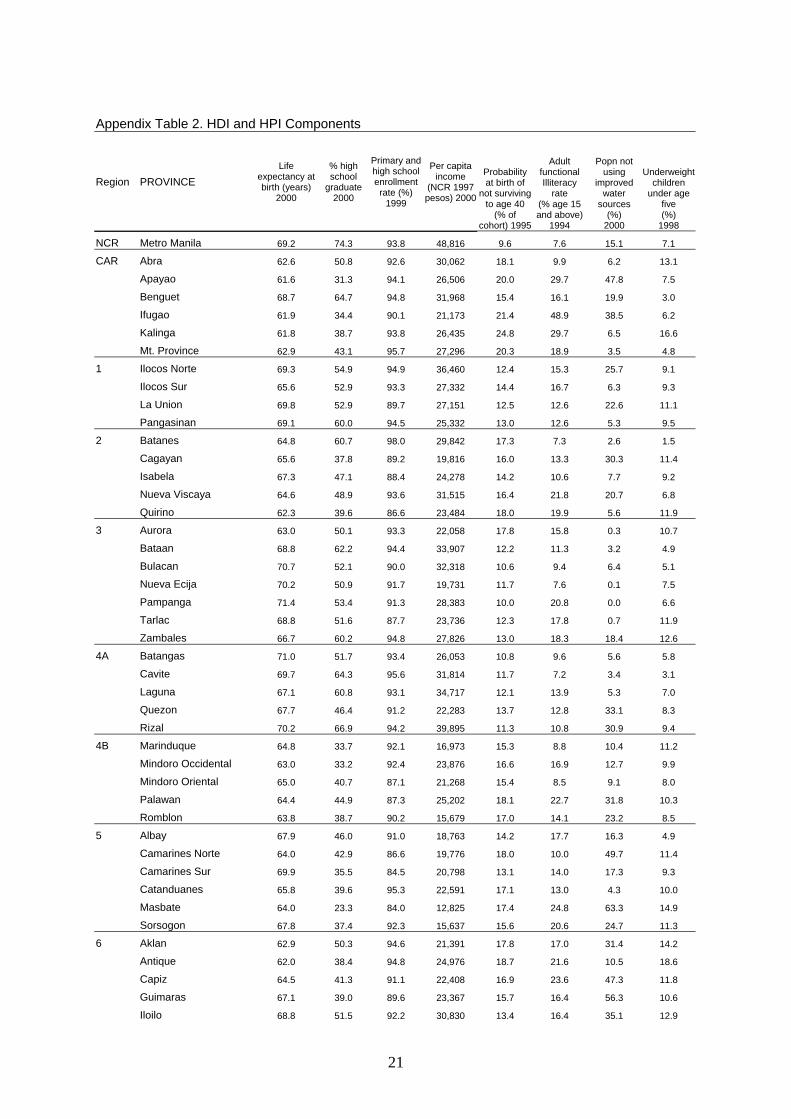
Appendix Table 2. HDI and HPI Components
Region PROVINCE Life
expectancy at birth (years)
2000
% high school
graduate 2000
Primary and high school enrollment rate (%)
1999
Per capita income
(NCR 1997 pesos) 2000
Probability at birth of
not surviving to age 40
(% of cohort) 1995
Adult functional Illiteracy
rate (% age 15 and above)
1994
Popn not using
improved water
sources (%)
2000
Underweight children
under age five (%)
1998
NCR Metro Manila 69.2 74.3 93.8 48,816 9.6 7.6 15.1 7.1
CAR Abra 62.6 50.8 92.6 30,062 18.1 9.9 6.2 13.1
Apayao 61.6 31.3 94.1 26,506 20.0 29.7 47.8 7.5
Benguet 68.7 64.7 94.8 31,968 15.4 16.1 19.9 3.0
Ifugao 61.9 34.4 90.1 21,173 21.4 48.9 38.5 6.2
Kalinga 61.8 38.7 93.8 26,435 24.8 29.7 6.5 16.6
Mt. Province 62.9 43.1 95.7 27,296 20.3 18.9 3.5 4.8
1 Ilocos Norte 69.3 54.9 94.9 36,460 12.4 15.3 25.7 9.1
Ilocos Sur 65.6 52.9 93.3 27,332 14.4 16.7 6.3 9.3
La Union 69.8 52.9 89.7 27,151 12.5 12.6 22.6 11.1
Pangasinan 69.1 60.0 94.5 25,332 13.0 12.6 5.3 9.5
2 Batanes 64.8 60.7 98.0 29,842 17.3 7.3 2.6 1.5
Cagayan 65.6 37.8 89.2 19,816 16.0 13.3 30.3 11.4
Isabela 67.3 47.1 88.4 24,278 14.2 10.6 7.7 9.2
Nueva Viscaya 64.6 48.9 93.6 31,515 16.4 21.8 20.7 6.8
Quirino 62.3 39.6 86.6 23,484 18.0 19.9 5.6 11.9
3 Aurora 63.0 50.1 93.3 22,058 17.8 15.8 0.3 10.7
Bataan 68.8 62.2 94.4 33,907 12.2 11.3 3.2 4.9
Bulacan 70.7 52.1 90.0 32,318 10.6 9.4 6.4 5.1
Nueva Ecija 70.2 50.9 91.7 19,731 11.7 7.6 0.1 7.5
Pampanga 71.4 53.4 91.3 28,383 10.0 20.8 0.0 6.6
Tarlac 68.8 51.6 87.7 23,736 12.3 17.8 0.7 11.9
Zambales 66.7 60.2 94.8 27,826 13.0 18.3 18.4 12.6
4A Batangas 71.0 51.7 93.4 26,053 10.8 9.6 5.6 5.8
Cavite 69.7 64.3 95.6 31,814 11.7 7.2 3.4 3.1
Laguna 67.1 60.8 93.1 34,717 12.1 13.9 5.3 7.0
Quezon 67.7 46.4 91.2 22,283 13.7 12.8 33.1 8.3
Rizal 70.2 66.9 94.2 39,895 11.3 10.8 30.9 9.4
4B Marinduque 64.8 33.7 92.1 16,973 15.3 8.8 10.4 11.2
Mindoro Occidental 63.0 33.2 92.4 23,876 16.6 16.9 12.7 9.9
Mindoro Oriental 65.0 40.7 87.1 21,268 15.4 8.5 9.1 8.0
Palawan 64.4 44.9 87.3 25,202 18.1 22.7 31.8 10.3
Romblon 63.8 38.7 90.2 15,679 17.0 14.1 23.2 8.5
5 Albay 67.9 46.0 91.0 18,763 14.2 17.7 16.3 4.9
Camarines Norte 64.0 42.9 86.6 19,776 18.0 10.0 49.7 11.4
Camarines Sur 69.9 35.5 84.5 20,798 13.1 14.0 17.3 9.3
Catanduanes 65.8 39.6 95.3 22,591 17.1 13.0 4.3 10.0
Masbate 64.0 23.3 84.0 12,825 17.4 24.8 63.3 14.9
Sorsogon 67.8 37.4 92.3 15,637 15.6 20.6 24.7 11.3
6 Aklan 62.9 50.3 94.6 21,391 17.8 17.0 31.4 14.2
Antique 62.0 38.4 94.8 24,976 18.7 21.6 10.5 18.6
Capiz 64.5 41.3 91.1 22,408 16.9 23.6 47.3 11.8
Guimaras 67.1 39.0 89.6 23,367 15.7 16.4 56.3 10.6
Iloilo 68.8 51.5 92.2 30,830 13.4 16.4 35.1 12.9
21
Negros Occid. 69.0 38.0 90.2 21,774 14.1 21.7 28.2 14.0
7 Bohol 69.0 33.1 92.3 20,042 13.5 15.1 31.2 7.6
Cebu 71.8 41.6 89.5 21,843 11.0 19.8 25.7 8.6
Negros Orient. 65.0 33.1 79.7 23,698 15.1 26.2 35.3 7.8
Siquijor 63.6 34.3 95.2 21,532 16.0 13.7 2.3 5.6
8 Biliran 62.8 32.6 90.4 18,902 18.1 20.6 9.9 6.1
E. Samar 61.1 27.8 89.8 15,253 19.8 13.8 15.6 8.6
Leyte 67.3 36.2 88.9 24,183 15.6 20.6 19.9 9.6
N. Samar 63.3 31.8 87.2 20,509 19.2 26.4 28.1 12.7
S. Leyte 64.6 37.6 89.6 21,519 16.4 13.7 5.8 16.8
W. Samar 60.6 22.3 85.5 17,262 20.4 23.6 31.4 11.9
9 Z. del Norte 63.1 37.8 90.5 21,934 16.6 25.5 47.8 9.8
Z. del Sur 66.9 37.7 85.7 20,185 15.9 22.8 33.3 12.7
10 Bukidnon 67.2 34.1 82.8 29,817 16.0 16.9 37.2 7.9
Camiguin 63.6 46.2 94.9 20,606 16.7 14.1 6.7 4.7
Lanao del Norte 63.7 47.7 92.4 25,572 16.6 26.6 16.5 5.6
Mis. Occid. 65.7 41.3 90.4 21,170 16.2 15.2 17.2 6.3
Mis. Orient. 68.4 55.2 92.1 31,795 13.0 15.5 13.6 7.3
11 Davao del Norte 65.1 36.5 88.5 22,668 16.7 14.5 45.7 9.2
Davao del Sur 69.9 49.4 85.3 29,641 12.8 31.2 19.3 7.5
Davao Oriental 68.3 31.8 87.4 26,298 15.6 25.4 21.0 6.1
12 North Cotobato 68.0 42.9 90.9 19,443 14.6 27.2 23.8 14.1
Sarangani 67.2 33.6 69.3 17,722 15.1 26.4 34.4 13.0
South Cotobato 67.2 50.2 89.8 32,101 14.5 26.4 14.4 14.5
Sultan Kudarat 63.1 41.9 93.5 18,653 16.0 21.4 17.1 11.1
13 Agusan del Norte 63.8 46.7 87.6 21,340 16.3 11.8 16.8 8.3
Agusan del Sur 62.4 33.2 88.0 18,462 19.3 28.2 30.0 8.8
Surigao del Norte 65.9 35.3 91.7 19,244 15.6 18.4 8.4 12.3
Surigao del Sur 62.7 40.2 85.8 22,028 19.3 17.6 18.6 10.0
ARMM Basilan 60.2 28.6 82.1 13,193 18.1 51.9 53.7 -
Lanao del Sur 56.9 35.7 76.9 15,936 22.9 40.7 70.5 7.4
Maguindanao 52.6 36.1 76.6 19,967 24.3 31.3 52.2 10.7
Sulu 52.3 18.1 77.7 7,850 28.6 42.3 71.0 8.9
Tawi-Tawi 50.8 34.2 90.9 11,349 29.7 47.3 81.1 10.4
*Source: PHDR 2002
22
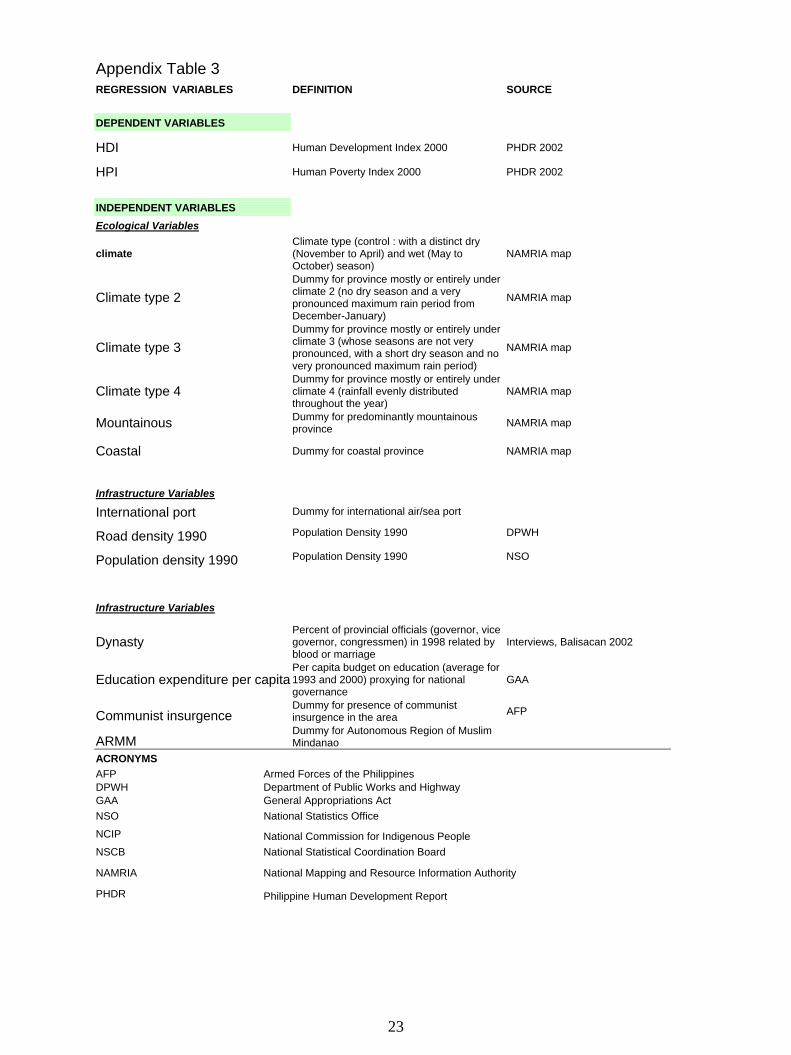
Appendix Table 3 REGRESSION VARIABLES DEFINITION SOURCE DEPENDENT VARIABLES
HDI Human Development Index 2000 PHDR 2002
HPI Human Poverty Index 2000 PHDR 2002
INDEPENDENT VARIABLES
Ecological Variables
climate Climate type (control : with a distinct dry (November to April) and wet (May to October) season)
NAMRIA map
Climate type 2 Dummy for province mostly or entirely under climate 2 (no dry season and a very pronounced maximum rain period from December-January)
NAMRIA map
Climate type 3 Dummy for province mostly or entirely under climate 3 (whose seasons are not very pronounced, with a short dry season and no very pronounced maximum rain period)
NAMRIA map
Climate type 4 Dummy for province mostly or entirely under climate 4 (rainfall evenly distributed throughout the year)
NAMRIA map
Mountainous Dummy for predominantly mountainous province NAMRIA map
Coastal Dummy for coastal province NAMRIA map
Infrastructure Variables
International port Dummy for international air/sea port
Road density 1990 Population Density 1990 DPWH
Population density 1990 Population Density 1990 NSO
Infrastructure Variables
Dynasty Percent of provincial officials (governor, vice governor, congressmen) in 1998 related by blood or marriage
Interviews, Balisacan 2002
Education expenditure per capita Per capita budget on education (average for 1993 and 2000) proxying for national governance
GAA
Communist insurgence Dummy for presence of communist insurgence in the area AFP
ARMM Dummy for Autonomous Region of Muslim Mindanao
ACRONYMS AFP Armed Forces of the Philippines DPWH Department of Public Works and Highway GAA General Appropriations Act NSO National Statistics Office NCIP National Commission for Indigenous People NSCB National Statistical Coordination Board
NAMRIA National Mapping and Resource Information Authority PHDR Philippine Human Development Report
23
International Poverty CentreSBS – Ed. BNDES, 10º andar70076-900 Brasilia DFBrazil
[email protected]/povertycentreTelephone +55 61 2105 5000