Embed Size (px)
Citation preview
International Conference for Millennium Development Goals
Statistics1-3 October 2007, Manila
Achieving the Cambodia’s Millennium Development Goals 2005 update
National Institute of Statistics,
Ministry of Planning, Cambodia
Contents
• Introduction
• CMDGs
• Cambodia Millennium Development Goals
• Data gap
• Challenge in general statistical activities
Introduction
• Provides an update of Cambodia progress toward meeting the Cambodia Millennium Development Goals (CMDG)
• Compares current achievements with target for 2005 using indicators for which recent data is available
• Royal Government of Cambodia have developed National Strategic Development Plan (NSDP) and National Poverty Reduction Strategy (NPRS)
• NSDP will be integrated with the CMDGs and will be firmly rooted in the Rectangular Strategy for Growth
Cambodia Millennium Development Goals (CMDGs)
• CMDGs are 9 goals, 25 overall target and 106 specific targets converting:
• i Extreme Poverty and hunger• ii Universal nine-year basic education• iii Gender equality and women’s empowerment;• iv Child mortality;• v Maternal health• vi HIV/AIDS, malaria and other diseases• vii Environmental sustainability;• viii Global partnership for development; and • ix De-mining, unexploded ordnance and victim
assistance
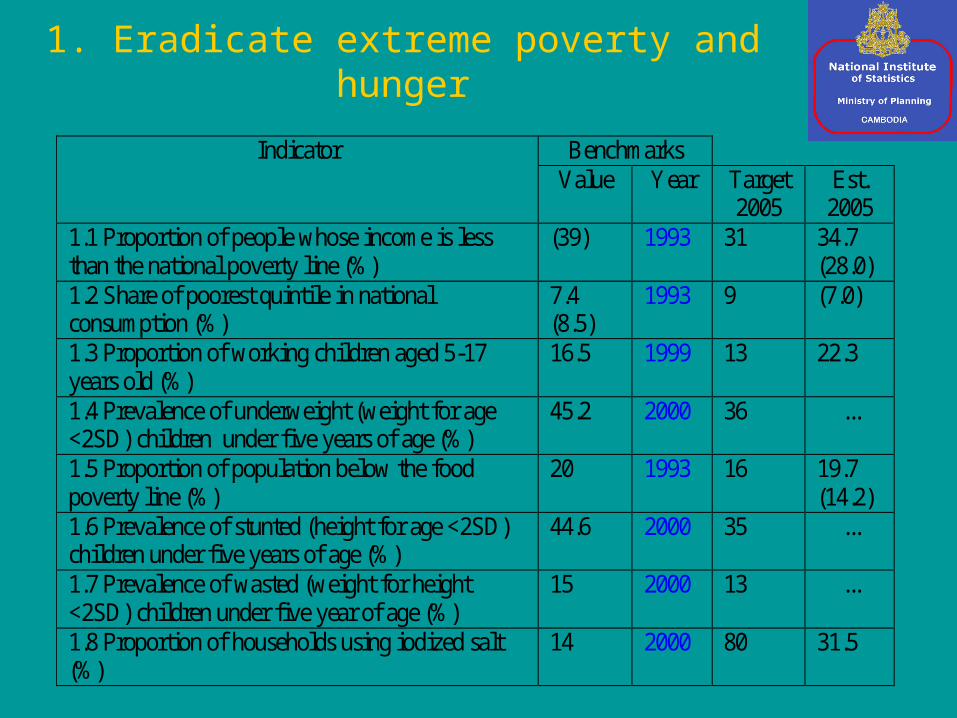
1. Eradicate extreme poverty and hunger
Benchmarks Indicator Value Year Target
2005 Est. 2005
1.1 Proportion of people whose income is less than the national poverty line (%)
(39) 1993 31 34.7 (28.0)
1.2 Share of poorest quintile in national consumption (%)
7.4 (8.5)
1993 9 (7.0)
1.3 Proportion of working children aged 5-17 years old (%)
16.5 1999 13 22.3
1.4 Prevalence of underweight (weight for age <2SD) children under five years of age (%)
45.2 2000 36 ...
1.5 Proportion of population below the food poverty line (%)
20 1993 16 19.7 (14.2)
1.6 Prevalence of stunted (height for age <2SD) children under five years of age (%)
44.6 2000 35 ...
1.7 Prevalence of wasted (weight for height <2SD) children under five year of age (%)
15 2000 13 ...
1.8 Proportion of households using iodized salt (%)
14 2000 80 31.5
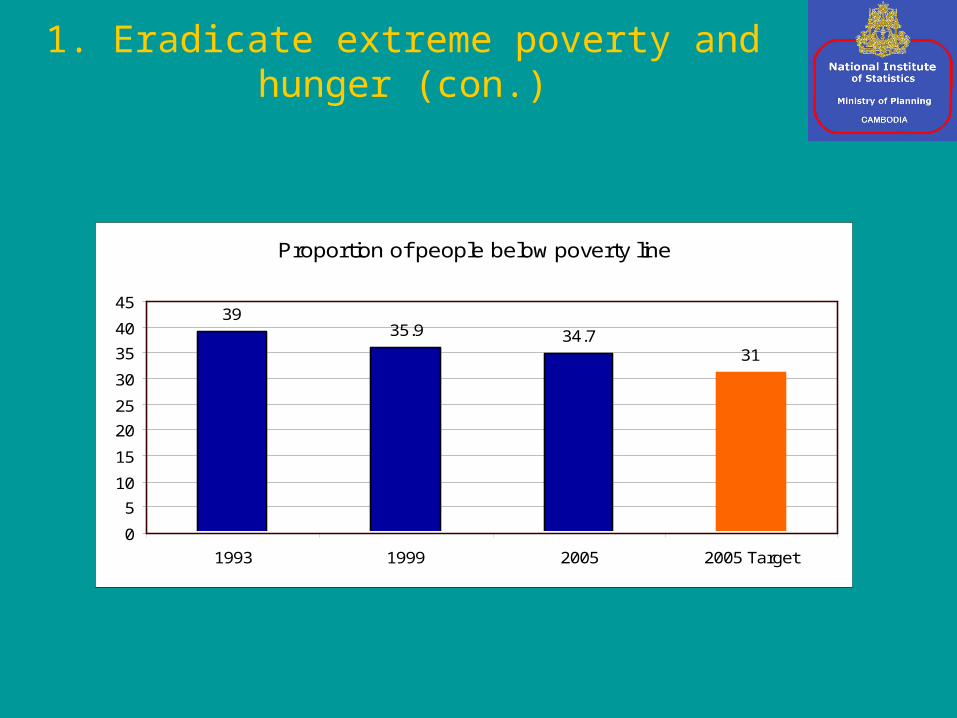
1. Eradicate extreme poverty and hunger (con.)
Proportion of people below poverty line
3935.9 34.7
31
0
5
10
15
20
25
30
35
40
45
1993 1999 2005 2005 Target
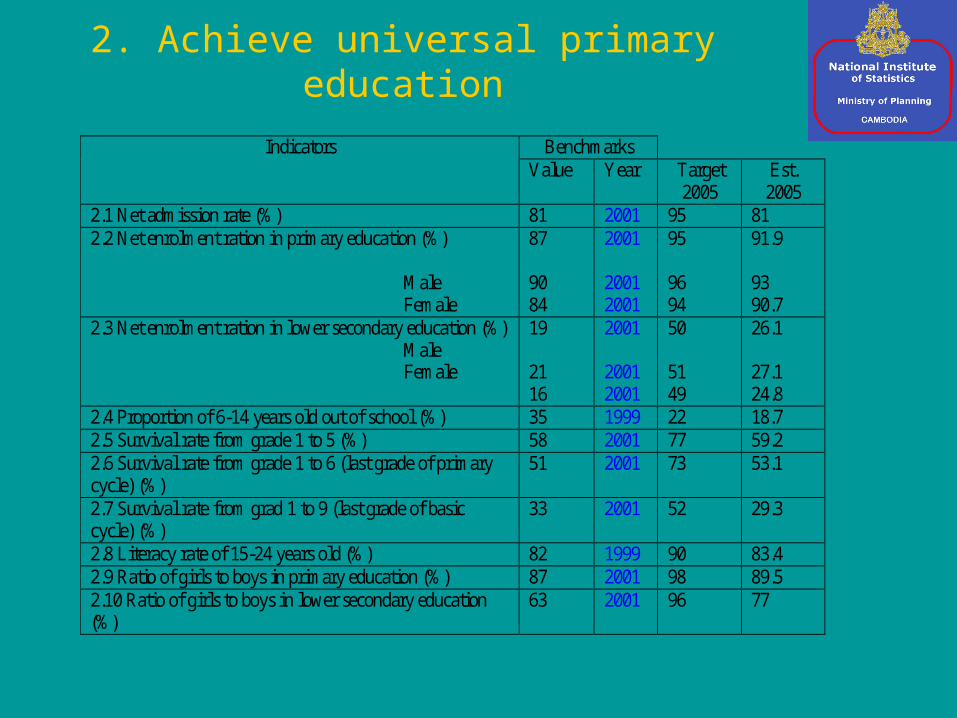
2. Achieve universal primary education
Benchmarks Indicators Value Year Target
2005 Est. 2005
2.1 Net admission rate (%) 81 2001 95 81 2.2 Net enrolment ration in primary education (%) Male Female
87 90 84
2001 2001 2001
95 96 94
91.9 93 90.7
2.3 Net enrolment ration in lower secondary education (%) Male Female
19 21 16
2001 2001 2001
50 51 49
26.1 27.1 24.8
2.4 Proportion of 6-14 years old out of school (%) 35 1999 22 18.7 2.5 Survival rate from grade 1 to 5 (%) 58 2001 77 59.2 2.6 Survival rate from grade 1 to 6 (last grade of primary cycle) (%)
51 2001 73 53.1
2.7 Survival rate from grad 1 to 9 (last grade of basic cycle) (%)
33 2001 52 29.3
2.8 Literacy rate of 15-24 years old (%) 82 1999 90 83.4 2.9 Ratio of girls to boys in primary education (%) 87 2001 98 89.5 2.10 Ratio of girls to boys in lower secondary education (%)
63 2001 96 77
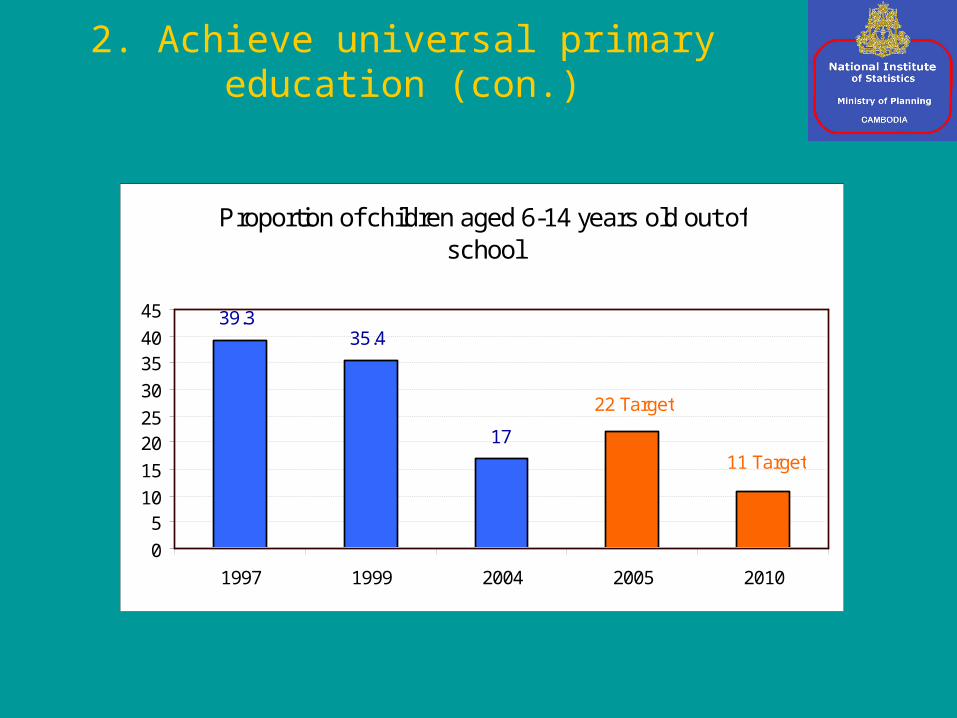
Proportion of children aged 6-14 years old out of school
39.335.4
17
22 Target
11 Target
0
510
15
2025
30
3540
45
1997 1999 2004 2005 2010
2. Achieve universal primary education (con.)
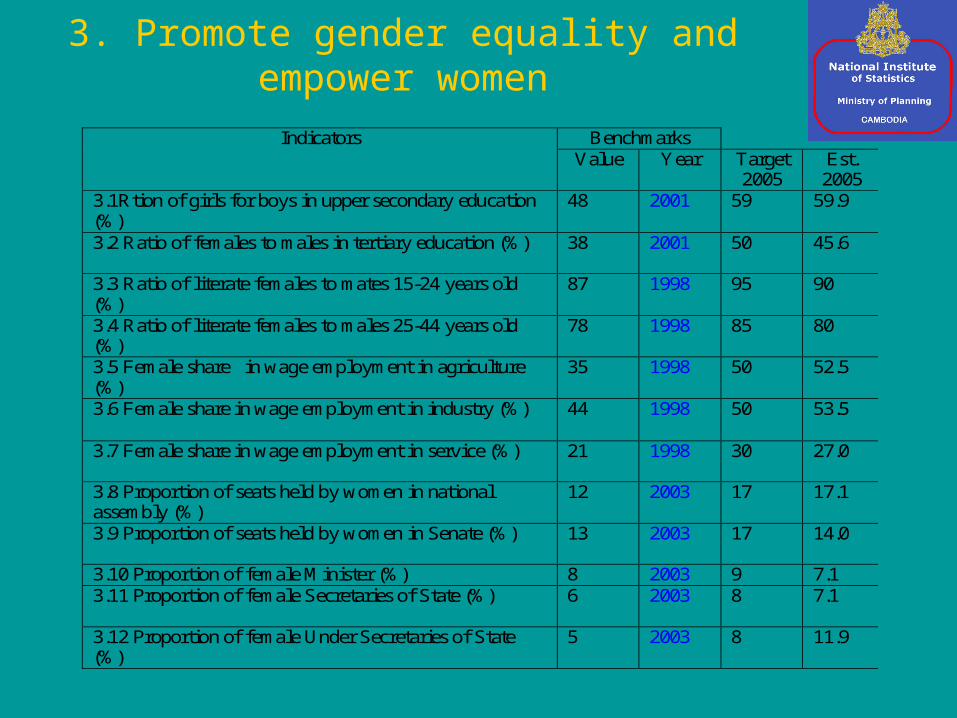
3. Promote gender equality and empower women
Benchmarks Indicators Value Year Target
2005 Est. 2005
3.1Rtion of girls for boys in upper secondary education (%)
48 2001 59 59.9
3.2 Ratio of females to males in tertiary education (%) 38 2001 50 45.6
3.3 Ratio of literate females to mates 15-24 years old (%)
87 1998 95 90
3.4 Ratio of literate females to males 25-44 years old (%)
78 1998 85 80
3.5 Female share in wage employment in agriculture (%)
35 1998 50 52.5
3.6 Female share in wage employment in industry (%) 44 1998 50 53.5
3.7 Female share in wage employment in service (%) 21 1998 30 27.0
3.8 Proportion of seats held by women in national assembly (%)
12 2003 17 17.1
3.9 Proportion of seats held by women in Senate (%) 13 2003 17 14.0
3.10 Proportion of female Minister (%) 8 2003 9 7.1 3.11 Proportion of female Secretaries of State (%) 6 2003 8 7.1
3.12 Proportion of female Under Secretaries of State (%)
5 2003 8 11.9
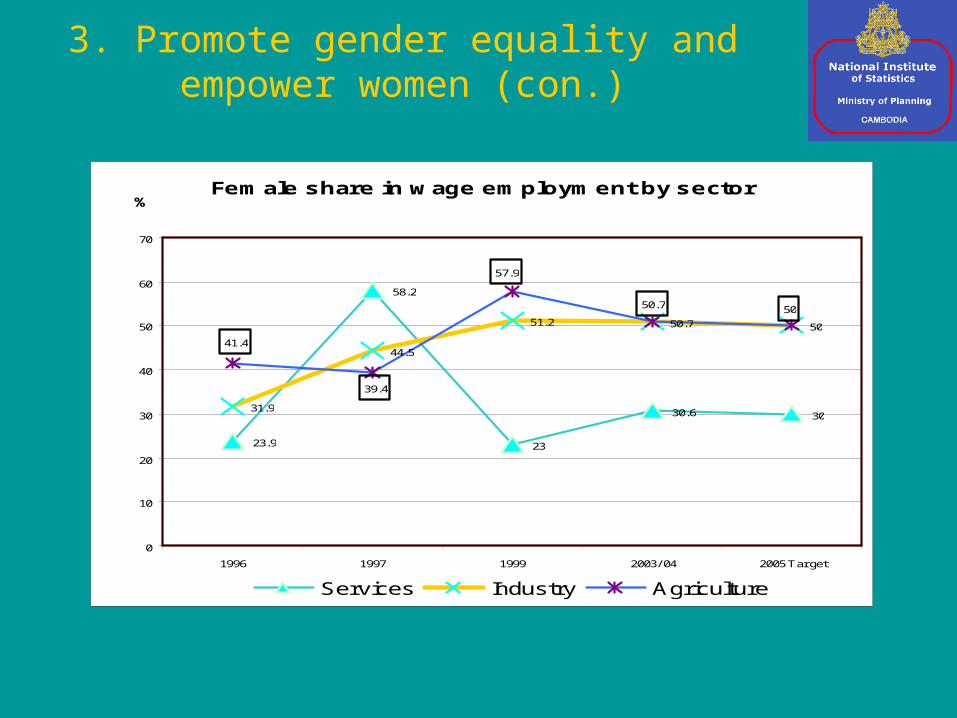
Female share in wage employment by sector
23.9
58.2
23
30.6 3031.9
44.5
51.2 50.7 50
5050.7
57.9
39.4
41.4
0
10
20
30
40
50
60
70
1996 1997 1999 2003/ 04 2005 Target
%
Services Industry Agriculture
3. Promote gender equality and empower women (con.)
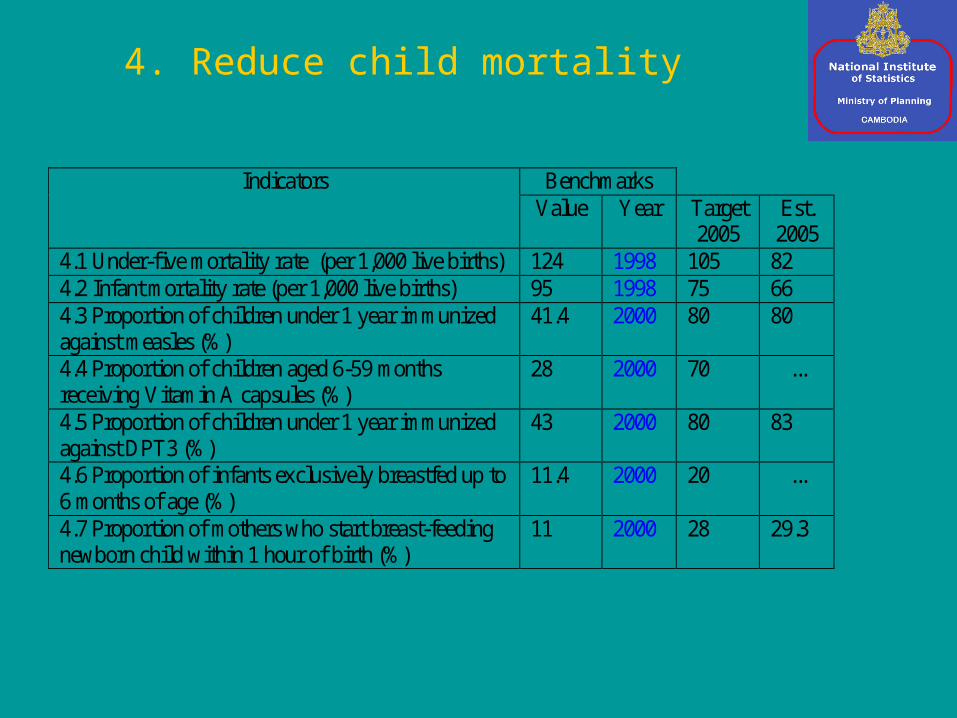
4. Reduce child mortality
Benchmarks Indicators Value Year Target
2005 Est. 2005
4.1 Under-five mortality rate (per 1,000 live births) 124 1998 105 82 4.2 Infant mortality rate (per 1,000 live births) 95 1998 75 66 4.3 Proportion of children under 1 year immunized against measles (%)
41.4 2000 80 80
4.4 Proportion of children aged 6-59 months receiving Vitamin A capsules (%)
28 2000 70 ...
4.5 Proportion of children under 1 year immunized against DPT3 (%)
43 2000 80 83
4.6 Proportion of infants exclusively breastfed up to 6 months of age (%)
11.4 2000 20 ...
4.7 Proportion of mothers who start breast-feeding newborn child within 1 hour of birth (%)
11 2000 28 29.3
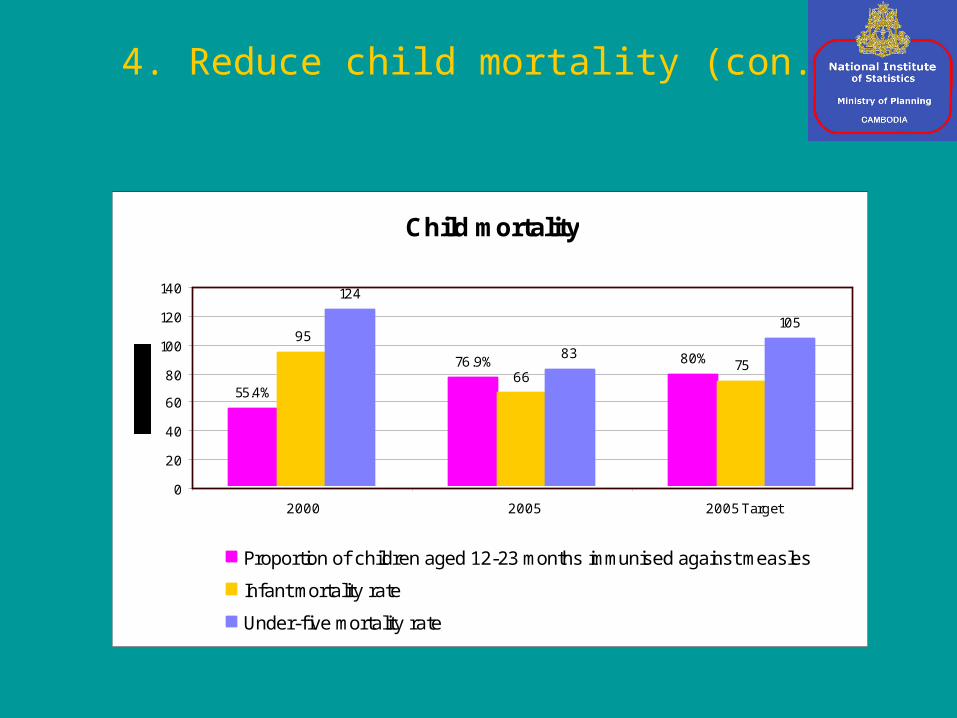
Child mortality
95
6675
124
83
105
55.4%
76.9% 80%
0
20
40
60
80
100
120
140
2000 2005 2005 Target
Proportion of children aged 12-23 months immunised against measles
Infant mortality rate
Under-f ive mortality rate
4. Reduce child mortality (con.)
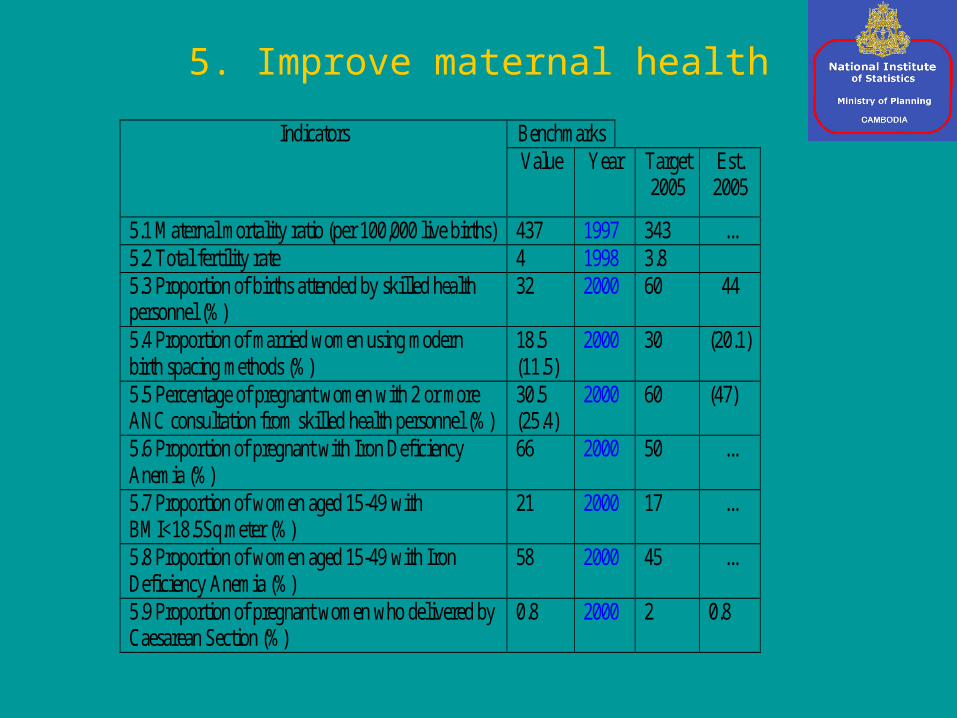
5. Improve maternal health
Benchmarks Indicators Value Year Target
2005 Est. 2005
5.1 Maternal mortality ratio (per 100,000 live births) 437 1997 343 ... 5.2 Total fertility rate 4 1998 3.8 5.3 Proportion of births attended by skilled health personnel (%)
32 2000 60 44
5.4 Proportion of married women using modern birth spacing methods (%)
18.5 (11.5)
2000 30 (20.1)
5.5 Percentage of pregnant women with 2 or more ANC consultation from skilled health personnel (%)
30.5 (25.4)
2000 60 (47)
5.6 Proportion of pregnant with Iron Deficiency Anemia (%)
66 2000 50 ...
5.7 Proportion of women aged 15-49 with BMI<18.5Sq.meter (%)
21 2000 17 ...
5.8 Proportion of women aged 15-49 with Iron Deficiency Anemia (%)
58 2000 45 ...
5.9 Proportion of pregnant women who delivered by Caesarean Section (%)
0.8 2000 2 0.8
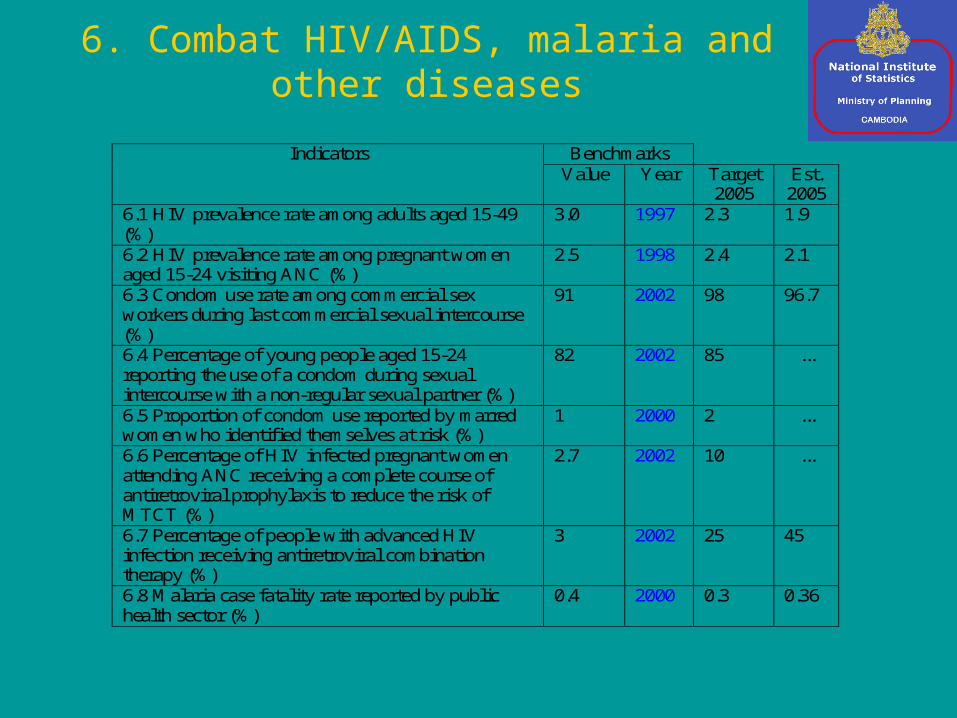
6. Combat HIV/AIDS, malaria and other diseases
Benchmarks Indicators Value Year Target
2005 Est. 2005
6.1 HIV prevalence rate among adults aged 15-49 (%)
3.0 1997 2.3 1.9
6.2 HIV prevalence rate among pregnant women aged 15-24 visiting ANC (%)
2.5 1998 2.4 2.1
6.3 Condom use rate among commercial sex workers during last commercial sexual intercourse (%)
91 2002 98 96.7
6.4 Percentage of young people aged 15-24 reporting the use of a condom during sexual intercourse with a non-regular sexual partner (%)
82 2002 85 ...
6.5 Proportion of condom use reported by marred women who identified themselves at risk (%)
1 2000 2 ...
6.6 Percentage of HIV infected pregnant women attending ANC receiving a complete course of antiretroviral prophylaxis to reduce the risk of MTCT (%)
2.7 2002 10 ...
6.7 Percentage of people with advanced HIV infection receiving antiretroviral combination therapy (%)
3 2002 25 45
6.8 Malaria case fatality rate reported by public health sector (%)
0.4 2000 0.3 0.36
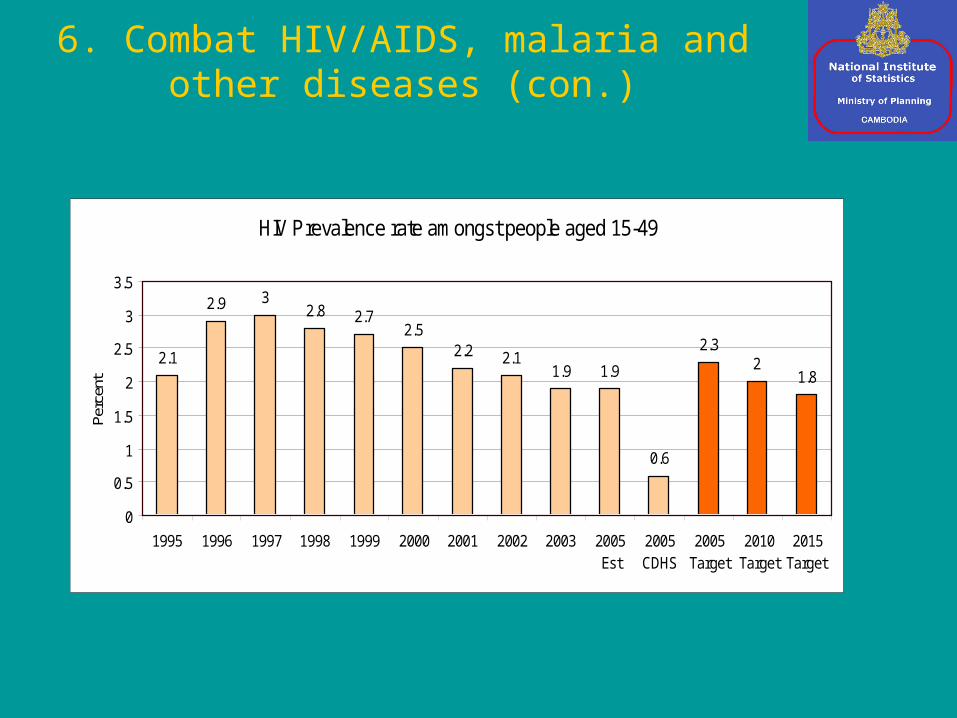
HIV Prevalence rate amongst people aged 15-49
2.1
2.9 32.8 2.7
2.52.2 2.1
1.9 1.9
0.6
2.32
1.8
0
0.5
1
1.5
2
2.5
3
3.5
1995 1996 1997 1998 1999 2000 2001 2002 2003 2005Est
2005CDHS
2005Target
2010Target
2015Target
Perc
ent
6. Combat HIV/AIDS, malaria and other diseases (con.)
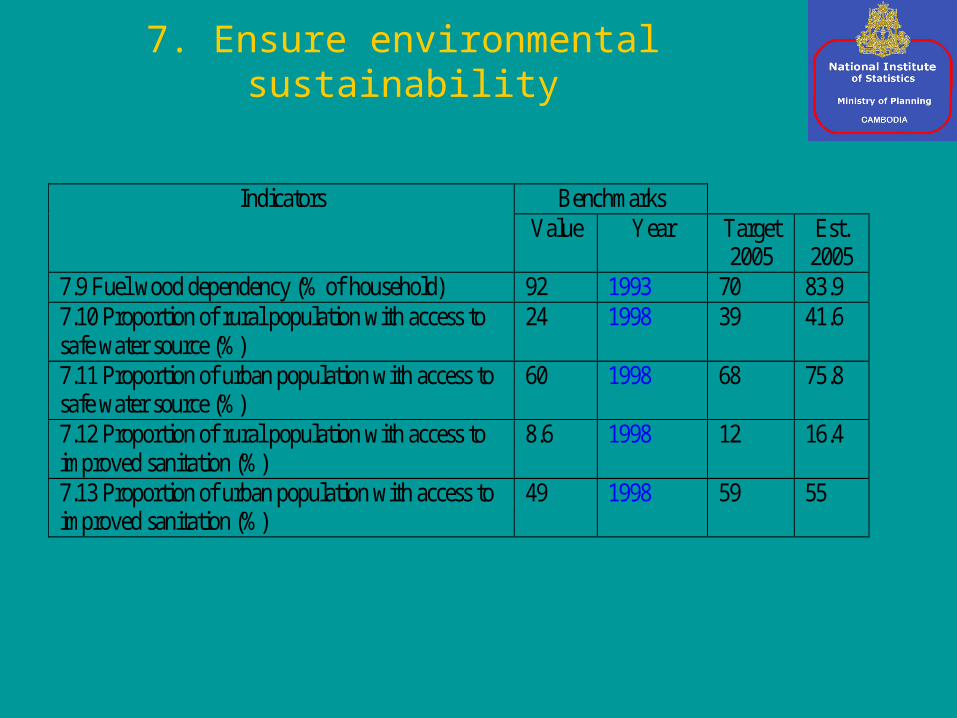
7. Ensure environmental sustainability
Benchmarks Indicators Value Year Target
2005 Est. 2005
7.9 Fuel wood dependency (% of household) 92 1993 70 83.9 7.10 Proportion of rural population with access to safe water source (%)
24 1998 39 41.6
7.11 Proportion of urban population with access to safe water source (%)
60 1998 68 75.8
7.12 Proportion of rural population with access to improved sanitation (%)
8.6 1998 12 16.4
7.13 Proportion of urban population with access to improved sanitation (%)
49 1998 59 55
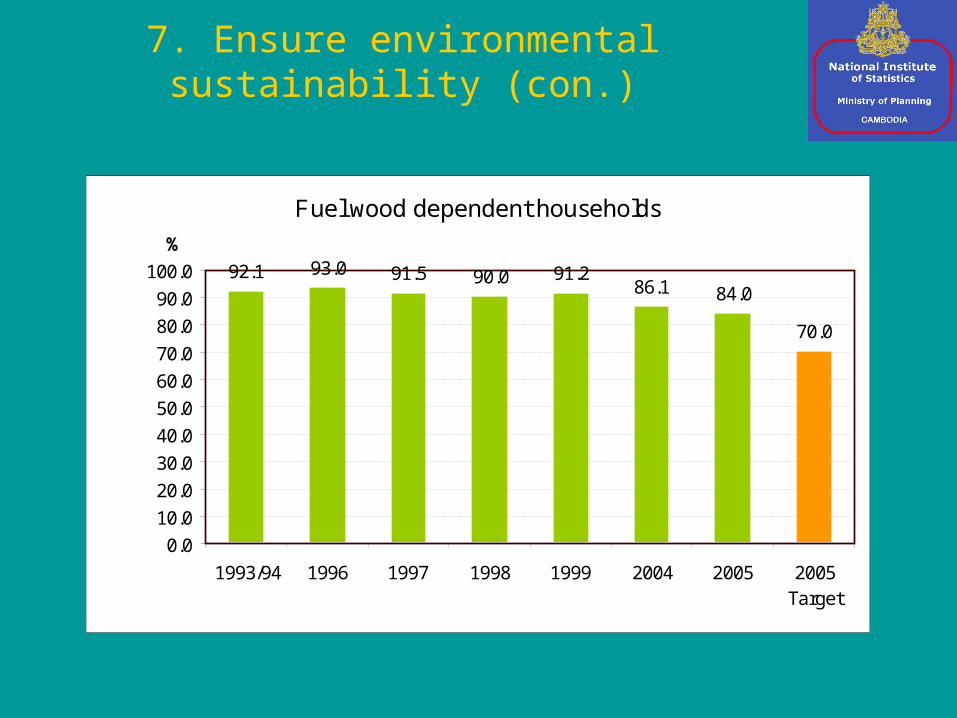
7. Ensure environmental sustainability (con.)
Fuel wood dependent households
92.1 93.0 91.5 90.0 91.286.1 84.0
70.0
0.0
10.0
20.0
30.0
40.0
50.0
60.0
70.0
80.0
90.0
100.0
1993/94 1996 1997 1998 1999 2004 2005 2005Target
%
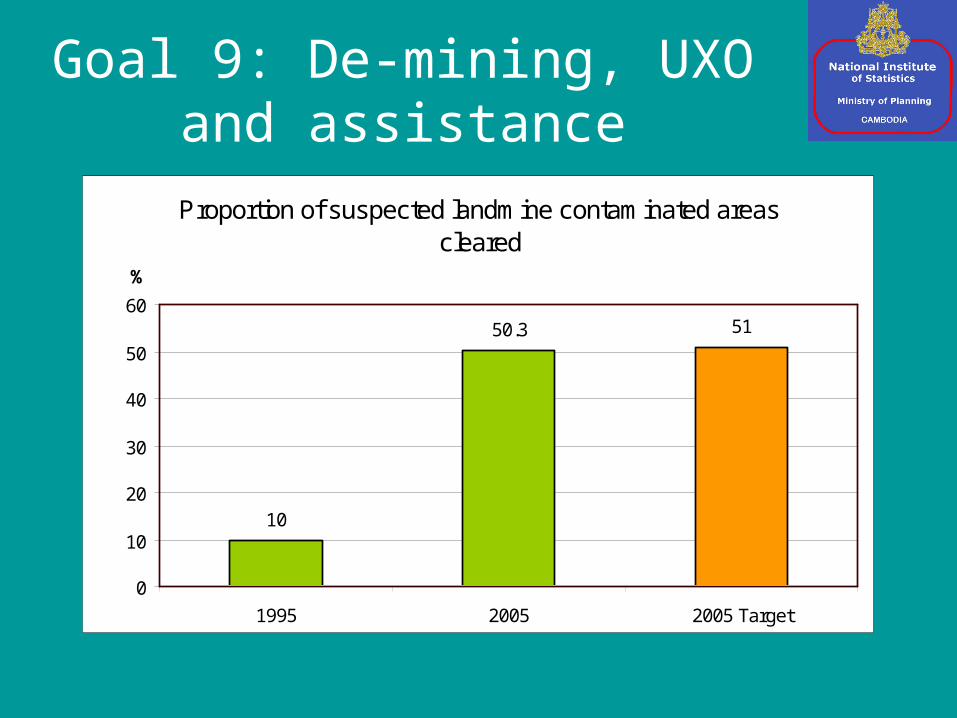
Goal 9: De-mining, UXO and assistance
Proportion of suspected landmine contaminated areas cleared
10
50.3 51
0
10
20
30
40
50
60
1995 2005 2005 Target
%
• Data collections were not regular.
• Unit responsible for monitoring MDG not existed
• Lack of dissemination for MDGs at local level (technical and senior officer relevant institutions)
Data gape
Challenges in general statistics
– Lack of statistical methods, standards, classifications
– Lack of funding for big statistical operations such as censuses, surveys
– Low Government budget for Statistics– Low salaries of statistical staff– No records of statistical activities remained
THANK YOU
![[Millennium Development Goals 1 and 3] By [Author Name ... · MILLENNIUM DEVELOPMENT GOALS 1 & 3 4 were termedas “Millennium Development Goals” and United Nations Millennium Declaration](https://img.pdfslide.us/doc/110x75/5edb6813ad6a402d66659cfd/millennium-development-goals-1-and-3-by-author-name-millennium-development.jpg)