Embed Size (px)
Citation preview
International comparisons of
GDP per capita and per employed person
17 countries, 1960-2008
Division of International Labor Comparisons
July 28, 2009
U.S. Department of Labor Bureau of Labor Statistics
Division of International Labor Comparisons E-mail:
Web site: [email protected]
http://www.bls.gov/ILC
This report presents comparative levels and trends of real gross domestic product (GDP) per capita and per employed person for 17 countries: The United States, Canada, Japan, Republic of Korea, Singapore, Australia, and eleven European countries. In addition, this report also examines two alternative measures, gross national income (GNI) per capita and GDP per hour worked. The data have been adjusted for comparability. This report is available on the Division of International Labor Comparisons Web site at www.bls.gov/ilc.
- 1 -
CONTENTS
I. Description Page
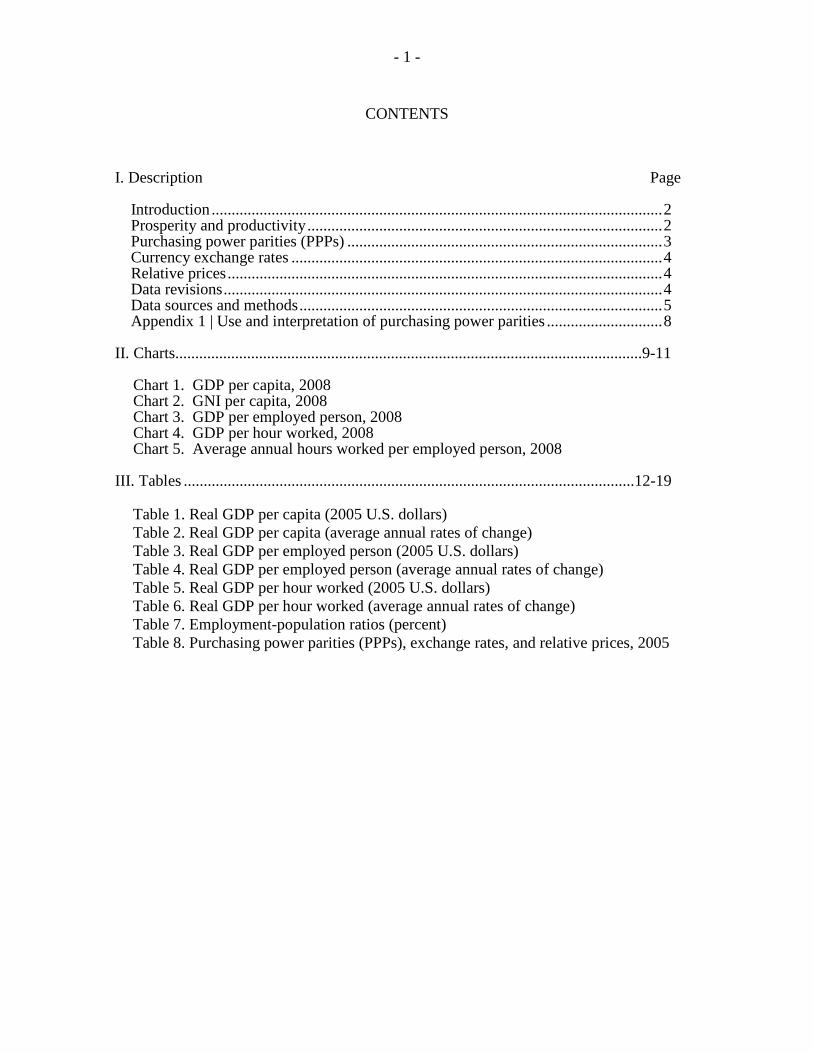
Introduction ................................................................................................................. 2 Prosperity and productivity ......................................................................................... 2
Purchasing power parities (PPPs) ............................................................................... 3 Currency exchange rates ............................................................................................. 4
Relative prices ............................................................................................................. 4 Data revisions .............................................................................................................. 4
Data sources and methods ........................................................................................... 5 Appendix 1 | Use and interpretation of purchasing power parities ............................. 8 II. Charts.....................................................................................................................9-11
Chart 1. GDP per capita, 2008 Chart 2. GNI per capita, 2008 Chart 3. GDP per employed person, 2008 Chart 4. GDP per hour worked, 2008 Chart 5. Average annual hours worked per employed person, 2008
III. Tables .................................................................................................................12-19
Table 1. Real GDP per capita (2005 U.S. dollars) Table 2. Real GDP per capita (average annual rates of change) Table 3. Real GDP per employed person (2005 U.S. dollars) Table 4. Real GDP per employed person (average annual rates of change) Table 5. Real GDP per hour worked (2005 U.S. dollars) Table 6. Real GDP per hour worked (average annual rates of change) Table 7. Employment-population ratios (percent) Table 8. Purchasing power parities (PPPs), exchange rates, and relative prices, 2005

- 2 -
I. Description Introduction This report represents an update of comparative GDP per capita and per employed person data produced annually by the Bureau of Labor Statistics (BLS). Separate historical tables for GDP per hour worked are included for the first time. With this year’s edition, Singapore becomes the seventeenth country included in these comparisons. The main source of Singapore’s data is Statistics Singapore. The data comply with international standards of national accounts. An eighteenth country, Ireland, has been partially included for illustrative purposes.1
Section I discusses the concepts, sources, and methods. Section II presents charts with level data for 2008 on prosperity, productivity, and hours worked. Section III provides historical time series and growth rates.
2
Charts 1 and 2 (page 9) show that comparisons of well-being may be affected by taking into account a country's net income receipts from abroad. Instead of GDP per capita, chart 2 shows GNI per capita.
In addition, the section also presents historical level data for population-employment ratios and relative prices for 2005. Prosperity and productivity Gross domestic product is the value of all market and some non-market goods and services produced within a country. As such, it is the most comprehensive measure of a country's economic output that is generally estimated by statistical agencies. GDP per capita may therefore be viewed as a rough indicator of a nation's prosperity, while GDP per employed person and GDP per hour worked can provide a general picture of a country's productivity. These indicators are only approximations. National prosperity consists of many things that are not included in its GDP and some items included may not contribute to a country's well-being. In addition, some countries experience significant in- and out-flows of income because of foreign investment, which may affect a country’s prosperity. For productivity comparisons, using the number of persons employed as a measure of labor input ignores differences in the number of hours worked and the skill levels of different people. Nevertheless, GDP, GDP per capita, and GDP per employed person, as presented here, are commonly used to compare the economic performance of different countries.
3
1 BLS is investigating the feasibility of full inclusion of data for Ireland in subsequent reports. 2 The charts that use GDP data have been converted with PPPs for 2008, which are the latest available PPPs. The tables convert output with PPPs for 2005, which are the latest available benchmarks for PPP data. 3 Many countries now publish estimates of GNI as part of their national accounts. However, GNI expressed in real terms are not consistently available as long time series.
GNI is obtained by adjusting GDP for net income flows from abroad. For some countries, this adjustment has a significant impact on the data. For example, for Ireland GNI per capita is 17.9 percent smaller than GDP per capita. As a result, Ireland’s ranking changes from third place using GDP per capita to ninth place using GNI per capita in 2008.

- 3 -
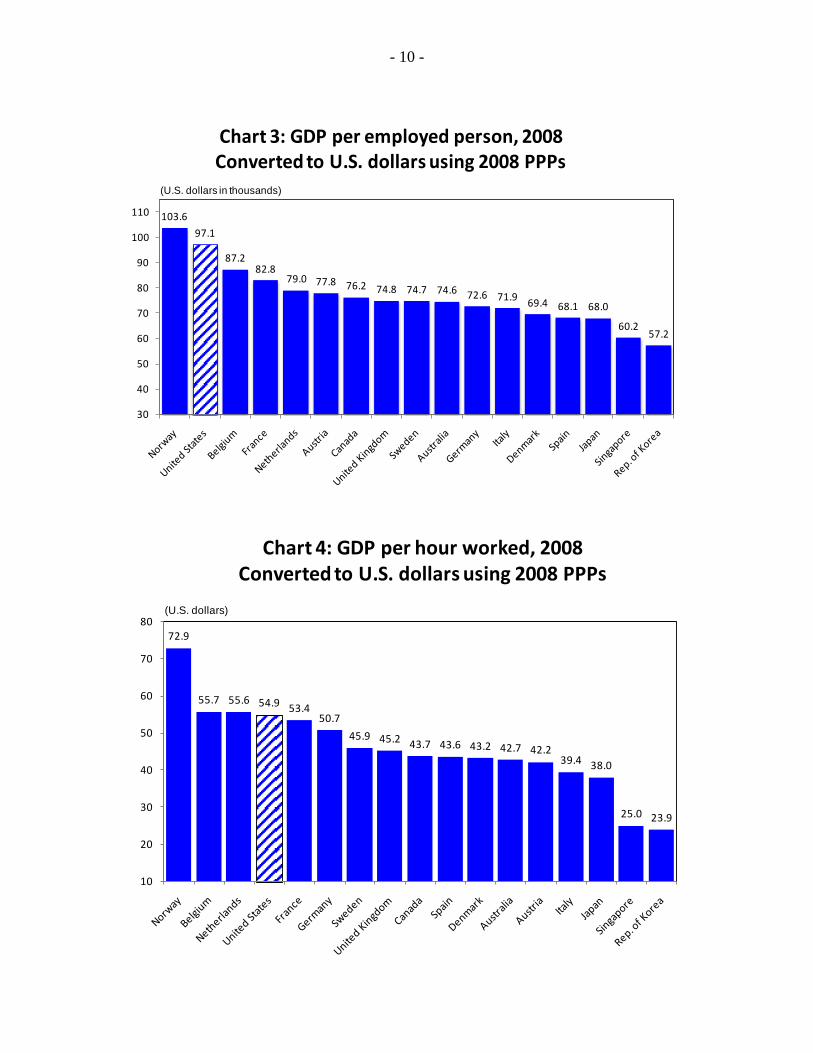
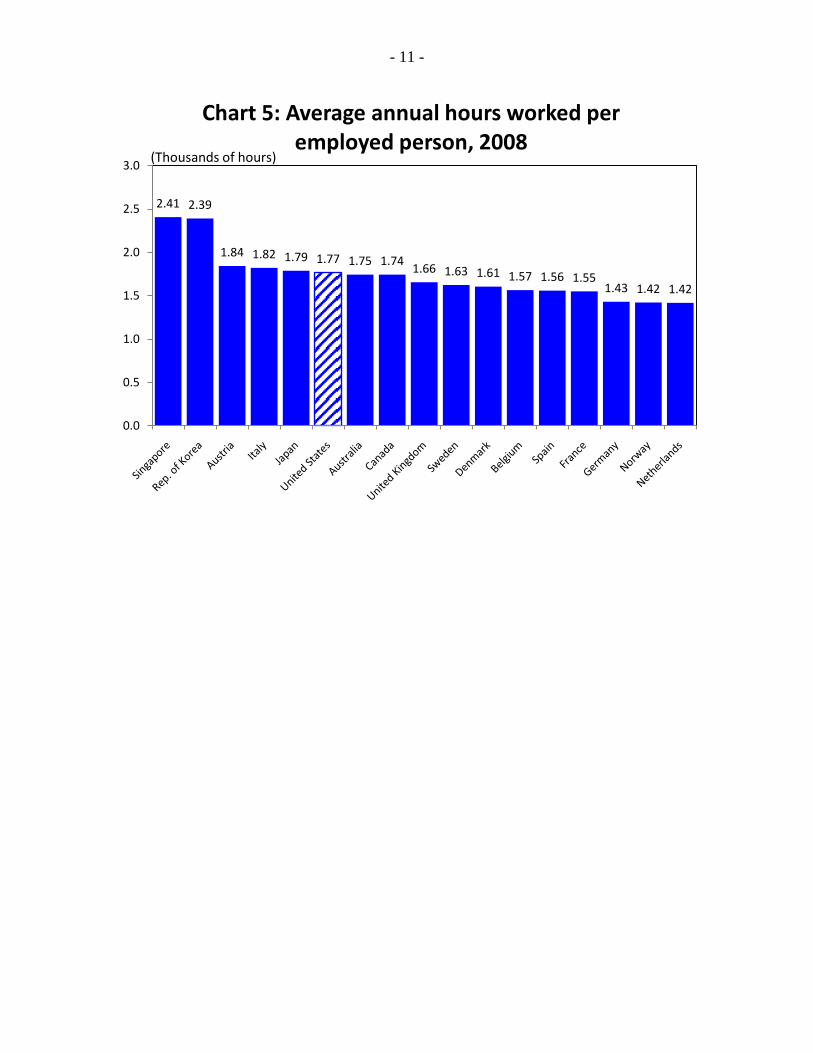
Charts 3 and 4 (page 10) show 2008 comparisons on both a GDP per employed person and a GDP per hour worked basis for all countries except Ireland. The resulting ranking is different. The United States moves from second place on the per employed person basis to fourth place on the per hour worked basis. This is because U.S. workers worked longer hours in 2008. Average annual hours worked in the United States were higher than in most European countries. See chart 5. However, it must be noted that methods of computing hours worked at the aggregate national level can differ significantly among countries, and thus such level comparisons must be viewed with caution. Small differences in rankings should not be considered economically significant. More information about the data and their limitations appears in the section on sources and methods beginning on page 6. Purchasing power parities (PPPs) In each country's national statistics, GDP and GNI are valued in terms of its national currency units. Therefore, these results must be converted to a common unit of value before they can be compared. In this report, all GDP series are converted to U.S. dollars through the use of PPPs. PPPs are currency conversion rates that allow output in different currency units to be expressed in a common unit of value. A PPP for a given country is a ratio, in which the numerator is the number of national currency units needed to purchase a basket of goods and services in that country and the denominator is the number of currency units needed to purchase a similar basket of goods and services in the base country. The base country for this report is the United States. Thus PPPs are interspatial indexes constructed for the purpose of comparing relative prices across countries. They are similar to an intertemporal price index, such as a consumer price index used within a country to compare changes in prices over time. Just as a consumer price index measures the cost of a basket of goods and services over time, PPPs can be used to measure the cost of a particular basket of goods and services across countries at a point in time. The procedures are similar: first calculate the ratios of prices for each of a detailed set of goods and services in different countries. Then, at higher levels of aggregation, and for the GDP, PPPs are the weighted averages of these ratios. PPPs have been or currently are being used by a number of international organizations to compare performance levels among countries and regions. These include the Organization for Economic Co-operation and Development (OECD), the Statistical Office of the European Communities (Eurostat), the United Nations, the International Monetary Fund, and the World Bank. (See box on page 8 for information about the use and interpretation of PPPs.)

- 4 -
Currency exchange rates Inter-country comparisons of output levels are sometimes based on market exchange rates rather than PPPs. However, market exchange rates seldom reflect the relative purchasing powers of different currencies. At best, market exchange rates represent only the relative prices of goods and services that are traded internationally, not the relative value of total domestic output, which also consists of goods, and particularly services, that are not traded internationally, or which are isolated from the effects of foreign trade. In addition, market exchange rates also are affected by influences entirely unrelated to the relative values of any goods or services. These influences include currency traders’ views of the stability of governments in various countries, relative interest rates among countries, and other incentives for holding financial assets in one currency rather than another. Relative prices The relationship between PPPs and exchange rates can be used to estimate comparative prices in different countries. This report calculates relative price by dividing a country's PPP for a given year by its currency's exchange rate. (See table 8) A price indicator of less than 1.00 indicates that less than one U.S. dollar (exchanged for the local currency at the market exchange rate) can purchase an amount of goods and services in that country that it would take one dollar to purchase in the United States; therefore, prices in that country are relatively low compared to the United States. A price indicator greater than 1.00 indicates that it would take more than one U.S. dollar to purchase in that country an amount of goods and services that could be purchased for one dollar in the United States; therefore, prices in that country are relatively high compared to the United States. These relative price indicators refer to all the goods and services that go into GDP. Data revisions National accounts data are subject to two basic types of revisions. Generally, for the first three years, statistical agencies consider GDP and GNI data preliminary and revise them with each successive release. In addition, statistical agencies revise data periodically to improve the methodology or include new accounts.

- 5 -
Data sources and methods The comparative measures in this report were calculated from GDP, population, employment, and hours worked data series that were obtained from national statistical sources. While these data are generally comparable, some differences remain in the countries' statistical methodologies, which may affect comparability. The estimates shown in this report are based on data available as of May 2009. Gross domestic product. The GDP and GNI measures used for all countries come from their national accounts sources. For all countries in this comparison, the most recent series use the 1993 United Nations System of National Accounts (SNA 93). However, some earlier series have been prepared using 1968 United Nations System of National Accounts (SNA 68). The U.S. GDP series is based on the system of national income and product accounts (NIPAs) estimated by the Bureau of Economic Analysis (BEA). This release does not include the 13th comprehensive revision of the national income and product accounts (NIPAs) from July 31, 2009. Spanish GDP data are available from 1964. A major difference among countries pertains to the weighting scheme used to derive real GDP. The SNA 93 recommends annual-weighted real output measures. The U.S. GDP series is a chain-type annual-weighted measure of real GDP. Most of the other countries are already using, or switching to, this same deflation method, at least for the most recent years. Belgium and the Republic of Korea, however, still produce their real GDP series by means of fixed base-year deflators, updating their base year every 5 years. For many countries it has been necessary to link several time series, each of which has its own set of base-year price weights, to construct one continuous real GDP series for use over a longer time period. Gross national income. GNI equals GDP plus net income flows from abroad. Net income flows from abroad are the sum of all income received by one country from investment in other countries, minus the income paid to other countries from investments made by other countries. The GNI measures in this report come predominantly from national accounts sources. For some countries they are based on data published by Eurostat and the International Monetary Fund. The U.S. GNI series is based on the system of national income and product accounts (NIPAs) estimated by the Bureau of Economic Analysis (BEA). Population. The population figures are derived from national and international statistical sources, and represent the total resident population. For recent years alternative sources may be used, until data from normal sources become available. The employment-population ratios in table 7 of this report differ from the ratios published in the BLS report International comparisons of annual labor force statistics, 10 countries,4
Employment. For most countries, the employment data used in this report are obtained from the countries' national accounts, where the data series have been developed from
which uses working-age population rather than total population as the denominator.
4 This report is available on the Internet at http://www.bls.gov/ilc/home.htm.

- 6 -
various surveys and other sources, including labor force (household) and establishment surveys. Employment data for Korea and Spain are available from 1963 and 1971 respectively. The employment series used in this report for the United States, the Netherlands, and the United Kingdom are based on the employment data set used for the BLS report International comparisons of annual labor force statistics, 10 Countries. While these series have been adjusted for greater comparability with U.S. concepts, they have not been adjusted for breaks in series. For the current report, the data have been further adjusted to include people serving in the armed forces. Hours worked. For most countries, the hours data used in this report are obtained from the countries' national accounts, where the data series have been developed from various surveys and other sources. To calculate total hours worked by all people employed in an economy, national statistical offices use different data sources and estimation techniques. The employment series may refer to the number of persons or the number of jobs, and hours worked may have to be estimated from hours paid. Different establishment and household surveys are used to cover all employees, self-employed, and armed forces. These differences may affect the comparability of these data among different countries.5
Purchasing power parities. The purchasing power parities (PPPs) used for this report are taken from the OECD-Eurostat PPP Program, as published by the OECD in its publications and posted on its web-site. Data for benchmark PPP estimates are collected every three years. The latest published benchmark data are for 2005,
6
5 BLS can provide upon request the average annual hours worked data that underlie the estimates in this report.
and were used to convert the GDP series in the tables to 2005 U.S. dollars. The PPPs for the years after 2005 are OECD and Eurostat estimates. The 2008 PPPs were used to convert the 2008 GDP and GNI data used in charts 1–4 to U.S. dollars. Comparative real GDP series. For this report, the real GDP series, expressed in 2005 U.S. dollars, were calculated based on the PPPs for 2005, the latest published benchmark year. The real GDP values for other years were derived by using the trends in the respective real GDP series that were published by each country in their national currency units. Thus, the changes over time in the comparative real GDP for each country, expressed in 2005 U.S. dollars, are based on changes in the country's own GDP deflator. The method of deriving the comparative series can be summarized as follows. First, all the real GDP series from the different countries were expressed in constant 2005 prices of their national currencies. Next, each country's GDP series was divided by its PPP for 2005, thereby converting the series into constant 2005 U.S. dollars. Finally, the series of GDP per capita, per employed person, and per hour, in constant 2005 dollars, were estimated by dividing each country's GDP in 2005 dollars by its population, employment, and hours respectively.
6 OECD and Eurostat, Purchasing Power Parities and Real Expenditures. 2005 Benchmark Year, 2007 Edition. Also http://www.oecd.org/LongAbstract/0,3425,en_2649_34357_1876126_119656_1_1_1,00.html

- 7 -
Data for Germany. German data prior to 1991 pertain to the former West Germany. The data series are linked in 1991. Data for Ireland. Data for Ireland are from the Central Statistics Office Ireland. Output and income data are prepared according to the 1993 System of National Accounts. Population data represent total resident population. BLS is investigating the feasibility of full inclusion of data for Ireland in future issues of this report. Comparisons with OECD published data. The OECD also publishes comparative levels of GDP per capita.7
The OECD also publishes average hours worked, which for some countries may differ from the average hours used in this report. The differences may be due to differences in the timing of the data releases or adjustments made to some of the data.
These may differ from the level comparisons in the attached tables. First, the per capita GDP figures presented in the OECD reports may differ from BLS figures because of the timing of the receipt of revised GDP and population data from national accounts offices. In addition, for the United States and Canada, the GDP numbers used in the OECD estimates are based on data that have been specially adjusted to conform to the SNA93 system of national accounts. These special adjustments result in lower levels for U.S. and Canadian GDP data than the GDP data used for this report, but do not have an appreciable affect on the growth rate of real GDP.
8, 9
7 OECD, national accounts databases,
http://stats.oecd.org/WBOS/Index.aspx. Select National Accounts, Annual National Accounts, Main Aggregates, Gross Domestic Product. 8 OECD, Employment Outlook, and productivity database, http://www.oecd.org/statistics/productivity/compendium. 9 Some of the differences between estimates of average annual hours worked, published by the OECD and by BLS, are discussed in Susan Fleck, "International comparisons of hours worked: an assessment of the statistics," Monthly Labor Review, May 2009, pp. 3–31.

- 8 -
Appendix 1 | Use and interpretation of purchasing power parities PPPs are an effective tool for international economic comparisons. However they should be used and interpreted with caution, given certain aspects of the collection and estimation procedures used. While comparative estimates like GDP per capita are useful for grouping countries, a strict ranking order interpretation should be avoided. The per capita GDPs of most OECD countries fall within a relatively narrow range, and changes in rankings can occur as a result of relatively minor adjustments to PPP estimates. Small differences in per capita GDP between countries are not, in general, economically significant. Some aspects of PPP estimation that may influence the accuracy of the results include: Representativeness of goods and services to be priced It is difficult to find goods and services for pricing that are representative of the goods and services actually purchased in all countries. Price comparability There may be a lack of comparability between national prices. This can arise from differences in the characteristics of the products that countries price, or because of the sampling procedures that countries use to collect prices. Aggregation method The results are influenced by the aggregation method used to combine different commodity groups into a single PPP for total GDP in each country. A different aggregation method can produce different PPP estimates. PPP quality varies by sector Certain expenditure categories are resistant to comparison because they cover products or services which are difficult to specify for pricing across countries (e.g., services and information technology products) or because they cover consumption for which no market prices exist (e.g., government services, fixed capital formation, and imputed rents of owner occupiers). Country capabilities Participating countries differ in their financial and technical support of the PPP program, and therefore in the extent to which they are able to satisfy the entire program's methodological requirements.

- 9 -
II. Charts
56.8
46.8 44.6
41.1 39.4 38.4 37.4 36.9 36.7 36.4 36.2 36.1 35.6 34.2 33.4 31.3 30.3
27.7
10
20
30
40
50
60
Chart 1: GDP per capita, 2008 Converted to U.S. dollars using 2008 PPPs
(U.S. dollars in thousands)
57.4
46.8
42.238.9 37.9 37.8 37.1 36.9 36.6 36.4 36.2 35.9 35.7 35.3
33.630.6 29.9
27.9
10
20
30
40
50
60
Chart 2: GNI per capita, 2008 Converted to U.S. dollars using 2008 PPPs
(U.S. dollars in thousands)
- 10 -
103.6
97.1
87.282.8
79.0 77.8 76.2 74.8 74.7 74.6 72.6 71.9 69.4 68.1 68.0
60.257.2
30
40
50
60
70
80
90
100
110
Chart 3: GDP per employed person, 2008 Converted to U.S. dollars using 2008 PPPs
(U.S. dollars in thousands)
72.9
55.7 55.6 54.9 53.450.7
45.9 45.2 43.7 43.6 43.2 42.7 42.239.4 38.0
25.0 23.9
10
20
30
40
50
60
70
80
Chart 4: GDP per hour worked, 2008 Converted to U.S. dollars using 2008 PPPs
(U.S. dollars)
- 11 -
2.41 2.39
1.84 1.82 1.79 1.77 1.75 1.741.66 1.63 1.61 1.57 1.56 1.55
1.43 1.42 1.42
0.0
0.5
1.0
1.5
2.0
2.5
3.0
Chart 5: Average annual hours worked per employed person, 2008
(Thousands of hours)
- 12 -
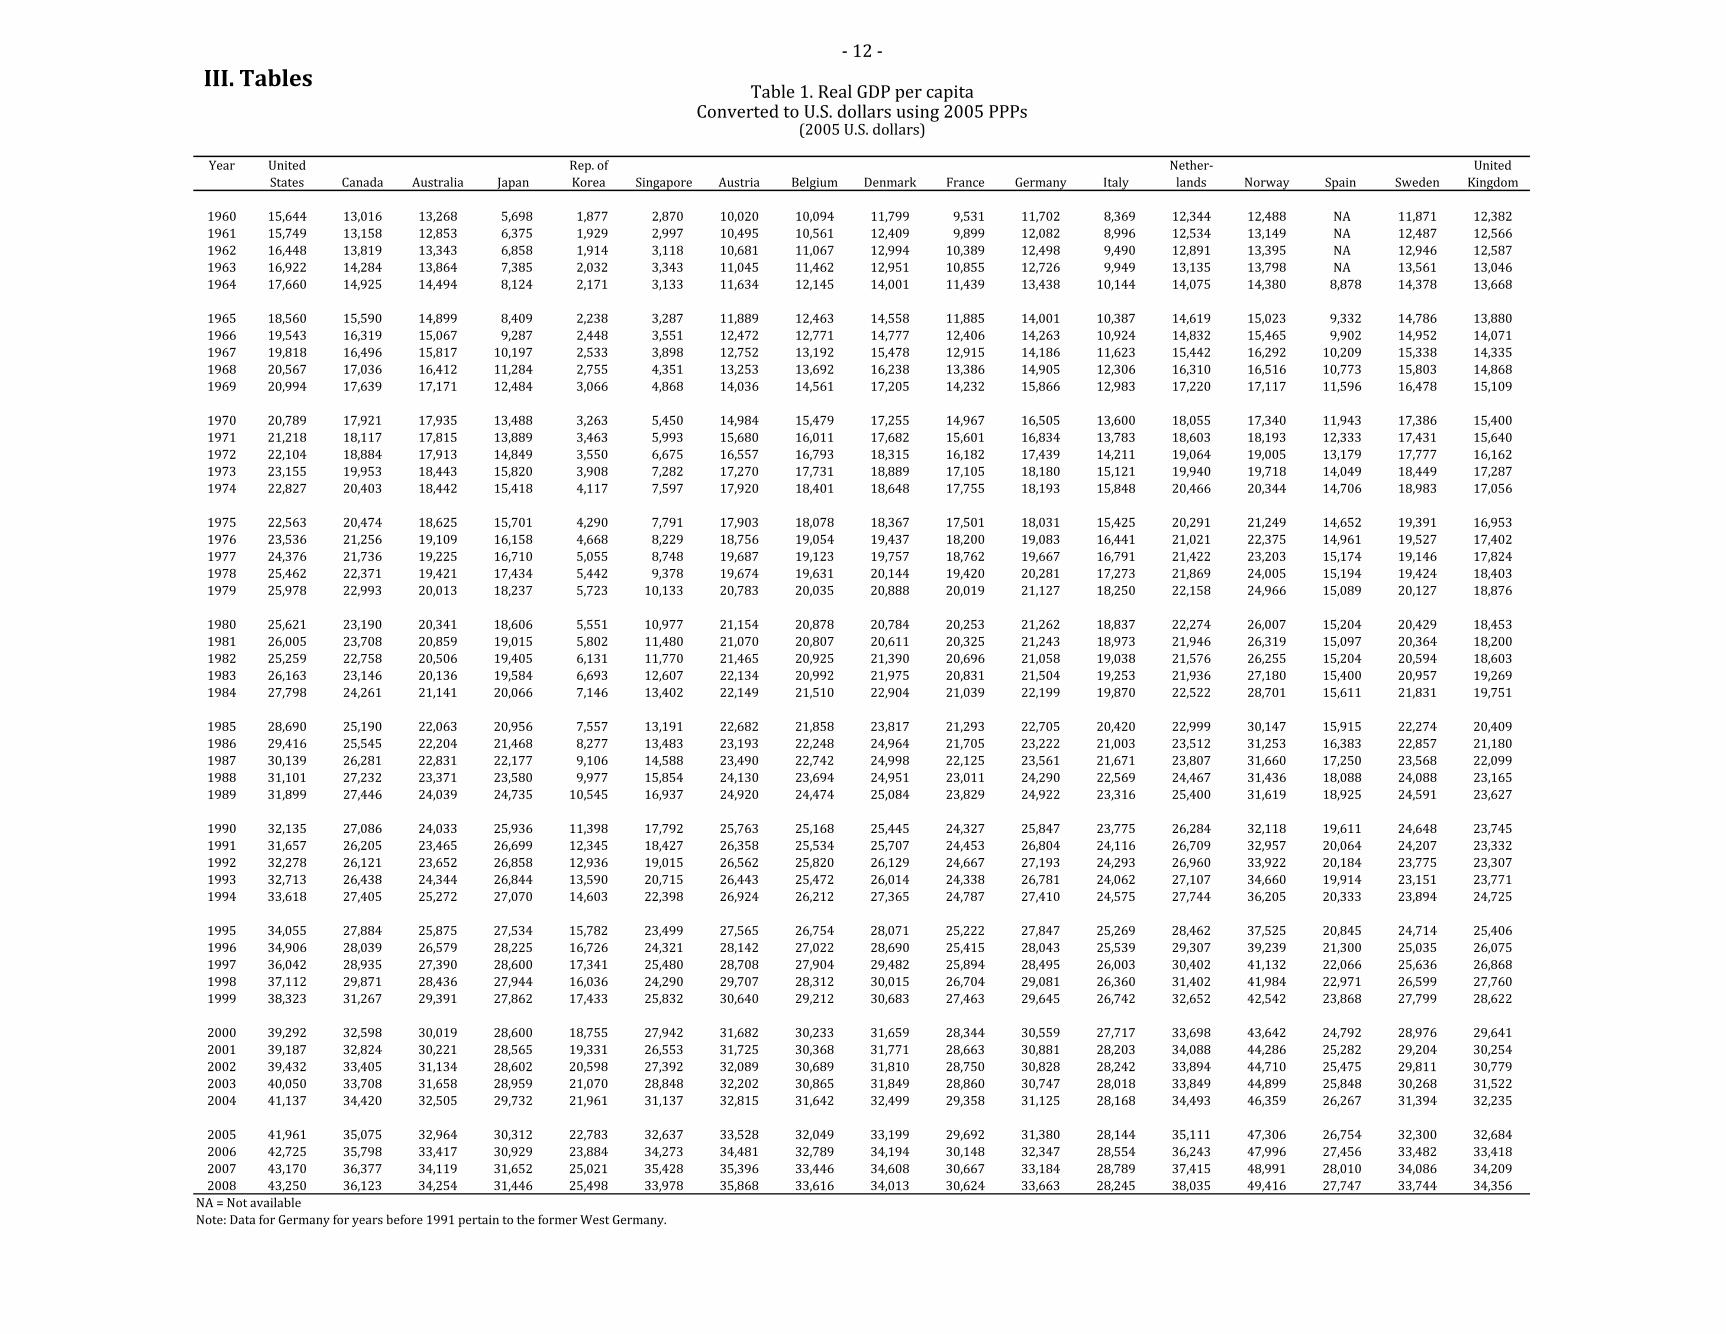
Table 1. Real GDP per capitaConverted to U.S. dollars using 2005 PPPs
(2005 U.S. dollars)
Year United Rep. of Nether- UnitedStates Canada Australia Japan Korea Singapore Austria Belgium Denmark France Germany Italy lands Norway Spain Sweden Kingdom
1960 15,644 13,016 13,268 5,698 1,877 2,870 10,020 10,094 11,799 9,531 11,702 8,369 12,344 12,488 NA 11,871 12,3821961 15,749 13,158 12,853 6,375 1,929 2,997 10,495 10,561 12,409 9,899 12,082 8,996 12,534 13,149 NA 12,487 12,5661962 16,448 13,819 13,343 6,858 1,914 3,118 10,681 11,067 12,994 10,389 12,498 9,490 12,891 13,395 NA 12,946 12,5871963 16,922 14,284 13,864 7,385 2,032 3,343 11,045 11,462 12,951 10,855 12,726 9,949 13,135 13,798 NA 13,561 13,0461964 17,660 14,925 14,494 8,124 2,171 3,133 11,634 12,145 14,001 11,439 13,438 10,144 14,075 14,380 8,878 14,378 13,668
1965 18,560 15,590 14,899 8,409 2,238 3,287 11,889 12,463 14,558 11,885 14,001 10,387 14,619 15,023 9,332 14,786 13,8801966 19,543 16,319 15,067 9,287 2,448 3,551 12,472 12,771 14,777 12,406 14,263 10,924 14,832 15,465 9,902 14,952 14,0711967 19,818 16,496 15,817 10,197 2,533 3,898 12,752 13,192 15,478 12,915 14,186 11,623 15,442 16,292 10,209 15,338 14,3351968 20,567 17,036 16,412 11,284 2,755 4,351 13,253 13,692 16,238 13,386 14,905 12,306 16,310 16,516 10,773 15,803 14,8681969 20,994 17,639 17,171 12,484 3,066 4,868 14,036 14,561 17,205 14,232 15,866 12,983 17,220 17,117 11,596 16,478 15,109
1970 20,789 17,921 17,935 13,488 3,263 5,450 14,984 15,479 17,255 14,967 16,505 13,600 18,055 17,340 11,943 17,386 15,4001971 21,218 18,117 17,815 13,889 3,463 5,993 15,680 16,011 17,682 15,601 16,834 13,783 18,603 18,193 12,333 17,431 15,6401972 22,104 18,884 17,913 14,849 3,550 6,675 16,557 16,793 18,315 16,182 17,439 14,211 19,064 19,005 13,179 17,777 16,1621973 23,155 19,953 18,443 15,820 3,908 7,282 17,270 17,731 18,889 17,105 18,180 15,121 19,940 19,718 14,049 18,449 17,2871974 22,827 20,403 18,442 15,418 4,117 7,597 17,920 18,401 18,648 17,755 18,193 15,848 20,466 20,344 14,706 18,983 17,056
1975 22,563 20,474 18,625 15,701 4,290 7,791 17,903 18,078 18,367 17,501 18,031 15,425 20,291 21,249 14,652 19,391 16,9531976 23,536 21,256 19,109 16,158 4,668 8,229 18,756 19,054 19,437 18,200 19,083 16,441 21,021 22,375 14,961 19,527 17,4021977 24,376 21,736 19,225 16,710 5,055 8,748 19,687 19,123 19,757 18,762 19,667 16,791 21,422 23,203 15,174 19,146 17,8241978 25,462 22,371 19,421 17,434 5,442 9,378 19,674 19,631 20,144 19,420 20,281 17,273 21,869 24,005 15,194 19,424 18,4031979 25,978 22,993 20,013 18,237 5,723 10,133 20,783 20,035 20,888 20,019 21,127 18,250 22,158 24,966 15,089 20,127 18,876
1980 25,621 23,190 20,341 18,606 5,551 10,977 21,154 20,878 20,784 20,253 21,262 18,837 22,274 26,007 15,204 20,429 18,4531981 26,005 23,708 20,859 19,015 5,802 11,480 21,070 20,807 20,611 20,325 21,243 18,973 21,946 26,319 15,097 20,364 18,2001982 25,259 22,758 20,506 19,405 6,131 11,770 21,465 20,925 21,390 20,696 21,058 19,038 21,576 26,255 15,204 20,594 18,6031983 26,163 23,146 20,136 19,584 6,693 12,607 22,134 20,992 21,975 20,831 21,504 19,253 21,936 27,180 15,400 20,957 19,2691984 27,798 24,261 21,141 20,066 7,146 13,402 22,149 21,510 22,904 21,039 22,199 19,870 22,522 28,701 15,611 21,831 19,751
1985 28,690 25,190 22,063 20,956 7,557 13,191 22,682 21,858 23,817 21,293 22,705 20,420 22,999 30,147 15,915 22,274 20,4091986 29,416 25,545 22,204 21,468 8,277 13,483 23,193 22,248 24,964 21,705 23,222 21,003 23,512 31,253 16,383 22,857 21,1801987 30,139 26,281 22,831 22,177 9,106 14,588 23,490 22,742 24,998 22,125 23,561 21,671 23,807 31,660 17,250 23,568 22,0991988 31,101 27,232 23,371 23,580 9,977 15,854 24,130 23,694 24,951 23,011 24,290 22,569 24,467 31,436 18,088 24,088 23,1651989 31,899 27,446 24,039 24,735 10,545 16,937 24,920 24,474 25,084 23,829 24,922 23,316 25,400 31,619 18,925 24,591 23,627
1990 32,135 27,086 24,033 25,936 11,398 17,792 25,763 25,168 25,445 24,327 25,847 23,775 26,284 32,118 19,611 24,648 23,7451991 31,657 26,205 23,465 26,699 12,345 18,427 26,358 25,534 25,707 24,453 26,804 24,116 26,709 32,957 20,064 24,207 23,3321992 32,278 26,121 23,652 26,858 12,936 19,015 26,562 25,820 26,129 24,667 27,193 24,293 26,960 33,922 20,184 23,775 23,3071993 32,713 26,438 24,344 26,844 13,590 20,715 26,443 25,472 26,014 24,338 26,781 24,062 27,107 34,660 19,914 23,151 23,7711994 33,618 27,405 25,272 27,070 14,603 22,398 26,924 26,212 27,365 24,787 27,410 24,575 27,744 36,205 20,333 23,894 24,725
1995 34,055 27,884 25,875 27,534 15,782 23,499 27,565 26,754 28,071 25,222 27,847 25,269 28,462 37,525 20,845 24,714 25,4061996 34,906 28,039 26,579 28,225 16,726 24,321 28,142 27,022 28,690 25,415 28,043 25,539 29,307 39,239 21,300 25,035 26,0751997 36,042 28,935 27,390 28,600 17,341 25,480 28,708 27,904 29,482 25,894 28,495 26,003 30,402 41,132 22,066 25,636 26,8681998 37,112 29,871 28,436 27,944 16,036 24,290 29,707 28,312 30,015 26,704 29,081 26,360 31,402 41,984 22,971 26,599 27,7601999 38,323 31,267 29,391 27,862 17,433 25,832 30,640 29,212 30,683 27,463 29,645 26,742 32,652 42,542 23,868 27,799 28,622
2000 39,292 32,598 30,019 28,600 18,755 27,942 31,682 30,233 31,659 28,344 30,559 27,717 33,698 43,642 24,792 28,976 29,6412001 39,187 32,824 30,221 28,565 19,331 26,553 31,725 30,368 31,771 28,663 30,881 28,203 34,088 44,286 25,282 29,204 30,2542002 39,432 33,405 31,134 28,602 20,598 27,392 32,089 30,689 31,810 28,750 30,828 28,242 33,894 44,710 25,475 29,811 30,7792003 40,050 33,708 31,658 28,959 21,070 28,848 32,202 30,865 31,849 28,860 30,747 28,018 33,849 44,899 25,848 30,268 31,5222004 41,137 34,420 32,505 29,732 21,961 31,137 32,815 31,642 32,499 29,358 31,125 28,168 34,493 46,359 26,267 31,394 32,235
2005 41,961 35,075 32,964 30,312 22,783 32,637 33,528 32,049 33,199 29,692 31,380 28,144 35,111 47,306 26,754 32,300 32,6842006 42,725 35,798 33,417 30,929 23,884 34,273 34,481 32,789 34,194 30,148 32,347 28,554 36,243 47,996 27,456 33,482 33,4182007 43,170 36,377 34,119 31,652 25,021 35,428 35,396 33,446 34,608 30,667 33,184 28,789 37,415 48,991 28,010 34,086 34,2092008 43,250 36,123 34,254 31,446 25,498 33,978 35,868 33,616 34,013 30,624 33,663 28,245 38,035 49,416 27,747 33,744 34,356
NA = Not availableNote: Data for Germany for years before 1991 pertain to the former West Germany.
III. Tables

- 13 -
Table 2. Real GDP per capita (average annual rates of change)
Country 1979-2008 1979-1990 1990-1995 1995-2000 2000-2008 2002-2003 2003-2004 2004-2005 2005-2006 2006-2007 2007-2008
United States 1.8 2.0 1.2 2.9 1.2 1.6 2.7 2.0 1.8 1.0 0.2
Canada 1.6 1.5 0.6 3.2 1.3 0.9 2.1 1.9 2.1 1.6 -0.7Australia 1.9 1.7 1.5 3.0 1.7 1.7 2.7 1.4 1.4 2.1 0.4Japan 1.9 3.3 1.2 0.8 1.2 1.2 2.7 1.9 2.0 2.3 -0.7Republic of Korea 5.3 6.5 6.7 3.5 3.9 2.3 4.2 3.7 4.8 4.8 1.9Singapore 4.3 5.3 5.7 3.5 2.5 5.3 7.9 4.8 5.0 3.4 -4.1
Austria 1.9 2.0 1.4 2.8 1.6 0.4 1.9 2.2 2.8 2.7 1.3Belgium 1.8 2.1 1.2 2.5 1.3 0.6 2.5 1.3 2.3 2.0 0.5Denmark 1.7 1.8 2.0 2.4 0.9 0.1 2.0 2.2 3.0 1.2 -1.7France 1.5 1.8 0.7 2.4 1.0 0.4 1.7 1.1 1.5 1.7 -0.1Germany 1.6 1.9 1.5 1.9 1.2 -0.3 1.2 0.8 3.1 2.6 1.4Italy 1.5 2.4 1.2 1.9 0.2 -0.8 0.5 -0.1 1.5 0.8 -1.9Netherlands 1.9 1.6 1.6 3.4 1.5 -0.1 1.9 1.8 3.2 3.2 1.7Norway 2.4 2.3 3.2 3.1 1.6 0.4 3.3 2.0 1.5 2.1 0.9Spain 2.1 2.4 1.2 3.5 1.4 1.5 1.6 1.9 2.6 2.0 -0.9Sweden 1.8 1.9 0.1 3.2 1.9 1.5 3.7 2.9 3.7 1.8 -1.0United Kingdom 2.1 2.1 1.4 3.1 1.9 2.4 2.3 1.4 2.2 2.4 0.4
Note: Data for Germany for years before 1991 pertain to the former West Germany. Percent changes were calculated from table 1 using the compound rate method.

- 14 -
Table 3. Real GDP per employed personConverted to U.S. dollars using 2005 PPPs
(2005 U.S. dollars)
Year United Rep. of Nether- UnitedStates Canada Australia Japan Korea Singapore Austria Belgium Denmark France Germany Italy lands Norway Spain Sweden Kingdom
1960 41,409 37,322 32,804 11,429 NA NA 20,529 26,247 25,342 22,247 23,481 20,079 30,834 29,241 NA 24,309 26,8621961 42,356 37,918 32,527 12,616 NA NA 21,501 27,349 26,446 23,358 24,231 21,589 31,272 30,614 NA 25,484 27,2021962 44,141 39,453 33,584 13,544 NA NA 22,120 28,337 27,482 24,969 25,273 22,995 31,976 31,266 NA 26,425 27,3651963 45,439 40,605 34,583 14,610 7,324 NA 23,181 29,363 27,273 26,341 25,922 24,695 32,587 32,318 NA 27,695 28,4791964 47,048 41,754 35,649 16,006 7,891 NA 24,622 30,964 29,112 27,750 27,625 25,474 34,779 33,842 NA 29,165 29,645
1965 48,869 42,844 36,206 16,656 7,919 NA 25,497 31,943 29,961 29,023 28,940 26,965 36,313 35,315 NA 30,072 30,0051966 50,543 43,900 35,718 17,975 8,656 NA 27,161 32,836 30,152 30,334 29,839 29,053 37,042 36,504 NA 30,658 30,5171967 50,615 43,809 37,243 19,564 8,848 NA 28,442 34,259 31,852 31,762 30,749 30,755 39,126 38,559 NA 32,031 31,6331968 51,965 45,030 38,360 21,485 9,376 NA 30,109 35,738 33,404 33,277 32,398 32,785 41,363 39,392 NA 32,848 33,1181969 52,282 45,854 39,979 23,821 10,417 NA 32,058 37,471 34,893 35,149 34,282 35,036 43,452 40,808 NA 33,857 33,806
1970 52,079 46,685 40,934 25,974 10,939 NA 34,273 39,823 34,950 36,820 35,558 36,726 45,580 40,961 NA 35,356 34,6601971 53,621 47,439 41,570 26,924 11,449 NA 35,633 40,996 36,052 38,587 36,497 37,381 47,266 42,903 29,451 35,760 35,4131972 54,846 48,558 41,868 29,038 11,461 NA 37,568 43,253 36,818 40,158 37,898 38,861 49,365 44,648 31,463 36,459 36,5991973 56,155 49,424 42,532 30,677 12,180 NA 38,861 45,407 37,731 42,220 39,275 41,049 52,030 46,318 33,068 37,764 38,6381974 54,847 49,151 42,734 30,429 12,507 NA 39,875 46,568 37,730 43,734 39,835 42,645 53,303 47,459 34,799 38,213 38,046
1975 55,360 49,141 43,784 31,448 12,945 NA 40,026 46,548 37,767 43,693 40,422 41,721 53,717 49,027 35,695 38,431 37,9621976 56,469 50,682 44,941 32,432 13,482 NA 41,718 49,406 39,399 45,278 42,801 44,246 55,805 50,188 37,282 38,704 39,1911977 57,033 51,544 44,986 33,455 14,367 NA 43,281 49,841 40,279 46,512 43,956 45,240 56,033 50,855 38,590 38,010 40,0931978 57,746 51,999 45,904 34,878 14,999 NA 43,003 51,164 40,901 48,118 44,907 46,552 56,987 51,918 40,148 38,531 41,1801979 57,949 51,729 47,002 36,417 15,793 NA 45,157 51,782 42,114 49,565 46,029 48,783 57,136 53,435 41,094 39,436 41,862
1980 57,537 51,345 47,028 37,188 15,466 NA 45,547 54,087 42,281 50,270 45,775 49,738 56,140 54,520 42,634 39,666 41,1591981 58,333 51,640 47,982 37,989 16,021 NA 45,661 54,948 42,604 50,928 45,869 50,198 55,395 54,663 43,623 39,523 41,6881982 57,674 51,804 48,008 38,723 16,769 NA 47,195 56,006 44,045 52,104 45,986 50,303 54,992 54,715 44,549 40,070 43,4161983 59,503 52,832 48,649 38,760 18,414 NA 48,913 56,759 45,209 52,890 47,470 50,727 57,184 56,947 45,496 40,702 45,3201984 61,286 54,534 50,179 39,834 20,011 NA 48,987 58,272 46,403 54,012 48,728 52,367 58,205 59,853 47,367 42,090 45,556
1985 62,557 55,541 51,480 41,633 20,600 NA 50,044 58,906 47,156 55,139 49,349 53,327 58,060 61,356 48,969 42,573 46,6111986 63,304 55,191 50,431 42,646 22,001 NA 51,052 59,584 48,332 56,281 49,817 54,478 58,748 61,808 49,417 43,522 48,1871987 63,812 55,924 51,503 44,090 23,175 NA 51,770 60,641 48,256 57,244 50,190 56,088 59,826 61,654 49,774 44,670 49,4121988 65,035 56,981 51,643 46,532 24,859 NA 52,797 62,596 48,571 59,335 51,656 57,820 60,162 61,890 50,539 45,240 50,2571989 66,009 57,187 51,798 48,283 25,491 NA 54,116 63,768 49,067 60,783 52,760 59,374 61,550 64,338 51,126 45,828 50,114
1990 66,465 56,905 51,623 49,961 27,017 36,667 55,312 64,820 50,135 61,897 54,160 59,643 62,085 66,166 51,118 45,868 50,2801991 66,975 56,705 52,222 50,606 28,661 37,733 56,451 65,938 51,087 62,458 55,511 59,445 61,961 68,903 51,797 46,044 50,9211992 68,845 57,775 53,551 50,527 29,770 39,096 57,190 67,253 52,720 63,681 57,584 60,342 61,755 71,481 53,016 47,608 52,2381993 69,748 58,847 55,409 50,461 31,227 41,799 57,671 67,109 53,508 63,923 57,889 61,457 62,604 72,956 54,002 49,202 53,9161994 70,982 60,434 56,391 50,962 32,844 44,673 58,930 69,538 56,671 65,244 59,489 63,831 64,004 75,608 55,550 51,638 55,807
1995 71,756 61,045 56,250 51,890 34,861 45,427 60,537 70,645 57,515 66,039 60,477 65,766 64,109 77,170 56,016 52,834 56,8421996 73,400 61,480 57,790 53,094 36,516 46,358 61,640 71,266 58,427 66,522 61,246 66,109 64,962 79,499 56,558 54,039 57,9511997 75,059 62,767 59,657 53,554 37,564 47,271 62,496 73,105 59,293 67,713 62,409 67,137 65,651 81,399 57,081 56,088 58,8291998 77,086 63,768 61,340 53,082 37,228 47,160 64,095 72,927 59,659 69,035 62,924 67,411 66,282 81,412 57,393 57,262 60,3391999 79,326 65,618 63,099 53,747 40,051 49,578 65,249 74,460 60,605 69,902 63,332 67,664 67,566 82,301 58,014 58,662 61,580
2000 80,222 67,389 63,606 55,630 41,673 51,839 67,000 75,757 62,309 70,738 64,163 68,829 68,390 84,499 58,890 59,776 63,2582001 80,777 67,755 64,216 56,157 42,438 50,611 66,866 75,273 62,062 70,791 64,674 68,693 67,943 85,879 59,155 59,163 64,2892002 82,285 68,073 65,686 57,200 44,247 53,251 68,031 76,519 62,272 71,076 65,038 67,845 67,177 86,835 59,448 60,560 65,1432003 83,520 67,757 66,089 58,199 45,549 55,593 68,624 77,241 63,258 71,758 65,517 66,832 67,785 88,629 59,421 62,078 66,3372004 85,624 68,674 67,309 59,667 46,770 58,797 69,405 78,979 65,092 73,452 66,045 67,558 69,439 91,625 59,306 65,094 67,456
2005 86,641 69,676 67,058 60,591 47,985 60,012 70,362 79,411 65,968 74,431 66,605 67,612 70,825 93,000 59,065 67,063 68,1632006 87,437 70,470 67,563 61,557 49,827 60,438 71,729 80,658 66,839 75,342 68,146 67,662 71,874 91,791 58,956 68,749 69,5002007 88,238 70,746 68,328 62,763 51,741 59,530 72,618 81,419 66,144 76,063 68,644 67,875 72,582 90,905 59,242 69,002 71,1302008 89,626 69,991 68,198 62,578 52,568 55,694 72,622 80,976 64,840 75,989 68,547 66,959 72,995 90,074 60,283 68,219 71,121
NA = Not availableNote: Data for Germany for years before 1991 pertain to the former West Germany.
- 15 -
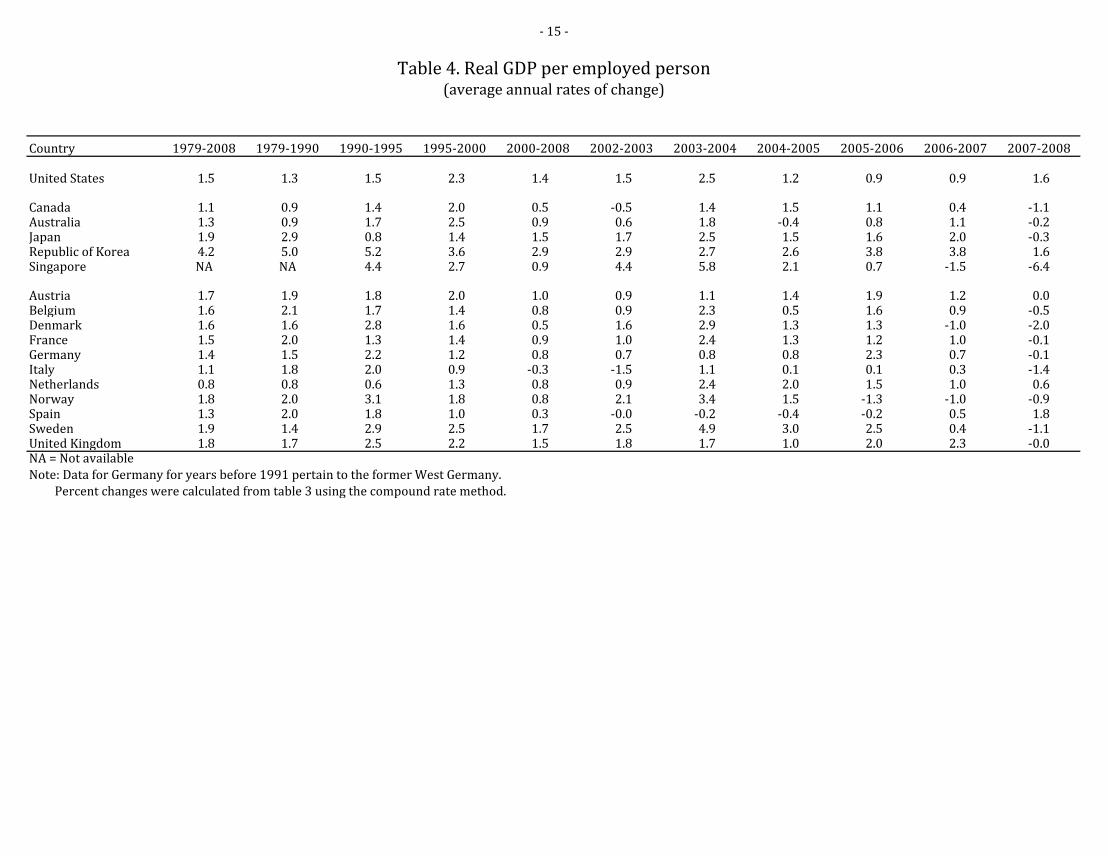
Table 4. Real GDP per employed person(average annual rates of change)
Country 1979-2008 1979-1990 1990-1995 1995-2000 2000-2008 2002-2003 2003-2004 2004-2005 2005-2006 2006-2007 2007-2008
United States 1.5 1.3 1.5 2.3 1.4 1.5 2.5 1.2 0.9 0.9 1.6
Canada 1.1 0.9 1.4 2.0 0.5 -0.5 1.4 1.5 1.1 0.4 -1.1Australia 1.3 0.9 1.7 2.5 0.9 0.6 1.8 -0.4 0.8 1.1 -0.2Japan 1.9 2.9 0.8 1.4 1.5 1.7 2.5 1.5 1.6 2.0 -0.3Republic of Korea 4.2 5.0 5.2 3.6 2.9 2.9 2.7 2.6 3.8 3.8 1.6Singapore NA NA 4.4 2.7 0.9 4.4 5.8 2.1 0.7 -1.5 -6.4
Austria 1.7 1.9 1.8 2.0 1.0 0.9 1.1 1.4 1.9 1.2 0.0Belgium 1.6 2.1 1.7 1.4 0.8 0.9 2.3 0.5 1.6 0.9 -0.5Denmark 1.6 1.6 2.8 1.6 0.5 1.6 2.9 1.3 1.3 -1.0 -2.0France 1.5 2.0 1.3 1.4 0.9 1.0 2.4 1.3 1.2 1.0 -0.1Germany 1.4 1.5 2.2 1.2 0.8 0.7 0.8 0.8 2.3 0.7 -0.1Italy 1.1 1.8 2.0 0.9 -0.3 -1.5 1.1 0.1 0.1 0.3 -1.4Netherlands 0.8 0.8 0.6 1.3 0.8 0.9 2.4 2.0 1.5 1.0 0.6Norway 1.8 2.0 3.1 1.8 0.8 2.1 3.4 1.5 -1.3 -1.0 -0.9Spain 1.3 2.0 1.8 1.0 0.3 -0.0 -0.2 -0.4 -0.2 0.5 1.8Sweden 1.9 1.4 2.9 2.5 1.7 2.5 4.9 3.0 2.5 0.4 -1.1United Kingdom 1.8 1.7 2.5 2.2 1.5 1.8 1.7 1.0 2.0 2.3 -0.0NA = Not availableNote: Data for Germany for years before 1991 pertain to the former West Germany. Percent changes were calculated from table 3 using the compound rate method.

- 16 -
Table 5. Real GDP per hour workedConverted to U.S. dollars using 2005 PPPs
(2005 U.S. dollars)
Year United Rep. of Nether- UnitedStates Canada Australia Japan Korea Singapore Austria Belgium Denmark France Germany Italy lands Norway Spain Sweden Kingdom
1970 27.24 24.32 NA NA NA NA NA 21.23 18.55 17.97 18.71 NA NA 22.32 NA NA NA1971 28.28 24.94 NA NA NA NA NA 21.97 19.44 18.86 19.50 NA NA 23.66 NA NA 19.501972 28.98 25.68 NA NA NA NA NA 23.49 20.48 20.17 20.55 NA NA 25.08 NA NA 19.921973 29.70 26.19 NA NA NA NA NA 25.05 21.51 21.38 21.65 NA NA 26.23 NA NA 20.931974 29.44 26.25 NA NA NA NA NA 26.09 21.65 22.52 22.33 NA NA 27.20 NA NA 20.77
1975 30.25 26.47 NA NA NA NA NA 26.21 22.55 22.83 23.17 NA NA 28.37 NA NA 21.071976 30.97 27.73 NA NA NA NA NA 27.77 23.39 23.33 24.07 NA NA 29.97 NA NA 21.841977 31.29 28.30 NA NA NA NA NA 28.43 24.25 24.46 25.13 NA NA 31.04 21.01 NA 22.221978 31.55 28.46 24.64 NA NA NA NA 29.46 24.90 25.73 26.03 NA NA 32.41 22.12 NA 22.801979 31.69 28.36 25.35 NA NA NA NA 30.11 25.75 26.54 26.88 NA NA 33.82 23.27 NA 23.21
1980 31.71 28.54 25.71 NA 5.52 NA NA 31.82 25.49 27.03 26.96 26.76 NA 34.51 24.32 25.91 23.211981 32.44 28.71 26.10 NA 5.75 NA NA 32.77 26.11 27.66 27.26 26.91 NA 34.81 25.27 25.96 24.001982 32.29 29.13 26.83 NA 5.77 NA NA 33.68 26.83 29.50 27.35 26.81 NA 35.10 25.80 26.08 25.051983 33.16 29.76 27.35 NA 6.39 NA NA 34.01 27.60 30.24 28.27 27.04 NA 36.66 26.83 26.33 26.241984 33.83 30.64 27.85 NA 6.98 NA NA 34.42 28.42 31.01 29.14 28.07 NA 38.66 28.53 27.19 26.28
1985 34.44 30.97 28.69 NA 7.19 NA NA 34.69 29.13 32.30 29.99 28.64 NA 39.78 29.81 27.43 26.851986 35.22 30.83 28.00 NA 7.85 NA NA 35.49 29.80 33.07 30.42 29.13 NA 40.18 30.08 28.07 27.841987 35.45 31.05 28.34 NA 8.04 NA NA 36.44 30.40 33.39 30.77 29.68 NA 40.81 31.20 28.63 28.461988 35.85 31.31 28.58 NA 8.57 NA NA 37.89 30.95 34.42 31.72 30.54 NA 40.90 31.59 28.63 28.821989 36.12 31.52 28.69 NA 8.99 NA NA 38.79 31.62 35.58 32.87 31.63 NA 42.59 31.79 29.02 28.67
1990 36.73 31.67 28.88 NA 9.66 15.16 NA 39.14 32.58 36.31 34.56 31.95 NA 44.04 31.79 29.12 28.971991 37.20 31.98 29.17 NA 10.32 15.57 NA 40.73 33.31 36.86 35.86 31.97 NA 45.93 32.38 29.48 29.771992 38.40 32.61 29.68 NA 10.90 16.13 NA 42.09 33.92 37.58 36.77 32.39 NA 47.34 33.21 30.14 30.661993 38.53 32.73 30.93 NA 11.40 17.21 NA 43.18 34.41 38.01 37.35 32.99 NA 48.41 34.02 30.81 31.701994 38.86 33.31 31.29 NA 12.05 18.32 NA 44.75 36.61 38.95 38.45 34.38 NA 50.24 35.06 31.58 32.60
1995 38.88 33.83 31.25 NA 12.77 18.55 32.71 44.71 37.34 40.01 39.43 35.38 42.25 51.87 35.19 32.21 33.141996 39.82 33.77 32.65 27.77 13.43 18.89 33.06 45.86 38.17 40.19 40.35 35.29 42.60 53.62 35.53 32.69 33.791997 40.42 34.80 33.21 28.44 14.05 19.22 33.30 46.65 38.40 41.07 41.37 36.03 43.36 55.09 35.63 33.83 34.331998 41.22 35.51 34.14 28.53 14.29 19.42 34.06 46.21 38.26 42.16 41.86 35.86 44.26 55.17 35.56 34.57 35.281999 42.23 36.46 35.21 29.16 15.28 20.37 34.71 47.10 38.63 42.87 42.46 36.08 45.26 55.84 35.60 35.24 36.18
2000 43.20 37.54 35.45 29.95 15.84 21.21 35.57 48.75 39.40 44.45 43.56 36.98 46.07 58.07 35.62 36.40 37.512001 44.06 37.95 36.81 30.55 16.19 21.07 35.38 47.73 39.11 44.85 44.35 37.27 46.38 60.09 35.87 36.56 38.072002 45.36 38.49 37.53 31.38 17.09 22.26 36.11 48.46 39.44 46.24 45.00 37.05 46.69 61.41 36.10 37.97 38.972003 46.74 38.63 37.59 31.92 17.84 23.24 36.26 49.04 40.12 46.82 45.53 36.61 47.32 63.37 36.41 39.25 39.912004 47.90 38.75 38.71 32.66 18.47 24.42 36.53 50.99 41.21 47.05 45.82 37.00 48.87 64.65 36.66 40.55 40.67
2005 48.56 39.54 38.34 33.41 19.18 24.82 37.33 50.74 41.78 47.76 46.45 37.17 49.83 65.49 36.97 41.78 40.992006 49.01 40.05 39.22 33.78 20.00 25.16 38.21 51.34 42.18 49.06 47.60 37.29 50.59 64.92 37.29 42.99 41.932007 49.67 40.34 40.32 34.65 21.13 24.73 39.01 51.99 41.36 48.99 47.89 37.25 51.02 64.14 37.95 42.73 42.852008 50.69 40.12 39.08 34.97 21.98 23.13 39.38 51.71 40.34 48.99 47.89 36.74 51.44 63.35 38.62 41.98 42.94
NA = Not availableNote: Data for Germany for years before 1991 pertain to the former West Germany.

- 17 -
Table 6. Real GDP per hour worked(average annual rates of change)
Country 1979-2008 1979-1990 1990-1995 1995-2000 2000-2008 2002-2003 2003-2004 2004-2005 2005-2006 2006-2007 2007-2008
United States 1.6 1.4 1.1 2.1 2.0 3.0 2.5 1.4 0.9 1.3 2.1
Canada 1.2 1.0 1.3 2.1 0.8 0.4 0.3 2.0 1.3 0.7 -0.6Australia 1.5 1.2 1.6 2.6 1.2 0.2 3.0 -1.0 2.3 2.8 -3.1Japan NA NA NA NA 2.0 1.7 2.3 2.3 1.1 2.6 0.9Republic of Korea NA NA 5.7 4.4 4.2 4.4 3.5 3.9 4.3 5.6 4.0Singapore NA NA 4.1 2.7 1.1 4.4 5.1 1.6 1.4 -1.7 -6.4
Austria NA NA NA 1.7 1.3 0.4 0.7 2.2 2.4 2.1 0.9Belgium 1.9 2.4 2.7 1.7 0.7 1.2 4.0 -0.5 1.2 1.3 -0.5Denmark 1.6 2.2 2.8 1.1 0.3 1.7 2.7 1.4 0.9 -1.9 -2.5France 2.1 2.9 2.0 2.1 1.2 1.3 0.5 1.5 2.7 -0.1 -0.0Germany 2.0 2.3 2.7 2.0 1.2 1.2 0.6 1.4 2.5 0.6 0.0Italy NA NA 2.1 0.9 -0.1 -1.2 1.1 0.5 0.3 -0.1 -1.4Netherlands NA NA NA 1.8 1.4 1.4 3.3 2.0 1.5 0.9 0.8Norway 2.2 2.4 3.3 2.3 1.1 3.2 2.0 1.3 -0.9 -1.2 -1.2Spain 1.8 2.9 2.1 0.2 1.0 0.9 0.7 0.8 0.9 1.8 1.8Sweden NA NA 2.0 2.5 1.8 3.4 3.3 3.1 2.9 -0.6 -1.8United Kingdom 2.1 2.0 2.7 2.5 1.7 2.4 1.9 0.8 2.3 2.2 0.2NA = Not availableNote: Data for Germany for years before 1991 pertain to the former West Germany. Percent changes were calculated from table 5 using the compound rate method.

- 18 -
Table 7. Employment-population ratios(percent)
Year United Rep. of Nether- UnitedStates Canada Australia Japan Korea Singapore Austria Belgium Denmark France Germany Italy lands Norway Spain Sweden Kingdom
1960 37.8 34.9 40.4 49.9 NA NA 48.8 38.5 46.6 42.8 49.8 41.7 40.0 42.7 NA 48.8 46.11961 37.2 34.7 39.5 50.5 NA NA 48.8 38.6 46.9 42.4 49.9 41.7 40.1 43.0 NA 49.0 46.21962 37.3 35.0 39.7 50.6 NA NA 48.3 39.1 47.3 41.6 49.5 41.3 40.3 42.8 NA 49.0 46.01963 37.2 35.2 40.1 50.5 27.7 NA 47.6 39.0 47.5 41.2 49.1 40.3 40.3 42.7 NA 49.0 45.81964 37.5 35.7 40.7 50.8 27.5 NA 47.3 39.2 48.1 41.2 48.6 39.8 40.5 42.5 NA 49.3 46.1
1965 38.0 36.4 41.1 50.5 28.3 NA 46.6 39.0 48.6 41.0 48.4 38.5 40.3 42.5 NA 49.2 46.31966 38.7 37.2 42.2 51.7 28.3 NA 45.9 38.9 49.0 40.9 47.8 37.6 40.0 42.4 NA 48.8 46.11967 39.2 37.7 42.5 52.1 28.6 NA 44.8 38.5 48.6 40.7 46.1 37.8 39.5 42.3 NA 47.9 45.31968 39.6 37.8 42.8 52.5 29.4 NA 44.0 38.3 48.6 40.2 46.0 37.5 39.4 41.9 NA 48.1 44.91969 40.2 38.5 43.0 52.4 29.4 NA 43.8 38.9 49.3 40.5 46.3 37.1 39.6 41.9 NA 48.7 44.7
1970 39.9 38.4 43.8 51.9 29.8 NA 43.7 38.9 49.4 40.6 46.4 37.0 39.6 42.3 NA 49.2 44.41971 39.6 38.2 42.9 51.6 30.2 NA 44.0 39.1 49.0 40.4 46.1 36.9 39.4 42.4 41.9 48.7 44.21972 40.3 38.9 42.8 51.1 31.0 NA 44.1 38.8 49.7 40.3 46.0 36.6 38.6 42.6 41.9 48.8 44.21973 41.2 40.4 43.4 51.6 32.1 NA 44.4 39.0 50.1 40.5 46.3 36.8 38.3 42.6 42.5 48.9 44.71974 41.6 41.5 43.2 50.7 32.9 NA 44.9 39.5 49.4 40.6 45.7 37.2 38.4 42.9 42.3 49.7 44.8
1975 40.8 41.7 42.5 49.9 33.1 NA 44.7 38.8 48.6 40.1 44.6 37.0 37.8 43.3 41.0 50.5 44.71976 41.7 41.9 42.5 49.8 34.6 NA 45.0 38.6 49.3 40.2 44.6 37.2 37.7 44.6 40.1 50.5 44.41977 42.7 42.2 42.7 49.9 35.2 NA 45.5 38.4 49.1 40.3 44.7 37.1 38.2 45.6 39.3 50.4 44.51978 44.1 43.0 42.3 50.0 36.3 NA 45.8 38.4 49.3 40.4 45.2 37.1 38.4 46.2 37.8 50.4 44.71979 44.8 44.4 42.6 50.1 36.2 NA 46.0 38.7 49.6 40.4 45.9 37.4 38.8 46.7 36.7 51.0 45.1
1980 44.5 45.2 43.3 50.0 35.9 NA 46.4 38.6 49.2 40.3 46.4 37.9 39.7 47.7 35.7 51.5 44.81981 44.6 45.9 43.5 50.1 36.2 NA 46.1 37.9 48.4 39.9 46.3 37.8 39.6 48.1 34.6 51.5 43.71982 43.8 43.9 42.7 50.1 36.6 NA 45.5 37.4 48.6 39.7 45.8 37.8 39.2 48.0 34.1 51.4 42.81983 44.0 43.8 41.4 50.5 36.3 NA 45.3 37.0 48.6 39.4 45.3 38.0 38.4 47.7 33.9 51.5 42.51984 45.4 44.5 42.1 50.4 35.7 NA 45.2 36.9 49.4 39.0 45.6 37.9 38.7 48.0 33.0 51.9 43.4
1985 45.9 45.4 42.9 50.3 36.7 NA 45.3 37.1 50.5 38.6 46.0 38.3 39.6 49.1 32.5 52.3 43.81986 46.5 46.3 44.0 50.3 37.6 NA 45.4 37.3 51.7 38.6 46.6 38.6 40.0 50.6 33.2 52.5 44.01987 47.2 47.0 44.3 50.3 39.3 NA 45.4 37.5 51.8 38.7 46.9 38.6 39.8 51.4 34.7 52.8 44.71988 47.8 47.8 45.3 50.7 40.1 NA 45.7 37.9 51.4 38.8 47.0 39.0 40.7 50.8 35.8 53.2 46.11989 48.3 48.0 46.4 51.2 41.4 NA 46.0 38.4 51.1 39.2 47.2 39.3 41.3 49.1 37.0 53.7 47.1
1990 48.3 47.6 46.6 51.9 42.2 48.5 46.6 38.8 50.8 39.3 47.7 39.9 42.3 48.5 38.4 53.7 47.21991 47.3 46.2 44.9 52.8 43.1 48.8 46.7 38.7 50.3 39.2 48.3 40.6 43.1 47.8 38.7 52.6 45.81992 46.9 45.2 44.2 53.2 43.5 48.6 46.4 38.4 49.6 38.7 47.2 40.3 43.7 47.5 38.1 49.9 44.61993 46.9 44.9 43.9 53.2 43.5 49.6 45.9 38.0 48.6 38.1 46.3 39.2 43.3 47.5 36.9 47.1 44.11994 47.4 45.3 44.8 53.1 44.5 50.1 45.7 37.7 48.3 38.0 46.1 38.5 43.3 47.9 36.6 46.3 44.3
1995 47.5 45.7 46.0 53.1 45.3 51.7 45.5 37.9 48.8 38.2 46.0 38.4 44.4 48.6 37.2 46.8 44.71996 47.6 45.6 46.0 53.2 45.8 52.5 45.7 37.9 49.1 38.2 45.8 38.6 45.1 49.4 37.7 46.3 45.01997 48.0 46.1 45.9 53.4 46.2 53.9 45.9 38.2 49.7 38.2 45.7 38.7 46.3 50.5 38.7 45.7 45.71998 48.1 46.8 46.4 52.6 43.1 51.5 46.3 38.8 50.3 38.7 46.2 39.1 47.4 51.6 40.0 46.5 46.01999 48.3 47.7 46.6 51.8 43.5 52.1 47.0 39.2 50.6 39.3 46.8 39.5 48.3 51.7 41.1 47.4 46.5
2000 49.0 48.4 47.2 51.4 45.0 53.9 47.3 39.9 50.8 40.1 47.6 40.3 49.3 51.6 42.1 48.5 46.92001 48.5 48.4 47.1 50.9 45.6 52.5 47.4 40.3 51.2 40.5 47.7 41.1 50.2 51.6 42.7 49.4 47.12002 47.9 49.1 47.4 50.0 46.6 51.4 47.2 40.1 51.1 40.4 47.4 41.6 50.5 51.5 42.9 49.2 47.22003 48.0 49.7 47.9 49.8 46.3 51.9 46.9 40.0 50.3 40.2 46.9 41.9 49.9 50.7 43.5 48.8 47.52004 48.0 50.1 48.3 49.8 47.0 53.0 47.3 40.1 49.9 40.0 47.1 41.7 49.7 50.6 44.3 48.2 47.8
2005 48.4 50.3 49.2 50.0 47.5 54.4 47.7 40.4 50.3 39.9 47.1 41.6 49.6 50.9 45.3 48.2 47.92006 48.9 50.8 49.5 50.2 47.9 56.7 48.1 40.7 51.2 40.0 47.5 42.2 50.4 52.3 46.6 48.7 48.12007 48.9 51.4 49.9 50.4 48.4 59.5 48.7 41.1 52.3 40.3 48.3 42.4 51.5 53.9 47.3 49.4 48.12008 48.3 51.6 50.2 50.3 48.5 61.0 49.4 41.5 52.5 40.3 49.1 42.2 52.1 54.9 46.0 49.5 48.3
NA = Not availableNote: Data for Germany for years before 1991 pertain to the former West Germany.

- 19 -
Table 8. Purchasing power parities (PPPs), exchange rates, and relative prices, 2005
PPPs for GDP Exchange Relative(U.S.=1.000) rates prices1
United States 1.000 1.000 1.00
Canada 1.214 1.212 1.00Australia 1.388 1.311 1.06Japan 129.6 110.1 1.18Republic of Korea 788.9 1024 0.77Singapore 1.446 1.664 0.87
Austria 0.886 0.803 1.10Belgium 0.900 0.803 1.12Denmark 8.590 5.995 1.43France 0.923 0.803 1.15Germany 0.867 0.803 1.08Italy 0.867 0.803 1.08Netherlands 0.896 0.803 1.12Norway 8.896 6.441 1.38Spain 0.765 0.803 0.95Sweden 9.378 7.471 1.26United Kingdom 0.636 0.549 1.16
1A number below one indicates that prices in this country are lower than in the United States and a number higher than one that prices are higher than in the United States.