Embed Size (px)
Citation preview

THE WILLIAM DAVIDSON INSTITUTE AT THE UNIVERSITY OF MICHIGAN BUSINESS SCHOOL
International Coercion, Emulation and Policy Diffusion: Market-Oriented Infrastructure Reforms, 1977-1999
By: Witold J. Henisz and Bennet A. Zelner and Mauro F. Guillen
William Davidson Institute Working Paper Number 713 July 2004
International Coercion, Emulation and Policy Diffusion: Market-Oriented Infrastructure Reforms, 1977-1999
WITOLD J. HENISZ The Wharton School
2021 Steinberg Hall-Dietrich Hall University of Pennsylvania
Philadelphia, PA 19104-6370 Tel: (215) 898-0788 Fax: (215) 898-0401
Email: [email protected]
BENNET A. ZELNER McDonough School of Business
G-04 Old North Georgetown University Washington, DC 20057
Tel: (202) 687-6087 Fax: (202) 687-1366
Email: [email protected]
and
MAURO F. GUILLÉN* The Wharton School
2016 Steinberg Hall-Dietrich Hall University of Pennsylvania
Philadelphia, PA 19104-6370 Tel: (215) 573-6267 Fax: (215) 898-0401
Email: [email protected]
July 21, 2004
* Corresponding author. This research was supported by the Reginald H. Jones Center for Management Policy, Strategy and Organization at the Wharton School through the General Electric Fund.

BIOGRAPHY PAGE
Witold J. Henisz is an Assistant Professor of Management at the Wharton School. He received his Ph.D. from the Haas School of Business at University of California, Berkeley. His research examines the impact of political hazards on international investment strategy. He considers both the determinants of government attempts to redistribute investor returns to the broader polity as well as the determinants of the success of individual firms in withstanding such pressure. His research has been published in such scholarly journals as Academy of Management Journal, Academy of Management Review, Administrative Science Quarterly and Strategic Management Journal. Mauro F. Guillén is the Dr. Felix Zandman Endowed Professor of International Management at the Wharton School and Professor of Sociology in the Department of Sociology of the University of Pennsylvania. He received a PhD in sociology from Yale University and a Doctorate in political economy from the University of Oviedo in his native Spain. His current research deals with the diffusion of practices and innovations in the global economy. His most recent book, The Limits of Convergence: Globalization and Organizational Change in Argentina, South Korea, and Spain, was published by Princeton University Press in 2001. Bennet A. Zelner is an Assistant Professor of Strategy and Policy at Georgetown University’s McDonough School of Business. He received his Ph.D. from the Haas School of Business at the University of California at Berkeley. His current research examines how firms manage the political, legal, regulatory and social risks and opportunities that they confront, especially in their overseas operations. His work has appeared in Academy of Management Review, Industrial and Corporate Change, Journal of Economics and Management Strategy and Strategic Organization.

International Coercion, Emulation and Policy Diffusion:
Market-Oriented Infrastructure Reforms, 1977-1999
ABSTRACT
Why do some countries adopt market-oriented reforms such as deregulation, privatization
and liberalization of competition in their infrastructure industries while others do not? Why did
the pace of adoption accelerate in the 1990s? Building on neo-institutional theory in sociology,
we argue that the domestic adoption of market-oriented reforms is strongly influenced by
international pressures of coercion and emulation. We find robust support for these arguments
with an event-history analysis of the determinants of reform in the telecommunications and
electricity sectors of as many as 205 countries and territories between 1977 and 1999. Our results
also suggest that the coercive effect of multilateral lending from the IMF, the World Bank or
Regional Development Banks is increasing over time, a finding that is consistent with anecdotal
evidence that multilateral organizations have broadened the scope of the “conditionality” terms
specifying market-oriented reforms imposed on borrowing countries. We discuss the possibility
that, by pressuring countries into policy reform, cross-national coercion and emulation may not
produce ideal outcomes.
Keywords: Privatization, deregulation, liberalization, infrastructure, International Monetary Fund
(IMF), World Bank, Multileral Institutions, Development, Reform, Globalization, Adoption,
International
JEL Classifications: O19, F02, F42, H11, L33, L96, L94, N70, P16, C41

INTRODUCTION
The last two decades of economic globalization have been accompanied—and perhaps
fueled—by a set of market-oriented policies such as trade and capital account liberalization,
privatization of state-owned enterprises, and deregulation or liberalization of competition in a
variety of industries. This trend has been particularly pronounced in critical infrastructure sectors
such as telecommunications, electricity, water, highways and airports. The efficiency gains that
market-oriented reforms offer are often assumed to be substantial in size. Nonetheless, countries
vary significantly in the time at which they have adopted market-oriented reforms in these
sectors, and some have not adopted any such reforms at all. While multiple factors explain the
diffusion patterns of such reforms, perhaps the most controversial involve the impact of
international coercion and emulation. Coercive pressures are the result of power dynamics, while
emulation takes place among actors that recognize one another as being part of a certain social
structure. The cross-national study of policymaking is therefore sociologically meaningful
because of the processes of power and influence that underlie diffusion.
While there exists a considerable body of empirical research on the cross-national
diffusion of ideas, practices and policies,1 no published study considers international coercion
1 The policies whose adoption is analyzed include social security systems (Collier and Messick 1975), oil nationalizations (Kobrin 1985), decolonization (Strang 1990), the growth of the welfare state (Strang and Chang 1993), the bureaucratization of national science policy (Finnemore 1993), currency crises (Glick and Rose 1998), environmental protection (Frank, Hironaka, and Schofer 2000a; Frank, Hironaka, and Schofer 2000b), quality certification by firms (Guler, Guillén, and Macpherson 2002), deregulation (Eising 2002; Gilardi 2003), neoliberal macroeconomic policies (Yebra 2002a; Yebra 2002b; Yebra 2003), pension privatization (Weyland 2003), current account liberalization (Biglaiser and Brown 2003), capital account liberalization (Brune and Guisinger 2003), central bank independence (McNamara and Castro 2003), right to transparency laws (Roberts 2003) and privatization (Brune, Garrett, and Kogut 2004; Kogut and Macpherson 2004). Some of these studies emphasize the coercive role of multilateral organizations or strong states (Biglaiser and Brown 2003; Brune, Garrett, and Kogut 2004; Brune and Guisinger 2003; Eising 2002; Finnemore 1993; Frank, Hironaka, and Schofer 2000a; Frank, Hironaka, and Schofer 2000b; Glick and Rose 1998; Kogut and Macpherson 2004; McNamara and Castro 2003; Roberts 2003; Strang 1990; Strang and Chang 1993), while others highlight the role of emulation among peer countries (Collier and Messick 1975; Gilardi 2003; Guler, Guillén, and Macpherson 2002; Kobrin 1985; Simmons and Elkins 2004; Weyland 2003; Yebra 2002a; Yebra 2002b; Yebra 2003).
and emulation effects simultaneously.2 In this paper, we approach the diffusion of market-
oriented policy reform in the electricity and telecommunications industries from a unified
framework drawing on neo-institutional theory. While our focus is on international explanations
of policy reform, we necessarily take into account the domestic political-economic determinants
of policy diffusion, which typically involve the government’s relative costs and benefits from
promulgating alternative sets of policies.
We begin by examining these domestic drivers of market-oriented policy reform. We
then proceed to examine the effects that international coercion and emulation have on the
diffusion process, and formulate our hypotheses. We offer an empirical test using data on
market-oriented policy reforms in two key infrastructure sectors, telecommunications and
electricity, over more than two decades, and find that international coercion and emulation are
key drivers of the diffusion process.
THE DOMESTIC AND INTERNATIONAL CONTEXTS
OF MARKET-ORIENTED REFORM
Market-oriented policy reforms became part of the international agenda in the wake of
the oil crises of the 1970s. At least among economists, a consensus emerged that “structural
rigidities” caused by government intervention and excessive regulation stood in the way of
sustainable economic growth because they tended to misallocate resources. According to this
view, a reduction in the presence of the state in the economy through privatization and
deregulation was necessary to enhance economic performance. Chile was the first country to
adopt the new set of policy prescriptions during the 1970s, followed by the U.K. and the U.S.
(Fourcade-Gourinchas and Babb 2002). Market-oriented reforms diffused to other countries
following distinct patterns shaped by both domestic and international factors. As of 1980, only
20 countries had started to deregulate and/or privatize their electricity sector (12 in the case of
2 Only two studies, both unpublished, consider coercion and emulation in tandem, those by Brune and Guisinger (2003) on capital account liberalization, and Polillo and Guillén (2004) on the adoption of central bank independence.

telecommunications). By the end of 1999, the numbers had increased to 85 and 150, respectively.
Thus, of the 205 countries and territories in the world, only 13 percent had engaged in some form
of market-oriented reform in electricity or telecommunications as of 1980; by 1999, the figure
had risen to 78 percent.3
The Domestic Context of Market-Oriented Reform
Much of the existing research on the diffusion of market-oriented reforms in
infrastructure sectors such as electricity and telecommunications focuses on the domestic
variables that influence a country’s decision to country to adopt deregulation, privatization or
liberalization. The arguments tends to borrow heavily from political economy, and highlight
variables that affect policy adoption by altering policymakers’ perceived costs and benefits of
market-oriented reform. We group these factors into demand- and supply-side pressures (Li,
Qiang, and Xu 2002).
Demand
Sector Performance. A sharp change in economic conditions, such as a macroeconomic
or sector-level crisis, often motivates major policy reform (Henisz and Zelner 2004). Because
political actors are relatively certain about the outcomes that the status quo policy will produce
but view reforms as creating uncertain long-run benefits in addition to large or uncertain short-
run (political) costs, these actors are likely to maintain the status quo (Alesina and Drazen 1991;
Drazen and Grilli 1993; Fernandez and Rodrik 1991; Nelson 1990; Tornell 1998; Williamson
1993). A sharp change in economic conditions may serve as a “focusing event” (Kingdon 1984:
106) that moves reform to the top of the policymaking agenda by increasing the short-run costs
of inaction (Hoffman 1999; Seo and Creed 2002). Only in this circumstance is radical reform
such as a shift to market-oriented policies likely to occur (Astley 1985; Jones, Baumgartner, and
True 1998; Romanelli and Tushman 1994). For example, Fourcade-Gourinchas and Babb (2002)
show that poorly mediated distributional conflict precipitated monetarist revolutions in Chile and
Britain. Empirical support for this argument can also be found in sociological studies of how
broad macroeconomic crises led to the adoption of market-oriented reform in Latin America
3 See footnote 10 for sources.

(Armijo and Faucher 2001; Lora 2000; Remmer 1998), the adoption of trade reform also in Latin
America (Biglaiser and Brown 2003), and the adoption of capital account liberalization (Brune
and Guisinger 2003) or privatization programs globally (Banerjee and Munger 2002). Clarke and
Cull’s (2002) study of bank privatization in Argentina similarly implicates micro-level
performance.
The domestic economic factors contributing to reform in many countries also include the
large financial burden that state-owned and state-operated sectors had placed on governments at
a time of increasing pressure for greater operating efficiency. Because governments used state-
owned utilities as a vehicle for providing subsidies to politically important interest groups, e.g.,
labor or the middle class, an increasing fraction of capital investment had to be financed using
general revenue rather than utility-generated profits. This imbalance became more pronounced as
countries in Latin America, Southeast Asia and the former Eastern Bloc confronted trends such
as input price increases, unprecedented demand growth and increased industrialization (Henisz
and Zelner 2004).
Because many countries failed to respond to these trends, state-owned enterprise debt
burdens grew to enormous proportions. In Thailand, for example, the debt held by the national
electric utility (EGAT) grew to more than US $4 billion by 1990, equivalent to over one quarter
of the total debt held or guaranteed by the government. In Argentina, public electricity debt
issued during the 20 years preceding the Menem presidency of 1989-99 is estimated to have
totaled US $25 billion, equal to more than one quarter of the government’s total debt and one
half of its foreign debt (Badaraco, Scholand, Erize, Perrone, and Werning 1996).
Governments turned to market-oriented reforms in large part because they expected such
reforms—especially privatization—to avert impending financial catastrophe and create a basis
for meeting demand growth. Several studies that estimate the effect of domestic economic
conditions on the adoption of telecommunications or electricity reform support this conjecture.
Petrazzini (1995) shows that poor sectoral performance was associated with market-oriented
reforms in Latin American telecommunications. Ando and Palmer (1998), Damsgaard (2003)
and White (1996) all find that incumbent performance increased the likelihood of adoption of
retail price deregulation in electricity markets. Knittel (2003) finds a similar relationship in his
study of U.S. state-level electricity regulation during the 20th century.

A larger body of empirical work provides more indirect evidence of the influence of
sector-level performance on the decision to adopt market-oriented reforms by demonstrating that
deregulation, privatization and liberalization enhance the operating and financial performance of
public utilities (D'Souza and Megginson 1999a; Megginson and Netter 2001). In the context of
telecommunications, D’Souza and Megginson (1999b) find that profitability, output, efficiency,
capital expenditure, lines in service, and average salary per employee all increased following the
privatization of 26 state-owned firms in 21 countries. The increase in these measures resulted
from efficiency gains (as opposed to price hikes), which grow further when deregulation and
liberalization accompany privatization (Gutierrez and Berg 2000; Levy and Spiller 1994). Fink,
Mattoo and Rathindran (2002) show that the combination of the creation of an independent
regulator, privatization and market liberalization is associated with an eight percent higher level
of penetration and a 21 percent higher level of productivity relative to the levels found in non-
reforming countries during a fifteen year event window. Using data on 30 countries in Africa and
Latin America, Wallsten (2001) finds that privatization improved the performance of the
telecommunications industry, especially when accompanied by with separation of the regulatory
authority from the incumbent telecommunications company. Artana, Navajas and Urbiztondo
(2001) find productivity gains of 196 percent in Argentina following deregulation and
privatization, and Petrazzini and Clark (1996) find that deregulation was more beneficial than
privatization in a sample of 26 developing countries.
Interest Groups. Regardless of the actual level of performance of state-owned utilities, the
political strength of constituencies with intensive demand for infrastructure may also influence
the incidence of reform. Chief among these constituencies are domestic industrial, foreign
industrial and urban residential customers, all of which consume a disproportionately large
quantity of infrastructure services yet also often pay relatively high rates in order to provide
politically motivated cross-subsidies to agrarian and rural consumers (Henisz and Zelner 2004;
Li, Qiang, and Xu 2002).4 Faced with such costs, domestic industrial, foreign industrial and
4 Business consumers typically represent a more stable source of demand than residential consumers do and are consequently less costly to serve. Thus, higher business rates are prima facie evidence of cross-subsidization. Even if business prices are lower than residential prices are, a cross-subsidy may still be present if the difference in prices does not fully reflect the difference in service costs.

urban residential customers may exploit their respective organizational or political advantages to
exert concerted pressure on political actors for market-oriented infrastructure reform.
Domestic industrial consumers’ organizational advantages follow from their relative
concentration as a group and their possible pre-existing affiliation with one another through
industry associations and trade groups.5 Large industrial consumers may further be able to
threaten self-supply, increasing their bargaining leverage and political influence. Foreign
industrial customers, on the other hand, may be able to use their home country governments to
sway domestic policy outcomes, or may possess scarce, inimitable technology or managerial
capabilities that the host country government desires. Urban residential consumers derive their
political influence from a different source, namely, their ability to militate for reform of
infrastructure services through peaceful or violent protests, such as occurred in Indonesia in 1997
and Argentina in 2001.
Supply
Fiscal Position. Independent of the demand for market-oriented reforms by the public or
key interest groups, the government may be predisposed to undertake such reforms when the
added short-term revenue from doing so helps alleviate an adverse fiscal position that threatens
to reduce support for incumbent political actors. Because virtually all governments employ a
form of “cash” (as opposed to accrual) accounting,6 the market-oriented reforms that facilitate
the privatization of state assets generate short-term revenue without creating an offsetting
balance sheet loss equal to the net present value of the future public revenues that state
ownership of infrastructure assets would otherwise generate. Moreover, even when the loss of
this revenue stream is implicitly noted, the increased operating efficiency that private owners of
previously state-owned assets typically achieve leads such investors to bid above the net present
5 Indeed, “producers” such as industrial firms represent the quintessential organized interest group in the economic theory of regulation. Stigler (1971) and Peltzman (1976; 1989), addressing the US private ownership context, both conceive of producers exclusively as electric utilities, and “consumers” is typically taken to signify diffuse, unorganized interests such as residential consumers.
6 Only the New Zealand government follows the conventional corporate practice of accrual accounting,

value of the assets under government ownership, creating an incentive for governments—
especially cash-strapped ones—to undertake market-oriented reforms.
Technology. Changes in technology have reduced the validity of the economic argument
that infrastructure industries are “natural monopolies” in which government ownership or strict
price regulation is necessary to safeguard consumers’ interests. A natural monopoly arises in
industries characterized by large enough economies of scale relative to the level of demand that
one single producer ends up monopolizing the market as a result of its continuously decreasing
average unit costs over the entire necessary range of production. Innovations that reduce the
impact of natural monopolies include advances in information services that permit tighter
coordination between independent upstream and downstream stages of production, electricity
generating technologies that reduce the minimum efficient scale of a generating plant, and new
digital switching technology that facilitates the sharing of telecommunications infrastructure by
multiple providers. These technological innovations have undermined traditional economic
arguments for government intervention (Gilbert and Kahn 1996; Hirsh 1989; Joskow 1987).
Political Institutions. The structure of domestic political institutions affects policymakers’
incentives (North 1990; Persson 2001; Tsebelis 2003) to adopt reforms through its influence on
the costs of effecting actual policy change as well as investor perceptions of the credibility of
reform (Henisz and Zelner 2001; Henisz 2002; Henisz 2004; Janeba 2001; Stasavage 2002).
Institutions that create effective checks and balances on individual and institutional political
actors limit the ability of such actors to alter policy unilaterally, thereby generating a status quo
bias in policy, i.e., an increased level of policy stability (Henisz 2000; Tsebelis 2003).7
Several cross-national empirical studies linking a country’s level of policy stability to its
number of veto points support this contention. Hallerberg and Basinger (1998), for example, find
that in response to tax cuts enacted by the United States in the 1980s, OECD nations with fewer
de facto veto points lowered their tax rates by a greater amount than did countries with more
checks and balances. Taking a longer term view, Franzese (1999) and Treismann (2000)
respectively find that countries with more veto points have more stable levels of government
deficits and inflation. MacIntyre (2001) proposes a nonlinear relationship between veto points
7 In macroeconomic jargon, strong institutional constraints on policymaking enhance the credibility of policy initiatives by increasing their “time consistency.”

and policy responses to the 1997 East Asian financial crisis and reports supporting qualitative
evidence. Using an unbalanced panel of 92 countries over more than two decades, Henisz (2004)
finds evidence that checks and balances reduce the volatility of fiscal expenditure and revenue.
Accordingly, a higher level of checks and balances is expected to exert a negative influence on
reform adoption by increasing policymakers’ private costs of reform.
At the same time, an increased level of checks and balances should also exert a positive
influence on reform adoption through its influence on investor perceptions. Investors provide
capital more cheaply to countries whose domestic institutional environment offers a stronger
safeguard against the future rollback or reversal of reforms (Henisz and Zelner 2004). The
increased revenue-raising potential of market-oriented reforms in an institutional setting with
strong checks and balances thus increases political actors’ potential benefit from adopting such
reforms.
Evidence on market-oriented reforms in telecommunications and electricity is consistent
with the position that checks and balances promote successful reforms. A growing body of
literature argues that a central driver of infrastructure reform is the ability of a political system to
support credible government commitments not to intervene arbitrarily or capriciously in the
operating practices of private infrastructure service providers (Heller and McCubbins 1996;
Henisz and Zelner 2004; Holburn and Spiller 2003; Levy and Spiller 1994; Levy and Spiller
1996; Spiller 1993; Spiller 1996). Investors that perceive their returns to be at risk due to
government discretion over relevant prices, regulation, taxation, labor policy and the like tend to
invest less, front-load their returns, shun market-oriented competition or expend resources that
would otherwise be operationally employed on non-market risk-reduction activities such as
lobbying. Quantitative analysis of investment decisions in telecommunications (Henisz and
Zelner 2001) and electricity (Henisz and Zelner 2002) reinforces the findings in the earlier
qualitative studies.
In sum, governments tend to adopt market-oriented reforms in response to domestic
factors such as falling sectoral performance, interest-group pressures, a deteriorating fiscal
position and technological changes that reduce minimum efficient scale. The “net” effect of
checks and balances on policymaking discretion on adoption is ambiguous. The empirical
literature has found support for these arguments using data from a variety of industries and parts
of the world. In this paper, we measure and account for each of the domestic factors affecting
market-oriented reforms, focusing our attention on the international context of policy diffusion.
The International Context of Market-Oriented Reform
Our theoretical arguments build on Ikenberry’s (1990) observation that “privatization
programs across developed and developing countries can be understood only with an
appreciation of their international context.” Following neo-institutional analysis in sociology, we
propose coercion and emulation as the two basic mechanisms that underlie policy diffusion
across countries. We base this argument on the assumption that nation-states are in economic,
political and cultural competition with one another. Thus, they are influenced by power
dynamics, and borrow policy ideas and practices from other countries in order to maintain their
position and status in the global system of states (Gilpin 1987; Gilpin 2000; Meyer, Boli,
Thomas, and Ramirez 1997).
Coercion
Neo-institutional theory refers to the exertion of pressures for homogeneity by the state
and other powerful actors as coercive isomorphism (DiMaggio and Powell 1983). Although
much neo-institutional theorizing focuses on the domestic context, scholars have also applied the
concept of coercive isomorphism to the interaction among countries. Meyer et al. (1997: 157)
argue that “the expanding externally defined requirements of rational actorhood” increase the
proclivity of more dependent actors or states in the global system to adopt formal structures or
practices. In a global economy, most countries have become interdependent with (or dependent
on) other countries in trade, credit and foreign investment. This interdependency induces status
competition among states (Van Rossem 1996). Countries (or groups of countries) with more
power in the international system, or that are viewed as possessing high status, shape the policies
adopted by countries that are less powerful or considered less legitimate (Gilpin 1987).
International coercion occurs when powerful actors influence the policy choices of
governments directly, or when such actors alter the outcome of a domestic policy struggle by
favoring the domestic coalition supporting a given policy. The former concept of “direct
coercion” implies that domestic groups or parties that set policy simply acquiesce to international
pressures. This depiction may sometimes approximate reality, for example, in the case of

intervention by the International Monetary Fund (IMF) in the wake of a macroeconomic or
financial crisis. Despite the fact that governments “do not want to sacrifice their sovereignty and
have conditions imposed… they need the IMF loan and therefore accept IMF conditions because
they have no choice” (Vreeland 2003).
The concept of indirect coercion entails the more frequent and perhaps realistic
assumption that there exists a diversity of views about market-oriented reforms in any given
country. Domestic groups may hold different views about a market-oriented reform as a result of
their ideology or their economic interests.8 If groups have different positions on a prospective
market-oriented reform, then the intervention of an outsider or third party can tilt the balance of
power toward the group those favoring the reform by providing that group with more resources,
legitimacy or rhetorical arguments, and by prompting groups to join the pro-reform coalition.
The literature on IMF lending practices argues that intervention by external actors who provide
short-term resources conditional on the implementation of a reform, and threaten subsequent
direct or indirect punishments if that reform is not implemented, may alter the domestic political
balance of power in favor of reform (Boughton 2003; Dixit 1996; Pierre 1997; Putnam 1993;
Spaventa 1983; Vreeland 2003).
More generally, Simmel (Simmel 1950: 145-169) theorizes about the dynamics produced
by the intervention of a third party in a preexisting relationship between two parties. The third
party can play one of three roles, that of the (1) non-partisan arbiter that balances or seeks accord
between the two parties (Simmel 1950: 146) ; (2) divider-and-ruler that “intentionally produces
the conflict in order to gain a dominant position” (Simmel 1950: 162); or (3) tertius gaudens, a
third that enjoys influence because “either two parties are hostile toward one another and
therefore compete for the favor of a third element; or they compete for the favor of the third
element and therefore are hostile toward one another” (Simmel 1950: 155). The last role is most
8 Garrett’s (2000) study of the tendency of leftist governments to spend more and run higher deficits despite greater product and factor market integration highlights the persistent effects of ideology on policy outcomes. Boix (2000) replicates Garrett’s basic findings and extends them by incorporating an analysis of the structure of labor market institutions. Hallerberg and Basinger (1998), in their study of the adoption of tax reform, combine these two perspectives by considering the ideological preferences of the incumbent government as well as the policymaking structure. Murillo’s (2002) study of the type of the different privatization programs that countries adopt also finds a strong role for incumbent ideology.

relevant to the impact of multilateral agencies like the IMF or World Bank on deregulation,
privatization and liberalization policies. The group or party favoring market-oriented reform may
approach the multilateral agency in order to advance its goals (e.g., privatization), or the agency
may approach this group or party itself. The multilateral agency itself does not necessarily have
to exert a huge amount of influence; “the only important thing is that [the third party’s]
superadded power give one [of the two preexisting parties] superiority” (Simmel 1950: 157).
The available empirical evidence tends to support the argument that international
coercion may affect policymaking either directly or indirectly. Empirical research demonstrates
that decolonization (Strang 1990), currency crises (Glick and Rose 1998) and the adoption of
policies to protect the environment (Frank, Hironaka, and Schofer 2000a; Frank, Hironaka, and
Schofer 2000b) all exhibit distinct patterns of direct coercion. Dominant countries both define
the desirable set of policies to which others aspire (Stone 1999), and can impose or encourage
the adoption of these policies through direct financial channels such as conditional lending
(Khan and Sharma 2001).
Other empirical studies focus on the direct coercive influence of specific powerful
organizations. For example, the signing of International Labor Organization conventions
enhances subsequent welfare spending (Strang and Chang 1993), and UNESCO membership
increases that a government founds a formal science bureaucracy (Finnemore 1993). Guler et al.
(2002) finds that the presence of the state and foreign multinationals in the economy accelerates
the rate of diffusion of quality certification among local firms.
There exists limited empirical evidence of indirect coercion in the form of studies linking
a country’s fraction of output exported to subsequent trade liberalization (Biglaiser and Brown
2003) and demonstrating the negative impact of anti-capitalist sentiment on the adoption of
financial market liberalization (Quinn and Toyoda 2003). Research highlighting the use by
international interests of local actors sharing a common vision to achieve a given domestic policy
outcome provides additional evidence (Biglaiser and Brown 2003; Bockman and Eyal 2002;
Chwieroth 2003).
Much research on international coercion highlights the role of multilateral agencies,
which control financial resources sorely needed by many countries, have a considerable amount
of legitimacy, and typically enjoy the backing of the dominant states that contribute to them
financially. These agencies may be able to use their resultant financial and moral authority to
coerce domestic policy actors to adopt otherwise unacceptable reforms. More specifically, they
promote the diffusion of market-oriented reforms through the so-called “conditionality terms”
that they can attach to loan agreements. These terms take the form of a “complex policy
covenant” that a debtor country’s government makes with the multilateral agency when the
country’s lack of economic or political collateral precludes it from borrowing through
conventional private channels. The countries that enter into such a covenant, it is argued, are
typically those that direly need external funding to resolve an actual or impending
macroeconomic crisis. The aim of the covenant, according to two IMF economists, is to provide
the lender with
safeguards that the country will be able to rectify its macroeconomic and structural
imbalances and will be in a position to service and repay the loan… Certain structural
conditions may be necessary to signal the government’s commitment to
macroeconomic stability. Securing this depends not only on short-run macroeconomic
management given an existing set of institutions, but also on the quality of the
institutions themselves… Institutional development and reform require a variety of
structural policy changes and this is a justification for including them in programs
(Khan and Sharma 2001: 6).
The first amendment to the IMF charter, passed in 1952, granted the agency the ability to
seek policy changes in debtor countries. The actual imposition of conditionality terms by the
development agencies was initially rare and the terms imposed narrow in scope. However, the
average number of terms imposed on a borrowing country has risen substantially in recent years,
especially during the 1990s. The IMF imposed an average of six terms in 1970, 10 in the 1980s,
and 26 by 1999, with a maximum of 140 in the case of Indonesia in 1997. The average for the
World Bank rose from 32 in 1980-83 to 56 by 1990 (Buira 2003).
Some observers attribute the change in multilateral agency behavior to ideological shifts
that began in the 1980s. According to Buira (2003), “since the early 1980s, as the Thatcher and
Reagan doctrines gained ascendancy in the UK and the US, both [the IMF and the World Bank]
adopted a more neo-liberal economic stance and increasingly favored policies aimed at reducing
the role of the state, the reduction or elimination of subsidies, of market liberalization and
privatization of public enterprises.” As Kapur and Webb (2000) report, the dominant ideology at
the World Bank during the 1980s revolved around the theme that countries should do more with

less—that is, “downsize”—and evolved during the 1990s to include broad privatization
programs, regulatory reform and the implementation of checks and balances as recognition of
domestic institutional factors grew.9
The World Bank explicitly extended this macroeconomic ideology to infrastructure
sectors in 1993, when it made evidence of market-oriented infrastructure reform precondition for
any project lending. One example is the Democratic Republic of Congo, which borrowed $120
million under the condition that it “strengthen regulatory authorities in the telecommunication,
transport and energy sectors through technical assistance and training” (The World Bank 2004b).
Another example is Afghanistan, which recently borrowed $22 million “to set up an independent
Regulatory Commission (RC) and [formulate] a Telecommunications Act… Plans for eventual
privatization will be augmented by an institutional strengthening exercise to ensure
administration procedures and accountability meet all international quality and performance
expectations” (The World Bank 2004a). Similarly, Bangladesh borrowed $9 million in order “to
improve the performance of [its] telecommunications sector through strengthening elements of
the policy, institutional, and regulatory framework in order to promote the competitive provision
of telecommunications infrastructure and services” (The World Bank 2004c). The Democratic
Republic of Congo, Afghanistan and Bangladesh are but three of the countries that have received
infrastructure loans under the condition of market-oriented reform since the IMF and World
Bank began to publish the terms of their loan agreements in 1997. Wamukonya (2003) shows
that 32 countries signed letters of intent with the World Bank for lending in the electricity sector
that included similar terms over the period from October 1998 to February 2001.
Unpublished empirical studies find evidence of the coercive influence of multilateral
agencies on the likelihood of capital account liberalization (Brune and Guisinger 2003), the
adoption of central bank independence (McNamara and Castro 2003), the promulgation of a
national right to information or transparency laws around the world (Roberts 2003), and the
adoption of tariff reform in Latin America (Biglaiser and Brown 2003).
9 From a conceptual perspective, it is possible to conjecture that changes in development agency behavior may also have resulted from the growing legitimacy of agencies’ conditionality practices over time, both internally and throughout the field of development agencies. However, the identification of the precise explanation for changes in development agency behavior is, however, beyond the scope of this paper.

We expect direct coercion to occur in cases in which the multilaterals (and the states that
dominate their decision-making) are powerful enough relative to a country’s government to
impose market-oriented reforms in exchange for funding. In other cases, we expect indirect
coercion to occur: the IMF or the World Bank and domestic parties in favor of market-oriented
reform work in concert to tilt the balance of power, especially when the country requires external
funding to cope with a macroeconomic or financial crisis. Whichever coercive mechanism is
operative, external intervention still affects the policymaking process. Based on the foregoing,
we predict that:
Hypothesis 1a: The rate of adoption of market-oriented reform increases with
exposure to multilateral lenders.
Consistent with the anecdotal observations reported above regarding the increased scope of
multilateral conditionality over time, we also predict that
Hypothesis 1b: The magnitude of the positive correlation between the rate of
adoption of market-oriented reform and exposure to multilateral lenders is increasing
over time.
Emulation
In addition to coercion, a social structure may induce emulation or mimetic behavior
(DiMaggio and Powell 1983). Mimetic isomorphism refers to the tendency of actors to seek
legitimacy by emulating the behavior or practices of other actors. This process occurs more
frequently when there is uncertainty about the effectiveness of practices or policies, and when
the range of possible alternatives becomes so large that rationally-bounded actors find it difficult
or impractical to assess each possible alternative against the others. As Strang and Macy (2001)
note, adaptive emulation combines problem-driven search (March and Simon 1958) and
organizational imitation (DiMaggio and Powell 1983).
Social contact is the best documented channel through which mimetic isomorphism
occurs. Actors tied to one another share a culture or set of norms that invites them to behave
similarly; socially cohesive actors influence each other and hence tend to adopt similar patterns
of behavior (Coleman 1988). The extent of imitation thus depends on patterns of interaction
between pairs of actors, which is in turn a function of social density. Empirical evidence
supporting this argument comes from studies examining the diffusion across organizations of
practices such as corporate acquisitions (Haunschild 1993), poison pills (Davis 1991), golden
parachutes (Davis and Greve 1997), technological innovations (Ahuja 2000), total quality
management techniques (Westphal, Gulati, and Shortell 1997), and the multidivisional form
(Palmer, Jennings, and Zhou 1993). This body of research emphasizes the importance of such
interorganizational ties as interlocking directorates and the transfer of managerial personnel,
which provide channels for the exchange of information.
Some neo-institutional sociologists apply the concept of mimetic isomorphism at the
country level of analysis, arguing that policymakers emulate each other as a way to reduce search
costs and appear legitimate (Jepperson and Meyer 1991; Meyer, Boli, Thomas, and Ramirez
1997). Case study and historical research document that government officials and bureaucrats
constantly assess policy and organizational developments in other countries. Westney (1987)
provides historical evidence for the Japanese case during the period of Meiji reform in the late
19th and early 20th centuries. Guillén (1994) and Djelic (1998) show that governments in Western
Europe sought to emulate American productivity programs before and after World War II. Using
more recent evidence, some researchers show that the “menu” of known policy options from
which policymakers choose today is considerably larger than that available to their counterparts
several decades ago. Recognition that the range of options has grown over time is critical for
predicting the timing of adoption of a given reform. Empirical studies emphasizing policy
emulation among peers include Collier and Messick’s (1975) study of the adoption of social
security systems, Knoke’s (1982) analysis of the adoption of municipal reform in the 267 largest
US cities, Kobrin’s (1985) study of oil nationalization, Weyland’s (2003) work on the diffusion
of pension privatization, Guler et al.’s (2002) study of the adoption of quality certification, Brune
and Guisinger’s (2003) analysis of capital account liberalization, and Fourcade-Gourinchas and
Babb’s (2002) and Yebra’s (2002a; 2003) studies of the diffusion of neoliberal macroeconomic
policies.
Sociologists studying globalization argue that the intensity of trade transactions reflects
the density of the social network in which a given country is embedded (Albrow 1997: 25; Van
Rossem 1996) and therefore the level of formalized conformity within the network. Trade comes

hand in hand with “cultural ties” (Waters 1995: 40) and thus contributes to “establishing a
relationship of identification as well as interdependence.” For example, Japanese success in
exporting to the U.S. market prompted many American firms to experiment with such Japanese
organizational techniques as total quality management or lean production (Strang and Macy
2001).
Policies directly reflect the level of formalized conformity within a trade network. In a
world characterized by uncertain cause-effect relationships, the policy initiatives undertaken by
“relevant others” such as trade partners represent a normative model that lends credence to
analogous domestic policy innovations and may trigger a cross-national diffusion process.
Imitation is an effective policymaking strategy under conditions of uncertainty and bounded
rationality because it helps decision-makers keep search costs within reasonable limits, sort out
alternatives and legitimize their actions. Thus, we predict:
Hypothesis 2: The rate of adoption of market-oriented reform by a given country
increases with the incidence of adoption of such reforms by trade-related countries.
EMPIRICAL SETTING, DATA, AND METHODS
The empirical focus of our analysis is the wave of market-oriented reforms that have
taken place in the global telecommunications and electricity industries since the late 1970s. As in
the case of other infrastructure industries, telecommunications and electricity providers in most
countries were traditionally state-owned monopolies. Even where several firms were allowed to
operate, competition on price or product offerings was rarely allowed to occur.
During the 1960s and 1970s, fewer than half a dozen countries initiated major reforms in
the regulation of, degree of private ownership of or extent of competition among
telecommunications and electricity providers. Market-oriented reforms began to gather speed in
the 1980s. During the 1990s over two thirds of all countries and territories in the world
introduced at least one major market-oriented reform in telecommunications, while over one
third did so in the case of electricity (see Table 1). Early adopters and the countries that have
adopted the most comprehensive reforms represent a wide variety of geographic regions, income
levels and development levels. Table 2 lists the first 15 adopters in both sectors and the 15

countries that most rapidly adopted the most wide-ranging and comprehensive set of reforms
including deregulation, privatization and liberalization.
Data
We test our hypotheses using an unbalanced cross-national panel data set of reforms in up
to 205 countries during the period 1960-1999. The unit of analysis is the country-year. Data on
the timing of reforms in infrastructure services are drawn from multiple secondary sources
including intergovernmental organizations (The International Telecommunications Union,
known as the ITU, and The International Energy Agency, known as the IEA), national regulatory
agencies, press reports and third-party analyses.10 These data are combined with macroeconomic
information from the World Bank’s World Development Indicators, sector-specific information
from the ITU and IEA, and political data from the Political Constraints Database.11
Dependent Variables. We run separate regressions for telecommunications and
electricity. Our data include the year in which a country adopted a specific reform in the areas of
deregulation, privatization and liberalization. For the former, we consider four possible reforms:
(1) separating the regulatory authority from the ministry with oversight of the sector; (2)
separating the regulatory authority from the state-owned operator; (3) creating a semi-
autonomous regulator; and (4) creating an autonomous regulator. For the privatization variables,
we consider three possible reforms: (1) undertaking a privatization of a minority of the shares of
the state-owned provider; (2) undertaking a privatization of the majority of shares of the state-
owned provider; and (3) undertaking a complete privatization of the state-owned provider. For
the liberalization variables, we consider two reforms in each of the respective cases of
telecommunications and electricity: (1) allowing competition in long distance telephony, or
autoproduction in electricity; and (2) allowing competition in local telephony, or generation for
10 The telecommunications reform variables come from the International Telecommunications Union. For the electricity reform variables, we supplemented data available from the International Energy Agency with the OECD International Regulation Database, the World Bank’s International Directory of Utility Regulatory Institutions, and the websites of national regulatory agencies and ministries.
11 http://www-management.wharton.upenn.edu/henisz/POLCON/ContactInfo.html

external sale in electricity. We thus have nine potential adoption decisions in each sector and in
each country-year.
Table 1 shows the number of countries that have enacted each reform by decade, the
number of left-censored cases (those countries that had already enacted a given reform prior to
1960) and the number right-censored cases (those countries that had not yet enacted the reform
as of 1999). Appendix Tables 1 and 2 provide the year in which each of the 205 (196) countries
in our dataset undertook each of the above reforms in telecommunications (electricity).
Independent Variables. We measure the leverage of multilateral lenders using the ratio
of a country’s level of borrowing to Gross Domestic Product. Compared to the alternative
measure of actual infrastructure project-based loan agreements, the total exposure measure that
we use is not limited by a country’s short-term need for infrastructure borrowing nor is it
associated with a country’s desire to implement market-oriented infrastructure reforms, and is
therefore both robust to possible unobserved extra-sectoral linkages in country loan packages and
more independent from the domestic political economic factors which may generate pressure for
reform. For example, in the prominent cases of a $46 billion Indonesian lending program in 1997
and a $2.6 billion program to the Ukraine in 2001, disagreements about the attainment of or
commitment to market-oriented infrastructure reforms delayed a lending package for a country in
the midst of an exogenous macroeconomic and financial crisis. Even were we to set aside issues
of endogeneity, data on the contents of individual loans, were made public beginning only in
1998.
The countries with the highest overall exposure to multilateral lenders were São Tomé &
Principe, Guyana, Malawi, Zambia, Guinnea-Bissau, Gambia, Burundi, Mauritania, Togo,
Ghana, Mali and Sierra Leone. The country-years in which the multilateral lending agencies had
the highest leverage according to this measure were São Tomé & Principe from 1992-99,
Guinea-Bissau from 1995-99, Malawi from 1995-99, Guyana from 1992-94 and Zambia in 1987.
Country-years in which multilateral leverage increased by the greatest amount were Malawi in
1994, Rwanda in 1994, Bosnia in 1994, Sao Tome & Principe in 1991 and Malawi in 1998.
Anecdotal support in the form of case studies or news stories about the effect of multilateral
lending (H1a) can be found in the telecommunications reform adoption decisions of São Tomé &
Principe (1997), Malawi (1998), Guyana (1991), Zambia (1994), Guinea-Bissau (1989), Burundi

(1997), Mauritania (1999), Togo (1999), Ghana (1996), Rwanda (1996) and Bosnia (1999).
Guyana (1998), Ghana (1997) and Zambia (1997) also adopted electricity sector reforms.
We measure the legitimacy attributed to a given reform—and thus its mimetic appeal—
using the prior reform decisions of other countries. Rather than just count prior adoptions of an
analogous reform in the telecommunications or electricity sector, we construct a country-reform
specific policy index that accords more weight to the prior adoption decisions of more closely-
tied (i.e., peer) countries about a specific reform, as measured by the share of their total trade that
occurs with the focal country (Yebra 2002b). This indicator reflects the notion that, because of
uncertainty and bounded rationality, policymakers take into consideration their peers’ decisions.
The differences between the means of these variables in the entire sample as opposed to
the subsample of adopters and non-adopters reflect the strong clustering of adoption decisions. In
the case of the nine telecommunications reforms, 20.4 percent of the average country’s trade
during the sample period was with countries that had adopted a given reform. For countries that
had already adopted a reform, however, this figure was 46.8 percent, as opposed to 17.8 percent
for non-adopters. Similarly, in the case of electricity the figure of 34.1 percent fell in between the
figure for adopters of 78.9 percent and non-adopters of 24.5 percent.
Control Variables. We include additional independent variables to reflect domestic
factors such as sectoral performance, interest-group pressures, fiscal position, technological
changes, and checks and balances. We use the ratio of the number of customers waiting for
telecommunications services to the number of customers currently served as a proxy for the
quality of telecommunications services (Petrazzini 1995), and the percentage of electricity that is
generated but lost in transmission or distribution as a proxy for the quality of the electric system.
A high value of either measure indicates a clear performance shortfall in the sector. Each
measure is more widely available than potential alternatives such as the percentage of calls
completed, hours of brownouts or blackouts, and various productivity metrics. The countries
with the worst performance according to these metrics (Afghanistan, Albania, Syria, Cambodia,
Nepal, Eritrea, Honduras, Libya, Vietnam, Tanzania and Tonga in the case of
telecommunications; and Armenia, Haiti, Latvia, Mozambique, Myanamar, Bangladesh, Cyprus,
Angola and the Dominican Republic in the case of electricity) are plausible candidates for having
poorly performing state-owned enterprises. We measure interest group pressures using the value
added in industrial production as a share of gross domestic product, the ratio of foreign direct
investment to gross domestic product, and the percentage of the population living in urban areas.
Turning to supply-side factors, we include the public sector budget balance to capture
fiscal strain. We allow for the impact of technological change by permitting the hazard rate of
adoption to increase over time as a function of an estimated parameter in our specification, as
described below. Finally, in order to account for the role of any scale (dis)economies as country
size increases, we also include the log of a country’s population. Additionally, we include the log
of per capita GDP as a crude measure of resources and economic structure.
Table 2 provides summary statistics for the dependent and independent variables in our
analysis. We lag all independent variables one period to help alleviate concerns regarding
potential endogeneity.
Methods
We estimate policy reform adoption rates using an event history analysis, a technique that
assesses the influence of a set of covariates on the incidence of an event using a longitudinal
record of events in a sample from a population. Our focal event is the adoption of a reform by a
country in a given year. In our model, each country x is at risk of adopting reform i in each time
period t, or until adoption occurs. This technique models the rate of a transition from an origin
state to a destination state (adoption) as a function of the covariates. Its general form is: βρ λρλ jtXetth == − ,)( 1
where h(t) is the hazard function for a reform to transition from non-adoption to adoption at time
t, with the observed covariate row vectors Xjt and parameters to be estimated ρ and β (Blossfeld
and Rohwer 1995).
In our primary specification, we combine all nine possible reforms in each sector of each
country into a single, pooled, cross-national, sector-level regression, although we examine results
at individual reform level in our robustness tests. We allow for each type of reform to have an
independent baseline hazard and a different sensitivity to the passage of time, i.e., ρ is
subscripted by reform type (Wei, Lin, and Weissfeld 1989), resulting in a vector ρ. In order to
test support for Hypothesis 1b (the time-varying effect of multilateral lending), we also include
the multilateral lending variable in ρ. The effect of all other independent variables is assumed to
be constant across time t. We explicitly test this assumption in our robustness analysis by
permitting the effect of the multilateral lending variable and other independent variables to affect
individual reform types differentially. Finally, we cluster the standard errors by country in order
to address the lack of independence of multiple observations from the same cross-sectional unit.
Based on a review of the dates of initial reform in each sector across countries, we choose
1977 and 1978 (when Chile adopted market-oriented reforms) as the base year for analysis of the
telecommunications and electricity generation sectors, respectively, reflecting an assumption that
the adoption of sectoral reform was not a relevant policy option prior to that year. In our
robustness tests we also examine the sensitivity of our results to this assumption.
Finally, given our acknowledgement of the role of domestic economic and political
factors in reform adoption and the role ascribed to these same factors in Vreeland’s (2003)
analysis of a government’s decision to adopt an IMF program, we allow for the possibility that
countries’ choices to ask multilateral lenders for a loan and adopt market-oriented infrastructure
reforms are simultaneously determined. Specifically, we employ a two-stage model whose first
stage mirrors Vreeland’s (2003) depiction of the domestic economic and political factors that
influence the adoption of a multilateral lending program, and whose second stage includes the
variables listed above in addition to the predicted probability of seeking a multilateral loan from
the first-stage regression.
EMPIRICAL RESULTS
Model 1 of Table 4—the first-stage equation—shows that we replicate Vreeland’s (2003)
main findings that low official reserves, large government budget deficits, high debt service
obligations, new governments and a smaller number of checks and balances in the nation’s
political institutions are all associated with a greater predicted probability of a country’s
increasing its multilateral exposure. We also find that smaller (p = 0.06) and poorer countries are
more likely to increase their exposure. Columns 2 – 5 of Table 4 present the results of our
analysis of the telecommunications (columns 2 – 3) and electricity sectors (columns 4 – 5). The
second model for each sector (Columns 3 and 5) allow for a time-varying effect of multilateral
lending.
We find strong support for the coercive effect of multilateral lending and reform adoption
in both telecommunications and electricity (H1a). That is, the World Bank and International
Monetary Fund’s conditional lending practices increase the rate at which countries adopt market-
oriented infrastructure reforms. When we restrict the effect of multilateral lending to be constant
across time (columns 2 and 4), a country borrowing the sample mean level from multilateral
institutions is predicted to be approximately 38 percent more likely to adopt a reform in the
telecommunications sector as compared to a country with no exposure to multilateral institutions
(the analogous result is not significant in the case of electricity). A country with exposure one
standard deviation above the mean is predicted to be 50 percent more likely to adopt a reform
than is a country with exposure at the mean level, or 107 percent more than is a country with no
exposure. For severely indebted countries, i.e., those whose borrowing from multilaterals
exceeds the value of their gross domestic product, the total predicted increase in the rate of
reform adoption is 1,233 per cent.
Consistent with H1b, the economic magnitude of the effect of this coercive mechanism
varies substantially with time. According to the coefficient estimates in columns 3 and 5, from
the specifications in which the effect of multilateral lending is permitted to vary over time,
countries whose exposure to multilateral institutions in 1987 is at the mean, one standard
deviation above the mean, or greater than gross domestic product are respectively predicted to be
27 percent, 60 percent and 606 percent more likely to adopt a reform in the telecommunications
sector, when compared to countries with no multilateral exposure. These figures increase to 36
percent, 103 percent and 1,191 percent in 1997. In the case of the electricity sector, the effects
are now statistically significant and comparable in magnitude to those of the telecommunications
sector. Specifically, countries whose exposure to multilateral institutions is at the mean, one
standard deviation above the mean, or equal to their gross domestic product are predicted to
increase their adoption rates by 42 percent, 123 percent and 2462 percent in 1987 and 51 percent,
151 percent and 621 percent in 1997, as compared to countries with no multilateral exposure.12
Hypothesis 2 posits a positive relationship between peer countries’ adoption of a reform
and a focal country’s adoption rate. We find strong support for this hypothesis in both sectors
and the economic significance is again substantial. In the case of telecommunications, countries
12 The predicted rate of increase in reform adoption for severely indebted countries in 1997 is lower than it is in 1987 because the model predicts that all countries with such exposure would initiate a reform by the early 1990s, thus reaching the upper bound on the rate of adoption above which there are no possible predicted increases.

with trading partners that have undertaken a specific sector-level reform at a rate one standard
deviation above the mean level for that year exhibit predicted adoption rates that are 89 percent
higher than are those of countries whose trading partners exhibit the mean level of reform. The
analogous figure for the electricity sector is 145 percent. Thus, we obtain robust, statistically
significant support for the presence of both international coercion and emulation. Moreover, the
effects are large in magnitude.
In contrast, we find mixed support for the role of domestic demand and supply factors,
which we included in our analyses as control variables. The models support the expected positive
relationship between performance shortfalls and the adoption of reforms in both sectors.
Consumers facing waiting lists for telecommunications services or whose electric utilities are
able to supply only a fraction of the electricity generated are more likely to militate for reform.
The predicted adoption rate for sectoral reform in a country whose sectoral performance
indicator is one standard deviation lower than the mean level is 115 percent higher in the case of
telecommunications and 84 percent higher in the case of electricity than in an otherwise identical
country at the mean level of the performance indicator.
The flexibility of the Weibull specification permits us to infer that the baseline adoption
rate is initially much higher for telecommunications, but the rate of change over time for
electricity reforms is much more rapid (i.e., the coefficient estimate for the time-varying constant
for electricity is equal to 40 percent of the time-varying constant for telecommunications),
suggesting that technological change has played a larger role in enabling market-oriented
reforms in the latter sector. Although this finding may appear counterintuitive at first blush, it is
important to recall that our empirical analysis examines fixed-line telecommunications
infrastructure that supports voice services, not the overlapping data or cellular markets in which
technological change has played a much greater role. In the electricity sector, the substantial
decline in the minimum efficient scale of generating plants has radically altered the economics of
generation during the past few decades, enabling the vertical disintegration that is a crucial
component of market-oriented the reforms to occur.
We do not find a statistically significant relationship between interest group pressures
(value added by industry, urban population or foreign direct investment) or political institutions
(political constraints) and the adoption of reforms. Countries with larger budget surpluses are
more likely to reform in the case of telecommunications, highlighting the need for slack

resources to fund the necessary transformation of the sector rather than suggesting that resource
scarcity drives the government to reform.13 Larger countries are more likely to reform, although
the statistical support is within conventional confidence intervals only in the case of the
electricity sector.
Another way of examining the predictive power of our model is to review the post-1999
experience of non-adopting countries with the maximum predicted probabilities of adopting a
given reform in 1999. In the telecommunications sector, the International Telecommunications
Union dataset contains observations beyond the 1999 threshold that we use in our analysis. In
1999, the countries with the highest probability of making their regulator independent from the
Ministry of Telecommunications that had not yet done so were Uruguay, Romania and Latvia.
Uruguay and Latvia adopted this reform in 2001, and Romania did so in 2002. For the case of
making the regulator independent from the incumbent, the non-adopters with the highest
predicted adoption rate were Azerbaijan, Uruguay and Belarus. Uruguay adopted this reform in
2001 while Azerbaijan and Belarus have yet to do so. For the subjective measures of
deregulation, Mexico, Chile and Tunisia had the highest probability of making their regulator
autonomous, and Tunisia did so in 2001. Estonia, Lithuania and Azerbaijan had the highest
predicted probability of initiating a privatization program, and Estonia did so in 2000, followed
by Lithuania in 2001. The highest predicted rates of adoption of competition in long distance
telephony among non-adopters were those for Poland, the Czech Republic and Estonia. The
latter two countries adopted this reform in 2000, and Poland followed in 2001. Finally, for non-
adopters of competition in local services, the highest predicted rates of adoption were those for
Mexico, Estonia and Hungary, each of which adopted the reform in 2000.
13 This result exclusively reflects the impact of the size of a country’s budget deficit on the probability of reform, i.e., net of the impact of the budget deficit on the probability of the country’s increasing its multilateral institutions. The latter effect is captured in the first stage of the econometric model, which indicates that the budget deficit is a crucial determinant a country’s choice to increase its multilateral exposure.
Robustness Analyses
We examine the robustness of our results to the inclusion of additional variables,
different choices of base year, different time-varying effects and the disaggregation of our
dependent variable.
Omitted Variables. We check for omitted variable bias by adding to our core
specifications covariates that could plausibly influence the dependent variable, including the
level of democratization, the durability of the political regime, any change in political leadership,
the ideology of the political leadership, two measures of the openness of the host country
economy (trade and portfolio investment), two measures of the level of debt service (as a
percentage of GDP and exports), two measures of the size of government (expenditure and
revenue), and two measures of host country growth prospects (population and income). Given
the stability of our coefficient estimates, we present an abbreviated version of the results in Table
5, which includes the coefficient estimates of theoretical interest and the coefficient estimate for
the rotated variable for each of the twelve different equations for electricity and
telecommunications, in specifications that both restrict the effect of multilateral lending to be
constant across time and also allow it to vary over time (a total of 48 regressions). For
telecommunications, democratic countries (column 1, panels 1 and 2) and (weakly) countries in
which the government plays a smaller role in the economy, as measured by expenditure or
revenue (columns 9-10, panels 1-2), are more likely to initiate market-oriented reforms. Only
population growth (column 11, panels 3-4) is associated with market-oriented reforms in the
electricity sector. Except in the case of ideology (column 4), the coefficient estimate for which is
not itself significant and whose inclusion reduces our sample size by over forty percent, the
inclusion of any these variables does not substantively alter the results of primary interest. We do
not include these variables in our primary specification due to the reduction in sample size that
doing so would necessitate.
Assumptions about Initial Reform Year. We examine the sensitivity of our results to
varying assumptions about the initial year in which reform was a feasible policy option by
setting the initial year in our analyses to 1960 (the earliest year for which we have data) for both
sectors, and also to the years of the second and third significant reforms in each sector (1979 and
1984 for telecommunications, 1986 and 1987 for electricity). The coefficient estimates for the
multilateral exposure variable in Table 6 increase as we move the initial date of our analysis

forward in time. This change is consistent with the support for Hypothesis 1b (the time-varying
effect of multilateral lending); the predicted effect of a given quantity of lending is increasing as
we restrict our sample to include only more recent years. We do, however, lose some statistical
power as we restrict the sample size to the 1984-1999 period for telecommunications and 1986-
1999 for electricity. All of the other results for both sectors are robust to changes in the base year
of analysis.
Time-Varying Coefficient Estimates. In Table 7 we examine whether our result that
multilateral lending has a time-varying effect of could be an artifact of a poorly specified hazard
function or other mishandling of the effect of the passage of time. Specifically, we allow the
effect of trade-weighted peer adoption (columns 1 and 7) and the sector-level performance
indicator (columns 2 and 8) to vary over time. We also test models in which each of these
variables as well as the multilateral lending variable is allowed to have a time-varying effect
(columns 3, 5, 9 and 11), and in which all three variables are allowed to have a time-varying
effect (columns 6 and 12). While we find some weak evidence of a time-varying effect for peer
adoption, the loosening of any of these restrictions does not alter the support for our hypotheses.
Disaggregation of the Dependent Variable. In Tables 8 and 10, we disaggregate our
dependent variable to focus on five types of market-oriented reforms (deregulation, objectively-
measured deregulation, subjectively-measured deregulation, privatization and liberalization).
Tables 9 and 11 report results for each of the nine individual reforms in each sector. As we are
no longer pooling our nine reform types together for each country year but are rather looking at
smaller groups of reforms (Tables 8 and 10) or single reforms per country year (Tables 9 and
11), the samples are substantially smaller than our primary estimating sample, resulting in a
substantial loss of statistical power, particularly in Tables 9 and 11.
In both telecommunications and electricity, multilateral lending is most strongly
associated with the subsequent adoption of objectively-measured deregulation (the separation of
the regulator from the ministry and from the incumbent state-owned operator, as indicated in
columns 3 of Tables 8 and 10 and columns 1 and 3 of Tables 9 and 11). In the case of
telecommunications, this effect increases over time (column 4 of Table 8 and columns 2 and 4 of
Table 9).
The effect of multilateral lending on other reforms varies more between sectors. In
telecommunications, there is no impact on the aggregated subjectively-measured deregulation

(columns 5 – 6 of Table 8). There is weak evidence of an initially negative association between
multilateral lending and regulatory semi-autonomy, which diminishes over time and eventually
becomes positive (columns 5 – 6 of Table 9), and an increasingly positive effect on regulatory
autonomy over time (column 8 of Table 9). Other results for the telecommunications sector
include a strong, time-invariant impact on the aggregated privatization measure (column 7 of
Table 8), which seems to be concentrated on minority rather than majority privatizations
(columns 9 – 14 of Table 9), no impact on the aggregated liberalization measure (columns 9 – 20
of Table 8), and evidence of a positive and declining effect on liberalization of local telephony
(columns 17 – 18 of Table 9).
In the electricity sector, there is a positive but time-invariant effect on subjectively-
measured deregulation (columns 5 – 6 of Table 10) that appears concentrated on regulatory semi-
autonomy (columns 5 – 8 of Table 11); mixed evidence of a positive effect on aggregate
privatization (columns 7 – 8 of Table 10) that, when unpacked, shows a strong negative
association between multilateral lending and minority privatization (columns 9 – 10 of Table 11)
and a strong positive association with majority and full privatization that declines over time
(columns 11 – 14 of Table 11); and an initially negative effect on liberalization that declines in
magnitude and eventually becomes positive (columns 9 – 10 of Table 11), which is concentrated
on the existence of private generating companies (columns 17 – 18 of Table 11) as opposed to
autogeneration (columns 15 – 16 of Table 11).
The effect of trade-weighted peer adoption is relatively robust in the telecommunications
sector with a loss of statistical support only in the cases of liberalization (columns 9 – 10 of
Table 8) particularly of local telephony (columns 17 – 18 of Table 9), regulatory semi-autonomy
(columns 5 – 6 of Table 9) and full or majority privatization (columns 11 – 14 of Table 9). The
positive aggregate effect of peer adoption in the electricity sector is, however, entirely
concentrated in the adoption of liberalization reforms (columns 9 – 10 of Table 10) specifically,
the allowance of autogeneration (columns 15 – 16 of Table 11).
Disaggregating the results also uncovers some additional statistically significant
relationships between several of our control variables and types of reforms or individual reforms.
For example, the effect of sectoral performance is concentrated on objective measures of
deregulation in telecommunications (columns 3 – 4 of Table 8), particularly making the regulator
independent from the incumbent (columns 3 – 4 of Table 9) as well as supporting full

privatization (columns 13 – 14 of Table 9). In the case of electricity, poor performance is again
associated with objective measures of deregulation (columns 3 – 4 of Table 9 and columns 1 – 4
of Table 11) as well as regulatory semi-autonomy (columns 5 – 6 of Table 11) and the existence
of private generators (columns 17 – 18 of Table 11).
We now find evidence of interest group effects on telecommunications privatization
(columns 7 – 8 of Table 8), wherein the industrial lobby favors minority privatization (columns
9 – 10 of Table 9), foreign investors favor full privatization (columns 13 – 14 of Table 9) and
urban consumers prefer privatization in the aggregate (columns 7 – 8 of Table 8). Foreign
investors, similarly prefer privatization in electricity (columns 7 – 10 of Table 10) particularly
majority privatization (columns 11 – 12 of Table 11). Industrial consumers again prefer minority
privatization (columns 9 – 10 of Table 11) and are now opposed to majority privatization
(columns 11 – 12 of Table 11). Urban consumers prefer majority or (weakly) full privatization
(columns 11 – 14 of Table 11).
There is also evidence that countries with strong checks and balances in their political
institutions are more likely to adopt privatization (columns 7 – 8 of Table 8) and liberalization
(columns 9 – 10 of Table 8) reforms in telecommunications. The effect of checks and balances
on privatization appears concentrated on minority privatizations (columns 9 – 10 of Table 9),
whereas the effect on liberalization is significant for both long distance (columns 15 -16 of Table
9) and local service (columns 17 – 18 of Table 9), albeit much stronger in the latter case. Checks
and balances are again positively associated with minority privatization in the case of the
electricity sector (columns 9 – 10 of Table 11), although now they are negatively associated with
full privatization (columns 13 – 14 of Table 11). Finally, larger countries are more likely to adopt
telecommunications privatization (columns 7 – 8 of Table 8), particularly full privatization
(columns 13 – 14 of Table 9) and liberalization (columns 9 – 10 of Table 8 and 15 – 18 of Table
9).
DISCUSSION AND CONCLUSION
The theoretical and empirical analysis in this paper extends prior work on the impact of
coercion and emulation in an international setting by demonstrating that these institutional forces
affect policy outcomes in conjunction with domestic economic and political factors. Countries
adopt market-oriented policy reforms in telecommunications and electricity as external actors
with coercive power gain leverage over the domestic policymaking apparatus, and as the
legitimacy of reforms grows through their prior adoption by peer countries. Thus, our analysis
lends credence to the neo-institutional approach to diffusion, which can be fruitfully applied to
the interaction among nation-states in the global system. Our findings are consistent with prior
research proposing or demonstrating that early adopters are motivated to a greater extent by
efficiency motives than are later adopters, who are influenced more strongly by coercive or
mimetic isomorphic pressures (DiMaggio and Powell 1983; Westphal, Gulati, and Shortell
1997). Not only has the importance of isomorphic pressures increased over time due to the
widespread diffusion of market-oriented reforms and the growing role of multilateral
development agencies in international lending, but it is also the case that coercive pressures have
increased over time for a given amount of multilateral lending.
One issue that we are unable to resolve is the precise mechanism through which external
funding or prior adoption influences policy outcomes. We cannot separate direct coercion by
multilateral lenders from the indirect empowerment of domestic political actors to achieve their
desired policy outcomes. A more complex division exists in the case of mechanisms driving
international emulation, which may include (boundedly) rational learning processes, coercive or
normative isomorphism, and institutional pressure for conformity in appearance regardless of
function (Gilardi 2003; Weyland 2003). Differentiating between these causal mechanisms is
problematic even under ideal empirical circumstances due to the observational equivalence of
many of the underlying propositions. The limitations of our international dataset compound this
problem and we do not attempt to weigh in on these longstanding debates.
Our empirical evidence sheds light on the determinants of policy reform. Much previous
scholarship in this area has focused on domestic economic and political conditions as
explanatory factors. We concur that performance shortfalls generate pressure for policy change,
thereby increasing the rate of reform adoption, and that technological change enables reform. We
also find some evidence of interest group pressures driving reform adoption, particularly
privatization, as well as evidence that budgetary slack facilitates reform adoption, particularly in
the case of liberalization. Finally, we find evidence that checks and balances promote rather than
limit market-oriented reforms in the case of minority privatization and, in the case of
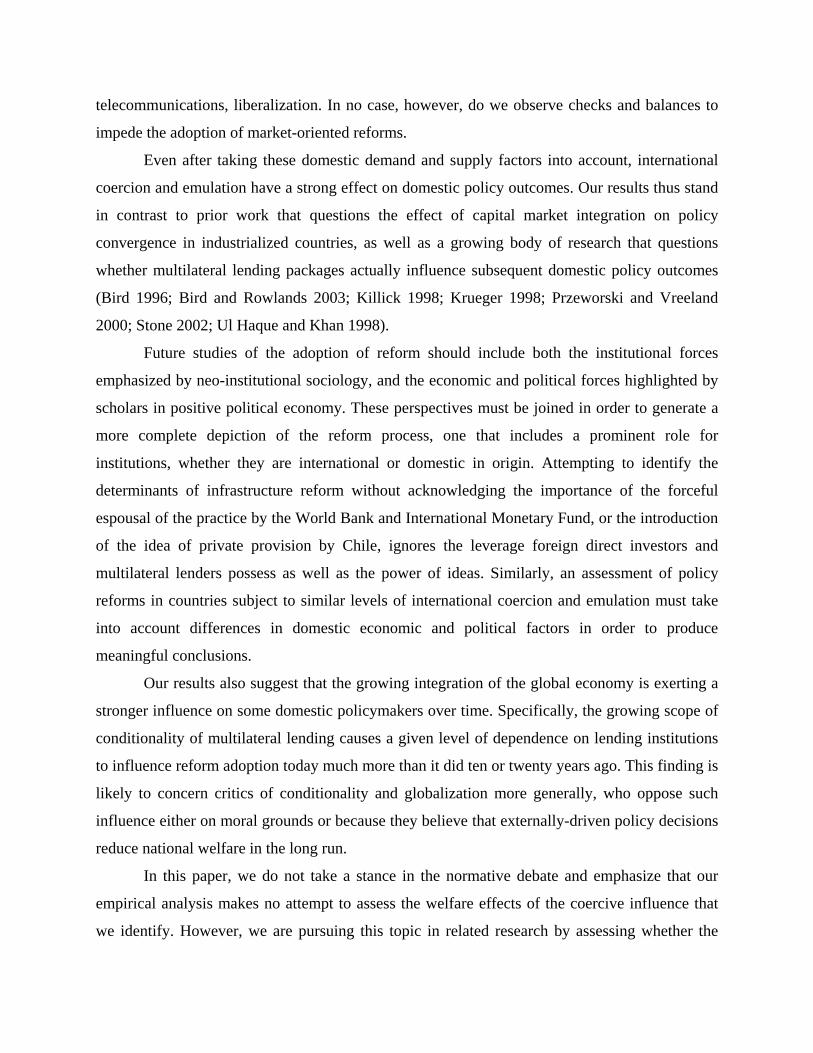
telecommunications, liberalization. In no case, however, do we observe checks and balances to
impede the adoption of market-oriented reforms.
Even after taking these domestic demand and supply factors into account, international
coercion and emulation have a strong effect on domestic policy outcomes. Our results thus stand
in contrast to prior work that questions the effect of capital market integration on policy
convergence in industrialized countries, as well as a growing body of research that questions
whether multilateral lending packages actually influence subsequent domestic policy outcomes
(Bird 1996; Bird and Rowlands 2003; Killick 1998; Krueger 1998; Przeworski and Vreeland
2000; Stone 2002; Ul Haque and Khan 1998).
Future studies of the adoption of reform should include both the institutional forces
emphasized by neo-institutional sociology, and the economic and political forces highlighted by
scholars in positive political economy. These perspectives must be joined in order to generate a
more complete depiction of the reform process, one that includes a prominent role for
institutions, whether they are international or domestic in origin. Attempting to identify the
determinants of infrastructure reform without acknowledging the importance of the forceful
espousal of the practice by the World Bank and International Monetary Fund, or the introduction
of the idea of private provision by Chile, ignores the leverage foreign direct investors and
multilateral lenders possess as well as the power of ideas. Similarly, an assessment of policy
reforms in countries subject to similar levels of international coercion and emulation must take
into account differences in domestic economic and political factors in order to produce
meaningful conclusions.
Our results also suggest that the growing integration of the global economy is exerting a
stronger influence on some domestic policymakers over time. Specifically, the growing scope of
conditionality of multilateral lending causes a given level of dependence on lending institutions
to influence reform adoption today much more than it did ten or twenty years ago. This finding is
likely to concern critics of conditionality and globalization more generally, who oppose such
influence either on moral grounds or because they believe that externally-driven policy decisions
reduce national welfare in the long run.
In this paper, we do not take a stance in the normative debate and emphasize that our
empirical analysis makes no attempt to assess the welfare effects of the coercive influence that
we identify. However, we are pursuing this topic in related research by assessing whether the

sources of infrastructure policy reform—both domestic and international—affect the impact of
reforms on supply, productivity, quality and service price. Given the growing body of empirical
findings suggesting that de jure and de facto deregulation, privatization and liberalization are
together required for successful transformation of state-owned enterprises in infrastructure
services, our disaggregated analyses point to an important subsequent line of inquiry.
Specifically, if multilateral lending does not influence each of these reforms equally, are the
outcomes of market-oriented reforms (such as improved efficiency, output, contractual security
and market structure) better or worse in countries that reform as a result of direct or indirect
coercion by multilateral lenders?
This is a tantalizing debate which neo-institutional sociology can illuminate. A country
pressured into deregulating, privatizing or liberalizing when sectoral performance does not create
domestic demands for such a reform, or when the national policymaking apparatus lacks
sufficient checks and balances to support a well-organized market, might fare much worse than a
country adopting such a reform as the result of clear performance shortfalls and in the presence
of domestic institutional support. At the extreme, the normative policymaking prescription that
the World Bank, International Monetary Fund and some academics espouse, rooted in the
presumed wholesale efficacy of deregulation, privatization and liberalization, could be damaging
for some countries, especially late adopters acting primarily as the result of coercion. In this case,
institutional pressures may generate inferior policy choices and undermine internal support for
market-oriented reforms. Understanding the drivers of adoption, as we do in this paper, is the
first stage in a research program attempting to address the larger question of the extent to which
pressures towards market-oriented reform result in ideal outcomes. Hence, neo-institutional
sociology makes a contribution to the policy debate by unmasking the processes of cross-
national coercion and emulation, and by empirically showing how much they contribute to policy
diffusion above and beyond the effect of domestic supply and demand factors.

REFERENCES
Ahuja, Gautam. 2000. "Collaboration Networks, Structural Holes and Innovation: A
Longitudinal Study." Administrative Science Quarterly 45:425-455.
Albrow, Martin. 1997. The Global Age. Stanford, CA: Stanford University Press.
Alesina, Alberto and Allan Drazen. 1991. "Why Are Stabilizations Delayed?" American
Economic Review 81:1170-1188.
Ando, Amy W. and Karen L. Palmer. 1998. "Getting on the Map: The Political Economy of
State-Level Electricity Restructuring." Resources for the Future Discussion Paper 98.
Armijo, Leslie Eliott and Philippe Faucher. 2001. "We Have a Consensus: Explaining Political
Support for Market Reforms in Latin America." Mimeo.
Artana, Daniel, Fernando Navajas, and Santiago Urbiztondo. 2001. "Regulation Policies
Towards Utilities and Competitive Industries: The Case of Argentina." Quarterly Review
of Economics and Finance 41:585-607.
Astley, W. Graham. 1985. "The Two Ecologies: Population and Community Perspectives on
Organizational Evolution." Administrative Science Quarterly 30:224-241.
Badaraco, Ernesto P., Luis F. Scholand, Luis A. Erize, Daniel Perrone, and Pablo Werning.
1996. "Proposed Supplement to the Regulatory Framework of the Argentine Electricity
Industry." in Presented at the "First Gas and Electricity Congress for Latin America and
the Caribbean" organized by the Argentine Oil and Gas Institute, the American Gas
Association and the Society of Petroleum Engineers.
Banerjee, Sudeshana Ghosh and Michael C. Munger. 2002. "Move to Markets? An Empirical
Analysis of Privatization in Developing Countries." Fondazione Eni Enrico Mattei Note
Di Lavoro 2002.

Biglaiser, Glen and David S. Brown. 2003. "What's the Big Idea? An Ideational Explanation for
Tariff Reform in Latin America, 1981-1995." in American Political Science Association.
Philadelphia, PA.
Bird, Graham. 1996. "The International Monetary Fund and Developing Countries: A Review of
the Evidence and Policy Options." International Organization 50:477-511.
Bird, Graham and Dane Rowlands. 2003. "Political Economy Influences Within the Life-Cycle
of IMF Programmes." The World Economy 26:1255-1278.
Blossfeld, Hans-Peter and Gotz Rohwer. 1995. Techniques of event history modeling : new
approaches to causal analysis. Mahwah, NJ: Erlbaum.
Bockman, Johanna and Gil Eyal. 2002. "Eastern Europe as a Laboratory for Economic
Knowledge: The Transnational Roots of Neoliberalism." American Journal of Sociology
108:310-352.
Boix, Carles. 2000. "Partisan Governments, the International Economy, and Macroeconomic
Policies in Advanced Nations, 1960-93." World Politics 53:38-73.
Boughton, James M. 2003. "Who's in Charge? Ownership and Conditionality in IMF-Supported
Programs." IMF Working Paper 2003.
Brune, Nancy, Geoffrey Garrett, and Bruce Kogut. 2004. "The International Monetary Fund and
the Global Spread of Privatization." IMF Staff Papers 51.
Brune, Nancy and Alexandra Guisinger. 2003. "The Diffusion of Capital Account Liberalization
in Developing Countries." in American Political Science Association. Philadelphia, PA.
Buira, Ariel. 2003. "An Analysis of IMF Conditionality." in XVI Technical Group Meeting of the
Intergovernmental Group of 24. Port of Spain, Trinidad and Tobago.

Chwieroth, Jeffrey M. 2003. "Neoliberal Norms and Capital Account Liberalization in Emerging
Markets: The Role of Domestic-Level Knowledge-Based Experts." in American Political
Science Association. Philadelphia, PA.
Clarke, George and Robert Cull. 2002. "Political and Economic Determinants of the Likelihood
of Privatizing Argentine Public Banks." Journal of Law and Economics 45:165-197.
Coleman, J.S. 1988. "Social Capital in the Creation of Human Capital." American Journal of
Sociology 94:S95-S120.
Collier, David and Richard E. Messick. 1975. "Prerequisites Versus Diffusion: Testing
Alternative Explanations of Social Security Adoption." The American Political Science
Review 69:1299-1315.
Damsgaard, Niclas. 2003. "Why Deregulation? Economics and Politics in Retail Electricity
Markets." Mimeo.
Davis, Gerald F. 1991. "Agents Without Principles? The spread of the poison pill through the
intercorporate network." Administrative Science Quarterly 36:583-613.
Davis, Gerald F. and Henrich R. Greve. 1997. "Corporate Elite Networks and Governance
Changes in the 1980s." American Journal of Sociology 103:1-37.
DiMaggio, Paul J. and Walter W. Powell. 1983. "The Iron Cage Revisited: Institutional
Isomorphism and Collective Rationality in Organizational Fields." American Sociological
Review 48:147-160.
Dixit, Avinash. 1996. The Making of Economic Policy: A transaction cost politics perspective.
Cambridge: MIT Press.
Djelic, Marie-Laure. 1998. Exporting the American Model. New York, NY: Oxford University
Press.

Drazen, A. and V. Grilli. 1993. "The Benefits of Crises for Economic Reform." American
Economic Review 83:598-607.
D'Souza, Juliet and William L. Megginson. 1999a. "The Financial and Operating Performance of
Privatized Firms During the 1990s." Journal of Finance 54:1397-1438.
—. 1999b. "Sources of Performance Improvement in Privatized Firms: A clinical study of the
global telecommunications industry." Mimeo.
Eising, Rainer. 2002. "Policy Learning in Embedded Negotiations: Explaining EU Electricity
Liberalization." International Organization 56:85-120.
Fernandez, Raquel and Dani Rodrik. 1991. "Resistance to Reform: Status Quo Bias in the
Presence of Individual-Specific Uncertainty." American Economic Review 81:1146-1155.
Fink, Carsten, Aaditya Mattoo, and Randeep Rathindran. 2002. "An Assessment of
Telecommunications Reform in Developing Countries." World Bank Policy Research
Paper 2909.
Finnemore, Martha. 1993. "International Organizations as Teachers of Norms: The United
Nations Education, Scientific and Cultural Organization and Science Policy."
International Organization 47:565-597.
Fourcade-Gourinchas, Marion and Sarah L. Babb. 2002. "The Rebirth of the Liberal Creed:
Paths to Neoliberalism in Four Countries." American Journal of Sociology 108:533-579.
Frank, D., A. Hironaka, and E. Schofer. 2000a. "Environmental Protection as a Global
Institution." American Sociological Review 65:122-127.
—. 2000b. "The Nation State and the Natural Environment, 1900-1995." American Sociological
Review 65:96-116.

Franzese Jr., Robert J. 1999. "Partially Independent Central Banks, Politically Responsive
Governments and Inflation." American Political Science Review 43:681-706.
Garrett, Geoffrey and Jonathan Rodden. 2000. "Globalization and Decentralization." Mimeo.
Gilardi, Fabrizio. 2003. "Spurious and Symbolic Diffusion of Independent Regulatory Agencies
in Western Europe." in The Internationalization of Regulatory Reforms. Berkeley, CA.
Gilbert, Richard J. and Edward P. Kahn. 1996. "International Comparison of Electricity
Regulation." New York: NY: Cambridge University Press.
Gilpin, Robert. 1987. The Political Economy of International Relations. Princeton, NJ: Princeton
University Press.
—. 2000. The Challenge of Global Capitalism. Princeton, NJ: Princeton University Press.
Glick, Reuven and Andrew K. Rose. 1998. "Contagion and Trade: Why Are Currency Crises
Regional?" National Bureau of Econoimic Research Working Paper 6806.
Guillén, Mauro. 1994. Models of Management: Work authority and organization in comparative
perspective. Chicago: University of Chicago Press.
Guler, Isin, Mauro Guillén, and Muir Macpherson. 2002. "Global Competition, Institutions, and
Organizational Change: The International Diffusion of the ISO 9000 Quality Standards."
Administrative Science Quarterly 47:207-232.
Gutierrez, Luis and Sanford Berg. 2000. "Telecommunications Privatization and Deregulation:
Lessons from Latin America." Telecommunications Policy 24:865-884.
Hallerberg, Mark and Scott Basinger. 1998. "Internationalization and Changes in Tax Policy in
OECD Countries: The Importance of Domestic Veto Players." Comparative Political
Studies 31:321-352.

Haunschild, Pamela R. 1993. "Interorganizational Imitation: The impact of interlocks on
corporate acquisition activity." Administrative Science Quarterly 38:564-592.
Heller, William B. and Mathew D. McCubbins. 1996. "Politics, Institutions and Outcomes:
Electricity regulation in Argentina and Chile." Journal of Policy Reform 1:357-388.
Henisz, Witold J. and Bennet A. Zelner. 2001. "The Institutional Environment for
Telecommunications Investment." Journal of Economics & Management Strategy
10:123-147.
—. 2002. "Interest Groups, Institutional Structures and Electricity Investment." Mimeo.
—. 2004. "Legitimacy, Interest Group Pressures and Change in Emergent Institutions: The Case
of Foreign Investors and Host Country Governments." Academy of Management Review
29.
Henisz, Witold Jerzy. 2000. "The Institutional Environment for Economic Growth." Economics
and Politics 12:1-31.
—. 2002. "The Institutional Environment for Infrastructure Investment." Industrial and
Corporate Change 11:355-389.
—. 2004. "Political Institutions and Policy Volatility." Economics and Politics 16:1-27.
Hirsh, Richard F. 1989. Technology and Transformation in the American Electric Utility
Industry. New York: Cambridge University Press.
Hoffman, Andrew J. 1999. "Institutional Evolution and Change: Environmentalism and the U.S.
Chemical Industry." Academy of Management Journal 42:353-371.
Holburn, Guy L.F. and Pablo T. Spiller. 2003. "Institutional or Structural: Lessons from
International Electricity Sector Reforms." in The Economics of Contracts: Theories and

Applications, edited by E. Brousseau and J.-M. Glachant. London: Cambridge University
Press.
Ikenberry, John. 1990. "The International Spread of Privatization Policies: Inducement, Learning
and Policy Bandwagoning." in The Political Economy of Public Sector Reform and
Privatization, edited by E. N. Sulieman and J. Waterbury. Boulder Co.: Westview Press.
Janeba, Eckard. 2001. "Attracting FDI in a Politically Risky World." NBER Working Paper
8400.
Jepperson, Ronald L. and John W. Meyer. 1991. "The Public Order and the Construction of
Formal Organizations." Pp. 204-231 in The New Institutionalism in Organizational
Analysis, edited by P. J. Dimaggio and W. W. Powell. Chicago, IL: University of
Chicago Press.
Jones, Bryan D., Frank R. Baumgartner, and James L. True. 1998. "Policy Punctuations: U.S.
Budgetary Authority, 1947-1995." Journal of Politics 60:1-33.
Joskow, Paul. 1987. "Contract Duration and Relation Specific Investments: Empirical Evidence
from Coal Markets." American Economic Review 17:168-85.
Kapur, Devesh and Richard Webb. 2000. "Governance Related Conditionalities." United Nations
Conference on Trade and Development G-24 Discussion Paper Series 6.
Khan, Mohsin S. and Sunil Sharma. 2001. "IMF Conditionality and Country Ownership of
Programs." International Monetary Fund Working Paper 01.
Killick, T. 1998. Aid and the Political Economy of Policy Change. London: Routledge.
Kingdon, John W. 1984. Agendas, Alternatives, and Public Policies. Boston: Little, Brown.
Knittel, Christopher. 2003. "The Adoption of State Electricity Regulation: The Role of Interest
Groups." Mimeo.

Knoke, David. 1982. "The Spread of Municpal Reform: Temporal, Spatial and Social
Dynamics." American Journal of Sociology 87:1314-1339.
Kobrin, Stephen J. 1985. "Diffusion as an Explanation of Oil Nationalization (Or the domino
effect rides again)." Journal of Conflict Resolution 29:3-32.
Kogut, Bruce and J. Muir Macpherson. 2004. "The Decision to Privatize as an Economic Policy
Idea: Epistemic Communities and Diffusion." Mimeo.
Krueger, Anne O. 1998. "Whither the World Bank and the IMF." Journal of Economic
Literature 36:1983-2020.
Levy, Brian and Pablo T. Spiller. 1994. "The Institutional Foundations of Regulatory
Commitment: A Comparative Analysis of Telecommunications Regulation." Journal of
Law, Economics and Organization 10:201-246.
—. 1996. Regulations, Institutions and Commitment, Edited by J. E. Alt and D. C. North.
Cambridge: Cambridge University Press.
Li, Wei, Christine Zhen-Wei Qiang, and Lixin Colin Xu. 2002. "The Political Economy of
Privatization and Competition: Cross-Country Evidence from the Telecommunication
Sector." Journal of Comparative Economics 30:439-462.
Lora, Eduardo. 2000. "What Makes Reforms Likely? Timing and Sequencing of Structural
Reforms in Latin America." Inter-American Development Bank Research Department
Working Paper 424.
MacIntyre, Andrew. 2001. "Institutions and Investors: The Politics of the Financial Crisis in
Southeast Asia." International Organization 55:81-122.
March, James G. and Herbert Simon. 1958. "Organizations." New York: John Wiley.

McNamara, Kathleen and Eduardo Castro. 2003. "The Diffusion of Central Bank Independence."
in American Political Science Association. Philadelphia, PA.
Megginson, William L and Jeffry M. Netter. 2001. "From State to Market: A survey of empirical
studies on privatization." Journal of Economic Literature 39:321-389.
Meyer, John W., John Boli, George M. Thomas, and Francisco O. Ramirez. 1997. "World
Society and the Nation State." American Journal of Sociology 103:144-181.
Murillo, Maria Victoria. 2002. "Political Bias in Policy Convergence." World Politics 54:462-
493.
Nelson, Joan. 1990. "Economic Crisis and Policy Choice: The Politics of Adjustment in the
Third World." Princeton: Princeton University Press.
North, Douglass C. 1990. Institutions, Institutional Change, and Economic Performance. New
York: Cambridge University Press.
Palmer, Donald A., P. Devereaux Jennings, and Xueguang Zhou. 1993. "Late Adoption of the
Multidivisional Form by Large U.S. Corporations: Institutional, political and economic
accounts." Administrative Science Quarterly 38:100-131.
Peltzman, Sam. 1976. "Toward a More General Theory of Regulation." Journal of Law and
Economics 19:211-248.
—. 1989. "The Control and Performance of State-Owned Enterprises." in Privatization and
State-Owned Enteprises, edited by P. e. a. MacAvoy. Boston, MA: Kluwer Academic
Publishers.
Persson, Torsten. 2001. "Do Political Institutions Shape Economic Policy?" NBER Working
Paper Series 8214.

Petrazzini, Ben A. 1995. The Political Economy of Telecommunications Reform in Developing
Countries: Privatization and Liberalization in Comparative Perspective. Westport, CT:
Praeger.
—. 1996. "Cost and Benefits of Telecommunications Liberalization in Developing Countries." in
Liberalizing Telecommunications. Institute for International Economics, Washington,
D.C.
Pierre, Dhonte. 1997. "Conditionality as an Instrument of Borrower Credibility." International
Monetary Fund Paper on Policy Analysis and Assessment 2.
Polillo, Simone and Mauro F. Guillen. 2004. "Globalization Pressures and the State: The Global
Spread of Central Bank Independence." Mimeo.
Przeworski, Adam and James Raymond Vreeland. 2000. "The Effect of IMF Programmes on
Economic Growth." Journal of Development Economics 62:385-421.
Putnam, Robert. 1993. "Diplomacy and Domestic Politics: The Logic of Two-Level Games."
International Organization 42:427-460.
Quinn, Dennis P. and A. Maria Toyoda. 2003. "Anti-capitalist Sentiment as a Determinant of
International Financial Liberalization." in International Diffusion of Democracy and
Markets. UCLA.
Remmer, Karen L. 1998. "The Politics of Neoliberal Reform in South America, 1980-94."
Studies in Comparative International Development 33:3-29.
Roberts, Alasdair. 2003. "Three Patterns in the Diffusion of Transparency Rules: Money, Guns
and Human Rights." Mimeo.

Romanelli, Elaine and Michael L. Tushman. 1994. "Organizational Transformation as
Punctuated Equilibrium: An Empirical Test." Academy of Management Journal 37:1141-
1166.
Seo, Myeong-Gu and W.E. Douglas Creed. 2002. "Institutional Contradictions, Praxis and
Institutional Change: A Dialectical Perspective." Academy of Management Review
27:222-247.
Simmel, Georg. 1950. The Sociology of Georg Simmel. Translated by K. Wolff. Toronto,
Ontario: Free Press.
Simmons, Beth and Z Elkins. 2004. "The Globalization of Liberalization: Policy Diffusion in the
International Political Economy." American Politcial Science Review 98:171-189.
Spaventa, Luigi. 1983. "Two Letters of Intent: External Crises and Stabilization Policy, Italy,
1973-1977." Pp. 441-473, edited by J. Williamson. Washington D.C.: Institute for
International Economics.
Spiller, Pablo T. 1993. "Institutions and Regulatory Commitment in Utilities' Privatization."
Industrial and Corporate Change 2:387-450.
—. 1996. "Institutions and Commitment." Industrial and Corporate Change 5:421-452.
Stasavage, David. 2002. "Private Investment and Political Uncertainty." Economics and Politics
14:41-63.
Stigler, George J. 1971. "The Theory of Economic Regulation." Bell Journal of Economic and
Management Science 2:3-21.
Stone, D. 1999. "Learning Lessons and Transferring Policy Across Time, Space and
Disciplines." Politics 19:51-59.

Stone, Randall W. 2002. Lending Credibility: The International Monetary Fund and the Post-
Communist Transition. Princeton, NJ: Princeton University Press.
Strang, David. 1990. "From Dependency to Sovereignty: An Event History Analysis of
Decolonization 1870-1987." American Sociological Review 55:846-60.
Strang, David and Patricia Mei Yin Chang. 1993. "The International Labor Organization and the
Welfare State: Institutional Effects on Welfare Spending, 1960-80." International
Organization 47:235-262.
Strang, David and Michael W. Macy. 2001. "In Search of Excellence: Fads, Success Stories and
Adaptive Emulation." American Journal of Sociology 107:147-182.
The World Bank. 2004a. "Emergency Communications Development Project, Afghanistan." vol.
2004.
—. 2004b. "Private Sector Development and Competitiveness Project, Democratic Republic of
Congo." vol. 2004.
—. 2004c. "Telecommunications Technical Assistance Project, Bangladesh." vol. 2004.
Tornell, Aaron. 1998. "Reform from Within." Harvard Institute for International Development
Discussion Paper 650.
Treisman, Daniel. 2000. "Decentralization and Inflation: Commitment, Collective Action or
Continuity." American Political Science Review 94:837-857.
Tsebelis, George. 2003. Veto Players: How Political Institutions Work. Princeton, NJ: Princeton
University Press and Russell Sage Foundation.
Ul Haque, Nadeem and Mohsin S. Khan. 1998. "Do IMF-Supported Programs Work? A Survey
of Cross-Country Empirical Evidence." IMF Working Paper 1998.

Van Rossem, Ronald. 1996. "The World System Paradigm as General Theory of Development:
A Cross-National Test." American Sociological Review 61:508-527.
Vreeland, James Raymond. 2003. The IMF and Economic Development. New York, NY:
Cambridge University Press.
Wallsten, Scott. 2001. "An Empirical Analysis of Competition, Privatization and Regulation in
Africa and Latin America." Journal of Industrial Economics 49:1-19.
Wamukonya, Njeri. 2003. "Power Sector Reform in Developing Countries: Mismatched
Agendas." Pp. 7-47 in Electricity Reform: Social and Environmental Challenges, edited
by N. Wamukonya. Roskilde, Denmark: United Nations Environment Programme.
Waters, Malcolm. 1995. Globalization. New York, NY: Routledge.
Wei, L.J., D.Y. Lin, and L. Weissfeld. 1989. "Regression Analysis of Multivariate Incomplete
Failure Time Data by Modeling Marginal Distributions." Journal of the American
Statistical Association 84:1065-1073.
Westney, Eleanor. 1987. Imitation and Innovation: The Transfer of Western Organizational
Patterns to Meiji Japan. Cambridge, MA: Harvard University Press.
Westphal, James D., Ranjay Gulati, and Stephen M. Shortell. 1997. "Customization or
Conformity: An Institutional and Network Perspective on the Content and Consequences
of TQM Adoption." Administrative Science Quarterly 42:366-394.
Weyland, Kurt. 2003. "Theories of Policy Diffusion: An Assessment." in American Political
Science Association. Philadelphia, PA.
White, Matthew W. 1996. "Power Struggles: Explaining Deregulatory Reforms in Electricity
Markets." Brookings Papers: Microeconomics:201-250.

Williamson, John. 1993. "The Political Economy of Policy Reform." Washington D.C.: Institute
for International Economics.
Yebra, Covadonga Meseguer. 2002a. "The Diffusion of Privatization in Industrial and Latin
American Countries: What Role for Learning?"
—. 2002b. "Learning and Economic Policy Choices: An Analysis Along Bayesian Lines." in The
Politics of Regulation. Barcelona.
—. 2003. "Rational and Bounded Learning in the Diffusion of Policy Innovations." in American
Political Science Association. Philadelphia, PA.
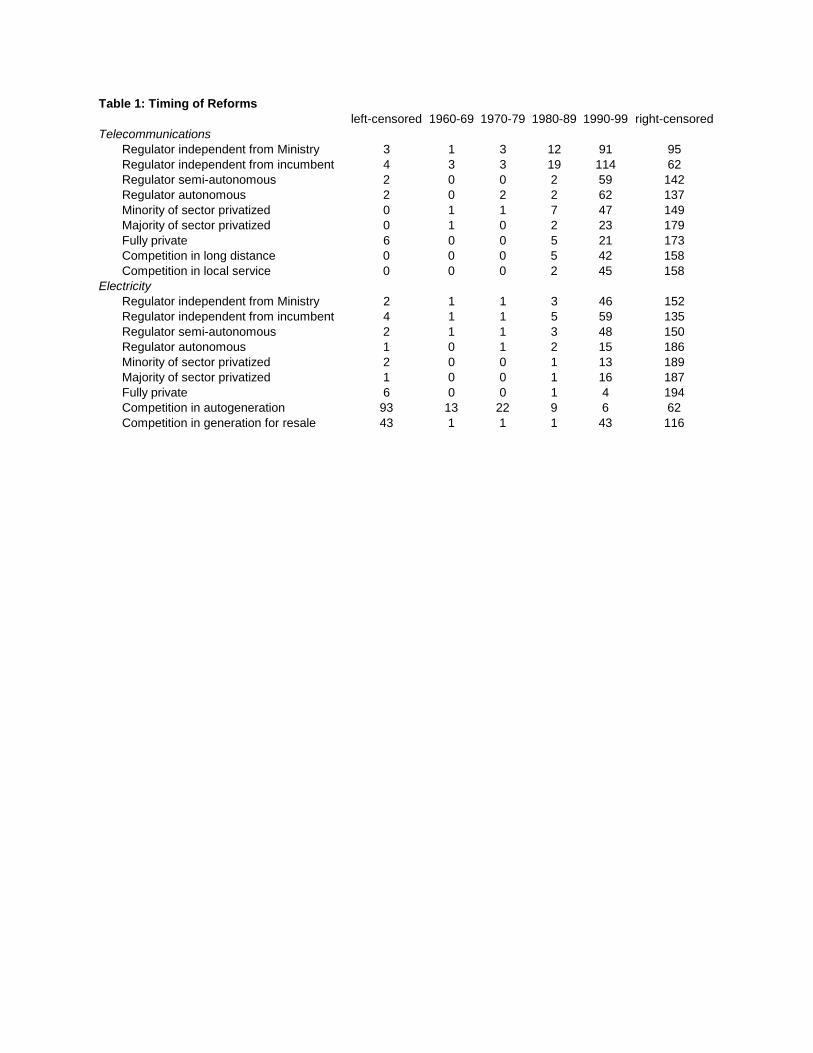
Table 1: Timing of Reformsleft-censored 1960-69 1970-79 1980-89 1990-99 right-censored
TelecommunicationsRegulator independent from Ministry 3 1 3 12 91 95Regulator independent from incumbent 4 3 3 19 114 62Regulator semi-autonomous 2 0 0 2 59 142Regulator autonomous 2 0 2 2 62 137Minority of sector privatized 0 1 1 7 47 149Majority of sector privatized 0 1 0 2 23 179Fully private 6 0 0 5 21 173Competition in long distance 0 0 0 5 42 158Competition in local service 0 0 0 2 45 158
ElectricityRegulator independent from Ministry 2 1 1 3 46 152Regulator independent from incumbent 4 1 1 5 59 135Regulator semi-autonomous 2 1 1 3 48 150Regulator autonomous 1 0 1 2 15 186Minority of sector privatized 2 0 0 1 13 189Majority of sector privatized 1 0 0 1 16 187Fully private 6 0 0 1 4 194Competition in autogeneration 93 13 22 9 6 62Competition in generation for resale 43 1 1 1 43 116

Table 2: Heterogeneity in Early and Comprehensive Reformers
Early ReformersTelecommunications ElectricityChile (1977) Chile (1978)Philippines (1979) New Zealand (1986)Hong Kong (1981) South Africa (1987)United Kingdom (1984) Spain (1988)Uruguay (1984) United Kingdom (1990)Japan (1985) Norway (1991)Spain (1987) Honduras (1991)Equatorial Guinea (1987) Argentina (1991)Haiti (1987) Peru (1992)Norway (1987) Grenada (1992)Belize (1988) Belize (1992)Mauritius (1988) Venezuela (1992)Finland (1988) Nepal (1992)Maldives (1988) Colombia (1992)Jamaica (1989) Hungary (1994)
Speed of Adoption of Comprehensive Reforms*Telecommunications ElectricityUnited Kingdom (1984) Chile (1986)Sweden (1993) United Kingdom (1991)Canada (1994) Barbados (1991)Finland (1994) Argentina (1993)Hong Kong (1995) Peru (1995)Philippines (1995) Australia (1996)El Salvador (1996) Bolivia (1996)Denmark (1997) Colombia (1997)Ghana (1997) Trinidad & Tobago (1997)Australia (1997) Spain (1998)India (1997) Portugal (1998)Netherlands (1997) Panama (1998)France (1998) Netherlands (1999)Austria (1998) Dominican Republic (1999)Belgium (1998) Italy (1999)
* Deregulation, Privatization and Liberalization
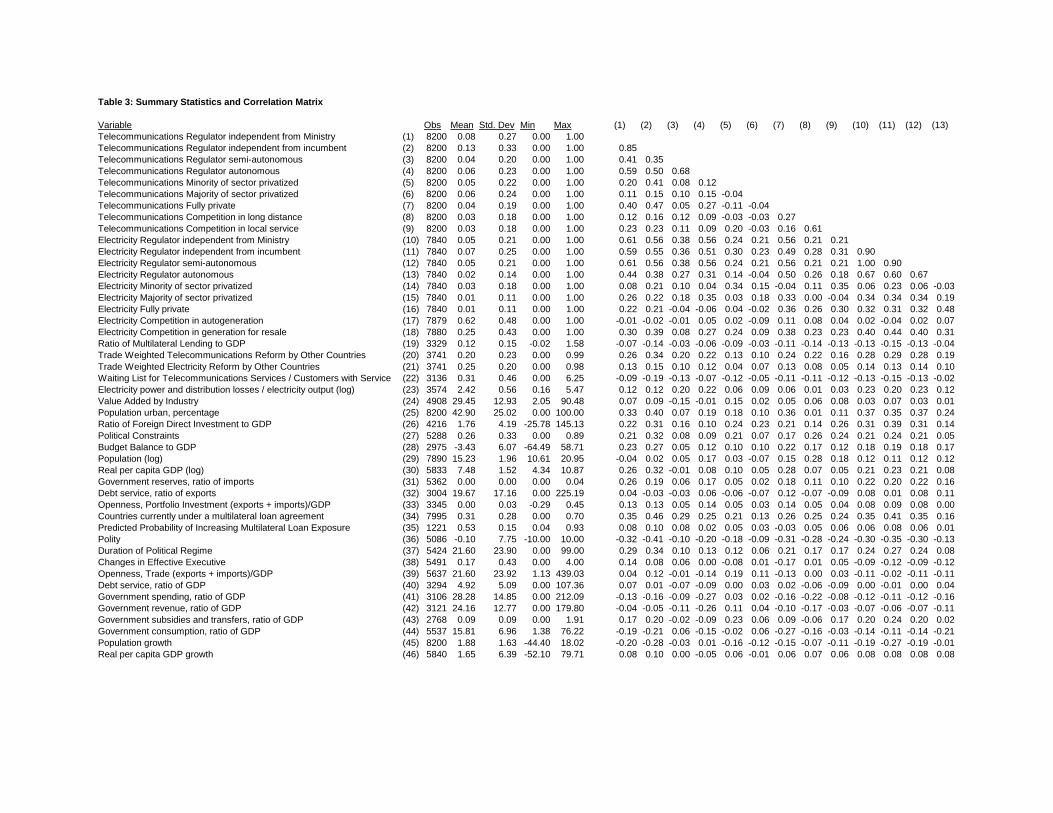
Table 3: Summary Statistics and Correlation Matrix
Variable Obs Mean Std. Dev Min Max (1) (2) (3) (4) (5) (6) (7) (8) (9) (10) (11) (12) (13)Telecommunications Regulator independent from Ministry (1) 8200 0.08 0.27 0.00 1.00Telecommunications Regulator independent from incumbent (2) 8200 0.13 0.33 0.00 1.00 0.85Telecommunications Regulator semi-autonomous (3) 8200 0.04 0.20 0.00 1.00 0.41 0.35Telecommunications Regulator autonomous (4) 8200 0.06 0.23 0.00 1.00 0.59 0.50 0.68Telecommunications Minority of sector privatized (5) 8200 0.05 0.22 0.00 1.00 0.20 0.41 0.08 0.12Telecommunications Majority of sector privatized (6) 8200 0.06 0.24 0.00 1.00 0.11 0.15 0.10 0.15 -0.04Telecommunications Fully private (7) 8200 0.04 0.19 0.00 1.00 0.40 0.47 0.05 0.27 -0.11 -0.04Telecommunications Competition in long distance (8) 8200 0.03 0.18 0.00 1.00 0.12 0.16 0.12 0.09 -0.03 -0.03 0.27Telecommunications Competition in local service (9) 8200 0.03 0.18 0.00 1.00 0.23 0.23 0.11 0.09 0.20 -0.03 0.16 0.61Electricity Regulator independent from Ministry (10) 7840 0.05 0.21 0.00 1.00 0.61 0.56 0.38 0.56 0.24 0.21 0.56 0.21 0.21Electricity Regulator independent from incumbent (11) 7840 0.07 0.25 0.00 1.00 0.59 0.55 0.36 0.51 0.30 0.23 0.49 0.28 0.31 0.90Electricity Regulator semi-autonomous (12) 7840 0.05 0.21 0.00 1.00 0.61 0.56 0.38 0.56 0.24 0.21 0.56 0.21 0.21 1.00 0.90Electricity Regulator autonomous (13) 7840 0.02 0.14 0.00 1.00 0.44 0.38 0.27 0.31 0.14 -0.04 0.50 0.26 0.18 0.67 0.60 0.67Electricity Minority of sector privatized (14) 7840 0.03 0.18 0.00 1.00 0.08 0.21 0.10 0.04 0.34 0.15 -0.04 0.11 0.35 0.06 0.23 0.06 -0.03Electricity Majority of sector privatized (15) 7840 0.01 0.11 0.00 1.00 0.26 0.22 0.18 0.35 0.03 0.18 0.33 0.00 -0.04 0.34 0.34 0.34 0.19Electricity Fully private (16) 7840 0.01 0.11 0.00 1.00 0.22 0.21 -0.04 -0.06 0.04 -0.02 0.36 0.26 0.30 0.32 0.31 0.32 0.48Electricity Competition in autogeneration (17) 7879 0.62 0.48 0.00 1.00 -0.01 -0.02 -0.01 0.05 0.02 -0.09 0.11 0.08 0.04 0.02 -0.04 0.02 0.07Electricity Competition in generation for resale (18) 7880 0.25 0.43 0.00 1.00 0.30 0.39 0.08 0.27 0.24 0.09 0.38 0.23 0.23 0.40 0.44 0.40 0.31Ratio of Multilateral Lending to GDP (19) 3329 0.12 0.15 -0.02 1.58 -0.07 -0.14 -0.03 -0.06 -0.09 -0.03 -0.11 -0.14 -0.13 -0.13 -0.15 -0.13 -0.04Trade Weighted Telecommunications Reform by Other Countries (20) 3741 0.20 0.23 0.00 0.99 0.26 0.34 0.20 0.22 0.13 0.10 0.24 0.22 0.16 0.28 0.29 0.28 0.19Trade Weighted Electricity Reform by Other Countries (21) 3741 0.25 0.20 0.00 0.98 0.13 0.15 0.10 0.12 0.04 0.07 0.13 0.08 0.05 0.14 0.13 0.14 0.10Waiting List for Telecommunications Services / Customers with Service (22) 3136 0.31 0.46 0.00 6.25 -0.09 -0.19 -0.13 -0.07 -0.12 -0.05 -0.11 -0.11 -0.12 -0.13 -0.15 -0.13 -0.02Electricity power and distribution losses / electricity output (log) (23) 3574 2.42 0.56 0.16 5.47 0.12 0.12 0.20 0.22 0.06 0.09 0.06 0.01 0.03 0.23 0.20 0.23 0.12Value Added by Industry (24) 4908 29.45 12.93 2.05 90.48 0.07 0.09 -0.15 -0.01 0.15 0.02 0.05 0.06 0.08 0.03 0.07 0.03 0.01Population urban, percentage (25) 8200 42.90 25.02 0.00 100.00 0.33 0.40 0.07 0.19 0.18 0.10 0.36 0.01 0.11 0.37 0.35 0.37 0.24Ratio of Foreign Direct Investment to GDP (26) 4216 1.76 4.19 -25.78 145.13 0.22 0.31 0.16 0.10 0.24 0.23 0.21 0.14 0.26 0.31 0.39 0.31 0.14Political Constraints (27) 5288 0.26 0.33 0.00 0.89 0.21 0.32 0.08 0.09 0.21 0.07 0.17 0.26 0.24 0.21 0.24 0.21 0.05Budget Balance to GDP (28) 2975 -3.43 6.07 -64.49 58.71 0.23 0.27 0.05 0.12 0.10 0.10 0.22 0.17 0.12 0.18 0.19 0.18 0.17Population (log) (29) 7890 15.23 1.96 10.61 20.95 -0.04 0.02 0.05 0.17 0.03 -0.07 0.15 0.28 0.18 0.12 0.11 0.12 0.12Real per capita GDP (log) (30) 5833 7.48 1.52 4.34 10.87 0.26 0.32 -0.01 0.08 0.10 0.05 0.28 0.07 0.05 0.21 0.23 0.21 0.08Government reserves, ratio of imports (31) 5362 0.00 0.00 0.00 0.04 0.26 0.19 0.06 0.17 0.05 0.02 0.18 0.11 0.10 0.22 0.20 0.22 0.16Debt service, ratio of exports (32) 3004 19.67 17.16 0.00 225.19 0.04 -0.03 -0.03 0.06 -0.06 -0.07 0.12 -0.07 -0.09 0.08 0.01 0.08 0.11Openness, Portfolio Investment (exports + imports)/GDP (33) 3345 0.00 0.03 -0.29 0.45 0.13 0.13 0.05 0.14 0.05 0.03 0.14 0.05 0.04 0.08 0.09 0.08 0.00Countries currently under a multilateral loan agreement (34) 7995 0.31 0.28 0.00 0.70 0.35 0.46 0.29 0.25 0.21 0.13 0.26 0.25 0.24 0.35 0.41 0.35 0.16Predicted Probability of Increasing Multilateral Loan Exposure (35) 1221 0.53 0.15 0.04 0.93 0.08 0.10 0.08 0.02 0.05 0.03 -0.03 0.05 0.06 0.06 0.08 0.06 0.01Polity (36) 5086 -0.10 7.75 -10.00 10.00 -0.32 -0.41 -0.10 -0.20 -0.18 -0.09 -0.31 -0.28 -0.24 -0.30 -0.35 -0.30 -0.13Duration of Political Regime (37) 5424 21.60 23.90 0.00 99.00 0.29 0.34 0.10 0.13 0.12 0.06 0.21 0.17 0.17 0.24 0.27 0.24 0.08Changes in Effective Executive (38) 5491 0.17 0.43 0.00 4.00 0.14 0.08 0.06 0.00 -0.08 0.01 -0.17 0.01 0.05 -0.09 -0.12 -0.09 -0.12Openness, Trade (exports + imports)/GDP (39) 5637 21.60 23.92 1.13 439.03 0.04 0.12 -0.01 -0.14 0.19 0.11 -0.13 0.00 0.03 -0.11 -0.02 -0.11 -0.11Debt service, ratio of GDP (40) 3294 4.92 5.09 0.00 107.36 0.07 0.01 -0.07 -0.09 0.00 0.03 0.02 -0.06 -0.09 0.00 -0.01 0.00 0.04Government spending, ratio of GDP (41) 3106 28.28 14.85 0.00 212.09 -0.13 -0.16 -0.09 -0.27 0.03 0.02 -0.16 -0.22 -0.08 -0.12 -0.11 -0.12 -0.16Government revenue, ratio of GDP (42) 3121 24.16 12.77 0.00 179.80 -0.04 -0.05 -0.11 -0.26 0.11 0.04 -0.10 -0.17 -0.03 -0.07 -0.06 -0.07 -0.11Government subsidies and transfers, ratio of GDP (43) 2768 0.09 0.09 0.00 1.91 0.17 0.20 -0.02 -0.09 0.23 0.06 0.09 -0.06 0.17 0.20 0.24 0.20 0.02Government consumption, ratio of GDP (44) 5537 15.81 6.96 1.38 76.22 -0.19 -0.21 0.06 -0.15 -0.02 0.06 -0.27 -0.16 -0.03 -0.14 -0.11 -0.14 -0.21Population growth (45) 8200 1.88 1.63 -44.40 18.02 -0.20 -0.28 -0.03 0.01 -0.16 -0.12 -0.15 -0.07 -0.11 -0.19 -0.27 -0.19 -0.01Real per capita GDP growth (46) 5840 1.65 6.39 -52.10 79.71 0.08 0.10 0.00 -0.05 0.06 -0.01 0.06 0.07 0.06 0.08 0.08 0.08 0.08

Table 3: Summary Statistics and Correlation Matrix (continued)
Variable (14) (15) (16) (17) (18) (19) (20) (21) (22) (23) (24) (25) (26) (27)Electricity Majority of sector privatized (15) -0.04Electricity Fully private (16) -0.03 -0.03Electricity Competition in autogeneration (17) -0.12 0.05 0.00Electricity Competition in generation for resale (18) 0.22 0.18 0.17 0.19Ratio of Multilateral Lending to GDP (19) -0.15 -0.04 -0.04 0.02 -0.31Trade Weighted Telecommunications Reform by Other Countries (20) 0.10 0.09 0.07 0.05 0.29 -0.08Trade Weighted Electricity Reform by Other Countries (21) 0.02 0.08 0.03 0.02 0.16 -0.04Waiting List for Telecommunications Services / Customers with Service (22) -0.13 -0.11 -0.07 0.09 -0.18 0.11 -0.26 -0.38Electricity power and distribution losses / electricity output (log) (23) -0.03 0.13 -0.04 -0.11 0.24 0.17 0.07 0.07 0.07Value Added by Industry (24) 0.14 -0.05 0.10 0.07 0.34 -0.45 0.04 0.06 0.00 -0.02 -0.14Population urban, percentage (25) 0.14 0.22 0.22 -0.17 0.38 -0.41 0.24 0.34 0.16 -0.30 0.11Ratio of Foreign Direct Investment to GDP (26) 0.32 0.12 0.17 -0.08 0.22 -0.20 0.19 0.28 0.09 -0.19 0.11 0.14Political Constraints (27) 0.17 0.07 0.08 0.03 0.24 -0.34 0.26 0.37 0.15 -0.32 0.04 0.29 0.30Budget Balance to GDP (28) 0.12 0.11 0.16 0.03 0.19 -0.27 0.20 0.29 0.11 -0.16 -0.10 0.34 0.11 0.15Population (log) (29) -0.03 0.05 0.00 0.29 0.33 -0.11 0.09 0.13 0.02 0.01 0.03 -0.04 -0.19 0.05Real per capita GDP (log) (30) 0.14 0.16 0.13 -0.03 0.34 -0.61 0.20 0.30 0.12 -0.29 -0.08 0.78 0.20 0.42Government reserves, ratio of imports (31) 0.00 0.20 0.20 -0.09 0.28 -0.27 0.14 0.20 0.10 -0.13 0.10 0.48 0.06 0.25Debt service, ratio of exports (32) -0.16 0.14 -0.01 0.07 0.05 0.24 0.00 -0.01 0.02 0.02 0.10 0.10 -0.21 -0.12Openness, Portfolio Investment (exports + imports)/GDP (33) 0.00 0.11 0.01 -0.02 0.08 -0.06 0.05 0.07 0.03 -0.06 0.02 0.13 0.00 0.14Countries currently under a multilateral loan agreement (34) 0.20 0.14 0.09 -0.11 0.18 -0.02 0.39 0.56 0.10 -0.39 0.15 0.29 0.28 0.34Predicted Probability of Increasing Multilateral Loan Exposure (35) 0.00 -0.07 -0.01 -0.04 0.04 -0.09 0.07 0.10 0.03 -0.01 0.07 0.00 0.01 0.19Polity (36) -0.20 -0.18 -0.18 0.03 -0.40 0.61 -0.32 -0.47 -0.17 0.36 0.02 -0.66 -0.27 -0.65Duration of Political Regime (37) 0.14 0.01 0.09 -0.08 0.19 -0.27 0.29 0.42 0.19 -0.23 0.23 0.33 0.20 0.70Changes in Effective Executive (38) 0.01 -0.04 -0.10 0.11 -0.05 0.10 0.09 0.13 0.02 0.01 0.03 -0.20 0.01 0.03Openness, Trade (exports + imports)/GDP (39) 0.30 -0.14 -0.03 -0.08 -0.10 0.00 0.01 0.02 -0.04 -0.05 -0.08 -0.08 0.38 0.11Debt service, ratio of GDP (40) -0.06 0.01 0.02 0.02 -0.02 0.29 -0.02 -0.03 0.00 -0.07 0.02 0.01 0.04 -0.08Government spending, ratio of GDP (41) 0.00 -0.12 -0.09 -0.05 -0.14 0.08 -0.20 -0.28 -0.13 0.17 0.06 -0.08 0.12 -0.09Government revenue, ratio of GDP (42) 0.06 -0.10 -0.03 -0.08 -0.03 -0.10 -0.14 -0.20 -0.09 0.10 0.00 0.12 0.20 -0.01Government subsidies and transfers, ratio of GDP (43) 0.15 0.05 0.09 -0.17 0.11 -0.27 -0.01 -0.01 -0.02 -0.12 0.08 0.43 0.18 0.23Government consumption, ratio of GDP (44) 0.12 -0.05 -0.13 -0.14 -0.23 0.07 -0.15 -0.22 -0.11 0.04 0.05 -0.17 0.12 -0.10Population growth (45) -0.13 -0.06 -0.06 0.19 -0.09 0.25 -0.14 -0.20 -0.06 0.17 -0.09 -0.31 -0.22 -0.33Real per capita GDP growth (46) 0.05 -0.01 0.10 0.01 0.06 -0.13 0.01 0.02 -0.01 0.04 0.04 0.04 0.10 0.13
(28) (29) (30) (31) (32) (33) (34) (35) (36) (37) (38) (39) (40) (41) (42) (43) (44) (45)Population (log) (29) 0.06Real per capita GDP (log) (30) 0.37 -0.18Government reserves, ratio of imports (31) 0.30 0.10 0.35Debt service, ratio of exports (32) 0.00 0.29 -0.14 0.15Openness, Portfolio Investment (exports + imports)/GDP (33) 0.05 0.06 0.12 0.14 0.00Countries currently under a multilateral loan agreement (34) 0.22 0.07 0.19 0.05 -0.03 0.08Predicted Probability of Increasing Multilateral Loan Exposure (35) -0.01 0.11 0.05 0.02 -0.01 0.04 0.07Polity (36) -0.46 -0.05 -0.78 -0.54 0.22 -0.16 -0.39 -0.10Duration of Political Regime (37) 0.22 -0.06 0.40 0.26 -0.12 0.12 0.33 0.26 -0.56Changes in Effective Executive (38) -0.06 -0.06 -0.10 0.04 -0.01 -0.08 0.06 -0.01 0.03 0.00Openness, Trade (exports + imports)/GDP (39) 0.01 -0.59 0.17 -0.27 -0.45 -0.06 0.15 -0.08 -0.09 0.07 0.03Debt service, ratio of GDP (40) -0.15 -0.16 -0.02 -0.03 0.31 -0.06 0.04 -0.02 0.15 -0.13 0.01 0.27Government spending, ratio of GDP (41) -0.36 -0.41 -0.01 -0.20 -0.12 -0.03 -0.02 -0.07 0.19 -0.25 0.04 0.36 0.26Government revenue, ratio of GDP (42) -0.05 -0.41 0.23 -0.09 -0.19 -0.01 0.05 -0.06 -0.06 -0.17 0.00 0.43 0.24 0.86Government subsidies and transfers, ratio of GDP (43) 0.15 -0.10 0.40 0.09 -0.06 0.08 0.26 0.07 -0.33 0.21 -0.12 0.09 0.10 0.48 0.64Government consumption, ratio of GDP (44) -0.29 -0.47 -0.11 -0.28 -0.19 -0.04 -0.06 -0.05 0.24 -0.27 -0.03 0.38 0.14 0.60 0.47 0.06Population growth (45) -0.21 0.01 -0.38 -0.04 0.15 -0.06 -0.39 -0.08 0.40 -0.36 0.15 -0.10 0.10 -0.11 -0.26 -0.60 0.19Real per capita GDP growth (46) 0.22 0.05 0.16 0.11 -0.16 0.02 0.02 -0.01 -0.18 0.10 0.02 0.12 -0.13 -0.11 0.02 0.08 -0.15 -0.19

Table 4: Base Regression Results
-First Stage- ------------Telecom------------- --------Electricity---------(1) (2) (3) (4) (5)
Reserves (as a ratio of imports) -46.816 Ratio of Multilateral Lending to GDP 2.730 0.391 1.117 -1.1140.001 (H1a > 0) 0.041 0.860 0.230 0.557
Budget Balance (as a ratio of GDP) -0.016 Trade Weighted Reform by Other Countries 1.384 1.412 1.324 1.3300.049 (H2 > 0) 0.001 0.001 0.012 0.010
Debt Service (as a ratio of exports) 0.007 Sectoral Performance Shortfall 0.406 0.400 0.301 0.3040.025 0.021 0.028 0.008 0.006
Ratio of Foreign Direct Investment to GDP 0.000 Value Added by Industry 0.005 0.000 0.007 0.0060.990 0.966 0.980 0.328 0.363
Ratio of Portfolio Investment to GDP 0.630 Urban population share 0.011 0.012 0.003 0.0040.579 0.193 0.179 0.669 0.646
Count of other countries receiving loan -0.393 Ratio of Foreign Direct Investment to GDP 0.046 0.045 0.029 0.0290.179 0.094 0.104 0.185 0.188
New Government? 0.169 Political Constraints 0.354 0.360 0.096 0.0920.027 0.336 0.334 0.616 0.630
Political Constraints -0.348 Budget Balance (as a ratio of GDP) 0.045 0.044 0.010 0.0100.026 0.033 0.037 0.374 0.404
Log of Population -0.051 Log of Population 0.137 0.135 0.118 0.1180.060 0.088 0.099 0.015 0.015
Log of Real Per Capita Income -0.178 Log of Real Per Capita Income 0.099 0.081 0.115 0.1140.000 0.632 0.700 0.393 0.398
Constant 2.320 Predicted Probability of Increasing -0.676 -0.561 0.078 0.1710.000 Multilateral Exposure, From (1) 0.484 0.573 0.892 0.760
Constant -8.110 -7.979 -14.834 -14.987N 11475 0.002 0.002 0.000 0.000
Pseudo Log-Likelihood -7417.5 Time Varying Coefficient EstimatesConstant 0.541 0.523 1.296 1.294
0.108 0.121 0.000 0.000Ratio of Multilateral Lending to GDP 0.510 0.341 (H1a > 0; H1b > 0) 0.003 0.030
N 5319 5319 5508 5508
Pseudo Log-Likelihood 433.7 447.0 1277.8 1297.4
* p-values are reported in italics underneath coefficient estimates.** Strata specific constants and time paramaters are suppressedNote: Dependent Variable in First Stage Regression (1) is a 0/1 indicator variable that takes the value of 1 when a country increases its exposure to multilateral institutions. Dependent Variable in Remaining Equations is a 0/1 indicator variable that takes the value of 1 when a country initiates a given reform in a given year.

Table 5: Robustness to Inclusion of Additional Independent Variables
(1) (2) (3) (4) (5) (6) (7) (8) (9) (10) (11) (12)Telecommunications, Effect of Multilateral Lending Constant Across Time
Ratio of Multilateral Lending to GDP 2.654 2.857 2.740 3.190 2.745 3.012 2.509 2.617 2.402 2.391 2.574 2.821 (H1 > 0) 0.032 0.035 0.039 0.073 0.041 0.025 0.071 0.057 0.076 0.076 0.060 0.038Trade Weighted Reform by Other Countries 1.220 1.328 1.394 0.990 1.394 1.345 1.371 1.380 1.150 1.169 1.362 1.462 (H2 > 0) 0.004 0.003 0.001 0.010 0.001 0.002 0.001 0.001 0.008 0.007 0.001 0.000Rotated Variable (See Note) 0.416 0.004 0.069 0.066 0.003 1.282 0.011 0.002 -0.028 -0.025 0.051 0.023
0.020 0.433 0.469 0.719 0.262 0.168 0.624 0.725 0.054 0.079 0.466 0.306
N 5319 5211 5319 3222 5310 5175 5319 5310 5193 5184 5319 5319
Telecommunications, Effect of Multilateral Lending Varying Across TimeRatio of Multilateral Lending to GDP 0.077 0.409 0.437 2.660 0.482 0.900 0.034 0.138 -0.114 -0.103 0.209 0.479 (H1a > 0) 0.974 0.853 0.842 0.467 0.828 0.671 0.988 0.952 0.962 0.966 0.927 0.827Trade Weighted Reform by Other Countries 1.260 1.359 1.426 1.044 1.425 1.370 1.400 1.411 1.188 1.207 1.394 1.494 (H2 > 0) 0.002 0.002 0.001 0.007 0.001 0.001 0.001 0.001 0.005 0.004 0.001 0.000Rotated Variable (See Note) 0.042 0.004 0.073 0.061 0.003 1.222 0.014 0.002 -0.028 -0.025 0.050 0.023
0.018 0.427 0.471 0.737 0.268 0.191 0.544 0.626 0.055 0.078 0.474 0.309Time Varying Coefficient EstimateRatio of Multilateral Lending to GDP 0.564 0.523 0.505 0.322 0.513 0.482 0.523 0.518 0.523 0.526 0.507 0.513 (H1a > 0; H1b > 0) 0.003 0.002 0.003 0.392 0.003 0.001 0.004 0.003 0.010 0.008 0.003 0.003
N 5319 5211 5319 3222 5310 5175 5319 5310 5193 5184 5319 5319
Electricity, Effect of Multilateral Lending Constant Across TimeRatio of Multilateral Lending to GDP 0.803 0.860 0.882 1.841 0.911 1.030 0.677 0.727 0.915 0.949 0.742 0.893 (H1a > 0) 0.370 0.335 0.334 0.080 0.311 0.255 0.474 0.432 0.346 0.324 0.402 0.326Trade Weighted Reform by Other Countries 1.371 1.516 1.430 0.985 1.420 1.441 1.414 1.416 1.343 1.349 1.296 1.456 (H2 > 0) 0.006 0.003 0.005 0.253 0.006 0.004 0.007 0.006 0.006 0.006 0.012 0.004Rotated Variable (See Note) 0.009 -0.004 -0.029 0.056 -0.001 -0.349 0.007 0.002 -0.009 -0.010 0.102 0.100
0.438 0.354 0.519 0.681 0.788 0.503 0.649 0.247 0.261 0.278 0.048 0.475
N 5616 5706 5706 3483 5697 5535 5706 5697 5580 5562 5706 5706
Electricity, Effect of Multilateral Lending Varying Across TimeRatio of Multilateral Lending to GDP -2.158 -1.828 -1.919 -2.838 -1.855 -1.995 -2.260 -2.054 -1.673 -1.514 -1.476 -1.989 (H1 > 0) 0.255 0.340 0.31 0.240 0.313 0.290 0.182 0.288 0.427 0.473 0.412 0.290Trade Weighted Reform by Other Countries 1.372 1.509 1.432 0.720 1.421 1.443 1.413 1.417 1.344 1.349 1.302 1.457 (H2 > 0) 0.005 0.002 0.004 0.218 0.005 0.003 0.006 0.005 0.005 0.004 0.009 0.003Rotated Variable (See Note) 0.010 -0.004 -0.029 0.065 -0.001 -0.365 0.008 0.003 -0.009 -0.010 0.100 0.098
0.404 0.395 0.522 0.637 0.776 0.478 0.566 0.222 0.238 0.258 0.048 0.483Time Varying Coefficient EstimateRatio of Multilateral Lending to GDP 0.420 0.398 0.408 0.624 0.402 0.462 0.418 0.403 0.375 0.365 0.338 0.414 (H1a > 0; H1b > 0) 0.023 0.034 0.03 0.082 0.033 0.014 0.027 0.030 0.048 0.052 0.061 0.031
N 5616 5706 5706 3483 5697 5535 5706 5697 5580 5562 5706 5706
* p-values are reported in italics underneath coefficient estimates.** Coefficient estimates other than those of theoretical interest, strata specific constants and time paramaters are all suppressedRotated Variable (1) Level of Democratization, Polity (2) Durability of Political Regime, Years since regime change (3) Durability of Political Leadership, Years of change in leadership (4) Ideology of Political Leadership, Right of Center Government (5) Openness of Host country economy, (exports + imports)/GDP (6) Openness of Host country economy, portfolio investment/GDP (7) Debt burden, debt service/GDP (8) Debt buden, debt service/exports (9) Size of government (expenditure), Share of GDP (10) Size of government (revenue), Government Share of GDP (11) Population growth (12) Real per capita income growth

Table 6: Robustness of Results to Varying Base Year for Hazard Analysis
---------------------------------Telecommunications--------------------------------- ----------------------------------------Electricity--------------------------------------(1) (2) (3) (4) (5) (6) (7) (8) (9) (10) (11) (12)
Ratio of Multilateral Lending to GDP 2.861 1.193 3.058 1.096 3.489 2.009 0.943 -0.921 1.132 -0.961 1.786 0.871 (H1a > 0) 0.031 0.556 0.024 0.598 0.009 0.342 0.283 0.607 0.224 0.587 0.094 0.581Trade Weighted Reform by Other Countries 1.177 1.210 1.256 1.292 1.192 1.237 1.281 1.270 1.323 1.328 1.340 1.341 (H2 > 0) 0.006 0.004 0.004 0.003 0.002 0.001 0.015 0.013 0.012 0.010 0.012 0.011Sectoral Performance Shortfall 0.386 0.383 0.434 0.428 0.491 0.482 0.288 0.292 0.305 0.309 0.290 0.296
0.034 0.042 0.019 0.024 0.018 0.023 0.009 0.007 0.008 0.006 0.017 0.014Value Added by Industry 0.007 0.006 0.003 0.003 0.002 0.002 0.007 0.007 0.007 0.006 0.004 0.004
0.600 0.620 0.788 0.805 0.856 0.865 0.268 0.303 0.340 0.374 0.568 0.600Urban population share 0.011 0.012 0.010 0.011 0.010 0.010 0.004 0.004 0.003 0.004 0.003 0.003
0.193 0.179 0.193 0.177 0.200 0.182 0.603 0.571 0.669 0.647 0.683 0.658Ratio of Foreign Direct Investment to GDP 0.031 0.031 0.041 0.041 0.043 0.042 0.029 0.029 0.029 0.029 0.031 0.031
0.255 0.269 0.140 0.151 0.131 0.142 0.196 0.201 0.183 0.184 0.161 0.155Political Constraints 0.317 0.325 0.324 0.332 0.430 0.437 0.135 0.129 0.094 0.089 0.093 0.087
0.372 0.368 0.362 0.358 0.227 0.226 0.464 0.484 0.628 0.643 0.656 0.677Budget Balance (as a ratio of GDP) 0.052 0.051 0.042 0.041 0.038 0.037 0.012 0.012 0.010 0.010 0.011 0.011
0.012 0.014 0.031 0.036 0.039 0.045 0.255 0.266 0.371 0.400 0.391 0.383Log of Population 0.138 0.136 0.141 0.138 0.137 0.134 0.111 0.111 0.118 0.119 0.129 0.129
0.078 0.086 0.073 0.082 0.076 0.087 0.019 0.018 0.016 0.015 0.013 0.013Log of Real Per Capita Income 0.127 0.108 0.147 0.128 0.195 0.176 0.088 0.084 0.117 0.116 0.146 0.143
0.538 0.605 0.458 0.522 0.323 0.381 0.492 0.512 0.391 0.394 0.300 0.311Predicted Probability of Increasing -0.080 0.008 -0.589 0.332 -0.518 -0.410 0.169 0.253 0.076 0.165 -0.110 -0.072 Multilateral Exposure, From (1), Table 4 0.938 0.994 0.545 0.358 0.627 0.709 0.758 0.636 0.897 0.773 0.886 0.925Constant -16.950 -17.006 -9.310 -0.487 -8.651 -8.507 -29.505 -30.122 -13.975 -14.107 -10.781 -10.834
0.003 0.003 0.000 0.628 0.000 0.000 0.001 0.001 0.000 0.000 0.000 0.000
Time Varying Coefficient EstimatesConstant 1.313 1.319 0.686 0.670 0.570 0.544 1.960 1.981 1.229 1.226 0.916 0.905
0.001 0.001 0.043 0.051 0.012 0.018 0.000 0.000 0.000 0.000 0.001 0.001Ratio of Multilateral Lending to GDP 0.169 0.424 0.455 0.137 0.354 0.337 (H1a > 0; H1b > 0) 0.004 0.005 0.061 0.029 0.034 0.137
N 5418 5418 5031 5031 4239 4239 6084 6084 5391 5391 4419 4419
Pseudo Log-Likelihood 935.60 948.46 384.85 397.77 177.32 190.92 2662.08 2683.52 1164.18 1183.30 592.74 607.78
* p-values are reported in italics underneath coefficient estimates.** Strata specific constants and time paramaters are suppressed*** Initial year for analysis set to 1960 in columns 1-2, 1979 for columsn 3-4, 1986 for columns 5-6, 1960 for columns 7-8, 1978 for columns 9-10 and 1987 for columns 11-12.

Table 7: Robustness of Results to Allowing Effect of Other Variables to Vary Across Time
---------------------------------Telecommunications--------------------------------- ----------------------------------------Electricity--------------------------------------(1) (2) (3) (4) (5) (6) (7) (8) (9) (10) (11) (12)
Ratio of Multilateral Lending to GDP 2.747 2.800 -0.459 0.446 2.832 -0.130 0.941 0.955 -2.672 -2.017 0.998 -2.528 (H1a > 0) 0.040 0.039 0.856 0.840 0.037 0.956 0.306 0.285 0.235 0.012 0.265 0.232Trade Weighted Reform by Other Countries -0.988 1.408 -1.326 1.430 -1.596 -1.733 -1.314 1.234 -1.053 1.249 -1.164 0.898 (H2 > 0) 0.628 0.001 0.539 0.001 0.443 0.406 0.431 0.015 0.534 0.012 0.506 0.617Sectoral Performance Shortfall 0.399 0.105 0.386 0.110 -0.254 -0.226 0.293 0.447 0.298 0.496 0.562 0.570
0.024 0.785 0.036 0.779 0.532 0.558 0.011 0.185 0.008 0.162 0.129 0.129Value Added by Industry 0.001 0.001 0.001 0.001 0.002 0.001 0.008 0.006 0.007 0.006 0.008 0.007
0.917 0.936 0.913 0.952 0.901 0.919 0.241 0.345 0.278 0.359 0.247 0.264Urban population share 0.012 0.011 0.012 0.012 0.011 0.012 0.003 0.004 0.004 0.004 0.003 0.003
0.181 0.197 0.172 0.181 0.190 0.176 0.675 0.654 0.657 0.641 0.685 0.671Ratio of Foreign Direct Investment to GDP 0.040 0.045 0.039 0.045 0.041 0.041 0.034 0.033 0.033 0.033 0.035 0.034
0.150 0.099 0.162 0.111 0.145 0.155 0.142 0.140 0.152 0.142 0.124 0.132Political Constraints 0.403 0.356 0.408 0.358 0.412 0.413 0.124 0.098 0.111 0.091 0.108 0.101
0.278 0.336 0.276 0.338 0.269 0.272 0.506 0.584 0.547 0.609 0.550 0.577Budget Balance (as a ratio of GDP) 0.046 0.044 0.045 0.044 0.046 0.046 0.011 0.011 0.010 0.010 0.011 0.011
0.030 0.037 0.030 0.039 0.031 0.030 0.335 0.317 0.386 0.365 0.305 0.354Log of Population 0.130 0.135 0.127 0.134 0.132 0.131 0.116 0.124 0.115 0.123 0.126 0.124
0.118 0.099 0.129 0.105 0.122 0.128 0.018 0.011 0.018 0.011 0.011 0.012Log of Real Per Capita Income 0.069 0.091 0.051 0.078 0.070 0.056 0.096 0.116 0.093 0.112 0.113 0.107
0.735 0.658 0.807 0.712 0.731 0.790 0.486 0.415 0.499 0.431 0.422 0.446Predicted Probability of Increasing -0.797 -0.705 -0.676 -0.545 -0.804 -0.629 0.078 0.101 0.182 0.193 0.036 0.133 Multilateral Exposure, From (1), Table 4 0.432 0.473 0.516 0.591 0.441 0.559 0.890 0.860 0.744 0.731 0.949 0.810Constant -7.235 -7.888 -6.924 -7.819 -6.780 -6.628 -12.878 -14.434 -12.934 -14.503 -14.001 -13.904
0.002 0.003 0.003 0.003 0.004 0.005 0.004 0.004 0.004 0.004 0.003 0.003
Time Varying Coefficient EstimatesConstant 0.481 0.517 0.439 0.502 0.403 0.379 1.108 1.076 1.101 1.090 1.038 1.040
0.139 0.144 0.168 0.160 0.255 0.280 0.004 0.009 0.005 0.009 0.009 0.010Ratio of Multilateral Lending to GDP 0.598 0.508 0.563 0.479 0.260 0.409 (H1a > 0; H1b > 0) 0.001 0.002 0.001 0.004 0.048 0.014Trade Weighted Reform by Other Countries 0.321 0.373 0.415 0.432 0.257 0.235 0.213 0.197
0.172 0.108 0.093 0.064 0.059 0.078 0.169 0.199Sectoral Performance Shortfall 0.049 0.039 0.096 0.081 0.045 0.035 0.034 0.027
0.329 0.402 0.118 0.131 0.231 0.316 0.427 0.481
N 5319 5319 5319 5319 5319 5319 5706 5706 5706 5706 5706 5706
Pseudo Log-Likelihood 445.94 458.54 440.23 451.29 452.02 463.05 1338.22 1351.35 1358.1 1368.3 1358.15 1374.79
* p-values are reported in italics underneath coefficient estimates.** Strata specific constants and time paramaters are suppressed

Table 8: Robustness of Results to Disaggregation of Dependent Variable, Telecommunications by Type of Reform
(1) (2) (3) (4) (5) (6) (7) (8) (9) (10)
Ratio of Multilateral Lending to GDP 2.698 -0.522 3.317 0.847 1.036 -6.024 5.454 0.456 -6.345 8.291 (H1a > 0) 0.063 0.817 0.015 0.671 0.641 0.276 0.014 0.909 0.435 0.698Trade Weighted Reform by Other Countries 1.194 1.200 1.028 1.023 1.593 1.633 2.071 2.071 0.844 0.838 (H2 > 0) 0.019 0.015 0.020 0.019 0.125 0.100 0.016 0.016 0.547 0.548Sectoral Performance Shortfall 0.434 0.419 0.562 0.556 -0.006 -0.055 0.569 0.571 0.713 0.703
0.012 0.015 0.000 0.000 0.988 0.884 0.223 0.215 0.330 0.346Value Added by Industry -0.010 -0.010 -0.003 -0.003 -0.039 -0.038 0.026 0.026 0.004 0.004
0.511 0.524 0.820 0.821 0.262 0.280 0.058 0.055 0.902 0.917Urban population share 0.011 0.011 0.010 0.010 0.014 0.015 0.035 0.035 0.005 0.005
0.276 0.272 0.331 0.334 0.317 0.281 0.015 0.014 0.673 0.671Ratio of Foreign Direct Investment to GDP 0.233 0.021 0.038 0.038 -0.011 -0.016 0.108 0.105 0.157 0.158
0.483 0.522 0.223 0.228 0.861 0.798 0.013 0.015 0.103 0.108Political Constraints 0.106 0.118 0.254 0.252 -0.486 -0.472 1.131 1.146 2.839 2.853
0.816 0.793 0.560 0.561 0.506 0.504 0.056 0.054 0.000 0.000Budget Balance (as a ratio of GDP) 0.022 0.022 0.024 0.024 0.014 0.014 0.073 0.074 0.296 0.297
0.284 0.288 0.274 0.279 0.677 0.691 0.038 0.040 0.001 0.000Log of Population 0.044 0.426 0.016 0.016 0.114 0.109 0.269 0.267 0.805 0.810
0.640 0.656 0.851 0.860 0.463 0.480 0.020 0.022 0.003 0.003Log of Real Per Capita Income 0.120 0.123 0.296 0.299 -0.410 -0.417 0.380 0.376 -0.417 -0.422
0.603 0.598 0.201 0.200 0.311 0.295 0.285 0.289 0.510 0.509Predicted Probability of Increasing -1.036 -0.888 -0.506 -0.461 -2.969 -2.647 2.883 2.986 -1.728 -1.682 Multilateral Exposure, From (1), Table 4 0.351 0.428 0.586 0.619 0.201 0.262 0.066 0.053 0.575 0.583Constant -6.542 -6.449 -8.123 -8.066 -3.776 -3.193 -25.073 -24.655 -39.886 -40.508
0.015 0.015 0.004 0.004 0.490 0.530 0.000 0.000 0.009 0.007
Time Varying Coefficient EstimatesConstant 0.626 0.600 0.653 0.635 1.669 1.691 1.492 1.484 2.064 2.078
0.059 0.059 0.055 0.061 0.009 0.000 0.000 0.049 0.000 0.000Ratio of Multilateral Lending to GDP 0.506 0.456 0.160 0.211 -0.318 (H1a > 0; H1b > 0) 0.004 0.006 0.629 0.552 0.747
N 2364 2364 1182 1182 1182 1182 1773 1773 1182 1182
Pseudo Log-Likelihood 407.16 411.27 375.22 376.00 46.90 49.13 35.80 36.24 70.41 70.52
* p-values are reported in italics underneath coefficient estimates.** Strata specific constants and time paramaters are suppressedDependent Variables (1)-(2) Measures of deregulation (Objective measures and subjective measures described below) (3)-(4) Objective measures of deregulation (Regulator independent of Ministry and Regulator independent of incumbent) (5)-(6) Subjective measures of deregulation (Regulator semiautonomous and Regulator autonomous) (7)-(8) Measures of privatization (minority privatization, majority privatization and full privatization) (9)-(10) Measures of competition (competition in long distance and local telephony)

Table 9: Robustness of Results to Disaggregation of Dependent Variable, Telecommunications by Individual Reform
(1) (2) (3) (4) (5) (6) (7) (8) (9) (10) (11) (12) (13) (14) (15) (16) (17) (18)
Ratio of Multilateral Lending to GDP 4.220 1.866 2.485 -0.380 -3.880 -16.428 2.160 -1.893 0.687 -8.166 17.356 124.000 11.873 12.135 -2.468 0.999 -22.088 39.659 (H1a > 0) 0.015 0.361 0.041 0.863 0.088 0.045 0.415 0.691 0.869 0.354 0.131 0.262 0.000 0.000 0.755 0.925 0.074 0.005Trade Weighted Reform by Other Countries 1.083 1.084 0.989 0.986 0.458 0.512 2.000 1.995 2.585 2.491 -11.195 -13.371 1.305 1.300 3.158 3.085 -1.144 -1.209 (H2 > 0) 0.032 0.031 0.029 0.027 0.580 0.535 0.111 0.108 0.043 0.055 0.582 0.531 0.180 0.182 0.037 0.042 0.510 0.491Sectoral Performance Shortfall 0.386 0.380 0.655 0.659 -0.549 -0.570 0.253 0.236 -0.595 -0.553 1.909 2.423 1.531 1.545 1.010 1.055 0.142 0.140
0.166 0.173 0.000 0.000 0.197 0.180 0.495 0.530 0.432 0.446 0.429 0.369 0.002 0.002 0.253 0.237 0.874 0.878Value Added by Industry -0.001 -0.001 -0.004 -0.004 -0.149 -0.147 -0.023 -0.023 0.080 0.079 0.201 0.253 0.000 0.000 -0.046 -0.045 0.055 0.058
0.951 0.957 0.711 0.718 0.000 0.000 0.498 0.505 0.000 0.000 0.291 0.319 0.991 0.990 0.166 0.168 0.236 0.215Urban population share 0.010 0.010 0.011 0.011 0.013 -0.012 0.022 0.022 0.047 0.047 0.080 0.103 0.026 0.026 -0.010 -0.011 0.042 0.046
0.431 0.435 0.269 0.285 0.524 0.561 0.106 0.104 0.099 0.095 0.213 0.280 0.179 0.181 0.411 0.403 0.031 0.014Ratio of Foreign Direct Investment to GDP 0.040 0.039 0.037 0.037 0.006 0.003 0.005 0.004 0.049 0.048 -0.057 -0.080 0.174 0.175 0.095 0.101 0.158 0.168
0.315 0.323 0.232 0.227 0.930 0.959 0.931 0.950 0.407 0.413 0.792 0.738 0.004 0.003 0.540 0.517 0.018 0.025Political Constraints 0.068 0.068 0.387 0.392 -0.733 -0.716 -0.468 -0.483 2.577 2.558 1.986 3.015 -0.509 -0.510 2.490 2.513 4.112 4.443
0.891 0.890 0.337 0.328 0.377 0.389 0.487 0.470 0.018 0.020 0.667 0.598 0.629 0.629 0.000 0.000 0.000 0.000Budget Balance (as a ratio of GDP) 0.018 0.018 0.029 0.029 0.043 0.042 0.007 0.006 0.030 0.030 0.661 0.728 0.108 0.109 0.284 0.290 0.291 0.301
0.487 0.494 0.167 0.172 0.395 0.402 0.849 0.859 0.457 0.464 0.013 0.022 0.253 0.253 0.002 0.002 0.008 0.006Log of Population -0.032 -0.033 0.048 0.052 -0.012 -0.020 0.197 0.192 -0.015 -0.020 -1.461 -1.763 0.581 0.587 0.924 0.953 0.642 0.678
0.776 0.769 0.533 0.500 0.926 0.874 0.294 0.307 0.934 0.909 0.358 0.417 0.013 0.013 0.004 0.004 0.025 0.027Log of Real Per Capita Income 0.232 0.237 0.318 0.345 -0.303 -0.352 -0.375 -0.383 -1.070 -1.076 -1.399 -1.866 1.692 1.716 0.100 0.155 -1.838 -1.972
0.430 0.425 0.115 0.093 0.541 0.475 0.407 0.398 0.027 0.029 0.612 0.615 0.005 0.004 0.896 0.842 0.009 0.004Predicted Probability of Increasing -1.533 -1.482 0.165 0.305 -2.331 -2.321 -3.408 -3.345 2.217 2.465 1.241 3.004 1.274 1.381 -5.633 -5.384 0.440 1.036 Multilateral Exposure, From (1), Table 4 0.192 0.204 0.855 0.733 0.475 0.472 0.109 0.114 0.544 0.474 0.815 0.555 0.643 0.618 0.032 0.040 0.918 0.800Constant -6.254 -6.151 -9.515 -9.717 -34.267 -32.022 -5.811 -5.469 -3.350 -3.021 -120.648 -154.030 -38.822 -39.326 -34.787 -36.500 -31.501 -35.126
0.062 0.064 0.001 0.001 0.010 0.013 0.304 0.329 0.562 0.605 0.244 0.177 0.000 0.000 0.012 0.010 0.069 0.054
Time Varying Coefficient EstimatesConstant 0.627 0.605 0.899 0.728 2.622 2.603 0.907 0.679 0.648 0.262 3.462 4.054 1.428 1.398 1.895 1.846 2.204 2.348
0.066 0.071 0.000 0.027 0.000 0.000 0.000 0.271 0.000 0.703 0.000 0.000 0.000 0.000 0.000 0.000 0.000 0.000Ratio of Multilateral Lending to GDP 0.374 0.413 0.286 0.568 1.494 -0.649 -0.012 -0.159 -2.323 (H1a > 0; H1b > 0) 0.007 0.054 0.087 0.060 0.136 0.000 0.931 0.648 0.000
N 591 591 591 591 591 591 591 591 591 591 591 591 591 591 591 591 591 591
Pseudo Log-Likelihood 133.89 134.18 243.46 243.73 42.48 42.65 16.98 17.24 2.21 2.50 8.73 9.14 60.08 60.09 45.37 45.39 37.96 38.98
* p-values are reported in italics underneath coefficient estimates.** Strata specific constants and time paramaters are suppressedDependent Variables: (1)-(2) Regulator Independent from Ministry (3)-(4) Regulator Independent from Incumbent (5)-(6) Regulator Semi-Autonomous (7)-(8) Regulator Autonomous (9)-(10) Minority Privatization (11)-(12) Majority Privatization (13)-(14) Complete Privatization (15)-(16) Competition Allowed in Long Distance Telephony (17)-(18) Competition Allowed in Local Telephony

Table 10: Robustness of Results to Disaggregation of Dependent Variable, Electricity by Type of Reform
(1) (2) (3) (4) (5) (6) (7) (8) (9) (10)
Ratio of Multilateral Lending to GDP 4.241 2.823 4.198 2.579 4.297 3.137 7.087 11.611 -0.829 -5.322 (H1a > 0) 0.018 0.425 0.016 0.567 0.029 0.304 0.234 0.001 0.087 0.000Trade Weighted Reform by Other Countries 0.236 0.239 -0.004 0.003 0.544 0.544 1.421 1.229 2.167 2.019 (H2 > 0) 0.696 0.692 0.994 0.996 0.468 0.468 0.403 0.390 0.032 0.037Sectoral Performance Shortfall 0.673 0.672 0.789 0.786 0.500 0.501 -0.183 -0.024 0.212 0.214
0.069 0.070 0.018 0.019 0.259 0.258 0.681 0.963 0.005 0.004Value Added by Industry -0.016 -0.016 -0.011 -0.011 -0.025 -0.025 0.001 -0.003 0.010 0.010
0.257 0.258 0.397 0.400 0.178 0.179 0.983 0.929 0.046 0.059Urban population share 0.026 0.026 0.019 0.019 0.038 0.038 0.044 0.049 -0.006 -0.005
0.212 0.211 0.273 0.274 0.166 0.166 0.175 0.104 0.205 0.214Ratio of Foreign Direct Investment to GDP 0.059 0.059 0.062 0.618 0.056 0.056 0.131 0.139 0.008 0.007
0.055 0.056 0.031 0.031 0.118 0.120 0.031 0.015 0.694 0.737Political Constraints 0.310 0.309 0.352 0.352 0.254 0.252 0.137 -0.015 0.075 0.070
0.510 0.511 0.443 0.442 0.614 0.617 0.875 0.986 0.592 0.612Budget Balance (as a ratio of GDP) 0.040 0.040 0.032 0.032 0.052 0.052 0.175 0.170 -0.001 -0.001
0.193 0.195 0.244 0.247 0.163 0.165 0.015 0.016 0.916 0.792Log of Population 0.210 0.209 0.171 0.171 0.270 0.270 -0.015 -0.003 0.107 0.106
0.047 0.049 0.079 0.081 0.037 0.038 0.942 0.989 0.002 0.002Log of Real Per Capita Income -0.100 -0.100 0.008 0.009 -0.287 -0.284 0.355 0.250 0.177 0.177
0.732 0.732 0.975 0.975 0.424 0.426 0.539 0.675 0.088 0.086Predicted Probability of Increasing -1.584 -1.572 -1.832 -1.816 -1.319 -1.304 -2.080 -1.675 0.634 0.756 Multilateral Exposure, From (1), Table 4 0.330 0.327 0.260 0.260 0.438 0.436 0.534 0.580 0.117 0.057Constant -13.936 -13.839 -14.133 -14.026 -10.325 -10.299 -12.529 -12.804 -7.460 -7.172
0.017 0.019 0.017 0.022 0.047 0.050 0.056 0.085 0.000 0.000
Time Varying Coefficient EstimatesConstant 1.119 1.108 1.134 1.122 1.103 1.100 1.577 1.545 0.176 0.154
0.006 0.009 0.006 0.010 0.030 0.033 0.000 0.000 0.000 0.000Ratio of Multilateral Lending to GDP 0.152 0.180 0.054 -0.320 0.424 (H1a > 0; H1b > 0) 0.664 0.676 0.871 0.619 0.056
N 2536 2536 1268 1268 1268 1268 1902 1902 1268 1268
Pseudo Log-Likelihood 340.10 340.25 239.17 239.24 104.92 104.96 -12.35 -4.78 1083.93 1090.84
* p-values are reported in italics underneath coefficient estimates.** Strata specific constants and time paramaters are suppressedDependent Variables (1)-(2) Measures of deregulation (Objective measures and subjective measures described below) (3)-(4) Objective measures of deregulation (Regulator independent of Ministry and Regulator independent of incumbent) (5)-(6) Subjective measures of deregulation (Regulator semiautonomous and Regulator autonomous) (7)-(8) Measures of privatization (minority privatization, majority privatization and full privatization) (9)-(10) Measures of competition (competition in the form of autoproduction or private generation for resale)

Table 11: Robustness of Results to Disaggregation of Dependent Variable, Electricity by Individual Reform
(1) (2) (3) (4) (5) (6) (7) (8) (9) (10) (11) (12) (13) (14) (15) (16) (17) (18)
Ratio of Multilateral Lending to GDP 4.574 2.690 3.890 2.593 4.576 2.679 4.043 4.038 -44.510 -36.200 13.264 21.920 13.178 34.582 -0.540 -3.386 -0.762 -8.119 (H1a > 0) 0.010 0.493 0.029 0.627 0.010 0.495 0.194 0.247 0.006 0.055 0.037 0.006 0.002 0.022 0.174 0.108 0.601 0.005Trade Weighted Reform by Other Countries 0.173 0.181 -0.195 -0.191 0.193 0.201 1.194 1.194 -1.310 -1.312 -5.762 -5.727 -5.020 -5.294 2.833 2.832 1.415 1.437 (H2 > 0) 0.783 0.773 0.735 0.740 0.758 0.748 0.428 0.428 0.509 0.508 0.216 0.212 0.158 0.187 0.009 0.010 0.167 0.166Sectoral Performance Shortfall 0.872 0.870 0.731 0.729 0.870 0.868 -0.289 -0.289 -0.160 -0.158 1.329 1.312 -4.161 -4.089 0.015 0.015 0.779 0.769
0.025 0.026 0.016 0.018 0.026 0.027 0.623 0.623 0.829 0.831 0.099 0.101 0.054 0.051 0.749 0.755 0.000 0.000Value Added by Industry -0.021 -0.021 -0.004 -0.004 -0.021 -0.021 -0.035 -0.035 0.120 0.120 -0.248 -0.252 0.057 0.061 0.001 0.000 0.031 0.030
0.135 0.137 0.801 0.801 0.138 0.141 0.350 0.349 0.001 0.001 0.000 0.000 0.137 0.151 0.834 0.941 0.005 0.006Urban population share 0.023 0.023 0.016 0.016 0.023 0.023 0.083 0.083 0.022 0.022 0.169 0.172 0.393 0.391 -0.008 -0.008 -0.005 -0.005
0.280 0.280 0.352 0.353 0.280 0.280 0.105 0.105 0.562 0.562 0.001 0.000 0.061 0.061 0.036 0.032 0.507 0.522Ratio of Foreign Direct Investment to GDP 0.059 0.059 0.064 0.064 0.059 0.058 0.054 0.054 0.046 0.046 0.277 0.279 0.047 0.040 -0.007 -0.008 0.044 0.042
0.118 0.119 0.011 0.010 0.119 0.121 0.216 0.216 0.709 0.708 0.000 0.000 0.566 0.642 0.701 0.674 0.086 0.106Political Constraints 0.298 0.298 0.403 0.405 0.297 0.297 0.198 0.198 2.267 2.256 -1.488 -1.573 -1.351 -1.213 -0.024 -0.028 0.260 0.009
0.545 0.545 0.377 0.374 0.313 0.548 0.764 0.764 0.019 0.020 0.362 0.332 0.003 0.038 0.789 0.761 0.413 0.539Budget Balance (as a ratio of GDP) 0.031 0.031 0.033 0.033 0.031 0.031 0.088 0.088 0.047 0.047 0.017 0.172 0.403 0.401 -0.002 -0.003 0.010 0.217
0.313 0.317 0.194 0.195 0.313 0.317 0.089 0.089 0.533 0.533 0.053 0.065 0.005 0.006 0.552 0.435 0.504 0.000Log of Population 0.212 0.211 0.137 0.136 0.211 0.211 0.455 0.456 -0.543 -0.545 0.375 0.380 1.596 1.602 0.071 0.072 0.217 0.431
0.044 0.045 0.160 0.161 0.044 0.045 0.139 0.139 0.159 0.157 0.185 0.172 0.147 0.152 0.028 0.026 0.001 0.041Log of Real Per Capita Income 0.012 0.013 0.003 0.003 0.012 0.013 -1.143 -1.143 -1.324 -1.326 -0.316 -0.360 -4.274 -4.345 0.149 0.155 0.437 0.253
0.971 0.968 0.992 0.992 0.969 0.967 0.091 0.092 0.240 0.239 0.726 0.682 0.085 0.088 0.055 0.046 0.041 0.420Predicted Probability of Increasing -2.031 -2.001 -1.682 -1.670 -2.025 -2.004 -0.709 -0.710 2.955 2.945 -7.704 -7.812 -4.595 -4.713 0.436 0.480 1.016 1.188 Multilateral Exposure, From (1), Table 4 0.258 0.259 0.271 0.271 0.260 0.261 0.738 0.738 0.599 0.600 0.211 0.206 0.011 0.002 0.239 0.209 0.152 0.079Constant -14.634 -14.493 -14.641 -14.533 -14.620 -14.478 -7.213 -7.213 -10.113 -10.261 -15.213 -15.739 -23.821 -25.288 -5.515 -5.440 -12.966 -12.721
0.017 0.021 0.014 0.020 0.018 0.021 0.241 0.241 0.539 0.539 0.161 0.124 0.120 0.123 0.001 0.001 0.000 0.000
Time Varying Coefficient EstimatesConstant 1.096 1.801 1.267 1.257 1.095 1.079 0.488 0.487 2.018 2.026 0.434 0.589 1.417 1.555 0.169 0.137 0.221 0.176
0.009 0.013 0.001 0.003 0.009 0.013 0.346 0.342 0.000 0.000 0.771 0.681 0.001 0.001 0.000 0.000 0.064 0.120Ratio of Multilateral Lending to GDP 0.195 0.115 0.197 0.001 -0.364 -1.711 -1.677 0.667 1.479 (H1a > 0; H1b > 0) 0.610 0.800 0.608 0.997 0.639 0.071 0.017 0.113 0.000
N 634 634 634 634 634 634 634 634 634 634 634 634 634 634 634 634 634 634
Pseudo Log-Likelihood 103.64 103.68 137.03 137.05 103.66 103.69 10.37 10.37 12.41 12.41 18.73 18.82 9.95 10.09 756.35 756.63 354.89 357.09
* p-values are reported in italics underneath coefficient estimates.** Strata specific constants and time paramaters are suppressedDependent Variables: (1)-(2) Regulator Independent from Ministry (3)-(4) Regulator Independent from Incumbent (5)-(6) Regulator Semi-Autonomous (7)-(8) Regulator Autonomous (9)-(10) Minority Privatization (11)-(12) Majority Privatization (13)-(14) Complete Privatization (15)-(16) Competition Allowed in Autoproduction (17)-(18) Competition Allowed in Private Generation

Appendix Table 1: Year of Telecommunications Reform Country Name ind_min ind_inc ind_sa ind_a priv_min priv_maj priv_full comp_ld comp_l Afghanistan Albania 1998 1998 1998 1998 Algeria American Samoa <=1960 <=1960 <=1960 <=1960 1996 Andorra Angola 1999 1999 1999 1999 Antigua and Barbuda Argentina 1990 1990 1990 1990 Armenia 1998 1998 Aruba Australia 1992 1992 1997 1997 1997 1991 1991 Austria 1997 1997 1997 1997 1998 1998 1998 Azerbaijan 1996 Bahamas, The 1993 1993 1999 1999 Bahrain 1996 1981 1981 Bangladesh 1989 Barbados <=1960 <=1960 1991 1991 <=1960 Belarus Belgium 1993 1993 1993 1996 1998 1998 Belize 1988 1988 1996 Benin Bermuda 1996 Bhutan 1999 1999 Bolivia 1995 1995 1995 1995 1995 Bosnia and Herzegovina 1999 1999 1999 1999 Botswana 1996 1996 1996 1996 Brazil 1997 1997 1997 1997 1998 1999 1999 Brunei Bulgaria 1998 1998 1998 Burkina Faso 1999 1999 1999 Burundi 1997 1997 1997 Cambodia Cameroon 1998 1998 1998 1998 Canada 1976 1976 1976 1991 1992 1994 Cape Verde 1992 1992 1995 Cayman Islands Central African Republic 1990

Country Name ind_min ind_inc ind_sa ind_a priv_min priv_maj priv_full comp_ld comp_l Chad Channel Islands Chile 1977 1977 1978 1989 1994 1994 China 1997 1994 Colombia 1994 1994 1994 1994 1998 1998 Comoros Congo, Dem. Rep. Congo, Rep. Costa Rica 1963 1963 1996 1996 Cote d'Ivoire 1995 1995 1997 Croatia Cuba 1995 Cyprus Czech Republic 1994 1994 1994 1995 Denmark 1991 1991 1997 1997 1991 1996 1996 Djibouti 1998 1998 Dominica 1967 1967 Dominican Republic 1998 1990 1998 1998 1990 1990 1990 Ecuador 1995 1995 1995 1995 Egypt, Arab Rep. 1998 1998 El Salvador 1996 1996 1996 1996 1998 1996 1996 Equatorial Guinea 1987 1987 Eritrea 1998 1998 Estonia 1998 1993 1998 1998 1993 1998 Ethiopia 1996 1996 1996 1996 Faeroe Islands 1991 1996 1996 Fiji Finland 1988 1988 1988 1988 1998 1994 1994 France 1997 1997 1997 1997 1997 1998 1998 French Polynesia 1997 1997 1997 1997 Gabon Gambia, The Georgia 1994 1994 1994 Germany 1998 1996 1998 1998 1996 1998 1998 Ghana 1996 1996 1996 1996 1997 1997 1997 Greece 1993 1993 1993 1993 1996 Greenland 1991 1996 1996 Grenada 1998 1998 Guam 1983

Country Name ind_min ind_inc ind_sa ind_a priv_min priv_maj priv_full comp_ld comp_l Guatemala 1996 1996 1996 1996 1998 1998 1998 Guinea 1995 1996 Guinea-Bissau 1989 1989 Guyana 1991 1991 Haiti 1987 1987 1995 Honduras 1996 1996 1996 1996 Hong Kong, China 1993 1981 1993 1993 1981 1995 1995 Hungary 1990 1990 1993 Iceland 1997 1997 1997 1997 1998 1998 India 1997 1997 1997 1997 1994 1994 Indonesia 1993 1993 1995 Iran, Islamic Rep. Iraq Ireland 1997 1997 1997 1997 1999 1999 1999 Isle of Man 1984 1984 1987 Israel 1990 1990 Italy 1997 1997 1997 1997 1997 1998 1998 Jamaica 1995 1989 1989 Japan 1985 1998 1985 1985 Jordan 1995 1995 1995 1995 Kazakhstan 1994 1994 Kenya 1999 1999 1999 1999 1999 1999 Kiribati 1996 1983 1983 Korea, Dem. Rep. Korea, Rep. 1993 1993 1996 1999 Kuwait Kyrgyz Republic 1997 1997 1997 1997 Lao PDR 1998 1998 Latvia 1992 1993 Lebanon Lesotho Liberia Libya Liechtenstein 1999 1999 Lithuania 1998 1998 Luxembourg 1997 1997 1997 1997 1998 1998 Macao, China Macedonia, FYR Madagascar 1997 1995 1995
Country Name ind_min ind_inc ind_sa ind_a priv_min priv_maj priv_full comp_ld comp_l Malawi 1998 1998 1998 1998 Malaysia 1998 1990 1990 1996 1996 Maldives 1988 1988 Mali Malta 1997 1997 1997 1997 1998 Marshall Islands 1987 1990 1990 Mauritania 1999 1999 1999 1999 Mauritius 1988 1988 1998 1998 Mayotte Mexico 1996 1990 1990 1997 Micronesia, Fed. Sts. Moldova Monaco 1997 1999 Mongolia 1995 1995 1995 Morocco 1997 1997 1997 Mozambique 1992 1992 1992 Myanmar Namibia 1992 1992 1999 1999 Nepal 1997 1997 1997 1997 Netherlands 1997 1989 1997 1997 1994 1995 1997 1997 Netherlands Antilles 1992 1992 New Caledonia New Zealand 1990 1990 1991 1996 Nicaragua 1995 1995 1995 <=1960 Niger Nigeria 1992 1992 1992 1992 1993 1999 Northern Mariana Islands Norway 1987 1987 1998 1998 1998 1998 Oman Pakistan 1996 1994 1996 1996 1994 Palau Panama 1996 1996 1996 1996 1997 Papua New Guinea 1997 1997 Paraguay 1995 1995 Peru 1993 1993 1993 1993 1994 1999 Philippines 1979 1979 1979 1990 1995 1995 Poland 1990 1990 1998 1998 Portugal 1991 1991 1991 1991 1995 1997 Puerto Rico 1996 1996 1998 <=1960 1989 1996

Country Name ind_min ind_inc ind_sa ind_a priv_min priv_maj priv_full comp_ld comp_l Qatar 1998 1998 Romania 1997 1997 Russian Federation 1997 1997 Rwanda 1996 1996 Samoa San Marino 1997 1997 Sao Tome and Principe 1997 1997 Saudi Arabia 1998 Senegal 1997 1997 1997 Seychelles <=1960 Sierra Leone Singapore 1992 1992 1992 1992 1993 1999 Slovak Republic 1993 1993 Slovenia 1997 1996 1996 Solomon Islands 1988 1988 Somalia 1995 1995 1995 1995 South Africa 1997 1997 1997 1997 1997 Spain 1987 1987 1997 1997 1987 1997 1998 1998 Sri Lanka 1991 1991 1997 St. Kitts and Nevis 1985 1985 1990 St. Lucia 1965 1965 1998 St. Vincent and the Grenadines <=1960 <=1960 Sudan 1996 1994 1994 Suriname 1980 1999 1999 Swaziland Sweden 1992 1992 1992 1992 1993 1993 1993 Switzerland 1992 1992 1992 1992 1998 1998 1998 Syrian Arab Republic 1985 Tajikistan 1995 1995 Tanzania 1994 1993 1994 1994 1995 Thailand 1990 Togo 1999 1999 Tonga Trinidad and Tobago 1991 1991 1995 Tunisia 1995 1995 Turkey 1994 Turkmenistan Uganda 1997 1997 1997 1997 1998 1998 1998 Ukraine

Country Name ind_min ind_inc ind_sa ind_a priv_min priv_maj priv_full comp_ld comp_l United Arab Emirates 1999 1999 United Kingdom 1984 1984 1984 1984 1984 1982 1991 United States <=1960 <=1960 <=1960 <=1960 <=1960 1980 1992 Uruguay 1984 1984 Uzbekistan 1997 1997 Vanuatu 1989 1989 1996 Venezuela, RB 1991 1991 1991 1991 1997 Vietnam 1997 Yemen, Rep. Yugoslavia, FR (Serbia/Montenegro) 1999 1999 Zambia 1994 1994 1994 1994 Zimbabwe Key: ind_min = Regulator independent from ministry ind_inc = Regulator independent from incumbent ind_sa = Regulator semiautonomous from political influence ind_a = Regulator autonomous from political influence priv_min = Minority of formerly state-owned enterprise privatized priv_maj = Majority of formerly state-owned enterprise privatized priv_full = All of formerly state-owned enterprise privatized comp_ld = Competition exists in long distance service comp_l = Competition exists in local service

Appendix Table 2: Year of Electricity Generation Reform Country Name ind_min ind_inc ind_sa ind_a priv_min priv_maj priv_full comp_ap comp_pu Afghanistan Albania 1995 1995 1995 1995 Algeria <=1960 American Samoa Andorra Angola <=1960 <=1960 Antigua and Barbuda 1975 Argentina 1991 1991 1991 1993 <=1960 <=1960 Armenia Aruba Australia 1996 1996 1996 1996 1996 <=1960 <=1960 Austria <=1960 <=1960 Azerbaijan 1996 Bahamas, The Bahrain <=1960 Bangladesh 1966 1998 Barbados <=1960 <=1960 <=1960 1991 1982 1991 Belarus Belgium <=1960 1999 1999 <=1960 <=1960 <=1960 Belize 1992 1992 1992 Benin 1983 Bermuda <=1960 <=1960 Bhutan Bolivia 1994 1994 1994 1994 1996 <=1960 <=1960 Bosnia and Herzegovina <=1960 Botswana 1993 Brazil 1995 1995 1995 1995 <=1960 <=1960 Brunei <=1960 Bulgaria 1989 Burkina Faso Burundi <=1960 Cambodia 1996 1996 Cameroon <=1960 Canada 1961 1961 1961 <=1960 <=1960 Cape Verde

Country Name ind_min ind_inc ind_sa ind_a priv_min priv_maj priv_full comp_ap comp_pu Cayman Islands Central African Republic <=1960 Chad Chile 1978 1978 1978 1978 1986 1988 <=1960 <=1960 China <=1960 1987 Colombia 1994 1994 1994 1997 <=1960 1992 Comoros Congo, Dem. Rep. <=1960 Congo, Rep. 1974 Costa Rica 1996 1996 1996 1996 <=1960 1993 Cote d'Ivoire 1997 1997 1977 1997 Croatia <=1960 Cuba <=1960 Cyprus 1978 Czech Republic 1992 1992 <=1960 1995 Denmark 1999 1999 <=1960 <=1960 <=1960 Djibouti <=1960 Dominica 1997 1997 1997 Dominican Republic 1999 1999 1999 1999 <=1960 <=1960 Ecuador 1997 1997 1997 1997 <=1960 <=1960 Egypt, Arab Rep. <=1960 El Salvador 1997 1997 1997 <=1960 1995 Equatorial Guinea 1998 Eritrea Estonia 1997 1997 1997 1999 1997 1999 Ethiopia 1966 Faeroe Islands Fiji <=1960 Finland 1995 1995 1995 <=1960 1998 France <=1960 <=1960 Gabon 1997 1997 1995 1997 Gambia, The Georgia 1997 1997 1997 1997 1995 Germany <=1960 <=1960 <=1960 Ghana 1997 1997 1997 1997 1977 1997 Greece <=1960 Greenland Grenada 1992 1992 1992

Country Name ind_min ind_inc ind_sa ind_a priv_min priv_maj priv_full comp_ap comp_pu Guam Guatemala 1996 1996 1996 <=1960 <=1960 Guinea 1973 Guinea-Bissau Guyana 1998 1969 1998 Haiti 1973 Honduras 1991 1991 1991 <=1960 1994 Hong Kong, China <=1960 <=1960 Hungary 1994 1994 1994 <=1960 <=1960 Iceland <=1960 India 1998 1998 1998 <=1960 <=1960 Indonesia <=1960 <=1960 Iran, Islamic Rep. <=1960 Iraq 1978 Ireland 1999 1999 1999 <=1960 1993 Israel 1996 1996 1996 1996 <=1960 <=1960 Italy 1996 1996 1996 1996 1999 <=1960 <=1960 Jamaica 1997 1997 1997 <=1960 1994 Japan <=1960 <=1960 <=1960 Jordan 1999 <=1960 Kazakhstan 1996 1996 1997 1999 <=1960 Kenya 1998 1998 1998 <=1960 1997 Kiribati Korea, Dem. Rep. Korea, Rep. 1966 1991 Kuwait <=1960 Kyrgyz Republic 1996 1996 1996 Lao PDR 1998 Latvia 1998 1998 1998 <=1960 <=1960 Lebanon 1975 Lesotho Liberia 1967 Libya 1963 1979 Liechtenstein Lithuania 1998 1995 1998 1995 1995 Luxembourg <=1960 <=1960 <=1960 Macao, China 1978 Macedonia, FYR 1963 Madagascar 1998 1975
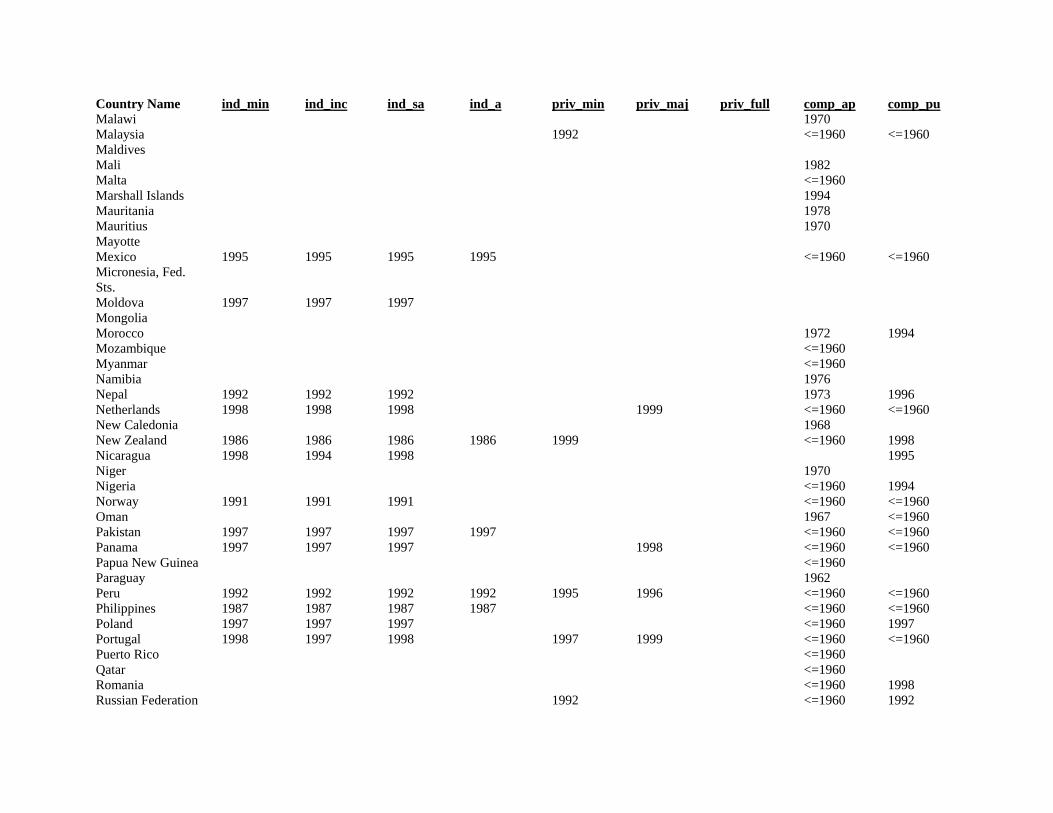
Country Name ind_min ind_inc ind_sa ind_a priv_min priv_maj priv_full comp_ap comp_pu Malawi 1970 Malaysia 1992 <=1960 <=1960 Maldives Mali 1982 Malta <=1960 Marshall Islands 1994 Mauritania 1978 Mauritius 1970 Mayotte Mexico 1995 1995 1995 1995 <=1960 <=1960 Micronesia, Fed. Sts. Moldova 1997 1997 1997 Mongolia Morocco 1972 1994 Mozambique <=1960 Myanmar <=1960 Namibia 1976 Nepal 1992 1992 1992 1973 1996 Netherlands 1998 1998 1998 1999 <=1960 <=1960 New Caledonia 1968 New Zealand 1986 1986 1986 1986 1999 <=1960 1998 Nicaragua 1998 1994 1998 1995 Niger 1970 Nigeria <=1960 1994 Norway 1991 1991 1991 <=1960 <=1960 Oman 1967 <=1960 Pakistan 1997 1997 1997 1997 <=1960 <=1960 Panama 1997 1997 1997 1998 <=1960 <=1960 Papua New Guinea <=1960 Paraguay 1962 Peru 1992 1992 1992 1992 1995 1996 <=1960 <=1960 Philippines 1987 1987 1987 1987 <=1960 <=1960 Poland 1997 1997 1997 <=1960 1997 Portugal 1998 1997 1998 1997 1999 <=1960 <=1960 Puerto Rico <=1960 Qatar <=1960 Romania <=1960 1998 Russian Federation 1992 <=1960 1992
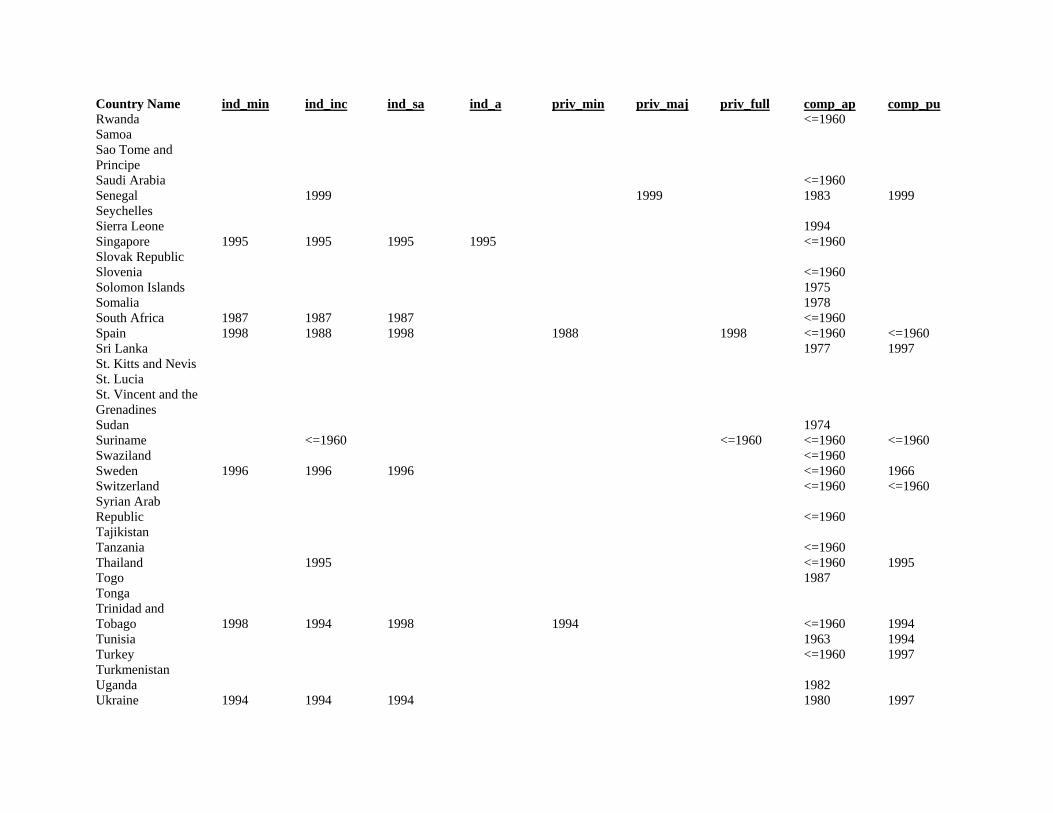
Country Name ind_min ind_inc ind_sa ind_a priv_min priv_maj priv_full comp_ap comp_pu Rwanda <=1960 Samoa Sao Tome and Principe Saudi Arabia <=1960 Senegal 1999 1999 1983 1999 Seychelles Sierra Leone 1994 Singapore 1995 1995 1995 1995 <=1960 Slovak Republic Slovenia <=1960 Solomon Islands 1975 Somalia 1978 South Africa 1987 1987 1987 <=1960 Spain 1998 1988 1998 1988 1998 <=1960 <=1960 Sri Lanka 1977 1997 St. Kitts and Nevis St. Lucia St. Vincent and the Grenadines Sudan 1974 Suriname <=1960 <=1960 <=1960 <=1960 Swaziland <=1960 Sweden 1996 1996 1996 <=1960 1966 Switzerland <=1960 <=1960 Syrian Arab Republic <=1960 Tajikistan Tanzania <=1960 Thailand 1995 <=1960 1995 Togo 1987 Tonga Trinidad and Tobago 1998 1994 1998 1994 <=1960 1994 Tunisia 1963 1994 Turkey <=1960 1997 Turkmenistan Uganda 1982 Ukraine 1994 1994 1994 1980 1997
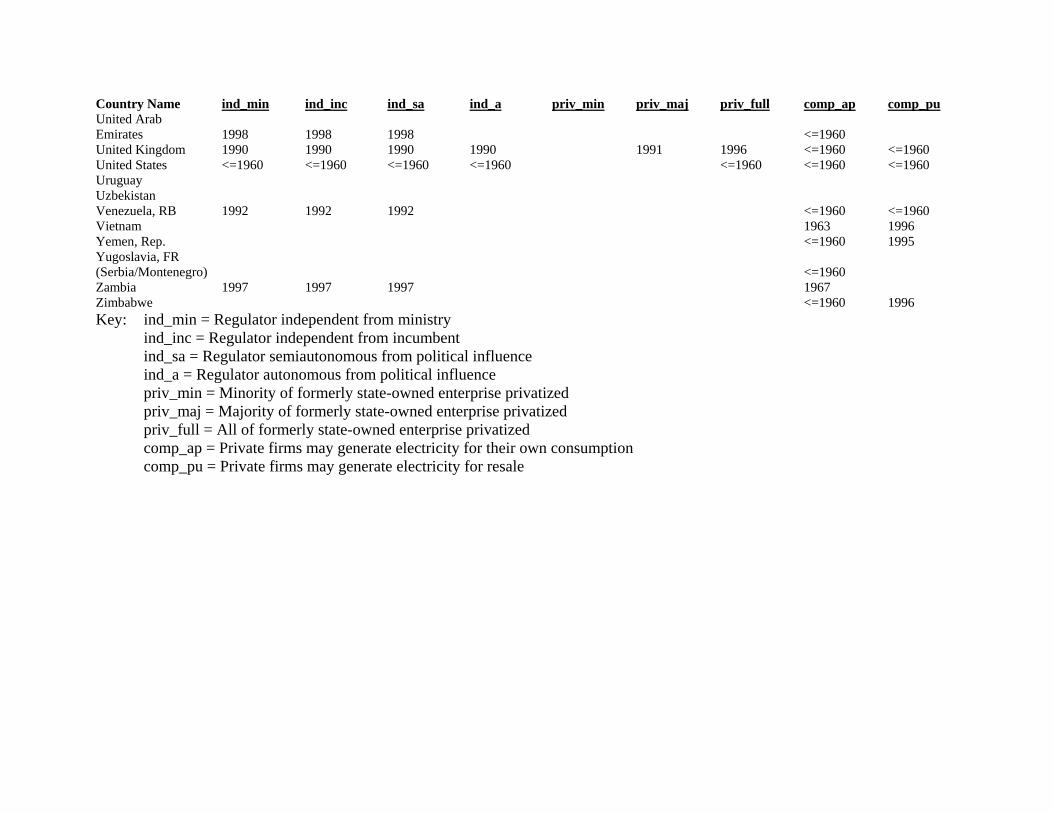
Country Name ind_min ind_inc ind_sa ind_a priv_min priv_maj priv_full comp_ap comp_pu United Arab Emirates 1998 1998 1998 <=1960 United Kingdom 1990 1990 1990 1990 1991 1996 <=1960 <=1960 United States <=1960 <=1960 <=1960 <=1960 <=1960 <=1960 <=1960 Uruguay Uzbekistan Venezuela, RB 1992 1992 1992 <=1960 <=1960 Vietnam 1963 1996 Yemen, Rep. <=1960 1995 Yugoslavia, FR (Serbia/Montenegro) <=1960 Zambia 1997 1997 1997 1967 Zimbabwe <=1960 1996 Key: ind_min = Regulator independent from ministry ind_inc = Regulator independent from incumbent ind_sa = Regulator semiautonomous from political influence ind_a = Regulator autonomous from political influence priv_min = Minority of formerly state-owned enterprise privatized priv_maj = Majority of formerly state-owned enterprise privatized priv_full = All of formerly state-owned enterprise privatized comp_ap = Private firms may generate electricity for their own consumption comp_pu = Private firms may generate electricity for resale

DAVIDSON INSTITUTE WORKING PAPER SERIES - Most Recent Papers The entire Working Paper Series may be downloaded free of charge at: www.wdi.bus.umich.edu
CURRENT AS OF 7/21/04 Publication Authors Date No. 713: International Coercion, Emulation and Policy Diffusion: Market-Oriented Infrastructure Reforms, 1977-1999
Witold J. Henisz and Bennet A. Zelner and Mauro F. Guillen
July 2004
No. 712: Votes and Vetoes: The Political Determinants of Commercial Openness
Witold J. Henisz and Edward D. Mansfield
July 2004
No. 711: Interest Groups, Veto Points and Electricity Infrastructure Deployment
Witold J. Henisz and Bennet A. Zelner
July 2004
No. 710: Firms’ Price Markups and Returns to Scale in Imperfect Markets: Bulgaria and Hungary
Rumen Dobrinsky, Gábor Kőrösi, Nikolay Markov, and László Halpern
July 2004
No. 709: The Stability and Growth Pact from the Perspective of the New Member States
Gábor Orbán and György Szapáry July 2004
No. 708: Contract Violations, Neighborhood Effects, and Wage Arrears in Russia
John S. Earle and Klara Sabirianova Peter
July 2004
No. 707: Determinants of Employment Growth at MNEs: Evidence from Egypt, India, South Africa and Vietnam
Sumon Kumar Bhaumik, Saul Estrin and Klaus Meyer
July 2004
No. 706: Economic Reform in Tanzania and Vietnam: A Comparative Commentary
Brian Van Arkadie and Do Duc Dinh
June 2004
No. 705: Beliefs about Exchange-Rate Stability: Survey Evidence from the Currency Board in Bulgaria
Neven T. Valev and John A. Carlson
June 2004
No. 704: Returns to Schooling in China Under Planning and Reform Belton M. Fleisher and Xiaojun Wang
June 2004
No. 703: Return to Skills and the Speed of Reforms: Evidence from Central and Eastern Europe, China and Russia
Belton M. Fleisher, Klara Sabirianova Peter, and Xiaojun Wang
June 2004
No. 702: What Makes Small Firms Grow? Finance, Human Capital, Technical Assistance, and the Business Environment in Romania
J. David Brown, John S. Earle and Dana Lup
May 2004
No. 701: The Effects of Multiple Minimum Wages Throughout the Labor Market
T. H. Gindling and Katherine Terrell
May 2004
No. 700: Minimum Wages, Inequality and Globalization T. H. Gindling and Katherine Terrell
May 2004
No. 699: Self-Selection and Earnings During Volatile Transition Ralitza Dimova and Ira Gang May 2004 No. 698: Ecology and Violence: The Environmental Dimensions of War Timothy L. Fort and Cindy A.
Schipani May 2004
No. 697: Russian Cities in Transition: The Impact of Market Forces in the 1990s
Ira N. Gang and Robert C. Stuart May 2004
No. 696: Firm Ownership and Internal Labor Practices in a Transition Economy: An Exploration of Worker Skill Acquisition in Vietnam
Jed Friedman May 2004
No. 695: The Unanticipated Effects of Insider Trading Regulation Art A. Durnev and Amrita S. Nain
May 2004
No. 694: Volatile Interest Rates, Volatile Crime Rates: A New Argument for Interest Rate Smoothing
Garett Jones and Ali M. Kutan May 2004
No. 693 Money Market Liquidity under Currency Board – Empirical Investigations for Bulgaria
Petar Chobanov and Nikolay Nenovsky
May 2004
No. 692: Credibility and Adjustment: Gold Standards Versus Currency Boards
Jean Baptiste Desquilbet and Nikolay Nenovsky
May 2004
No. 691: Impact of Cross-listing on Local Stock Returns: Case of Russian ADRs
Elena Smirnova May 2004
No. 690: Executive Compensation, Firm Performance, and State Ownership in China:Evidence from New Panel Data
Takao Kato and Cheryl Long May 2004
No. 689: Diverging Paths: Transition in the Presence of the Informal Sector
Maxim Bouev May 2004
No. 688: What Causes Bank Asset Substitution in Kazakhstan? Explaining Dollarization in a Transition Economy
Sharon Eicher May 2004