Embed Size (px)
Citation preview

International Climate ChangeAdaptation Initiative
Tropical cyclones in the Western Pacific
Yuriy Kuleshov Australian Bureau of Meteorology
International Climate Change Adaptation Initiative
Outline
• Tropical cyclones – the most extreme severe weather events
• Tropical cyclone research
– Historical data
– Climatology
– Seasonal prediction

International Climate Change Adaptation Initiative
Tropical cyclones
Cyclone Yasi approaching Queensland on 2 February 2011

International Climate Change Adaptation Initiative
Tropical cyclones
Tropical cyclones are the most extreme severe weather eventswhich impact coastal communities and island nations.
There is an ongoing research(i) on accurate analysis of observed trends in tropical cyclone occurrences, and(ii) how to improve skill of tropical cyclone forecasting, including seasonal
prediction of cyclone activity to assist with preparedness and risk reduction forcoastal communities.

International Climate Change Adaptation Initiative
Cyclone Tracy, Darwin, Australia, 1974
71 direct fatalities
Over $5 billion in damage

International Climate Change Adaptation Initiative
Cyclone Tracy, Darwin, Australia, 1974
•70% of Darwin’s buildings were destroyed
•Tracy was described as “disaster of the first magnitude …
without parallel in Australia’s history”.
International Climate Change Adaptation Initiative
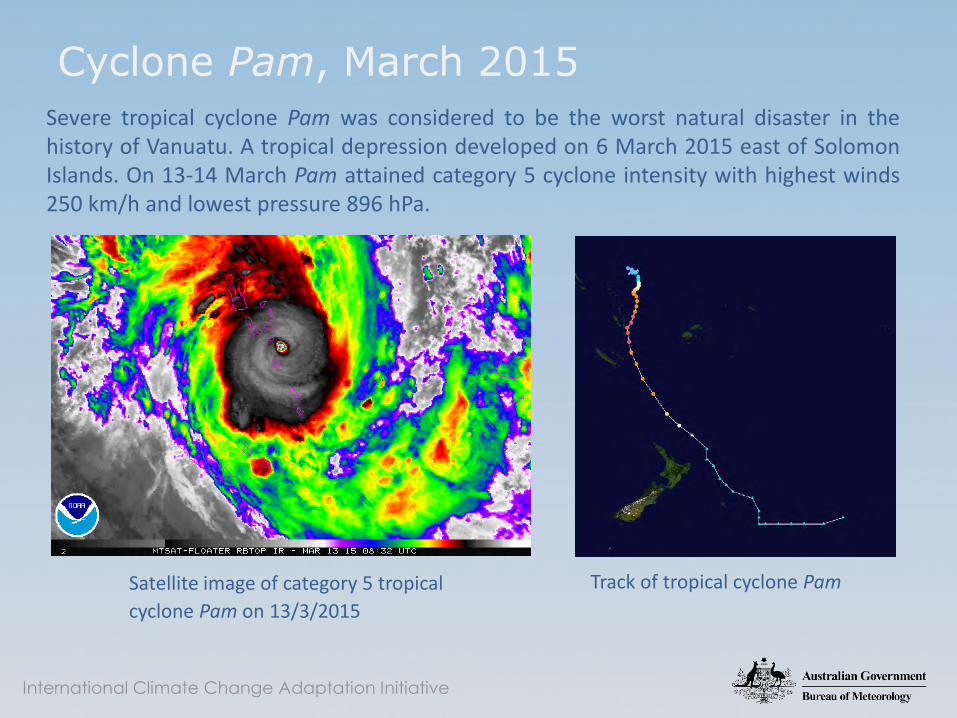
Cyclone Pam, March 2015
Satellite image of category 5 tropical
cyclone Pam on 13/3/2015
Track of tropical cyclone Pam
Severe tropical cyclone Pam was considered to be the worst natural disaster in thehistory of Vanuatu. A tropical depression developed on 6 March 2015 east of SolomonIslands. On 13-14 March Pam attained category 5 cyclone intensity with highest winds250 km/h and lowest pressure 896 hPa.

International Climate Change Adaptation Initiative
Cyclone Pam, March 2015
At least 16 people are confirmed to have died, and 30 others were reported injured; at least 132,000 people have been impacted (Vanuatu population is estimated at 267,000, July 2014)
~ 70% of houses destroyed
After all the development we have done for the last couple of years and this big
cyclone came and just destroyed... all the infrastructure the government has...
built. Completely destroyed. Vanuatu President Baldwin Lonsdale.
International Climate Change Adaptation Initiative
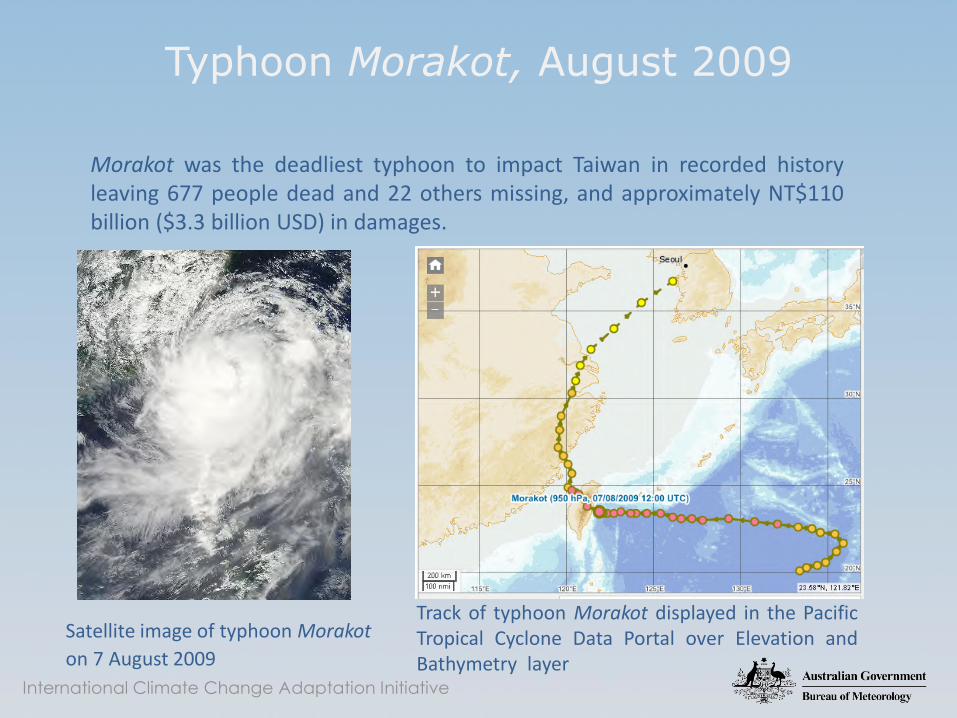
Typhoon Morakot, August 2009
Satellite image of typhoon Morakot
on 7 August 2009
Track of typhoon Morakot displayed in the PacificTropical Cyclone Data Portal over Elevation andBathymetry layer
Morakot was the deadliest typhoon to impact Taiwan in recorded historyleaving 677 people dead and 22 others missing, and approximately NT$110billion ($3.3 billion USD) in damages.

International Climate Change Adaptation Initiative
Cyclone Vance approaching Western Australia on 21 March 2009
How climate change affects tropical cyclone activity –globally and regionally?

International Climate Change Adaptation Initiative
• Current datasets indicate no significant observed trends inglobal tropical cyclone frequency over the past century.
• It is likely that the global frequency of occurrence oftropical cyclones will either decrease or remain essentiallyunchanged, concurrent with a likely increase in both globalmean tropical cyclone maximum wind speedand precipitation rates.
IPCC AR5 – Tropical Cyclone Trends

International Climate Change Adaptation Initiative
IPCC Fifth Assessment Report (AR5): Climate Change 2013
Phenomenon and
direction of trend
Assessment that
changes occurred
Likelihood of further
changes (Late 21st
century)
Increases in intense
tropical cyclone
activity
Low confidence in long
term (centennial) changes
Virtually certain in North
Atlantic since 1970
More likely than not in
the Western North Pacific
and North Atlantic
Climate is changing on a global scale and consequently it isimportant to monitor changes in global as well as in regionaltropical cyclone frequencies, intensities and tracks.

International Climate Change Adaptation Initiative
Tropical Cyclones in the western North Pacific
Chan, J. C. L., 2005: Interannual and interdecadal variations oftropical cyclone activity over the western North Pacific. Meteor.Atmos. Phys., 89, 143–152.
International Climate Change Adaptation Initiative
Tropical Cyclones in the western North Pacific – Seasonal prediction
Less Typhoons due to La Niña, While Two to Four
Expected to Hit Taiwan in 2016
Taipei, Taiwan--June 28, 2016 – The Central Weather Bureau (CWB) has predicted 19 to 23 typhoons/tropical storms (TYs/TSs), which is less than the climate mean (25.7), may occur over the western North Pacific (WNP) in 2016.
Two (2) to four (4) TYs/TSs are most likely to invade Taiwan this year, anticipated by the CWB, while the climate average number is three point six (3.6).
NB. The 2016 season has so far produced a total of 25 named storms, 12 typhoons and five intense typhoons.

International Climate Change Adaptation Initiative
Tropical Cyclones in the western North Pacific – Seasonal prediction
PAGASA issues TC seasonal outlook twice a year
(to develop / enter the Philippines Area of Responsibility)
Jan 8, 2016 Jan - March 1-2 TCs
Jan 8, 2016 Apr – June 1-3 TCs
July 15, 2016 July – Sept 5-11 TCs
July 15. 2016 Oct - Dec 4-9 TCs

International Climate Change Adaptation Initiative
• High-quality tropical cyclone database for the SouthPacific and the South Indian Oceans, covering tracksand intensity.
• Tropical cyclone archive extended to the WesternNorth Pacific (in collaboration with RSMC Tokyo).
• Tropical cyclone climatology for the SouthernHemisphere.
• Web-based information tools to support the use anddissemination of data and analyses.
• Statistical and dynamical climate model-basedseasonal tropical climate prediction.
“Climate Change and Southern Hemisphere Tropical Cyclones” initiative

International Climate Change Adaptation Initiative
Tropical cyclone archive for the Southern Hemisphere and the Western Pacific Ocean
Original data from the Regional Specialised Meteorological Centres (RSMC) Nadi,La Reunion and Tokyo, and Tropical Cyclone Warning Centres (TCWCs) inBrisbane, Darwin, Perth and Wellington for 1969-1970 to 2012-2013 tropicalcyclone seasons have been revised.

International Climate Change Adaptation Initiative
• Historical tropical cyclone best track data have been examined and a new satellite-era data set has been prepared to be subsequently displayed through theenhanced tropical cyclone data portal for the Southern Hemisphere and theWestern Pacific Ocean.
Tropical cyclone archive for the Southern Hemisphere and the Western Pacific Ocean

International Climate Change Adaptation Initiative
Tropical cyclone data portal
• South Pacific
• Western North Pacific
Kuleshov, Y., 2012: Southern Hemisphere tropical cyclone climatology, Chapter 1, in book "Modern Climatology", Intech,
ISBN 979-953-307-337-7, pp. 1-44.

International Climate Change Adaptation Initiative
Tropical cyclones climatology
Kuleshov, Y., L. Qi, R. Fawcett, and D. Jones, 2008: On tropical cyclone activity in the Southern Hemisphere: Trends and the
ENSO connection, Geophysical Research Letters, 35, L14S08, doi:10.1029/2007GL032983.

International Climate Change Adaptation Initiative
Wind field modelBest track of tropical cycloneHamish
Tropical cyclone Hamish as a category 5 cyclone at peak intensity (central pressure 924 hPa).

International Climate Change Adaptation Initiative
Wind field model
Comparison of modelled wind speeds of the spline model and HBF2010 model at WillisIsland when tropical cyclone Yasi passed the AWS
International Climate Change Adaptation Initiative
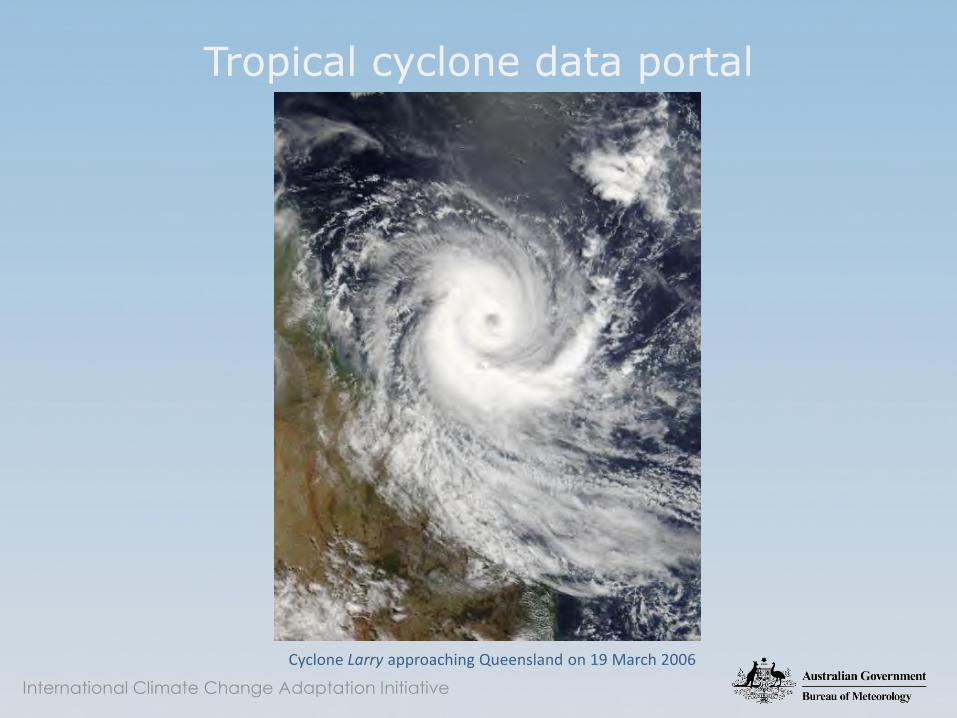
Tropical cyclone data portal
Cyclone Larry approaching Queensland on 19 March 2006

International Climate Change Adaptation Initiative
Tropical Cyclone Data Portal
Southern Hemisphere –
Regional SpecialisedMeteorological Centres Nadi,Fiji and La Reunion, France;Tropical Cyclone WarningCentres in Brisbane, Darwinand Wellington
Western North Pacific –
Regional SpecialisedMeteorological Centre Tokyo,Japan

International Climate Change Adaptation Initiative
Tropical cyclone data portal
Temporal selection:
'when'
• Season (e.g. 2009)

International Climate Change Adaptation Initiative
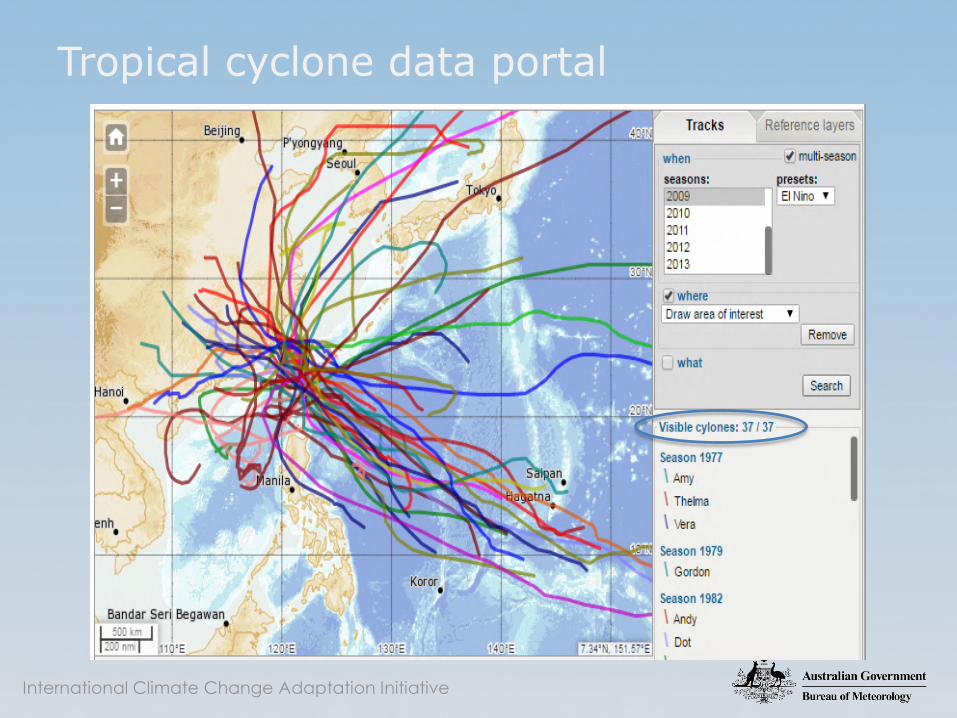
Tropical cyclone data portal
Temporal selection:
'when'
• Multi-season

International Climate Change Adaptation Initiative
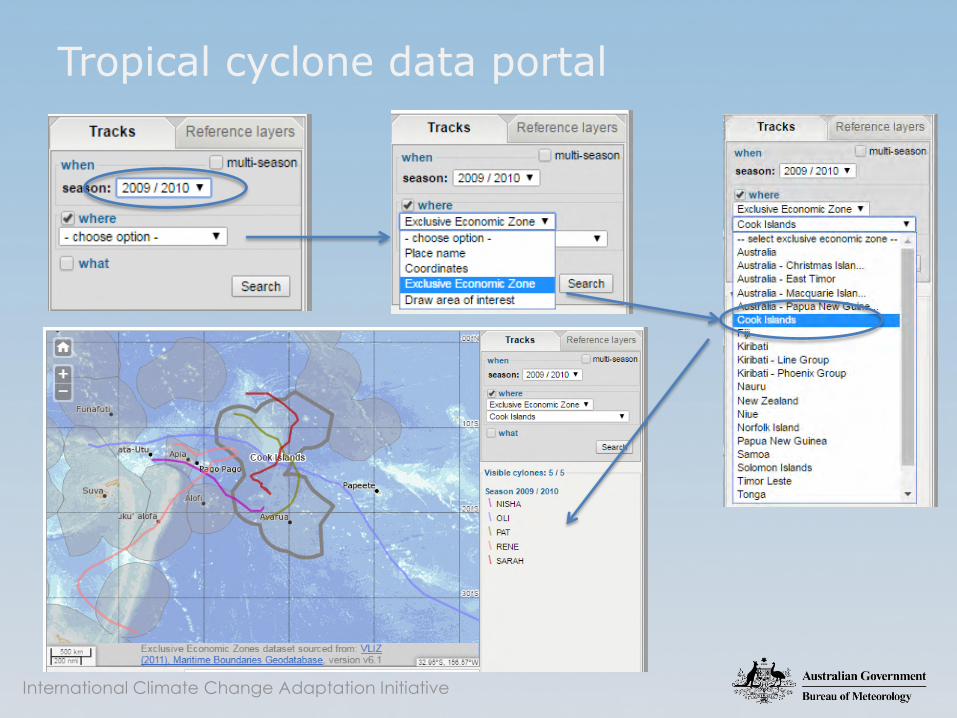
Tropical cyclone data portal
Spatial selection:
'where'
• Place name
• Coordinates
• Exclusive Economic Zone
• Draw area of interest

International Climate Change Adaptation Initiative
Tropical cyclone data portal

International Climate Change Adaptation Initiative
'season' – 1974/75; 'where' - 50 km of Darwin, Australia
Pacific Tropical Cyclone Data Portal
International Climate Change Adaptation Initiative
Tropical cyclone data portal

International Climate Change Adaptation Initiative
Tropical cyclone data portal

International Climate Change Adaptation Initiative
Tropical cyclone data portalSelection: 'what'
• Pressure
• Name

International Climate Change Adaptation Initiative
Tropical cyclone data portal

International Climate Change Adaptation Initiative
Tropical cyclone data portal
International Climate Change Adaptation Initiative
Tropical cyclone data portal

International Climate Change Adaptation Initiative
Tropical cyclone climatologyand seasonal prediction
Cyclone Larry approaching Queensland on 19 March 2006
International Climate Change Adaptation Initiative
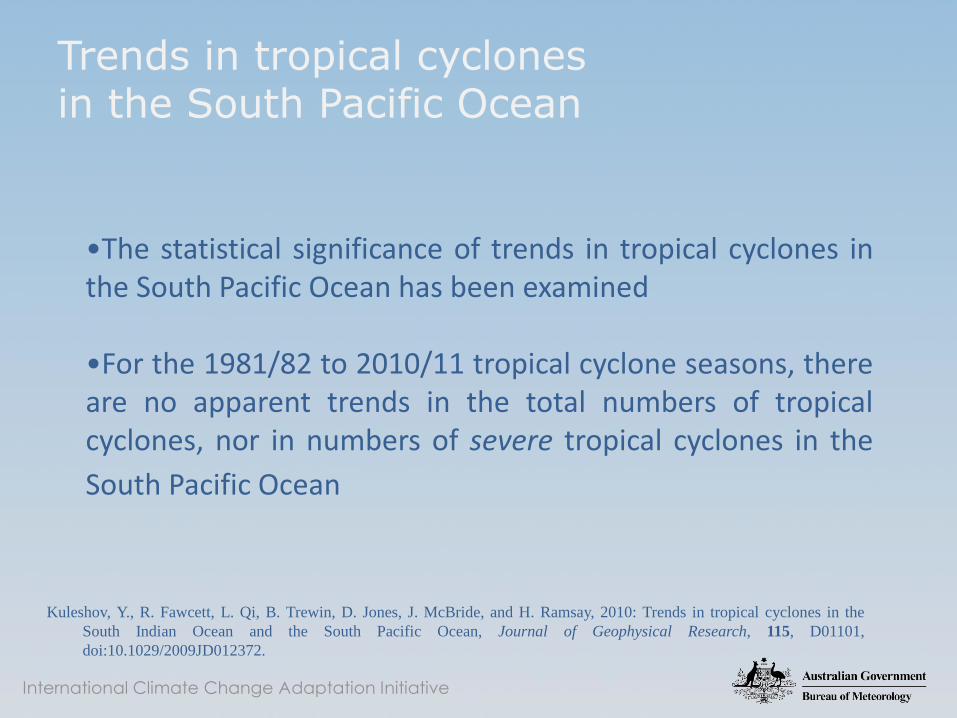
Trends in tropical cyclones in the South Pacific Ocean
•The statistical significance of trends in tropical cyclones inthe South Pacific Ocean has been examined
•For the 1981/82 to 2010/11 tropical cyclone seasons, thereare no apparent trends in the total numbers of tropicalcyclones, nor in numbers of severe tropical cyclones in the
South Pacific Ocean
Kuleshov, Y., R. Fawcett, L. Qi, B. Trewin, D. Jones, J. McBride, and H. Ramsay, 2010: Trends in tropical cyclones in the
South Indian Ocean and the South Pacific Ocean, Journal of Geophysical Research, 115, D01101,
doi:10.1029/2009JD012372.

International Climate Change Adaptation Initiative
Trends in tropical cyclones in the South Pacific Ocean
Kuleshov, Y., R. Fawcett, L. Qi, B. Trewin, D. Jones, J. McBride, and H. Ramsay, 2010: Trends in tropical cyclones in the
South Indian Ocean and the South Pacific Ocean, Journal of Geophysical Research, 115, D01101,
doi:10.1029/2009JD012372.
International Climate Change Adaptation Initiative
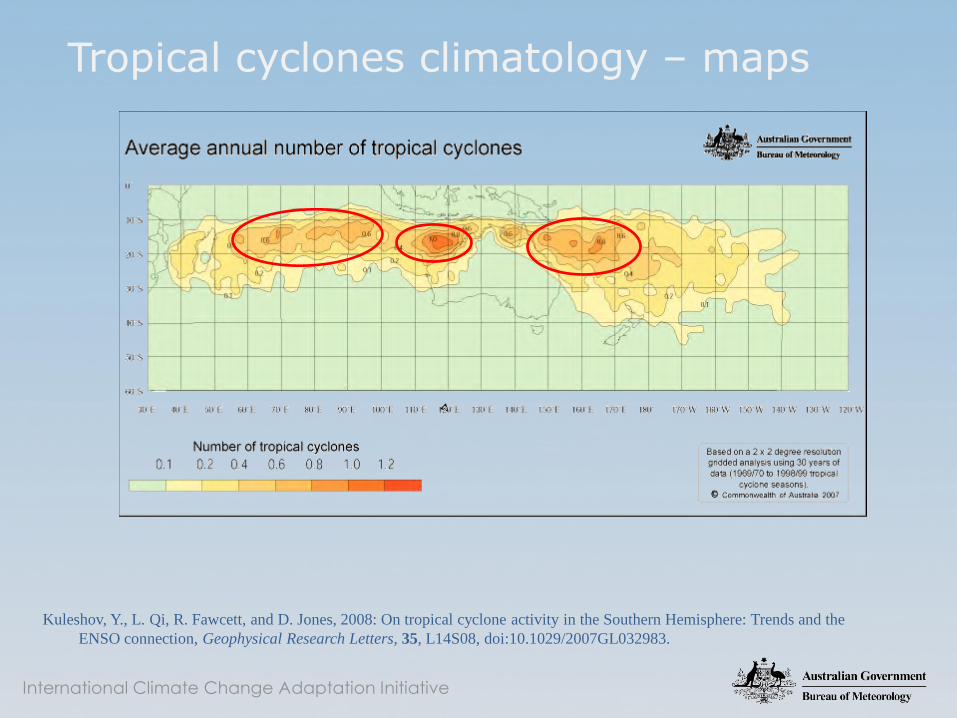
Tropical cyclones climatology – maps
Kuleshov, Y., L. Qi, R. Fawcett, and D. Jones, 2008: On tropical cyclone activity in the Southern Hemisphere: Trends and the
ENSO connection, Geophysical Research Letters, 35, L14S08, doi:10.1029/2007GL032983.

International Climate Change Adaptation Initiative
Tropical cyclones climatology – maps

International Climate Change Adaptation Initiative
Seasonal prediction models
• Forecast models vary tremendously in structure and complexity. They can besimple enough to run in a few seconds on an ordinary computer, or complexenough to require a number of hours on a supercomputer.
• Dynamical models, also known as numerical models, are the most complexand use high-speed computers to solve the physical equations of motiongoverning the atmosphere.
• Statistical models, in contrast, do not explicitly consider the physics of theatmosphere but instead are based on historical relationships between stormbehavior and storm-specific details such as location and date.
• Statistical-dynamical models blend both dynamical and statistical techniquesby making a forecast based on established historical relationships betweenstorm behavior and atmospheric variables provided by dynamical models.
• Finally, ensemble or consensus models are created by combining the forecastsfrom a collection of other models.

International Climate Change Adaptation Initiative
Tropical cyclones: El Niño and La Niña
Kuleshov, Y., L. Qi, R. Fawcett and D. Jones, 2009: Improving preparedness to natural hazards: Tropical cyclone seasonal
prediction for the Southern Hemisphere, Advances in Geosciences, Vol. 12, pp. 127-143.

International Climate Change Adaptation Initiative
Tropical cyclones: departure from climatology
Kuleshov, Y., L. Qi, R. Fawcett and D. Jones, 2009: Improving preparedness to natural hazards: Tropical cyclone seasonal
prediction for the Southern Hemisphere, Advances in Geosciences, Vol. 12, pp. 127-143.
El Niño
La Niña

International Climate Change Adaptation Initiative
El Niño – Southern Oscillation (ENSO)
• El Niño–Southern Oscillation (ENSO) is an irregularly periodical variation
in winds and sea surface temperatures over the tropical eastern Pacific Ocean, affecting
much of the tropics and subtropics.
• The oceanic warming phase is known as El Niño and the cooling phase as La Niña.
• Southern Oscillation is the accompanying atmospheric component, coupled with the sea
temperature change: El Niño is accompanied with high, and La Niña with low air surface
pressure in the tropical western Pacific.
• The two periods last several months each (typically occur every 2-7 years) and their
effects vary in intensity.

International Climate Change Adaptation Initiative
Southern Oscillation Index (SOI)
• The Southern Oscillation Index (SOI) provides an indication of the development and
intensity of El Niño or La Niña events.
• The SOI is calculated using the pressure difference between Tahiti and Darwin.
• Sustained negative SOI values (blue) are indicative of El Niño conditions, and
sustained positive SOI values (orange) are indicative of La Niña conditions.

International Climate Change Adaptation Initiative
El Niño – Southern Oscillation (ENSO)
International Climate Change Adaptation Initiative
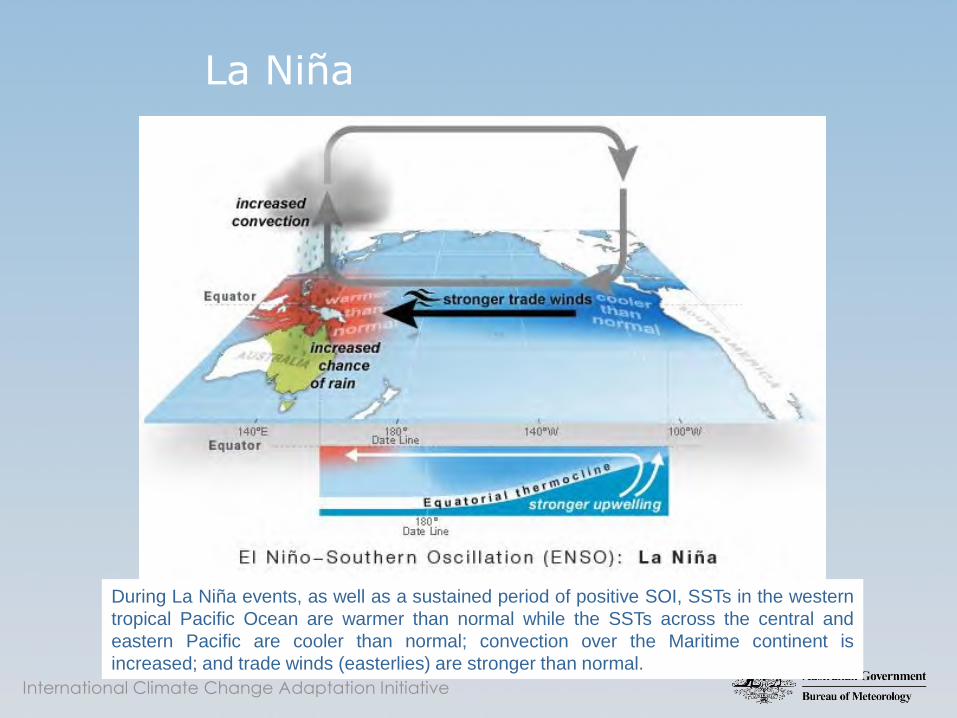
La Niña
During La Niña events, as well as a sustained period of positive SOI, SSTs in the western
tropical Pacific Ocean are warmer than normal while the SSTs across the central and
eastern Pacific are cooler than normal; convection over the Maritime continent is
increased; and trade winds (easterlies) are stronger than normal.

International Climate Change Adaptation Initiative
El Niño
During El Niño events, as well as a sustained period of negative SOI, SSTs in the central
and eastern tropical Pacific Ocean are warmer than normal; the focus of convection
migrates from the Australian/Indonesian region eastward towards the central tropical
Pacific Ocean; and trade winds (easterlies) are weaker than normal.

International Climate Change Adaptation Initiative
Sea Surface Temperatures (SSTs)
In addition to the SOI, climatologists use several NINO indices to monitor the Pacific
Ocean. These indices refer to the difference from the long term mean of the SSTs in
several regions located along the equatorial Pacific. Generally, the National Climate
Centre uses NINO3.4 as the most informative index for the Australian region.

International Climate Change Adaptation Initiative
5VAR Index
• Sustained positive 5VAR values are indicative of El Niño conditions, and sustained
negative 5VAR values are indicative of La Niña conditions.
Kuleshov, Y., L. Qi, R. Fawcett and D. Jones, 2009: Improving preparedness to natural hazards: Tropical cyclone seasonal
prediction for the Southern Hemisphere, Advances in Geosciences, Vol. 12, pp. 127-143.
El Niño
La Niña
5VAR – an index based on Darwin and Tahiti mean sea level
pressure, and the NINO3, NINO3.4 and NINO4 SST indices.

International Climate Change Adaptation Initiative
5VAR Index

International Climate Change Adaptation Initiative
5VAR Index
International Climate Change Adaptation Initiative
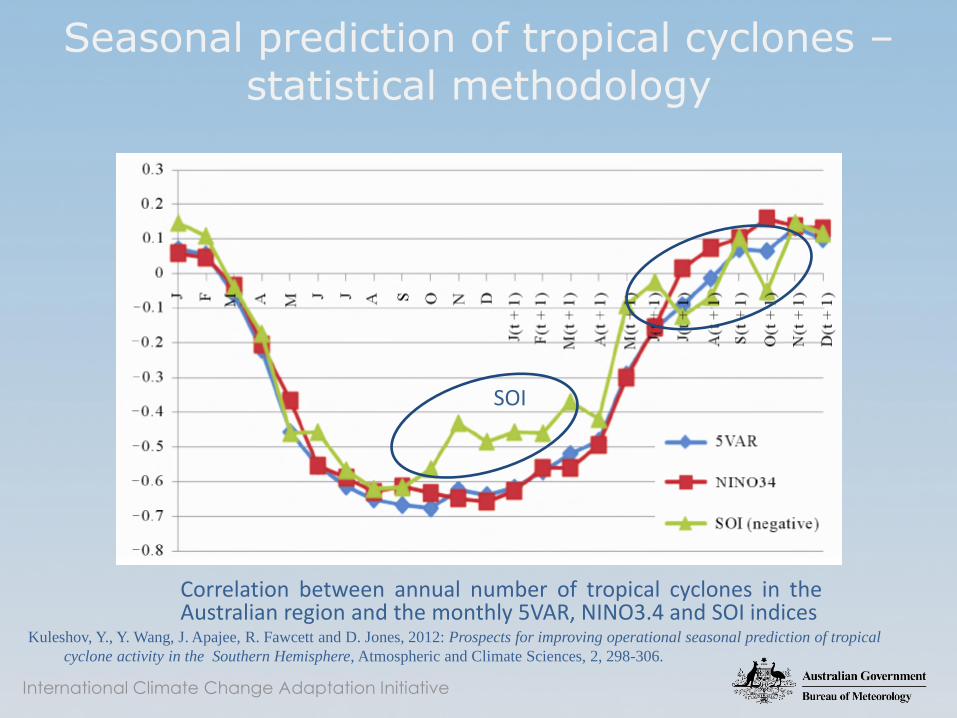
Seasonal prediction of tropical cyclones –statistical methodology
Correlation between annual number of tropical cyclones in theAustralian region and the monthly 5VAR, NINO3.4 and SOI indices
Kuleshov, Y., Y. Wang, J. Apajee, R. Fawcett and D. Jones, 2012: Prospects for improving operational seasonal prediction of tropical
cyclone activity in the Southern Hemisphere, Atmospheric and Climate Sciences, 2, 298-306.
SOI

International Climate Change Adaptation Initiative
Seasonal prediction of tropical cyclones –statistical methodology
Correlation between annual number of tropical cyclones in theAustralian region and tri-monthly 5VAR, NINO3.4 and SOI indices
Kuleshov, Y., Y. Wang, J. Apajee, R. Fawcett and D. Jones, 2012: Prospects for improving operational seasonal prediction of tropical
cyclone activity in the Southern Hemisphere, Atmospheric and Climate Sciences, 2, 298-306.
SOI
International Climate Change Adaptation Initiative
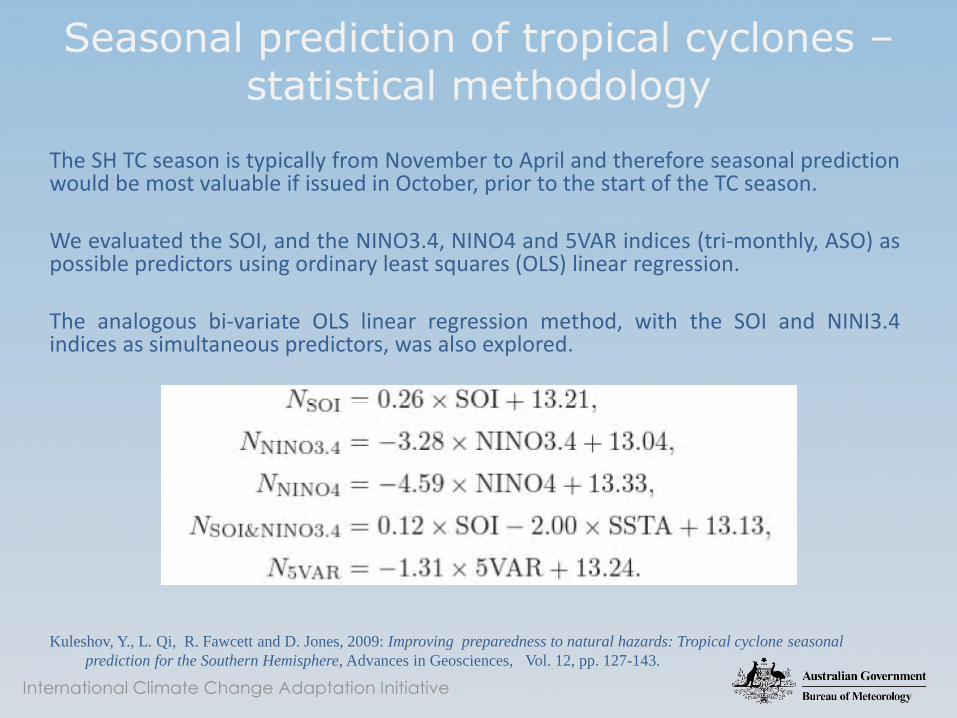
Seasonal prediction of tropical cyclones –statistical methodology
The SH TC season is typically from November to April and therefore seasonal predictionwould be most valuable if issued in October, prior to the start of the TC season.
We evaluated the SOI, and the NINO3.4, NINO4 and 5VAR indices (tri-monthly, ASO) aspossible predictors using ordinary least squares (OLS) linear regression.
The analogous bi-variate OLS linear regression method, with the SOI and NINI3.4indices as simultaneous predictors, was also explored.
Kuleshov, Y., L. Qi, R. Fawcett and D. Jones, 2009: Improving preparedness to natural hazards: Tropical cyclone seasonal
prediction for the Southern Hemisphere, Advances in Geosciences, Vol. 12, pp. 127-143.

International Climate Change Adaptation Initiative
Seasonal prediction of tropical cyclones –statistical methodology
Time series of total annual number of TCs in the Australian region as observedand predicted using NINO3.4 and the 5VAR indices.
Kuleshov, Y., L. Qi, R. Fawcett and D. Jones, 2009: Improving preparedness to natural hazards: Tropical cyclone seasonal
prediction for the Southern Hemisphere, Advances in Geosciences, Vol. 12, pp. 127-143.

International Climate Change Adaptation Initiative
Seasonal prediction of tropical cyclones –statistical methodology
Support Vector Regression (SVR) has been identified as a skilful machine learningalgorithm for application to TC seasonal prediction.
Using non-parametric and non-linear regression approach, annual total numberof TCs expected to be formed in the coming season (Y) has been generated usingnine variables as the model’s input.
Selected input variables (X1-X9) were the following indices:X1 - Dipole Mode Index;X2 - NIÑ O4;X3 - NIÑ O3.4;X4 - NIÑ O3;X5 – NIÑ O1.2;X6 – El Niño Modoki index;X7 – 5VAR index;X8 – Multivariate ENSO index; andX9 - SOI.
Wijnands, J.S., Qian, G., Shelton, K.L., Fawcett, R.J.B., Chan, J.C.L., and Kuleshov, Y., 2015: Seasonal forecasting of tropical
cyclone activity in the Australian and the South Pacific regions, Mathematics of Climate and Weather Forecasting, pp. 21-44.

International Climate Change Adaptation Initiative
Seasonal prediction of tropical cyclones –statistical methodology
For all regions, model averaging yields better results than using the best modelitself. Averaging top two to four models works well for most regions.
Wijnands, J.S., Qian, G., Shelton, K.L., Fawcett, R.J.B., Chan, J.C.L., and Kuleshov, Y., 2015: Seasonal forecasting of tropical
cyclone activity in the Australian and the South Pacific regions, Mathematics of Climate and Weather Forecasting, pp. 21-44.

International Climate Change Adaptation Initiative
Seasonal prediction of tropical cyclones –statistical methodology
Wijnands, J.S., Qian, G., Shelton, K.L., Fawcett, R.J.B., Chan, J.C.L., and Kuleshov, Y., 2015: Seasonal forecasting of tropical
cyclone activity in the Australian and the South Pacific regions, Mathematics of Climate and Weather Forecasting, pp. 21-44.

International Climate Change Adaptation Initiative
WMO activities of seasonal prediction of tropical cyclones
• Seasonal Hurricane Predictions has been created to pool predictions by the maincenters carrying out forecasts on the hurricane season, which usually runs fromearly June to late November, and to make them available to the wider public.
• The 17 centers whose forecasts are presented on the website are: Accu Weather,Coastal Carolina University, Colorado State University, MDA Weather Services, NCState University, NMME, the National Oceanic and Atmospheric Administration(NOAA), Penn State University, The University of Arizona, Weatherbell Analytics,The Weather Company, WeatherTigger (all based in the U.S.), the ServicioMeteorológico Nacional of México, the Instituto Cubano de Meteorología (Cuba),StormGeo (Norway), Tropical Storm Risk at University College London, and the UKMet Office (United Kingdom).

International Climate Change Adaptation Initiative
The Atlantic basin hurricane season prediction
• Statistical, hybrid and dynamical (Met Office, United Kingdom) models

International Climate Change Adaptation Initiative
Seasonal prediction of tropical cyclones –hybrid (statistical-dynamical) methodology
Vecchi, G.A., M. Zhao, H. Wang, G. Villarini, A. Rosati, A. Kumar, I.M. Held, R. Gudgel (2011): Statistical-Dynamical Predictions of Seasonal North Atlantic Hurricane Activity. /Mon. Wea. Rev.
Retrospective (1982-2009)performance of HyHuFS predictionsof hurricane frequency initialized inJanuary (adapted from Vecchi etal. 2011). Black line shows theobserved hurricane frequency. Red lineshows the predicted expected value.The pink, yellow and green shadedareas show the predicted 50%, 75%and 90% confidence range on thepredictions, respectively.

International Climate Change Adaptation Initiative
• Ocean Model + Atmosphere model + Land surface/soil model + Sea ice model• Models represent basic variables on a 3D grid. Typical grid resolutions 100 -
200km• Use laws of physics to evolve variables forward in time and continuous in space -
These represent the exchange of properties between the different variables
Introduction to dynamical coupled models

International Climate Change Adaptation Initiative
About POAMA
Predictive Ocean Atmosphere Model for Australia (POAMA), version 2.4.
Coupled atmosphere-ocean GCM developed by BoM and CSIRO.
Components: ACOM2 (Australian Community Ocean Model version 2); BAM3 (the Bureau of Meteorology Research Centre Atmospheric Model version 3); OASIS3 (Ocean Atmosphere Sea Ice Soil version 3) coupler.
Vital statistics: 30 member ensemble; T47 (~2.5°) L17 atmospheric model; L25 oceanic model.
Seasonal version is initialised on 1st of every month and run for 9 months. For current analysis use Oct run to cover Nov-Apr TC season.

International Climate Change Adaptation Initiative
About ACCESS-S1
The Australian Community Climate and Earth-System Simulator-Seasonal prediction system (ACCESS-S1).
• ACCESS-S1 built upon the latest climate model Global Seasonalforecast system version 5 using the Global Coupled configuration 2(GloSea5-GC2) from the UK Met Office (UKMO) along with locallydeveloped system enhancements.
• The ACCESS-S1 system is planned to become operational, replacingthe BoM’s current operational system POAMA2 by mid-2017.
• The UKMO's GloSea5-GC2 includes a number of state-of-the-artfeatures compared to POAMA2, such as substantially higherhorizontal (~60 km) and vertical resolution, improved model physicsand parameterization, a multi-level land surface model, and aninteractive multi-level sea-ice model.

International Climate Change Adaptation Initiative
POAMA – tropical cyclone track density
• Xxxx
• Xxxx
• Xxxx
• xxxx
observations (NCC SH TC)
Number of TCs per 2°x2° grid box per season
[Obs. TC locations once per day to agree with POAMA]
p24 30-member mean
1980/1981 – 2010/2011 July – June
1980/1981 – 2010/2011 October – June

International Climate Change Adaptation Initiative
POAMA – tropical cyclones & ENSO
Observations POAMA
ENSO years defined member Niño 3.4 SST anomalyENSO years defined following Kuleshov et al. (2008).

International Climate Change Adaptation Initiative
Tropical cyclone seasonal prediction
• Tropical cyclones are tracked every day for the entireSouthern Hemisphere tropical cyclone season (Nov-Apr) ineach member of the climate model ensemble.
Pre-TC track TC track
Kuleshov, Y., C. Spillman, Y. Wang, A. Charles, R. de Wit, K. Shelton, D. Jones, H. Hendon, C. Ganter, A. Watkins, J. Apajee, and
A. Griesser, 2012: Seasonal prediction of climate extremes for the Pacific: Tropical cyclones and extreme ocean
temperatures, Journal of Marine Science and Technology. Vol. 20, No. 6, pp. 675-683, doi: 10.6119/JMST-012-0628-1.

International Climate Change Adaptation Initiative
Tropical cyclone seasonal prediction
Use dynamical climate model and objective cyclonetracking scheme:
• Identify disturbances in the model at each time,
• Join these disturbances together to form a track,
• When certain threshold criteria have been met for 3successive times, the disturbance is declared atropical cyclone.
t0 t1 t2 t3
Tory, K.J., Chand, S.S., Dare, R.A. and McBride, J.L. 2013. The development and assessment of a model-, grid- and basin-independent tropical cyclone detection scheme. J. Climate, doi: 10.1175/JCLI-D-12-00510.1
.

International Climate Change Adaptation Initiative
Tropical cyclone seasonal predictions
Time series of annual (NDJFMA) number of TCs in POAMA for the Australian (top panel) and South Pacific (bottom panel) regions. TC numbers are shown for observations (solid black line) and ensemble mean (dashed grey line). Ensemble members are shown as coloured circles.

International Climate Change Adaptation Initiative
Tropical cyclone seasonal predictions
Time series of annual (NDJFMA) number of TCs in JMA/MRI-CGCM for the Australian (top panel) and South Pacific (bottom panel) regions. TC numbers are shown for observations (solid black line) and ensemble mean (dashed grey line). Ensemble members are shown as grey circles.

International Climate Change Adaptation Initiative
Tropical cyclone seasonal predictions
Climatological number of TCs as a function of month for observations (solid black line), POAMA (blue dashed line) and JMA/MRI-CGCM (red dashed line) in the Australian (left panel) and South Pacific Ocean (right panel) regions.

International Climate Change Adaptation Initiative
Tropical cyclone seasonal predictions
Based on climate model outputs, we could provide
• Regional probabilistic tropical cyclone predictions.
• Geographic distribution of tropical cyclone activity.
International Climate Change Adaptation Initiative
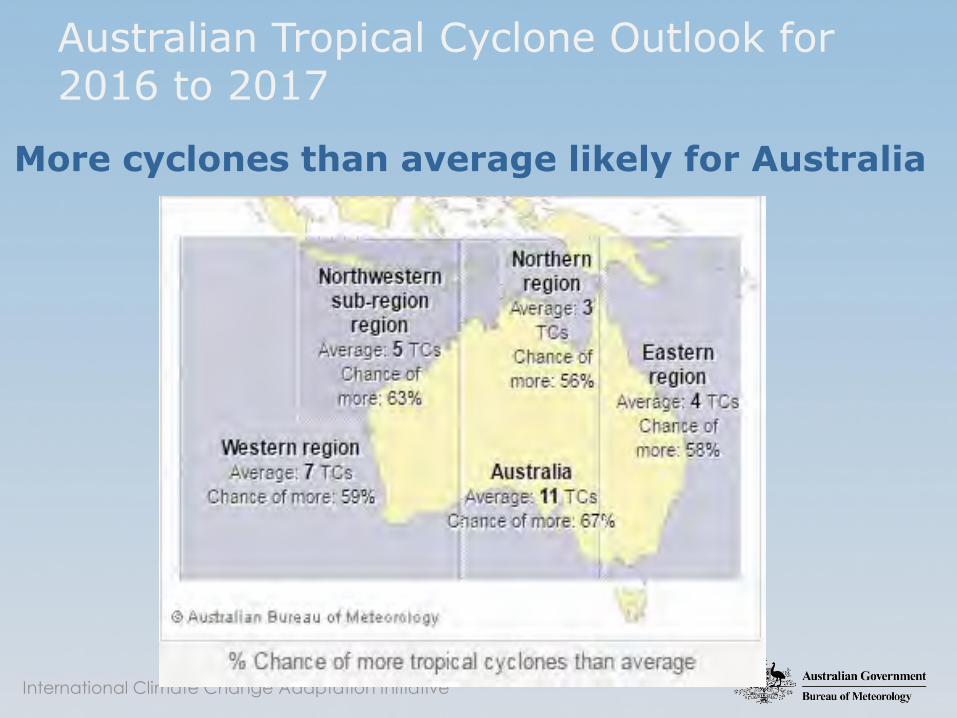
Australian Tropical Cyclone Outlook for 2016 to 2017
More cyclones than average likely for Australia
International Climate Change Adaptation Initiative
Australian Tropical Cyclone Outlook for 2016 to 2017
• An average to above-average number of cyclones are expected for the 2016–17 Australian tropical cyclone season (November–April).
• Neutral to weak La Niña conditions in the tropical Pacific Ocean and warmer than average ocean temperatures to the north and east of Australia have influenced this year’s tropical cyclone outlook.
• During neutral years, the first tropical cyclone to make landfall typically occurs in late December. In La Niña years, the first cyclone to make landfall over Australia typically occurs earlier, around the first week of December.
• The Australian region typically experiences more tropical cyclone activity during La Niña years
More cyclones than average likely for Australia

International Climate Change Adaptation Initiative
TC seasonal predictions: ACCESS
International Climate Change Adaptation Initiative
Tropical cyclone seasonal prediction
• In summary, POAMA and JMA/MRI-CGCM both represent the large-scale environment relevant to TCs reasonably well, although possible deficiencies exist in the Australian region.
• The monthly TC climatologies in both models is reasonably realistic.
• Both models capture some of the interannual variability in the Australian region, although POAMA performs better in the South Pacific.
• Probabilistic NDJFMA TC number predictions both models, evaluated over the 31-year hindcast, show skill over random chance.
• With further development of dynamical climate models (e.g. ACCESS) and improving of their skill it is expected that both statistical and dynamical models will be used in operational TC seasonal prediction in the Australian and South Pacific regions, to complement each other.

International Climate Change Adaptation Initiative
Thank you

International Climate Change Adaptation Initiative
Tropical Cyclones in the western North Pacific
Lin, I.-I. and Chan, J. C. L. Recent decrease in typhoondestructive potential and global warming implications. Nat.Commun. 6:7182 doi: 10.1038/ncomms8182 (2015).