Embed Size (px)
Citation preview
International Chickpea and Pigeonpea Newsletter
Publishing objectives
The International Chickpea and Pigeonpea Newsletter (ICPN) is published annually by ICRISAT. It is intended as a worldwide communi
cation link for all those who are interested in the research and development of chickpea (Cicer arietinum L.), and pigeonpea (Cajanus cajan
(L.) Millsp.). and their wild relatives. Though the contributions that appear in ICPN are peer-reviewed and edited, it is expected that the
work reported will be developed further and formally published later in refereed journals. It is assumed that contributions in ICPN wil l not
be cited unless no alternative reference is available.
ICPN welcomes short contributions (not exceeding 600 words) about matters of interest to its readers.
What to contribute?
Send us the kind of information you would like to see in ICPN.
• Contributions should be current, scholarly, and their inclusion well-justified on the grounds of new information.
• Results of recently concluded experiments, newly released varieties, recent additions to germplasm collections, etc.
• Genome maps and information on probe-availability and sequences, and populations synthesized for specific traits being mapped. Glossy
black and white prints of maps should be included, if possible. Partial maps can also be submitted.
• Short reports of workshops, conferences, symposia, field days, meetings, tours, surveys, network activities, and recently launched or
concluded projects.
• Details of recent publications, with full bibliographic information and 'mini reviews' whenever possible.
• Personal news (new appointments, awards, promotions, change of address, etc.)
How to format contributions?
• Keep the items brief - remember, ICPN is a newsletter and not a primary journal. About 600 words is the upper limit (no more than two
double-spaced pages). As the newsletter is devoted to the chickpea and pigeonpea crops, authors should refrain from
providing a general introduction to these crops, except if they are being grown in a new area.
• If necessary, include one or two small tables (and no more). Supply only the essential information; round off the data-values to just one
decimal place whenever appropriate; choose suitable units to keep the values small (e.g., use tons instead of kg). Every table should fit
within the normal typewritten area of a standard upright page (not a 'landscape' page).
• Black-and-white photographs and drawings (prepared in dense black ink on a white card or a heavy-duty tracing paper) are welcome -
photocopies, color photographs, and 35-mm slides are not. Please send disk-files (with all the data) whenever you submit computer-
generated illustrations.
• Keep the list of references short - not more than five references, all of which should have been seen in the original by the author.
Provide all the details including author/s, year, title of the article, full title of the journal, volume, issue, and page numbers (for journal
articles), and place of publication and publishers (for books and conference proceedings) for every reference.
• Express all the quantities only in SI units. Spell out in full every acronym you use.
• Give the correct Latin name of every crop, pest, or pathogen at the first mention.
• Type the entire text in double spacing. Please send a file, which should match the printout, on a double-sided/high density IBM-
compatible disk using Microsoft Applications.
• Contact the Editor for detailed guidelines on how to format text and diskettes.
• Include the full address with telephone, fax, and email numbers of all authors.
The Editors wil l carefully consider all submitted contributions and will include in the Newsletter those that are of acceptable scientific
standard and conform to requirements. The language of the Newsletter is English, but where possible, articles submitted in other languages
will be translated. Authors should closely follow the style of the reports in this issue. Contributions that deviate markedly from this style
will be returned for revision, and could miss the publication date. Communications will be edited to preserve a uniform style throughout the
Newsletter. This may shorten some contributions, but particular care will be taken to ensure that the editing will not change the meaning
and scientific content of the article. Wherever substantial editing is required, a draft copy of the edited version will be sent to the contributor
for approval before printing.
Contributions should be sent before 31 March to:
ICPN Editor
ICRISAT
Patancheru 502 324
Andhra Pradesh, India
Fax +91 40 23241239
Email [email protected]
Tel +91 40 23296161
Contents
Editorial
News
About Scientists
ICRISAT and ICARDA Win the King Baudouin Award 2002
ICRISAT's Chickpea Team Wins Doreen Mashler Award 2002
Chickpea Scientists' Meet at ICRISAT
Awards for DFID-funded Research on Pigeonpea Sterility Mosaic
New Pigeonpea Varieties Released in Andhra Pradesh
National Review and Planning Meeting on Chickpea in Pakistan
Research Reports
Chickpea
Breeding
Effect of Seed Size on Seed Yield and Quality in Chickpea
SK Varshney
Induced Flower Color Mutations in Chickpea
BM Atta, M Ahsan ul Haq, TM Shah, M Sadiq, Mahmud ul Hassan,
and Hina Syed
Response of Chickpea Genotypes to Different Dates of Sowing in Alfisols of Chittoor District,
Andhra Pradesh, India
5 Krishna Chaitanya and V Chandrika
Evaluation of Chickpea Genotypes for Cold Tolerance
JS Sandhu and ,SJ ArasaKesary
Himachal Chana 2: A New Desi Chickpea Line for Himachal Pradesh. India
Anand Singh and Anil Sirohi
1
1
1
2
2
3
3
3
5
6
8
9
12
ICPN 10, 2003 i
Gujarat Gram 1: A High-yielding Wilt Resistant Desi Chickpea Variety for Central Zone of India
MS Pithia, BL Joshi, JH Vachhani, VP Andani, MU Vachhani, and VB Gadhiu
Gujarat Gram 4: A New Desi Chickpea Variety for Northeastern India
MS Pithia, BL Joshi, JH Vachhani, VP Andani, Mil Vachhani, and MF Acharya
Annigeri in the High Barind Tract of Bangladesh - Performance of a Chickpea Variety
Out of its Zone of Adaptation
M Yusuf Ali. C Johansen, and Selim Ahmed
Agronomy/Physiology
Priming of Chickpea Seeds with Water and Mannitol Overcomes the Effect of Salt Stress
on Seedling Growth
Satvir Kaur, Anil K Gupta, and Narinder Kaur
Response of Chickpea to Sources and Levels of Sulfur
RV Singh, AK Sharma, and RKS Tomar
Genetic Diversity of Drought-avoidance Root Traits in the Mini-core Germplasm Collection
of Chickpea
L Krishnamurthy, J Kashiwagi, HD Upadhyaya, and R Serraj
Root and Shoot Growth Dynamics of Some Chickpea Genotypes Under Two Moisture Levels
L Krishnamurthy, J Kashiwagi, and R Serraj
Pathology
Status of Chickpea Diseases in Himachal Pradesh, India
Anand Singh and Anil Sirohi
An Improved Technique for Virulence Assay of Ascochyta rabiei on Chickpea
W Chen and FJ Muehlhauer
Entomology
Effect of Helicoverpa Nuclear Polyhedrosis Virus on Pod Borer Larvae in Chickpea Crops
in BangladeshAM Musa and C Johansen
13
15
16
18
20
21
24
29
31
33
ii ICPN 10, 2003
Biotechnology
Functional Genome Analysis Using DDRT for Ascochyta Blight Resistance in Chickpea
PN Rajesh, VS Gupta, PK Ranjekar, and FJ Muehlbauer
Enzymatic Degradation of Oligosaccharide Content of Chickpea
VH Mulimani, S Thippeswamy, and S Devindra
Diversity in Advanced Breeding Lines of Chickpea
T Dasgupta and Mukesh Singh
Pigeonpea
Breeding
BRG 1: A High-yielding and Bold-seeded Pigeonpea Variety for Dhal and Vegetable Purpose
M Byre Gowda, M Saifulla, CS Jagadeesh Babu, BC Shankaralingappa, and P Mahadevu
Agronomy/Physiology
Identification of 'Phosphorus' Efficient Pigeonpea Genotypes Based on Phosphate
Solubilizing Bacteria in the Rhizosphere
V Thamodharan, Lakshmi Tewari, and GC Bajpai
Pathology
Evaluation of Pigeonpea Genotypes to Root-knot Nematode Meloidogyne incognita
Abdul Hamid Wani and M Mashkoor Alam
Entomology
Reaction of Eight Short-duration Pigeonpea Genotypes Against Pod Borer Complex
in Tamil Nadu, IndiaC Durairaj and TG Shanower
New Methodology for Assessment of Damage by Pigeonpea Pod Wasp Tanaostigmodes cajaninae C Durairaj, S Palaniswamy, and AR Muthiah
Effect of Insecticides on Loss in Seed Mass and Yield of Pigeonpea by Pod BorerAkhilesh Kumar and Paras Nath
35
37
38
42
44
45
47
48
50
ICPN 10,2003 iii
Natural Enemies of Pigeonpea Insect Pests at Varanasi, Uttar Pradesh, India
Akhilesh Kumar and Paras Nath
Egg Parasitoid Gryon sp on Pigeonpea Pod Bug Clavigralla gibbosa in Tamil Nadu, India
C Durairaj, S Palaniswamy, and AR Muthiah
Bioassay of Metarhizium anisopliae Against Pigeonpea Pod Borer Helicoverpa armigera
SS Kulau PR Patil, SA Nimbalkar, PS Paul, and PK Sarnaik
Publications
Publications from ICRISAT
SATCRIS Listing
51
54
55
57
57
iv ICPN 10, 2003
Edi tor ia l News
Last year (2002) was a landmark for scientists working
on chickpea and pigeonpea. Several scientists received
both individual as well as team awards for their
achievements. ICRISAT and ICARDA jointly won the
King Baudouin Award, the highest accolade conferred by
the Consultative Group on International Agricultural
Research (CGIAR) for excellence in chickpea research.
ICRISAT Chickpea Team also won the Doreen Mashler
Award for outstanding contribution to chickpea
improvement. Jagdish Kumar, HD Upadhyaya, and
P Lava Kumar were also recognized for their achievements
described under the section News. Congratulations to
one and all! I am sure in the years to come several such
laurels will follow. Keep it up!
This issue of the International Chickpea and Pigeonpea
Newsletter (ICPN) contains articles on all disciplines of
chickpea and pigeonpea. However, most articles still
continue to be from Asia and the Indian subcontinent in
particular. A substantial research on these crops is being
carried out in several other countries of Asia and in
Africa, and ICPN can be a good informal vehicle to bring
this research to wider readership. A great proportion of
results on these crops remain unpublished or arc published
in the vernacular publications. This deprives a large
section of the scientific community to be informed of the
outcome of scientific efforts. I urge scientists to share
their research results with the readership of ICPN.
Several papers submitted for this issue were not in the
ICPN format and had to be sent back to authors for
modifications. To reduce time in acceptance of papers for
publication in the ICPN, I request authors to follow ICPN
guidelines for format and length of submission.
I would like to acknowledge S Chandra, YS Chauhan.
R Folkertsma, PM Gaur, JVDK Kumar Rao,
V Mahalakshmi, S Pande, A Ramakrishna, GV Ranga Rao,
KN Reddy, OP Rupela. KL Sahrawat, DVSSR Sastry,
KB Saxena, R Serraj, HC Sharma. KK Sharma,
P Singh, and RP Thakur for reviewing ICPN papers, and
the Library at ICRISAT for compiling the SATCRIS
listing.
I assure you that with cooperation from the
contributors and readers, we will try our best to ensure
that ICPN continues to maintain high standards in
disseminating information efficiently and effectively
amongchickpea and pigeonpea workers.
HD Upadhyaya
About Scientists
Jagdish Kumar, Principal Scientist (Chickpea Breeding),
who is presently on secondment from ICRISAT and
working with Agriculture Environmental Renewal
Canada Inc. in Ottawa, Canada was awarded
"Millennium ICRISAT Science Award 2002" in
recognition of his contribution to chickpea improvement.
HD Upadhyaya, Special Project Scientist, Genebank,
ICRISAT was awarded "Millennium ICRISAT Science
Award 2002" for his Outstanding Scientific Article entitled
"A mini core subset for capturing diversity and
promoting utilization of chickpea genetic resources in
crop improvement" published in Theoretical and Applied
Genetics in 2001.
After completing one-year assignment as Visiting
Scientist, PM Gaur joined as Senior Scientist (Chickpea
Breeding) at ICRISAT, Patancheru effective August
2002.
ICRISAT and ICARDA Win the King
Baudouin Award 2002
ICRISAT and ICARDA have jointly won the 2002 King
Baudouin Award, the highest accolade conferred by the
Consultative Group on International Agricultural
Research (CGIAR). This Award is given in recognition
of the most outstanding scientific work done by the 16
CGIAR centers in partnership with national research and
development organizations. The joint submission by
ICRISAT and ICARDA was titled "Changing lives in
marginal environments - ICRISAT and ICARDA: a
winning partnership in chickpea research". The award was
given for excellence in chickpea research, particularly for
development of new chickpea varieties with higher
tolerance to drought and heat, better resistance to pests
and diseases that provide stable and economically
profitable yields. The benefits of this research are having
positive impacts in Bangladesh, Ethiopia, India,
Myanmar, Nepal, Syria, and other rainfed agricultural areas.
This research partnership involved collaboration
between scientists and farmers in more than 30 countries.
ICPN 10, 2003 1
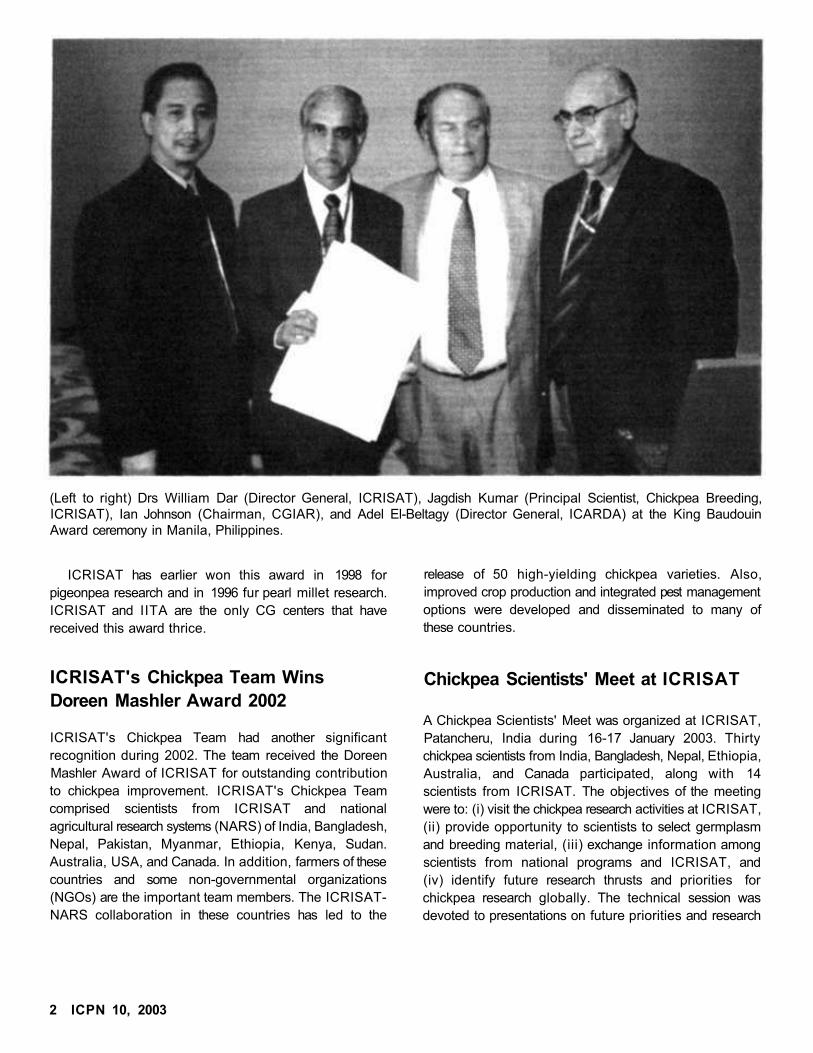
(Left to right) Drs William Dar (Director General, ICRISAT), Jagdish Kumar (Principal Scientist, Chickpea Breeding,ICRISAT), Ian Johnson (Chairman, CGIAR), and Adel El-Beltagy (Director General, ICARDA) at the King BaudouinAward ceremony in Manila, Philippines.
ICRISAT has earlier won this award in 1998 for
pigeonpea research and in 1996 fur pearl millet research.
ICRISAT and IITA are the only CG centers that have
received this award thrice.
ICRISAT's Chickpea Team Wins
Doreen Mashler Award 2002
ICRISAT's Chickpea Team had another significant
recognition during 2002. The team received the Doreen
Mashler Award of ICRISAT for outstanding contribution
to chickpea improvement. ICRISAT's Chickpea Team
comprised scientists from ICRISAT and national
agricultural research systems (NARS) of India, Bangladesh,
Nepal, Pakistan, Myanmar, Ethiopia, Kenya, Sudan.
Australia, USA, and Canada. In addition, farmers of these
countries and some non-governmental organizations
(NGOs) are the important team members. The ICRISAT-
NARS collaboration in these countries has led to the
release of 50 high-yielding chickpea varieties. Also,
improved crop production and integrated pest management
options were developed and disseminated to many of
these countries.
Chickpea Scientists' Meet at ICRISAT
A Chickpea Scientists' Meet was organized at ICRISAT,
Patancheru, India during 16-17 January 2003. Thirty
chickpea scientists from India, Bangladesh, Nepal, Ethiopia,
Australia, and Canada participated, along with 14
scientists from ICRISAT. The objectives of the meeting
were to: (i) visit the chickpea research activities at ICRISAT,
(ii) provide opportunity to scientists to select germplasm
and breeding material, (iii) exchange information among
scientists from national programs and ICRISAT, and
(iv) identify future research thrusts and priorities for
chickpea research globally. The technical session was
devoted to presentations on future priorities and research
2 ICPN 10, 2003
strategies of ICRISAT (PM Gaur), India (Masood Ali),
Bangladesh (M Azizur Rahman), Nepal (RK Neupane),
Ethiopia (Ketems Daba), Australia (EJ Knights), and
Canada (Tom Warkentin) for chickpea improvement.
After the technical session, the scientists visited
experiments and research lacilities of ICRISAT and selected
breeding materials and germplasm of their interest.
Awards for DFID-funded Research on
Pigeonpea Sterility Mosaic
Research work on pigeonpea sterility mosaic funded by
the Crop Protection Programme (CPP) of United Kingdom
Department for International Development (DFID) was
recognized for excellent research outputs that helped
solve the mystery of sterility mosaic, a serious threat to
pigeonpea production in the Indian subcontinent. With
funding from CPP-DFID, ICRISAT and the Scottish
Crop Research Institute (SCRI) have identified the causal
agent of sterility mosaic and methods for its control. For
these achievements two team members working in the
DFID project bagged the following awards.
• P Lava Kumar, working in the DFID project since
October 1996, first as PhD student (October 1996-
August 1999) and later as a Special Project Scientist at
ICRISAT won three awards for his outstanding
research contributions:
- The Jawaharlal Nehru Award for Outstanding Post
Graduate Agriculture Research 2001 for best PhD
work in plant pathology presented by the Union
Minister of Agriculture, Sri Ajit Singh, on 16 July
2002 at Vigyan Bhavan, New Delhi, India. The
award was instituted by the Indian Council of
Agricultural Research (ICAR).
- Millennium ICRISAT Science Award 2002,
category 'Promising Young Scientist' presented by
Dr Fortunato Battad, President Emeritus, Central
Luzon State University, Philippines on the occasion
of ICRISAT Loyalty Day on 12 December 2002 at
ICRISAT, Patancheru, India.
- Sri Veerapaneni Narasimham Memorial Gold
Medal for the Year 2001 for best research worker
in plant pathology presented by the Governor of
Andhra Pradesh Sri Surjit Singh Barnala, during
the Acharya NG Ranga Agricultural University 35th
Annual Convocation on 11 March 2003 at Hyderabad,
India.
• NK Kulkarni, former PhD student in a DFID-funded
project at ICRISAT, won the Prof MJ Narasimhan
Academic Merit Award for presentation of a research
paper based on his PhD work in the national contest
held during the 55th Annual Conference of Indian
Phyotpathological Society on 17 January 2003, at
Osmania University, Hyderabad. He is currently working
as Research Associate in DFID project at the University
of Agricultural Sciences, Bangalore, India.
New Pigeonpea Varieties Released in
Andhra Pradesh
Two new pigeonpea varieties developed by Acharya NG
Ranga Agricultural University, Rajendranagar, Hyderabad
were released for cultivation in Andhra Pradesh, India
during July 2002.
LRG 38 (Ranga Bold) was developed from a cross
between C 11 and ICP 7035 by the Regional Agricultural
Research Station, Lam, Guntur, Andhra Pradesh. It is a
medium-duration variety (170 days) with bold seed (100-
seed mass 10.5 g). It matures 10 days earlier than LRG 30
which was released in 1980. It is a robust bushy type with
broad leaves. It is suitable for sole and intercropping
during kharif (rainy) and rabi (postrainy) seasons. The
yield potential of LRG 38 is 2.0 to 2.2 t ha-1.
WRG 27 (Varalu) is a selection from a local landrace
and was developed by the Agricultural Research Station,
Warangal, Andhra Pradesh. It is a medium-duration
variety (170-180 days). It has red flowers and is suitable
for sole cropping and intercropping during kharif and
rabi seasons. It is tolerant to Helicoverpa pod borer. The
yield potential of WRG 27 is 2.0 to 2.2 t ha-1.
National Review and Planning Meeting
on Chickpea in Pakistan
The national review and planning meeting of Pulses
Program was held from 24 to 26 September 2002 at the
National Agricultural Research Centre (NARC). Islamabad,
Pakistan after a gap of five years. The meeting was
coordinated by Dr Muhammad Bashir, National Coordinator
(Pulses), NARC and attended by more than 60
participants including scientists from federal and
provincial research institutes, personnel from agriculture
extension department, representatives of seed companies,
Federal Seed Certification and Registration Department, and
progressive growers. The overall objective of the meeting
ICPN 10,2003 3
was to share views to develop strategies for the improvement
of chickpea in the country based on problem oriented
research. The meeting provided a common forum for
chickpea scientists to share their previous research
results, plan research activities for 2002/03, and make
recommendations for researchers, planners, and farmers.
The issues related to production constraints of chickpea
were thoroughly discussed. It was noted that non-availability
of quality seed of improved cultivars, non-adoption of
production technology, and lack of credit facilities for
chickpea growers are major constraints. The following
research priorities were fixed for the improvement of
chickpea in the country:
• Improvement for high yield potential and desirable
physio-agronomic traits with resistance to biotic and
abiotic stresses
- Drought and cold tolerance
- Blight and wilt resistance
- Field and storage insect infestation
• Development of package of production technology for
different cropping systems
- Moisture conservation
- Nutrient management and Rhizobium inoculation
- Seed rate and sowing time
- Weed control
- Intercropping
• Production of certified and quality seed
The recommendations and research plan for 2002/03
were approved by the Director General, NARC and Member,
Crop Sciences, Pakistan Agricultural Research Council
(PARC). The higher authorities of PARC and Ministry of
Food and Agriculture were requested to raise funds for
chickpea research so that fixed targets may be achieved.
The need for short- and long-term training of chickpea
scientists was also felt. The house also proposed a seminar on
chickpea during March 2003 and a National Conference
on Grain Legumes (Pulses) during 2004 at Faisalabad,
Pakistan.
Contributed by: Muhammad Bashir
National Coordinator (Pulses), Pulses Program,
National Agricultural Research Centre
Islamabad, Pakistan
4 ICPN 10, 2003
Research Reports
Chickpea
Breeding
Effect of Seed Size on Seed Yield and
Quality in Chickpea
SK Varshney (Department of Seed Technology. Tirhul
College of Agriculture. Dholi (Muzaffarpur) 843 121,
Bihar. India)
Chickpea (Cicer arietinum) is an important rabi (postrainy
season) pulse crop of India and occupies a prime position
both in area and production in the state of Bihar. Seed
size and density affect the seed vigor as they indicate the
amount of reserve food supply for seedlings during the
period of germination, field emergence, and stress
conditions. In seed industry too seed size is considered an
important aspect of seed quality. To obtain uniform seed
size within a variety, size grading is inevitable. While
grading, sizeable portion of oversize and undcrsize seeds
are rejected due to their unworthiness in terms of seed
quality. Therefore, optimum seed size needs to be
determined which may affect both seed yield and quality
in chickpea (Vadivelu and Ramakrishnan 1983, Bhor et
al. 1988). Keeping in view the above facts, this study was
undertaken.
The experiment was conducted with eight treatments
including four seed sizes: oversize (OS), graded (G),
ungraded (UG), and undersize (US); and two chickpea
genotypes P-256 and DHG 82-4. The experiment was
laid out in three replications during rabi in 1990/91. 1991/92,
and 1992/93 at Tirhut College of Agriculture. Dholi
Research Farm, Dholi, Bihar. The plot size for each
treatment was 5 x 3 m2 and recommended agronomic
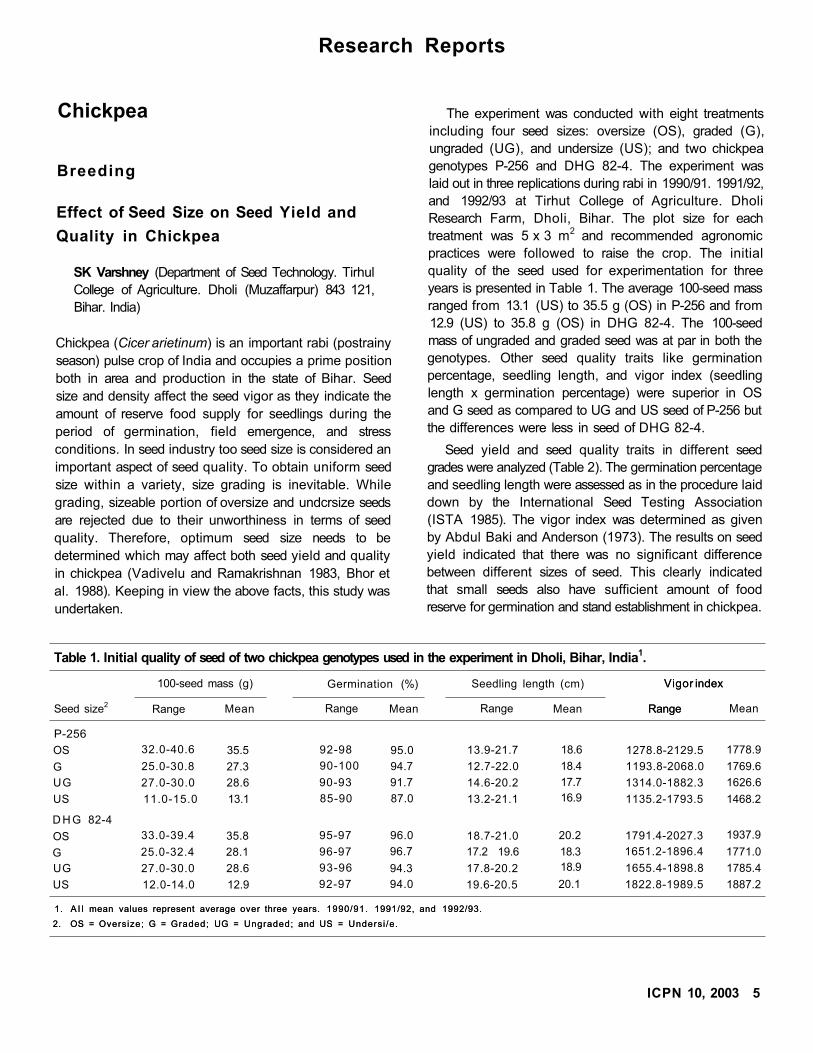
practices were followed to raise the crop. The initial
quality of the seed used for experimentation for three
years is presented in Table 1. The average 100-seed mass
ranged from 13.1 (US) to 35.5 g (OS) in P-256 and from
12.9 (US) to 35.8 g (OS) in DHG 82-4. The 100-seed
mass of ungraded and graded seed was at par in both the
genotypes. Other seed quality traits like germination
percentage, seedling length, and vigor index (seedling
length x germination percentage) were superior in OS
and G seed as compared to UG and US seed of P-256 but
the differences were less in seed of DHG 82-4.
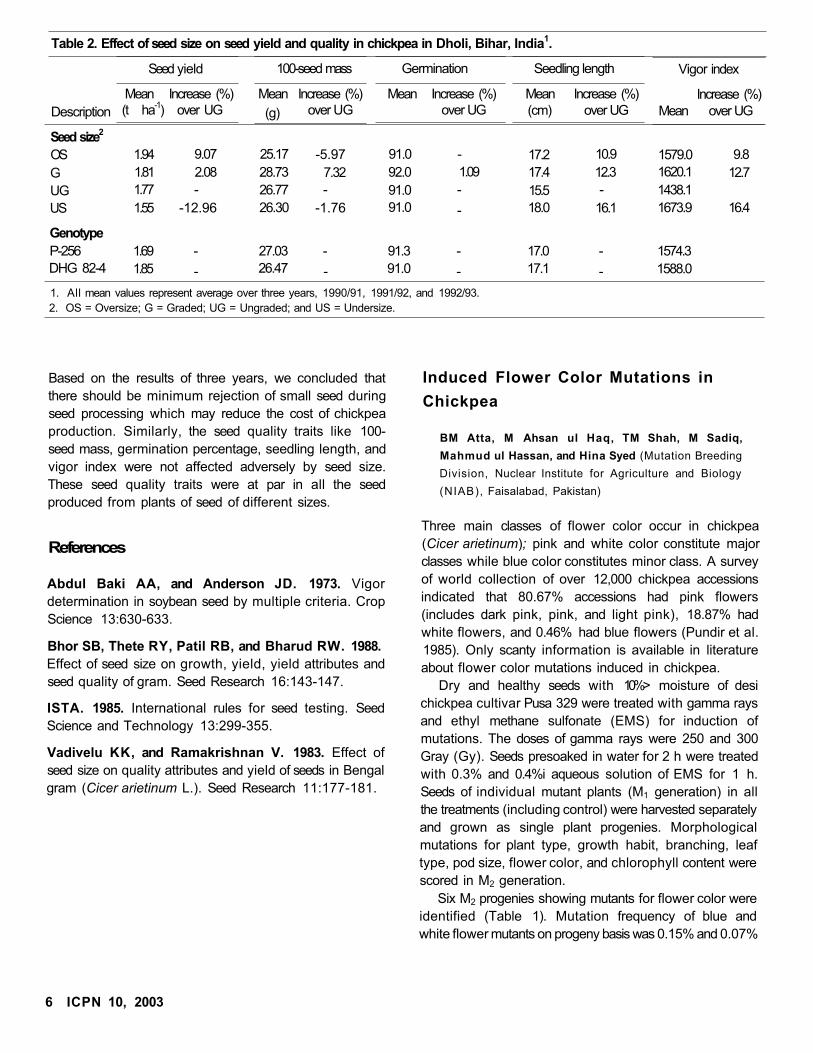
Seed yield and seed quality traits in different seed
grades were analyzed (Table 2). The germination percentage
and seedling length were assessed as in the procedure laid
down by the International Seed Testing Association
(ISTA 1985). The vigor index was determined as given
by Abdul Baki and Anderson (1973). The results on seed
yield indicated that there was no significant difference
between different sizes of seed. This clearly indicated
that small seeds also have sufficient amount of food
reserve for germination and stand establishment in chickpea.
Table 1. Initial quality of seed of two chickpea genotypes used in the experiment in Dholi, Bihar, India1.
100-seed mass (g) Germination (%) Seedling length (cm) Vigor index
RangeSeed size2Range Mean Range Mean Range Mean
Vigor index
Range Mean
P-256
OS 32.0-40.6 35.5 92-98 95.0 13.9-21.7 18.6 1278.8-2129.5 1778.9
G 25.0-30.8 27.3 90-100 94.7 12.7-22.0 18.4 1193.8-2068.0 1769.6
UG 27.0-30.0 28.6 90-93 91.7 14.6-20.2 17.7 1314.0-1882.3 1626.6
US 11.0-15.0 13.1 85-90 87.0 13.2-21.1 16.9 1135.2-1793.5 1468.2
D H G 82-4
OS 33.0-39.4 35.8 95-97 96.0 18.7-21.0 20.2 1791.4-2027.3 1937.9
G 25.0-32.4 28.1 96-97 96.7 17.2 19.6 18.3 1651.2-1896.4 1771.0
UG 27.0-30.0 28.6 93-96 94.3 17.8-20.2 18.9 1655.4-1898.8 1785.4
US 12.0-14.0 12.9 92-97 94.0 19.6-20.5 20.1 1822.8-1989.5 1887.2
1. A l l mean values represent average over three years. 1990/91. 1991/92, and 1992/93.
2. OS = Oversize; G = Graded; UG = Ungraded; and US = Undersi /e.
1. A l l mean values represent average over three years. 1990/91. 1991/92, and 1992/93.
2. OS = Oversize; G = Graded; UG = Ungraded; and US = Undersi /e.
ICPN 10, 2003 5
Seed size2
OS 1.94 9.07 25.17 -5.97 91.0 - 17.2 10.9 1579.0 9.8
G 1.81 2.08 28.73 7.32 92.0 1.09 17.4 12.3 1620.1 12.7
UG 1.77 - 26.77 - 91.0 - 15.5 - 1438.1
US 1.55 -12.96 26.30 -1.76 91.0 - 18.0 16.1 1673.9 16.4
Genotype
P-256 1.69 - 27.03 - 91.3 - 17.0 - 1574.3
DHG 82-4 1.85 - 26.47 - 91.0 - 17.1 - 1588.0
1. All mean values represent average over three years, 1990/91, 1991/92, and 1992/93.
2. OS = Oversize; G = Graded; UG = Ungraded; and US = Undersize.
Based on the results of three years, we concluded that
there should be minimum rejection of small seed during
seed processing which may reduce the cost of chickpea
production. Similarly, the seed quality traits like 100-
seed mass, germination percentage, seedling length, and
vigor index were not affected adversely by seed size.
These seed quality traits were at par in all the seed
produced from plants of seed of different sizes.
References
Abdul Baki AA, and Anderson JD. 1973. Vigor
determination in soybean seed by multiple criteria. Crop
Science 13:630-633.
Bhor SB, Thete RY, Patil RB, and Bharud RW. 1988.
Effect of seed size on growth, yield, yield attributes and
seed quality of gram. Seed Research 16:143-147.
ISTA. 1985. International rules for seed testing. Seed
Science and Technology 13:299-355.
Vadivelu KK, and Ramakrishnan V. 1983. Effect of
seed size on quality attributes and yield of seeds in Bengal
gram (Cicer arietinum L.). Seed Research 11:177-181.
Induced Flower Color Mutations in
Chickpea
BM Atta, M Ahsan ul Haq, TM Shah, M Sadiq,
Mahmud ul Hassan, and Hina Syed (Mutation Breeding
Division, Nuclear Institute for Agriculture and Biology
(NIAB), Faisalabad, Pakistan)
Three main classes of flower color occur in chickpea
(Cicer arietinum); pink and white color constitute major
classes while blue color constitutes minor class. A survey
of world collection of over 12,000 chickpea accessions
indicated that 80.67% accessions had pink flowers
(includes dark pink, pink, and light pink), 18.87% had
white flowers, and 0.46% had blue flowers (Pundir et al.
1985). Only scanty information is available in literature
about flower color mutations induced in chickpea.
Dry and healthy seeds with 10%> moisture of desi
chickpea cultivar Pusa 329 were treated with gamma rays
and ethyl methane sulfonate (EMS) for induction of
mutations. The doses of gamma rays were 250 and 300
Gray (Gy). Seeds presoaked in water for 2 h were treated
with 0.3% and 0.4%i aqueous solution of EMS for 1 h.
Seeds of individual mutant plants (M1 generation) in all
the treatments (including control) were harvested separately
and grown as single plant progenies. Morphological
mutations for plant type, growth habit, branching, leaf
type, pod size, flower color, and chlorophyll content were
scored in M2 generation.
Six M2 progenies showing mutants for flower color were
identified (Table 1). Mutation frequency of blue and
white flower mutants on progeny basis was 0.15% and 0.07%
6 ICPN 10, 2003
Description
Seed yield
Mean Increase (%)(t ha-1) over UG
100-seed mass
Mean
(g)
Increase (%)over UG
Germination
Mean Increase (%)over UG
Seedling length
Mean(cm)
Increase (%)over UG
Vigor index
Increase (%)Mean over UG
Table 2. Effect of seed size on seed yield and quality in chickpea in Dholi, Bihar, India1.
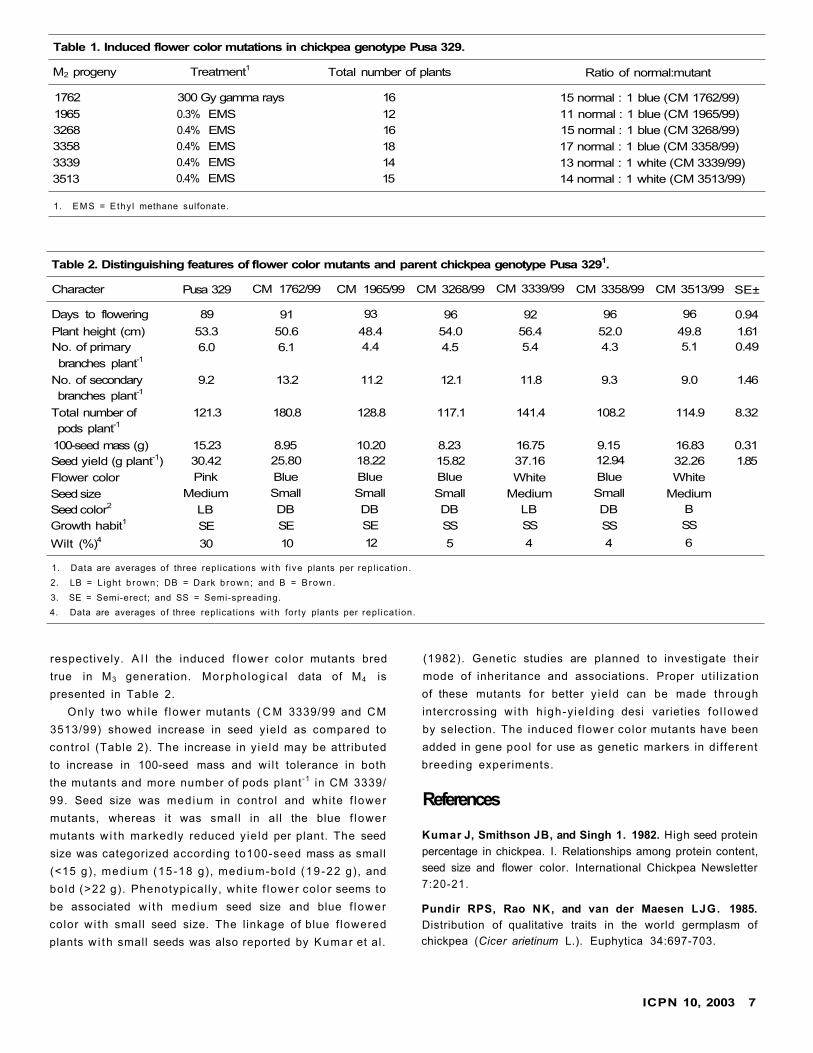
Table 1. Induced flower color mutations in chickpea genotype Pusa 329.
M2 progeny Treatment1 Total number of plants Ratio of normal:mutant
1762 300 Gy gamma rays 16 15 normal : 1 blue (CM 1762/99)
1965 0.3% EMS 12 11 normal : 1 blue (CM 1965/99)
3268 0.4% EMS 16 15 normal : 1 blue (CM 3268/99)
3358 0.4% EMS 18 17 normal : 1 blue (CM 3358/99)
3339 0.4% EMS 14 13 normal : 1 white (CM 3339/99)
3513 0.4% EMS 15 14 normal : 1 white (CM 3513/99)
1. EMS = Ethy l methane sulfonate.
Table 2. Distinguishing features of flower color mutants and parent chickpea genotype Pusa 3291.
Character Pusa 329 CM 1762/99 CM 1965/99 CM 3268/99 CM 3339/99 CM 3358/99 CM 3513/99 SE±
Days to flowering 89 91 93 96 92 96 96 0.94
Plant height (cm) 53.3 50.6 48.4 54.0 56.4 52.0 49.8 1.61
No. of primary 6.0 6.1 4.4 4.5 5.4 4.3 5.1 0.49
branches plant-1
No. of secondary 9.2 13.2 11.2 12.1 11.8 9.3 9.0 1.46
branches plant-1
Total number of 121.3 180.8 128.8 117.1 141.4 108.2 114.9 8.32
pods plant-1
100-seed mass (g) 15.23 8.95 10.20 8.23 16.75 9.15 16.83 0.31
Seed yield (g plant-1) 30.42 25.80 18.22 15.82 37.16 12.94 32.26 1.85
Flower color Pink Blue Blue Blue White Blue White
Seed size Medium Small Small Small Medium Small Medium
Seed color2 LB DB DB DB LB DB B
Growth habit1 SE SE SE SS SS SS SS
Wilt (%)4 30 10 12 5 4 4 6
1. Data are averages of three replications w i th f ive plants per repl icat ion.
2. LB = Light b rown; DB = Dark b rown; and B = Brown.
3. SE = Semi-erect; and SS = Semi-spreading.
4. Data are averages of three replications w i th forty plants per repl icat ion.
respectively. A l l the induced f lower color mutants bred
true in M3 generation. Morpholog ica l data of M4 is
presented in Table 2.
Only two whi le f lower mutants ( C M 3339/99 and CM
3513/99) showed increase in seed yield as compared to
control (Table 2). The increase in y ie ld may be attributed
to increase in 100-seed mass and wi l t tolerance in both
the mutants and more number of pods plant -1 in CM 3339/
99. Seed size was medium in control and white f lower
mutants, whereas it was small in all the blue f lower
mutants w i th markedly reduced y ie ld per plant. The seed
size was categorized according to100-seed mass as small
(<15 g), medium (15-18 g), medium-bold (19-22 g), and
bold (>22 g). Phenotypical ly, white f lower color seems to
be associated w i th medium seed size and blue f lower
color w i th small seed size. The l inkage of blue f lowered
plants w i th small seeds was also reported by Kumar et al.
(1982). Genetic studies are planned to investigate their
mode of inheritance and associations. Proper ut i l izat ion
of these mutants for better y ie ld can be made through
intercrossing w i th h igh-y ie ld ing desi varieties fo l lowed
by selection. The induced f lower color mutants have been
added in gene pool for use as genetic markers in different
breeding experiments.
References
Kumar J, Smithson JB, and Singh 1. 1982. High seed protein
percentage in chickpea. I. Relationships among protein content,
seed size and flower color. International Chickpea Newsletter
7:20-21.
Pundir RPS, Rao NK, and van der Maesen LJG. 1985.
Distribution of qualitative traits in the world germplasm of
chickpea (Cicer arietinum L.). Euphytica 34:697-703.
ICPN 10, 2003 7
Response of Chickpea Genotypes to
Different Dates of Sowing in Alfisols of
Chittoor District, Andhra Pradesh, India
S Krishna Chaitanya and V Chandrika (SV Agricultural
College, Acharya NG Ranga Agricultural University,
Tirupati 517 502, Andhra Pradesh, India)
In Chittoor district of Andhra Pradesh, India the length of
crop growing season is more due to characteristic bimodal
distribution of rainfall. Chickpea (Cicer arietinum) is a new
crop to this region and hence it can be tried as a sequential
crop in double cropping system, after groundnut (Arachis
hypogaea). Among different agronomic practices,
selection of suitable variety and optimum time of sowing
are important non-monetary inputs for obtaining higher
yields. Information regarding these aspects is lacking for
the southern agroclimatic zone and hence this study was
conducted at the SV Agricultural College Farm, Tirupati,
Andhra Pradesh.
A field experiment was conducted during rabi
(postrainy season) 2001/02 on sandy loam soils in a factorial
randomized block design (RBD), replicated thrice with
two factors, viz., three genotypes (ICCV 10, ICCV 2,
Annigeri 1) and four dates of sowing (October 15,
November 1, November 15, and December 1). A uniform
fertilizer dose of 20 kg nitrogen ha-1 and 50 kg P2O5 ha-1
was applied as basal dose to all experimental plots. One
seed was hand dibbled per hill in furrows adopting a
spacing of 30 cm x 10 cm. Five plants were randomly
selected from net plot area in each experimental plot and
tagged for recording observations on growth characters
and yield attributes.
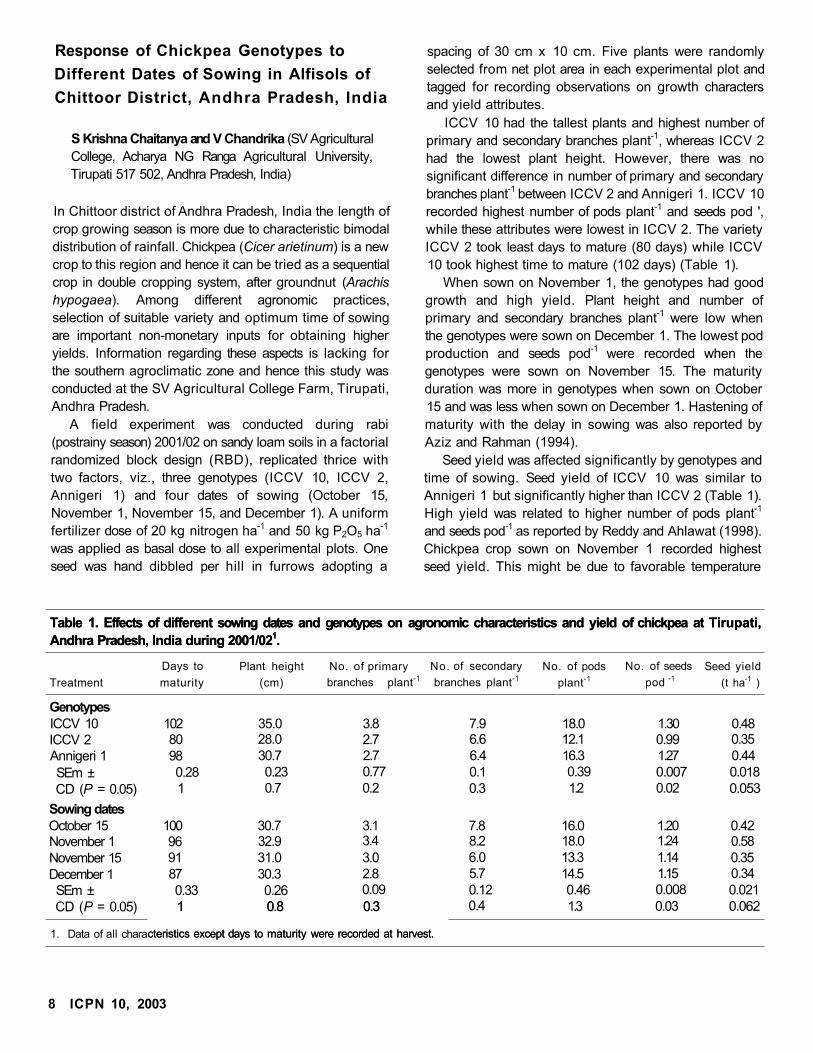
ICCV 10 had the tallest plants and highest number of
primary and secondary branches plant-1, whereas ICCV 2
had the lowest plant height. However, there was no
significant difference in number of primary and secondary
branches plant-1 between ICCV 2 and Annigeri 1. ICCV 10
recorded highest number of pods plant-1 and seeds pod ',
while these attributes were lowest in ICCV 2. The variety
ICCV 2 took least days to mature (80 days) while ICCV
10 took highest time to mature (102 days) (Table 1).
When sown on November 1, the genotypes had good
growth and high yield. Plant height and number of
primary and secondary branches plant-1 were low when
the genotypes were sown on December 1. The lowest pod
production and seeds pod-1 were recorded when the
genotypes were sown on November 15. The maturity
duration was more in genotypes when sown on October
15 and was less when sown on December 1. Hastening of
maturity with the delay in sowing was also reported by
Aziz and Rahman (1994).
Seed yield was affected significantly by genotypes and
time of sowing. Seed yield of ICCV 10 was similar to
Annigeri 1 but significantly higher than ICCV 2 (Table 1).
High yield was related to higher number of pods plant-1
and seeds pod-1 as reported by Reddy and Ahlawat (1998).
Chickpea crop sown on November 1 recorded highest
seed yield. This might be due to favorable temperature
Table 1. Effects of different sowing dates and genotypes on agronomic characteristics and yield of chickpea at Tirupati,
Andhra Pradesh, India during 2001/021.
Table 1. Effects of different sowing dates and genotypes on agronomic characteristics and yield of chickpea at Tirupati,
Andhra Pradesh, India during 2001/021.
Days to Plant height No. of primary No. of secondary No. of pods No. of seeds Seed yield
Treatment maturity (cm) branches plant-1 branches plant-1plant-1 pod -1
(t ha-1 )
Genotypes
ICCV 10 102 35.0 3.8 7.9 18.0 1.30 0.48ICCV 2 80 28.0 2.7 6.6 12.1 0.99 0.35Annigeri 1 98 30.7 2.7 6.4 16.3 1.27 0.44
SEm ± 0.28 0.23 0.77 0.1 0.39 0.007 0.018
CD (P = 0.05) 1 0.7 0.2 0.3 1.2 0.02 0.053
Sowing dates
October 15 100 30.7 3.1 7.8 16.0 1.20 0.42November 1 96 32.9 3.4 8.2 18.0 1.24 0.58November 15 91 31.0 3.0 6.0 13.3 1.14 0.35December 1 87 30.3 2.8 5.7 14.5 1.15 0.34SEm ± 0.33 0.26 0.09 0.12 0.46 0.008 0.021CD (P = 0.05) 1 0.8 0.3
cteristics except days to maturity were recorded at harvest.
0.4 1.3 0.03 0.062
1. Data of all chara
1 0.8 0.3
cteristics except days to maturity were recorded at harvest.
8 ICPN 10, 2003
dur ing crop growth period resulting in increased number
of pods plant -1 and seeds pod -1. Chickpea crop when sown
on December 1 recorded lowest seed y ie ld. Y ie ld
reduction in chickpea when sown earlier or later than the
opt imal date of sowing was also observed by Paikaray
and Misra (1992) and Saini and Faroda (1997). The
results indicated that ICCV 10 performed better than
Anniger i 1 and I C C V 2, indicating the suitabi l i ty of this
variety to this tract. Sowing of chickpea on November 1
was found to be the best in Chit toor distr ict.
References
Aziz M A , and Rahman M M . 1994. Effect o f date of
sowing on yield and y ie ld components of kabul i gram
(Cicer arietinum). Indian Journal of Agricultural Sciences
64(9) :624-626.
Paikaray R K , and Misra R C . 1992. Performance of
chickpea under different dates of sowing in Eastern Ghat
Highland Zone of Orissa, India. International Chickpea
Newsletter 27:24-25.
Reddy N R N , and Ahlawat IPS. 1998. Response of
chickpea (Cicer arictinum) genotypes to irr igation and
ferti l izers under late-sown condit ions. Indian Journal of
Agronomy 43(1 ) :95 -101 .
Saini SS, and Faroda AS. 1997. Effect of sowing t ime,
its pattern and seed rate on growth and yield of 'H 86-143'
chickpea (Cicer arictinum). Indian Journal of Agronomy
42(4) :645-649.
Evaluation of Chickpea Genotypes for
Cold Tolerance
JS Sandhu and SJ ArasaKesary (Department of Plant
Breeding, Punjab Agricultural University. Ludhiana 141 (X)4.
Punjab. India)
In North India, m in imum temperature falls below 10°C
for two and hal f months (December. January, and early
February) dur ing the crop season of chickpea (Cicer
arietinum). Due to lack of cold tolerance the recommended
chickpea cultivars of the region are unable to set productive
pods (wi th ful ly developed seeds) at this low temperature.
However, cult ivars continuously f lower and develop few
pods w i th shriveled seeds. The cult ivars set productive
pods when temperature starts r ising f rom mid-February.
Hence, the maturi ty period may be prolonged to 150-160
days. Consequently per day product iv i ty of chickpea is
low when compared to the most competi t ive crop of the
region, i.e., wheat (Triticum aestivum). There is urgent
need to develop cold tolerant chickpea cult ivars. The
cold tolerant genotypes w i l l mature early and also escape
from the damage of insect pests. After early harvest of
chickpea crop, farmers may have an addit ional summer
crop. We evaluated 57 desi chickpea genotypes for cold
tolerance at the Punjab Agr icul tural Universi ty, Ludhiana
(30°54' N, 75°48 ' E. 247 m altitude), Punjab, India.
The test genotypes of chickpea were selected f rom the
International Chickpea Cold Nursery/Winter 1995-96
supplied by ICRISAT . Patancheru, Andhra Pradesh,
India. The genotypes were sown on 1 October 2000, 25
days in advance than the recommended time to ensure
that f lowering occurs during the cold spell. Each genotype
was sown in a single row plot of 3 m length wi th 30 cm
interrow spacing. T w o plants f rom each genotype were
tagged at f lower ini t iat ion stage. All except six genotypes
flowered by mid-December 2000. Pollen viabil i ty, and total
pods and productive pods formed per plant were recorded
at low (minimum) temperatures of 5°C and 10°C separately
to evaluate the genotypes for cold tolerance. Pollen
viabi l i ty of each genotype was studied in the flowers
exposed at least three days to minimum temperatures selected
for the study (Srinivasan et al. 1999). Total pods plant-1
and productive pods plant-1 on the tagged plants were
counted for both the m in imum temperatures, separately.
M in imum temperature remained around 5°C from 21
December 2000 to 29 January 2001 except for seven
days. Old f lowers and pods were removed f rom the tagged
plants on 21 December 2000. Pods appeared ti l l 29 January
2001 : tagged plants were l ied wi th small white thread and
pods were al lowed to develop further. On 15 February
2001. total pods and number of productive pods were
recorded. Empty pods turned pale yel low and productive
pods were green. These tagged plants were further allowed
to (lower t i l l 28 February 2001 at m in imum temperature
10°C, and all the fresh pods that appeared were tied wi th
red color thread on these tagged plants. Thereafter no
flower was allowed to develop into pod ti l l 15 March 2001.
Final count of pods per plant were taken on 15 March 2001.
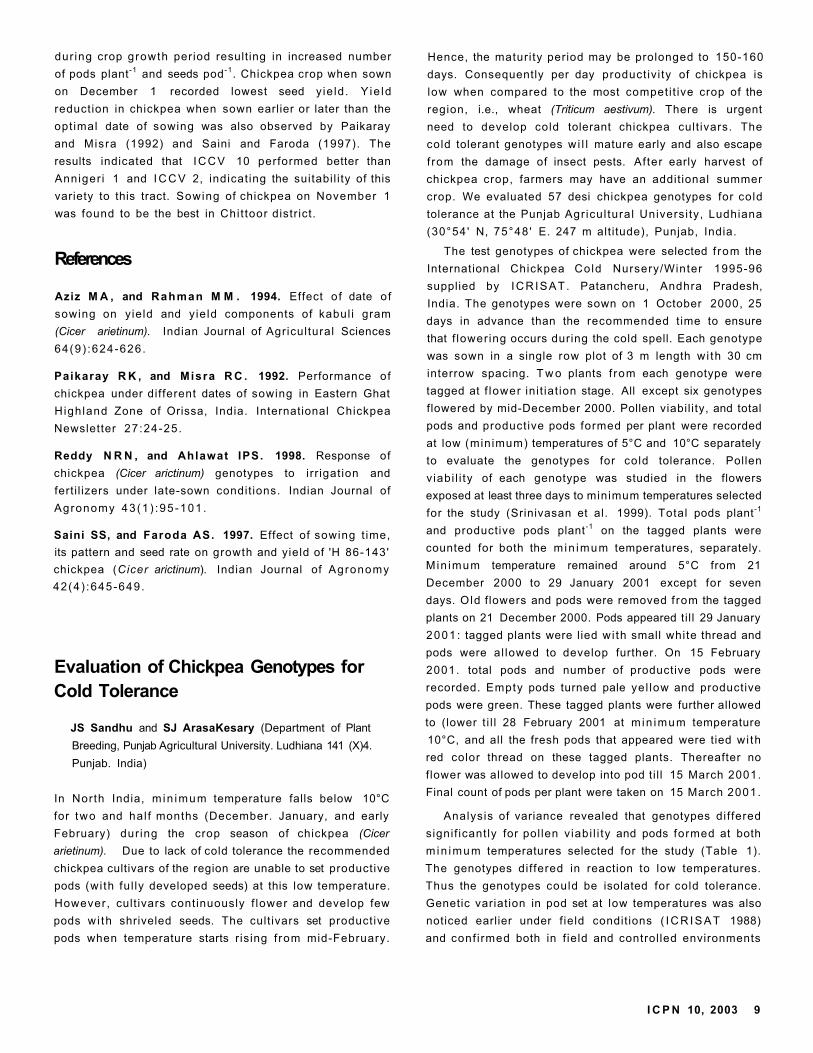
Analysis of variance revealed that genotypes dif fered
signif icantly for pol len v iabi l i ty and pods formed at both
m in imum temperatures selected for the study (Table 1).
The genotypes dif fered in reaction to low temperatures.
Thus the genotypes could be isolated for cold tolerance.
Genetic variation in pod set at low temperatures was also
noticed earlier under f ield condit ions ( I C R I S A T 1988)
and conf i rmed both in f ield and control led environments
I C P N 10, 2003 9
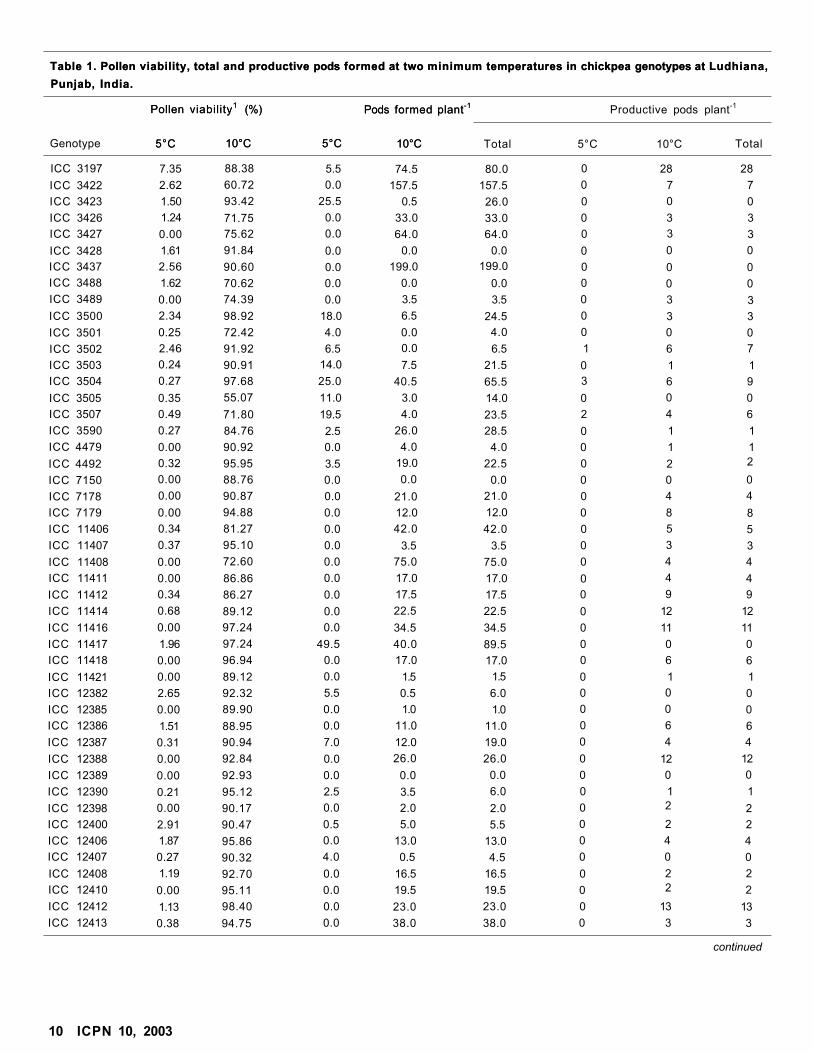
Table 1. Pollen viability, total and productive pods formed at two minimum temperatures in chickpea genotypes at Ludhiana,
Punjab, India.
Table 1. Pollen viability, total and productive pods formed at two minimum temperatures in chickpea genotypes at Ludhiana,
Punjab, India.
Pollen
5°C
viability1 (%)
10°C 5°C
Pods formed plant-1
10°C
Productive pods plant-1
Genotype
Pollen
5°C
viability1 (%)
10°C 5°C
Pods formed plant-1
10°C Total 5°C 10°C Total
ICC 3197 7.35 88.38 5.5 74.5 80.0 0 28 28
ICC 3422 2.62 60.72 0.0 157.5 157.5 0 7 7
ICC 3423 1.50 93.42 25.5 0.5 26.0 0 0 0
ICC 3426 1.24 71.75 0.0 33.0 33.0 0 3 3
ICC 3427 0.00 75.62 0.0 64.0 64.0 0 3 3
ICC 3428 1.61 91.84 0.0 0.0 0.0 0 0 0
ICC 3437 2.56 90.60 0.0 199.0 199.0 0 0 0
ICC 3488 1.62 70.62 0.0 0.0 0.0 0 0 0
ICC 3489 0.00 74.39 0.0 3.5 3.5 0 3 3
ICC 3500 2.34 98.92 18.0 6.5 24.5 0 3 3
ICC 3501 0.25 72.42 4.0 0.0 4.0 0 0 0
ICC 3502 2.46 91.92 6.5 0.0 6.5 1 6 7
ICC 3503 0.24 90.91 14.0 7.5 21.5 0 1 1
ICC 3504 0.27 97.68 25.0 40.5 65.5 3 6 9
ICC 3505 0.35 55.07 11.0 3.0 14.0 0 0 0
ICC 3507 0.49 71.80 19.5 4.0 23.5 2 4 6
ICC 3590 0.27 84.76 2.5 26.0 28.5 0 1 1
ICC 4479 0.00 90.92 0.0 4.0 4.0 0 1 1
ICC 4492 0.32 95.95 3.5 19.0 22.5 0 2 2
ICC 7150 0.00 88.76 0.0 0.0 0.0 0 0 0
ICC 7178 0.00 90.87 0.0 21.0 21.0 0 4 4
ICC 7179 0.00 94.88 0.0 12.0 12.0 0 8 8
ICC 11406 0.34 81.27 0.0 42.0 42.0 0 5 5
ICC 11407 0.37 95.10 0.0 3.5 3.5 0 3 3
ICC 11408 0.00 72.60 0.0 75.0 75.0 0 4 4
ICC 11411 0.00 86.86 0.0 17.0 17.0 0 4 4
ICC 11412 0.34 86.27 0.0 17.5 17.5 0 9 9
ICC 11414 0.68 89.12 0.0 22.5 22.5 0 12 12
ICC 11416 0.00 97.24 0.0 34.5 34.5 0 11 11
ICC 11417 1.96 97.24 49.5 40.0 89.5 0 0 0
ICC 11418 0.00 96.94 0.0 17.0 17.0 0 6 6
ICC 11421 0.00 89.12 0.0 1.5 1.5 0 1 1
ICC 12382 2.65 92.32 5.5 0.5 6.0 0 0 0
ICC 12385 0.00 89.90 0.0 1.0 1.0 0 0 0
ICC 12386 1.51 88.95 0.0 11.0 11.0 0 6 6
ICC 12387 0.31 90.94 7.0 12.0 19.0 0 4 4
ICC 12388 0.00 92.84 0.0 26.0 26.0 0 12 12
ICC 12389 0.00 92.93 0.0 0.0 0.0 0 0 0
ICC 12390 0.21 95.12 2.5 3.5 6.0 0 1 1
ICC 12398 0.00 90.17 0.0 2.0 2.0 0 2 2
ICC 12400 2.91 90.47 0.5 5.0 5.5 0 2 2
ICC 12406 1.87 95.86 0.0 13.0 13.0 0 4 4
ICC 12407 0.27 90.32 4.0 0.5 4.5 0 0 0
ICC 12408 1.19 92.70 0.0 16.5 16.5 0 2 2
ICC 12410 0.00 95.11 0.0 19.5 19.5 0 2 2
ICC 12412 1.13 98.40 0.0 23.0 23.0 0 13 13
ICC 12413 0.38 94.75 0.0 38.0 38.0 0 3 3
continued
10 ICPN 10, 2003
ICC 12414 0.69 97.77 0.0 9.5 9.5 0 5 5ICC 12415 0.53 99.57 4.0 10.0 14.0 2 3 5ICC 12416 1.02 82.04 5.0 0.0 5.0 1 0 1ICC 12418 1.11 99.61 2.0 9.0 11.0 0 4 4ICC 12419 7.07 100.00 7.0 61.0 68.0 3 57 60ICCV 88501 2.57 96.34 69.5 20.0 89.5 36 3 39ICCV 88502 1.72 97.20 23.5 11.5 35.0 16 3 19ICCV 88503 1.95 92.93 32.0 5.0 37.0 6 3 9ICCV 88505 0.10 94.70 1.5 38.5 40.0 0 10 10ICCV 88506 1.74 98.07 7.5 7.5 15.0 1 3 4
CD (5%) 0.53
observations
20.36 0.74 4.78 - - -
1. Mean of nine
0.53
observations recorded in one f lower of the f irst plant and two f lowers of the second plant.
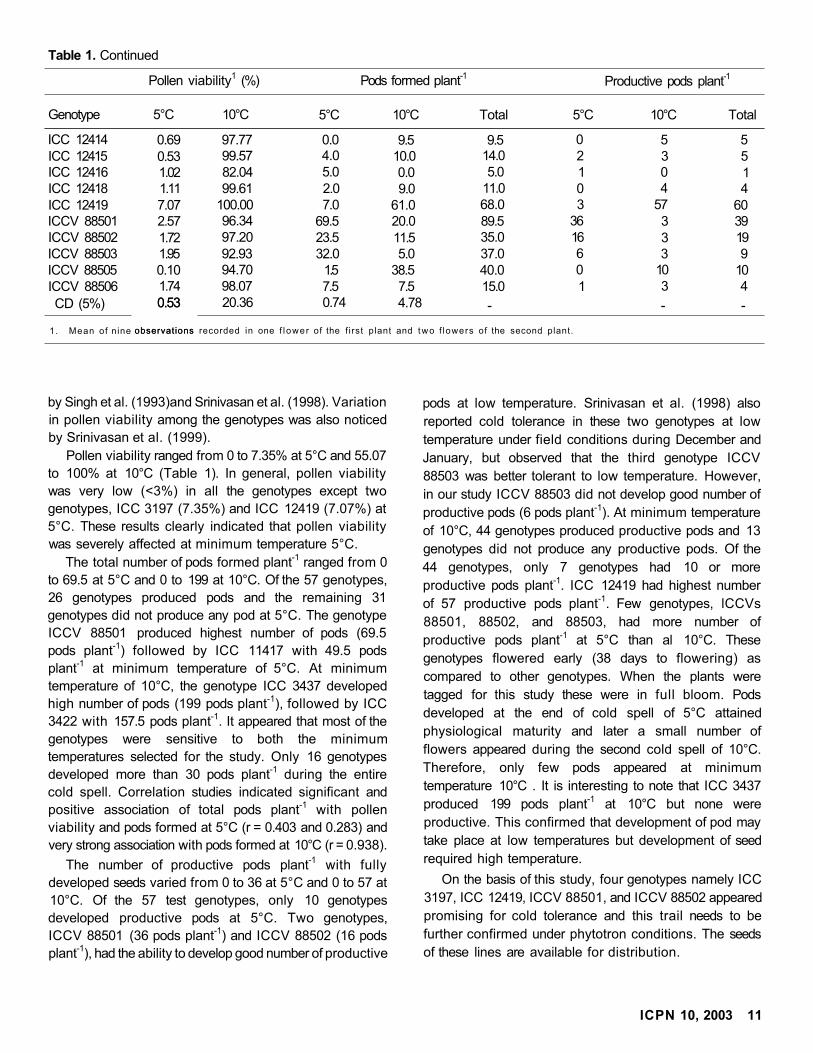
by Singh et al. (1993)and Srinivasan et al. (1998). Variation
in pollen viability among the genotypes was also noticed
by Srinivasan et al. (1999).
Pollen viability ranged from 0 to 7.35% at 5°C and 55.07
to 100% at 10°C (Table 1). In general, pollen viability
was very low (<3%) in all the genotypes except two
genotypes, ICC 3197 (7.35%) and ICC 12419 (7.07%) at
5°C. These results clearly indicated that pollen viability
was severely affected at minimum temperature 5°C.
The total number of pods formed plant-1 ranged from 0
to 69.5 at 5°C and 0 to 199 at 10°C. Of the 57 genotypes,
26 genotypes produced pods and the remaining 31
genotypes did not produce any pod at 5°C. The genotype
ICCV 88501 produced highest number of pods (69.5
pods plant-1) followed by ICC 11417 with 49.5 pods
plant-1 at minimum temperature of 5°C. At minimum
temperature of 10°C, the genotype ICC 3437 developed
high number of pods (199 pods plant-1), followed by ICC
3422 with 157.5 pods plant-1. It appeared that most of the
genotypes were sensitive to both the minimum
temperatures selected for the study. Only 16 genotypes
developed more than 30 pods plant-1 during the entire
cold spell. Correlation studies indicated significant and
positive association of total pods plant-1 with pollen
viability and pods formed at 5°C (r = 0.403 and 0.283) and
very strong association with pods formed at 10°C (r = 0.938).
The number of productive pods plant-1 with fully
developed seeds varied from 0 to 36 at 5°C and 0 to 57 at
10°C. Of the 57 test genotypes, only 10 genotypes
developed productive pods at 5°C. Two genotypes,
ICCV 88501 (36 pods plant-1) and ICCV 88502 (16 pods
plant-1), had the ability to develop good number of productive
pods at low temperature. Srinivasan et al. (1998) also
reported cold tolerance in these two genotypes at low
temperature under field conditions during December and
January, but observed that the third genotype ICCV
88503 was better tolerant to low temperature. However,
in our study ICCV 88503 did not develop good number of
productive pods (6 pods plant-1). At minimum temperature
of 10°C, 44 genotypes produced productive pods and 13
genotypes did not produce any productive pods. Of the
44 genotypes, only 7 genotypes had 10 or more
productive pods plant-1. ICC 12419 had highest number
of 57 productive pods plant-1. Few genotypes, lCCVs
88501, 88502, and 88503, had more number of
productive pods plant-1 at 5°C than al 10°C. These
genotypes flowered early (38 days to flowering) as
compared to other genotypes. When the plants were
tagged for this study these were in full bloom. Pods
developed at the end of cold spell of 5°C attained
physiological maturity and later a small number of
flowers appeared during the second cold spell of 10°C.
Therefore, only few pods appeared at minimum
temperature 10°C . It is interesting to note that ICC 3437
produced 199 pods plant-1 at 10°C but none were
productive. This confirmed that development of pod may
take place at low temperatures but development of seed
required high temperature.
On the basis of this study, four genotypes namely ICC
3197, ICC 12419, ICCV 88501, and ICCV 88502 appeared
promising for cold tolerance and this trail needs to be
further confirmed under phytotron conditions. The seeds
of these lines are available for distribution.
ICPN 10, 2003 11
Table 1. Continued
Pollen viability1 (%) Pods formed plant-1 Productive pods plant-1
Genotype 5°C 10°C 5°C 10°C Total 5°C 10°C Total
References
ICRISAT. 1988. Annual Report 1987. Patancheru 502 324,
Andhra Pradesh, India: ICRISAT. pp. 136-137.
Singh KB, Malhotra RS, and Saxena MC. 1993.
Relationship between cold screening and field loss in
chickpea (Cicer arientinum L.). Journal of Agronomy
170:121-127.
Srinivasan A, Johansen C, and Saxena NP. 1998. Cold
tolerance during early reproductive growth of chickpea
(Cicer arietinum L.). Characterization of stress and genetic-
variation in pod set. Field Crops Research 57:181-193.
Srinivasan A, Johansen C, and Saxena NP. 1999. Cold
tolerance during early reproductive growth in chickpea
(C. arientinum L.). Genetic variation in gamete development
and function. Field Crops Research 60:209-222.
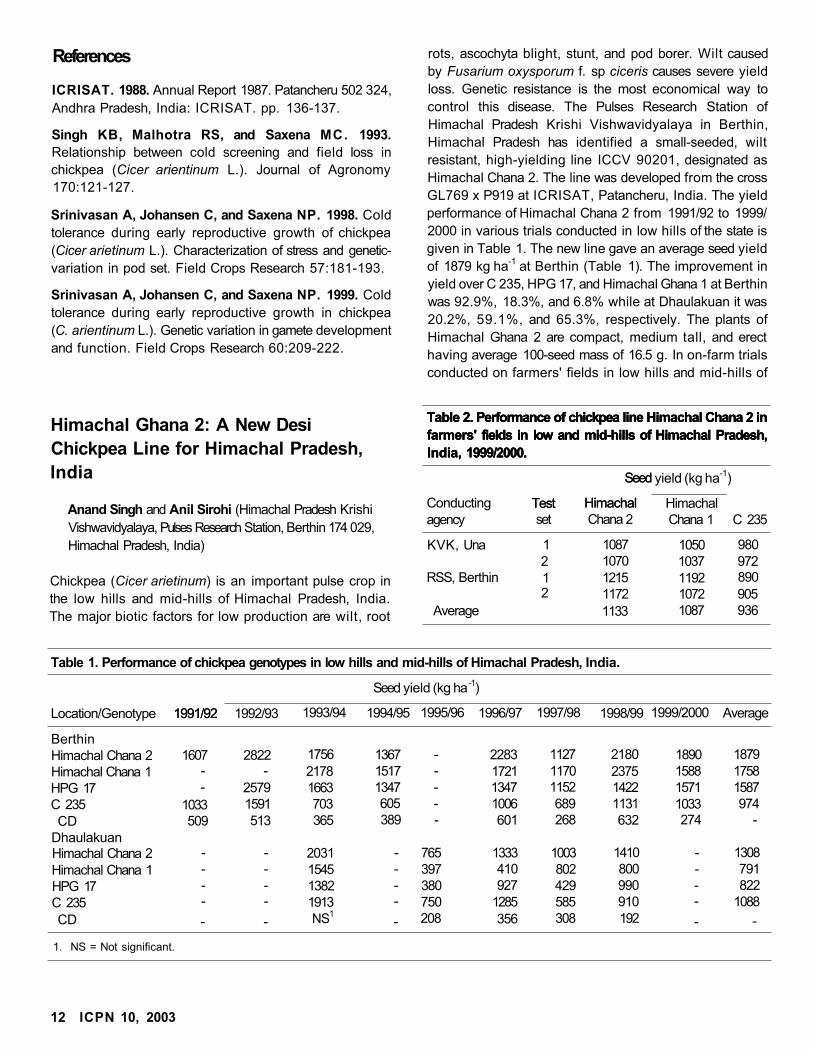
rots, ascochyta blight, stunt, and pod borer. Wilt caused
by Fusarium oxysporum f. sp ciceris causes severe yield
loss. Genetic resistance is the most economical way to
control this disease. The Pulses Research Station of
Himachal Pradesh Krishi Vishwavidyalaya in Berthin,
Himachal Pradesh has identified a small-seeded, wilt
resistant, high-yielding line ICCV 90201, designated as
Himachal Chana 2. The line was developed from the cross
GL769 x P919 at ICRISAT, Patancheru, India. The yield
performance of Himachal Chana 2 from 1991/92 to 1999/
2000 in various trials conducted in low hills of the state is
given in Table 1. The new line gave an average seed yield
of 1879 kg ha-1 at Berthin (Table 1). The improvement in
yield over C 235, HPG 17, and Himachal Ghana 1 at Berthin
was 92.9%, 18.3%, and 6.8% while at Dhaulakuan it was
20.2%, 59.1%, and 65.3%, respectively. The plants of
Himachal Ghana 2 are compact, medium tall, and erect
having average 100-seed mass of 16.5 g. In on-farm trials
conducted on farmers' fields in low hills and mid-hills of
Himachal Ghana 2: A New Desi
Chickpea Line for Himachal Pradesh,
India
Anand Singh and Anil Sirohi (Himachal Pradesh Krishi
Vishwavidyalaya, Pulses Research Station, Berthin 174 029,
Himachal Pradesh, India)
Chickpea (Cicer arietinum) is an important pulse crop in
the low hills and mid-hills of Himachal Pradesh, India.
The major biotic factors for low production are wilt, root
Table 2. Performance of chickpea line Himachal Chana 2 in
farmers' fields in low and mid-hills of Himachal Pradesh,
India, 1999/2000.
Table 2. Performance of chickpea line Himachal Chana 2 in
farmers' fields in low and mid-hills of Himachal Pradesh,
India, 1999/2000.
Table 2. Performance of chickpea line Himachal Chana 2 in
farmers' fields in low and mid-hills of Himachal Pradesh,
India, 1999/2000.
Test
Seed
Himachal
yield (kg ha-1)
Conducting Test
Seed
Himachal Himachalagency set Chana 2 Chana 1 C 235
KVK, Una 1 1087 1050 9802 1070 1037 972
RSS, Berthin 1 1215 1192 8902 1172 1072 905
Average 1133 1087 936
Table 1. Performance of chickpea genotypes in low hills and mid-hills of Himachal Pradesh, India.
1991/92
Seed yield (kg ha -1)
Location/Genotype 1991/92 1992/93 1993/94 1994/95 1995/96 1996/97 1997/98 1998/99 1999/2000 Average
BerthinHimachal Chana 2 1607 2822 1756 1367 - 2283 1127 2180 1890 1879
Himachal Chana 1 - - 2178 1517 - 1721 1170 2375 1588 1758
HPG 17 - 2579 1663 1347 - 1347 1152 1422 1571 1587
C 235 1033 1591 703 605 - 1006 689 1131 1033 974
CD 509 513 365 389 - 601 268 632 274 -
DhaulakuanHimachal Chana 2 - - 2031 - 765 1333 1003 1410 - 1308
Himachal Chana 1 - - 1545 - 397 410 802 800 - 791
HPG 17 - - 1382 - 380 927 429 990 - 822
C 235 - - 1913 - 750 1285 585 910 - 1088
CD - - NS1- 208 356 308 192 - -
1. NS = Not significant.
12 ICPN 10, 2003
the state, Himachal Chana 2 gave an average yield of
1133 kg ha-1 as against 1087 kg ha-1 in Himachal Ghana I
and 936 kg ha-1 in C 235 (Table 2). Himachal Chana 2
exhibited stable resistance to wilt (an average disease
score of 1.6 during 1990/91 to 1993/94) when screened
in wilt sick plots using the technique developed by Nene
et al. (1981). It showed resistance to wilt also at ICRISAT
in Patancheru, Jabalpur (Gupta 1995), and Hisar. In 1994,
the All India Coordinated Research Project recommended
Himachal Chana 2 as a donor for wilt resistance
(Anonymous 1994).
References
Anonymous. 1994. Proceedings and recommendations. Rabi
Pulses, Al l India Coordinated Pulses Improvement Project,
Rajasthan Agricultural University, Bikancr, Sept 15-18. 123 pp.
Gupta O. 1995. Identification of chickpea genotypes with dual
resistance against wilt and root rots. International Chickpea
and Pigeonpea Newsletter 2:27-28.
Nene YL, Haware MP, and Reddy MV. 1981. Chickpea diseases:
resistance-screening techniques. Information Bulletin no. 10.
Patancheru 502 324. Andhra Pradesh, India: ICRISAT. 10 pp.
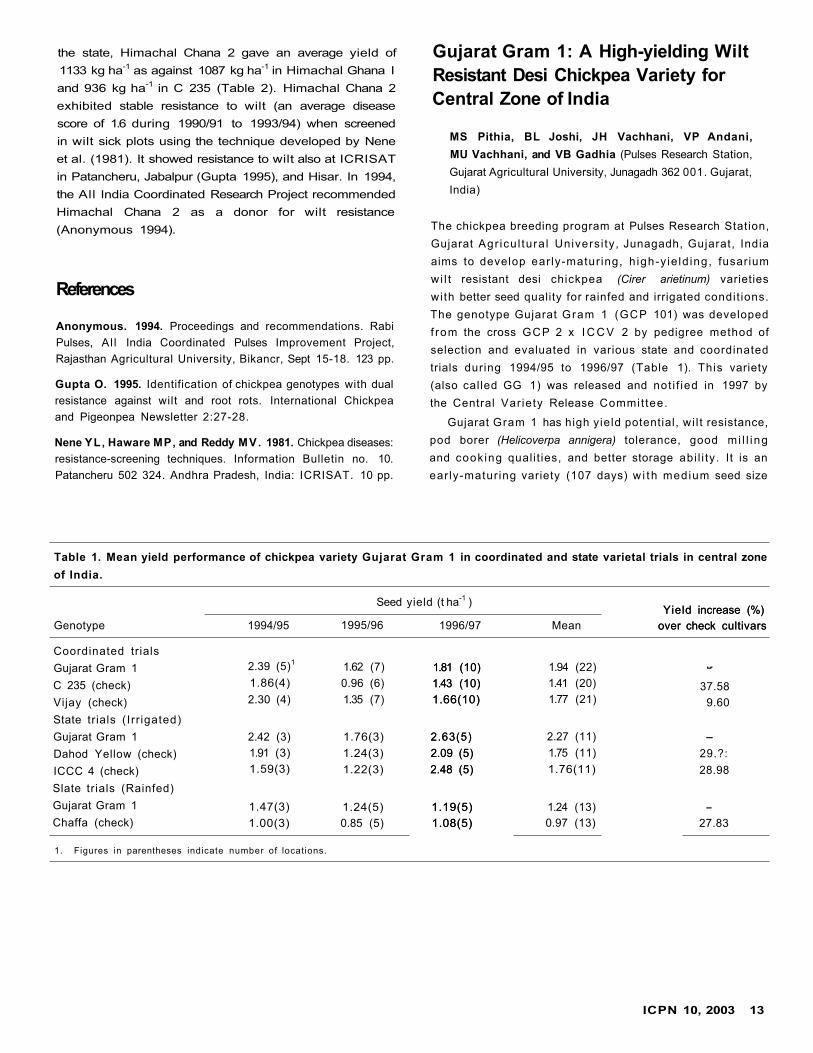
Gujarat Gram 1: A High-yielding Wilt
Resistant Desi Chickpea Variety for
Central Zone of India
MS Pithia, BL Joshi, JH Vachhani, VP Andani,
MU Vachhani, and VB Gadhia (Pulses Research Station,
Gujarat Agricultural University, Junagadh 362 001. Gujarat,
India)
The chickpea breeding program at Pulses Research Station,
Gujarat Agr icu l tura l Univers i ty, Junagadh, Gujarat, India
aims to develop ear ly-matur ing, h igh-y ie ld ing, fusarium
wi l t resistant desi chickpea (Cirer arietinum) varieties
with better seed quality for rainfed and irrigated condit ions.
The genotype Gujarat Gram 1 (GCP 101) was developed
f rom the cross GCP 2 x I C C V 2 by pedigree method of
selection and evaluated in various state and coordinated
trials during 1994/95 to 1996/97 (Table 1). This variety
(also called GG 1) was released and not i f ied in 1997 by
the Central Var iety Release Commit tee.
Gujarat Gram 1 has high yield potential, wi l t resistance,
pod borer (Helicoverpa annigera) tolerance, good mi l l i ng
and cooking quali t ies, and better storage abi l i ty. It is an
ear ly-matur ing variety (107 days) w i th medium seed size
Table 1. Mean yield performance of chickpea variety Gujarat Gram 1 in coordinated and state varietal trials in central zone
of India.
Seed yield (t ha-1 ) Yield increase (%)
over check cultivarsGenotype 1994/95 1995/96 1996/97 Mean
Yield increase (%)
over check cultivars
Coordinated trials
Gujarat Gram 1
C 235 (check)
Vijay (check)
State trials (Irr igated)
Gujarat Gram 1
Dahod Yellow (check)
ICCC 4 (check)
Slate trials (Rainfed)
Gujarat Gram 1
Chaffa (check)
2.39 (5)1
1.86(4)
2.30 (4)
2.42 (3)
1.91 (3)
1.59(3)
1.47(3)
1.00(3)
1.62 (7)
0.96 (6)
1.35 (7)
1.76(3)
1.24(3)
1.22(3)
1.24(5)
0.85 (5)
1.81 (10)
1.43 (10)
1.66(10)
2.63(5)
2.09 (5)
2.48 (5)
1.19(5)
1.08(5)
1.94 (22)
1.41 (20)
1.77 (21)
2.27 (11)
1.75 (11)
1.76(11)
1.24 (13)
0.97 (13)
37.58
9.60
29.?:
28.98
27.83
1. Figures in parentheses indicate number of locations.
1.81 (10)
1.43 (10)
1.66(10)
2.63(5)
2.09 (5)
2.48 (5)
1.19(5)
1.08(5)
ICPN 10, 2003 13
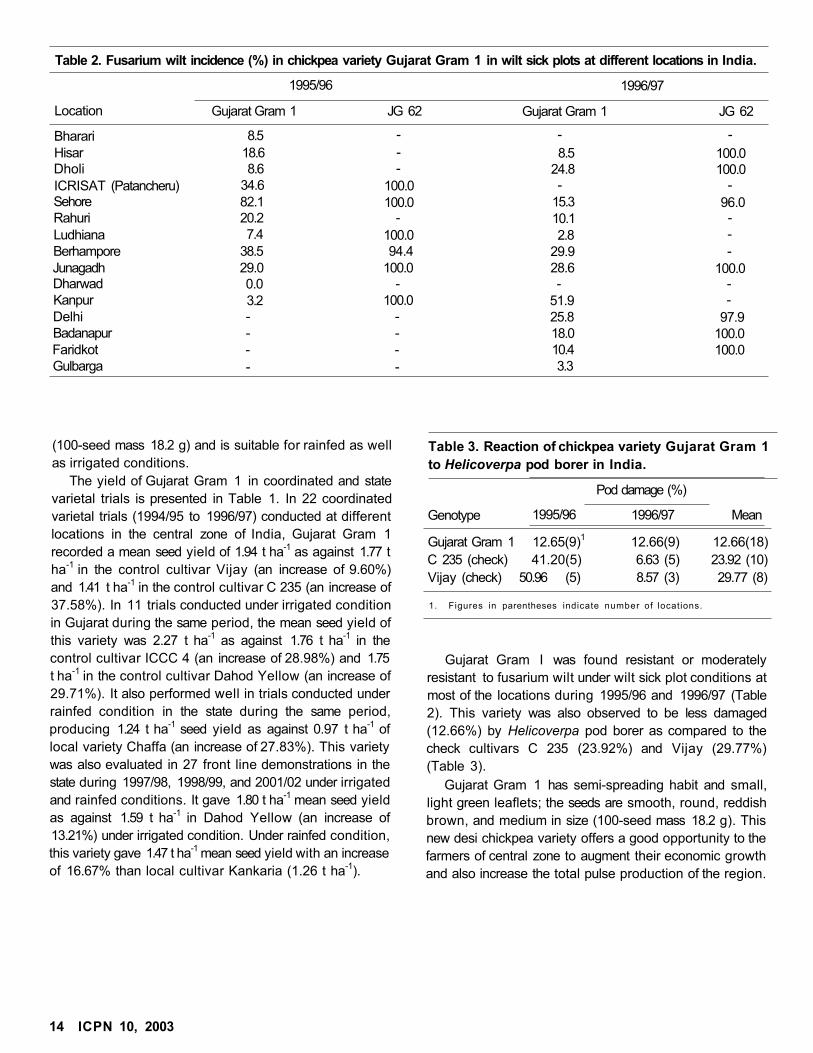
Table 2. Fusarium wilt incidence (%) in chickpea variety Gujarat Gram 1 in wilt sick plots at different locations in India.
1995/96 1996/97
Location Gujarat Gram 1 JG 62 Gujarat Gram 1 JG 62
Bharari 8.5 - - -
Hisar 18.6 - 8.5 100.0Dholi 8.6 - 24.8 100.0ICRISAT (Patancheru) 34.6 100.0 - -Sehore 82.1 100.0 15.3 96.0Rahuri 20.2 - 10.1 -
Ludhiana 7.4 100.0 2.8 -
Berhampore 38.5 94.4 29.9 -Junagadh 29.0 100.0 28.6 100.0Dharwad 0.0 - - -Kanpur 3.2 100.0 51.9 -
Delhi - - 25.8 97.9Badanapur - - 18.0 100.0Faridkot - - 10.4 100.0Gulbarga - - 3.3
(100-seed mass 18.2 g) and is suitable for rainfed as well
as irrigated conditions.
The yield of Gujarat Gram 1 in coordinated and state
varietal trials is presented in Table 1. In 22 coordinated
varietal trials (1994/95 to 1996/97) conducted at different
locations in the central zone of India, Gujarat Gram 1
recorded a mean seed yield of 1.94 t ha-1 as against 1.77 t
ha-1 in the control cultivar Vijay (an increase of 9.60%)
and 1.41 t ha-1 in the control cultivar C 235 (an increase of
37.58%). In 11 trials conducted under irrigated condition
in Gujarat during the same period, the mean seed yield of
this variety was 2.27 t ha-1 as against 1.76 t ha-1 in the
control cultivar ICCC 4 (an increase of 28.98%) and 1.75
t ha-1 in the control cultivar Dahod Yellow (an increase of
29.71%). It also performed well in trials conducted under
rainfed condition in the state during the same period,
producing 1.24 t ha-1 seed yield as against 0.97 t ha-1 of
local variety Chaffa (an increase of 27.83%). This variety
was also evaluated in 27 front line demonstrations in the
state during 1997/98, 1998/99, and 2001/02 under irrigated
and rainfed conditions. It gave 1.80 t ha-1 mean seed yield
as against 1.59 t ha-1 in Dahod Yellow (an increase of
13.21%) under irrigated condition. Under rainfed condition,
this variety gave 1.47 t ha-1 mean seed yield with an increase
of 16.67% than local cultivar Kankaria (1.26 t ha-1).
Gujarat Gram 1 12.65(9)1
C 235 (check) 41.20(5)
Vijay (check) 50.96 (5)
12.66(9)
6.63 (5)
8.57 (3)
12.66(18)
23.92 (10)
29.77 (8)
1. Figures in parentheses indicate number of locations.
Gujarat Gram I was found resistant or moderately
resistant to fusarium wilt under wilt sick plot conditions at
most of the locations during 1995/96 and 1996/97 (Table
2). This variety was also observed to be less damaged
(12.66%) by Helicoverpa pod borer as compared to the
check cultivars C 235 (23.92%) and Vijay (29.77%)
(Table 3).
Gujarat Gram 1 has semi-spreading habit and small,
light green leaflets; the seeds are smooth, round, reddish
brown, and medium in size (100-seed mass 18.2 g). This
new desi chickpea variety offers a good opportunity to the
farmers of central zone to augment their economic growth
and also increase the total pulse production of the region.
14 ICPN 10, 2003
Genotype
Pod damage (%)
1995/96 1996/97 Mean
Table 3. Reaction of chickpea variety Gujarat Gram 1
to Helicoverpa pod borer in India.
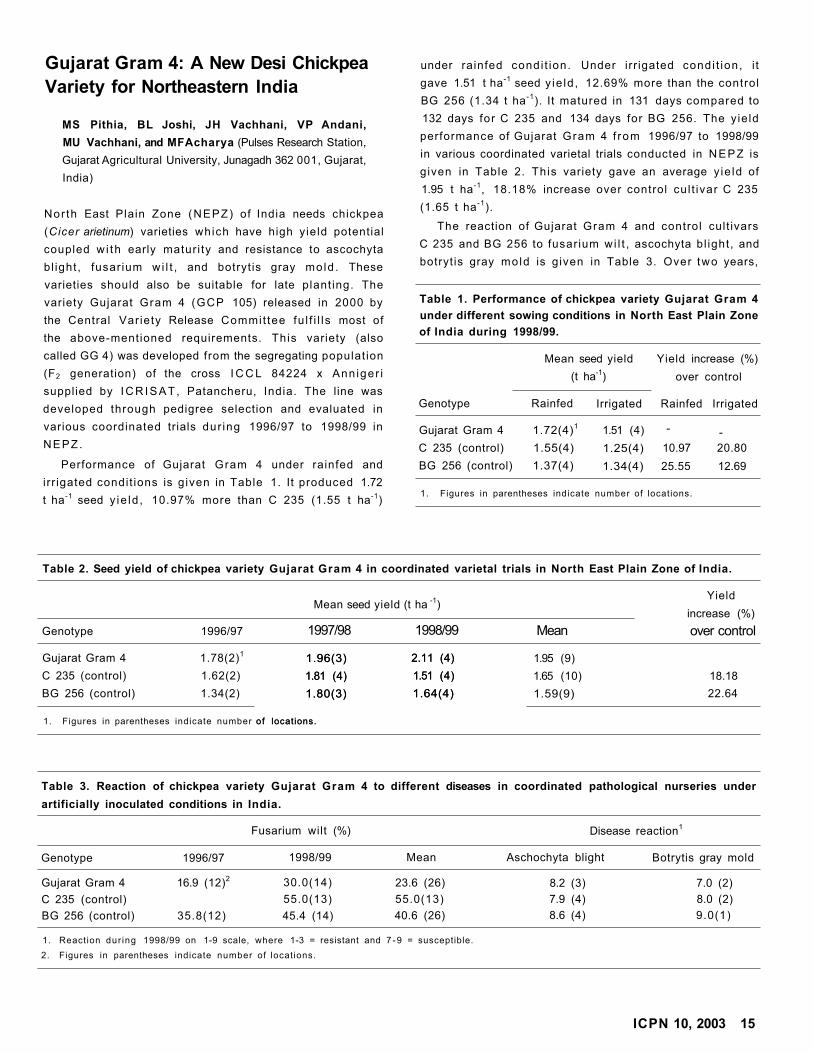
Gujarat Gram 4: A New Desi Chickpea
Variety for Northeastern India
MS Pithia, BL Joshi, JH Vachhani, VP Andani,
MU Vachhani, and MFAcharya (Pulses Research Station,
Gujarat Agricultural University, Junagadh 362 001, Gujarat,
India)
Nor th East Plain Zone (NEPZ) of India needs chickpea
(Cicer arietinum) varieties which have high yield potential
coupled w i th early matur i ty and resistance to ascochyta
bl ight , fusar ium w i l t , and botryt is gray mold . These
varieties should also be suitable for late plant ing. The
variety Gujarat Gram 4 (GCP 105) released in 2000 by
the Central Var iety Release Commit tee fu l f i l l s most of
the above-mentioned requirements. This variety (also
called GG 4) was developed from the segregating populat ion
(F2 generation) of the cross I C C L 84224 x Ann iger i
supplied by I C R I S A T , Patancheru, India. The line was
developed through pedigree selection and evaluated in
various coordinated trials dur ing 1996/97 to 1998/99 in
NEPZ.
Performance of Gujarat Gram 4 under rainfed and
irr igated condit ions is g iven in Table 1. It produced 1.72
t ha-1 seed y ie ld , 10.97% more than C 235 (1.55 t ha-1)
under rainfed condi t ion. Under irr igated condi t ion, i t
gave 1.51 t ha-1 seed y ie ld , 12.69% more than the control
BG 256 (1.34 t ha -1). It matured in 131 days compared to
132 days for C 235 and 134 days for BG 256. The y ie ld
performance of Gujarat Gram 4 f rom 1996/97 to 1998/99
in various coordinated varietal trials conducted in NEPZ is
given in Table 2. This variety gave an average y ie ld of
1.95 t ha-1, 18.18% increase over control cul t ivar C 235
(1.65 t ha -1).
The reaction of Gujarat Gram 4 and control cult ivars
C 235 and BG 256 to fusarium wi l t , ascochyta bl ight , and
botryt is gray mold is given in Table 3. Over two years,
Table 2. Seed yield of chickpea variety Gujarat Gram 4 in coordinated varietal trials in North East Plain Zone of India.
Mean seed yield (t ha -1)Yield
increase (%)
Genotype 1996/97 1997/98 1998/99 Mean over control
Gujarat Gram 4 1.78(2)1
C 235 (control) 1.62(2)
BG 256 (control) 1.34(2)
1.96(3)
1.81 (4)
1.80(3)
of locations.
2.11 (4)
1.51 (4)
1.64(4)
1.95 (9)
1.65 (10)
1.59(9)
18.18
22.64
1. Figures in parentheses indicate number
1.96(3)
1.81 (4)
1.80(3)
of locations.
2.11 (4)
1.51 (4)
1.64(4)
Table 3. Reaction of chickpea variety Gujarat Gram 4 to different diseases in coordinated pathological nurseries under
artificially inoculated conditions in India.
Fusarium wilt (%) Disease reaction1
Genotype 1996/97 1998/99 Mean Aschochyta blight Botrytis gray mold
Gujarat Gram 4 16.9 (12)2
C 235 (control)
BG 256 (control) 35.8(12)
30.0(14)
55.0(13)
45.4 (14)
23.6 (26)
55.0(13)
40.6 (26)
8.2 (3)
7.9 (4)
8.6 (4)
7.0 (2)
8.0 (2)
9.0(1)
1. Reaction dur ing 1998/99 on 1-9 scale, where 1-3 = resistant and 7 -9 = susceptible.
2. Figures in parentheses indicate number of locations.
ICPN 10, 2003 15
Table 1. Performance of chickpea variety Gujarat Gram 4
under different sowing conditions in North East Plain Zone
of India during 1998/99.
Mean seed yield
(t ha-1)
Yield increase (%)
over control
Genotype Rainfed Irrigated Rainfed Irrigated
Gujarat Gram 4
C 235 (control)
BG 256 (control)
1.72(4)1
1.55(4)
1.37(4)
1.51 (4)
1.25(4)
1.34(4)
10.97 20.80
25.55 12.69
1. Figures in parentheses indicate number of locations.
- -
the average incidence of wilt was 23.6% in Gujarat Gram
4 as compared to 55.0% and 40.6% in C 235 and BG 256,
respectively. The incidence of aschochyta blight in
Gujarat Gram 4 was slightly higher than C 235. But the
incidence of botrytis gray mold was lower than both the
control cultivars. The culinary and nutritional quality of
Gujarat Gram 4 is also good. The 100-seed mass of this
variety is 17.10 g. Seeds of Gujarat Gram 4 contain 23.18%
protein and 66.48% carbohydrate. The new variety offers
a better opportunity to the farmers of the NEPZ of India.
Annigeri in the High Barind Tract of
Bangladesh - Performance of a Chickpea
Variety Out of its Zone of Adaptation
M Yusuf Ali1, C Johansen
2, and Selim Ahmed
3
(1. On-Farm Research Division (OFRD), Bangladesh
Agricultural Research Institute (BARI), Joydebpur,
Gazipur. Bangladesh; 2. 2B, Palmdale, Plot 6, Road 104,
Gulshan-2. Dhaka 1212. Bangladesh; 3. OFRD-Barind,
BARI , Rajshahi, Bangladesh)
Annigeri is a long-standing chickpea (Cicer arietinum)
variety selected for the tropical zone of peninsular India
(ICRISAT 1992, Krishnamurthy et al. 1996, Kumar et al.
1996). It is still widely used as a local check in varietal
evaluations in peninsular India because of its consistently
high yields over locations and seasons. The High Barind
Tract (HBT) is situated in the northwest of Bangladesh,
in the subtropics. Here, the chickpea growing period is
considered to be longer because of the cooler and more
prolonged winter period of the subtropics. Thus medium-
or long-duration chickpea genotypes should be better
adapted rather than short-duration types evolved in
tropical regions with warm, short winters. However, in
the particular conditions of the HBT, the surface soil
dries quickly, and temperatures rise rapidly (to maximum
>30°C) from the end of February, forcing the crop to
terminal drought stress. Therefore, shorter duration
varieties than those normally grown in the subtropics may
have an advantage in this particular environment.
During the late 1990s, a study was conducted on
comparative rooting behavior of chickpea genotypes, for
their ability to acquire water and nutrients, across a range
of environments and soil conditions (Ali 2000). The
locations used were ICRISAT Center, in peninsular India,
and the HBT. Annigeri was included as a common control
variety in all experiments because it remained a dominating
variety in peninsular India and it was also thought as
possibly suitable for the shorter duration subtropical
environment of the HBT. Indeed, Annigeri outperformed
other test genotypes in the first year of the study in the
HBT, 1998/99. It was therefore tested against other
genotypes known to perform well in the HBT in subsequent
seasons and at several locations. This paper reports these
comparisons.
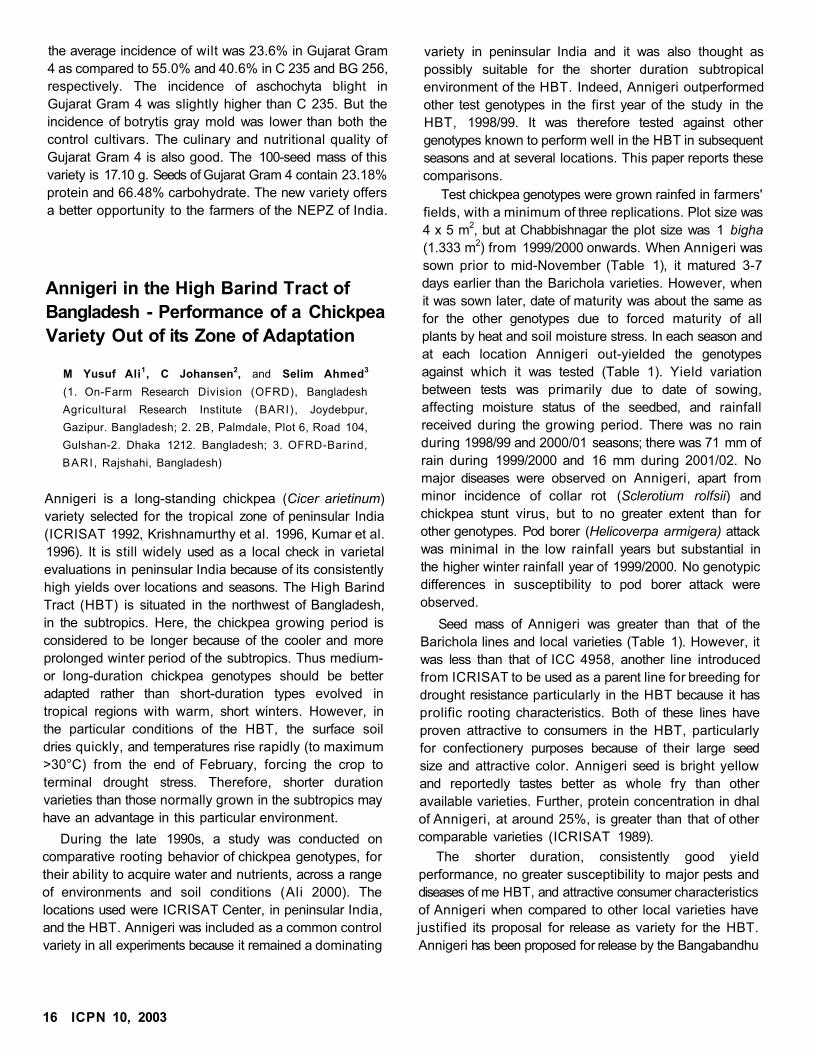
Test chickpea genotypes were grown rainfed in farmers'
fields, with a minimum of three replications. Plot size was
4 x 5 m2, but at Chabbishnagar the plot size was 1 bigha
(1.333 m2) from 1999/2000 onwards. When Annigeri was
sown prior to mid-November (Table 1), it matured 3-7
days earlier than the Barichola varieties. However, when
it was sown later, date of maturity was about the same as
for the other genotypes due to forced maturity of all
plants by heat and soil moisture stress. In each season and
at each location Annigeri out-yielded the genotypes
against which it was tested (Table 1). Yield variation
between tests was primarily due to date of sowing,
affecting moisture status of the seedbed, and rainfall
received during the growing period. There was no rain
during 1998/99 and 2000/01 seasons; there was 71 mm of
rain during 1999/2000 and 16 mm during 2001/02. No
major diseases were observed on Annigeri, apart from
minor incidence of collar rot (Sclerotium rolfsii) and
chickpea stunt virus, but to no greater extent than for
other genotypes. Pod borer (Helicoverpa armigera) attack
was minimal in the low rainfall years but substantial in
the higher winter rainfall year of 1999/2000. No genotypic
differences in susceptibility to pod borer attack were
observed.
Seed mass of Annigeri was greater than that of the
Barichola lines and local varieties (Table 1). However, it
was less than that of ICC 4958, another line introduced
from ICRISAT to be used as a parent line for breeding for
drought resistance particularly in the HBT because it has
prolific rooting characteristics. Both of these lines have
proven attractive to consumers in the HBT, particularly
for confectionery purposes because of their large seed
size and attractive color. Annigeri seed is bright yellow
and reportedly tastes better as whole fry than other
available varieties. Further, protein concentration in dhal
of Annigeri, at around 25%, is greater than that of other
comparable varieties (ICRISAT 1989).
The shorter duration, consistently good yield
performance, no greater susceptibility to major pests and
diseases of me HBT, and attractive consumer characteristics
of Annigeri when compared to other local varieties have
justified its proposal for release as variety for the HBT.
Annigeri has been proposed for release by the Bangabandhu
16 ICPN 10, 2003
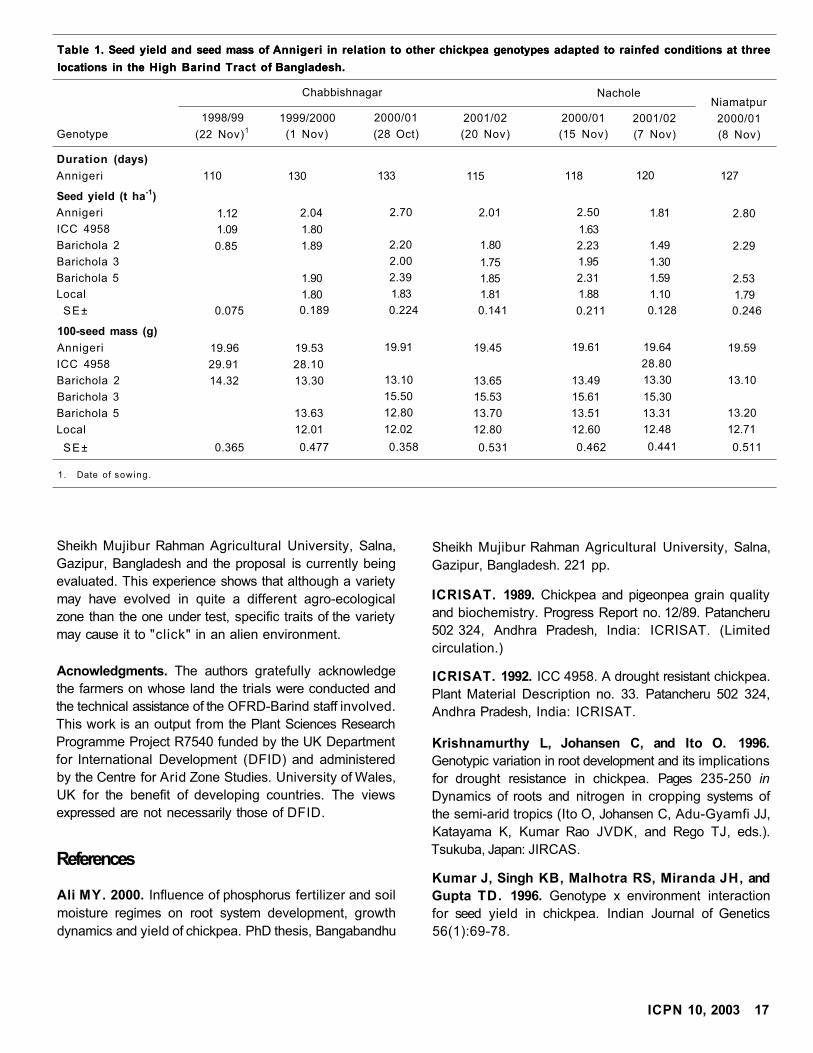
Table 1. Seed yield and seed mass of Annigeri in relation to other chickpea genotypes adapted to rainfed conditions at three
locations in the High Barind Tract of Bangladesh.
Table 1. Seed yield and seed mass of Annigeri in relation to other chickpea genotypes adapted to rainfed conditions at three
locations in the High Barind Tract of Bangladesh.
Chabbishnagar NacholeNiamatpur
1998/99 1999/2000 2000/01 2001/02 2000/01 2001/02 2000/01
Genotype (22 Nov)1 (1 Nov) (28 Oct) (20 Nov) (15 Nov) (7 Nov) (8 Nov)
Duration (days)
Annigeri 110 130 133 115 118 120 127
Seed yield (t ha-1
)
Annigeri 1.12 2.04 2.70 2.01 2.50 1.81 2.80
ICC 4958 1.09 1.80 1.63
Barichola 2 0.85 1.89 2.20 1.80 2.23 1.49 2.29
Barichola 3 2.00 1.75 1.95 1.30
Barichola 5 1.90 2.39 1.85 2.31 1.59 2.53
Local 1.80 1.83 1.81 1.88 1.10 1.79
SE± 0.075 0.189 0.224 0.141 0.211 0.128 0.246
100-seed mass (g)
Annigeri 19.96 19.53 19.91 19.45 19.61 19.64 19.59
ICC 4958 29.91 28.10 28.80
Barichola 2 14.32 13.30 13.10 13.65 13.49 13.30 13.10
Barichola 3 15.50 15.53 15.61 15.30
Barichola 5 13.63 12.80 13.70 13.51 13.31 13.20
Local 12.01 12.02 12.80 12.60 12.48 12.71
SE± 0.365 0.477 0.358 0.531 0.462 0.441 0.511
1. Date of sowing.
Sheikh Mujibur Rahman Agricultural University, Salna,
Gazipur, Bangladesh and the proposal is currently being
evaluated. This experience shows that although a variety
may have evolved in quite a different agro-ecological
zone than the one under test, specific traits of the variety
may cause it to "click" in an alien environment.
Acnowledgments. The authors gratefully acknowledge
the farmers on whose land the trials were conducted and
the technical assistance of the OFRD-Barind staff involved.
This work is an output from the Plant Sciences Research
Programme Project R7540 funded by the UK Department
for International Development (DFID) and administered
by the Centre for Arid Zone Studies. University of Wales,
UK for the benefit of developing countries. The views
expressed are not necessarily those of DFID.
References
Ali MY. 2000. Influence of phosphorus fertilizer and soil
moisture regimes on root system development, growth
dynamics and yield of chickpea. PhD thesis, Bangabandhu
Sheikh Mujibur Rahman Agricultural University, Salna,
Gazipur, Bangladesh. 221 pp.
ICRISAT. 1989. Chickpea and pigeonpea grain quality
and biochemistry. Progress Report no. 12/89. Patancheru
502 324, Andhra Pradesh, India: ICRISAT. (Limited
circulation.)
ICRISAT. 1992. ICC 4958. A drought resistant chickpea.
Plant Material Description no. 33. Patancheru 502 324,
Andhra Pradesh, India: ICRISAT.
Krishnamurthy L, Johansen C, and Ito O. 1996.
Genotypic variation in root development and its implications
for drought resistance in chickpea. Pages 235-250 in
Dynamics of roots and nitrogen in cropping systems of
the semi-arid tropics (Ito O, Johansen C, Adu-Gyamfi JJ,
Katayama K, Kumar Rao JVDK, and Rego TJ, eds.).
Tsukuba, Japan: JIRCAS.
Kumar J, Singh KB, Malhotra RS, Miranda JH, and
Gupta TD. 1996. Genotype x environment interaction
for seed yield in chickpea. Indian Journal of Genetics
56(1):69-78.
ICPN 10, 2003 17
Agronomy/Physiology
Priming of Chickpea Seeds with Water
and Mannitol Overcomes the Effect of
Salt Stress on Seedling Growth
Satvir Kaur, Anil K Gupta, and Narinder Kaur
(Department of Biochemistry and Chemistry, Punjab
Agricultural University, Ludhiana 141 004, Punjab, India)
Poor crop establishment due to drought, lack of irrigation
facilities, and salinity is a common problem in developing
countries. Fast emergence of seedlings usually leads to
healthier crops. In an earlier study, we had reported that
osmo-priming (with mannitol) and hydro-priming of
chickpea (Cicer arietinum) seeds for 24 h improved
seedling growth under water deficit stress in comparison
with non-primed control (Kaur et al. 2002b). The
beneficial role of priming was attributed to the alterations
in enzyme activities of carbohydrate metabolism in the
seedlings. Kaur et al. (2002a) reported that activities of
amylase, invertase (acid and alkaline), sucrose synthase
and sucrose phosphate synthase in shoots, sucrose
synthase and invertase in roots, and sucrose phosphate
synthase in cotyledons increased in primed stressed
seedlings as compared to non-primed stressed seedlings.
Chickpea seedlings raised in 4% mannitol and water
primed chickpea seeds showed better performance in
terms of yield as compared to non-primed seeds (Kaur et
al. 2002b). Harris et al. (1999) have also reported that
overnight priming of seeds with water promoted seedling
vigor, yield, and crop establishment of chickpea, maize
(Zea mays), and rice (Oryza sativa) in India. Similar
results have been reported with chickpea crop raised
from overnight water primed seeds in Bangladesh (Musa
et al. 1999). This study was planned to see if priming of
seeds with mannitol, water, sodium chloride (NaCl),
gibberellic acid (GA3), and potassium nitrate (KNO3)
could overcome the negative effect of salt stress on
seedling growth in chickpea. GA3 was primarily selected
because of its role in increased seedling growth under
NaCl imposed stress (Kaur et al. 1998).
Chickpea (PBG 1) seeds were washed with water,
surface sterilized with 0.1% mercuric chloride for 5 min
and again washed with water. The priming of seeds was
done with 50, 100, 150, 200, 500, and 1000 mM NaCl;
50, 100, 150, and 200 mM KNO3; 4% mannitol; 3 and 6
µM GA3;3 µM GA3 + 4% mannitol, and 6 µM GA3 + 4%
mannitol; and water. For priming, the washed chickpea
seeds were fully immersed in these solutions under
aseptic conditions for 24 h at 25°C. The seeds were then
washed with water and dried on a filter paper al 25°C.
The primed and non-primed seeds were germinated in
conical flasks at 25°C in dark on Murashige and Skoog
(1962) medium without sucrose. The salt stress was
created by including 75 mM NaCl in the medium. The
length and biomass of roots and shoots of each seedling
were recorded at 7 days after sowing.
In general it was observed that priming with water and
mannitol causes early emergence of germination under
salt stressed conditions. Priming with 4% mannitol and
water increased the length and biomass of roots and
shoots of salt stressed chickpea seedlings as compared to
non-primed controls (Table 1). Priming with 3 and 6 µM
GA3 alone and in combination with 4% mannitol did not
show any additional beneficial effect on seedling growth
Table 1. Effect of priming of chickpea seeds with 4% mannitol, water, and gibberellic acid (GA3) on growth of seedling under
salt stress at 7 days after sowing1.
Root growth seedling -1
Length
(cm)
Shoot growth seedling-1
Priming treatment
Length
(cm)
Fresh biomass
(mg)
Dry biomass
(mg)
Length
(cm)
Fresh biomass
(mg)
Dry biomass
(mg)
Control2 3.6 ± 0.36 44.5 ± 1.5 4.3 ± 0.23 1.9 ± 0.18 35.7 ± 0.9 3.6 ± 0.10
4% mannitol 8.5 ± 0.02 53.7 ± 4.3 5.1 ±0.35 3.8 ± 0.59 77.6 ± 7.6 7.8 ± 0.61
4% mannitol + 3 µM GA3 8.6 ± 0.69 58.3 ± 4.3 5.0 ± 0.29 3.3 ± 0.28 73.3 ± 4.8 7.4 ± 0.14
4% mannitol + 6 µM GA3 8.7 ± 0.79 69.7 ± 0.9 5.9 ± 0.30 3.5 ± 0.15 77.9 ± 2.7 7.3 ± 0.62
Water 7.1 ± 0.34 55.3 ± 3.3 5.4 ± 0.15 3.8 ± 0.26 88.1 ± 4.3 7.9 ± 0.45
3 µM GA3 7.5 ±0 .41 48.0 ± 2.0 4.8 ±0.15 3.6 ±0 .31 73.0 ± 4.4 7.3 ± 0.75
6 µM GA3 7.1 ±0.33 49.7 ± 3.9 4.8 ± 0.30 3.7 ± 0.08 73.1 ± 3 . 6 7.1 ±0.25
1. Data represent mean ± SD of 3 repl icat ions w i th 10 seedlings in each repl icat ion.
2. Non-pr imed seedlings g rown under salt (75 mM sodium chlor ide) stress.
18 ICPN 10, 2003
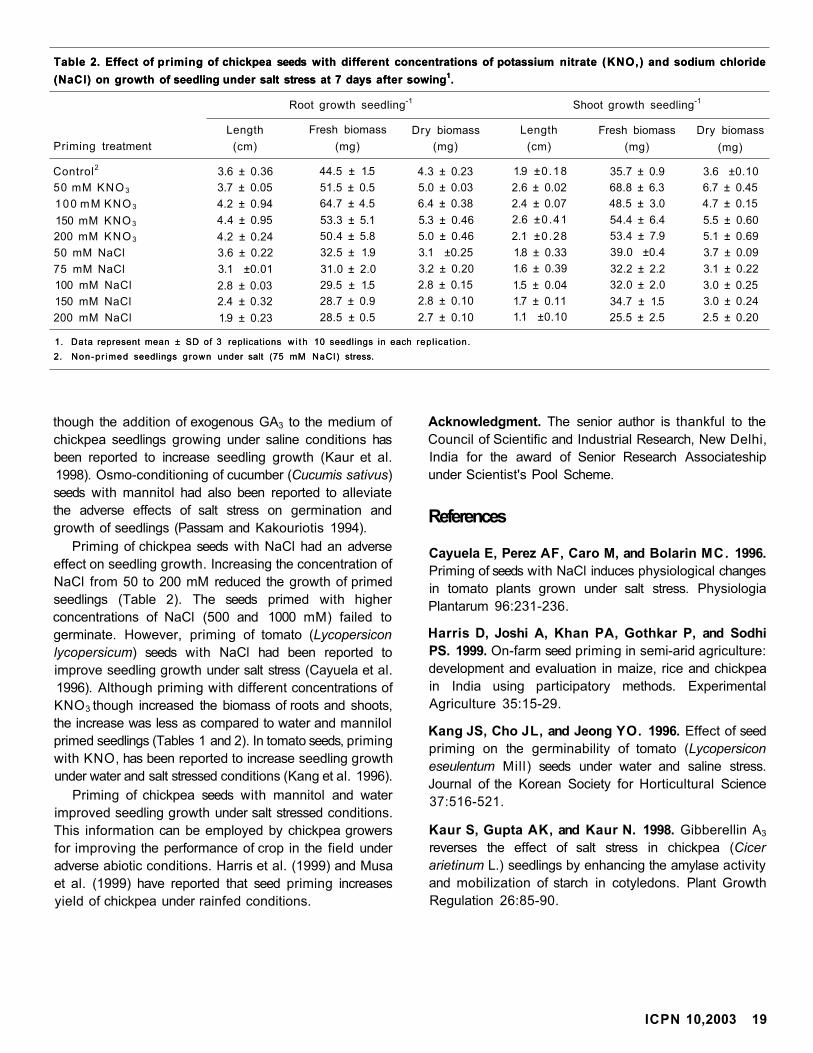
Table 2. Effect of priming of chickpea seeds with different concentrations of potassium nitrate (KNO,) and sodium chloride
(NaCl) on growth of seedling under salt stress at 7 days after sowing1.
Table 2. Effect of priming of chickpea seeds with different concentrations of potassium nitrate (KNO,) and sodium chloride
(NaCl) on growth of seedling under salt stress at 7 days after sowing1.
Root growth seedling-1 Shoot growth seedling-1
Length Fresh biomass Dry biomass Length Fresh biomass Dry biomass
Priming treatment (cm) (mg) (mg) (cm) (mg) (mg)
Control2 3.6 ± 0.36 44.5 ± 1.5 4.3 ± 0.23 1.9 ±0.18 35.7 ± 0.9 3.6 ±0.10
50 mM KNO 3 3.7 ± 0.05 51.5 ± 0.5 5.0 ± 0.03 2.6 ± 0.02 68.8 ± 6.3 6.7 ± 0.45
100 mM KNO 3 4.2 ± 0.94 64.7 ± 4.5 6.4 ± 0.38 2.4 ± 0.07 48.5 ± 3.0 4.7 ± 0.15
150 mM KNO 3 4.4 ± 0.95 53.3 ± 5.1 5.3 ± 0.46 2.6 ±0.41 54.4 ± 6.4 5.5 ± 0.60
200 mM KNO 3 4.2 ± 0.24 50.4 ± 5.8 5.0 ± 0.46 2.1 ±0.28 53.4 ± 7.9 5.1 ± 0.69
50 mM NaCl 3.6 ± 0.22 32.5 ± 1.9 3.1 ±0.25 1.8 ± 0.33 39.0 ±0.4 3.7 ± 0.09
75 mM NaCl 3.1 ±0.01 31.0 ± 2.0 3.2 ± 0.20 1.6 ± 0.39 32.2 ± 2.2 3.1 ± 0.22
100 mM NaCl 2.8 ± 0.03 29.5 ± 1.5 2.8 ± 0.15 1.5 ± 0.04 32.0 ± 2.0 3.0 ± 0.25
150 mM NaCl 2.4 ± 0.32 28.7 ± 0.9 2.8 ± 0.10 1.7 ± 0.11 34.7 ± 1.5 3.0 ± 0.24
200 mM NaCl 1.9 ± 0.23 28.5 ± 0.5 2.7 ± 0.10 1.1 ±0.10 25.5 ± 2.5 2.5 ± 0.20
1. Data represent mean ± SD of 3 replications w i t h 10 seedlings in each repl icat ion.
2. Non-pr imed seedlings grown under salt (75 mM NaCl) stress.
1. Data represent mean ± SD of 3 replications w i t h 10 seedlings in each repl icat ion.
2. Non-pr imed seedlings grown under salt (75 mM NaCl) stress.
though the addition of exogenous GA3 to the medium of
chickpea seedlings growing under saline conditions has
been reported to increase seedling growth (Kaur et al.
1998). Osmo-conditioning of cucumber (Cucumis sativus)
seeds with mannitol had also been reported to alleviate
the adverse effects of salt stress on germination and
growth of seedlings (Passam and Kakouriotis 1994).
Priming of chickpea seeds with NaCl had an adverse
effect on seedling growth. Increasing the concentration of
NaCl from 50 to 200 mM reduced the growth of primed
seedlings (Table 2). The seeds primed with higher
concentrations of NaCl (500 and 1000 mM) failed to
germinate. However, priming of tomato (Lycopersicon
lycopersicum) seeds with NaCl had been reported to
improve seedling growth under salt stress (Cayuela et al.
1996). Although priming with different concentrations of
KNO3 though increased the biomass of roots and shoots,
the increase was less as compared to water and mannilol
primed seedlings (Tables 1 and 2). In tomato seeds, priming
with KNO, has been reported to increase seedling growth
under water and salt stressed conditions (Kang et al. 1996).
Priming of chickpea seeds with mannitol and water
improved seedling growth under salt stressed conditions.
This information can be employed by chickpea growers
for improving the performance of crop in the field under
adverse abiotic conditions. Harris et al. (1999) and Musa
et al. (1999) have reported that seed priming increases
yield of chickpea under rainfed conditions.
Acknowledgment. The senior author is thankful to the
Council of Scientific and Industrial Research, New Delhi,
India for the award of Senior Research Associateship
under Scientist's Pool Scheme.
References
Cayuela E, Perez AF, Caro M, and Bolarin MC. 1996.
Priming of seeds with NaCl induces physiological changes
in tomato plants grown under salt stress. Physiologia
Plantarum 96:231-236.
Harris D, Joshi A, Khan PA, Gothkar P, and Sodhi
PS. 1999. On-farm seed priming in semi-arid agriculture:
development and evaluation in maize, rice and chickpea
in India using participatory methods. Experimental
Agriculture 35:15-29.
Kang JS, Cho JL, and Jeong YO. 1996. Effect of seed
priming on the germinability of tomato (Lycopersicon
eseulentum Mill) seeds under water and saline stress.
Journal of the Korean Society for Horticultural Science
37:516-521.
Kaur S, Gupta AK, and Kaur N. 1998. Gibberellin A3
reverses the effect of salt stress in chickpea (Cicer
arietinum L.) seedlings by enhancing the amylase activity
and mobilization of starch in cotyledons. Plant Growth
Regulation 26:85-90.
ICPN 10,2003 19
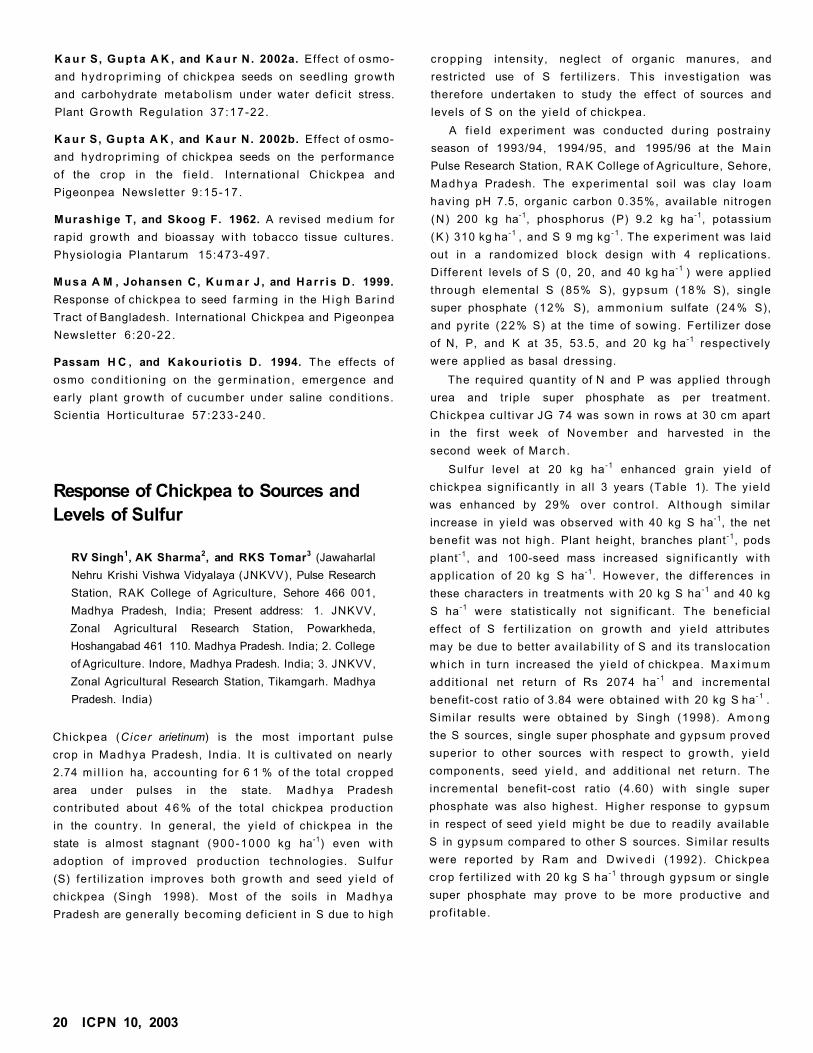
K a u r S, Gupta A K , and K a u r N. 2002a. Effect o f osmo-
and hydropr iming of chickpea seeds on seedling growth
and carbohydrate metabol ism under water def ic i t stress.
Plant Growth Regulat ion 37 :17-22 .
K a u r S, Gupta A K , and K a u r N. 2002b. Effect o f osmo-
and hydropr iming of chickpea seeds on the performance
of the crop in the f ie ld . International Chickpea and
Pigeonpea Newsletter 9 :15-17.
Murashige T, and Skoog F. 1962. A revised medium for
rapid growth and bioassay w i th tobacco tissue cultures.
Physiologia Plantarum 15:473-497.
Musa A M , Johansen C, K u m a r J , and Har r is D . 1999.
Response of chickpea to seed farming in the H i g h Bar ind
Tract of Bangladesh. International Chickpea and Pigeonpea
Newsletter 6 :20-22.
Passam H C , and Kakouriot is D. 1994. The effects of
osmo cond i t ion ing on the germinat ion , emergence and
early plant g rowth of cucumber under saline condit ions.
Scientia Hort icul turae 57:233-240.
Response of Chickpea to Sources and
Levels of Sulfur
RV Singh1, AK Sharma
2, and RKS Tomar
3 (Jawaharlal
Nehru Krishi Vishwa Vidyalaya (JNKVV), Pulse Research
Station, RAK College of Agriculture, Sehore 466 001,
Madhya Pradesh, India; Present address: 1. JNKVV,
Zonal Agricultural Research Station, Powarkheda,
Hoshangabad 461 110. Madhya Pradesh. India; 2. College
of Agriculture. Indore, Madhya Pradesh. India; 3. JNKVV,
Zonal Agricultural Research Station, Tikamgarh. Madhya
Pradesh. India)
Chickpea (Cicer arietinum) is the most important pulse
crop in Madhya Pradesh, India. It is cul t ivated on nearly
2.74 m i l l i on ha, accounting for 6 1 % of the total cropped
area under pulses in the state. Madhya Pradesh
contr ibuted about 4 6 % of the total chickpea product ion
in the country. In general, the y ie ld of chickpea in the
state is almost stagnant (900-1000 kg ha-1) even w i th
adoption of improved product ion technologies. Sul fur
(S) fer t i l izat ion improves both growth and seed y ie ld of
chickpea (Singh 1998). Most of the soils in Madhya
Pradesh are generally becoming def icient in S due to h igh
cropping intensity, neglect of organic manures, and
restricted use of S fert i l izers. This invest igat ion was
therefore undertaken to study the effect of sources and
levels of S on the y ie ld of chickpea.
A f ie ld experiment was conducted dur ing postrainy
season of 1993/94, 1994/95, and 1995/96 at the Ma in
Pulse Research Station, R A K College of Agriculture, Sehore,
Madhya Pradesh. The experimental soil was clay loam
having pH 7.5, organic carbon 0.35%, available nitrogen
(N) 200 kg ha-1, phosphorus (P) 9.2 kg ha-1, potassium
(K) 310 kg ha -1 , and S 9 mg kg - 1 . The experiment was laid
out in a randomized block design w i th 4 replications.
Dif ferent levels of S (0, 20, and 40 kg ha -1 ) were appl ied
through elemental S (85% S), gypsum (18% S), single
super phosphate (12% S), ammon ium sulfate (24% S),
and pyr i te ( 22% S) at the t ime of sowing. Fert i l izer dose
of N, P, and K at 35, 53.5, and 20 kg ha -1 respectively
were applied as basal dressing.
The required quanti ty of N and P was applied through
urea and tr iple super phosphate as per treatment.
Chickpea cul t ivar JG 74 was sown in rows at 30 cm apart
in the f i rst week of November and harvested in the
second week of March .
Sulfur level at 20 kg ha -1 enhanced grain y ie ld of
chickpea signi f icant ly in all 3 years (Table 1). The y ie ld
was enhanced by 29% over contro l . A l though simi lar
increase in y ie ld was observed w i th 40 kg S ha-1, the net
benefi t was not h igh. Plant height, branches plant -1, pods
plant -1, and 100-seed mass increased signi f icant ly w i th
appl icat ion of 20 kg S ha-1. However , the differences in
these characters in treatments w i th 20 kg S ha -1 and 40 kg
S ha -1 were statistically not signif icant. The beneficial
effect of S fer t i l izat ion on growth and y ie ld attributes
may be due to better avai labi l i ty of S and its translocation
wh ich in turn increased the y ie ld of chickpea. M a x i m u m
addit ional net return of Rs 2074 ha -1 and incremental
benefit-cost rat io of 3.84 were obtained w i th 20 kg S ha -1 .
S imi lar results were obtained by Singh (1998). A m o n g
the S sources, single super phosphate and gypsum proved
superior to other sources w i th respect to g rowth , y ie ld
components, seed y ie ld , and addit ional net return. The
incremental benefit-cost ratio (4.60) w i th single super
phosphate was also highest. Higher response to gypsum
in respect of seed y ie ld might be due to readily available
S in gypsum compared to other S sources. Simi lar results
were reported by Ram and Dw ived i (1992). Chickpea
crop fert i l ized w i th 20 kg S ha -1 through gypsum or single
super phosphate may prove to be more product ive and
prof i table.
20 ICPN 10, 2003
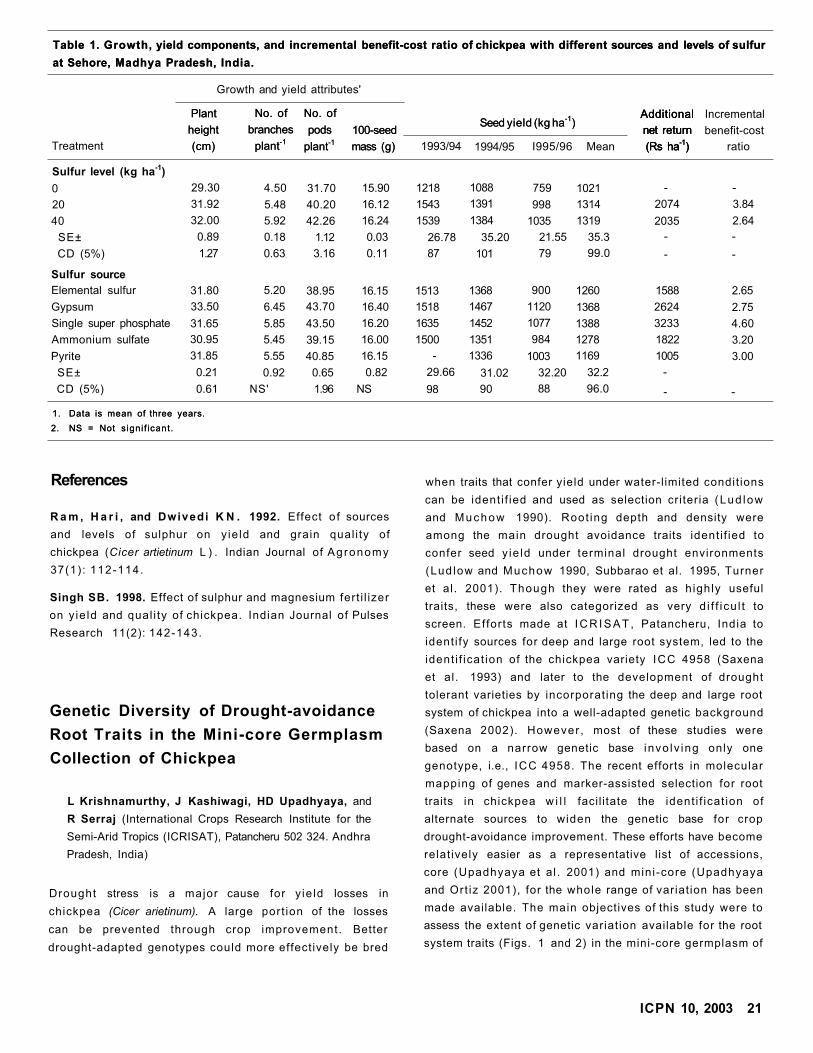
Table 1. Growth, yield components, and incremental benefit-cost ratio of chickpea with different sources and levels of sulfur
at Sehore, Madhya Pradesh, India.
Table 1. Growth, yield components, and incremental benefit-cost ratio of chickpea with different sources and levels of sulfur
at Sehore, Madhya Pradesh, India.
Growth and yield attributes'
Seed yield (kg ha-1)Additional
net return
(Rs ha-1)
Plant
height
(cm)
No. of
branches
plant-1
No. of
pods
plant-1100-seed
mass (g)
Seed yield (kg ha-1)Additional
net return
(Rs ha-1)
Incremental
benefit-cost
Treatment
Plant
height
(cm)
No. of
branches
plant-1
No. of
pods
plant-1100-seed
mass (g) 1993/94 1994/95 I995/96 Mean
Additional
net return
(Rs ha-1) ratio
Sulfur level (kg ha-1
)
0 29.30 4.50 31.70 15.90 1218 1088 759 1021 - -
20 31.92 5.48 40.20 16.12 1543 1391 998 1314 2074 3.84
40 32.00 5.92 42.26 16.24 1539 1384 1035 1319 2035 2.64
SE± 0.89 0.18 1.12 0.03 26.78 35.20 21.55 35.3 - -
CD (5%) 1.27 0.63 3.16 0.11 87 101 79 99.0 - -
Sulfur source
Elemental sulfur 31.80 5.20 38.95 16.15 1513 1368 900 1260 1588 2.65
Gypsum 33.50 6.45 43.70 16.40 1518 1467 1120 1368 2624 2.75
Single super phosphate 31.65 5.85 43.50 16.20 1635 1452 1077 1388 3233 4.60
Ammonium sulfate 30.95 5.45 39.15 16.00 1500 1351 984 1278 1822 3.20
Pyrite 31.85 5.55 40.85 16.15 - 1336 1003 1169 1005 3.00
SE± 0.21 0.92 0.65 0.82 29.66 31.02 32.20 32.2 -
CD (5%) 0.61 NS' 1.96 NS 98 90 88 96.0 - -
1. Data is mean of three years.
2. NS = Not signif icant.
1. Data is mean of three years.
2. NS = Not signif icant.
References
R a m , H a r i , and Dwivedi K N . 1992. Effect o f sources
and levels of sulphur on y ie ld and grain qual i ty of
chickpea (Cicer artietinum L ) . Indian Journal of Agronomy
37(1): 112-114.
Singh SB. 1998. Effect of sulphur and magnesium fert i l izer
on y ie ld and qual i ty of chickpea. Indian Journal of Pulses
Research 11(2): 142-143.
Genetic Diversity of Drought-avoidance
Root Traits in the Mini-core Germplasm
Collection of Chickpea
L Krishnamurthy, J Kashiwagi, HD Upadhyaya, and
R Serraj (International Crops Research Institute for the
Semi-Arid Tropics (ICRISAT), Patancheru 502 324. Andhra
Pradesh, India)
Drought stress is a major cause for y ie ld losses in
chickpea (Cicer arietinum). A large port ion of the losses
can be prevented through crop improvement. Better
drought-adapted genotypes could more effectively be bred
when traits that confer yield under water-l imited condit ions
can be ident i f ied and used as selection criteria (Lud low
and Muchow 1990). Root ing depth and density were
among the main drought avoidance traits ident i f ied to
confer seed y ie ld under terminal drought environments
(Lud low and Muchow 1990, Subbarao et al. 1995, Turner
et al. 2001). Though they were rated as highly useful
traits, these were also categorized as very d i f f i cu l t to
screen. Efforts made at I C R I S A T , Patancheru, India to
ident i fy sources for deep and large root system, led to the
ident i f icat ion of the chickpea variety ICC 4958 (Saxena
et al. 1993) and later to the development of drought
tolerant varieties by incorporat ing the deep and large root
system of chickpea into a well-adapted genetic background
(Saxena 2002). However , most of these studies were
based on a narrow genetic base invo lv ing only one
genotype, i.e., ICC 4958. The recent efforts in molecular
mapping of genes and marker-assisted selection for root
traits in chickpea w i l l facil i tate the ident i f icat ion of
alternate sources to widen the genetic base for crop
drought-avoidance improvement. These efforts have become
relat ively easier as a representative list of accessions,
core (Upadhyaya et al . 2001) and mini-core (Upadhyaya
and Ort iz 2001), for the whole range of variat ion has been
made available. The main objectives of this study were to
assess the extent of genetic variat ion available for the root
system traits (Figs. 1 and 2) in the mini-core germplasm of
ICPN 10, 2003 21
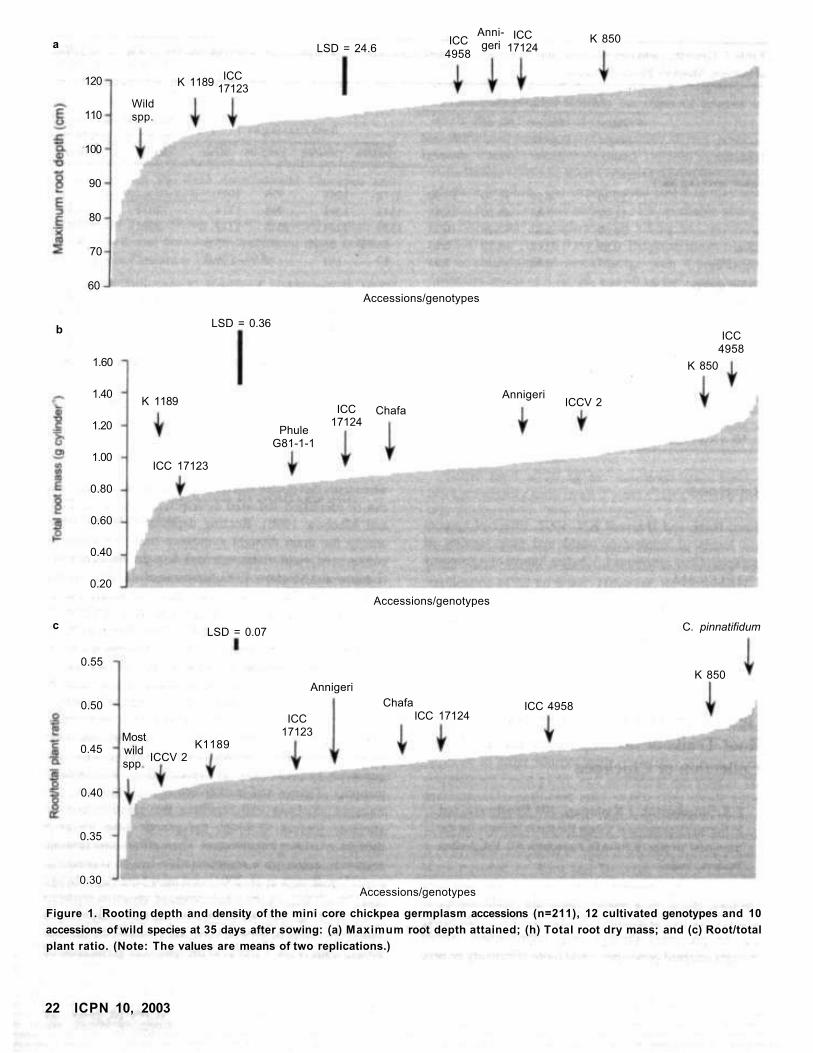
22 ICPN 10, 2003
Figure 1. Rooting depth and density of the mini core chickpea germplasm accessions (n=211), 12 cultivated genotypes and 10
accessions of wild species at 35 days after sowing: (a) Maximum root depth attained; (h) Total root dry mass; and (c) Root/total
plant ratio. (Note: The values are means of two replications.)
Accessions/genotypes
0.55
0.50
0.45
0.40
0.35
0.30
Mostwildspp
ICCV 2 K1189
ICC17123
Annigeri
ChafaICC 17124
ICC 4958
K 850
C. pinnatifidum LSD = 0.07c
Accessions/genotypes
1.60
1.40
1.20
1.00
0.80
0.60
0.40
0.20
K 1189
ICC 17123
PhuleG81-1-1
ICC17124
Chafa
AnnigeriICCV 2
bLSD = 0.36
K 850
ICC4958
Accessions/genotypes
120
110
100
90
80
70
60
Wildspp.
K 1189ICC
17123
LSD = 24.6ICC
4958
Anni-geri
ICC17124
K 850a
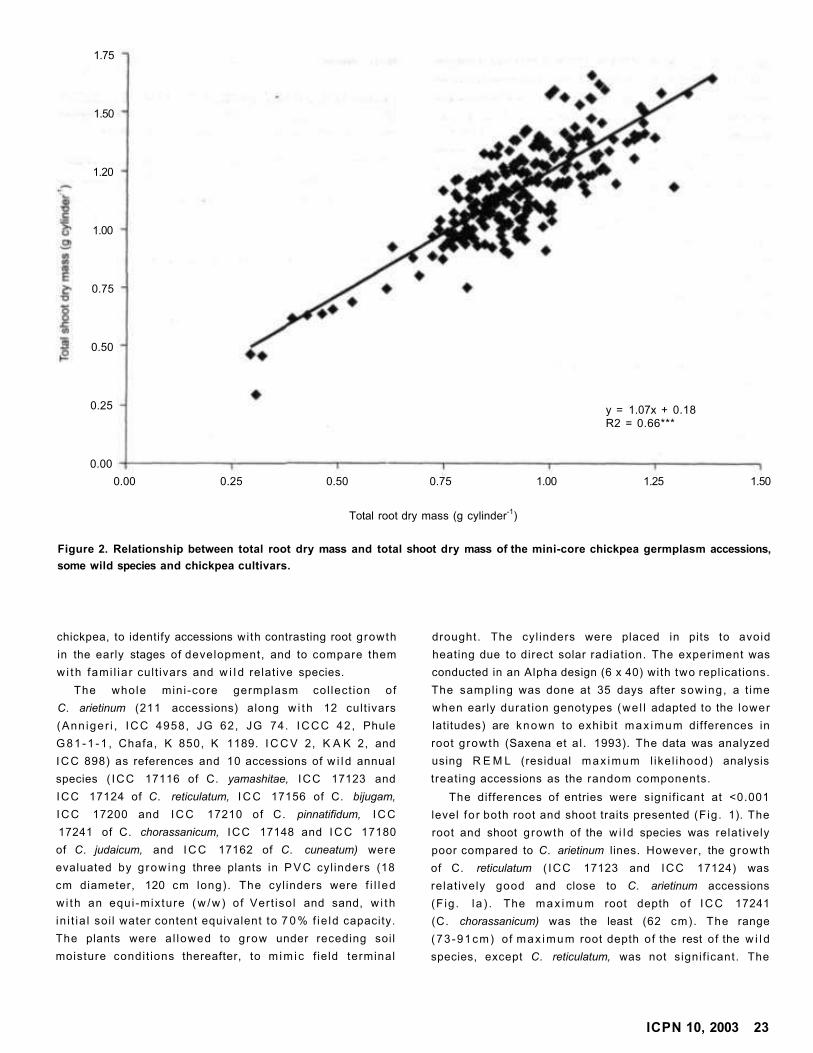
chickpea, to identify accessions with contrasting root growth
in the early stages of development, and to compare them
wi th fami l iar cult ivars and w i l d relat ive species.
The whole mini-core germplasm col lect ion of
C. arietinum (211 accessions) along w i th 12 cult ivars
(Ann iger i , ICC 4958, JG 62, JG 74. ICCC 42, Phule
G 8 1 - 1 - 1 , Chafa, K 850, K 1189. I C C V 2, K A K 2, and
ICC 898) as references and 10 accessions of w i l d annual
species ( ICC 17116 of C. yamashitae, ICC 17123 and
ICC 17124 of C. reticulatum, I C C 17156 of C. bijugam,
ICC 17200 and I C C 17210 of C. pinnatifidum, I C C
17241 of C. chorassanicum, ICC 17148 and I C C 17180
of C. judaicum, and I C C 17162 of C. cuneatum) were
evaluated by g row ing three plants in P V C cyl inders (18
cm diameter, 120 cm long). The cyl inders were f i l l ed
w i th an equi -mixture ( w / w ) of Vert isol and sand, w i th
in i t ia l soi l water content equivalent to 7 0 % f ie ld capacity.
The plants were a l lowed to grow under receding soil
moisture condit ions thereafter, to m im ic f ield terminal
drought. The cyl inders were placed in pits to avoid
heating due to direct solar radiat ion. The experiment was
conducted in an Alpha design (6 x 40) with two replications.
The sampl ing was done at 35 days after sowing, a t ime
when early durat ion genotypes (we l l adapted to the lower
latitudes) are known to exhibi t max imum differences in
root growth (Saxena et al . 1993). The data was analyzed
using R E M L (residual max imum l ikel ihood) analysis
treating accessions as the random components.
The differences of entries were signif icant at <0.001
level fo r both root and shoot traits presented (F ig. 1). The
root and shoot growth of the w i l d species was relat ively
poor compared to C. arietinum lines. However, the growth
of C. reticulatum ( ICC 17123 and ICC 17124) was
relat ively good and close to C. arietinum accessions
(F ig . l a ) . The max imum root depth of I C C 17241
(C. chorassanicum) was the least (62 cm). The range
(73-91cm) of max imum root depth of the rest of the w i l d
species, except C. reticulatum, was not signif icant. The
ICPN 10, 2003 23
Figure 2. Relationship between total root dry mass and total shoot dry mass of the mini-core chickpea germplasm accessions,
some wild species and chickpea cultivars.
Total root dry mass (g cylinder-1)
0.00 0.25 0.50 0.75 1.00 1.25 1.50
1.75
1.50
1.20
1.00
0.75
0.50
0.25
0.00
y = 1.07x + 0.18R2 = 0.66***
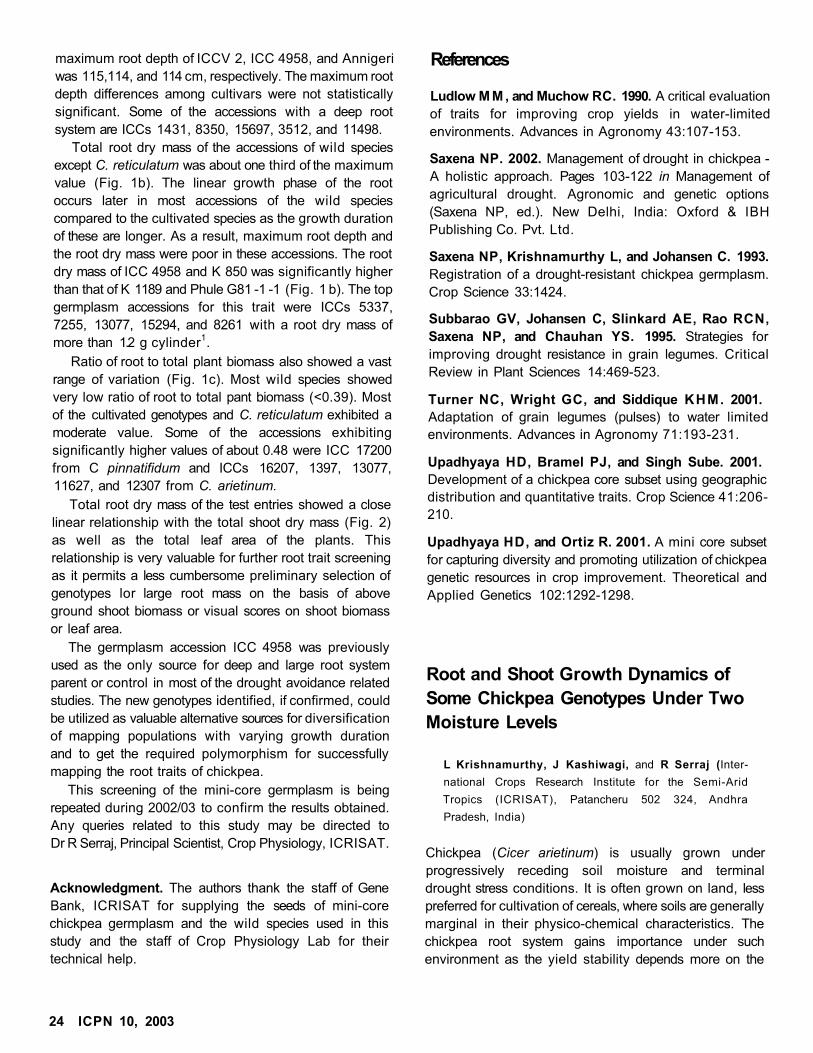
maximum root depth of ICCV 2, ICC 4958, and Annigeri
was 115,114, and 114 cm, respectively. The maximum root
depth differences among cultivars were not statistically
significant. Some of the accessions with a deep root
system are ICCs 1431, 8350, 15697, 3512, and 11498.
Total root dry mass of the accessions of wild species
except C. reticulatum was about one third of the maximum
value (Fig. 1b). The linear growth phase of the root
occurs later in most accessions of the wild species
compared to the cultivated species as the growth duration
of these are longer. As a result, maximum root depth and
the root dry mass were poor in these accessions. The root
dry mass of ICC 4958 and K 850 was significantly higher
than that of K 1189 and Phule G81 -1 -1 (Fig. 1 b). The top
germplasm accessions for this trait were ICCs 5337,
7255, 13077, 15294, and 8261 with a root dry mass of
more than 1.2 g cylinder1.
Ratio of root to total plant biomass also showed a vast
range of variation (Fig. 1c). Most wild species showed
very low ratio of root to total pant biomass (<0.39). Most
of the cultivated genotypes and C. reticulatum exhibited a
moderate value. Some of the accessions exhibiting
significantly higher values of about 0.48 were ICC 17200
from C pinnatifidum and ICCs 16207, 1397, 13077,
11627, and 12307 from C. arietinum.
Total root dry mass of the test entries showed a close
linear relationship with the total shoot dry mass (Fig. 2)
as well as the total leaf area of the plants. This
relationship is very valuable for further root trait screening
as it permits a less cumbersome preliminary selection of
genotypes lor large root mass on the basis of above
ground shoot biomass or visual scores on shoot biomass
or leaf area.
The germplasm accession ICC 4958 was previously
used as the only source for deep and large root system
parent or control in most of the drought avoidance related
studies. The new genotypes identified, if confirmed, could
be utilized as valuable alternative sources for diversification
of mapping populations with varying growth duration
and to get the required polymorphism for successfully
mapping the root traits of chickpea.
This screening of the mini-core germplasm is being
repeated during 2002/03 to confirm the results obtained.
Any queries related to this study may be directed to
Dr R Serraj, Principal Scientist, Crop Physiology, ICRISAT.
Acknowledgment. The authors thank the staff of Gene
Bank, ICRISAT for supplying the seeds of mini-core
chickpea germplasm and the wild species used in this
study and the staff of Crop Physiology Lab for their
technical help.
References
Ludlow M M , and Muchow RC. 1990. A critical evaluation
of traits for improving crop yields in water-limited
environments. Advances in Agronomy 43:107-153.
Saxena NP. 2002. Management of drought in chickpea -
A holistic approach. Pages 103-122 in Management of
agricultural drought. Agronomic and genetic options
(Saxena NP, ed.). New Delhi, India: Oxford & IBH
Publishing Co. Pvt. Ltd.
Saxena NP, Krishnamurthy L, and Johansen C. 1993.
Registration of a drought-resistant chickpea germplasm.
Crop Science 33:1424.
Subbarao GV, Johansen C, Slinkard AE, Rao RCN,
Saxena NP, and Chauhan YS. 1995. Strategies for
improving drought resistance in grain legumes. Critical
Review in Plant Sciences 14:469-523.
Turner NC, Wright GC, and Siddique KHM. 2001.
Adaptation of grain legumes (pulses) to water limited
environments. Advances in Agronomy 71:193-231.
Upadhyaya HD, Bramel PJ, and Singh Sube. 2001.
Development of a chickpea core subset using geographic
distribution and quantitative traits. Crop Science 41:206-
210.
Upadhyaya HD, and Ortiz R. 2001. A mini core subset
for capturing diversity and promoting utilization of chickpea
genetic resources in crop improvement. Theoretical and
Applied Genetics 102:1292-1298.
Root and Shoot Growth Dynamics of
Some Chickpea Genotypes Under Two
Moisture Levels
L Krishnamurthy, J Kashiwagi, and R Serraj (Inter
national Crops Research Institute for the Semi-Arid
Tropics (ICRISAT), Patancheru 502 324, Andhra
Pradesh, India)
Chickpea (Cicer arietinum) is usually grown under
progressively receding soil moisture and terminal
drought stress conditions. It is often grown on land, less
preferred for cultivation of cereals, where soils are generally
marginal in their physico-chemical characteristics. The
chickpea root system gains importance under such
environment as the yield stability depends more on the
24 ICPN 10, 2003
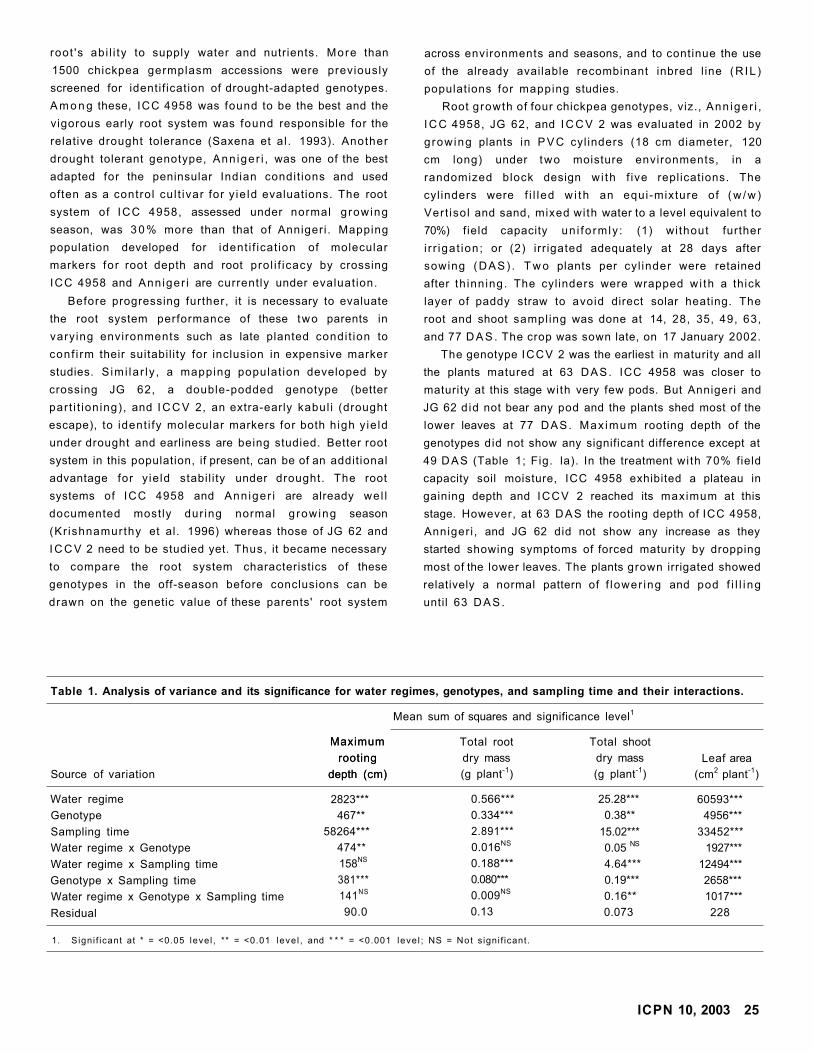
root 's abi l i ty to supply water and nutrients. More than
1500 chickpea germplasm accessions were previously
screened for identif ication of drought-adapted genotypes.
A m o n g these, ICC 4958 was found to be the best and the
vigorous early root system was found responsible for the
relative drought tolerance (Saxena et al . 1993). Another
drought tolerant genotype, Ann iger i , was one of the best
adapted for the peninsular Indian condit ions and used
often as a control cul t ivar for y ie ld evaluations. The root
system of ICC 4958, assessed under normal growing
season, was 3 0 % more than that of Annigeri . Mapping
population developed for ident i f icat ion of molecular
markers for root depth and root prol i f icacy by crossing
ICC 4958 and Anniger i are currently under evaluation.
Before progressing further, it is necessary to evaluate
the root system performance of these two parents in
varying environments such as late planted condi t ion to
conf i rm their suitabil i ty for inclusion in expensive marker
studies. S imi la r ly , a mapping populat ion developed by
crossing JG 62, a double-podded genotype (better
part i t ioning), and I C C V 2, an extra-early kabul i (drought
escape), to ident i fy molecular markers for both high y ie ld
under drought and earliness are being studied. Better root
system in this population, if present, can be of an addit ional
advantage for y ie ld stabil i ty under drought. The root
systems of ICC 4958 and Ann iger i are already wel l
documented mostly dur ing normal g rowing season
(Kr ishnamurthy et al. 1996) whereas those of JG 62 and
I C C V 2 need to be studied yet. Thus, it became necessary
to compare the root system characteristics of these
genotypes in the off-season before conclusions can be
drawn on the genetic value of these parents' root system
across environments and seasons, and to continue the use
of the already available recombinant inbred l ine (R IL )
populations for mapping studies.
Root growth of four chickpea genotypes, viz., Ann iger i ,
I C C 4958, JG 62, and I C C V 2 was evaluated in 2002 by
growing plants in P V C cyl inders (18 cm diameter, 120
cm long) under two moisture environments, in a
randomized block design w i th f ive replications. The
cyl inders were f i l led w i th an equi-mixture of ( w / w )
Vert isol and sand, mixed wi th water to a level equivalent to
70%) f ield capacity un i fo rmly : (1) wi thout further
i r r igat ion; or (2) irr igated adequately at 28 days after
sowing (DAS) . T w o plants per cyl inder were retained
after th inning. The cyl inders were wrapped w i th a thick
layer of paddy straw to avoid direct solar heating. The
root and shoot sampl ing was done at 14, 28, 35, 49, 63,
and 77 D A S . The crop was sown late, on 17 January 2002.
The genotype ICCV 2 was the earliest in maturity and all
the plants matured at 63 DAS. ICC 4958 was closer to
maturity at this stage wi th very few pods. But Annigeri and
JG 62 d id not bear any pod and the plants shed most of the
lower leaves at 77 DAS. Max imum rooting depth of the
genotypes did not show any significant difference except at
49 D A S (Table 1; Fig. la). In the treatment wi th 70% field
capacity soil moisture, ICC 4958 exhibited a plateau in
gaining depth and ICCV 2 reached its maximum at this
stage. However, at 63 D A S the rooting depth of ICC 4958,
Annigeri , and JG 62 did not show any increase as they
started showing symptoms of forced maturity by dropping
most of the lower leaves. The plants grown irrigated showed
relatively a normal pattern of f lower ing and pod f i l l i ng
until 63 D A S .
Table 1. Analysis of variance and its significance for water regimes, genotypes, and sampling time and their interactions.
Maximum
rooting
depth (cm)
Mean sum of squares and significance level1
Source of variation
Maximum
rooting
depth (cm)
Total root
dry mass
(g plant-1)
Total shoot
dry mass
(g plant-1)
Leaf area
(cm2 plant-1)
Water regime
Genotype
Sampling time
Water regime x Genotype
Water regime x Sampling time
Genotype x Sampling time
Water regime x Genotype x Sampling time
Residual
2823***
467**
58264***
474**
158NS
381***
141NS
90.0
0.566***
0.334***
2.891***
0.016NS
0.188***
0.080***
0.009NS
0.13
25.28***
0.38**
15.02***
0.05 NS
4.64***
0.19***
0.16**
0.073
60593***
4956***
33452***
1927***
12494***
2658***
1017***
228
1. Signi f icant at * = <0.05 level , ** = <0.01 leve l , and * * * = <0.001 leve l ; NS = Not s igni f icant.
ICPN 10, 2003 25
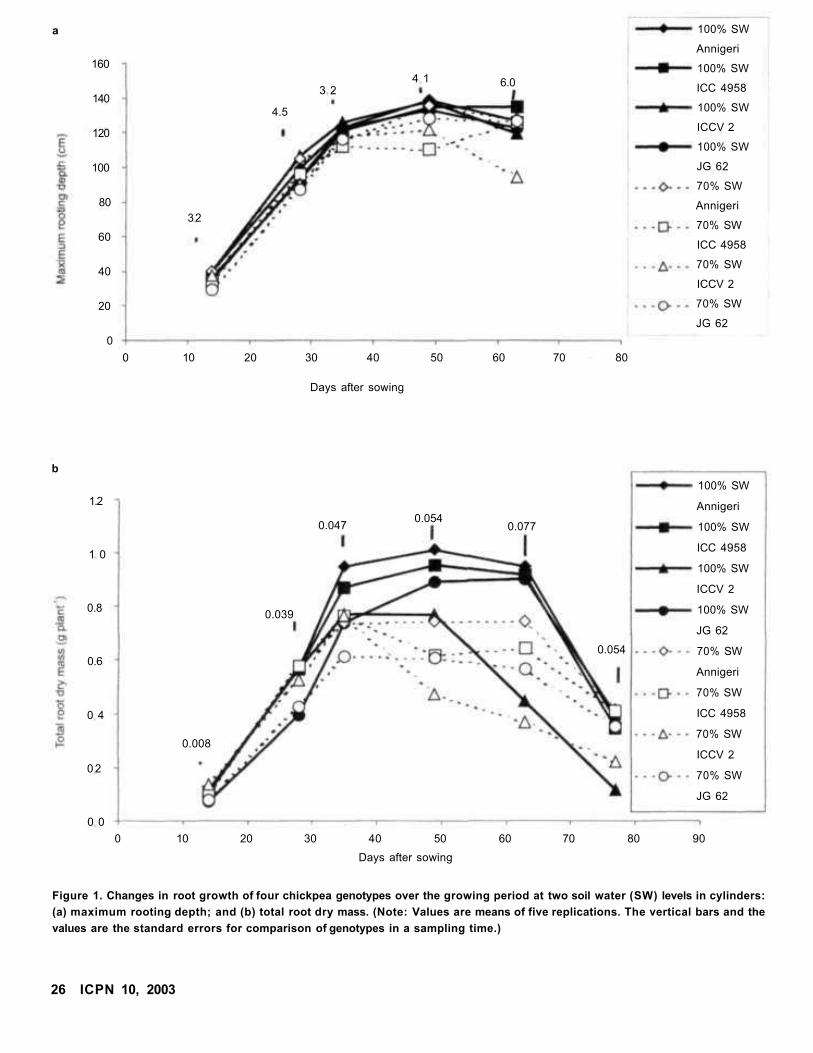
26 ICPN 10, 2003
Figure 1. Changes in root growth of four chickpea genotypes over the growing period at two soil water (SW) levels in cylinders:
(a) maximum rooting depth; and (b) total root dry mass. (Note: Values are means of five replications. The vertical bars and the
values are the standard errors for comparison of genotypes in a sampling time.)
Days after sowing
0 10 20 30 40 50 60 70 80 90
1.2
1 0
0.8
0.6
0 4
0 2
0 0
0.008
0.039
0.0470.054
0.077
0.054
100% SW
Annigeri
100% SW
ICC 4958
100% SW
ICCV 2
100% SW
JG 62
70% SW
Annigeri
70% SW
ICC 4958
70% SW
ICCV 2
70% SW
JG 62
Days after sowing
0 10 20 30 40 50 60 70 80
160
140
120
100
80
60
40
20
0
a
32
4.5
3 2 4 1 6.0
100% SW
Annigeri
100% SW
ICC 4958
100% SW
ICCV 2
100% SW
JG 62
70% SW
Annigeri
70% SW
ICC 4958
70% SW
ICCV 2
70% SW
JG 62
b
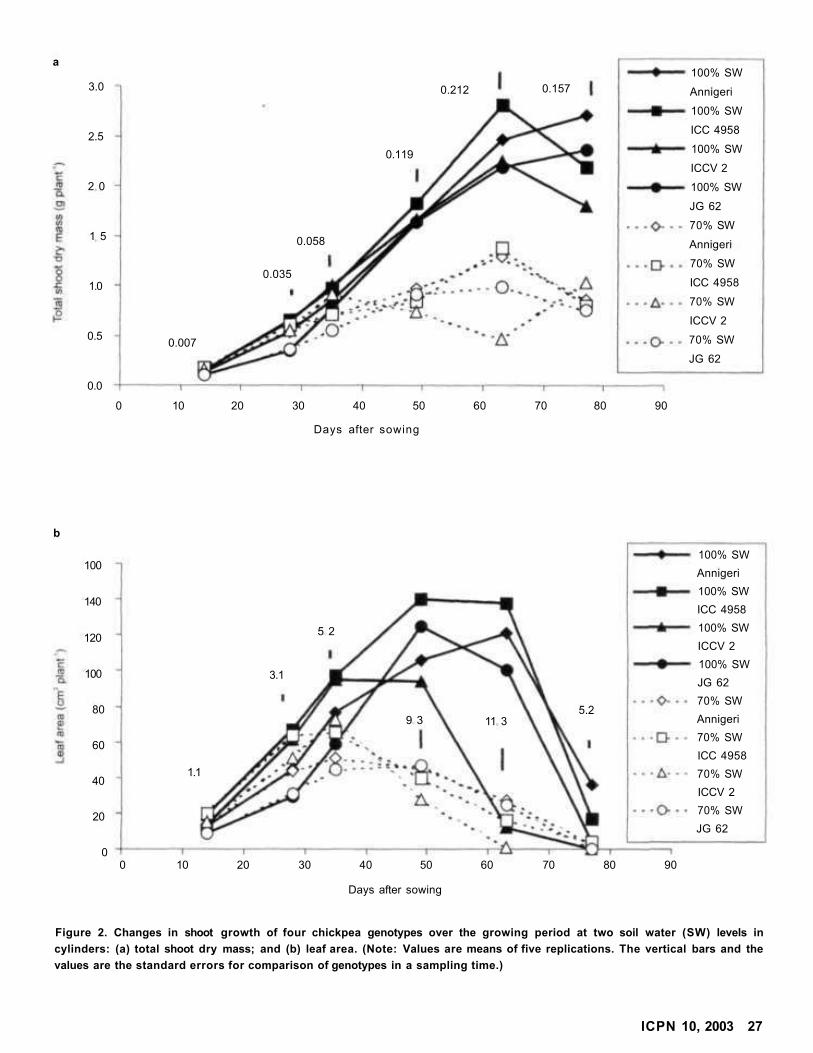
a
3.0
2.5
2 0
1 5
1.0
0.5
0.0
0 10 20 30 40 50 60 70 80 90
0.007
0.035
0.058
0.119
0.212 0.157
100% SW
Annigeri
100% SW
ICC 4958
100% SW
ICCV 2
100% SW
JG 62
70% SW
Annigeri
70% SW
ICC 4958
70% SW
ICCV 2
70% SW
JG 62
Days after sowing
b
100
140
120
100
80
60
40
20
00 10 20 30 40 50 60 70 80 90
1.1
3.1
5 2
9 3 11 3 5.2
Days after sowing
100% SW
Annigeri
100% SW
ICC 4958
100% SW
ICCV 2
100% SW
JG 62
70% SW
Annigeri
70% SW
ICC 4958
70% SW
ICCV 2
70% SW
JG 62
Figure 2. Changes in shoot growth of four chickpea genotypes over the growing period at two soil water (SW) levels in
cylinders: (a) total shoot dry mass; and (b) leaf area. (Note: Values are means of five replications. The vertical bars and the
values are the standard errors for comparison of genotypes in a sampling time.)
ICPN 10, 2003 27
The root dry mass reached near maximum at 35 DAS
in all the genotypes (Table 1; Fig. lb). Root dry mass of
field grown chickpea is known to continue until about 10
days to physiological maturity when grown under normal
season (Krishnamurthy et al. 1996). The early cessation
of root and shoot growth was likely due to the increasing
temperature after mid-February. Root dry mass of ICCV
2 in 70% field capacity started declining after this stage
and under irrigation at 49 DAS. After imposing the soil
moisture treatments the positive irrigation response in
root mass appeared in all genotypes. JG 62 produced
significantly the least root biomass at 14 and 28 DAS
whereas due to a rapid growth at later stages the
difference was minimized and not significant. There was
no difference in root dry mass among Annigeri, ICC
4958, and ICCV 2 in the early stages and between
Annigeri and ICC 4958 in the later stages. ICC 4958 was
previously shown to produce large root mass in the early
stages of crop growth both at ICRISAT, Patancheru,
India as well as in the spring sown conditions at the
International Center for Agricultural Research in Dry
Areas (ICARDA), Aleppo, Syria (Krishnamurthy et al.
1996, Saxena 2002). A comparison of the two genotypes
ICCV 2 and JG 62 exhibits a contrasting temporal interaction
for root mass. This provides a classic example on the
significance of growth stage while defining the superiority
of any genotype. ICCV 2 produced large root mass at
early stages but JG 62 produced at later stages of crop
growth.
The biomass production of shoot was similar to that of
the root (Table 1; Fig. 2a). All the genotypes except
ICCV 2 did not have enough time to pod and mature
normally. Though there were flowers, the flowers did not
set pods; the partitioning was very poor and consequently
the plants remained green but lost the leaf area (Fig. 2b).
ICCV 2 produced significantly high shoot biomass in the
early stages and JG 62 the lowest, as the linear phase of
the growth varied between these two genotypes. There
was no difference between Annigeri and ICC 4958 in any
of the stages. Under field conditions, the early growth
vigor of ICC 4958, at least up to flowering over Annigeri
is apparent visually as well as by dry matter production.
The absence of such a difference in shoot growth indicates
genotype x environment interaction in this experiment.
In conclusion, genotypic variation was observed for
root and shoot growth among the four cultivated genotypes.
The linear growth phase of the genotypes was different
leading to a crop growth stage x genotype interaction.
Such interactions would create difficulties in identifying
the best rooting progenies, as this superiority needs to be
seen in a temporal context. The absence of a significant
difference in root or shoot growth between extremely late
planted Annigeri and ICC 4958, emphasizes the need for
further comprehensive investigation of the whole germplasm
collection to choose the best parental lines to identify
quantitative trait loci (QTL) for the root traits across
different growth conditions. The root growth of ICCV 2
at the early stages was good and therefore some of the
existing RILs of JG 62 x ICCV 2, though were not
consciously bred for, can also be expected to possess a
better root system.
References
Krishnamurthy L, Ito O, and Johansen C. 1996.
Genotypic differences in root growth dynamics and its
implications for drought resistance in chickpea. Pages
235-250 in Dynamics of roots and nitrogen in cropping
systems of the semi-arid tropics (Ito O, Johansen C,
Adu- Gyamfi JJ, Katayama K, Kumar Rao JVDK, and
Rego TJ, eds.). Tsukuba, Japan: JIRCAS.
Saxena NP. 2002. Management of drought in chickpea -
A holistic approach. Pages 103-122 in Management of
agricultural drought. Agronomic and genetic options
(Saxena NP, ed.). New Delhi, India: Oxford & IBH
Publishing Co. Pvt. Ltd.
Saxena NP, Krishnamurthy L, and Johansen C. 1993.
Registration of a drought-resistant chickpea germplasm.
Crop Science 33:1424.
28 ICPN 10, 2003
Pathology
Status of Chickpea Diseases in Himachal
Pradesh, India
Anand Singh and Anil Sirohi (Himachal Pradesh Krishi
Vishwavidyalaya. Pulses Research Station, Berthin
174 029, Himachal Pradesh, India)
Chickpea (Cicer arietinum) is an important pulse crop grown
in submontane, low hill subtropical zone of Himachal
Pradesh, India. It is cultivated between 30°4' to 31°35' N
and 71°5' to 76°55' E. The area under chickpea cultivation
in Himachal Pradesh is 2500 ha (Anonymous 1998). It is
mostly cultivated in rainfed situation on small farms. The
average yield of chickpea is 700 kg ha ' and is below
potential yields. Diseases arc the most important factor
limiting production. There is limited information available
on diseases affecting this crop (Kapoor et al. 1991).
Therefore, there is a need to conduct systematic surveys
to determine the incidence of diseases affecting chickpea
in Himachal Pradesh.
Surveys from 1992 to 1998 were conducted in the
major chickpea-growing areas of Himachal Pradesh.
Farmers' fields, demonstration plots in farmers' fields
laid out by the extension division, research stations, and
seed farms were surveyed in 7 districts at 161 locations.
At each location, disease observations were recorded in 3
to 8 individual fields. In each field, number of total plants
and plants infected by different diseases in one m2 area at
10 randomly selected spots were counted. From these
observations the average disease incidence in each district
was calculated.
Fungal isolates were made from all plant parts of
diseased plants and cultures were maintained in potato
dextrose agar (PDA) medium. The pathogenicity of
isolates of Fusarium spp and Rhizoctonia solani was
tested on susceptible cultivar JG 62 by using pot culture
inoculation methods developed by Nene and Haware
(1980). For pot culture, inoculum was grown in a chickpea
flour-sand mixture. This inoculum mixture was thoroughly
mixed with autoclaved soil in a pot (1:20) and sowing
was done 4 days later. Control plants were grown in a
comparable mixture of non-infected sand and chickpea
flour and autoclaved soil.
Inoculum of leaf pathogen was produced on PDA and
chickpea seed meal dextrose agar. Arial parts of the
plants were sprayed uniformly with a spore suspension of
pathogens. The plants were then covered with transparent
polyethylene bags for 4 days and incubated at 23±2°C
with 12 h photoperiod. Disease assessment for leaf pathogen
was made at 20 and 40 days after inoculation. Experiments
with each of the pathogens were replicated 5 times, a 15-
cm pot with eight seedlings forming a replication.
Eight fungal and four viral diseases were identified.
The incidence of diseases varied in the districts (Table 1).
Most of these diseases have been reported previously
(Kapoor et al. 1991); however, cucumber mosaic virus
(CMV), bean yellow mosaic virus, and a gemini virus
were recorded for the first time from Himachal Pradesh.
The diseases that were encountered during the survey
period are described below.
Collar rot. Collar rot (Sclerotium rolfsii) was observed
in farmers' fields at all the locations. In infested soil,
germinating seeds are attacked in the pre-emergence
phase. Seedlings and young plants get infected at the
collar region and the affected plants dry up. The incidence
decreases with the age of the crop. The disease is favored
by good soil moisture and high soil temperature.
Optimum temperature for disease development is 30°C
(Mathur and Sinha 1968).
Wilt. Wilt was first reported from India (Butler 1918).
Fusarium solani, F. oxysporum f. sp ciceris, R. solani,
and R. bataticola were isolated from wilted plants. The
incidence of F. solani was high although F. oxysporum
was mainly associated with chickpea wilt. The disease
occurred at all the stages of plant growth. High incidence
was noticed at Una and Sirmour where temperature is
normally high (>24°C).
Black root rot. Black root rot is caused by the fungus
F. solani. The disease was observed at all stages of plant
growth. Excessive moisture and moderately high
temperatures (25 to 30°C) encourage disease development
(Nene and Reddy 1987). High incidence of disease was
observed at Bilaspur.
Stem rot. Stem rot is caused by Sclerotinia sclerotiorum.
The disease can affect the crop at any stage. However,
maximum incidence was noticed in February and March
when the crop canopy covered the ground below the crop.
Excessive vegetative growth, high soil moisture, and cool
weather (20°C) favor disease development.
Dry root rot. Dry root rot caused by R. bataticola was a
serious disease in non-irrigated chickpea-growing areas.
The incidence of disease was more in Una and Sirmour
districts.
ICRN 10, 2003 29
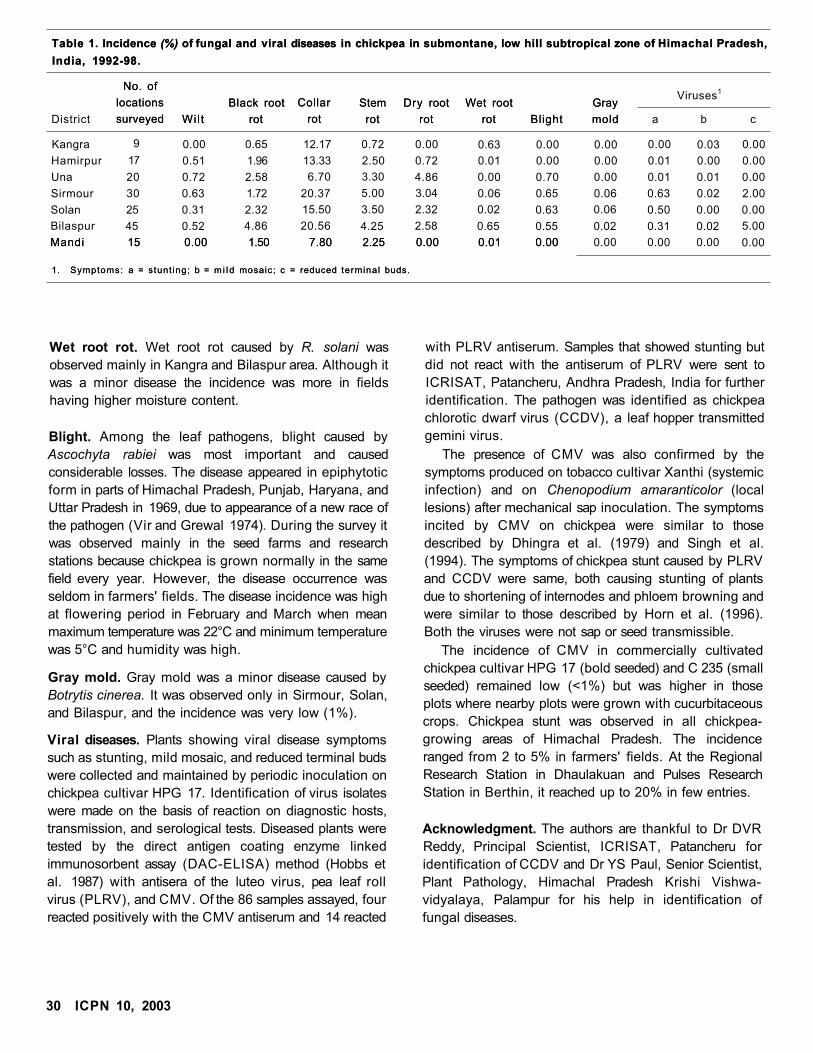
Table 1. Incidence (%) of fungal and viral diseases in chickpea in submontane, low hill subtropical zone of Himachal Pradesh,
India, 1992-98.
Table 1. Incidence (%) of fungal and viral diseases in chickpea in submontane, low hill subtropical zone of Himachal Pradesh,
India, 1992-98.
No. of
locations
surveyed Wilt
Black root
rot
Collar
rot
Stem
rot
Dry root
rot
Wet root
rot Blight
Gray
mold
Viruses1
District
No. of
locations
surveyed Wilt
Black root
rot
Collar
rot
Stem
rot
Dry root
rot
Wet root
rot Blight
Gray
mold a b c
Kangra 9 0.00 0.65 12.17 0.72 0.00 0.63 0.00 0.00 0.00 0.03 0.00
Hamirpur 17 0.51 1.96 13.33 2.50 0.72 0.01 0.00 0.00 0.01 0.00 0.00
Una 20 0.72 2.58 6.70 3.30 4.86 0.00 0.70 0.00 0.01 0.01 0.00
Sirmour 30 0.63 1.72 20.37 5.00 3.04 0.06 0.65 0.06 0.63 0.02 2.00
Solan 25 0.31 2.32 15.50 3.50 2.32 0.02 0.63 0.06 0.50 0.00 0.00
Bilaspur 45 0.52 4.86 20.56 4.25 2.58 0.65 0.55 0.02 0.31 0.02 5.00
Mandi 15 0.00 1.50 7.80 2.25 0.00 0.01
1. Symptoms: a = stunt ing; b = m i l d mosaic; c = reduced terminal buds.
0.00 0.00 0.00 0.00 0.00Mandi 15 0.00 1.50 7.80 2.25 0.00 0.01
1. Symptoms: a = stunt ing; b = m i l d mosaic; c = reduced terminal buds.
0.00
Wet root rot. Wet root rot caused by R. solani was
observed mainly in Kangra and Bilaspur area. Although it
was a minor disease the incidence was more in fields
having higher moisture content.
Blight. Among the leaf pathogens, blight caused by
Ascochyta rabiei was most important and caused
considerable losses. The disease appeared in epiphytotic
form in parts of Himachal Pradesh, Punjab, Haryana, and
Uttar Pradesh in 1969, due to appearance of a new race of
the pathogen (Vir and Grewal 1974). During the survey it
was observed mainly in the seed farms and research
stations because chickpea is grown normally in the same
field every year. However, the disease occurrence was
seldom in farmers' fields. The disease incidence was high
at flowering period in February and March when mean
maximum temperature was 22°C and minimum temperature
was 5°C and humidity was high.
Gray mold. Gray mold was a minor disease caused by
Botrytis cinerea. It was observed only in Sirmour, Solan,
and Bilaspur, and the incidence was very low (1%).
Viral diseases. Plants showing viral disease symptoms
such as stunting, mild mosaic, and reduced terminal buds
were collected and maintained by periodic inoculation on
chickpea cultivar HPG 17. Identification of virus isolates
were made on the basis of reaction on diagnostic hosts,
transmission, and serological tests. Diseased plants were
tested by the direct antigen coating enzyme linked
immunosorbent assay (DAC-ELISA) method (Hobbs et
al. 1987) with antisera of the luteo virus, pea leaf roll
virus (PLRV), and CMV. Of the 86 samples assayed, four
reacted positively with the CMV antiserum and 14 reacted
with PLRV antiserum. Samples that showed stunting but
did not react with the antiserum of PLRV were sent to
ICRISAT, Patancheru, Andhra Pradesh, India for further
identification. The pathogen was identified as chickpea
chlorotic dwarf virus (CCDV), a leaf hopper transmitted
gemini virus.
The presence of CMV was also confirmed by the
symptoms produced on tobacco cultivar Xanthi (systemic
infection) and on Chenopodium amaranticolor (local
lesions) after mechanical sap inoculation. The symptoms
incited by CMV on chickpea were similar to those
described by Dhingra et al. (1979) and Singh et al.
(1994). The symptoms of chickpea stunt caused by PLRV
and CCDV were same, both causing stunting of plants
due to shortening of internodes and phloem browning and
were similar to those described by Horn et al. (1996).
Both the viruses were not sap or seed transmissible.
The incidence of CMV in commercially cultivated
chickpea cultivar HPG 17 (bold seeded) and C 235 (small
seeded) remained low (<1%) but was higher in those
plots where nearby plots were grown with cucurbitaceous
crops. Chickpea stunt was observed in all chickpea-
growing areas of Himachal Pradesh. The incidence
ranged from 2 to 5% in farmers' fields. At the Regional
Research Station in Dhaulakuan and Pulses Research
Station in Berthin, it reached up to 20% in few entries.
Acknowledgment. The authors are thankful to Dr DVR
Reddy, Principal Scientist, ICRISAT, Patancheru for
identification of CCDV and Dr YS Paul, Senior Scientist,
Plant Pathology, Himachal Pradesh Krishi Vishwa-
vidyalaya, Palampur for his help in identification of
fungal diseases.
30 ICPN 10, 2003
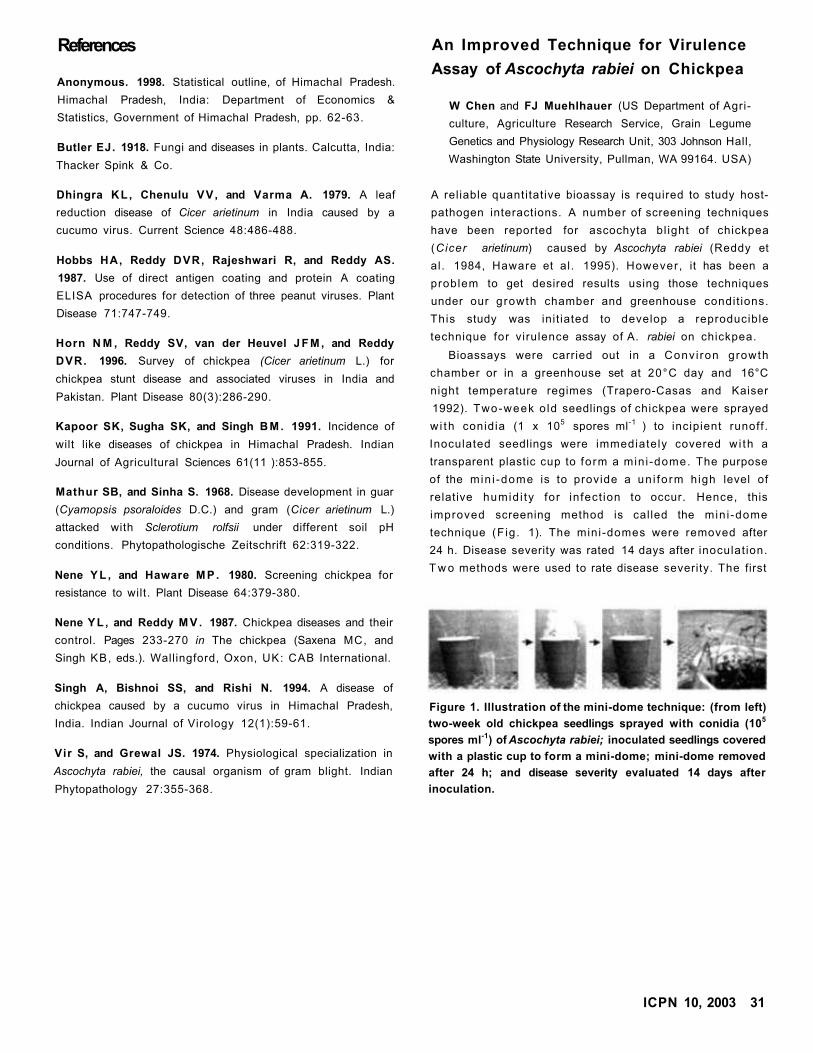
References
Anonymous. 1998. Statistical outline, of Himachal Pradesh.
Himachal Pradesh, India: Department of Economics &
Statistics, Government of Himachal Pradesh, pp. 62-63.
Butler EJ. 1918. Fungi and diseases in plants. Calcutta, India:
Thacker Spink & Co.
Dhingra KL , Chenulu VV, and Varma A. 1979. A leaf
reduction disease of Cicer arietinum in India caused by a
cucumo virus. Current Science 48:486-488.
Hobbs HA, Reddy DVR, Rajeshwari R, and Reddy AS.
1987. Use of direct antigen coating and protein A coating
ELISA procedures for detection of three peanut viruses. Plant
Disease 71:747-749.
Horn N M , Reddy SV, van der Heuvel J F M , and Reddy
DVR. 1996. Survey of chickpea (Cicer arietinum L.) for
chickpea stunt disease and associated viruses in India and
Pakistan. Plant Disease 80(3):286-290.
Kapoor SK, Sugha SK, and Singh B M . 1991. Incidence of
wilt like diseases of chickpea in Himachal Pradesh. Indian
Journal of Agricultural Sciences 61(11 ):853-855.
Mathur SB, and Sinha S. 1968. Disease development in guar
(Cyamopsis psoraloides D.C.) and gram (Cicer arietinum L.)
attacked with Sclerotium rolfsii under different soil pH
conditions. Phytopathologische Zeitschrift 62:319-322.
Nene Y L , and Haware M P . 1980. Screening chickpea for
resistance to wilt. Plant Disease 64:379-380.
Nene YL , and Reddy M V . 1987. Chickpea diseases and their
control. Pages 233-270 in The chickpea (Saxena MC, and
Singh KB, eds.). Wallingford, Oxon, UK: CAB International.
Singh A, Bishnoi SS, and Rishi N. 1994. A disease of
chickpea caused by a cucumo virus in Himachal Pradesh,
India. Indian Journal of Virology 12(1):59-61.
Vir S, and Grewal JS. 1974. Physiological specialization in
Ascochyta rabiei, the causal organism of gram blight. Indian
Phytopathology 27:355-368.
An Improved Technique for Virulence
Assay of Ascochyta rabiei on Chickpea
W Chen and FJ Muehlhauer (US Department of Agri
culture, Agriculture Research Service, Grain Legume
Genetics and Physiology Research Unit, 303 Johnson Hall,
Washington State University, Pullman, WA 99164. USA)
A reliable quantitat ive bioassay is required to study host-
pathogen interactions. A number of screening techniques
have been reported for ascochyta bl ight of chickpea
(Cicer arietinum) caused by Ascochyta rabiei (Reddy et
al. 1984, Haware et al. 1995). However, it has been a
problem to get desired results using those techniques
under our growth chamber and greenhouse condit ions.
This study was init iated to develop a reproducible
technique for virulence assay of A. rabiei on chickpea.
Bioassays were carried out in a Conv i ron growth
chamber or in a greenhouse set at 20°C day and 16°C
night temperature regimes (Trapero-Casas and Kaiser
1992). Two-week o ld seedlings of chickpea were sprayed
wi th conidia (1 x 10⁵ spores ml-1 ) to incipient runoff.
Inoculated seedlings were immediately covered w i th a
transparent plastic cup to form a min i -dome. The purpose
of the min i -dome is to provide a un i fo rm high level of
relative humid i ty for infect ion to occur. Hence, this
improved screening method is called the min i -dome
technique (Fig. 1). The mini-domes were removed after
24 h. Disease severity was rated 14 days after inoculat ion.
T w o methods were used to rate disease severity. The first
ICPN 10, 2003 31
Figure 1. Illustration of the mini-dome technique: (from left)
two-week old chickpea seedlings sprayed with conidia (105
spores ml-1
) of Ascochyta rabiei; inoculated seedlings covered
with a plastic cup to form a mini-dome; mini-dome removed
after 24 h; and disease severity evaluated 14 days after
inoculation.
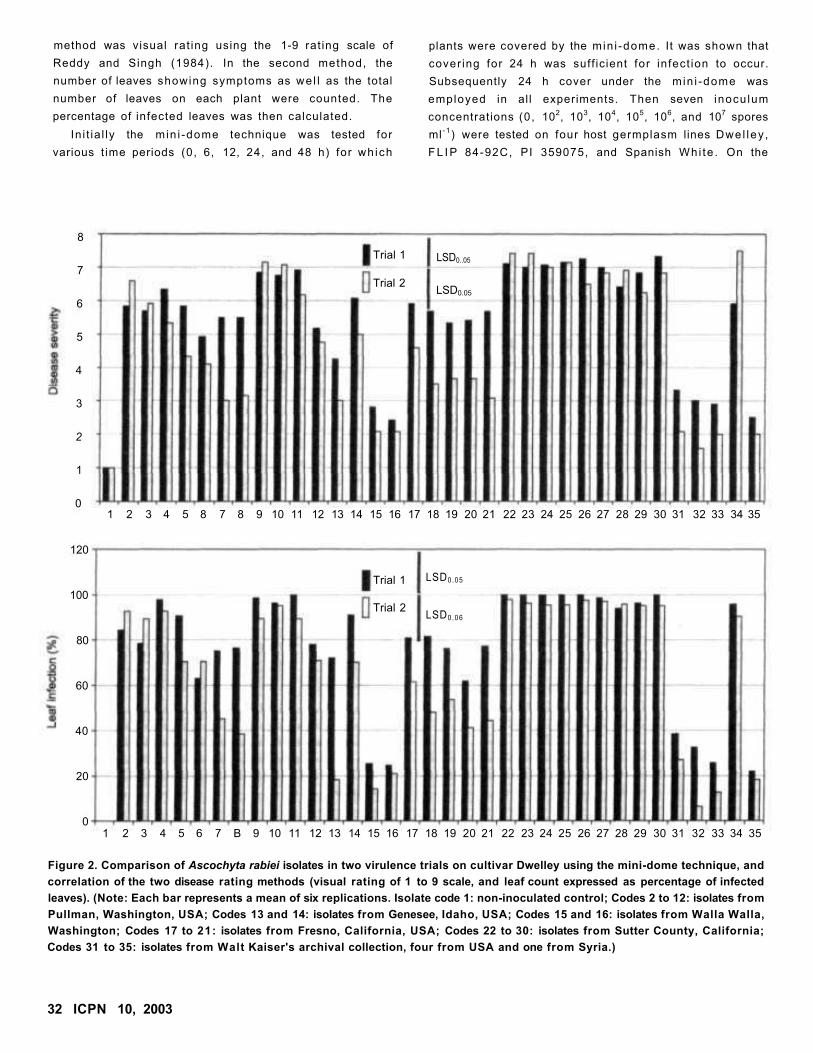
method was visual rat ing using the 1-9 rat ing scale of
Reddy and Singh (1984). In the second method, the
number of leaves showing symptoms as we l l as the total
number of leaves on each plant were counted. The
percentage of infected leaves was then calculated.
In i t ia l ly the min i -dome technique was tested for
various t ime periods (0, 6, 12, 24, and 48 h) for wh ich
plants were covered by the min i -dome. It was shown that
cover ing for 24 h was suff icient for infect ion to occur.
Subsequently 24 h cover under the min i -dome was
employed in al l experiments. Then seven inocu lum
concentrations (0, 102, 103, 104, 105, 106, and 107 spores
ml -1) were tested on four host germplasm lines Dwel ley ,
F L I P 84-92C, PI 359075, and Spanish Whi te . On the
32 ICPN 10, 2003
Figure 2. Comparison of Ascochyta rabiei isolates in two virulence trials on cultivar Dwelley using the mini-dome technique, and
correlation of the two disease rating methods (visual rating of 1 to 9 scale, and leaf count expressed as percentage of infected
leaves). (Note: Each bar represents a mean of six replications. Isolate code 1: non-inoculated control; Codes 2 to 12: isolates from
Pullman, Washington, USA; Codes 13 and 14: isolates from Genesee, Idaho, USA; Codes 15 and 16: isolates from Walla Walla,
Washington; Codes 17 to 21: isolates from Fresno, California, USA; Codes 22 to 30: isolates from Sutter County, California;
Codes 31 to 35: isolates from Walt Kaiser's archival collection, four from USA and one from Syria.)
1 2 3 4 5 6 7 B 9 10 11 12 13 14 15 16 17 18 19 20 21 22 23 24 25 26 27 28 29 30 31 32 33 34 35
120
100
80
60
40
20
0
Trial 1
Trial 2
LSD0.05
LSD0.06
1 2 3 4 5 8 7 8 9 10 11 12 13 14 15 16 17 18 19 20 21 22 23 24 25 26 27 28 29 30 31 32 33 34 35
8
7
6
5
4
3
2
1
0
Trial 1
Trial 2 LSD0.05
LSD0..05
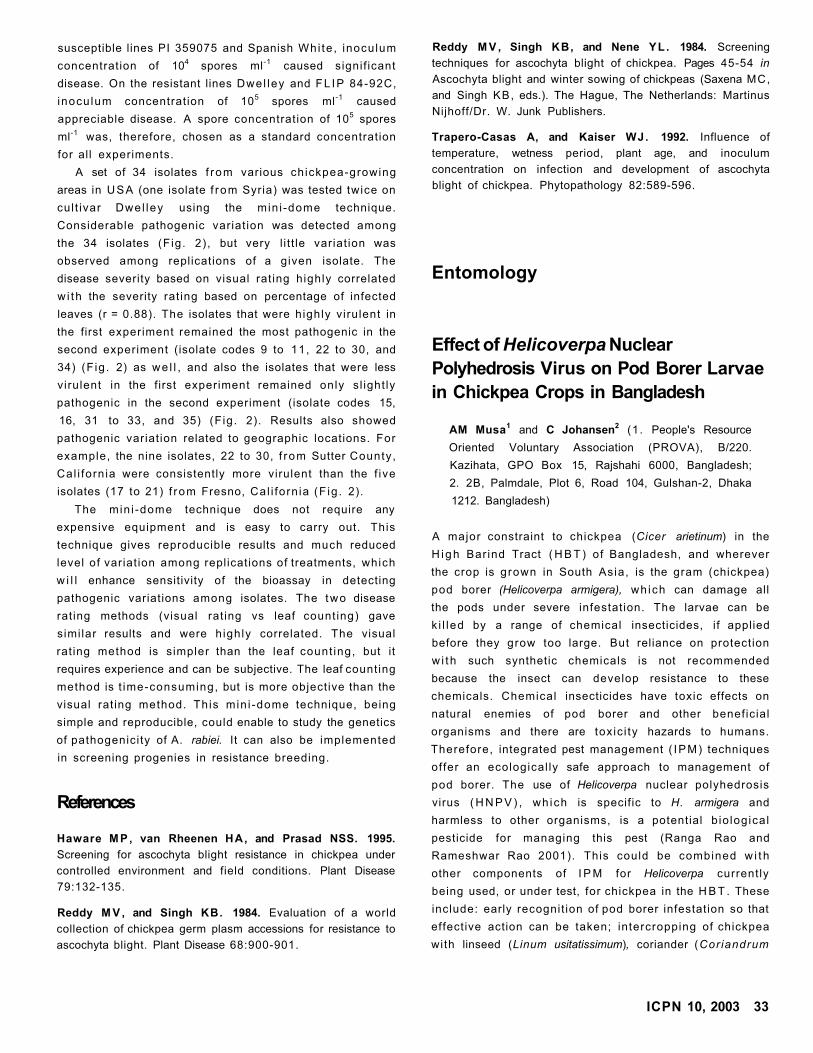
susceptible lines PI 359075 and Spanish Whi te , inoculum
concentration of 104 spores ml-1 caused signif icant
disease. On the resistant lines Dwel ley and FL IP 84-92C,
inocu lum concentration of 105 spores ml-1 caused
appreciable disease. A spore concentration of 105 spores
ml-1 was, therefore, chosen as a standard concentration
for all experiments.
A set of 34 isolates f rom various chickpea-growing
areas in USA (one isolate f rom Syria) was tested twice on
cul t ivar Dwel ley using the min i -dome technique.
Considerable pathogenic variat ion was detected among
the 34 isolates (F ig. 2), but very l i t t le variat ion was
observed among replications of a given isolate. The
disease severity based on visual rat ing highly correlated
wi th the severity rat ing based on percentage of infected
leaves (r = 0.88). The isolates that were highly virulent in
the first experiment remained the most pathogenic in the
second experiment (isolate codes 9 to 11, 22 to 30, and
34) (F ig . 2) as we l l , and also the isolates that were less
virulent in the first experiment remained only sl ight ly
pathogenic in the second experiment (isolate codes 15,
16, 31 to 33, and 35) (F ig. 2). Results also showed
pathogenic variat ion related to geographic locations. For
example, the nine isolates, 22 to 30, f rom Sutter County,
Cal i forn ia were consistently more virulent than the f ive
isolates (17 to 21) f rom Fresno, Cal i forn ia (F ig . 2).
The min i -dome technique does not require any
expensive equipment and is easy to carry out. This
technique gives reproducible results and much reduced
level of variat ion among replications of treatments, which
w i l l enhance sensitivity of the bioassay in detecting
pathogenic variations among isolates. The two disease
rating methods (visual rat ing vs leaf count ing) gave
simi lar results and were h ighly correlated. The visual
rat ing method is simpler than the leaf count ing, but it
requires experience and can be subjective. The leaf counting
method is t ime-consuming, but is more objective than the
visual rat ing method. This min i -dome technique, being
simple and reproducible, could enable to study the genetics
of pathogenici ty of A. rabiei. It can also be implemented
in screening progenies in resistance breeding.
References
Haware M P , van Rheenen HA, and Prasad NSS. 1995.
Screening for ascochyta blight resistance in chickpea under
controlled environment and field conditions. Plant Disease
79:132-135.
Reddy M V , and Singh KB. 1984. Evaluation of a world
collection of chickpea germ plasm accessions for resistance to
ascochyta blight. Plant Disease 68:900-901.
Reddy M V , Singh KB, and Nene YL. 1984. Screening
techniques for ascochyta blight of chickpea. Pages 45-54 in
Ascochyta blight and winter sowing of chickpeas (Saxena MC,
and Singh KB, eds.). The Hague, The Netherlands: Martinus
Nijhoff/Dr. W. Junk Publishers.
Trapero-Casas A, and Kaiser WJ. 1992. Influence of
temperature, wetness period, plant age, and inoculum
concentration on infection and development of ascochyta
blight of chickpea. Phytopathology 82:589-596.
Entomology
Effect of Helicoverpa Nuclear
Polyhedrosis Virus on Pod Borer Larvae
in Chickpea Crops in Bangladesh
AM Musa1 and C Johansen
2 (1. People's Resource
Oriented Voluntary Association (PROVA), B/220.
Kazihata, GPO Box 15, Rajshahi 6000, Bangladesh;
2. 2B, Palmdale, Plot 6, Road 104, Gulshan-2, Dhaka
1212. Bangladesh)
A major constraint to chickpea (Cicer arietinum) in the
H i g h Bar ind Tract ( H B T ) of Bangladesh, and wherever
the crop is grown in South Asia, is the gram (chickpea)
pod borer (Helicoverpa armigera), wh ich can damage all
the pods under severe infestation. The larvae can be
k i l led by a range of chemical insecticides, if applied
before they grow too large. But reliance on protection
w i th such synthetic chemicals is not recommended
because the insect can develop resistance to these
chemicals. Chemical insecticides have toxic effects on
natural enemies of pod borer and other beneficial
organisms and there are tox ic i ty hazards to humans.
Therefore, integrated pest management ( IPM) techniques
offer an ecological ly safe approach to management of
pod borer. The use of Helicoverpa nuclear polyhedrosis
virus ( H N P V ) , wh ich is specific to H. armigera and
harmless to other organisms, is a potential b io logical
pesticide for managing this pest (Ranga Rao and
Rameshwar Rao 2001). This could be combined w i t h
other components of I P M for Helicoverpa current ly
being used, or under test, for chickpea in the H B T . These
include: early recognit ion of pod borer infestation so that
effective action can be taken; intercropping of chickpea
with linseed (Linum usitatissimum), coriander (Coriandrum
ICPN 10, 2003 33
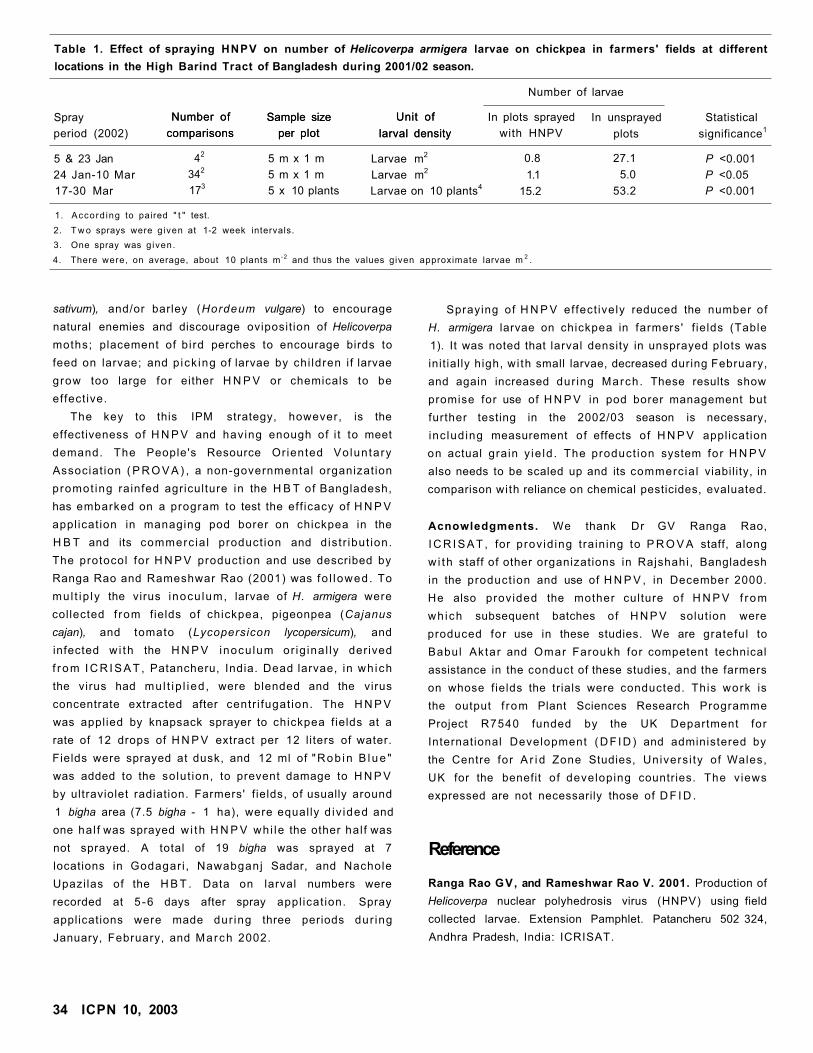
Table 1. Effect of spraying HNPV on number of Helicoverpa armigera larvae on chickpea in farmers' fields at different
locations in the High Barind Tract of Bangladesh during 2001/02 season.
Number of
comparisons
Sample size
per plot
Unit of
larval density
Number of larvae
Spray
period (2002)
Number of
comparisons
Sample size
per plot
Unit of
larval density
In plots sprayed
with HNPV
In unsprayed
plots
Statistical
significance1
5 & 23 Jan
24 Jan-10 Mar
17-30 Mar
42
342
173
5 m x 1 m
5 m x 1 m
5 x 10 plants
Larvae m2
Larvae m2
Larvae on 10 plants4
0.8
1.1
15.2
27.1
5.0
53.2
P <0.001
P <0.05
P <0.001
1. Accord ing to paired " t " test.
2. T w o sprays were g iven at 1-2 week intervals.
3. One spray was g iven.
4. There were, on average, about 10 plants m -2 and thus the values given approximate larvae m 2 .
sativum), and/or barley (Hordeum vulgare) to encourage
natural enemies and discourage oviposit ion of Helicoverpa
moths; placement of b i rd perches to encourage birds to
feed on larvae; and p ick ing of larvae by chi ldren i f larvae
grow too large for either H N P V or chemicals to be
effect ive.
The key to this IPM strategy, however, is the
effectiveness of H N P V and having enough of i t to meet
demand. The People's Resource Oriented Voluntary
Associat ion ( P R O V A ) , a non-governmental organizat ion
promot ing rainfed agriculture in the H B T of Bangladesh,
has embarked on a program to test the eff icacy of H N P V
appl icat ion in managing pod borer on chickpea in the
H B T and its commerc ia l product ion and distr ibut ion.
The protocol for H N P V product ion and use described by
Ranga Rao and Rameshwar Rao (2001) was fo l lowed. To
mul t ip ly the virus inocu lum, larvae of H. armigera were
collected f rom fields of chickpea, pigeonpea (Cajanus
cajan), and tomato (Lycopersicon lycopersicum), and
infected w i th the H N P V inocu lum or ig inal ly derived
f rom I C R I S A T , Patancheru, India. Dead larvae, in wh ich
the virus had mul t ip l ied , were blended and the virus
concentrate extracted after centr i fugat ion. The H N P V
was applied by knapsack sprayer to chickpea f ields at a
rate of 12 drops of H N P V extract per 12 liters of water.
Fields were sprayed at dusk, and 12 ml of "Rob in B l u e "
was added to the solut ion, to prevent damage to H N P V
by ultraviolet radiation. Farmers' f ields, of usually around
1 bigha area (7.5 bigha - 1 ha), were equally d iv ided and
one hal f was sprayed w i th H N P V whi le the other hal f was
not sprayed. A total of 19 bigha was sprayed at 7
locations in Godagari , Nawabganj Sadar, and Nachole
Upazilas of the H B T . Data on larval numbers were
recorded at 5 -6 days after spray appl icat ion. Spray
applications were made dur ing three periods dur ing
January, February, and March 2002.
Spraying of H N P V effect ively reduced the number of
H. armigera larvae on chickpea in farmers' f ields (Table
1). It was noted that larval density in unsprayed plots was
init ial ly high, wi th small larvae, decreased during February,
and again increased dur ing March. These results show
promise for use of H N P V in pod borer management but
further testing in the 2002/03 season is necessary,
inc luding measurement of effects of H N P V appl icat ion
on actual grain y ie ld . The product ion system for H N P V
also needs to be scaled up and its commercia l viability, in
comparison with reliance on chemical pesticides, evaluated.
Acnowledgments. We thank Dr GV Ranga Rao,
I C R I S A T , for prov id ing training to P R O V A staff, along
w i th staff of other organizations in Rajshahi, Bangladesh
in the product ion and use of H N P V , in December 2000.
He also provided the mother culture of H N P V f rom
which subsequent batches of H N P V solut ion were
produced for use in these studies. We are grateful to
Babul Aktar and Omar Faroukh for competent technical
assistance in the conduct of these studies, and the farmers
on whose f ields the trials were conducted. This work is
the output f rom Plant Sciences Research Programme
Project R7540 funded by the UK Department for
International Development ( D F I D ) and administered by
the Centre for A r i d Zone Studies, Univers i ty of Wales,
UK for the benefit of developing countries. The views
expressed are not necessarily those of D F I D .
Reference
Ranga Rao GV, and Rameshwar Rao V. 2001. Production of
Helicoverpa nuclear polyhedrosis virus (HNPV) using field
collected larvae. Extension Pamphlet. Patancheru 502 324,
Andhra Pradesh, India: ICRISAT.
34 ICPN 10, 2003
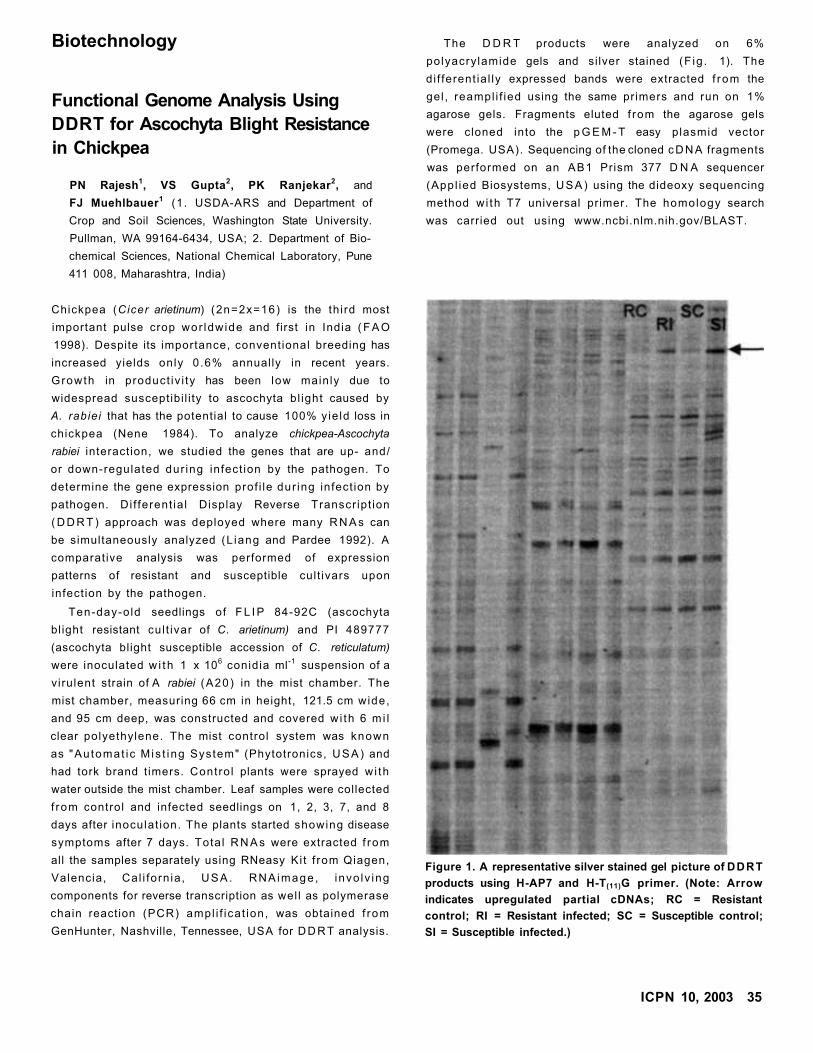
Biotechnology
Functional Genome Analysis Using
DDRT for Ascochyta Blight Resistance
in Chickpea
PN Rajesh1, VS Gupta
2, PK Ranjekar
2, and
FJ Muehlbauer1 (1. USDA-ARS and Department of
Crop and Soil Sciences, Washington State University.
Pullman, WA 99164-6434, USA; 2. Department of Bio
chemical Sciences, National Chemical Laboratory, Pune
411 008, Maharashtra, India)
Chickpea (Cicer arietinum) (2n=2x=16) is the th i rd most
important pulse crop wor ldwide and first in India ( F A O
1998). Despite its importance, conventional breeding has
increased yields only 0.6% annually in recent years.
Growth in product iv i ty has been low mainly due to
widespread susceptibi l i ty to ascochyta bl ight caused by
A. rabiei that has the potential to cause 100% yie ld loss in
chickpea (Nene 1984). To analyze chickpea-Ascochyta
rabiei interaction, we studied the genes that are up- and/
or down-regulated dur ing infect ion by the pathogen. To
determine the gene expression prof i le dur ing infect ion by
pathogen. Di f ferent ia l Display Reverse Transcr ipt ion
( D D R T ) approach was deployed where many R N A s can
be simultaneously analyzed (L iang and Pardee 1992). A
comparative analysis was performed of expression
patterns of resistant and susceptible cult ivars upon
infect ion by the pathogen.
Ten-day-old seedlings of F L I P 84-92C (ascochyta
blight resistant cul t ivar of C. arietinum) and PI 489777
(ascochyta blight susceptible accession of C. reticulatum)
were inoculated w i th 1 x 10⁶ conidia ml-1 suspension of a
virulent strain of A rabiei (A20) in the mist chamber. The
mist chamber, measuring 66 cm in height, 121.5 cm wide,
and 95 cm deep, was constructed and covered w i th 6 m i l
clear polyethylene. The mist control system was known
as "Automat ic M is t ing System" (Phytotronics, USA) and
had tork brand t imers. Contro l plants were sprayed w i th
water outside the mist chamber. Leaf samples were collected
f rom control and infected seedlings on 1, 2, 3, 7, and 8
days after inoculat ion. The plants started showing disease
symptoms after 7 days. Total R N A s were extracted f rom
all the samples separately using RNeasy Ki t f rom Qiagen,
Valencia, Cal i forn ia, U S A . RNAimage , invo lv ing
components for reverse transcription as wel l as polymerase
chain reaction (PCR) ampl i f icat ion, was obtained f rom
GenHunter, Nashville, Tennessee, USA for D D R T analysis.
The D D R T products were analyzed on 6%
polyacry lamide gels and si lver stained (F ig . 1). The
di f ferent ia l ly expressed bands were extracted f rom the
gel , reampl i f ied using the same primers and run on 1%
agarose gels. Fragments eluted f rom the agarose gels
were cloned into the p G E M - T easy plasmid vector
(Promega. USA). Sequencing of the cloned c D N A fragments
was performed on an AB1 Prism 377 D N A sequencer
(Appl ied Biosystems, USA) using the dideoxy sequencing
method w i th T7 universal primer. The homology search
was carried out using www.ncbi.nlm.nih.gov/BLAST.
Figure 1. A representative silver stained gel picture of DDRT
products using H-AP7 and H-T(11)G primer. (Note: Arrow
indicates upregulated partial cDNAs; RC = Resistant
control; RI = Resistant infected; SC = Susceptible control;
SI = Susceptible infected.)
ICPN 10, 2003 35
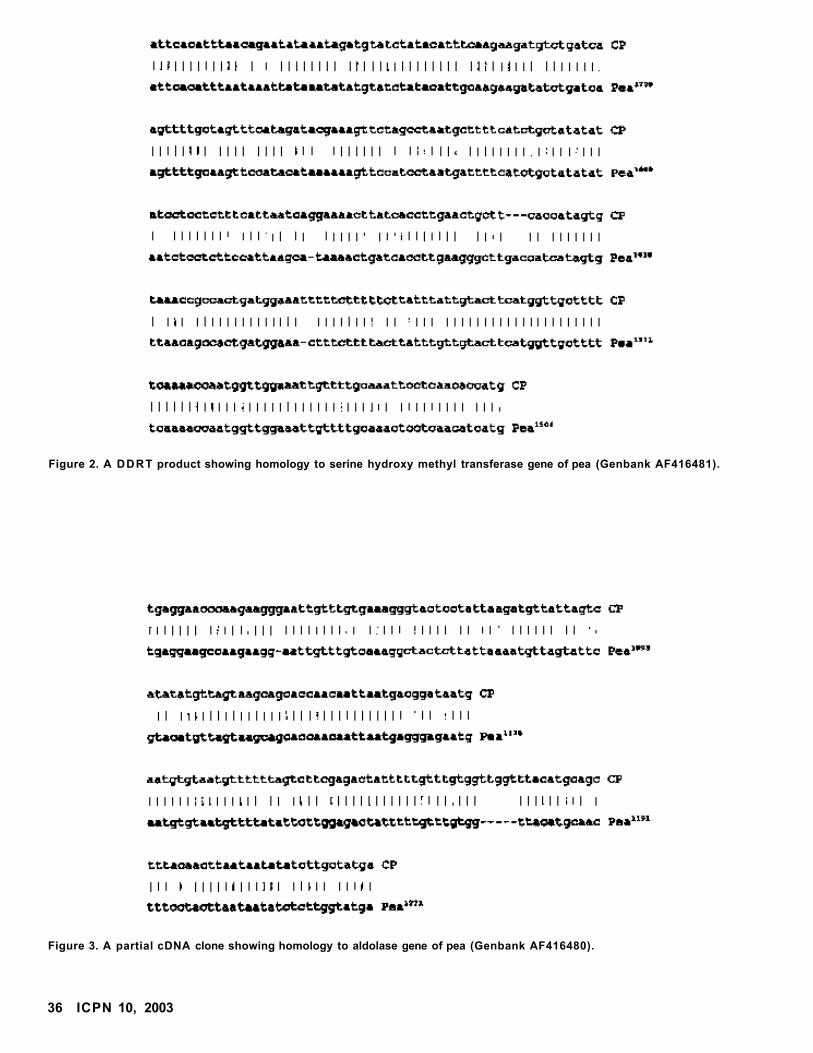
Figure 3. A partial cDNA clone showing homology to aldolase gene of pea (Genbank AF416480).
36 ICPN 10, 2003
Figure 2. A DDRT product showing homology to serine hydroxy methyl transferase gene of pea (Genbank AF416481).
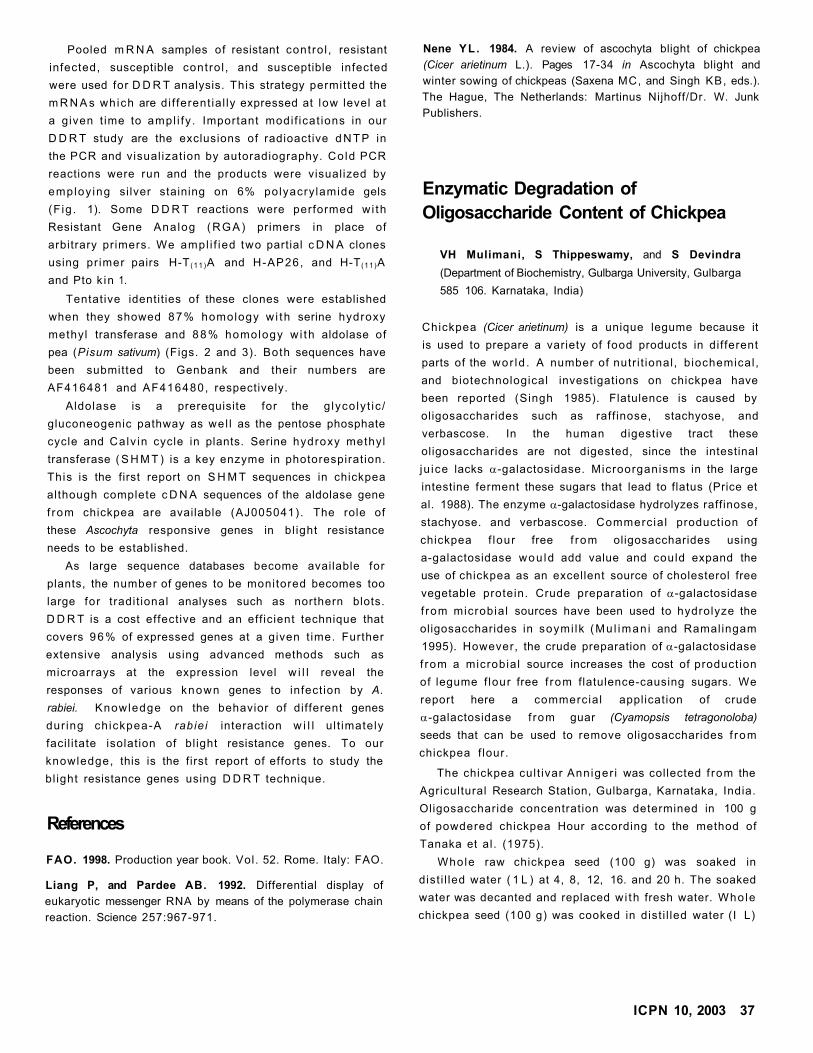
Pooled m R N A samples of resistant contro l , resistant
infected, susceptible contro l , and susceptible infected
were used for D D R T analysis. This strategy permitted the
m R N A s which are di f ferent ial ly expressed at low level at
a given t ime to ampl i fy . Important modi f icat ions in our
D D R T study are the exclusions of radioactive d N T P in
the PCR and visual izat ion by autoradiography. Co ld PCR
reactions were run and the products were visualized by
employ ing si lver staining on 6% polyacry lamide gels
(F ig . 1). Some D D R T reactions were performed wi th
Resistant Gene Analog ( R G A ) primers in place of
arbitrary primers. We ampl i f ied two partial c D N A clones
using pr imer pairs H-T (11)A and H-AP26, and H-T (11)A
and Pto k in 1.
Tentative identities of these clones were established
when they showed 87% homology w i th serine hydroxy
methyl transferase and 88% homology w i th aldolase of
pea (Pisum sativum) (Figs. 2 and 3). Both sequences have
been submitted to Genbank and their numbers are
AF416481 and AF416480, respectively.
Aldolase is a prerequisite for the g lyco ly t ic /
gluconeogenic pathway as wel l as the pentose phosphate
cycle and Calv in cycle in plants. Serine hydroxy methyl
transferase ( S H M T ) is a key enzyme in photorespirat ion.
This is the first report on S H M T sequences in chickpea
although complete c D N A sequences of the aldolase gene
f rom chickpea are available (AJ005041). The role of
these Ascochyta responsive genes in bl ight resistance
needs to be established.
As large sequence databases become available for
plants, the number of genes to be monitored becomes too
large for tradit ional analyses such as northern blots.
D D R T is a cost effective and an eff icient technique that
covers 96% of expressed genes at a given t ime. Further
extensive analysis using advanced methods such as
microarrays at the expression level w i l l reveal the
responses of various known genes to infect ion by A.
rabiei. Knowledge on the behavior of different genes
dur ing chickpea-A rabiei interaction w i l l u l t imately
facil i tate isolation of bl ight resistance genes. To our
knowledge, this is the first report of efforts to study the
bl ight resistance genes using D D R T technique.
References
FAO. 1998. Production year book. Vol. 52. Rome. Italy: FAO.
Liang P, and Pardee AB. 1992. Differential display of
eukaryotic messenger RNA by means of the polymerase chain
reaction. Science 257:967-971.
Nene YL. 1984. A review of ascochyta blight of chickpea
(Cicer arietinum L.). Pages 17-34 in Ascochyta blight and
winter sowing of chickpeas (Saxena MC, and Singh KB, eds.).
The Hague, The Netherlands: Martinus Nijhoff/Dr. W. Junk
Publishers.
Enzymatic Degradation of
Oligosaccharide Content of Chickpea
VH Mulimani, S Thippeswamy, and S Devindra
(Department of Biochemistry, Gulbarga University, Gulbarga
585 106. Karnataka, India)
Chickpea (Cicer arietinum) is a unique legume because it
is used to prepare a variety of food products in different
parts of the wor ld . A number of nutr i t ional, b iochemical ,
and biotechnological investigations on chickpea have
been reported (Singh 1985). Flatulence is caused by
oligosaccharides such as raff inose, stachyose, and
verbascose. In the human digestive tract these
oligosaccharides are not digested, since the intestinal
ju ice lacks a-galactosidase. Microorganisms in the large
intestine ferment these sugars that lead to flatus (Price et
al. 1988). The enzyme a-galactosidase hydrolyzes raffinose,
stachyose. and verbascose. Commercia l production of
chickpea f lour free f rom oligosaccharides using
a-galactosidase wou ld add value and could expand the
use of chickpea as an excellent source of cholesterol free
vegetable protein. Crude preparation of a-galactosidase
f rom microbial sources have been used to hydrolyze the
oligosaccharides in soymi lk (Mu l iman i and Ramalingam
1995). However, the crude preparation of a-galactosidase
f rom a microbial source increases the cost of product ion
of legume f lour free f rom flatulence-causing sugars. We
report here a commercial application of crude
a-galactosidase f rom guar (Cyamopsis tetragonoloba)
seeds that can be used to remove oligosaccharides f rom
chickpea f lour.
The chickpea cult ivar Anniger i was collected f rom the
Agricultural Research Station, Gulbarga, Karnataka, India.
Oligosaccharide concentration was determined in 100 g
of powdered chickpea Hour according to the method of
Tanaka et al. (1975).
Whole raw chickpea seed (100 g) was soaked in
dist i l led water ( 1 L ) at 4, 8, 12, 16. and 20 h. The soaked
water was decanted and replaced w i th fresh water. Whole
chickpea seed (100 g) was cooked in dist i l led water (I L)
ICPN 10, 2003 37
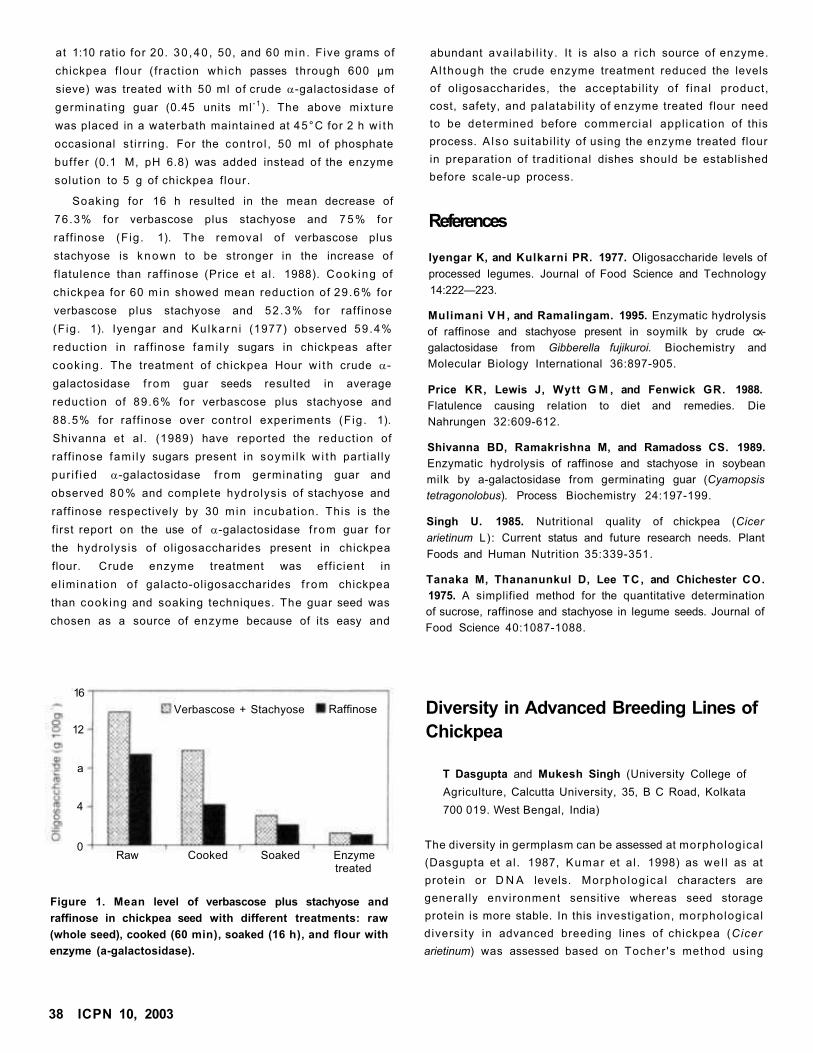
at 1:10 rat io for 20. 30 ,40 , 50, and 60 m in . Five grams of
chickpea f lour ( f ract ion which passes through 600 µm
sieve) was treated w i th 50 ml of crude a-galactosidase of
germinat ing guar (0.45 units ml - 1) . The above mixture
was placed in a waterbath maintained at 45°C for 2 h w i th
occasional st i rr ing. For the contro l , 50 ml of phosphate
buffer (0.1 M, pH 6.8) was added instead of the enzyme
solut ion to 5 g of chickpea f lour.
Soaking for 16 h resulted in the mean decrease of
76.3% for verbascose plus stachyose and 7 5 % for
raff inose (F ig. 1). The removal of verbascose plus
stachyose is known to be stronger in the increase of
f latulence than raff inose (Price et al. 1988). Cook ing of
chickpea for 60 m in showed mean reduction of 29.6% for
verbascose plus stachyose and 52 .3% for raff inose
(Fig. 1). Iyengar and Ku lkarn i (1977) observed 59.4%
reduction in raff inose fami ly sugars in chickpeas after
cook ing. The treatment of chickpea Hour w i th crude a-
galactosidase f rom guar seeds resulted in average
reduction of 89.6% for verbascose plus stachyose and
88.5% for raff inose over control experiments (F ig . 1).
Shivanna et al. (1989) have reported the reduction of
raff inose fami ly sugars present in soymi lk w i th part ial ly
pur i f ied a-galactosidase f rom germinat ing guar and
observed 8 0 % and complete hydrolysis of stachyose and
raffinose respectively by 30 min incubat ion. This is the
first report on the use of a-galactosidase f rom guar for
the hydrolysis of oligosaccharides present in chickpea
flour. Crude enzyme treatment was eff ic ient in
e l iminat ion of galacto-oligosaccharides f rom chickpea
than cooking and soaking techniques. The guar seed was
chosen as a source of enzyme because of its easy and
Figure 1. Mean level of verbascose plus stachyose and
raffinose in chickpea seed with different treatments: raw
(whole seed), cooked (60 min), soaked (16 h), and flour with
enzyme (a-galactosidase).
abundant avai labi l i ty . It is also a r ich source of enzyme.
A l though the crude enzyme treatment reduced the levels
of oligosaccharides, the acceptabil i ty of f inal product,
cost, safety, and palatabi l i ty of enzyme treated flour need
to be determined before commercial appl icat ion of this
process. A lso suitabi l i ty of using the enzyme treated f lour
in preparation of tradit ional dishes should be established
before scale-up process.
References
Iyengar K, and Kulkarni PR. 1977. Oligosaccharide levels of
processed legumes. Journal of Food Science and Technology
14:222—223.
Mulimani V H , and Ramalingam. 1995. Enzymatic hydrolysis
of raffinose and stachyose present in soymilk by crude cx-
galactosidase from Gibberella fujikuroi. Biochemistry and
Molecular Biology International 36:897-905.
Price KR, Lewis J, Wytt G M , and Fenwick GR. 1988.
Flatulence causing relation to diet and remedies. Die
Nahrungen 32:609-612.
Shivanna BD, Ramakrishna M, and Ramadoss CS. 1989.
Enzymatic hydrolysis of raffinose and stachyose in soybean
milk by a-galactosidase from germinating guar (Cyamopsis
tetragonolobus). Process Biochemistry 24:197-199.
Singh U. 1985. Nutritional quality of chickpea (Cicer
arietinum L): Current status and future research needs. Plant
Foods and Human Nutrition 35:339-351.
Tanaka M, Thananunkul D, Lee TC , and Chichester CO.
1975. A simplified method for the quantitative determination
of sucrose, raffinose and stachyose in legume seeds. Journal of
Food Science 40:1087-1088.
Diversity in Advanced Breeding Lines of
Chickpea
T Dasgupta and Mukesh Singh (University College of
Agriculture, Calcutta University, 35, B C Road, Kolkata
700 019. West Bengal, India)
The diversity in germplasm can be assessed at morphological
(Dasgupta et al. 1987, Kumar et al . 1998) as we l l as at
protein or D N A levels. Morpholog ica l characters are
generally environment sensitive whereas seed storage
protein is more stable. In this investigation, morphological
diversi ty in advanced breeding lines of chickpea (Cicer
arietinum) was assessed based on Tocher 's method using
38 ICPN 10, 2003
16
12
a
4
0Raw Cooked Soaked Enzyme
treated
Verbascose + Stachyose Raffinose
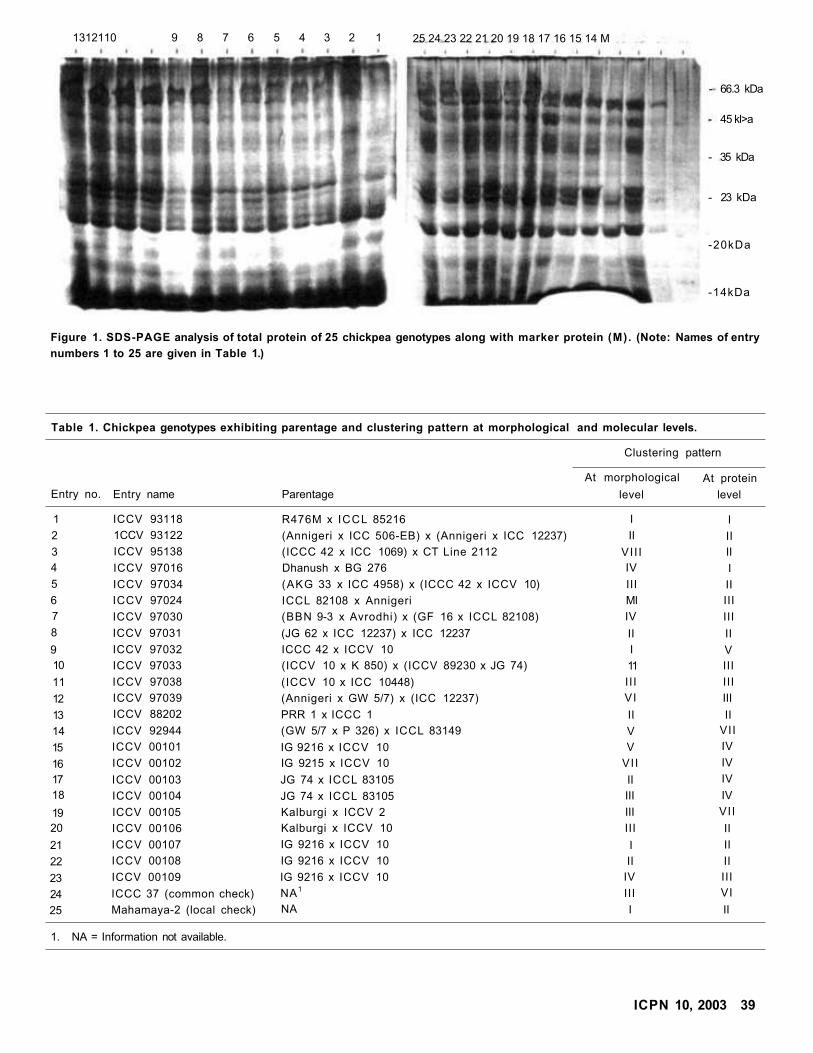
Figure 1. SDS-PAGE analysis of total protein of 25 chickpea genotypes along with marker protein (M). (Note: Names of entry
numbers 1 to 25 are given in Table 1.)
Table 1. Chickpea genotypes exhibiting parentage and clustering pattern at morphological and molecular levels.
Clustering pattern
At morphological At protein
Entry no. Entry name Parentage level level
1 ICCV 93118 R476M x ICCL 85216 I I
2 1CCV 93122 (Annigeri x ICC 506-EB) x (Annigeri x ICC 12237) II II
3 ICCV 95138 (ICCC 42 x ICC 1069) x CT Line 2112 VII I II
4 ICCV 97016 Dhanush x BG 276 IV I
5 ICCV 97034 (AKG 33 x ICC 4958) x (ICCC 42 x ICCV 10) III II
6 ICCV 97024 ICCL 82108 x Annigeri Ml III
7 ICCV 97030 (BBN 9-3 x Avrodhi) x (GF 16 x ICCL 82108) IV III
8 ICCV 97031 (JG 62 x ICC 12237) x ICC 12237 II II
9 ICCV 97032 ICCC 42 x ICCV 10 I V
10 ICCV 97033 (ICCV 10 x K 850) x (ICCV 89230 x JG 74) 11 III
11 ICCV 97038 (ICCV 10 x ICC 10448) III III
12 ICCV 97039 (Annigeri x GW 5/7) x (ICC 12237) VI III
13 ICCV 88202 PRR 1 x ICCC 1 II II
14 ICCV 92944 (GW 5/7 x P 326) x ICCL 83149 V VII
15 ICCV 00101 IG 9216 x ICCV 10 V IV
16 ICCV 00102 IG 9215 x ICCV 10 VII IV
17 ICCV 00103 JG 74 x ICCL 83105 II IV
18 ICCV 00104 JG 74 x ICCL 83105 III IV
19 ICCV 00105 Kalburgi x ICCV 2 III VII
20 ICCV 00106 Kalburgi x ICCV 10 III II
21 ICCV 00107 IG 9216 x ICCV 10 I II
22 ICCV 00108 IG 9216 x ICCV 10 II II
23 ICCV 00109 IG 9216 x ICCV 10 IV III
24 ICCC 37 (common check) NA1 III VI
25 Mahamaya-2 (local check) NA I II
1. NA = Information not available.
ICPN 10, 2003 39
- 66.3 kDa
- 45 kl>a
- 35 kDa
- 23 kDa
-20kDa
-14kDa
25 24 23 22 21 20 19 18 17 16 15 14 M 1312110 9 8 7 6 5 4 3 2 1
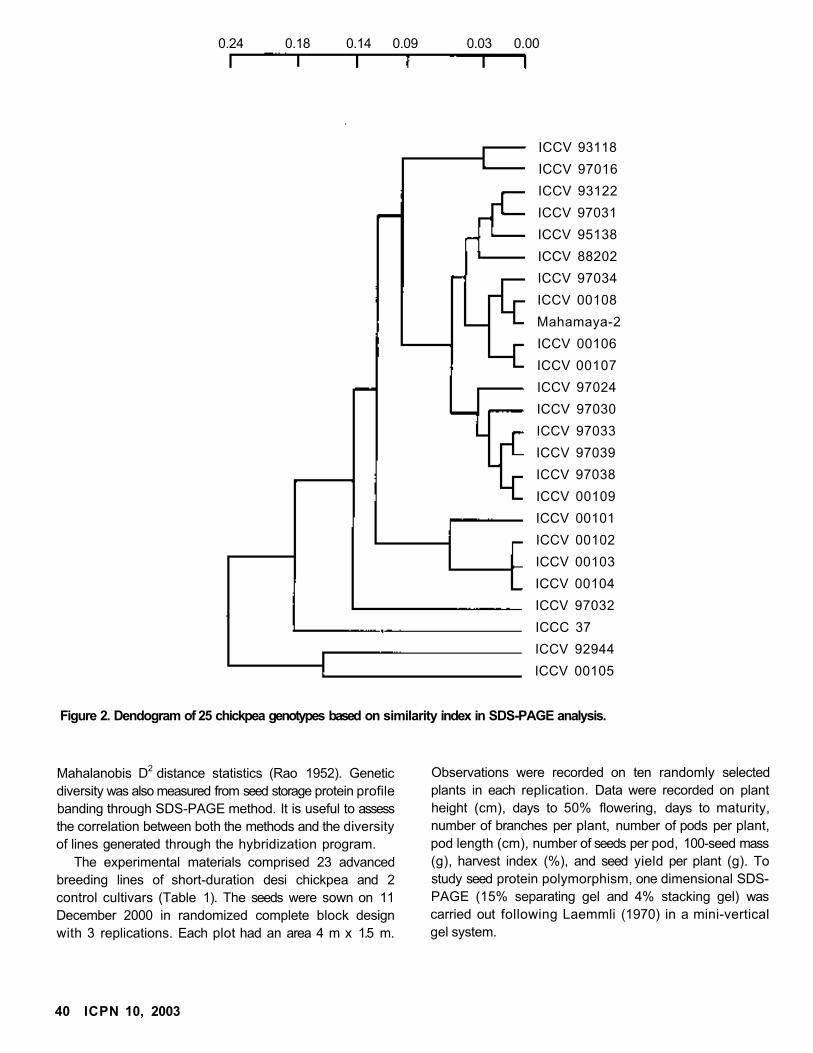
Mahalanobis D2 distance statistics (Rao 1952). Genetic
diversity was also measured from seed storage protein profile
banding through SDS-PAGE method. It is useful to assess
the correlation between both the methods and the diversity
of lines generated through the hybridization program.
The experimental materials comprised 23 advanced
breeding lines of short-duration desi chickpea and 2
control cultivars (Table 1). The seeds were sown on 11
December 2000 in randomized complete block design
with 3 replications. Each plot had an area 4 m x 1.5 m.
Observations were recorded on ten randomly selected
plants in each replication. Data were recorded on plant
height (cm), days to 50% flowering, days to maturity,
number of branches per plant, number of pods per plant,
pod length (cm), number of seeds per pod, 100-seed mass
(g), harvest index (%), and seed yield per plant (g). To
study seed protein polymorphism, one dimensional SDS-
PAGE (15% separating gel and 4% stacking gel) was
carried out following Laemmli (1970) in a mini-vertical
gel system.
40 ICPN 10, 2003
Figure 2. Dendogram of 25 chickpea genotypes based on similarity index in SDS-PAGE analysis.
ICCV 93118
ICCV 97016
ICCV 93122
ICCV 97031
ICCV 95138
ICCV 88202
ICCV 97034
ICCV 00108
Mahamaya-2
ICCV 00106
ICCV 00107
ICCV 97024
ICCV 97030
ICCV 97033
ICCV 97039
ICCV 97038
ICCV 00109
ICCV 00101
ICCV 00102
ICCV 00103
ICCV 00104
ICCV 97032
ICCC 37
ICCV 92944
ICCV 00105
0.24 0.18 0.14 0.09 0.03 0.00
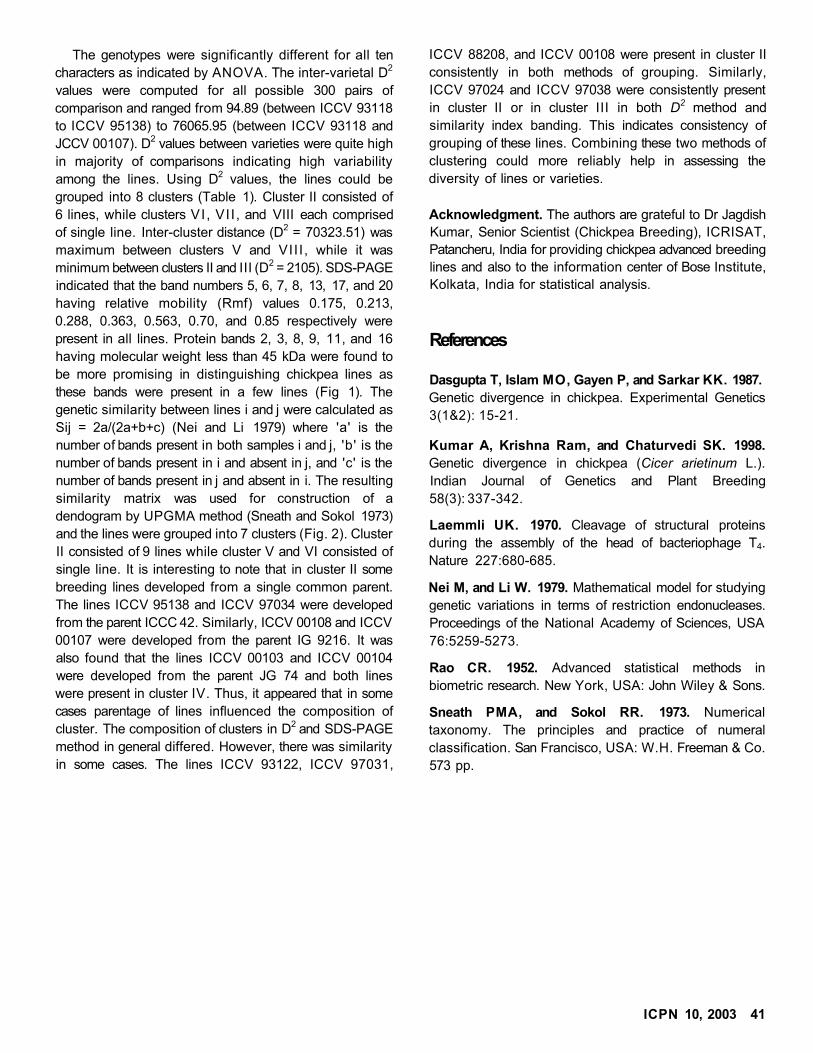
The genotypes were significantly different for all ten
characters as indicated by ANOVA. The inter-varietal D2
values were computed for all possible 300 pairs of
comparison and ranged from 94.89 (between ICCV 93118
to ICCV 95138) to 76065.95 (between ICCV 93118 and
JCCV 00107). D2 values between varieties were quite high
in majority of comparisons indicating high variability
among the lines. Using D2 values, the lines could be
grouped into 8 clusters (Table 1). Cluster II consisted of
6 lines, while clusters VI , VI I , and VIII each comprised
of single line. Inter-cluster distance (D2 = 70323.51) was
maximum between clusters V and VII I , while it was
minimum between clusters II and III (D2 = 2105). SDS-PAGE
indicated that the band numbers 5, 6, 7, 8, 13, 17, and 20
having relative mobility (Rmf) values 0.175, 0.213,
0.288, 0.363, 0.563, 0.70, and 0.85 respectively were
present in all lines. Protein bands 2, 3, 8, 9, 11, and 16
having molecular weight less than 45 kDa were found to
be more promising in distinguishing chickpea lines as
these bands were present in a few lines (Fig 1). The
genetic similarity between lines i and j were calculated as
Sij = 2a/(2a+b+c) (Nei and Li 1979) where 'a' is the
number of bands present in both samples i and j, 'b' is the
number of bands present in i and absent in j, and 'c' is the
number of bands present in j and absent in i. The resulting
similarity matrix was used for construction of a
dendogram by UPGMA method (Sneath and Sokol 1973)
and the lines were grouped into 7 clusters (Fig. 2). Cluster
II consisted of 9 lines while cluster V and VI consisted of
single line. It is interesting to note that in cluster II some
breeding lines developed from a single common parent.
The lines ICCV 95138 and ICCV 97034 were developed
from the parent ICCC 42. Similarly, ICCV 00108 and ICCV
00107 were developed from the parent IG 9216. It was
also found that the lines ICCV 00103 and ICCV 00104
were developed from the parent JG 74 and both lines
were present in cluster IV. Thus, it appeared that in some
cases parentage of lines influenced the composition of
cluster. The composition of clusters in D2 and SDS-PAGE
method in general differed. However, there was similarity
in some cases. The lines ICCV 93122, ICCV 97031,
ICCV 88208, and ICCV 00108 were present in cluster II
consistently in both methods of grouping. Similarly,
ICCV 97024 and ICCV 97038 were consistently present
in cluster II or in cluster III in both D2 method and
similarity index banding. This indicates consistency of
grouping of these lines. Combining these two methods of
clustering could more reliably help in assessing the
diversity of lines or varieties.
Acknowledgment. The authors are grateful to Dr Jagdish
Kumar, Senior Scientist (Chickpea Breeding), ICRISAT,
Patancheru, India for providing chickpea advanced breeding
lines and also to the information center of Bose Institute,
Kolkata, India for statistical analysis.
References
Dasgupta T, Islam MO, Gayen P, and Sarkar KK. 1987.
Genetic divergence in chickpea. Experimental Genetics
3(1&2): 15-21.
Kumar A, Krishna Ram, and Chaturvedi SK. 1998.
Genetic divergence in chickpea (Cicer arietinum L.).
Indian Journal of Genetics and Plant Breeding
58(3): 337-342.
Laemmli UK. 1970. Cleavage of structural proteins
during the assembly of the head of bacteriophage T4.
Nature 227:680-685.
Nei M, and Li W. 1979. Mathematical model for studying
genetic variations in terms of restriction endonucleases.
Proceedings of the National Academy of Sciences, USA
76:5259-5273.
Rao CR. 1952. Advanced statistical methods in
biometric research. New York, USA: John Wiley & Sons.
Sneath PMA, and Sokol RR. 1973. Numerical
taxonomy. The principles and practice of numeral
classification. San Francisco, USA: W.H. Freeman & Co.
573 pp.
ICPN 10, 2003 41
Pigeonpea
Breeding
BRG 1: A High-yielding and Bold-seeded
Pigeonpea Variety for Dhal and
Vegetable Purpose
M Byre Gowda, M Saifulla, CS Jagadeesh Babu,
BC Shankaralingappa, and P Mahadevu (All India
Co-ordinated Research Project on Pigeonpea, University
of Agricultural Sciences, GKVK Campus, Bangalore
560 065, Karnataka. India)
Pigeonpea (Cajanus cajan) seeds can be used as dhal
(dry split decorticated seed) or as a green vegetable. For
green vegetable, pods are harvested when the seeds attain
physiological maturity, i.e., when the seed accumulates
most of its dry matter. Vegetable pigeonpea variety
should have large pods and seeds for easy shelling. The
Table 1. Seed yield of pigeonpea genotypes B R G 1 and
Hy 3C at Bangalore, India .
Seed y ie ld
Year1
B R G 1
(kg ha-1)
Hy 3C
(kg ha-1)
Increase (%)
over Hy 3C
1997/98
1998/99
1999/00
2001/02
Mean
916
1654
1076
2048
1423
900
1419
928
1825
1268
1.8
16.6
15.9
12.2
12.2
1. Data not avai lable for 2000/01.
Table 2. Green pod yield of pigeonpea genotypes BRG 1
and Hy 3C at different pickings at Bangalore, India.
Pod yield
Harvest
B R G 1
(kg ha-1)
Hy 3C
(kg ha-1)
Increase (%)
over Hy 3C
1st picking
2nd picking
3rd picking
Total
1182
1778
1278
4238
1381
1238
397
3016
-16.8
43.6
221.9
40.5
42 ICPN 10, 2003
seeds should be sweet and tender to meet the requirement
of the consumers (Faris and Singh 1990).
In recent years, farmers around towns and cities of
southern Karnataka, India have started growing
vegetable pigeonpea for local markets, where the demand
is high. Hy 3C, a bold-seeded variety released in 1976 is
being grown in these areas to meet the requirement of the
consumers. However, this variety is susceptible to
Helicoverpa pod borer infestation and phyllody disease.
BRG 1, a new high-yielding and bold-seeded vegetable
type, has been developed recently at Gandhi Krishi
Vignana Kendra ( G K V K ) Campus, University of
Agricultural Sciences, Bangalore, Karnataka (Fig. 1). This
variety was developed by pedigree method from the
segregating material of a cross between Hy 3C and local
vegetable type, collected from the farmers' fields at
Chemachanahalli in Devanahalli taluka, Karnataka. BRG 1
was tested for its performance in state multilocation trials
from 1997/98 to 2001/02 (AICPIP 1998, 1999, 2000,
2002). BRG 1 produced a mean dry seed yield of 1423 kg
ha-1, 12.2% more than the control cultivar Hy 3C (1268
kg ha-1) (Table 1). During 2001/02, it produced a mean
green pod yield of 4238 kg ha-1 , 40.5% more than Hy 3C
(Table 2).
Figure 1. New vegetable pigeonpea variety BRG 1.
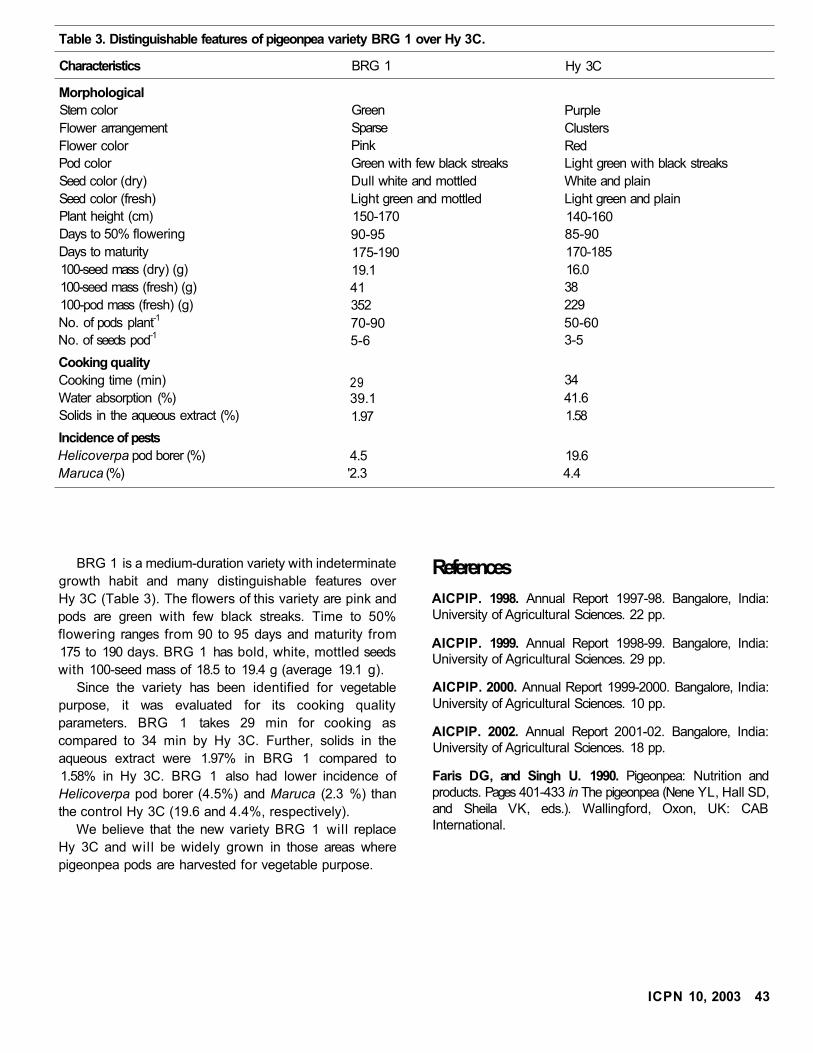
Table 3. Distinguishable features of pigeonpea variety BRG 1 over Hy 3C.
Characteristics BRG 1 Hy 3C
Morphological
Stem color Green Purple
Flower arrangement Sparse Clusters
Flower color Pink Red
Pod color Green with few black streaks Light green with black streaks
Seed color (dry) Dull white and mottled White and plain
Seed color (fresh) Light green and mottled Light green and plain
Plant height (cm) 150-170 140-160
Days to 50% flowering 90-95 85-90
Days to maturity 175-190 170-185
100-seed mass (dry) (g) 19.1 16.0
100-seed mass (fresh) (g) 41 38
100-pod mass (fresh) (g) 352 229
No. of pods plant-1 70-90 50-60
No. of seeds pod-15-6 3-5
Cooking quality
Cooking time (min) 29 34
Water absorption (%) 39.1 41.6
Solids in the aqueous extract (%) 1.97 1.58
Incidence of pests
Helicoverpa pod borer (%) 4.5 19.6
Maruca (%) '2.3 4.4
BRG 1 is a medium-duration variety with indeterminate
growth habit and many distinguishable features over
Hy 3C (Table 3). The flowers of this variety are pink and
pods are green with few black streaks. Time to 50%
flowering ranges from 90 to 95 days and maturity from
175 to 190 days. BRG 1 has bold, white, mottled seeds
with 100-seed mass of 18.5 to 19.4 g (average 19.1 g).
Since the variety has been identified for vegetable
purpose, it was evaluated for its cooking quality
parameters. BRG 1 takes 29 min for cooking as
compared to 34 min by Hy 3C. Further, solids in the
aqueous extract were 1.97% in BRG 1 compared to
1.58% in Hy 3C. BRG 1 also had lower incidence of
Helicoverpa pod borer (4.5%) and Maruca (2.3 %) than
the control Hy 3C (19.6 and 4.4%, respectively).
We believe that the new variety BRG 1 will replace
Hy 3C and will be widely grown in those areas where
pigeonpea pods are harvested for vegetable purpose.
References
AICPIP. 1998. Annual Report 1997-98. Bangalore, India:University of Agricultural Sciences. 22 pp.
AICPIP. 1999. Annual Report 1998-99. Bangalore, India:University of Agricultural Sciences. 29 pp.
AICPIP. 2000. Annual Report 1999-2000. Bangalore, India:University of Agricultural Sciences. 10 pp.
AICPIP. 2002. Annual Report 2001-02. Bangalore, India:University of Agricultural Sciences. 18 pp.
Faris DG, and Singh U. 1990. Pigeonpea: Nutrition andproducts. Pages 401-433 in The pigeonpea (Nene YL, Hall SD,and Sheila VK, eds.). Wallingford, Oxon, UK: CABInternational.
ICPN 10, 2003 43
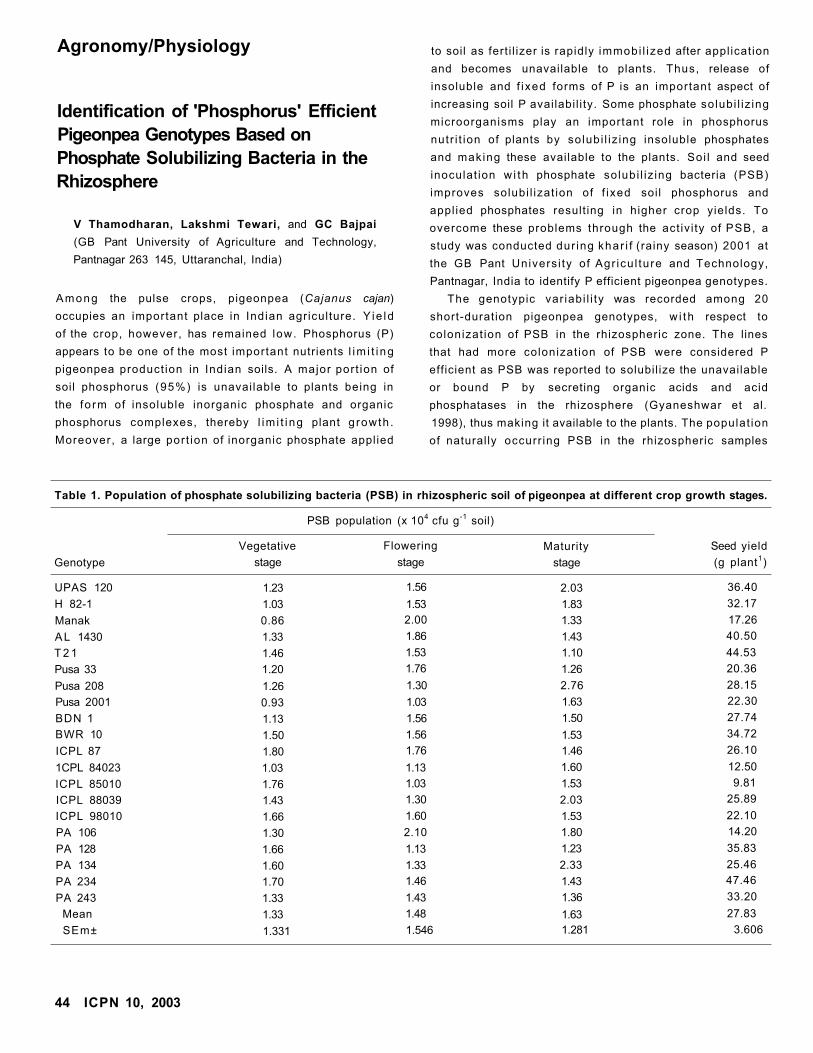
Agronomy/Physiology
Identification of 'Phosphorus' Efficient
Pigeonpea Genotypes Based on
Phosphate Solubilizing Bacteria in the
Rhizosphere
V Thamodharan, Lakshmi Tewari, and GC Bajpai
(GB Pant University of Agriculture and Technology,
Pantnagar 263 145, Uttaranchal, India)
Among the pulse crops, pigeonpea (Cajanus cajan)
occupies an important place in Indian agriculture. Y ie ld
of the crop, however, has remained low. Phosphorus (P)
appears to be one of the most important nutrients l im i t i ng
pigeonpea product ion in Indian soils. A major por t ion of
soil phosphorus (95%) is unavailable to plants being in
the fo rm of insoluble inorganic phosphate and organic
phosphorus complexes, thereby l im i t i ng plant g rowth .
Moreover, a large port ion of inorganic phosphate applied
to soil as fert i l izer is rapidly immobi l ized after appl icat ion
and becomes unavailable to plants. Thus, release of
insoluble and f ixed forms of P is an important aspect of
increasing soil P availabi l i ty. Some phosphate solubi l iz ing
microorganisms play an important role in phosphorus
nutr i t ion of plants by solubi l iz ing insoluble phosphates
and making these available to the plants. Soi l and seed
inoculat ion w i th phosphate solubi l iz ing bacteria (PSB)
improves solubi l izat ion of f ixed soil phosphorus and
appl ied phosphates result ing in higher crop yields. To
overcome these problems through the act iv i ty of PSB, a
study was conducted dur ing khar i f (rainy season) 2001 at
the GB Pant Univers i ty of Agr icu l ture and Technology,
Pantnagar, India to identify P efficient pigeonpea genotypes.
The genotypic var iabi l i ty was recorded among 20
short-duration pigeonpea genotypes, w i th respect to
colonizat ion of PSB in the rhizospheric zone. The lines
that had more colonizat ion of PSB were considered P
efficient as PSB was reported to solubil ize the unavailable
or bound P by secreting organic acids and acid
phosphatases in the rhizosphere (Gyaneshwar et al.
1998), thus making it available to the plants. The populat ion
of naturally occurr ing PSB in the rhizospheric samples
Table 1. Population of phosphate solubilizing bacteria (PSB) in rhizospheric soil of pigeonpea at different crop growth stages.
PSB population (x 104 cfu g-1 soil)
Vegetative Flowering Maturity Seed yield
Genotype stage stage stage (g plant1)
UPAS 120 1.23 1.56 2.03 36.40
H 82-1 1.03 1.53 1.83 32.17
Manak 0.86 2.00 1.33 17.26
AL 1430 1.33 1.86 1.43 40.50
T 2 1 1.46 1.53 1.10 44.53
Pusa 33 1.20 1.76 1.26 20.36
Pusa 208 1.26 1.30 2.76 28.15
Pusa 2001 0.93 1.03 1.63 22.30
BDN 1 1.13 1.56 1.50 27.74
BWR 10 1.50 1.56 1.53 34.72
ICPL 87 1.80 1.76 1.46 26.10
1CPL 84023 1.03 1.13 1.60 12.50
ICPL 85010 1.76 1.03 1.53 9.81
ICPL 88039 1.43 1.30 2.03 25.89
ICPL 98010 1.66 1.60 1.53 22.10
PA 106 1.30 2.10 1.80 14.20
PA 128 1.66 1.13 1.23 35.83
PA 134 1.60 1.33 2.33 25.46
PA 234 1.70 1.46 1.43 47.46
PA 243 1.33 1.43 1.36 33.20
Mean 1.33 1.48 1.63 27.83
SEm± 1.331 1.546 1.281 3.606
44 ICPN 10, 2003
were determined by counting the number of colonies with
clear transparent zone on Pikovskaya's agar medium and
the colony forming units (cfu) g-1 of rhizospheric soil
were estimated (Sundara Rao and Sinha 1963). There was
neither an external application of P nor PSB inoculation
in the experiment. PSB population in the rhizosphere was
determined at the vegetative, flowering, and maturity stages.
Analysis of variance for PSB population showed
significant differences among the pigeonpea genotypes
(Table 1). Plant species differ in the efficiency with
which they acquire and utilize nutrients. The results of
absolute PSB count and yield were consistently high in
the determinate genotype ICPL 87 and indeterminate
genotype BWR 10 and PA 243. High yield as well as
increasing trend of PSB population from vegetative to
maturity stage were observed in UPAS 120 (1.23 x 10⁴ to
2.03 x 10⁴ cfu g-1 soil), H 82-1 (1.03 x 10⁴ to 1.83 x 10⁴
cfu g-1 soil), and Pusa 208 (1.26 x 10⁴ to 2.76 x 10⁴ cfu g-1
soil). High yield and near stable trend of PSB count in all
the growth stages were noted in PA 234 and AL 1430.
Pigeonpea cultivars were studied for native PSB isolate
for the first time and no conclusion regarding high PSB
population at all the growth stages and yield could be
drawn in the investigation as its relative role changed
with the genotype.
At vegetative stage, PSB count showed significant
correlation with 100-seed mass (0.85, 0.55) and plant
height (0.67, 0.45) at genotypic and phenotypic levels,
respectively. Seed yield (0.51) had significant relationship
at genotypic level only. At flowering stage, only pod
length (-0.53) showed significant correlation at genotypic
level. None of the yield traits showed significant correlation
with PSB at maturity stage. The low magnitude of association
between PSB and yield traits suggests that probably
simple correlation does not account for such complex
interrelationship.
In conclusion, results of this study revealed that the
interactions between PSB and crop plants are complex
and this may be affected by genotype, crop growth stage,
and environment. The study is based on limited genotypes
tested at a single location for one year; therefore, further
investigation is required.
References
Gyancshwar P, Kumar GN, and Pareekh LJ. 1998. Effect ofbuffering in the phosphate solubilizing ability of microorganism.World Journal of Microbiology and Biotechnology 14:669-673.
Sundara Rao WVB, and Sinha MK. 1963. Phosphatedissolving organisms in the soil and rhi7.osphere. Indian Journalof Agricultural Sciences 33(4):272-278.
Pathology
Evaluation of Pigeonpea Genotypes to
Root-knot Nematode Meloidogyne
incognita
Abdul Hamid Wani1 and M Mashkoor Alam
2 (1 . PG
Department of Botany, Kashmir University, Srinagar
190 006, Jammu & Kashmir, India; 2. Department of
Botany, Aligarh Muslim University, Aligarh 202 002,
Uttar Pradesh, India)
Pigeonpea (Cajanus cajan), also known as red gram or
arhar, is a good source of protein and is one of the most
important pulse crops in India. The root-knot nematode
Meloidogyne incognita causes damage to pigeonpea crop
and reduces the yield. Therefore, we evaluated 14 pigeonpea
genotypes for resistance to M. incognita.
The genotypes which were used in this study were
obtained from the Directorate of Pulses Research,
Kalyanpur, Uttar Pradesh. India. About 4-5 seeds of each
genotype were sown in 15 cm diameter clay pots containing
1 kg autoclaved soil-manure mixture in the ratio of 3:1.
Prior to sowing, seeds were treated with Rhizobium using
a 5% sucrose solution. When the seedlings were 20 days
old, they were inoculated with 3000 freshly hatched
second stage larvae or juveniles (J2) of M. incognita. For
obtaining .12, eggmasses of nematodes were picked from
the roots of tomato (Lycoperscion lyeopersicum) plants
grown in concrete culture beds. These eggmasses were
then placed in 7.5 cm diameter sieves of 1 mm pore size
and lined with double layer of tissue paper and placed in
10 cm diameter petri dishes containing water. The petri
dishes were left at room temperature (25 ± 1 °C) for three
days and thereafter water containing J2 that meanwhile
hatched out was collected. The number of J2 per unit
volume of the suspension was determined by counting
them with the help of counting dish under a stereoscopic
microscope. Appropriate amounts of J2 suspension were
added to the test plants by making holes in the soil around
the root system, so that each plant was inoculated with
3000 J2. There were five replications for each inoculated
and uninoculated genotypes. Uninoculated plants served
as control.
The plants were uprooted at 90 days after inoculation
and were assessed for root gall, plant mass, plant length,
and root nodulation. Roots and shoots were separated by
cutting and the total length and mass were determined.
ICPN 10, 2003 45
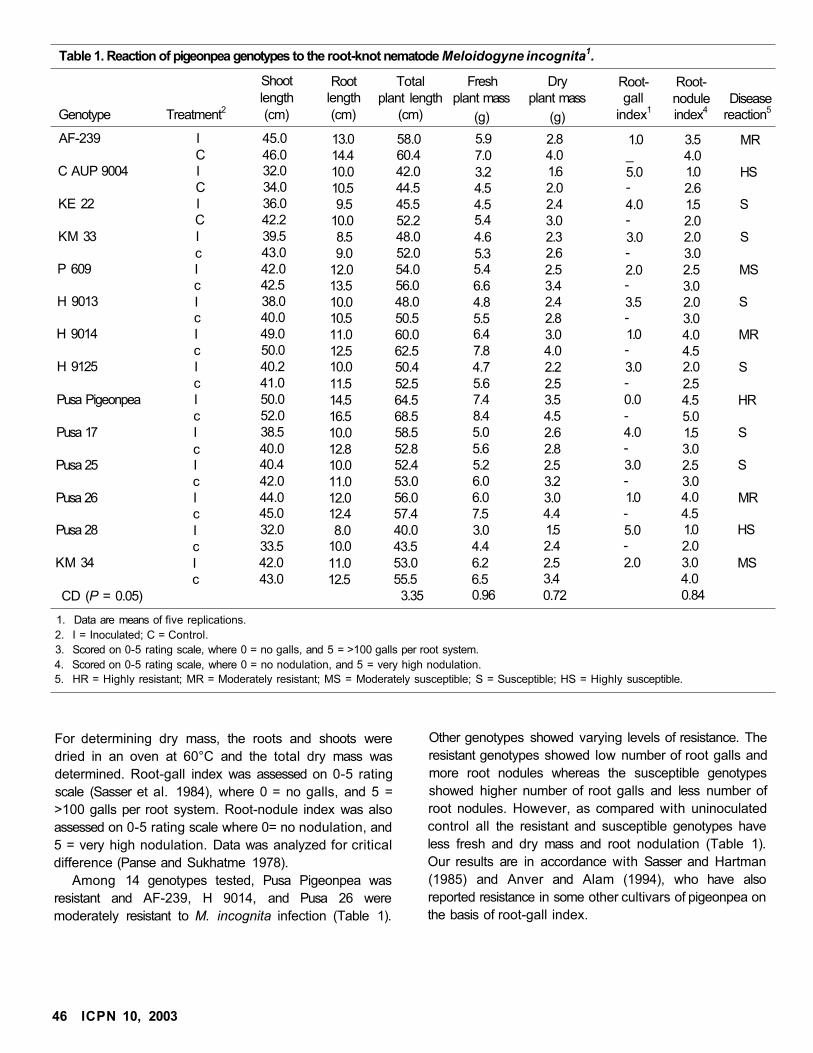
Table 1. Reaction of pigeonpea genotypes to the root-knot nematode Meloidogyne incognita1.
Shoot Root Total Fresh Dry Root- Root-length length plant length plant mass plant mass gall nodule Disease
Genotype Treatment2 (cm) (cm) (cm) (g) (g) index1 index4 reaction5
AF-239 I 45.0 13.0 58.0 5.9 2.8 1.0 3.5 MRC 46.0 14.4 60.4 7.0 4.0 _ 4.0
C AUP 9004 I 32.0 10.0 42.0 3.2 1.6 5.0 1.0 HSC 34.0 10.5 44.5 4.5 2.0 - 2.6
KE 22 I 36.0 9.5 45.5 4.5 2.4 4.0 1.5 SC 42.2 10.0 52.2 5.4 3.0 - 2.0
KM 33 I 39.5 8.5 48.0 4.6 2.3 3.0 2.0 Sc 43.0 9.0 52.0 5.3 2.6 - 3.0
P 609 I 42.0 12.0 54.0 5.4 2.5 2.0 2.5 MSc 42.5 13.5 56.0 6.6 3.4 - 3.0
H 9013 I 38.0 10.0 48.0 4.8 2.4 3.5 2.0 Sc 40.0 10.5 50.5 5.5 2.8 - 3.0
H 9014 I 49.0 11.0 60.0 6.4 3.0 1.0 4.0 MRc 50.0 12.5 62.5 7.8 4.0 - 4.5
H 9125 I 40.2 10.0 50.4 4.7 2.2 3.0 2.0 Sc 41.0 11.5 52.5 5.6 2.5 - 2.5
Pusa Pigeonpea I 50.0 14.5 64.5 7.4 3.5 0.0 4.5 HRc 52.0 16.5 68.5 8.4 4.5 - 5.0
Pusa 17 I 38.5 10.0 58.5 5.0 2.6 4.0 1.5 Sc 40.0 12.8 52.8 5.6 2.8 - 3.0
Pusa 25 I 40.4 10.0 52.4 5.2 2.5 3.0 2.5 Sc 42.0 11.0 53.0 6.0 3.2 - 3.0
Pusa 26 I 44.0 12.0 56.0 6.0 3.0 1.0 4.0 MRc 45.0 12.4 57.4 7.5 4.4 - 4.5
Pusa 28 I 32.0 8.0 40.0 3.0 1.5 5.0 1.0 HS
c 33.5 10.0 43.5 4.4 2.4 - 2.0KM 34 I 42.0 11.0 53.0 6.2 2.5 2.0 3.0 MS
c 43.0 12.5 55.5 6.5 3.4 4.0
CD (P = 0.05) 3.35 0.96 0.72 0.84
1. Data are means of five replications.
2. I = Inoculated; C = Control.
3. Scored on 0-5 rating scale, where 0 = no galls, and 5 = >100 galls per root system.
4. Scored on 0-5 rating scale, where 0 = no nodulation, and 5 = very high nodulation.
5. HR = Highly resistant; MR = Moderately resistant; MS = Moderately susceptible; S = Susceptible; HS = Highly susceptible.
For determining dry mass, the roots and shoots were
dried in an oven at 60°C and the total dry mass was
determined. Root-gall index was assessed on 0-5 rating
scale (Sasser et al. 1984), where 0 = no galls, and 5 =
>100 galls per root system. Root-nodule index was also
assessed on 0-5 rating scale where 0= no nodulation, and
5 = very high nodulation. Data was analyzed for critical
difference (Panse and Sukhatme 1978).
Among 14 genotypes tested, Pusa Pigeonpea was
resistant and AF-239, H 9014, and Pusa 26 were
moderately resistant to M. incognita infection (Table 1).
Other genotypes showed varying levels of resistance. The
resistant genotypes showed low number of root galls and
more root nodules whereas the susceptible genotypes
showed higher number of root galls and less number of
root nodules. However, as compared with uninoculated
control all the resistant and susceptible genotypes have
less fresh and dry mass and root nodulation (Table 1).
Our results are in accordance with Sasser and Hartman
(1985) and Anver and Alam (1994), who have also
reported resistance in some other cultivars of pigeonpea on
the basis of root-gall index.
46 ICPN 10, 2003
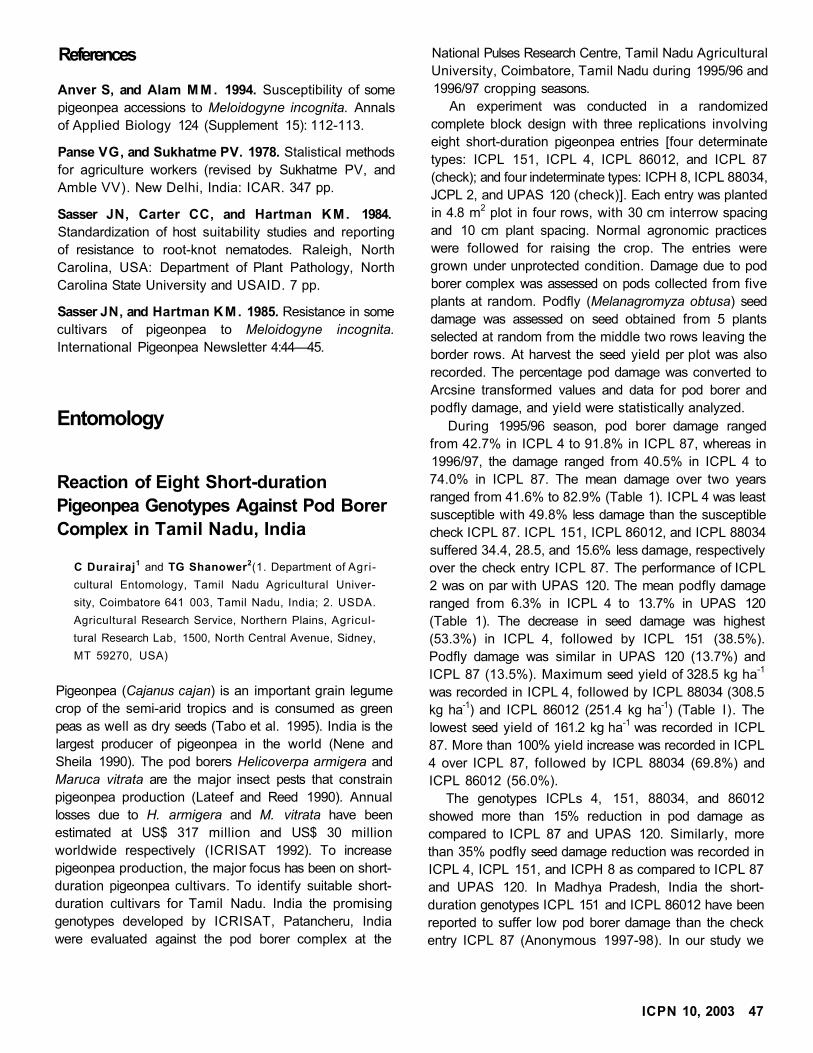
References
Anver S, and Alam M M . 1994. Susceptibility of some
pigeonpea accessions to Meloidogyne incognita. Annals
of Applied Biology 124 (Supplement 15): 112-113.
Panse VG, and Sukhatme PV. 1978. Stalistical methods
for agriculture workers (revised by Sukhatme PV, and
Amble VV). New Delhi, India: ICAR. 347 pp.
Sasser JN, Carter CC, and Hartman KM. 1984.
Standardization of host suitability studies and reporting
of resistance to root-knot nematodes. Raleigh, North
Carolina, USA: Department of Plant Pathology, North
Carolina State University and USAID. 7 pp.
Sasser JN, and Hartman KM. 1985. Resistance in some
cultivars of pigeonpea to Meloidogyne incognita.
International Pigeonpea Newsletter 4:44—45.
Entomology
Reaction of Eight Short-duration
Pigeonpea Genotypes Against Pod Borer
Complex in Tamil Nadu, India
C Durairaj1 and TG Shanower
2(1. Department of Agri
cultural Entomology, Tamil Nadu Agricultural Univer-
sity, Coimbatore 641 003, Tamil Nadu, India; 2. USDA.
Agricultural Research Service, Northern Plains, Agricul
tural Research Lab, 1500, North Central Avenue, Sidney,
MT 59270, USA)
Pigeonpea (Cajanus cajan) is an important grain legume
crop of the semi-arid tropics and is consumed as green
peas as well as dry seeds (Tabo et al. 1995). India is the
largest producer of pigeonpea in the world (Nene and
Sheila 1990). The pod borers Helicoverpa armigera and
Maruca vitrata are the major insect pests that constrain
pigeonpea production (Lateef and Reed 1990). Annual
losses due to H. armigera and M. vitrata have been
estimated at US$ 317 million and US$ 30 million
worldwide respectively (ICRISAT 1992). To increase
pigeonpea production, the major focus has been on short-
duration pigeonpea cultivars. To identify suitable short-
duration cultivars for Tamil Nadu. India the promising
genotypes developed by ICRISAT, Patancheru, India
were evaluated against the pod borer complex at the
National Pulses Research Centre, Tamil Nadu Agricultural
University, Coimbatore, Tamil Nadu during 1995/96 and
1996/97 cropping seasons.
An experiment was conducted in a randomized
complete block design with three replications involving
eight short-duration pigeonpea entries [four determinate
types: ICPL 151, ICPL 4, ICPL 86012, and ICPL 87
(check); and four indeterminate types: ICPH 8, ICPL 88034,
JCPL 2, and UPAS 120 (check)]. Each entry was planted
in 4.8 m2 plot in four rows, with 30 cm interrow spacing
and 10 cm plant spacing. Normal agronomic practices
were followed for raising the crop. The entries were
grown under unprotected condition. Damage due to pod
borer complex was assessed on pods collected from five
plants at random. Podfly (Melanagromyza obtusa) seed
damage was assessed on seed obtained from 5 plants
selected at random from the middle two rows leaving the
border rows. At harvest the seed yield per plot was also
recorded. The percentage pod damage was converted to
Arcsine transformed values and data for pod borer and
podfly damage, and yield were statistically analyzed.
During 1995/96 season, pod borer damage ranged
from 42.7% in ICPL 4 to 91.8% in ICPL 87, whereas in
1996/97, the damage ranged from 40.5% in ICPL 4 to
74.0% in ICPL 87. The mean damage over two years
ranged from 41.6% to 82.9% (Table 1). ICPL 4 was least
susceptible with 49.8% less damage than the susceptible
check ICPL 87. ICPL 151, ICPL 86012, and ICPL 88034
suffered 34.4, 28.5, and 15.6% less damage, respectively
over the check entry ICPL 87. The performance of ICPL
2 was on par with UPAS 120. The mean podfly damage
ranged from 6.3% in ICPL 4 to 13.7% in UPAS 120
(Table 1). The decrease in seed damage was highest
(53.3%) in ICPL 4, followed by ICPL 151 (38.5%).
Podfly damage was similar in UPAS 120 (13.7%) and
ICPL 87 (13.5%). Maximum seed yield of 328.5 kg ha-1
was recorded in ICPL 4, followed by ICPL 88034 (308.5
kg ha-1) and ICPL 86012 (251.4 kg ha-1) (Table I). The
lowest seed yield of 161.2 kg ha-1 was recorded in ICPL
87. More than 100% yield increase was recorded in ICPL
4 over ICPL 87, followed by ICPL 88034 (69.8%) and
ICPL 86012 (56.0%).
The genotypes ICPLs 4, 151, 88034, and 86012
showed more than 15% reduction in pod damage as
compared to ICPL 87 and UPAS 120. Similarly, more
than 35% podfly seed damage reduction was recorded in
ICPL 4, ICPL 151, and ICPH 8 as compared to ICPL 87
and UPAS 120. In Madhya Pradesh, India the short-
duration genotypes ICPL 151 and ICPL 86012 have been
reported to suffer low pod borer damage than the check
entry ICPL 87 (Anonymous 1997-98). In our study we
ICPN 10, 2003 47
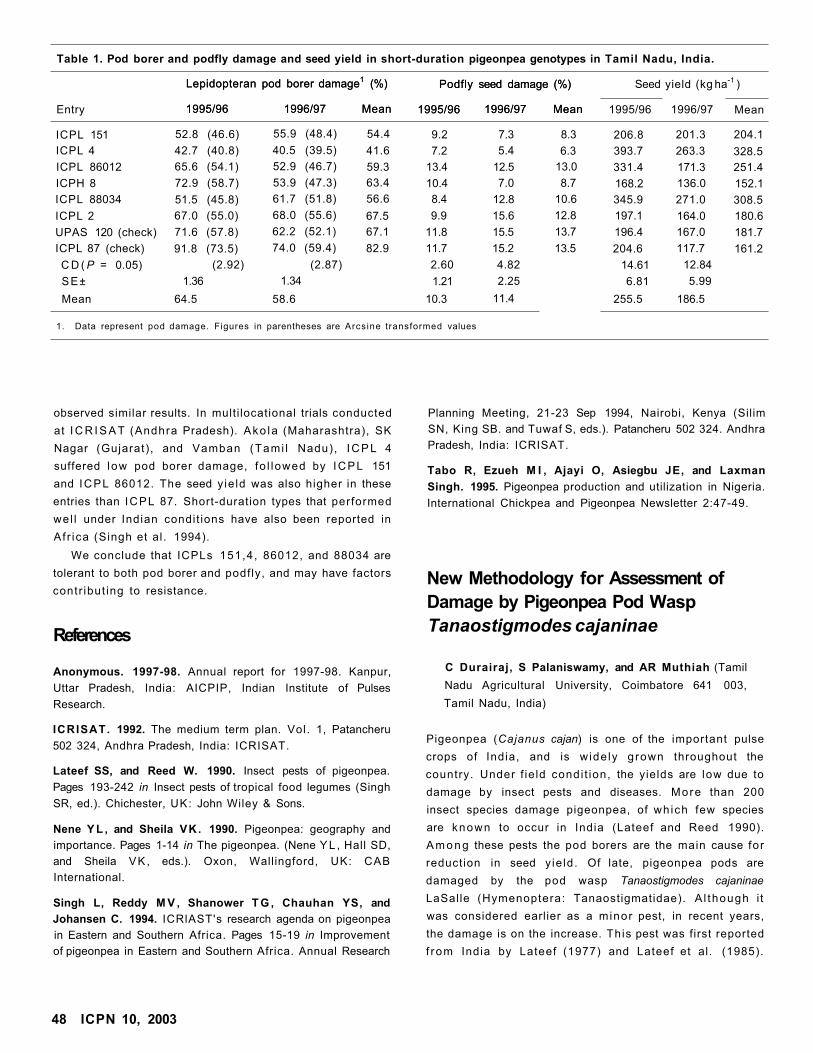
Table 1. Pod borer and podfly damage and seed yield in short-duration pigeonpea genotypes in Tamil Nadu, India.
Lepidopteran
1995/96
pod borer damage1 (%)
1996/97 Mean
Podfly
1995/96
seed damage (%)
1996/97 Mean
Seed yield (kg ha-1 )
Entry
Lepidopteran
1995/96
pod borer damage1 (%)
1996/97 Mean
Podfly
1995/96
seed damage (%)
1996/97 Mean 1995/96 1996/97 Mean
ICPL 151 52.8 (46.6) 55.9 (48.4) 54.4 9.2 7.3 8.3 206.8 201.3 204.1
ICPL 4 42.7 (40.8) 40.5 (39.5) 41.6 7.2 5.4 6.3 393.7 263.3 328.5
ICPL 86012 65.6 (54.1) 52.9 (46.7) 59.3 13.4 12.5 13.0 331.4 171.3 251.4
ICPH 8 72.9 (58.7) 53.9 (47.3) 63.4 10.4 7.0 8.7 168.2 136.0 152.1
ICPL 88034 51.5 (45.8) 61.7 (51.8) 56.6 8.4 12.8 10.6 345.9 271.0 308.5
ICPL 2 67.0 (55.0) 68.0 (55.6) 67.5 9.9 15.6 12.8 197.1 164.0 180.6
UPAS 120 (check) 71.6 (57.8) 62.2 (52.1) 67.1 11.8 15.5 13.7 196.4 167.0 181.7
ICPL 87 (check) 91.8 (73.5) 74.0 (59.4) 82.9 11.7 15.2 13.5 204.6 117.7 161.2
C D ( P = 0.05) (2.92) (2.87) 2.60 4.82 14.61 12.84
SE± 1.36 1.34 1.21 2.25 6.81 5.99
Mean 64.5 58.6 10.3 11.4 255.5 186.5
1. Data represent pod damage. Figures in parentheses are Arcsine transformed values
observed similar results. In multi locational trials conducted
at I C R I S A T (Andhra Pradesh). Ako la (Maharashtra), SK
Nagar (Gujarat), and Vamban (Tami l Nadu), I C P L 4
suffered low pod borer damage, fo l lowed by ICPL 151
and ICPL 86012. The seed y ie ld was also higher in these
entries than ICPL 87. Short-duration types that performed
wel l under Indian condit ions have also been reported in
Af r ica (Singh et al. 1994).
We conclude that ICPLs 151,4, 86012, and 88034 are
tolerant to both pod borer and podfly, and may have factors
contr ibut ing to resistance.
References
Planning Meeting, 21-23 Sep 1994, Nairobi, Kenya (Silim
SN, King SB. and Tuwaf S, eds.). Patancheru 502 324. Andhra
Pradesh, India: ICRISAT.
Tabo R, Ezueh M I , Ajayi O, Asiegbu JE, and Laxman
Singh. 1995. Pigeonpea production and utilization in Nigeria.
International Chickpea and Pigeonpea Newsletter 2:47-49.
New Methodology for Assessment of
Damage by Pigeonpea Pod Wasp
Tanaostigmodes cajaninae
Anonymous. 1997-98. Annual report for 1997-98. Kanpur,
Uttar Pradesh, India: AICPIP, Indian Institute of Pulses
Research.
ICRISAT. 1992. The medium term plan. Vol. 1, Patancheru
502 324, Andhra Pradesh, India: ICRISAT.
Lateef SS, and Reed W. 1990. Insect pests of pigeonpea.
Pages 193-242 in Insect pests of tropical food legumes (Singh
SR, ed.). Chichester, UK: John Wiley & Sons.
Nene Y L , and Sheila VK. 1990. Pigeonpea: geography and
importance. Pages 1-14 in The pigeonpea. (Nene Y L , Hall SD,
and Sheila VK, eds.). Oxon, Wallingford, UK: CAB
International.
Singh L, Reddy M V , Shanower T G , Chauhan YS, and
Johansen C. 1994. ICRlAST's research agenda on pigeonpea
in Eastern and Southern Africa. Pages 15-19 in Improvement
of pigeonpea in Eastern and Southern Africa. Annual Research
C Durairaj, S Palaniswamy, and AR Muthiah (Tamil
Nadu Agricultural University, Coimbatore 641 003,
Tamil Nadu, India)
Pigeonpea (Cajanus cajan) is one of the important pulse
crops of India, and is w ide ly grown throughout the
country. Under f ie ld condi t ion, the yields are low due to
damage by insect pests and diseases. More than 200
insect species damage pigeonpea, of wh ich few species
are known to occur in India (Lateef and Reed 1990).
A m o n g these pests the pod borers are the main cause for
reduction in seed y ie ld. Of late, pigeonpea pods are
damaged by the pod wasp Tanaostigmodes cajaninae
LaSalle (Hymenoptera: Tanaostigmatidae). A l though i t
was considered earlier as a minor pest, in recent years,
the damage is on the increase. This pest was first reported
f rom India by Lateef (1977) and Lateef et al. (1985).
48 ICPN 10, 2003
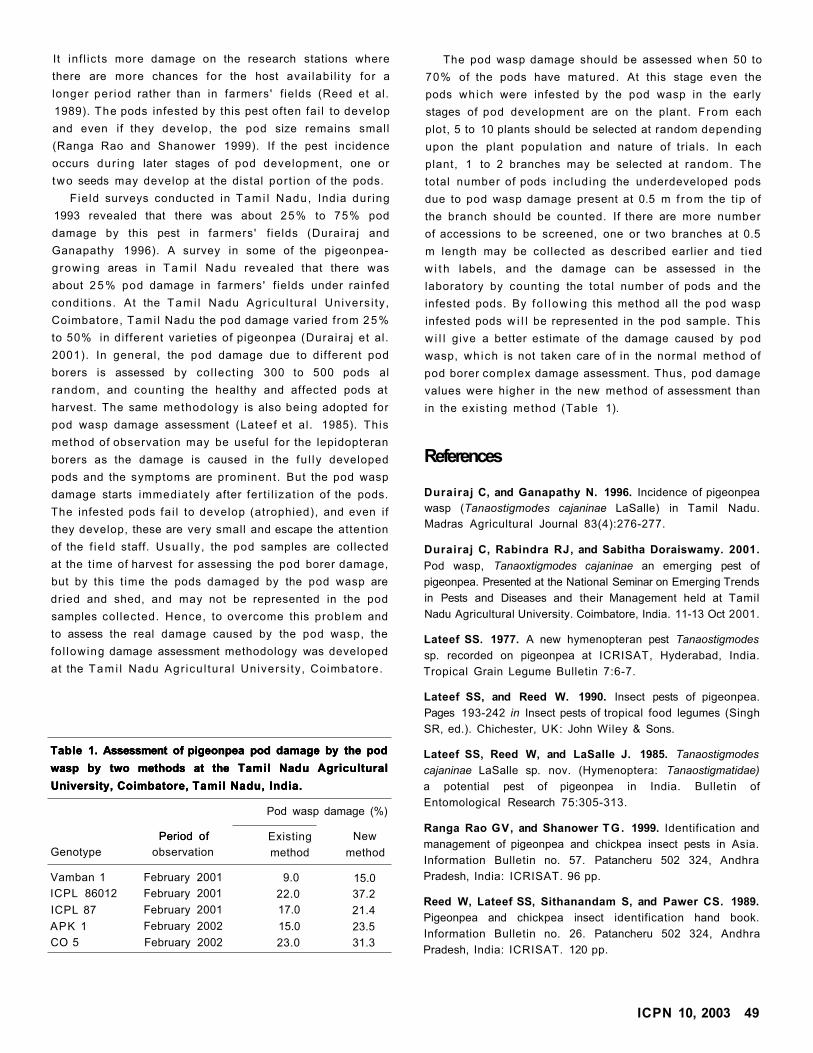
It inf l ic ts more damage on the research stations where
there are more chances for the host avai labi l i ty for a
longer per iod rather than in farmers' f ields (Reed et al.
1989). The pods infested by this pest often fa i l to develop
and even if they develop, the pod size remains small
(Ranga Rao and Shanower 1999). If the pest incidence
occurs dur ing later stages of pod development, one or
two seeds may develop at the distal port ion of the pods.
Fie ld surveys conducted in Tami l Nadu, India dur ing
1993 revealed that there was about 25% to 75% pod
damage by this pest in farmers' f ields (Durairaj and
Ganapathy 1996). A survey in some of the pigeonpea-
growing areas in Tam i l Nadu revealed that there was
about 2 5 % pod damage in farmers' f ields under rainfed
condit ions. At the Tami l Nadu Agr icu l tura l Univers i ty ,
Coimbatore, Tami l Nadu the pod damage varied f rom 25%
to 50% in dif ferent varieties of pigeonpea (Durairaj et al.
2001). In general, the pod damage due to different pod
borers is assessed by col lect ing 300 to 500 pods al
random, and count ing the healthy and affected pods at
harvest. The same methodology is also being adopted for
pod wasp damage assessment (Lateef et al. 1985). This
method of observation may be useful for the lepidopteran
borers as the damage is caused in the fu l ly developed
pods and the symptoms are prominent. But the pod wasp
damage starts immediately after fer t i l izat ion of the pods.
The infested pods fai l to develop (atrophied), and even if
they develop, these are very small and escape the attention
of the f ie ld staff. Usual ly , the pod samples are collected
at the t ime of harvest for assessing the pod borer damage,
but by this t ime the pods damaged by the pod wasp are
dried and shed, and may not be represented in the pod
samples col lected. Hence, to overcome this problem and
to assess the real damage caused by the pod wasp, the
fo l lowing damage assessment methodology was developed
at the Tami l Nadu Agr icu l tura l Univers i ty , Coimbatore.
Table 1. Assessment of pigeonpea pod damage by the pod
wasp by two methods at the Tamil Nadu Agricultural
University, Coimbatore, Tamil Nadu, India.
Table 1. Assessment of pigeonpea pod damage by the pod
wasp by two methods at the Tamil Nadu Agricultural
University, Coimbatore, Tamil Nadu, India.
Table 1. Assessment of pigeonpea pod damage by the pod
wasp by two methods at the Tamil Nadu Agricultural
University, Coimbatore, Tamil Nadu, India.
Period of
Pod wasp damage (%)
Period of Existing New
Genotype observation method method
Vamban 1 February 2001 9.0 15.0
ICPL 86012 February 2001 22.0 37.2
ICPL 87 February 2001 17.0 21.4
APK 1 February 2002 15.0 23.5
CO 5 February 2002 23.0 31.3
The pod wasp damage should be assessed when 50 to
70% of the pods have matured. At this stage even the
pods which were infested by the pod wasp in the early
stages of pod development are on the plant. From each
plot, 5 to 10 plants should be selected at random depending
upon the plant populat ion and nature of trials. In each
plant, 1 to 2 branches may be selected at random. The
total number of pods including the underdeveloped pods
due to pod wasp damage present at 0.5 m f rom the t ip of
the branch should be counted. If there are more number
of accessions to be screened, one or two branches at 0.5
m length may be collected as described earlier and t ied
w i t h labels, and the damage can be assessed in the
laboratory by count ing the total number of pods and the
infested pods. By fo l low ing this method all the pod wasp
infested pods w i l l be represented in the pod sample. This
w i l l give a better estimate of the damage caused by pod
wasp, wh ich is not taken care of in the normal method of
pod borer complex damage assessment. Thus, pod damage
values were higher in the new method of assessment than
in the exist ing method (Table 1).
References
Durairaj C, and Ganapathy N. 1996. Incidence of pigeonpea
wasp (Tanaostigmodes cajaninae LaSalle) in Tamil Nadu.
Madras Agricultural Journal 83(4):276-277.
Durairaj C, Rabindra RJ, and Sabitha Doraiswamy. 2001.
Pod wasp, Tanaoxtigmodes cajaninae an emerging pest of
pigeonpea. Presented at the National Seminar on Emerging Trends
in Pests and Diseases and their Management held at Tamil
Nadu Agricultural University. Coimbatore, India. 11-13 Oct 2001.
Lateef SS. 1977. A new hymenopteran pest Tanaostigmodes
sp. recorded on pigeonpea at ICRISAT, Hyderabad, India.
Tropical Grain Legume Bulletin 7:6-7.
Lateef SS, and Reed W. 1990. Insect pests of pigeonpea.
Pages 193-242 in Insect pests of tropical food legumes (Singh
SR, ed.). Chichester, UK: John Wiley & Sons.
Lateef SS, Reed W, and LaSalle J. 1985. Tanaostigmodes
cajaninae LaSalle sp. nov. (Hymenoptera: Tanaostigmatidae)
a potential pest of pigeonpea in India. Bulletin of
Entomological Research 75:305-313.
Ranga Rao GV, and Shanower TG. 1999. Identification and
management of pigeonpea and chickpea insect pests in Asia.
Information Bulletin no. 57. Patancheru 502 324, Andhra
Pradesh, India: ICRISAT. 96 pp.
Reed W, Lateef SS, Sithanandam S, and Pawer CS. 1989.
Pigeonpea and chickpea insect identification hand book.
Information Bulletin no. 26. Patancheru 502 324, Andhra
Pradesh, India: ICRISAT. 120 pp.
ICPN 10, 2003 49
Effect of Insecticides on Loss in Seed
Mass and Yield of Pigeonpea by Pod
Borer
Akhilesh Kumar1,2
and Paras Nath1 (1. Department of
Entomology and Agricultural Zoology, Institute of Agri
cultural Sciences, Banaras Hindu University (BHU),
Varanasi 22] 005, Uttar Pradesh, India; 2. Present Address:
Indian Institute of Vegetable Research (ICAR), 1, Gandhi
Nagar (Naria), PB No. 5002, PO BHU, Varanasi 221 005,
Uttar Pradesh, India)
Pigeonpea (Cajanus cajan) is attacked by more than 200
species of insect pests. A m o n g the various species of
insect pests of pigeonpea, the pod borers cause serious
damage in North India. At Varanasi, Uttar Pradesh, podf ly
(Melanagromyza obtusa) and pod borer (Helicoverpa
armigera) are the major pests of pigeonpea and result in
55.94%, 32.47%, and 19.19% loss in pods, seeds, and
seed mass, respectively (Kumar and Nath 2002). Insecticide
application is one of the most effect ive methods for
contro l l ing these pests. Therefore, we evaluated several
insecticides for their relative eff icacy to min imize the
losses due to pod borers in pigeonpea.
The experiments were conducted at the Agr icu l ture
Research Farm, Banaras Hindu University (BHU) , Varanasi
dur ing khar i f (rainy season) 1994 and 1995 to evaluate
the relative efficacy of synthetic insecticides in m in im iz ing
the losses by pod borer (H. armigera) and podf ly
(M. obtusa) on pigeonpea cul t ivar UPAS 120 and Bahar.
The insecticides such as monocrotophos 36 SL (0.04%),
fenvalerate 20 EC (0.02%), cypermethrin 25 EC (0.006%),
carbaryl 5 D (5.00%), deltamethrin 2.8 EC (0.004%),
endosulfan 35 EC (0.07%), and malathion 5 D (5.00%) were
applied in two dif ferent schedules. In the f irst schedule,
all the insecticides were applied only once at f lower ing
and pod format ion stage, whi le in the second schedule,
Table 1. Effect of insecticides on loss in pigeonpea seed mass and yield due to pod borer and podfly damage1.
Seed mass loss (%) (Bahar) Bahar
Seed yield (kg ha-1)
U P A s l 2 0Seed mass loss (%) (Bahar) Bahar
Seed yield (kg ha-1)
U P A s l 2 0
Insecticide Schedule 1 Schedule 2 Average Schedule 1 Schedule 2 Average Schedule 1 Schedule 2 Average
Monocrotophos 3.26 2.52 2.89 2323 2647 2485 1762 1893 1828
(0.04%) (10.67) (9.05) (9.86)
Fenvalerate 4.63 3.39 4.01 1938 2240 2090 1603 1655 1630
(0.02%) (12.37) (10.51) (11.44)
Cypermethrin 4.25 2.87 3.56 1979 2295 2137 1582 1715 1649
(0.006%) (11.87) (10.52) (11.19)
Carbaryl 5.32 4.56 4.94 1799 2096 1948 1380 1529 1455
(5.00%) (13.26) (12.17) (12.71)
Deltamethrin 4.93 4.20 4.57 1847 2154 2001 1440 1583 1512
(0.004%) (12.78) (11.75) (12.27)
Endosulfan 3.91 2.87 3.39 2120 2436 2292 1675 1830 1753
(0.07%) (11.35) (9.63) (10.49)
Malathion 6.00 4.99 5.50 1747 2024 1886 1356 1513 1434
(5.00%) (14.15) (12.84) (13.50)
Control 17.55
(24.73)
17.84
(24.97)
17.70
(24.85)
1323 1308 1316 963 996 979
Average 6.23
(13.90)
5.41
(12.68)
5.82
(13.29)
1884 2153 2019 1470 1589 1530
LSD for comparing (0.57) 28 32
insecticides (P = 0.05)
LSD for comparing (0.29) 14 16
schedules (P = 0.05)
LSD for comparing (0.82) 39 45
insecticides x schedules (P = 0.05)
1. Figures in parentheses are angular transformed values.
50 ICPN 10, 2003
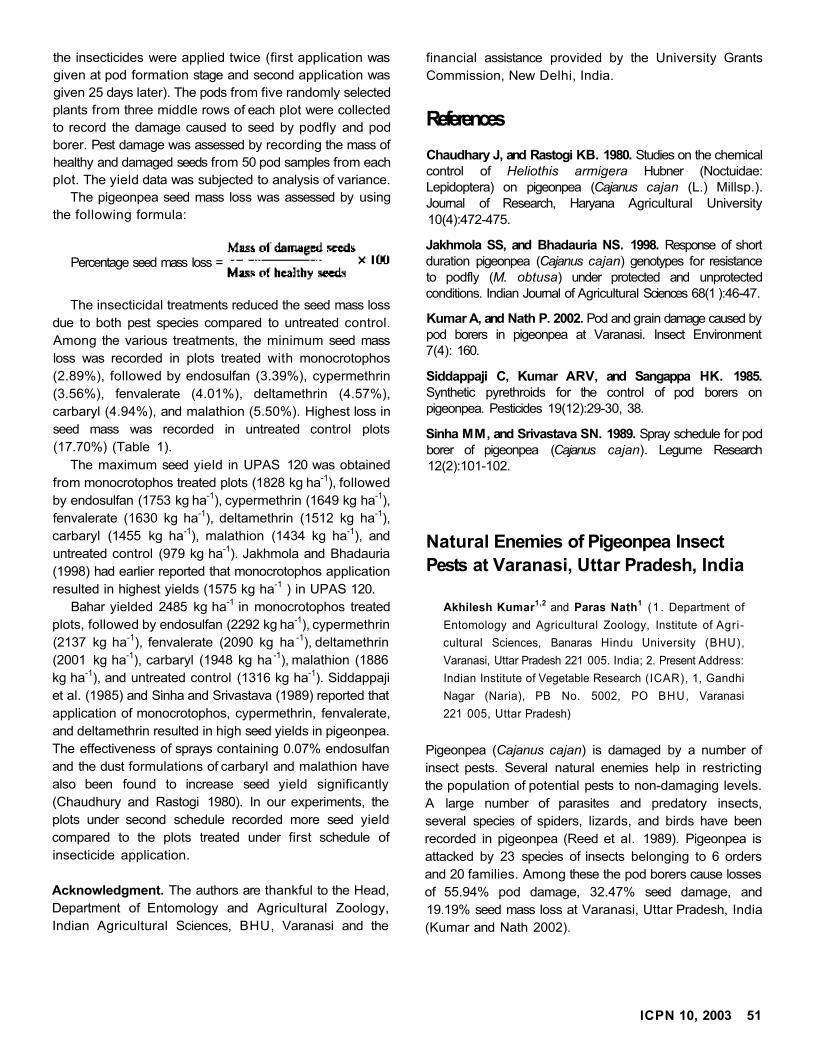
The insecticidal treatments reduced the seed mass loss
due to both pest species compared to untreated control.
Among the various treatments, the minimum seed mass
loss was recorded in plots treated with monocrotophos
(2.89%), followed by endosulfan (3.39%), cypermethrin
(3.56%), fenvalerate (4.01%), deltamethrin (4.57%),
carbaryl (4.94%), and malathion (5.50%). Highest loss in
seed mass was recorded in untreated control plots
(17.70%) (Table 1).
The maximum seed yield in UPAS 120 was obtained
from monocrotophos treated plots (1828 kg ha-1), followed
by endosulfan (1753 kg ha-1), cypermethrin (1649 kg ha-1),
fenvalerate (1630 kg ha-1), deltamethrin (1512 kg ha-1),
carbaryl (1455 kg ha-1), malathion (1434 kg ha-1), and
untreated control (979 kg ha-1). Jakhmola and Bhadauria
(1998) had earlier reported that monocrotophos application
resulted in highest yields (1575 kg ha-1 ) in UPAS 120.
Bahar yielded 2485 kg ha-1 in monocrotophos treated
plots, followed by endosulfan (2292 kg ha-1), cypermethrin
(2137 kg ha-1), fenvalerate (2090 kg ha -1), deltamethrin
(2001 kg ha-1), carbaryl (1948 kg ha -1), malathion (1886
kg ha-1), and untreated control (1316 kg ha-1). Siddappaji
et al. (1985) and Sinha and Srivastava (1989) reported that
application of monocrotophos, cypermethrin, fenvalerate,
and deltamethrin resulted in high seed yields in pigeonpea.
The effectiveness of sprays containing 0.07% endosulfan
and the dust formulations of carbaryl and malathion have
also been found to increase seed yield significantly
(Chaudhury and Rastogi 1980). In our experiments, the
plots under second schedule recorded more seed yield
compared to the plots treated under first schedule of
insecticide application.
Acknowledgment. The authors are thankful to the Head,
Department of Entomology and Agricultural Zoology,
Indian Agricultural Sciences, BHU, Varanasi and the
financial assistance provided by the University Grants
Commission, New Delhi, India.
References
Chaudhary J, and Rastogi KB. 1980. Studies on the chemicalcontrol of Heliothis armigera Hubner (Noctuidae:Lepidoptera) on pigeonpea (Cajanus cajan (L.) Millsp.).Journal of Research, Haryana Agricultural University
10(4):472-475.
Jakhmola SS, and Bhadauria NS. 1998. Response of shortduration pigeonpea (Cajanus cajan) genotypes for resistanceto podfly (M. obtusa) under protected and unprotectedconditions. Indian Journal of Agricultural Sciences 68(1 ):46-47.
Kumar A, and Nath P. 2002. Pod and grain damage caused bypod borers in pigeonpea at Varanasi. Insect Environment7(4): 160.
Siddappaji C, Kumar ARV, and Sangappa HK. 1985.
Synthetic pyrethroids for the control of pod borers onpigeonpea. Pesticides 19(12):29-30, 38.
Sinha MM, and Srivastava SN. 1989. Spray schedule for podborer of pigeonpea (Cajanus cajan). Legume Research12(2):101-102.
Natural Enemies of Pigeonpea Insect
Pests at Varanasi, Uttar Pradesh, India
Akhilesh Kumar1,2 and Paras Nath
1 (1 . Department of
Entomology and Agricultural Zoology, Institute of Agri
cultural Sciences, Banaras Hindu University (BHU),
Varanasi, Uttar Pradesh 221 005. India; 2. Present Address:
Indian Institute of Vegetable Research (ICAR), 1, Gandhi
Nagar (Naria), PB No. 5002, PO BHU, Varanasi
221 005, Uttar Pradesh)
Pigeonpea (Cajanus cajan) is damaged by a number of
insect pests. Several natural enemies help in restricting
the population of potential pests to non-damaging levels.
A large number of parasites and predatory insects,
several species of spiders, lizards, and birds have been
recorded in pigeonpea (Reed et al. 1989). Pigeonpea is
attacked by 23 species of insects belonging to 6 orders
and 20 families. Among these the pod borers cause losses
of 55.94% pod damage, 32.47% seed damage, and
19.19% seed mass loss at Varanasi, Uttar Pradesh, India
(Kumar and Nath 2002).
ICPN 10, 2003 51
Percentage seed mass loss =
the insecticides were applied twice (first application was
given at pod formation stage and second application was
given 25 days later). The pods from five randomly selected
plants from three middle rows of each plot were collected
to record the damage caused to seed by podfly and pod
borer. Pest damage was assessed by recording the mass of
healthy and damaged seeds from 50 pod samples from each
plot. The yield data was subjected to analysis of variance.
The pigeonpea seed mass loss was assessed by using
the following formula:
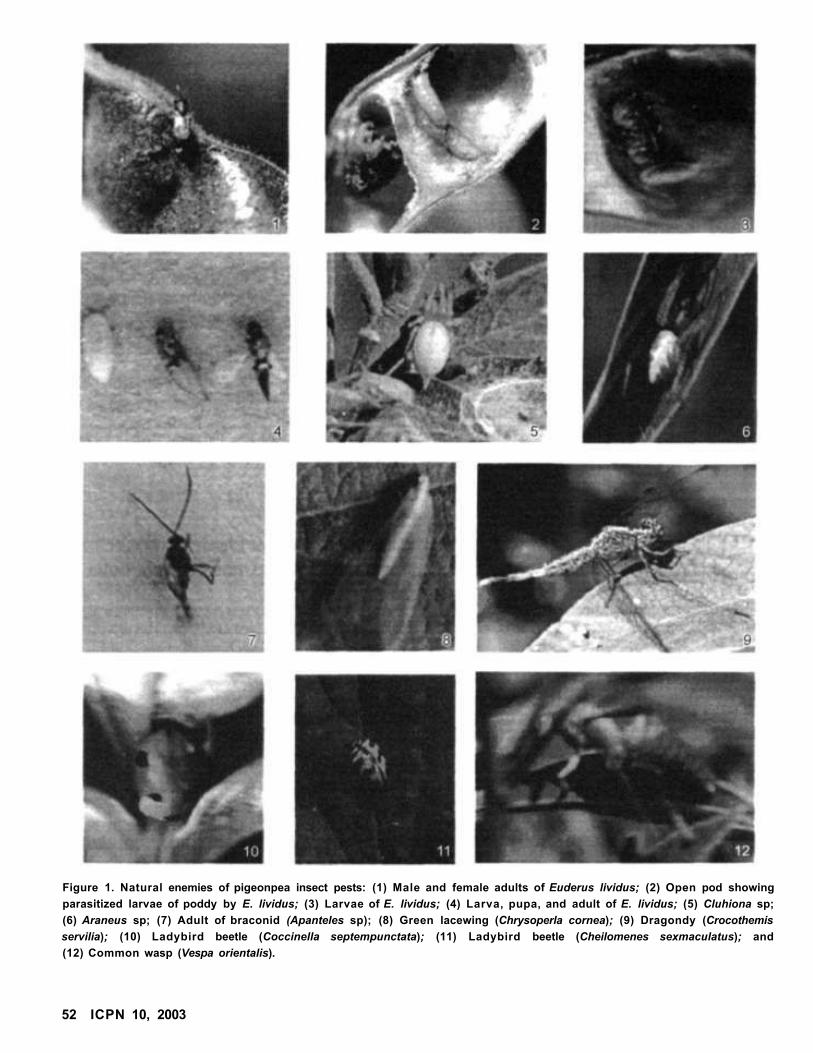
Figure 1. Natural enemies of pigeonpea insect pests: (1) Male and female adults of Euderus lividus; (2) Open pod showing
parasitized larvae of poddy by E. lividus; (3) Larvae of E. lividus; (4) Larva, pupa, and adult of E. lividus; (5) Cluhiona sp;
(6) Araneus sp; (7) Adult of braconid (Apanteles sp); (8) Green lacewing (Chrysoperla cornea); (9) Dragondy (Crocothemis
servilia); (10) Ladybird beetle (Coccinella septempunctata); (11) Ladybird beetle (Cheilomenes sexmaculatus); and
(12) Common wasp (Vespa orientalis).
52 ICPN 10, 2003
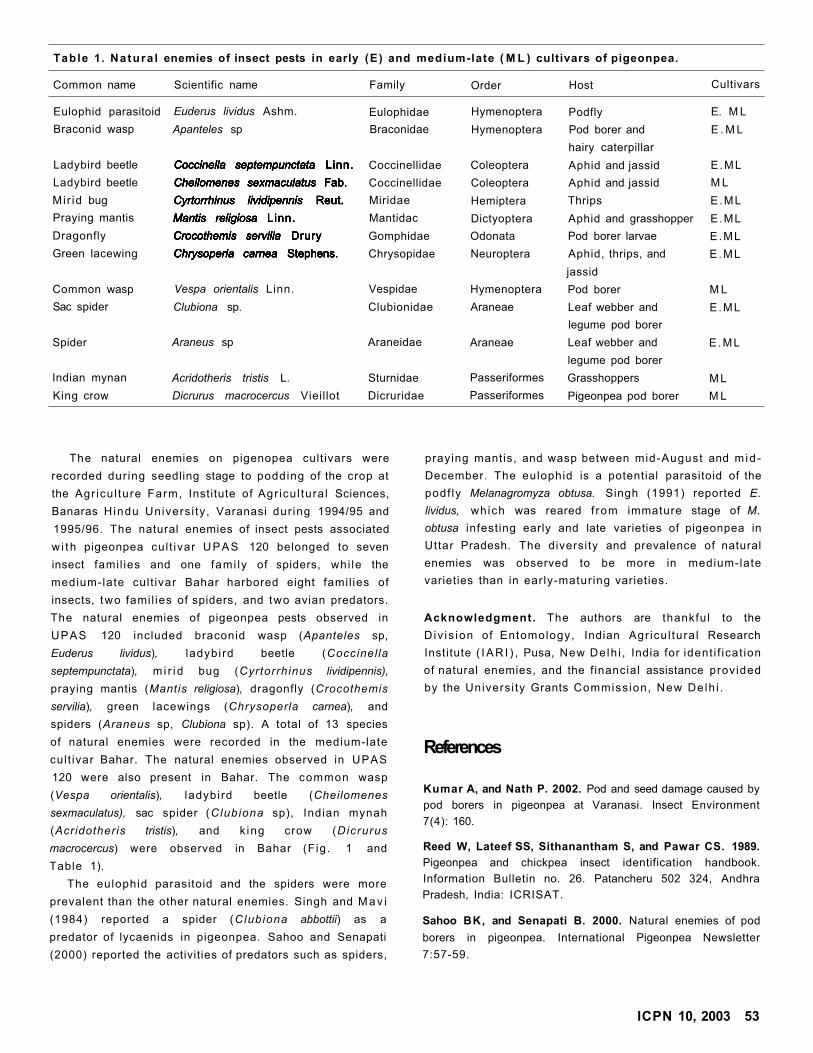
Table 1. Natura l enemies of insect pests in early (E) and medium-late ( M L ) cultivars of pigeonpea.
Common name Scientific name Family Order Host Cultivars
Eulophid parasitoid Euderus lividus Ashm. Eulophidae Hymenoptera Podfly E. M L
Braconid wasp Apanteles sp Braconidae Hymenoptera Pod borer and
hairy caterpillar
E . M L
Ladybird beetle Coccinella septempunctata Linn.
Cheilomenes sexmaculatus Fab.
Cyrtorrhinus lividipennis Reut.
Mantis religiosa Linn.
Crocothemis servilia Drury
Chrysoperla carnea Stephens.
Coccinellidae Coleoptera Aphid and jassid E .ML
Ladybird beetle
Coccinella septempunctata Linn.
Cheilomenes sexmaculatus Fab.
Cyrtorrhinus lividipennis Reut.
Mantis religiosa Linn.
Crocothemis servilia Drury
Chrysoperla carnea Stephens.
Coccinellidae Coleoptera Aphid and jassid M L
Mir id bug
Coccinella septempunctata Linn.
Cheilomenes sexmaculatus Fab.
Cyrtorrhinus lividipennis Reut.
Mantis religiosa Linn.
Crocothemis servilia Drury
Chrysoperla carnea Stephens.
Miridae Hemiptera Thrips E .ML
Praying mantis
Coccinella septempunctata Linn.
Cheilomenes sexmaculatus Fab.
Cyrtorrhinus lividipennis Reut.
Mantis religiosa Linn.
Crocothemis servilia Drury
Chrysoperla carnea Stephens.
Mantidac Dictyoptera Aphid and grasshopper E.ML
Dragonfly
Coccinella septempunctata Linn.
Cheilomenes sexmaculatus Fab.
Cyrtorrhinus lividipennis Reut.
Mantis religiosa Linn.
Crocothemis servilia Drury
Chrysoperla carnea Stephens.
Gomphidae Odonata Pod borer larvae E.ML
Green lacewing
Coccinella septempunctata Linn.
Cheilomenes sexmaculatus Fab.
Cyrtorrhinus lividipennis Reut.
Mantis religiosa Linn.
Crocothemis servilia Drury
Chrysoperla carnea Stephens. Chrysopidae Neuroptera Aphid, thrips, and E .ML
jassid
Common wasp Vespa orientalis Linn. Vespidae Hymenoptera Pod borer M L
Sac spider Clubiona sp. Clubionidae Araneae Leaf webber and
legume pod borer
E .ML
Spider Araneus sp Araneidae Araneae Leaf webber and
legume pod borer
E .ML
Indian mynan Acridotheris tristis L. Sturnidae Passeriformes Grasshoppers M L
King crow Dicrurus macrocercus Vieillot Dicruridae Passeriformes Pigeonpea pod borer M L
The natural enemies on pigenopea cult ivars were
recorded dur ing seedling stage to podding of the crop at
the Agr icu l ture Farm, Institute of Agr icu l tura l Sciences,
Banaras Hindu Univers i ty , Varanasi dur ing 1994/95 and
1995/96. The natural enemies of insect pests associated
w i th pigeonpea cul t ivar UPAS 120 belonged to seven
insect famil ies and one fami ly of spiders, whi le the
medium-late cult ivar Bahar harbored eight famil ies of
insects, two famil ies of spiders, and two avian predators.
The natural enemies of pigeonpea pests observed in
UPAS 120 included braconid wasp (Apanteles sp,
Euderus lividus), ladybird beetle (Coccinel la
septempunctata), m i r i d bug (Cyrtorrhinus lividipennis),
praying mantis (Mantis religiosa), dragonfly (Crocothemis
servilia), green lacewings (Chrysoperla carnea), and
spiders (Araneus sp, Clubiona sp). A total of 13 species
of natural enemies were recorded in the medium-late
cul t ivar Bahar. The natural enemies observed in UPAS
120 were also present in Bahar. The common wasp
(Vespa orientalis), ladybird beetle (Cheilomenes
sexmaculatus), sac spider (Clubiona sp), Indian mynah
(Acridotheris tristis), and k ing crow (Dicrurus
macrocercus) were observed in Bahar (Fig. 1 and
Table 1).
The eulophid parasitoid and the spiders were more
prevalent than the other natural enemies. Singh and M a v i
(1984) reported a spider (Clubiona abbottii) as a
predator of lycaenids in pigeonpea. Sahoo and Senapati
(2000) reported the activities of predators such as spiders,
praying mantis, and wasp between mid-August and m id -
December. The eulophid is a potential parasitoid of the
podf ly Melanagromyza obtusa. Singh (1991) reported E.
lividus, which was reared f rom immature stage of M.
obtusa infesting early and late varieties of pigeonpea in
Uttar Pradesh. The diversity and prevalence of natural
enemies was observed to be more in medium-late
varieties than in early-maturing varieties.
Acknowledgment. The authors are thankful to the
Div is ion of Entomology, Indian Agr icu l tura l Research
Institute ( IAR I ) , Pusa, New Delh i , India for ident i f icat ion
of natural enemies, and the f inancial assistance provided
by the Universi ty Grants Commiss ion, New Delh i .
References
Kumar A, and Nath P. 2002. Pod and seed damage caused by
pod borers in pigeonpea at Varanasi. Insect Environment
7(4): 160.
Reed W, Lateef SS, Sithanantham S, and Pawar CS. 1989.
Pigeonpea and chickpea insect identification handbook.
Information Bulletin no. 26. Patancheru 502 324, Andhra
Pradesh, India: ICRISAT.
Sahoo BK, and Senapati B. 2000. Natural enemies of pod
borers in pigeonpea. International Pigeonpea Newsletter
7:57-59.
ICPN 10, 2003 53
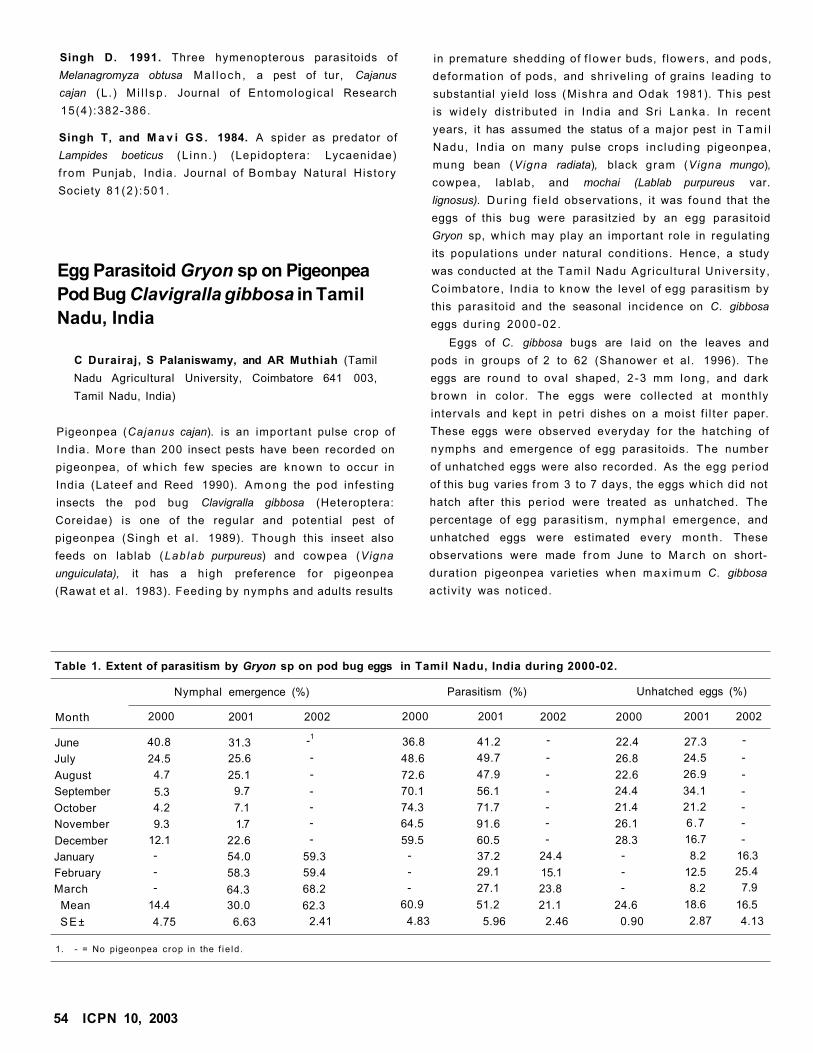
Singh D. 1991. Three hymenopterous parasitoids of
Melanagromyza obtusa Ma l loch , a pest of tur, Cajanus
cajan (L . ) M i l l sp . Journal of Entomological Research
15(4) :382-386.
Singh T, and M a v i GS . 1984. A spider as predator of
Lampides boeticus (L inn. ) (Lepidoptera: Lycaenidae)
f rom Punjab, India. Journal of Bombay Natural History
Society 81(2) :501.
Egg Parasitoid Gryon sp on Pigeonpea
Pod Bug Clavigralla gibbosa in Tamil
Nadu, India
C Durairaj, S Palaniswamy, and AR Muthiah (Tamil
Nadu Agricultural University, Coimbatore 641 003,
Tamil Nadu, India)
Pigeonpea (Cajanus cajan). is an important pulse crop of
India. More than 200 insect pests have been recorded on
pigeonpea, of wh ich few species are known to occur in
India (Lateef and Reed 1990). A m o n g the pod infesting
insects the pod bug Clavigralla gibbosa (Heteroptera:
Coreidae) is one of the regular and potential pest of
pigeonpea (Singh et al . 1989). Though this inseet also
feeds on lablab (Lablab purpureus) and cowpea (Vigna
unguiculata), it has a high preference for pigeonpea
(Rawat et al . 1983). Feeding by nymphs and adults results
in premature shedding of f lower buds, f lowers, and pods,
deformat ion of pods, and shr ivel ing of grains leading to
substantial y ie ld loss (Mishra and Odak 1981). This pest
is wide ly distr ibuted in India and Sri Lanka. In recent
years, it has assumed the status of a major pest in T a m i l
Nadu, India on many pulse crops inc luding pigeonpea,
mung bean (Vigna radiata), black gram (Vigna mungo),
cowpea, lablab, and mochai (Lablab purpureus var.
lignosus). Dur ing f ie ld observations, it was found that the
eggs of this bug were parasitzied by an egg parasitoid
Gryon sp, wh ich may play an important role in regulating
its populations under natural condit ions. Hence, a study
was conducted at the Tami l Nadu Agr icul tural Univers i ty ,
Coimbatore, India to know the level of egg parasitism by
this parasitoid and the seasonal incidence on C. gibbosa
eggs dur ing 2000-02.
Eggs of C. gibbosa bugs are laid on the leaves and
pods in groups of 2 to 62 (Shanower et al. 1996). The
eggs are round to oval shaped, 2 -3 mm long, and dark
brown in color. The eggs were col lected at month ly
intervals and kept in petri dishes on a moist f i l ter paper.
These eggs were observed everyday for the hatching of
nymphs and emergence of egg parasitoids. The number
of unhatched eggs were also recorded. As the egg per iod
of this bug varies f rom 3 to 7 days, the eggs wh ich did not
hatch after this period were treated as unhatched. The
percentage of egg parasit ism, nymphal emergence, and
unhatched eggs were estimated every month. These
observations were made f rom June to March on short-
durat ion pigeonpea varieties when max imum C. gibbosa
act iv i ty was noticed.
Table 1. Extent of parasitism by Gryon sp on pod bug eggs in Tamil Nadu, India during 2000-02.
Nymphal emergence (%) Parasitism (%) Unhatched eggs (%)
Month 2000 2001 2002 2000 2001 2002 2000 2001 2002
June 40.8 31.3 -136.8 41.2 - 22.4 27.3 -
July 24.5 25.6 - 48.6 49.7 - 26.8 24.5 -
August 4.7 25.1 - 72.6 47.9 - 22.6 26.9 -
September 5.3 9.7 - 70.1 56.1 - 24.4 34.1 -
October 4.2 7.1 - 74.3 71.7 - 21.4 21.2 -
November 9.3 1.7 - 64.5 91.6 - 26.1 6.7 -
December 12.1 22.6 - 59.5 60.5 - 28.3 16.7 -
January - 54.0 59.3 - 37.2 24.4 - 8.2 16.3
February - 58.3 59.4 - 29.1 15.1 - 12.5 25.4
March - 64.3 68.2 - 27.1 23.8 - 8.2 7.9
Mean 14.4 30.0 62.3 60.9 51.2 21.1 24.6 18.6 16.5
SE± 4.75 6.63 2.41 4.83 5.96 2.46 0.90 2.87 4.13
1. - = No pigeonpea crop in the f ie ld .
54 ICPN 10, 2003
The result of this study revealed that the act iv i ty of C.
gibbosa started f rom June and reached the peak dur ing
July to December. The bug populat ion gradually
decreased f rom December onwards and reached a low
level dur ing March . The abundance of eggs in the field is
direct ly related to the populat ion in the f ie ld . The egg
parasitoid ident i f ied on C. gibbosa was Gryon sp
(Hymenoptera: Scelionidae). A max imum of 74.3% of the
eggs were parasitized dur ing October 2000, and 91.6% in
November 2001 (Table 1). The lowest parasitization of
1 5 . 1 % was recorded in February 2002. The nymphal
emergence f rom the eggs was inversely related to the
level of parasit ism. Natural mortal i ty of eggs was also
observed under laboratory condit ions dur ing the course
of this investigation. Earl ier reports indicated that only a
few natural enemies parasitize the eggs of this bug (Shanower
et al. 1999). The act iv i ty of the egg parasitoid Gryon
clavigrallae has been reported f rom Andhra Pradesh,
India (Madhuri 1997). Shanower et al. (1996) observed that
G. clavigrallae parasitized up to 69% of eggs of Clavigralla
in India. In our studies, 15.1 to 91.6% eggs of C. gibbosa
were parasitized by Gryon sp w i th a peak act ivi ty dur ing
August to December. Hence, Gryon sp may be
considered as a potential b iocontrol agent of C. gibbosa.
References
Lateef SS, and Reed W, 1990. Insect pests of pigeonpea.
Pages 193-242 in Insect pests of tropical food legumes (Singh
SP, ed.). Chichester, UK: John Wiley & Sons.
Madhuri K. 1997. Biology and parasitization behaviour of
Gryon clavigrallae on the eggs of Clavigralla spp. MSc thesis,
Acharya NO Ranga Agricultural University, Andhra Pradesh.
India. 67 pp.
Mishra VK, and Odak SC. 1981. Seasonal occurrence and
population dynamics of the pod bug C. gibbosa. Pages 359-
363 in Proceedings of the International Workshop on
Pigeonpeas, 15-19 Dec 1980, ICRISAT, Patancheru, India.
Vol. I I . Patancheru 502 324, Andhra Pradesh, India: ICRISAT.
Rawat RR, Kapoor K N , and Mishra US. 1983. Studies on
host preference of the pod bug of pigeonpea C. gibbosa. Indian
Journal of Plant Protection 11:35-36.
Shanower T G , Antia V, Bhagwat VR, and Dreyer H. 1996.
Parasitism of Clavigralla spp eggs by Gryon clavigrallae.
Journal of Biological Control 10(1-2): 1-7.
Shanower TG , Romeis J, and Minja E M . 1999. Insect pests
of pigeonpea and their management. Annual Review of
Entomology 44:77-96.
Singh KJ, Singh OP, and Thakur RC. 1989. Seasonal and off
season activity of tur pod bug C. gibbosa in Madhya Pradesh.
Indian Journal of Agricultural Sciences 59(3): 187-188.
Bioassay of Metarhizium anisopliae
Against Pigeonpea Pod Borer
Helicoverpa armigera
SS Kulat1, PR Patil
1, SA Nimbalkar
2, PS Patil', and
PK Sarnaik1 (1 . Department of Entomology, College of
Agriculture, Nagpur 440 001, Maharashtra, India;
2. Dr Panjabrao Deshmukh Krishi Vidyapeeth, Akola
444 104, Maharashtra, India)
Helicoverpa armigera is a polyphagous pest on several
crops. It is a major constraint in pigeonpea (Cajanus
cajan) product ion. Yelshetty and Sidde Gowda (1998)
reported 90 to 100% yield loss due to this pest in Karnataka,
India. Considering the environmental impl icat ions of
chemical contro l , it is important to exploit novel tactics to
combat this pest. M ic rob ia l control is an attractive
method of pest management as it helps to min imize the
use of synthetic pesticides. Species of Helicoverpa are
susceptible to almost all groups of entomopathogens
(Deva Prasad et al. 1990). A deuteromycetes fungus,
Metarhizium anisopliae (Metch.) Sorokin infects a wide
range of insect species belonging to Lepidoptera,
Hemiptera, Coleoptera, and Orthoptera. Deva Prasad et
al. (1990) reported its eff icacy against H. armigera.
Considering its signif icance in pest management, in v i t ro
studies were carried out dur ing 2001-02 at the College of
Agr icu l ture, Nagpur, Maharashtra, India to quantify the
conidial concentration to achieve 50% mortal i ty in
laboratory reared second instar larvae of H. armigera.
Metarhizium anisopliae var. anisopliae used in the
present studies was obtained f rom the Sugarcane
Breeding Institute, Coimbatore, Tami l Nadu, India. The
fungus was subcultured on potato dextrose agar ( P D A )
medium and used for further studies. The conidial
suspension for the bioassays was obtained f rom 15-day-
o ld culture of the fungus, cultured on Sabouraud dextrose
agar + yeast (SDA + Y) medium. The fungal mat (20 g)
w i th homogenous fungal growth f rom the culture medium
was suspended thoroughly in 70 ml steril ized dist i l led
water containing 0.1 % Tween-80, by using a rotary mixer
for 20 minutes. It was poured through musl in c lo th , and
then f i l tered through Whatman No. 1 f i l ter paper. The
fi l trate was made up to 100 ml by adding suff ic ient
quantity of steril ized dist i l led water. An improved
Neubauer's hemocytometer was used to assess the
conidial concentration of the fungal suspension, and
through series of di lut ions, desired concentrations
ranging f rom 2.28 x 10⁶ to 2.28 x 10¹⁰ conidia ml-1 were
standardized. Larvae of H. armigera col lected f rom
ICPN 10,2003 55
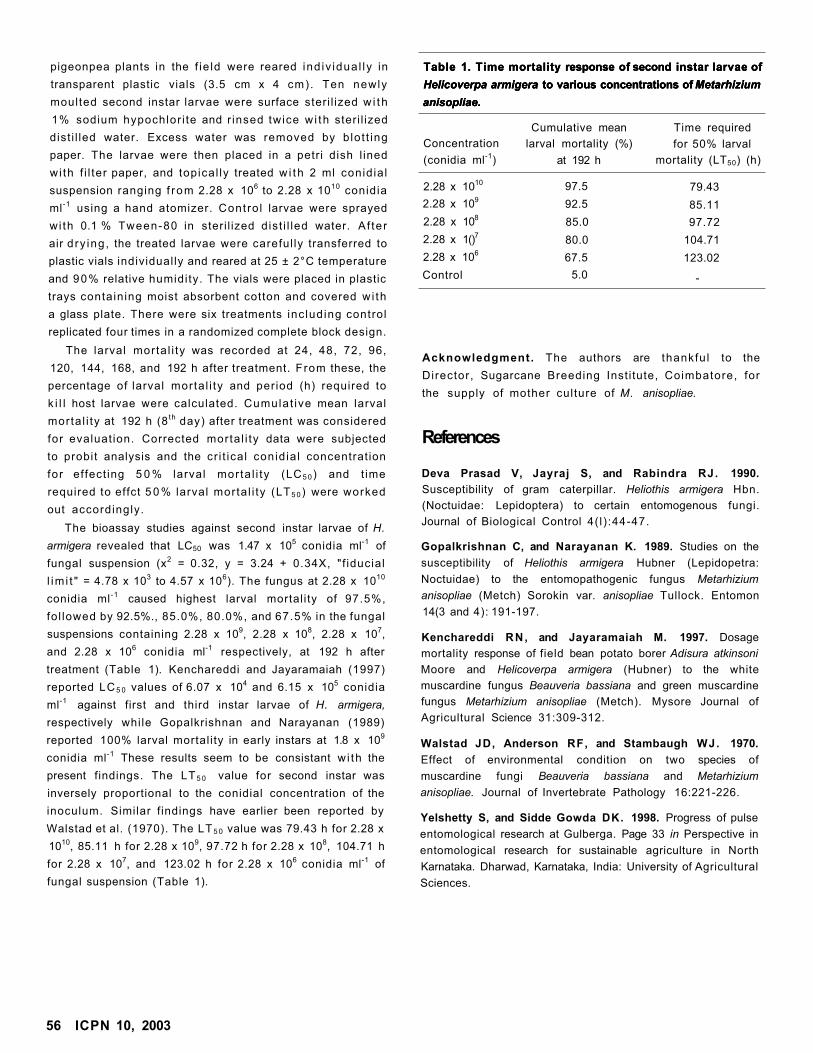
pigeonpea plants in the f ie ld were reared ind iv idua l ly in
transparent plastic vials (3.5 cm x 4 cm). Ten newly
moulted second instar larvae were surface steri l ized w i th
1% sodium hypochlor i te and r insed twice w i th steri l ized
dist i l led water. Excess water was removed by b lot t ing
paper. The larvae were then placed in a petri dish l ined
wi th f i l ter paper, and topical ly treated w i th 2 ml conidia l
suspension ranging f rom 2.28 x 10⁶ to 2.28 x 10¹⁰ conidia
ml-1 using a hand atomizer. Contro l larvae were sprayed
wi th 0.1 % Tween-80 in steri l ized dist i l led water. Af ter
air d ry ing , the treated larvae were careful ly transferred to
plastic vials individually and reared at 25 ± 2°C temperature
and 90% relative humidity. The vials were placed in plastic
trays containing moist absorbent cotton and covered w i th
a glass plate. There were six treatments inc luding control
replicated four times in a randomized complete block design.
The larval morta l i ty was recorded at 24, 48, 72, 96,
120, 144, 168, and 192 h after treatment. From these, the
percentage of larval morta l i ty and period (h) required to
k i l l host larvae were calculated. Cumulat ive mean larval
morta l i ty at 192 h (8 th day) after treatment was considered
for evaluat ion. Corrected morta l i ty data were subjected
to probit analysis and the cr i t ical conid ia l concentration
for effect ing 5 0 % larval morta l i ty (LC5 0) and t ime
required to effct 5 0 % larval morta l i ty (LT5 0 ) were worked
out accordingly.
The bioassay studies against second instar larvae of H.
armigera revealed that LC50 was 1.47 x 10⁵ conidia ml-1 of
fungal suspension (x2 = 0.32, y = 3.24 + 0.34X, "f iducial
l im i t " = 4.78 x 10³ to 4.57 x 10⁶). The fungus at 2.28 x 10¹⁰
conidia ml -1 caused highest larval mortal i ty of 97.5%,
fol lowed by 92.5%., 85.0%, 80.0%, and 67.5% in the fungal
suspensions containing 2.28 x 10⁹, 2.28 x 10⁸, 2.28 x 10⁷,
and 2.28 x 10⁶ conidia ml-1 respectively, at 192 h after
treatment (Table 1). Kenchareddi and Jayaramaiah (1997)
reported LC 5 0 values of 6.07 x 10⁴ and 6.15 x 10⁵ conidia
ml-1 against first and third instar larvae of H. armigera,
respectively while Gopalkrishnan and Narayanan (1989)
reported 100% larval mortal i ty in early instars at 1.8 x 10⁹
conidia ml-1 These results seem to be consistant w i th the
present findings. The LT 5 0 value for second instar was
inversely proportional to the conidial concentration of the
inoculum. Similar f indings have earlier been reported by
Walstad et al. (1970). The LT 5 0 value was 79.43 h for 2.28 x
1010, 85.11 h for 2.28 x 10⁹, 97.72 h for 2.28 x 10⁸, 104.71 h
for 2.28 x 10⁷, and 123.02 h for 2.28 x 10⁶ conidia ml-1 of
fungal suspension (Table 1).
Table 1. Time mortality response of second instar larvae of
Helicoverpa armigera to various concentrations of Metarhizium
anisopliae.
Table 1. Time mortality response of second instar larvae of
Helicoverpa armigera to various concentrations of Metarhizium
anisopliae.
Table 1. Time mortality response of second instar larvae of
Helicoverpa armigera to various concentrations of Metarhizium
anisopliae.
Cumulative mean Time required
Concentration larval mortality (%) for 50% larval
(conidia ml-1) at 192 h mortality (LT50) (h)
2.28 x 10¹⁰ 97.5 79.43
2.28 x 10992.5 85.11
2.28 x 10885.0 97.72
2.28 x 1()7 80.0 104.71
2.28 x 10667.5 123.02
Control 5.0 -
Acknowledgment. The authors are thankfu l to the
Director, Sugarcane Breeding Insti tute, Coimbatore, for
the supply of mother culture of M. anisopliae.
References
Deva Prasad V, Jayraj S, and Rabindra RJ. 1990.
Susceptibility of gram caterpillar. Heliothis armigera Hbn.
(Noctuidae: Lepidoptera) to certain entomogenous fungi.
Journal of Biological Control 4( l) :44-47.
Gopalkrishnan C, and Narayanan K. 1989. Studies on the
susceptibility of Heliothis armigera Hubner (Lepidopetra:
Noctuidae) to the entomopathogenic fungus Metarhizium
anisopliae (Metch) Sorokin var. anisopliae Tullock. Entomon
14(3 and 4): 191-197.
Kenchareddi RN, and Jayaramaiah M. 1997. Dosage
mortality response of field bean potato borer Adisura atkinsoni
Moore and Helicoverpa armigera (Hubner) to the white
muscardine fungus Beauveria bassiana and green muscardine
fungus Metarhizium anisopliae (Metch). Mysore Journal of
Agricultural Science 31:309-312.
Walstad JD, Anderson RF, and Stambaugh WJ. 1970.
Effect of environmental condition on two species of
muscardine fungi Beauveria bassiana and Metarhizium
anisopliae. Journal of Invertebrate Pathology 16:221-226.
Yelshetty S, and Sidde Gowda DK. 1998. Progress of pulse
entomological research at Gulberga. Page 33 in Perspective in
entomological research for sustainable agriculture in North
Karnataka. Dharwad, Karnataka, India: University of Agricultural
Sciences.
56 ICPN 10, 2003
Publications
Copies of ICRISAT titles are available from: Project
Development and Marketing Office, ICRISAT, Patancheru
502 324, Andhra Pradesh, India.
Email: [email protected]
Web: http://www.icrisat.org/publications
Publications from ICRISAT
Kiran S, Bramel PJ, Reddy LJ, and Vara Prasad KS. 2002.
Traditional pigeonpea cultivation practices in north coastal
Andhra Pradesh - A tribal legacy. Patancheru 502 324, Andhra
Pradesh, India: ICRISAT. 48 pp.
An effort is made to: (1) Document the different pigeonpea
landraces grown in the tribal areas of north coastal districts of
Andhra Pradesh. India; (2) Document folk names, crop
production aspects, seed production and conservation
methods, and storage structures used to store pigeonpea seed;
(3) Give a word of appreciation, on record, to the farming
communities that have been maintaining the landraces in situ;
(4) Empahsize on the growing importance of maintaining
landraces in situ; and (5) Create awareness among the younger
generations in these areas and motivate them to take up the
challenge of maintaining their traditional wealth.
Piara Singh, Vijaya D, Srinivas K, and Wani SP. 2002.
Potential productivity, yield gap, and water balance of soybean-
chickpea sequential system at selected benchmark sites in
India. Global Theme 3: Water, Soil, and Agrobiodiversity
Management for Ecosystem Health. Report No. I. Patancheru
502 324, Andhra Pradesh. India: ICRISAT. 52 pp.
Soybean is the predominant crop in the target region of India
and has the potential to be followed by chickpea crop on a
larger scale in the postrainy season. Using the CROPGRO
models of soybean and chickpea, this study examined the potential
yields, yield gap, and water balance of the soybean-chickpea
sequential system for the 24 selected benchmark sites within
the soybean production zones of India. Considering the variability
in soils and climate, this simulation study showed that the
average potential productivity of the soybean-chickpea system
under rainfed situation ranged from 1390 to 4590 kg ha-1 across
sites. The current level of productivity of the system across
sites ranges from 970 to 1780 kg ha-1. The yield gap of 200 to
300 kg ha-1 for the system indicates the potential to increase
productivity with improved management under rainfed
situation. However, higher increases in yields would be
possible in good rainfall years or with supplemental irrigation.
SATCRIS Listing
The following 2002 listings and publications have been
generated from ICRISAT's electronic bibliographic database
SATCRIS—the Semi-Arid Tropical Crops Information Service.
Copies of the following entries can be obtained by writing to:
Senior Manager
Library
ICRISAT
Patancheru 502 324, Andhra Pradesh, India
Email: [email protected]
Chickpea and Pigeonpea Publications
Abbo S, Lev Yadun S, and Galwey N. 2002. Vernalization
response of wild chickpea. New Phytologist 154(3):695-701.
Ae N, and Shen RF. 2002. Root cell-wall properties are
proposed to contribute to phosphorus (P) mobilization by
groundnut and pigeonpea. Plant and Soil 245(1 ):95-l03.
Agyare WA, Kombiok J M , Karbo N, and Larbi A. 2002.
Management of pigeon pea in short fallows for crop-livestock
production systems in the Guinea savanna zone of northern
Ghana. Agroforestry Systems 54(3): 197-202.
Akanvou R, Kropff M J , Bastiaans L, and Becker M. 2002.
Evaluating the use of two contrasting legume species as relay
intercrop in upland rice cropping systems. Field Crops
Research 74( 1 ):23-36.
Ali MY, Krishnamurthy L, Saxena NP, Rupela OP, Kumar J,
and Johansen C. 2002. Scope for genetic manipulation of
mineral acquisition in chickpea. Plant and Soil 245(1): 123- 134.
Alves Santos F M , Ramos B, Garcia Sanchez M A , Eslava
AP, and Diaz Minguez J M . 2002. A DNA-based procedure
for in planta detection of Fusarium oxysporum f. sp phaseoli.
Phytopathology 92(3):237-244.
Amarteifio JO, Munthali DC, Karikari SK, and Morake
TK. 2002. The composition of pigeon peas (Cajanus cajan
(L.) Millsp.) grown in Botswana. Plant Foods for Human
Nutrition 57(2): 173-177.
Arshad M, Bakhsh A, Bashir M, and Haqqani A M . 2002.
Determining the heritability and relationship between yield
and yield components in chickpea (Cicer urietinum L ) .
Pakistan Journal of Botany 34(3):237- 245.
Chauhan YS, Johansen C, Moon JK, Lee Y H , and Lee SH.
2002. Photoperiod responses of extra-short-duration
ICPN 10, 2003 57
pigeonpea lines developed at different latitudes. Crop Science
42(4): 1139-1146.
Cho SH, Kumar J, Shultz JL, Anupama K, Tefera F, and
Muehlbauer FJ. 2002. Mapping genes for double podding
and other morphological traits in chickpea. Euphytica
128(2):285-292.
Chowdhury M A , Vandenberg B, and Warkentin T. 2002.
Cultivar identification and genetic relationship among selected
breeding lines and cultivars in chickpea (Cicer arietinum L.).
Euphytica 127(3):317-325.
Dahiya SS, Chauhan YS, Johansen C, Waldia RS, Sekhon
HS, and Nandal JK. 2002. Extra-short-duration pigeonpea for
diversifying wheat-based cropping systems in the sub-tropics.
Experimental Agriculture 38(1):1-11.
Dasgan HY, Aktas H, Abak K, and Cakmak I. 2002.
Determination of screening techniques to salinity tolerance in
tomatoes and investigation of genotype responses. Plant
Science 163(4):695-703.
de Gruyter J. 2002. Contributions towards a monograph of
Phoma (Coelomycetes) - IX - Section Macrospora. Persoonia
18:85-102.
Deo C, and Kothari M L . 2002. Effect of modes and levels of
molybdenum application on grain yield, protein content and
nodulation of chickpea grown on loamy sand soil.
Communications in Soil Science and Plant Analysis 33(15-
18):2905-2915.
Duhan A, Khetarpaul N, and Bishnoi S. 2002. Content of
phytic acid and HCl-extractability of calcium, phosphorus and
iron as affected by various domestic processing and cooking
methods. Food Chemistry 78(1):9-14.
Esechie HA, Al Saidi A, and Al Khanjari S. 2002. Effect of
sodium chloride salinity on seedling emergence in chickpea.
Journal of Agronomy and Crop Science 188(3): 155-160.
Esteban R, Dopico B, Munoz FJ, Romo S, and Labrador E.
2002. A seedling specific vegetative lectin gene is related to
development in Cicer arietinum. Physiologia Plantarum
114(4):619-626.
Ford R, LeRoux K, Itman C, Brouwer JB, and Taylor PWJ.
2002. Diversity analysis and genotyping in Pisum with
sequence tagged microsatellite site (STMS) primers. Euphytica
124(3): 397-405.
Fratini R, and Ruiz M L . 2002. Comparative study of different
cytokinins in the induction of morphogenesis in lentil (Lens
culinaris Medik.). In Vitro Cellular and Developmental
Biology -Plant 38(1):46-51.
Funnell DL, and Van Etten HD. 2002. Pisatin demethylase
genes are on dispensable chromosomes while genes for
pathogenicity on carrot and ripe tomato are on other
chromosomes in Nectria haematococca. Molecular Plant-
Microbe Interactions 15(8):840-846.
Can YT, Miller PR, Liu PH, Stevenson FC, and McDonald
CL. 2002. Seedling emergence, pod development, and seed
yields of chickpea and dry pea in a semiarid environment.
Canadian Journal of Plant Science 82(3 ):531-537.
Gaur P M , and Gour VK. 2002. A gene producing one to nine
flowers per flowering node in chickpea. Euphytica
128(2):231-235.
Gene Y, McDonald GK, and Graham RD. 2002. A soil-based
method to screen for zinc efficiency in seedlings and its ability
to predict yield responses to zinc deficiency in mature plants.
Australian Journal of Agricultural Research 53(4):409-421.
Gene Y, McDonald GK, and Graham RD. 2002. Critical
deficiency concentration of zinc in barley genotypes differing
in zinc efficiency and its relation to growth responses. Journal
of Plant Nutrition 25(3):545-560.
Ghosh PK, Wanjari R H , Mandal K G , Hati K M , and
Bandyopadhyay KK. 2002. Recent trends in inter
relationship of nutrients with various agronomic practices of
field crops in India. Journal of Sustainable Agriculture
21( l) :47-77.
Graham J A, Panozzo JF, Lim PC, and Brouwer JB. 2002.
Effects of gamma irradiation on physical and chemical
properties of chickpeas (Cicer arietinum). Journal of the
Science of Food and Agriculture 82(14): 1599-1605.
Green PWC, Stevenson PC, Simmonds MSJ, and Sharma
HC 2002. Can larvae of the pod-borer, Helicoverpa armigera
(Lepidoptera: Nocluidae), select between wild and cultivated
pigeonpea Cajanus sp (Fabaceae)? Bulletin of Entomological
Research 92(1):45-51.
Gulati A, Schryer P, and McHughen A. 2002. Production of
fertile transgenic lentil (Urns culinaris Medik) plants using
particle bombardment. In Vitro Cellular and Developmental
Biology - Plant 38(4):316-324.
Habiba RA. 2002. Changes in anti-nutrients, protein
solubility, digestibility, and HCl-extractability of ash and
phosphorus in vegetable peas as affected by cooking methods.
Food Chemistry 77(2): 187-192.
Hadjipanayiotou A. 2002. Replacement of soybean meal and
barley grain by chick-peas in lamb and kid fattening diets.
Animal Feed Science and Technology 96(1-2): 103-109.
Hartkamp AD, Hoogenboom G, and White JW. 2002.
Adaptation of the CROPGRO growth model to velvet bean
(Mucuna pruriens) I. Model development. Field Crops
Research 78(1):9-25.
Hartung W, Leport L, Ratcliffe RG, Sauter A, Duda R, and
Turner NC. 2002. Abscisic acid concentration, root pH and
anatomy do not explain growth differences of chickpea (Cicer
arietinum L.) and lupin (Lupinus angustifolius L.) on acid and
alkaline soils. Plant and Soil 240(1): 191-199.
58 ICPN 10, 2003
Hash CT, Schaffert RE, and Peacock J M . 2002. Prospects
for using conventional techniques and molecular biological
tools to enhance performance of 'orphan' crop plants on soils
low in available phosphorus. Plant and Soil 245(1): 135-146.
Hernandez Nistal J, Dopico B, and Labrador E. 2002. Cold
and salt stress regulates the expression and activity of a
chickpea cytosolic Cu/Zn superoxide dismutase. Plant Science
163(3):507-514.
Herridge DF, and Peoples M B . 2002. Calibrating the xylem-
solute method for nitrogen fixation measurement of ureide-
producing legumes: cowpea, mungbean, and black gram.
Communications in Soil Science and Plant Analysis 33(3-
4):425-437.
Hoover R, and Ratnayake WS. 2002. Starch characteristics of
black bean, chick pea, lentil, navy bean and pinto bean
cultivars grown in Canada. Food Chemistry 78(4):489-498.
Hu J, Lee SO, Hendrich S, and Murphy PA. 2002.
Quantification of the group B soyasaponins by high-
performance liquid chromatography. Journal of Agricultural
and Food Chemistry 50(9):2587-2594.
Huettel B, Santra D, Muehlbauer F.I, and Kahl G. 2002.
Resistance gene analogues of chickpea (Cicer arietinum L):
isolation, genetic mapping and association with a Fusarium
resistance gene cluster. Theoretical and Applied Genetics
105(2-3 ):479-490.
Ilarslan H, and Dolar FS. 2002. Histological and
ultrastructural changes in leaves and stems of resistant and
susceptible chickpea cultivars to Ascochyta rahiei. Journal of
Phytopathology - Phytopathologische Zeitschrift 150(6):340-
348.
Iruela M, Rubio J, Cubero J l , Gil J, and Millan T. 2002.
Phylogenetic analysis in the genus Cicer and cultivated
chickpea using RAPD and ISSR markers. Theoretical and
Applied Genetics 104(4):643-651.
Ishikawa S, Adu-Gyamfi JJ, Nakamura T, Yoshihara T,
Watanabe T, and Wagatsuma T. 2002. Genotypic variability
in phosphorus solubilizing activity of root exudates by
pigeonpea grown in low-nutrient environments. Plant and Soil
245(1):71-81.
Jackowski R, Czuchajowska Z, and Baik BK. 2002.
Granular cold water gelling starch prepared from chickpea
starch using liquid ammonia and ethanol. Cereal Chemistry
79(0:125-128.
Jimenez Gasco M M , Milgroom M G , and Jimenez Diaz R M .
2002. Gene genealogies support Fusarium oxysporum f. sp
ciceris as a monophyletic group. Plant Pathology 51(1):72-77.
John S, and Sabharwal S. 2002. Immobilised human salivary
amylase: An affinity matrix for the isolation of alpha-amylase
inhibitor from chickpea. Journal of Food Science and
Technology - Mysore 39(3):296-298.
Johnvesly B, Manjunath BR, and Naik GR. 2002. Pigeon
pea waste as a novel, inexpensive, substrate for production of a
thermostable alkaline protease from thermoalkalophilic
Bacillus sp JB-99. Bioresource Technology 82(1):61-64.
Kaur S, Gupta AK, and Kaur N. 2002. Effect of osmo- and
hydropriming of chickpea seeds on seedling growth and
carbohydrate metabolism under water deficit stress. Plant
Growth Regulation 37(1):17-22.
Khan DF, Peoples M B , Chalk PM, and Herridge DF. 2002.
Quantifying below-ground nitrogen of legumes. 2. A
comparison of N15 and non-isotopic methods. Plant and Soil
239(2):277-289.
Khan WDF, Peoples MB, and Herridge DF. 2002.
Quantifying below-ground nitrogen of legumes - I. Optimising
procedures for N15 shoot-labelling. Plant and Soil 245(2):327-334.
Kiprop EK, Baudoin JP, Mwangombe AW, Kimani P M ,
Mergeai G, and Maquet A. 2002. Characterization of Kenyan
isolates of Fusarium udum from pigeonpea [Cajanus cajan
(L.) Millsp.] by cultural characteristics, aggressiveness and
AFLP analysis. Journal of Phytopathology - Phytopathologische
Zeitschrift 150( 10):517-525.
Kiprop EK, Mwangombe AW, Baudoin JP, Kimani P M ,
and Mergeai G. 2002. Cultural characteristics, pathogenicity
and vegetative compatibility of Fusarium udum isolates from
pigeonpea (Cajanus cajan (L.) Millsp.) in Kenya. European
Journal of Plant Pathology 108(2): 147-154.
Konak M, Carman K, and Aydin C. 2002. Physical properties
of chick pea seeds. Biosystems Engineering 82(0:73-78.
Konno H, Nakato T, and Katoh K. 2002. Characteristics,
hydrolysis of cell wall polymers, and response to calcium
deficiency of a cell wall-associated beta-galactosidase from
carrot cells. Journal of Plant Physiology 159(1):1-8.
Kumar PL, Duncan G H , Roberts I M , Jones AT, and Reddy
DVR. 2002. Cytopathology of pigeonpea sterility mosaic virus
in pigeonpea and Nicotiana benthamiana: similarities with
those of eriophyid mile-borne agents of undefined aetiology.
Annals of Applied Biology 140( 1 ):87-96.
Kumar S, Bahl JR, Bansal RP, Gupta AK, Singh V, and
Sharma S. 2002. High economic returns from companion and
relay cropping of bread wheat and menthol mint in the winter-
summer season in north Indian plains. Industrial Crops and
Products 15(2): 103-114.
Kurdali F, and Al Ain F. 2002. Effect of different water
salinity levels on growth, nodulation, and N2-fixation by
dhaincha and on growth of sunflower using a N15-tracer
technique. Journal of Plant Nutrition 25(11):2483-2498.
Kurdali F, Al Ain F, and Al Shamma M. 2002. Nodulation,
dry matter production, and N2 fixation by fababean and
chickpea as affected by soil moisture and potassium fertilizer.
Journal of Plant Nutrition 25(2):355-368.
ICPN 10, 2003 59
Kuribayashi T, Kaise H, Uno C, Hara T, Hayakawa T, and
Joh T. 2002. Purification and characterization of lipoxygenase
from Pleurotus ostreatus. Journal of Agricultural and Food
Chemistry 50(5): 1247-1253.
Kyei Boahen S, Stinkard AE, and Walley FL. 2002.
Evaluation of rhizobial inoculation methods for chickpea.
Agronomy Journal 94(4):851-859.
Kyei Boahen S, Slinkard AE, and Walley FL. 2002. Isotopic
fractionation during N2 fixation by chickpea. Soil Biology and
Biochemistry 34(3):417-420.
Kyei Boahen S, Slinkard AE, and Walley FL. 2002. Time
course of N2 fixation and growth of chickpea. Biology and
Fertility of Soils 35(6):441-447.
Laranjo M, Branco C, Soares R, Alho L, Carvalho MDF.,
and Oliveira S. 2002. Comparison of chickpea rhizobia
isolates from diverse Portuguese natural populations based on
symbiotic effectiveness and DNA fingerprint. Journal of
Applied Microbiology 92(6): 1043-1050.
Lee KS, Lee JC, and Soh W Y . 2002. High frequency plant
regeneration from Aralia cordata somatic embryos. Plant Cell
Tissue and Organ Culture 68(3):241-246.
Lichtenzveig J, Shtienberg D, Zhang HB, Bonfil DJ, and
Abbo S. 2002. Biometric analyses of the inheritance of
resistance to Didymella rabiei in chickpea. Phytopathology
92(4):417-423.
Lichtenzveig J, Winter P, Abbo S, Shtienberg D, Kaiser
WJ, and Kahl G. 2002. Towards the first linkage map of the
Didymella rabiei genome. Phytoparasitica 30(5):467-472.
Lioi L, and Galasso 1. 2002. Oligonucleotide DNA fingerprinting
revealing polymorphism in Phaseolus lunatus L. Genetic
Resources and Crop Evolution 49(l):53-58.
Lopez Meyer M, and Paiva NL. 2002. Immunolocalization of
vestitone reductase and isofiavone reductase, two enzymes
involved in the biosynthesis of the phytoalexin medicarpin.
Physiological and Molecular Plant Pathology 61(1): 15-30.
Luhova L, Hedererova D, Lebeda A, and Pec P. 2002. The
influence of Fusarium solani on enzyme activity of Pisum
sativum cultivars. Zeitschrift fur Pflanzenkrankheiten und
Pflanzenschutz - Journal of Plant Diseases and Protection
109(2): 113-128.
Maatallah J, Berraho E, Sanjuan J, and Lluch C. 2002.
Phenotypic characterization of rhizobia isolated from chickpea
(Cicer arietinum) growing in Moroccan soils. Agronomic
22(3):321-329.
Maatallah J, Berraho EB, Munoz S, Sanjuan J, and Lluch
C. 2002. Phenotypic and molecular characterization of
chickpea rhizobia isolated from different areas of Morocco.
Journal of Applied Microbiology 93(4):531-540.
Makkouk K M , Fazlali Y, Kumari SG, and Farzadfar S.
2002. First record of beet western yellows virus, chickpea
chlorotic dwarf virus, faba bean necrotic yellows virus and
soybean dwarf virus infecting chickpea and lentil crops in Iran.
Plant Pathology 51(3):387.
Malhotra RS, Singh KB, Di Vito M, Greco N, and Saxena
M C . 2002. Registration of ILC 10765 and ILC 10766 chickpea
germplasm lines resistant to cyst nematode. Crop Science
42(5): 1756.
Mallikarjuna N, and Saxena KB. 2002. Production of
hybrids between Cajanus acutifolius and C. cajan. Euphytica
124(1): 107-110.
Mandal K G , Saha KP, Ghosh PK, Hati K M , and
Bandyopadhyay KK. 2002. Bioenergy and economic analysis
of soybean-based crop production systems in central India.
Biomass and Bioenergy 23(5):337-345.
Mann A, Nandwal AS, Sheoran IS, Kundu BS, Sheokand S,
Kamboj DV, Sheoran A, Kumar B, Kumar N, and Dutta D.
2002. Ethylene evolution, H2O2 scavenging enzymes and
membrane integrity of Cicer arietinum L. nodules as affected
by nitrate and aminoethoxyvinylglycine. Journal of Plant
Physiology 159(4):347-353.
Marley PS, and Hillocks RJ. 2002. Induction of phytoalexins
in pigeonpea (Cajanus cajan) in response to inoculation with
Fusarium udum and other treatments. Pest Management
Science 58(10): 1068-1072.
Matilla AJ, Garcia S, and Bueno M. 2002. Diamine oxidase
activity during the germinative and post-germinative growth of
the embryonic axis in chickpea seeds. Biologia Plantarum
45(4):551-556.
McConnell JT, Miller PR, Lawrence RL, Engel R, and
Nielsen GA. 2002. Managing inoculation failure of field pea
and chickpea based on spectral responses. Canadian Journal of
Plant Science 82(2):273-282.
McDonald CK. 2002. Germination response to temperature in
tropical and subtropical pasture legumes. 1. Constant temperature.
Australian Journal of Experimental Agriculture 42(4):407-419.
Metoui O, Porta Puglia A, Marrakchi M, Kharrat M, and
Angelini R. 2002. The Vicia faba diamine oxidase system and
its role in response to Ascochyta fahae and to wounding.
Journal of Plant Pathology 84(1): 19-25.
Milan Carrillo J, Reyes Moreno C, Camacho Hernandez I,
and Rouzaud Sandez O. 2002. Optimisation of extrusion
process to transform hardened chickpeas (Cicer arietinum L)
into a useful product. Journal of the Science of Food and
Agriculture 82(14): 1718-1728.
Miller PR, McConkey BG, Clayton G W , Brandt SA,
Staricka JA, Johnston A M , Lafond GP, Schatz BG,
Baltensperger DD, and Neill KE . 2002. Pulse crop adaptation
in the northern Great Plains. Agronomy Journal 94(2):261-272.
Misra P. 2002. Direct differentiation of shoot buds from leaf
explants of Cajanus cajan L. Biologia Plantarum 45(3):347-351.
60 ICPN 10, 2003
Mohan M L , and Krishnamurthy KV. 2002. Somatic
embryogenesis and plant regeneration in pigeonpea. Biologia
Plantarum 45(1): 19-25.
Molas J. 2002. Changes of chloroplast ultrastructure and total
chlorophyll concentration in cabbage leaves caused by excess
of organic Ni(I I) complexes. Environmental and Experimental
Botany 47(2): 115-126.
Monsoor M A , and Yusuf H K M . 2002. In vitro protein
digestibility of lathyrus pea (Lathyrus sativus), lentil (Lens
culinaris), and chickpea (Cicer arietinum). International
Journal of Food Science and Technology 37(1):97—99.
Muehlbauer FJ, and Kaiser WJ. 2002. Registration of
'Evans' chickpea. Crop Science 42(1):301.
Nautiyal CS, Johri JK, and Singh HB. 2002. Survival of the
rhizosphere-competent biocontrol strain Pseudomonas
fluorescens NBRI2650 in the soil and phytosphere. Canadian
Journal of Microbiology 48(7):588-601.
Nleya T M , Arganosa GC, Vandenberg A, and Tyler RT.
2002. Genotype and environment effect on canning quality of
kabuli chickpea. Canadian Journal of Plant Science 82(2):267-272.
Oboh HA, Muzquiz M, Burbano C, Cuadrado C, Pedrosa
M M , Ayet G, and Osagie AU. 2002. Effect of local food
processing on the inositol phosphate contents in lima bean
(Phaseolus lunatus L.), pigeon pea (Cajanus cajan), African
yam bean (Sphenostylis sternocarpa) and jackbean (Canavalia
ensiformis). Ecology of Food and Nutrition 41(3):229-242.
Ohri D, and Singh SP. 2002. Karyotypic and genome size
variation in Cajanus cajan (L.) Mil lsp (pigeonpea) and some
wild relatives. Genetic Resources and Crop Evolution 49( 1): 1-10.
Paniego N, Echaide M, Munoz M, Fernandez L, Torales S,
Faccio P, Fuxan I, Carrera M, Zandomeni R, Suarez E, and
Hopp HE. 2002. Microsatellite isolation and characterization
in sunflower (Helianthus annuus L.). Genome 45(1):34-43.
Pedroche J, Yust M M , Giron Calle J, Alaiz M, Millan F,
and Vioque J. 2002. Utilisation of chickpea protein isolates for
production of peptides with angiotensin I-converting enzyme
(ACE)-inhibitory activity. Journal of the Science of Food and
Agriculture 82(9):960-965.
Phan H T T , Ford R, Bretag T, and Taylor PWJ. 2002. A
rapid and sensitive polymerase chain reaction (PCR) assay for
detection of Ascochyta rabiei, the cause of ascochyta blight of
chickpea. Australasian Plant Pathology 31(1):31-39.
Prasad RD, Rangeshwaran R, Hegde SV, and Anuroop CP.
2002. Effect of soil and seed application of Trichoderma
harzianum on pigeonpea wilt caused by Fusarium udum under
field conditions. Crop Protection 21(4):293-297.
Quatrini P, Scaglione G, Cardinale M, Caradonna F, and
Puglia A M . 2002. Bradyrhizobium sp nodulating the
Mediterranean shrub Spanish broom (Spartium junceum L.).
Journal of Applied Microbiology 92(1): 13-21.
Rajesh PN, Tullu A, Gil J, Gupta VS, Ranjekar PK, and
Muehlbauer FJ. 2002. Identification of an STMS marker for
the double-podding gene in chickpea. Theoretical and Applied
Genetics 105(4): 604-607.
Ramsubhag A, Donawa AL, and Umaharan P. 2002.
Variations in nodulalion and nitrogen-fixing characteristics of
slow-growing rhizobia isolates on pigeon-pea [Cajanus cajan
(L.) Mil lsp. ]. Tropical Agriculture 79(1): 12-20.
Rao D L N , Giller KE, Yeo AR, and Flowers TJ. 2002. The
effects of salinity and sodicity upon nodulalion and nitrogen
fixation in chickpea (Cicer arietinum). Annals of Botany
89(5):563-570.
Rao K V M , Sridevi V, and Satyanarayana NV. 2002. Heat
shock induced lipid changes and solute leakage in germinating
seeds of pigeonpea. Biologia Plantarum 45(1):71-76.
Rao SC, Coleman SW, and Mayeux HS. 2002. Forage
production and nutritive value of selected pigeonpea ecotypes
in the southern Great Plains. Crop Science 42(4): 1259-1263.
Rao SC, MacKown CT, and Bidlack JE. 2002. Biomass and
nitrogen traits of summer pigeon peas and winter wheat grown
for three rotations in containers. Communications in Soil
Science and Plant Analysis 33(5-6):897-912.
Reiter K, Schmidtke K, and Rauber R. 2002. The influence
of long-term tillage systems on symbiotic N2 fixation of pea
(Pisum sativum L.) and red clover (Trifolium pratense L.).
Plant and Soil 238(1 ):41-55.
Robertson MJ , Carberry PS, Huth N l , Turpin JE, Probert
M E , Poulton PL, Bell M, Wright GC, Yeates SJ, and
Brinsmead RB. 2002. Simulation of growth and development
of diverse legume species in APSIM. Australian Journal of
Agricultural Research 53(4):429-446.
Rubiales D, and Trapero Casas A. 2002. Occurrence of
Didymella fabae, the teleomorph of Ascochyta fabae, on faba
bean straw in Spain. Journal of Phytopathology -
Phytopathologische Zeitschrift 150(3): 146-148.
Rubio LA, Muzquiz M, Burbano C, Cuadrado C, and
Pedrosa M M . 2002. High apparent ileal digestibility of amino
acids in raw and germinated faba bean (Vicia faba) - and
chickpea (Cicer arietinum)-based diets for rats. Journal of the
Science of Food and Agriculture 82(14): 1710-1717.
Santos RHS, Gliessman SR, and Cecon PR. 2002. Crop
interactions in broccoli intercropping. Biological Agriculture
and Horticulture 20(1):51-75.
Sarma BK, Singh DP, Mehta S, Singh HB, and Singh UP.
2002. Plant growth-promoting rhizobacteria-elicited
alterations in phenolic profile of chickpea (Cicer arietinum)
infected by Sclerotium rolfsii. Journal of Phytopathology -
Phytopathologische Zeitschrift 150(4-5):277-282.
Sasikumar K, Parthiban KT, Kalaiselvi T, and Jagatram
M. 2002. Allelopathic effects of Parthenium hysterophorus on
ICPN 10, 2003 61
cowpea, pigeonpea, greengram, blackgram and horsegram.
Allelopathy Journal 10(1):45-51.
Saxena KB, Chandrasena GDSN, Hettiarachchi K, Iqbal
YB, Fonseka H H D , and Jayasekera SJBA. 2002. Evaluation
of pigeonpea accessions and selected lines for reaction to
Maruca. Crop Science 42(2):615-618.
Shamsuzzaman K M , Gibson A H , Oram RN, and Shaikh
MAQ. 2002. Assimilation and partitioning of dry matter and
nitrogen in Hyprosola, a more determinate mutant of chickpea,
and in its parental cultivar. Field Crops Research 77(1 ):51—59.
Shiyani RL, Joshi PK, Asokan M, and Bantilan MCS. 2002.
Adoption of improved chickpea varieties: KRIBHCO experience
in tribal region of Gujarat, India. Agricultural Economics
27(1):33-39.
Sigsgaard L, Greenstone M H , and Duffield SJ. 2002. Egg
cannibalism in Helicoverpa armigera on sorghum and
pigeonpea. Biocontrol 47(2): 151-165.
Sindhu SS, Suneja S, Goel AK, Parmar N, and Dadarwal
KR. 2002. Plant growth promoting effects of Pseudomonas sp
on coinoculation with Mesorhizobium sp Cicer strain under
sterile and "wi l t sick" soil conditions. Applied Soil Ecology
19(1):57-64.
Singh R, Srivastava K, Jaiswal H K , Amla DV, and Singh
BD. 2002. High frequency multiple shoot regeneration from
decapitated embryo axes of chickpea and establishment of
plantlets in the open environment. Biologia Plantarum
45(4):503-508.
Singh S, Choi SB, Modi M K , and Okita T W . 2002. Isolation
and characterization of cDNA clones encoding ADP-glucose
pyrophosphorylase (AGPase) large and small subunits from
chickpea (Cicer arietinum L.). Phytochemistry 59(3):261-268.
Singh UP, Sarma BK, Singh DP, and Bahadur A. 2002.
Studies on exudate-depleted sclerotial development in
Sclerotium rolfsii and the effect of oxalic acid, sclerotial
exudate, and culture filtrate on phenolic acid induction in
chickpea (Cicer arietinum). Canadian Journal of Microbiology
48(5):443-448.
Sivaramakrishnan S, Kannan S, and Reddy LJ. 2002.
Diversity in selected wi ld and cultivated species of pigeonpea
using RFLP of mtDNA. Euphytica 125(1):21-28.
Snapp SS, Rohrbach DD, Simtowe F, and Freeman HA.
2002. Sustainable soil management options for Malawi: Can
smallholder fanners grow more legumes? Agriculture
Ecosystems and Environment 91 (1-3): 159-174.
Soltani A, Galeshi S, Zeinali E, and Latifi N. 2002.
Germination, seed reserve utilization and seedling growth of
chickpea as affected by salinity and seed size. Seed Science
and Technology 30(1):51-60.
Sood M, and Malhotra SR. 2002. Effects of processing and
cooking on ascorbic acid content of chickpea (Cicer arietinum
L) varieties. Journal of the Science of Food and Agriculture
82(1):65-68.
Sood M, Malhotra SR, and Sood BC. 2002. Effect of
processing and cooking on proximate composition of chickpea
(Cicer arietinum) varieties. Journal of Food Science and
Technology - Mysore 39(1):69-71.
Tabrett CA, and Copeland L. 2002. Enzymes of malate
metabolism in Mesorhizobium ciceri CC 1192. Canadian
Journal of Microbiology 48(4):279-284.
Thacker PA, Qiao SY, and Racz VJ. 2002. A comparison of
the nutrient digestibility of desi and kabuli chickpeas fed to
swine. Journal of the Science of Food and Agriculture
82(11):1312-1318.
Turhan M, Sayar S, and Gunasekaran S. 2002. Application
of Peleg model to study water absorption in chickpea during
soaking. Journal of Food Engineering 53(2): 153-159.
Turpin JE, Herridge DF, and Robertson M J . 2002. Nitrogen
fixation and soil nitrate interactions in field-grown chickpea
(Cicer arietinum) and fababean (Vicia faba). Australian
Journal of Agricultural Research 53(5):599-608.
Upadhyaya HD, Ortiz R, Bramei PJ, and Singh S. 2002.
Phenotypic diversity for morphological and agronomic
characteristics in chickpea core collection. Euphytica
123(3):333-342.
Vadivel V, and Janardhanan K. 2002. Agrobotanical traits
and chemical composition of Cassia obtusifolia L.: A lesser-
known legume of the Western Ghats region of South India.
Plant Foods for Human Nutrition 57(2): 151-164.
Vassilev A, Lidon FC, Matos M D , Ramalho JC, and
Yordanov 1. 2002. Photosynthetic performance and content of
some nutrients in cadmium- and copper-treated barley plants.
Journal of Plant Nutrition 25(11):2343-2360.
Wamatu JN, and Thomas E. 2002. The influence of genotype-
environment interaction on the grain yields of 10 pigeonpea
cultivars grown in Kenya. Journal of Agronomy and Crop
Science - Zeitschrift fur Acker und Pflanzenbau 188(1):25-33.
Welfare K, Yeo AR, and Flowers TJ. 2002. Effects of salinity
and ozone, individually and in combination, on the growth and
ion contents of two chickpea (Cicer arietinum L.) varieties.
Environmental Pollution 120(2):397-403.
Yamamoto A, Nakamura T, Adu-Gyamfi JJ, and Saigusa M.
2002. Relationship between chlorophyll content in leaves of
sorghum and pigeonpea determined by extraction method and
by chlorophyll meter (SPAD-502). Journal of Plant Nutrition
25(10):2295-2301.
Zemanek AB, Ko TS, Thimmapuram J, Hammerschlag FA,
and Korban SS. 2002. Changes in beta-l,3-glucanase mRNA
levels in peach in response to treatment with pathogen culture
filtrates, wounding, and other elicitors. Journal of Plant
Physiology 159(8):877-889.
62 ICPN 10, 2003
Notes
Notes
About I C R I S A T
The semi-arid tropics (SAT) encompass parts of 48 developing countries including most of India, parts of Southeast Asia,
a swathe across sub-Saharan Africa, much of southern and eastern Africa, and parts of Latin America. Many of these
countries are among the poorest in the world. Approximately one-sixth of the world's population lives in the SAT, which
is typified by unpredictable weather, limited and erratic rainfall, and nutrient-poor soils.
ICRISAT's mandate crops are sorghum, pearl millet, chickpea, pigeonpea, and groundnut - five crops vital to life for the
ever-increasing populations of the SAT. ICRISAT's mission is to conduct research that can lead to enhanced sustainable
production of these crops and to improved management of the limited natural resources of the SAT. ICRISAT communicates
information on technologies as they are developed through workshops, networks, training, library services, and publishing.
ICRISAT was established in 1972. It is supported by the Consultative Group on International Agricultural Research
(CGIAR), an informal association of approximately 50 public and private sector donors. It is co-sponsored by the Food
and Agriculture Organization of the United Nations (FAO), the United Nations Development Programme (UNDP), the
United Nations Environment Programme (UNEP), and the World Bank. ICRISAT is one of the 16 nonprofit CGIAR-
supported Future Harvest Centers.
The opinions in this publication are those of the authors and not necessarily those of ICRISAT. The designations
employed and the presentation of the material in this publication do not imply the expression of any opinion whatsoever
on the part of the Institute concerning the legal status of any country, territory, city, or area, or of its authorities, or
concerning the delimitation of its frontiers or boundaries. Where trade names are used this does not constitute
endorsement of or discrimination against any product by the Institute.
ICRISAT
International Crops Research Institute for the Semi-Arid TropicsPatancheru 502 324, Andhra Pradesh, India
http://www.icrisat.org
ISSN 1023-4861 2 6 - 2 0 0 3


![Evaluation of pigeonpea [Cajanus cajan (L.) millsp ... · EVALUATION OF PIGEONPEA [Cajanus cajan (L.) Millsp.] ... Improved pigeonpea [Cajanus cajan (L.) Millsp.] ... from Otobi,](https://img.pdfslide.us/doc/110x75/5ac7c4847f8b9a5d718c0d07/evaluation-of-pigeonpea-cajanus-cajan-l-millsp-of-pigeonpea-cajanus-cajan.jpg)