Embed Size (px)
Citation preview
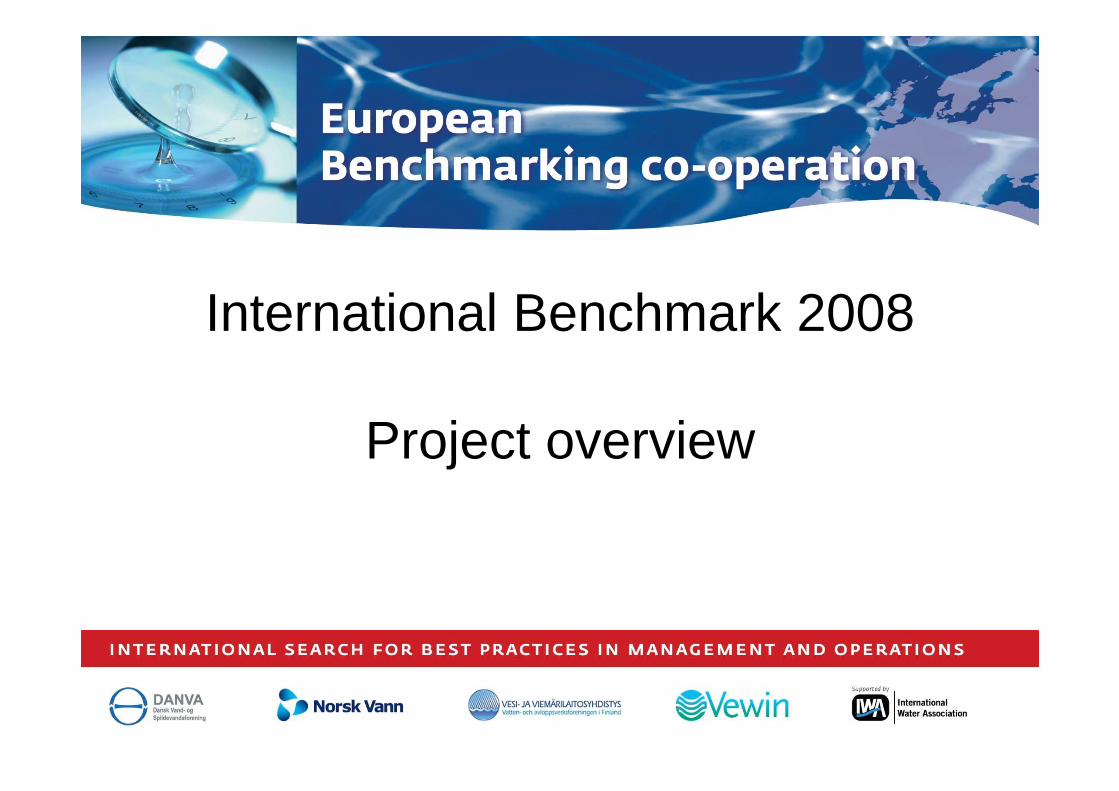
International Benchmark 2008
Project overview
Executive summary
• In 2009 the EBC International Benchmark for Drinking Water and Wastewater has been performed based on 2008 data
• 45 Utilities from 21 countries participated, covering some 50 million inhabitants. Countries of origin are Austria, Belgium, Cyprus, Denmark, Finland, France, Germany, Hungary, Israel, Italy, Malta, Norway, Peru, Poland, Portugal, Romania, Singapore, Spain, Switzerland, The Netherlands, United Kingdom.
• The main results of the International Benchmark have been communicated to the companies in a customised utility report, showing the key performance indicators on 5 performance areas. More extensive and customized reporting can be done by the utilities themselves via the website www.waterbenchmark.org
• On October, 9-10th a workshop was held in Bradford with 47 people from 24 utilities attending. The
Copyright © 2009 EBCInternational Benchmark 2008 – Project overview - 2 -
• On October, 9-10th a workshop was held in Bradford with 47 people from 24 utilities attending. The participants had the opportunity to network, discuss benchmark results, methodology and exchange knowledge on best practices and special topics. In addition, participants had the opportunity to take part in a performance improvement training.
• The project evaluation showed that participants appreciated the project organisation, methodology and reports
• During the Bradford workshop and the project evaluation, several participants have made suggestions for improvement. These suggestions are highly appreciated by the EBC project team and will be taken into account during the preparation for the next benchmarking round (International Benchmark 2009)
• The kick-off of the International Benchmark 2009 is planned to take place in April 2010 to make sure the data entry phase can be completed before the summer holidays
Contents
0. Executive summary
1. About EBC
2. Project objectives & deliverables
3. EBC Value proposition
4. Benchmarking Process & Methodology
5. Participants
Copyright © 2009 EBCInternational Benchmark 2008 – Project overview - 3 -
Supported by
5. Participants
6. Reporting
7. Geneva workshop
8. Evaluation
9. To Conclude
About EBC
About EBC
• The European Benchmarking Co-operation (EBC) was initiated in 2004 by the national water associations and several water utilities of Denmark, Finland, the Netherlands, Norway and Sweden
• Objective of the co-operation is to facilitate water utilities in the continuous process of improving efficiency and transparency
• For this, EBC yearly organises benchmarking exercises. Next to assessing performance, attention is paid to identifying performance gaps and exchanging best practices to enable preparing and implementing individual action plans for business improvement.
• EBC focuses (primarily) on European water utilities (water as well as and wastewater), no matter
Copyright © 2009 EBCInternational Benchmark 2008 – Project overview - 4 -
• EBC focuses (primarily) on European water utilities (water as well as and wastewater), no matter their size or type.
• EBC’s benchmarking programme is fully supported by IWA
Objectives
The project objectives were:
• Benchmarking water and wastewater services on data of 2008;
• Increasing the number of participants to create networking opportunities and exchange of best
practices;
• Focusing on facilitating performance improvement.
Deliverables
The project delivered:
Project objectives & deliverables
Copyright © 2009 EBCInternational Benchmark 2008 – Project overview - 5 -
The project delivered:
• Individual company reports (management reports) and the possibility to create own reports online;
• Web based ICT-tool for data collection and reporting;
• Utilities could network during a workshop in Bradford that was built around three themes:
– Benchmarking results & methodology
– Best practices & special topics
– Performance improvement
• Project overview;
• General report.
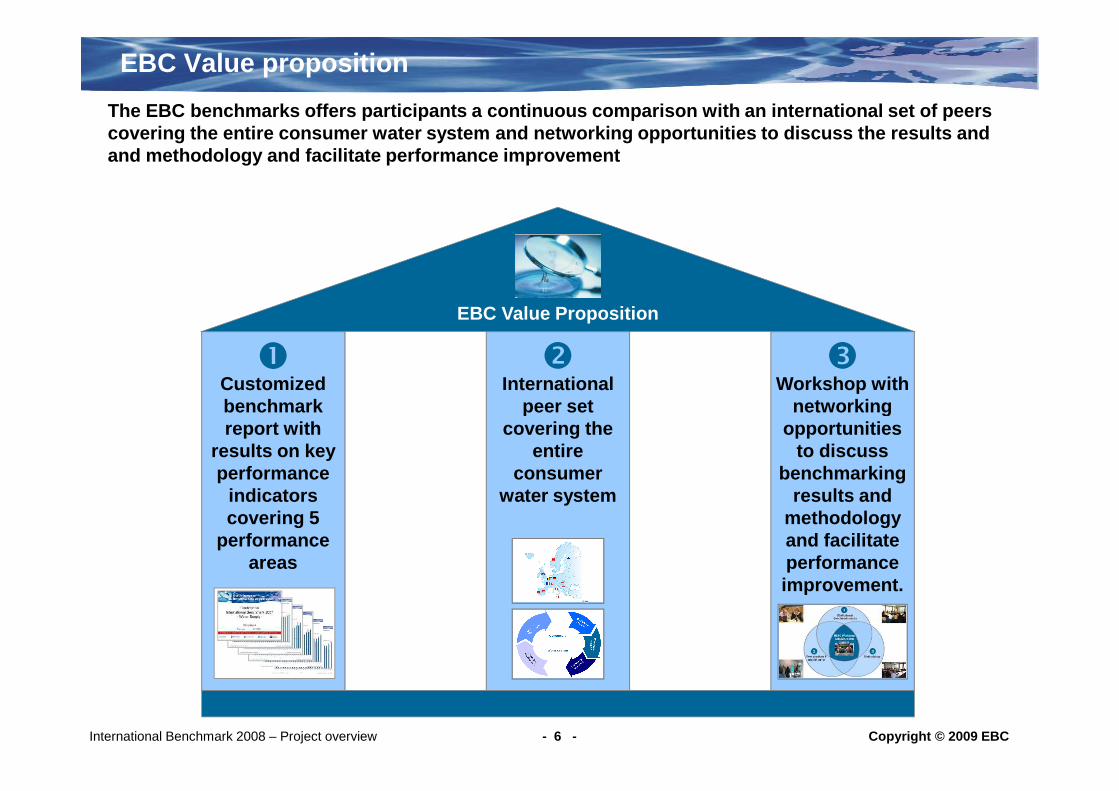
EBC Value proposition
� � �Customized benchmark
International peer set
Workshop with networking
The EBC benchmarks offers participants a continuous comparison with an international set of peers covering the entire consumer water system and netwo rking opportunities to discuss the results and and methodology and facilitate performance improvem ent
EBC Value Proposition
Copyright © 2009 EBCInternational Benchmark 2008 – Project overview - 6 -
benchmark report with
results on key performance
indicators covering 5
performance areas
peer set covering the
entire consumer
water system
networking opportunities
to discuss benchmarking
results and methodology and facilitate performance improvement.
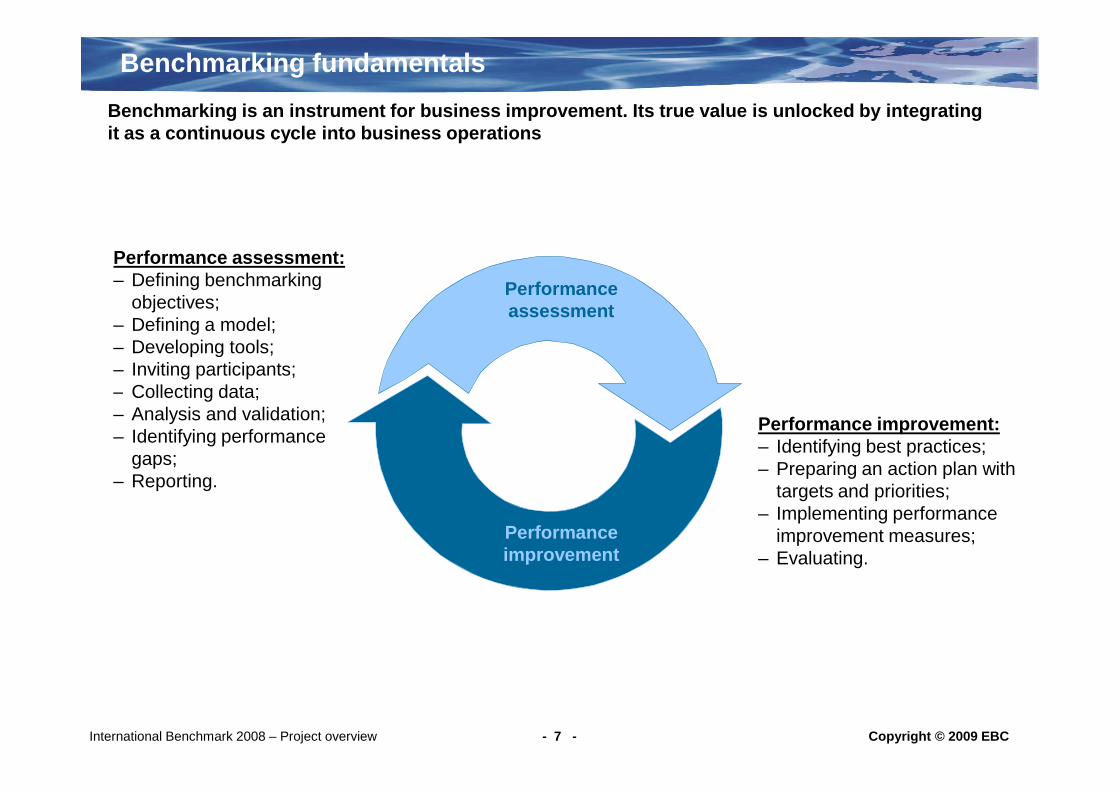
Benchmarking fundamentals
Benchmarking is an instrument for business improvem ent. Its true value is unlocked by integrating it as a continuous cycle into business operations
Performance assessment:– Defining benchmarking
objectives; – Defining a model; – Developing tools; – Inviting participants; – Collecting data;
Performance assessment
Copyright © 2009 EBCInternational Benchmark 2008 – Project overview - 7 -
– Collecting data; – Analysis and validation; – Identifying performance
gaps; – Reporting.
Performance improvement:– Identifying best practices; – Preparing an action plan with
targets and priorities; – Implementing performance
improvement measures;– Evaluating.
Performance improvement
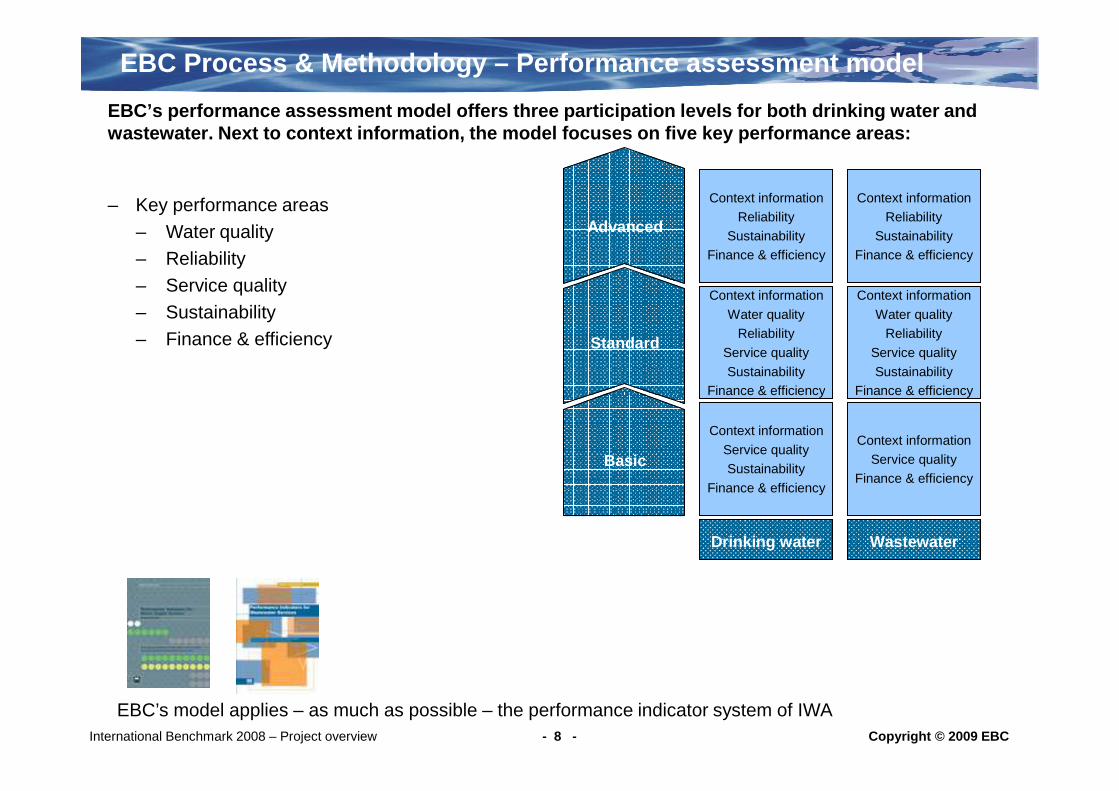
EBC Process & Methodology – Performance assessment m odel
EBC’s performance assessment model offers three par ticipation levels for both drinking water and wastewater. Next to context information, the model focuses on five key performance areas:
– Key performance areas– Water quality– Reliability– Service quality– Sustainability– Finance & efficiency
Context information
Water qualityReliability
Service quality
SustainabilityFinance & efficiency
Context informationReliability
SustainabilityFinance & efficiency
Context information
Water qualityReliability
Service quality
SustainabilityFinance & efficiency
Context informationReliability
SustainabilityFinance & efficiency
Advanced
Standard
Copyright © 2009 EBCInternational Benchmark 2008 – Project overview - 8 -
EBC’s model applies – as much as possible – the performance indicator system of IWA
Drinking water Wastewater
Context information
Service qualitySustainability
Finance & efficiency
Finance & efficiency
Context informationService quality
Finance & efficiency
Finance & efficiency
Basic
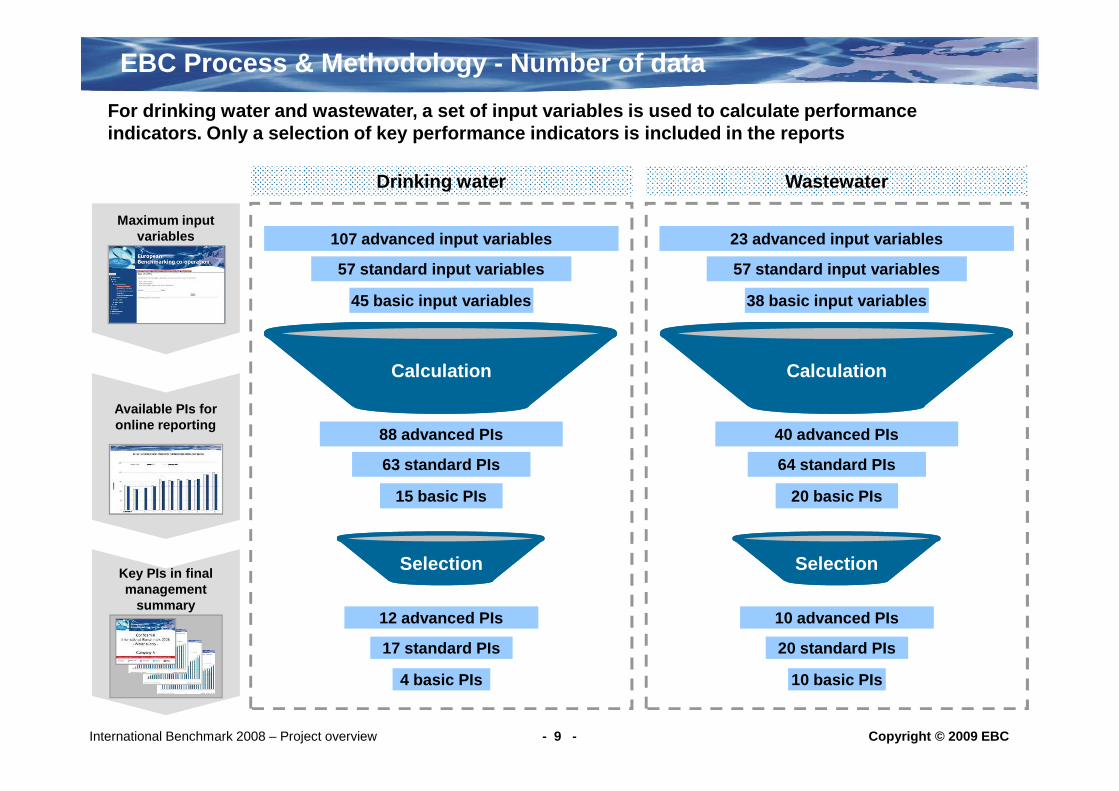
EBC Process & Methodology - Number of data
For drinking water and wastewater, a set of input v ariables is used to calculate performance indicators. Only a selection of key performance ind icators is included in the reports
45 basic input variables
57 standard input variables
107 advanced input variables
Drinking water Wastewater
38 basic input variables
57 standard input variables
23 advanced input variables
Calculation Calculation
Maximum input variables
Copyright © 2009 EBCInternational Benchmark 2008 – Project overview - 9 -
15 basic PIs
63 standard PIs
88 advanced PIs
4 basic PIs
17 standard PIs
12 advanced PIs
20 basic PIs
64 standard PIs
40 advanced PIs
10 basic PIs
20 standard PIs
10 advanced PIs
Selection Selection
Available PIs for online reporting
Key PIs in final management
summary
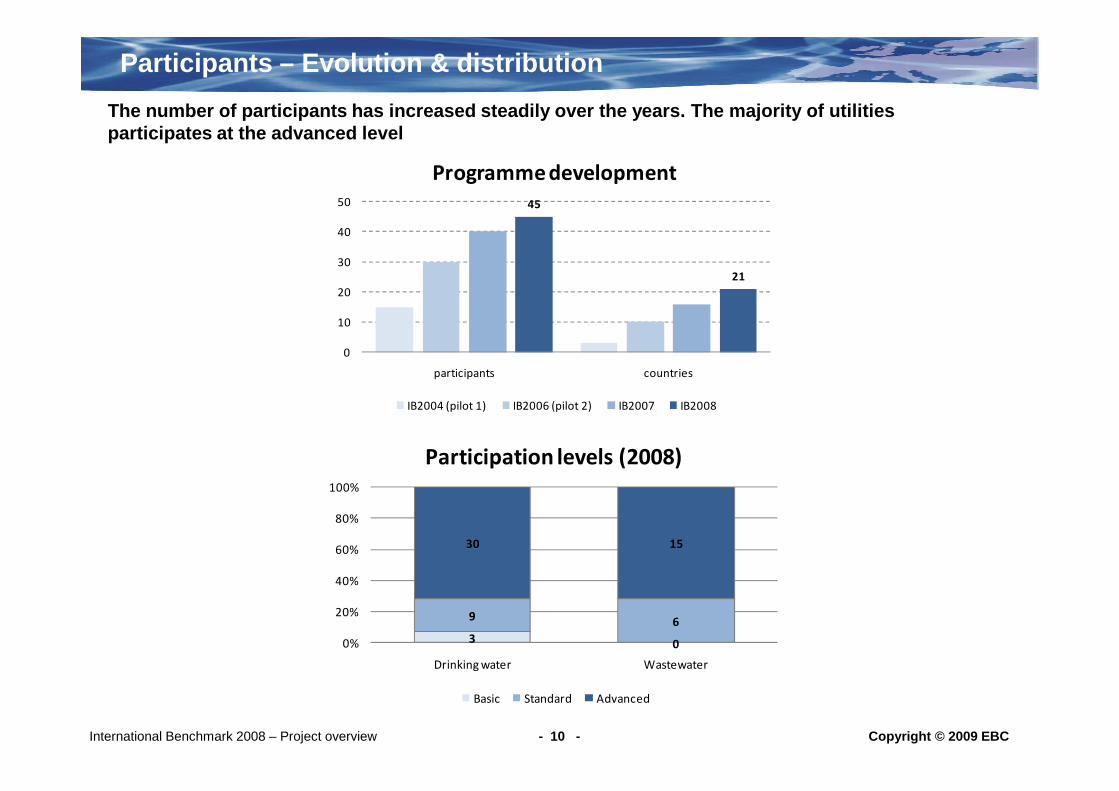
Participants – Evolution & distribution
The number of participants has increased steadily o ver the years. The majority of utilities participates at the advanced level
45
21
0
10
20
30
40
50
participants countries
Programme development
Copyright © 2009 EBCInternational Benchmark 2008 – Project overview - 10 -
IB2004 (pilot 1) IB2006 (pilot 2) IB2007 IB2008
3 0
9 6
30 15
0%
20%
40%
60%
80%
100%
Drinking water Wastewater
Participation levels (2008)
Basic Standard Advanced

Participants – Geographical distribution
Copyright © 2009 EBCInternational Benchmark 2008 – Project overview - 11 -
Countries outside Europe:
Status August 1, 2009:
- 45 participants
- 21 different countries
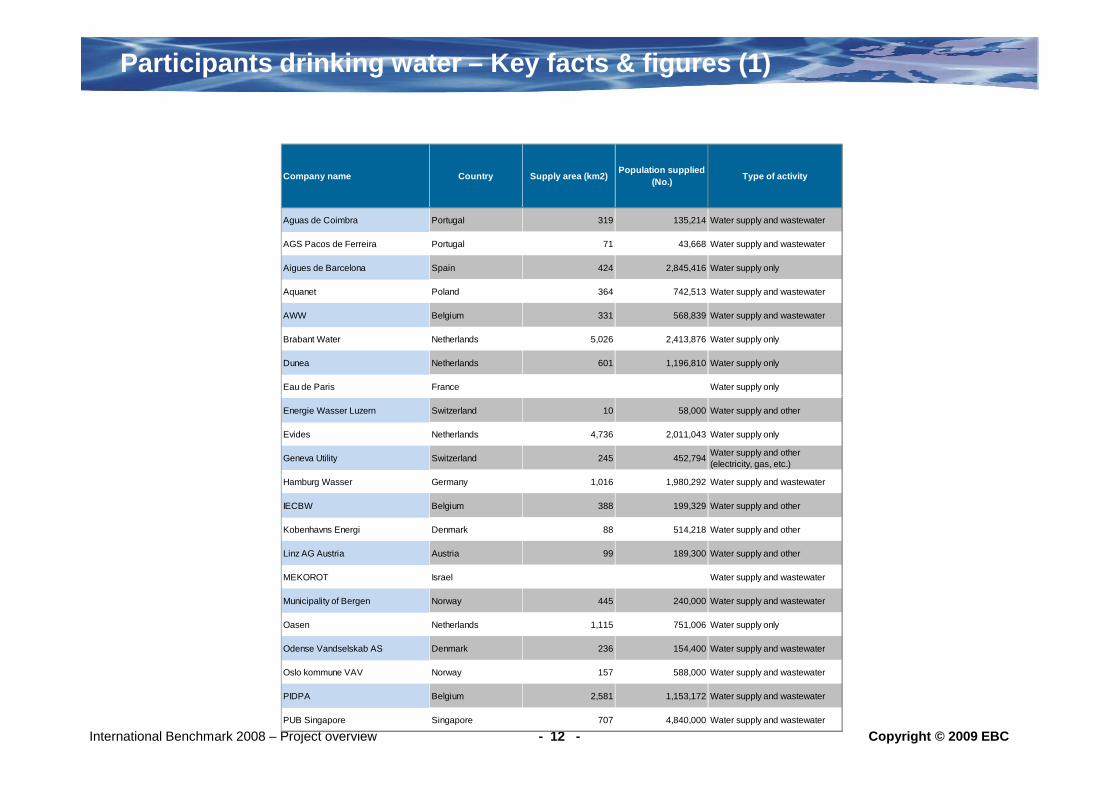
Participants drinking water – Key facts & figures (1 )
Company name Country Supply area (km2)Population supplied
(No.)Type of activity
Aguas de Coimbra Portugal 319 135,214 Water supply and wastewater
AGS Pacos de Ferreira Portugal 71 43,668 Water supply and wastewater
Aigues de Barcelona Spain 424 2,845,416 Water supply only
Aquanet Poland 364 742,513 Water supply and wastewater
AWW Belgium 331 568,839 Water supply and wastewater
Brabant Water Netherlands 5,026 2,413,876 Water supply only
Dunea Netherlands 601 1,196,810 Water supply only
Eau de Paris France Water supply only
Copyright © 2009 EBCInternational Benchmark 2008 – Project overview - 12 -
Energie Wasser Luzern Switzerland 10 58,000 Water supply and other
Evides Netherlands 4,736 2,011,043 Water supply only
Geneva Utility Switzerland 245 452,794Water supply and other (electricity, gas, etc.)
Hamburg Wasser Germany 1,016 1,980,292 Water supply and wastewater
IECBW Belgium 388 199,329 Water supply and other
Kobenhavns Energi Denmark 88 514,218 Water supply and other
Linz AG Austria Austria 99 189,300 Water supply and other
MEKOROT Israel Water supply and wastewater
Municipality of Bergen Norway 445 240,000 Water supply and wastewater
Oasen Netherlands 1,115 751,006 Water supply only
Odense Vandselskab AS Denmark 236 154,400 Water supply and wastewater
Oslo kommune VAV Norway 157 588,000 Water supply and wastewater
PIDPA Belgium 2,581 1,153,172 Water supply and wastewater
PUB Singapore Singapore 707 4,840,000 Water supply and wastewater
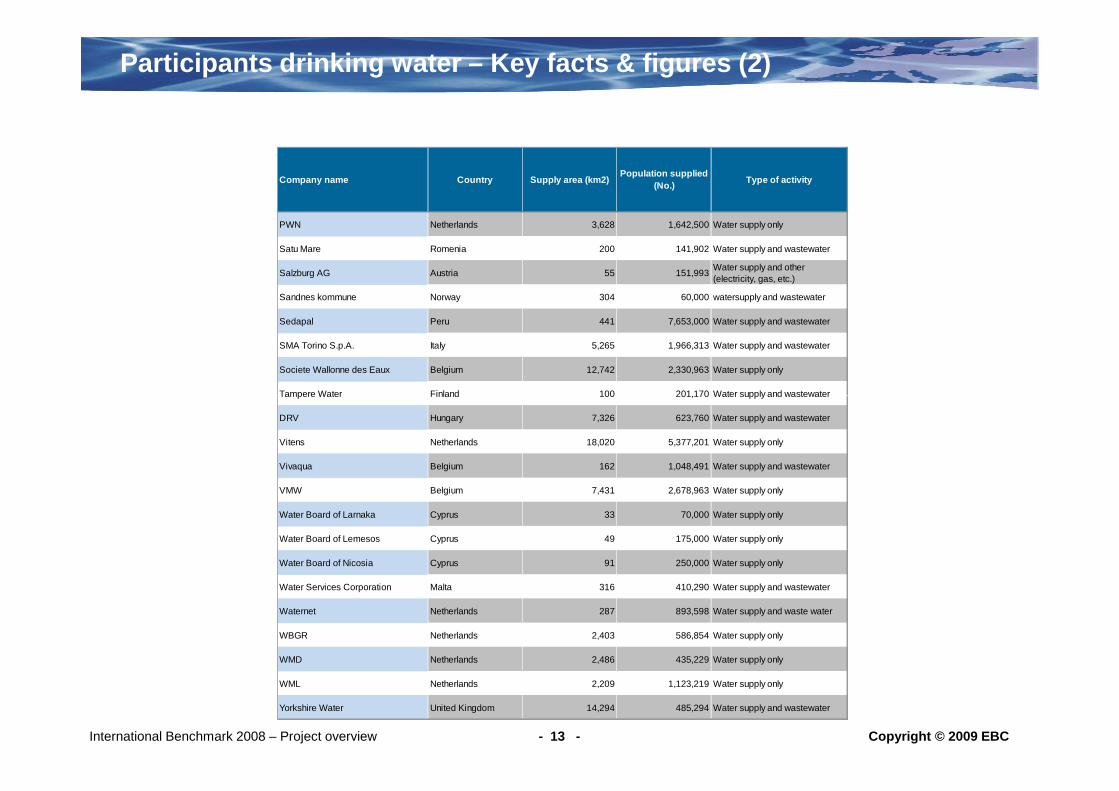
Participants drinking water – Key facts & figures (2 )
Company name Country Supply area (km2)Population supplied
(No.)Type of activity
PWN Netherlands 3,628 1,642,500 Water supply only
Satu Mare Romenia 200 141,902 Water supply and wastewater
Salzburg AG Austria 55 151,993Water supply and other (electricity, gas, etc.)
Sandnes kommune Norway 304 60,000 watersupply and wastewater
Sedapal Peru 441 7,653,000 Water supply and wastewater
SMA Torino S.p.A. Italy 5,265 1,966,313 Water supply and wastewater
Societe Wallonne des Eaux Belgium 12,742 2,330,963 Water supply only
Tampere Water Finland 100 201,170 Water supply and wastewater
Copyright © 2009 EBCInternational Benchmark 2008 – Project overview - 13 -
Tampere Water Finland 100 201,170 Water supply and wastewater
DRV Hungary 7,326 623,760 Water supply and wastewater
Vitens Netherlands 18,020 5,377,201 Water supply only
Vivaqua Belgium 162 1,048,491 Water supply and wastewater
VMW Belgium 7,431 2,678,963 Water supply only
Water Board of Larnaka Cyprus 33 70,000 Water supply only
Water Board of Lemesos Cyprus 49 175,000 Water supply only
Water Board of Nicosia Cyprus 91 250,000 Water supply only
Water Services Corporation Malta 316 410,290 Water supply and wastewater
Waternet Netherlands 287 893,598 Water supply and waste water
WBGR Netherlands 2,403 586,854 Water supply only
WMD Netherlands 2,486 435,229 Water supply only
WML Netherlands 2,209 1,123,219 Water supply only
Yorkshire Water United Kingdom 14,294 485,294 Water supply and wastewater

Participants wastewater – Key facts & figures (1)
Company name Country
Resident population
connected to SE (Inhabitants)
Resident population served by wastewater
treatment plant (Inhabitants)
Type of activity Type of system
Aguas de Coimbra Portugal 124,900 123,814Wastewater and water supply
Collection
AGS Pacos de Ferreira Portugal 35,835 39,749Wastewater and water supply
Collection, transport and treatment
AQUAFIN Belgium 4,563,133 4,444,239 Wastewater only Transport and treatment
Aquanet Poland 621,000 640,000Wastewater and water supply
Collection, transport and treatment
AWW Belgium 675,028Wastewater and water supply
Collection
Geneva Utility Switzerland 451,456 443,810Wastewater and water supply
Transport and treatment
Hamburg Wasser Germany 1,741,824 1,741,824Wastewater and water supply
Collection, transport and treatment
Kobenhavns Energi Denmark 514,218Wastewater and water supply
Collection and transport
Copyright © 2009 EBCInternational Benchmark 2008 – Project overview - 14 -
supply
Municipality of Bergen Norway 227,900 227,900Wastewater and water supply
Collection, transport and treatment
Odense Vandselskab AS Denmark 186,750 186,750Wastewater and water supply
Collection, transport and treatment
Oslo kommune VAV Norway 585,600 585,600Wastewater and water supply
Collection, transport and treatment
PUB Singapore Singapore 4,840,000 4,840,000Wastewater and water supply
Collection, transport and treatment
Satu Mare Romenia 128,518 128,518Wastewater and water supply
collection,transport and treatment
Sandnes kommune Norway 60,000 60,000Wastewater and water supply
Collection, transport and treatment
Sedapal Peru 7,589,000 7,589,000Wastewater and water supply
Collection, transport & treatment
SMA Torino S.p.A. Italy 2,133,588 2,198,000Wastewater and water supply
Collection, transport and treatment
Stadtentwasserung Dresden GmbH Germany 497,478 497,478 Wastewater only Collection, transport and treatment
Tampere Water Finland 201,170 201,170Wastewater and water supply
Collection, transport and treatment
DRV Hungary 409,860 409,860Wastewater and water supply
Collection, transport and treatment
Vivaqua Belgium 817,657Wastewater and water supply
Collection and transport
Waternet Netherlands 752,911 752,911Wastewater and water supply
Collection, transport and treatment
Yorkshire Water United Kingdom 4,901,257 4,861,202Water supply and wastewater
Collection, transport & treatment
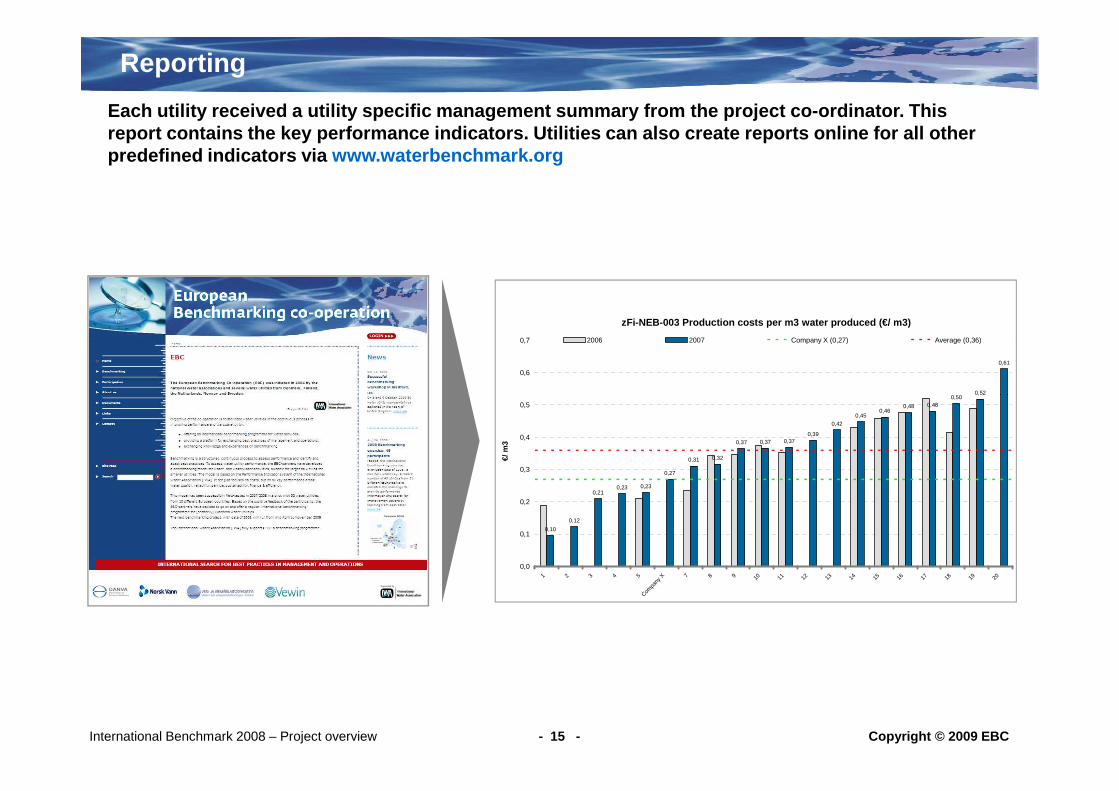
Reporting
Each utility received a utility specific management summary from the project co-ordinator. This report contains the key performance indicators. Uti lities can also create reports online for all other predefined indicators via www.waterbenchmark.org
zFi-NEB-003 Production costs per m3 water produced (€/ m3)
0,500,52
0,61
0,6
0,7 2006 2007 Company X (0,27) Average (0,36)
Copyright © 2009 EBCInternational Benchmark 2008 – Project overview - 15 -
0,10
0,12
0,210,23 0,23
0,27
0,31 0,32
0,37 0,37 0,370,39
0,420,45
0,460,48 0,48
0,500,52
0,0
0,1
0,2
0,3
0,4
0,5
1 2 3 4 5Com
pany
X 7 8 9 10 11 12 13 14 15 16 17 18 19 20
€/ m
3
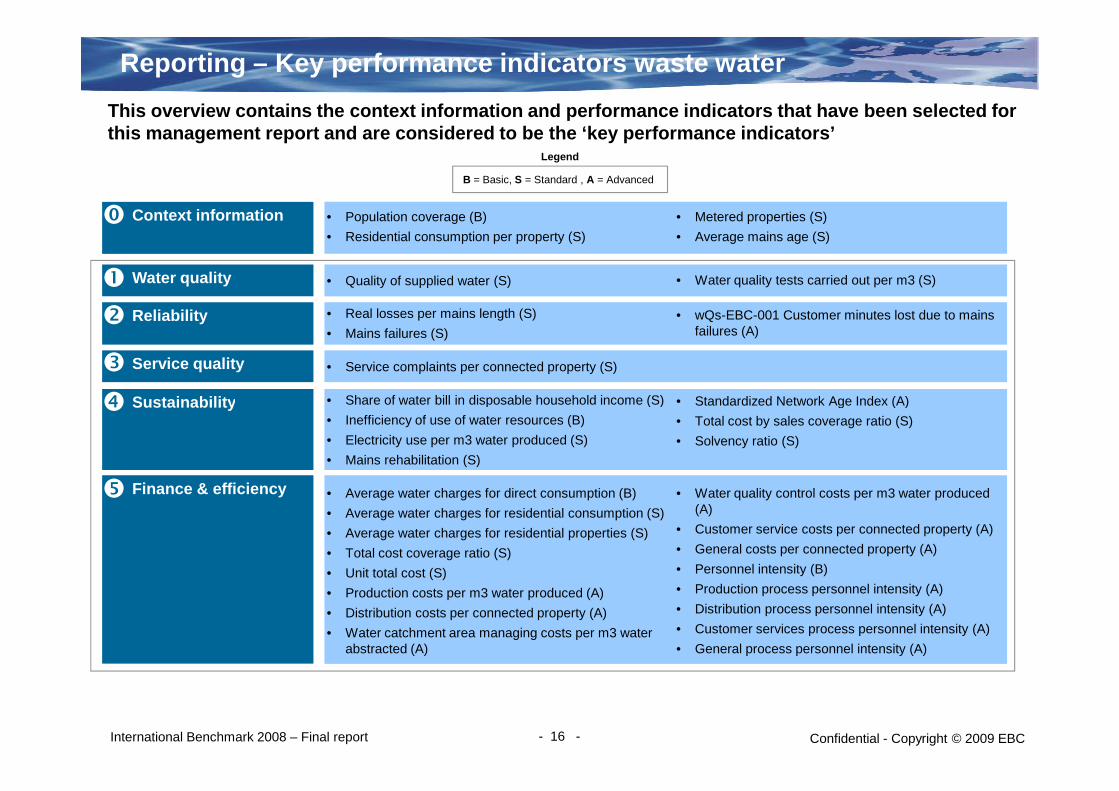
Reporting – Key performance indicators waste water
This overview contains the context information and performance indicators that have been selected for this management report and are considered to be the ‘key performance indicators’
• Population coverage (B)
• Residential consumption per property (S)
• Metered properties (S)
• Average mains age (S)
Context information
Sustainability • Share of water bill in disposable household income (S) • Standardized Network Age Index (A)�
B = Basic, S = Standard , A = Advanced
Legend
�
Service quality • Service complaints per connected property (S)�
Water quality • Quality of supplied water (S)� • Water quality tests carried out per m3 (S)
Reliability • Real losses per mains length (S)
• Mains failures (S)� • wQs-EBC-001 Customer minutes lost due to mains
failures (A)
International Benchmark 2008 – Final report - 16 - Confidential - Copyright © 2009 EBC
Sustainability • Share of water bill in disposable household income (S)
• Inefficiency of use of water resources (B)
• Electricity use per m3 water produced (S)
• Mains rehabilitation (S)
• Standardized Network Age Index (A)
• Total cost by sales coverage ratio (S)
• Solvency ratio (S)
�
Finance & efficiency • Average water charges for direct consumption (B)
• Average water charges for residential consumption (S)
• Average water charges for residential properties (S)
• Total cost coverage ratio (S)
• Unit total cost (S)
• Production costs per m3 water produced (A)
• Distribution costs per connected property (A)
• Water catchment area managing costs per m3 water abstracted (A)
• Water quality control costs per m3 water produced (A)
• Customer service costs per connected property (A)
• General costs per connected property (A)
• Personnel intensity (B)
• Production process personnel intensity (A)
• Distribution process personnel intensity (A)
• Customer services process personnel intensity (A)
• General process personnel intensity (A)
�
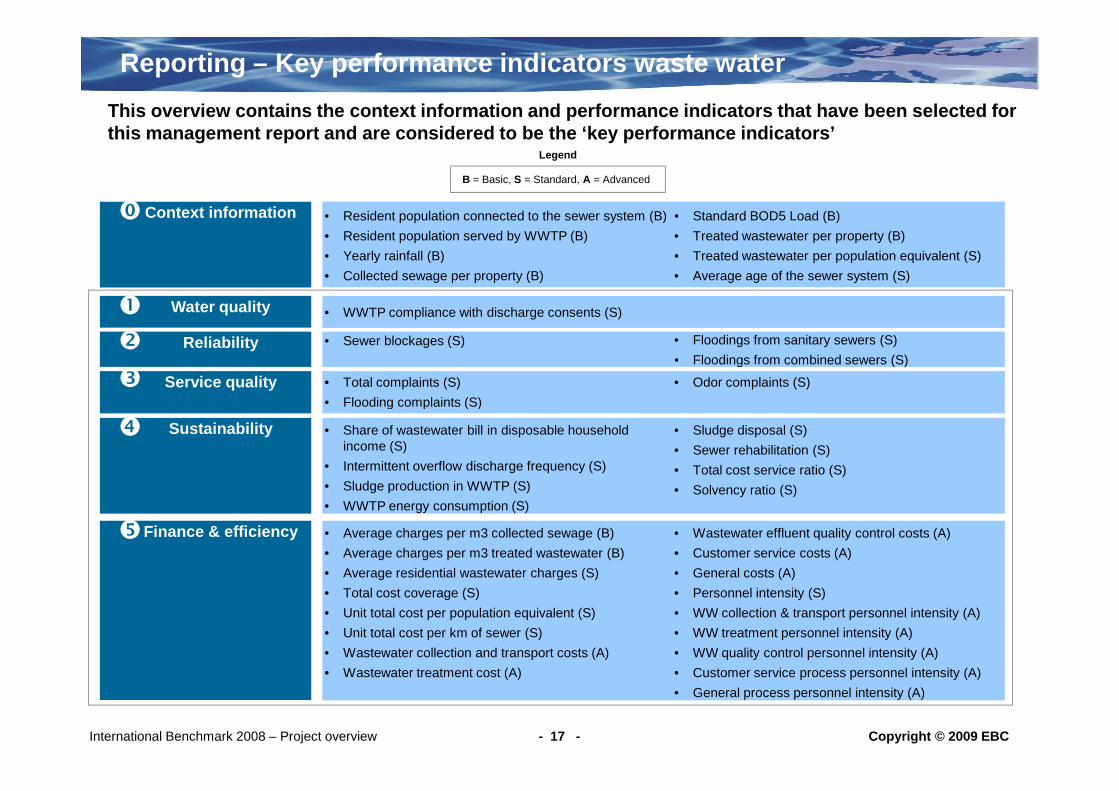
Reporting – Key performance indicators waste water
• Resident population connected to the sewer system (B)
• Resident population served by WWTP (B)
• Yearly rainfall (B)
• Collected sewage per property (B)
• Standard BOD5 Load (B)
• Treated wastewater per property (B)
• Treated wastewater per population equivalent (S)
• Average age of the sewer system (S)
Context information
B = Basic, S = Standard, A = Advanced
Legend
�
Service quality • Total complaints (S)
• Flooding complaints (S)
� • Odor complaints (S)
Water quality • WWTP compliance with discharge consents (S)�
Reliability • Sewer blockages (S)� • Floodings from sanitary sewers (S)
• Floodings from combined sewers (S)
This overview contains the context information and performance indicators that have been selected for this management report and are considered to be the ‘key performance indicators’
Copyright © 2009 EBCInternational Benchmark 2008 – Project overview - 17 -
Sustainability • Share of wastewater bill in disposable household income (S)
• Intermittent overflow discharge frequency (S)
• Sludge production in WWTP (S)
• WWTP energy consumption (S)
• Sludge disposal (S)
• Sewer rehabilitation (S)
• Total cost service ratio (S)
• Solvency ratio (S)
�
Finance & efficiency • Average charges per m3 collected sewage (B)
• Average charges per m3 treated wastewater (B)
• Average residential wastewater charges (S)
• Total cost coverage (S)
• Unit total cost per population equivalent (S)
• Unit total cost per km of sewer (S)
• Wastewater collection and transport costs (A)
• Wastewater treatment cost (A)
• Wastewater effluent quality control costs (A)
• Customer service costs (A)
• General costs (A)
• Personnel intensity (S)
• WW collection & transport personnel intensity (A)
• WW treatment personnel intensity (A)
• WW quality control personnel intensity (A)
• Customer service process personnel intensity (A)
• General process personnel intensity (A)
�
• Flooding complaints (S)
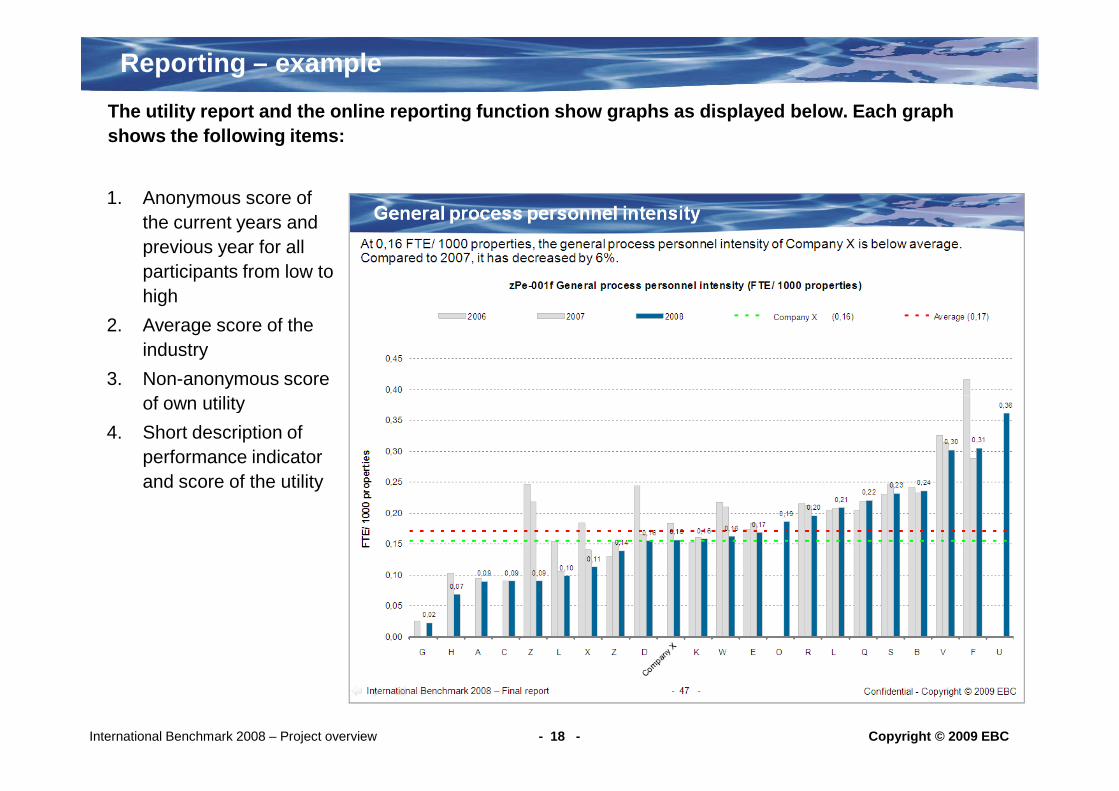
Reporting – example
1. Anonymous score of the current years and previous year for all participants from low to high
2. Average score of the industry
3. Non-anonymous score of own utility
The utility report and the online reporting functio n show graphs as displayed below. Each graph shows the following items:
Copyright © 2009 EBCInternational Benchmark 2008 – Project overview - 18 -
of own utility
4. Short description of performance indicator and score of the utility

Bradford workshop
On October, 9 th and 10 th, 47 people representing 24 utilities attended the EBC workshop in Bradford. The programme for the workshop was built around 3 m ain themes, while there were also lots of opportunities for networking and a site visit.
Benchmark results & methodology
1111
Copyright © 2009 EBCInternational Benchmark 2008 – Project overview - 19 -
EBC WorkshopOctober, 9-10th
Bradford
Best practices & special topics
Performance improvement
training
2222 3333
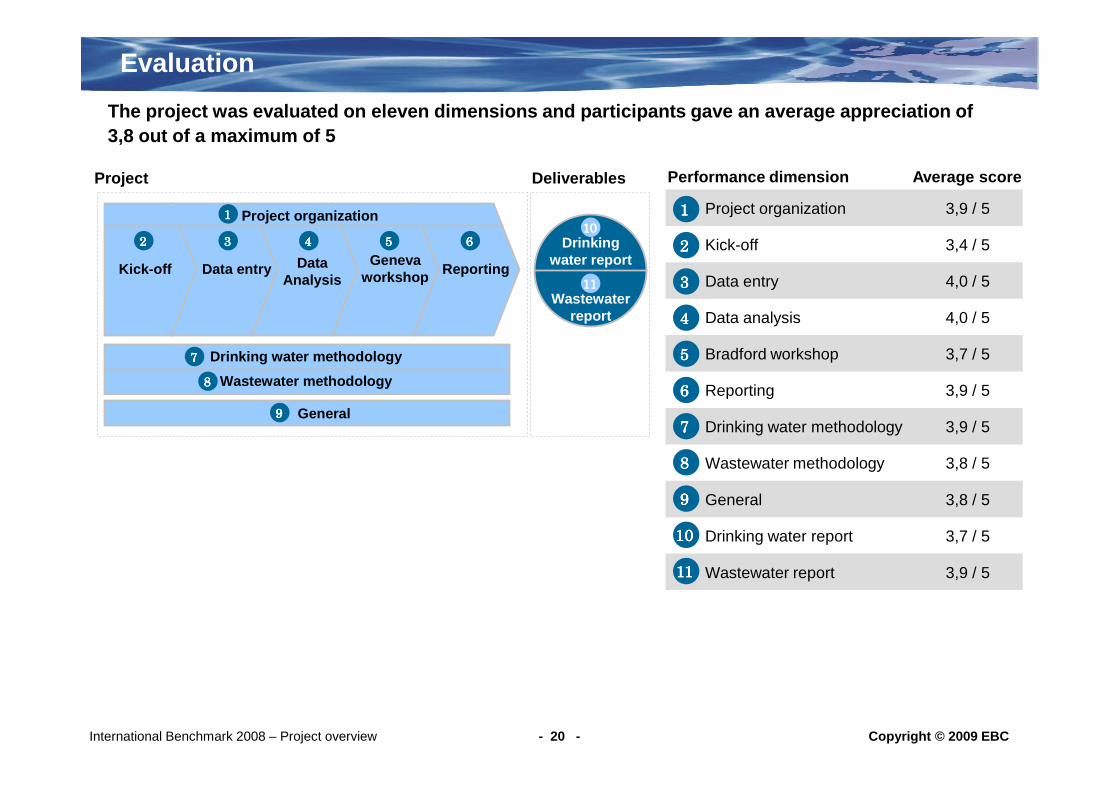
Evaluation
Project organization
Drinking water methodology
Wastewater methodology
Kick-off Data entry Data Analysis
Geneva workshop Reporting
Drinking water report
Wastewater report
1111
2222 3333 4444 5555 6666
7777
8888
10101010
11111111
Project Deliverables
1111
2222
3333
4444
5555
6666
Performance dimension Average score
Project organization
Kick-off
Data entry
Data analysis
Bradford workshop
Reporting
3,9 / 5
3,4 / 5
4,0 / 5
4,0 / 5
3,7 / 5
3,9 / 5
The project was evaluated on eleven dimensions and participants gave an average appreciation of 3,8 out of a maximum of 5
Copyright © 2009 EBCInternational Benchmark 2008 – Project overview - 20 -
General9999
6666
7777
8888
9999
10101010
11111111
Reporting
Drinking water methodology
Wastewater methodology
General
Drinking water report
Wastewater report
3,9 / 5
3,9 / 5
3,8 / 5
3,8 / 5
3,7 / 5
3,9 / 5
To Conclude
Based on the feedback by the participants, the international benchmark for drinking water and wastewater is considered to be successful. The Bradford workshop and project evaluation have revealed several areas for improvement, which will be considered in preparing the next benchmarking round. The aim is, once more, to create as much added value as possible for utilities.
Colofon:
EBC
Copyright © 2009 EBCInternational Benchmark 2008 – Project overview - 21 -
EBCc/o VewinP.O. Box 10192280 CA RijswijkThe [email protected]