Embed Size (px)
Citation preview

RESTRICTED
R*porf No. PTR-108a
This report iS for official use only by the Bank Group and speciflaly authoriazed rpnizationsor perons It nay not be published, quoted or cited without Bank Group authorizAtion. TheBank Group does not accept responsibflity for the accuray or completenes of the report.
INTERNATIONAL BANK FOR RECONSTRUCTION AND DEVELOPMENT
INTERNATIONAL DEVELOPMENT ASSOCIATION
APPRAISAL OF
A PORT PROJECT
PAPUA NEW GUINEA
April 10, 1972
Transportation Projects Department
Pub
lic D
iscl
osur
e A
utho
rized
Pub
lic D
iscl
osur
e A
utho
rized
Pub
lic D
iscl
osur
e A
utho
rized
Pub
lic D
iscl
osur
e A
utho
rized

Currency Equivalents
Currency Uhit - Australian DollarUS$1 a A$ 0.8397A$ 1 * US$1.1909A$ 1 dilion = US$1,190,900
Weights and Measures
1 ton * freight ton, i.e. 2,2240 lbor 40 cu ft
Financial Year
July 1 - June 30
ACronyrms and Abbreviations
Administration - Administration of Papua New GuineaDOT - Department of Transportationdwt - Deadweight tonsEIU - Economist Intelligence UnitLwOST - Low Water Ordinary Spring TidePNG - Papua New GuineaPNGHB - Papua Now Guinea Harbours Boardsu ft - Super foot: timber measurement equal to one board foot
or one foot square by one inch thick.

PAPUA NET I GUI1iIEA
APPRAISAL OF PORT PROJECT
Table of Contents
Page NSe
SUMVIARY AND CONCLUSIONS iii
1. INTRODUCTION 1
2, BACIKGROTID 2
A, Economic Setting 2B. The Transport Sector 3C. Transport Adininistration, Coordination and Development 4
3. PORT ORGANIZATION AIND ADMINISTRATION 6
4. THE PROJECT PORTS 9
A. Port Traffic., Current and Required Facilities 9B. Port Operaticns 10
5. THE PROJECT 12
A. Project Items 12B. Cost Estimates 12C. Subsoil Conditions 13D. Execution 14E. Engineering Consultants Services 14F0 Procurement and Disbursement 14Go Land Acquisition 15H. Finance 15I. Other Port DevelopmentsJ. Ecology 15
6. TRAFFIC FORECASTS AND ECONOMIC EVAUJATION 16
A. Traffic Forecasts 16B. Economic Evaluation 17
7, FINANCIAL ASPECTS 19
A. Present Position 19B. Financial and Tariff Policy 19C. Future Earnings 20D. Financing Plan, Cash Flow and Balance Sheets 21E. Conclusions and Undertakings on Financial Aspects 23
8. RECOMMENDATIONS 2'
This report was prepared by Messrs. A.H. Clark (inancial analyst),N. Heggemsnes (economist), C. John (economist), D, Johnson (engiree.r) and2, Scheiner (consulting engineer) and edited by Mfiss A-o 3sifer. Mr. .loSIParthasarathi assisted in the economic eval:iatior>

-2-
TABLES
1. Cost Estimates2. (a) Project EXpenditures
(b) Disbursement Schedule3. Port Development Program4. Traffic Forecasts
(a) Port Moresby(b) Lae - with traffic diversion to Mad'ng(c) Lae - without traffic diversion to Madang(d) Kieta(e) Samarai/Alotau
5. Economic Benefits of the Project6. Economic Return Sensitivity Analysis7. Current Tariffs8. Recommended Tariff Rates9. Revenue Accounts10. Total Debt Service11. Balance Sheets12. Existing Debt13. Sin,king Funds14. Cash Flow S;.atement
ANNE2E,)
1. Tof,al Foreign Traffic Development2. Port Operations3. Existing Facilities in Project Ports4. Stevedoring Labor Awards5. Project Items6. Project Alternatives7. Future Cargo Flows through Project Ports8. Rationale of Economic Evaluation9. Generated and Negative Benefits - Alotau10. Simulation - Lae11. Financial Assumptions
MAPS
1. Papua New Guinea2. Port of Port Moresby3. Port of Lae4. Port of Kieta5. Port of Alotau

PAPUJA NEM GUINEA
APPRAISAL OF PORT PROJECT
SUMHARY A\ID CONCLUSIONS
i. This report appraises a project to improve three of the mainpublic seaports in the Territory of Papua New Guinea (PNG) - Port Moresby,Lae and Kieta - and construct a new port at Alotau to replace old facilitieson an off-shore island at Samarai. The project also includes some equip-ment and a training program for port accounting staff. The total cost isestimated at US$11.1 million equivalent, of which costs to be incurredoutside PNG (off-shore costs 1/) are est3.rnated at US$9.2 million equivalentand will be financed by the proposed IDA credit.
ii. The project originated with a UNDP-financed and Bank-supervisedTransport '3urvey. It will cover most of the firm major port items in thePNG Administration's investment program for the period 1971/72-1975/76(based on the Survey), except for expansion of the port of Nadang, thejustification for which must await a decision on construction of a newaccess road from Madang to the interior Highlands to tap a large developingarea. Feasibility st0ies of this road are scheduled to be comapleted soon.Further investmelits are planned for Port Moresby and Lae extending intothe later 1970's but these will depend on traffic developments and furtherstudies.
iii. The Conmonwealth of Australia will guarantee the credit on behalfof PNG (Borrower) which Australia administers. This credit will be thefirst Bank Group lending operation for ports in PNG. In June 1970, theBank and the Association jointly provided US$9 million for a highwaysproject (Loan 693/Credit 204-PNG).
iv. The Papua New Guinea Harbours Board (PNGHB), which will be thebeneficiary, assumed operational responsibility for the principal portsin July 1967 and financial responsibility on January 1, 1968. PNGHB is astatutory corporation with adequate powers to conduct its affairs inaccordance with sound practices, subject to certain overriding policypowers held by the PNG Administrator and Minister of Transport.
v. Traffic through the project ports grew from 634,o000 tons in1968/69 to 1.114 million tons in 1970/71. Although this included majorconstruction items for a large copper mine now under development near theproject port of Kieta on Bougainville Island, other traffic increased by11% p.a. over the two-year period. Over the longer term, traffic, exclusiveof copper ore, is expected to increase about 6% annually to nearly 1.5 millicntons in 1980/81. Growth has been and continues to be greatest at the port of Lae
1/ "Off-shore" costs relate to all expenditures for goods and services madeoutside PNG, including those made in Australian dollars, the localcurrency. They represent the equivalent of a foreign exchange componentto an independent country. This distinction has been made in all pre-vious lending to PNG.

- ii -
resulting from the opening up of the New Guinea interior by the 1966 com-pletion of a road connecting Lae with the Western Highlands; expanding areasare being put under cultivation for both market gardenirg and cash crops(notably coffee) by the indigenous population and by expatriates. The Lac-Highlands road is being improved under Loan 693/Credit 204-PNG.
vi, The demand for port services has outstripped investments, especi-ally at Lae, which accounts for nearlytwo-thirds of the project. Becauseof the geographic conditions, coastwise traffic has grown generally withforeign traffic and at all project ports a shortage of berthing and/or stor-age facilities has resulted in serious congestion, relieved somewhat by in-creased productivity from a marked trend towards cargo unitization, includingcontainers. Another factor, contributing to congestion, has been inefficientoperational practices stemming from a multiplicity of private stevedoringservices and lack of overall organization and control. The PNGHB has thepowers necessary to correct these features and is now doing so. It is nowagreed that the existing port By-laws will be enforced immediately and acontinuing review of further operating improvement requirements wil.. be under-taken.
vii. PNGHB's management is able and its staff is cormpetent. However,at present, most senior staff members are expatriates. PNGHB intends to in-crease its management staff to enable it to handle its expanding responsibil-ities >^nd to train indigenous staff members to take more respcnsible posts.The project includes training for accounting staff.
viii. PNGHB's tariffs have, in general, not changed since 1958; they arenot only too low but also badly structured and unrelated to costs. With anew tariff structure, as recommended by consultants, PNIGLB will become fi-nancially viable and the prompt introduction of appropriate revisions willenable PNGHB to finance the local currency costs. Credit effectiveness isdependent upon approval of revised tariffs.
ix. Consalting services will be provided by the Australian Mrinistryof Works and the PINIG Public Works Department. Procurement will be on thebasis of international competitive bidding in accordance with IDA guidelines.Retroactive financing of about US$250,000 will be required for detailedengineering and soil surveys.
x. The credit proceeds will be relent to PNGHB on Bank terms, i.e.,for a period of 25 years including four years' grace with interest at 74%p,a. There will also be a project agreement between PcNGHB and the Association.
xi. The proposed project would earn an economic return of 27% and issuitable for an IDA credit of US$9.2 million equivalent on the usual termsto the Administration of FNG with the guarantee of the Commonwealth ofAustralia.

1. IMTRCDUCTIOI
1.01 The Administration of Papua New Guinea (PNG) has requested theAssociation, through the Government of Australia, to assist in financingimprovements to the ports of Port Moresby, Lae arid Kieta and constructionof a new port at Alotau to replace existing but obsolete facilities atSamarai.
1.02 The proposed project originated with a UNDP-financed and Bank-supervised transport survey in 1968/69 by Sir William Halcrow and Partners(UK), which recommended that master plans for development be drawn up forall ports under the jurisdiction of the Papua New Guinea Harbours Board(PNGHB). Feasibility studies and master plans were prepared by M4aunselland Partners (Australia) for Port Nloresby, and by NEIEC0 (Holland) for Lae,Kieta and Alotaus A study for Port Madang by Sir Bruce White, Wolfe-Barryand Partners (UK) is nearing completion. In August 1971 the EcononistIntelligence Unit (EIU (UK) ) completed a tariff study for all ports whichhandle foreign cargo in PNG.
1.03 The total cost of the proposed proJect would be US$11.1 millionequivalent of which the off-shore component, to be financed by the proposedIDA credit, would be US$9,2 miMlion equivalent. The credit would be tothe PNG Adminis ½ration with the Goverrment of Australia acting as guarantor.PNGHB would execate tLe project under the guidance of the Admij-istration'sDepartmenit of Transportation. These arrangements are similar to thoseentered into in connection with previous lending operations in PNG.
1.04 This would be the first Bank Group port operation in PNG. A com-bined loan/credit of US$9.0 million (Nos. 693/204-PNG) was made on June 27,1970, to finance improvements of sections of the Highlands Highway (whichlinks the Highlands to the port of Lae) and a detailed engineering study of asecond access road to the Highlands from the Port of Niadang.
1.05 In September/October 1971, a mission composed of Messrs. AoHa Clark(financial analyst), N. Heggemsnes (economist), C. John (economist), D. Johx-son (engineer) and R.Y. Scheiner (engineer-consultant) visited PNG to appraisethe project. This report is based on their findings.

- 2 -
2. BACKGROUND
A. Economic Settig
2.01 PNG, administered by Australia as one unit, consists of Papua, anAustralian deper.dency, and New Guinea, a United Nations Trusteeship territory.Politically it is in a transitional stage; internal self-govermnent isexpected by 1976 and full independence some time thereafter. Physically,it comprises the eastern half of the island of' New rjuinea (the mainland),the northernmost Solomon Islands and the Bismarok Archipelago (Map 1). Itis a country of higl, rugged mountain ranges, wide valleys, large riversystems, jungles and swamps and has a total coastline lerigth of 6,000 mi.Highway construction is difficult and co:3tLy. The indigenous population isestimated at about 2 4 million, growing at about 2.5% p.a. The non-indigenouspopulation numbers about 50,000 and has grown by about 9% p.a. over the pastfew years. Average population is only 13 to the sq mi but deiisity ranges from1.5 to 60. The largest towns are Port M4oresby, the capital (about 50,000)and Lae (about 24h000).
2.02 The economy is in an early stage of development and is based onprimary production. Its monetary sector is heavily dependent on externaltrade; annual irr,orts are currently valued at A$ 182 million while exports,mairly copra, ccifee, cocoa, timber and timber products, and nrbber are valuedat A$ 70 million, producing an unifavorable trade balance of A$ 112 million,i.e., about 60% of imports. Th:fs situation is expected to imp3ove when exportaof copper conceantrates start froim Bougainville Island in 1972. PNG reliesheavily on technical and financial assistarnce from Australia and will continueto do so for a long time, as Australia has indicated that it is prepared tomake substantial aid available after independence.
2q03 Subsistence-level agriculture accounts for about 40% of GI@ and isgrowing at about 2.5% annually. Per capita income of the indigenous popula-tion as a whole is about US$150 annual7y but will receive an acceleratingimpetus from the combined effects of education, the growth of indigenousagriculture, industry and tourism, and the copper mining enterprise on Bou-gainville Island. GNP in the monetized sector, valued at about US$390 millior.in 1969/70, increased at constant prices at an average of 14.% annually between1965/66 and 1968/69 and by 32% in 1969/70 (largely because of the copper enter-prise)
2.04 Apart from small enclaves around the principal ports, there wasvirtually no development of the interior or roads connecting ports on thesame island ntil after World War II and communications were by coastalshipping. After the war some 25,000 tons were transported annually by airto and from the interior and the ports, mainly Madang, but also Lae. By 1966through connection was established between Lae and Mt. Hagen - the so-calledLae-Highlands Highway - and air traffic fell off sharply. Madang lost partof its traffic and has since stagnated, but conversely, the demand for portservices at Lae has outstripped the facilities.

- 3 -
2.05 In the past, economic development has been almost exclusively inthe hands of expatriates. However, an important aspect of opening up theinterior is that increasing numbers of the indigenous population are turningfrom subsistence agriculture or hunting to plantation owning and cash cropfanning. The Administration is encouraging this trend as well as the develop-ment of light industries and tourism.
B. The Transport Sector
(a) General
2.06 Transport demand in PNG is focused upon import and export needs,coupled with Government acministrative requirements. At present, coastaland foreign shipping dominates the transport scene, supplemented by airtransport, but road transport is of growing significance despite the naturalgeographical difficulties. There are no railways. The last few years havebeen a period of rapid development which has imposed strains on all ports,except Madang, and especially at Lae.
(b) Highways
2.07 Apart from the Lae-EDhlands Highway, the road system is largelyconcentrated in unconmected areas in and near the ports and administrativecenters. There cre about 7,500 mi of public roads, of which about 300 areurban, 1,030 are classified as primary and secondary non-urban, and 6,200 asfeeder -md access, carrying light traffic. Registered motor vehlicles havebeen ixireasing by about 17% annually since 1963 and there are now some 29,00(X
2.08 In June 1970 the Bank Group provided Us$9.0 million to improve theLae-Highlands Highway to be completed by 1973/74. Also included was a detailedengineering study for a new access road from Madang to the Western Highlands.If this new road is constructed some 100,000 tons of traffic are expected to bediverted from Lae to Madang, thus reducing demand for additional port invest-ment at Lae over and above the proposed project with a corresponding increaseat Madang. Other road construction is also provisionally planned or underway, including connection between Iiadang and Lae.
(c) Civil Aviaticn
2.09 Air transport has been the most important mode of transport forpassenger traffic, both within PNG and externally. However, the considerablevolume of freight once moved by air has decreased because of the constructionof the Lae-Highlands Highway. Passenger traffic has been increasing steadilyby about 16% annually in recent years. The only international airport is atPort Moresby although another one is under consideration at Lae. Internalair services are operated by Australian and domestic airlines and a few chartercompanies. There are numerous airfields and airstrips in all parts of thecountry.

- 4 -
(d) Seaports and Shipping
2.10 There are some 35 public seaports, jetties and landing stages.The main ports are Port Moresby, Lae, Madang and Alotau-Samarai on NewGuinea, and Rabaul and Kieta on other islands (Map 1). These handle about95% of PNG's foreign traffic, as well as distributing and collecting cargo toand from the other ports by coastal vessel. There are also a few privatespecial cargo ports, including Loloho, the copper company's port near Kietaon Bougainville Island. Total traffic, foreign and coastwise, grew by about18% annually between 1968/69 and 1970/71, foreign imports by about 16% andexports 10%. The unusually high growth rates are in part due to requirementsof the Bougainville copper development, but the rapid development of thecountry was also significant and the growth in other traffic averaged 11%.The continuing and growing importance of coastal traffic for distributingimports and collecting exports has resulted in competition for berth spacewith overseas shipping and congestion of storage facilities at the ports.
2.11 Between 1967/68 and 1970/71 overseas ship calls rose from 530 to700 and coastal vessels from 6,300 to 8,000. Significant changes have beenmade in ship schedules and cargo-handling techniques to reduce the number ofports of call and speed turnaronnd. Containers and other unitized cargo-handling methods are being empoyed to an increasing degree, achieving highthroughput rates and reducing the demand for additional investment. PNGHBhas encouraged this by introducing berth reservations for ships adopt-ing uniti-zed ca-Igo techniques.
C. Transport Acdministration, Coordination and Development
2.12 As a result of the recommendations of the UNDP consultants and thenegotiations for the highway projct, a Department of Transportation wascreated in 1970 under a Minister of Transport with primary responsibility forall internal transportation. Air transport, so far, remains under theCommonwealth Department of Civil Aviation and licensing of coastal shippingand training responsibilities under the Division of Miarine of the PMG Depart-ment of Trade and Industry. The Department of Transportation developstransport policy, defines investment needs, and prepares projects for sub-mission to the Administration. Close cooperation is maintained with the PNGPublic Works Department (PI-M), responsible for highway construction and main-tenance, and continuing assistance is given by the Commonwealth Department ofWorks (COMWORKS). Within the Departrent various Divisions and bodies areresponsible for road safety, load limits and traffic control and for licensingand regulation of public passenger vehicles. Major public porLs are operatedand maintained by PNGHB , a statutory body responsible to the Minister, whileminor ports are controlled by the Departient of Transportation.
2,,13 The Department is conducting economic feasibility studies with theaim of developing the interior and providing access to new areas and, wherenecessary, between existing developed coastal areas. In the past, competitionbetween modes has not been important but intermodal coordination will requireconsideration in the future as between coastal shipping and road transport.

Lack of indigenous trained personnel is a constraint and intensive trainingschemes are being undertaken by both the Administration and Commonwealth.However, this is a long-tei'm program and expatriate personnel and consultantswill be required for many years. The progress of transport coordination willbe kept under continual review within the Bank group,
2 14 The Admiaistration's transportation program is based on the UNDPstudy, and is subject to periodic review. The aim is at least a minimumroad network connecting major population, production and resource areas andincludes rural development and penetration roads. Development of the interiorand of the road network must be paralleled by port development. The UNDP con-sultants recommended total investment in the transport sector of about US$180IrillIon over a period of five years of which US$126 million was for roads andUS$16 million for maritime projects. The Administration's present program to1972/73 envisages a total of about US$124 million of which US$104 million isfor roads and US$17 million for ports and shipping. The proposed projectwould be consistent- with this paogram.

- 6 -
3. PORT ORGANIZATION AND ADMINISTRATION
3.01 PNG's major ports are operated and maintained by PNGHB, a bodycorporate capable of acquiring and disposing of real and personal property,The Board was created by the Papua New Guinean Harbours Board Ordinance 1963.It consists of a Chairman and six members, appointed by the PNG Minister ofTransport on the recommendation of the Adninistrator. The functions of theBoard are comprehensive and it has adequate powers to perform these functionsand to enter into contracts and agreements as necessary. PNGHB may make By-leTJ ; for the control, regulation and management of the portis for which it isres-onsible. By-laws currently exist regulating: (i) vehicular traffic, useof machinery and handling of goods on wharves; (ii) licensing of and theduties of stevedores, including the care of equipment; (iii) port dues andcharges; (iv) berthing and mooring of vessels; (v) navigation; (vi) dan-gerous goods; (vii) passenger jetties; and (viii) conduct of tha Board'sbusiness and form of accounts. PNGHB assumed operational responsibilityfor the principal ports in July 1967 and financial responsibility on January1, 1968.
3.02 PNGHB's autonomy in day-to-day matters is subject to an overridingprovision that its actions sha-l be governed by any policy directives givenby the Administr. or or the PLVl.ister of Transport. Additionally, the termsand conditions cL employment of its officers and of temporary or casual emplcye^-sare laid down by the Minister. Such provisions are normal and necessary to tJ.erespo:r -ble Minimster. In this c_se their exercise has not resulted in undueinterse--tion an(i it is expected that they will continue to be exercised in asatisfa-,tory mamner.
3.03 Under the Ordinance creating PNGHB, the Admiristrator may declarecertain ports to be subject to PNG-B control. Nine ports have been sodesignated to date: Port Moresby, Lae, Kieta, Samarai, Madang, RaDaul,Kavieng, Kimbe and Wewak. It is expected that the ports of Laurengau andOro Bay will be added by January 1973. The port of Alotau will be placedunder PNGEB jurisdiction before construction of the proposed new port facilitybegins.
3.04 Each designated port has a Port Advisory Committee of five to nineappointed members representing port users and labor interests. The Commit-tee is empowered to make local rules under the Ordinan,ce and By-laws onmatters relating to port operations, subject to PNGHB approval.
3.05 PNGHB, which is exempu from income taxes, must maintain properaccounts and submit to audit by the Australian Auditor-General. Annualreports on operations and finance are required, together with an annualbudget. Port development programs and financial plans must be prepared ona five-year basis. All borrowing must be approved by the Administrator andthere are provisions within the Ordi.nance for Australian Government guaranteeoof approved loans.

- 7 -
3.06 The present PNGHB Chairman is also General Manager. The two posi-tions are likely to be split when the present incumbent's term of officeexpires in December 1972. The next senior officer is the Secretary, respon-sible for all administrative procedures, including finance. The Adminis-tration and PNGHB agree to consult the Association on the appointment ofChief Executive and Chief Financial officers.
Present Accounting Systems, Audit and Insurance
3.07 At the time of appraisal the reval.uation of fixed assets takenover by PNGHB had not been completed because no decision had been made asto the bases to be used. Fixed assets have, therefore, been recorded athistorical written-down values. Land was provisionally valued by the Valuer-General of PNG but is not recorded in the accounts, the total amount beingabout A$ 1.8 million. As a result, the Australian Auditor-General wasunable to complete the audit and no audit reports had been prepared. Assetvaluations were being compiled, taking inflation into account. The Admin-istration has since decided that all land within the port area alreadyunder PNGHB control shall be leased to PNGHB for 99 years. A law has beenpassed establishing the capital of PNGHB at the capitalized value of landleases granted to PNGHB plus the values of other property acqu--'red byPNGHB from the A einistration; +the capital value is about A$ 801 million.The law also urovictes for PNIGHB to pay the Administration, out of the prof-its of any finaroial year, an amount to be determLined by the Administrationtaking zcount of information furnished by PNGHB relating to it4s financialaffair,. This is acceptable. in this report it has been assumed that suchpayments will be the equivalent of a dividend on original equity capital of8% per annum. No payment is required from profits earned prior to July 1,1972.
3.08 The financial accounting systems have been adequate until now,but tosting systems have not been introduced and management information sys-tems are rudimentary, At present, no indigenous accounting staff is em-ployed. Because of the widespread interests of PNGHB, the substantial in-vestments now planned and the need for a restructured tariff based on eosts,PNGHB recognizes that the present systems are inadequate for the future,and that new ones must be installed. The Administration and the AustralianGovernment have agreed to include in the project provision for installingadequate financial, cost accounting and management information systems,training indigenous staff at all levels in the operation of these systems,including courses overseas, and the appointment of a consultant, satisfac-tory to the Association, to undertake this work. It is considered that anindividual, working with existing expatriate staff, would be sufficient.These matters were confirmed during negotiations, and undertakings obtainedthat the new systems will be introduced.
3.09 The Australian Auditor-General undertakes a commercial-type auditusing qualified, competent personnel. Audit reports will be made availableto the Association and the Auditor-General is willing to report on mattersnot normallY included, in such form as the Association may reasonably require.

- 8 -
This is acceptable to the Association. To ensure the contirinued applicationof sound auditing principles, agreement was obtained to the Association 1 sstandard audit covenants and PITGII3 undertook to appoint independent auditors,satisfactory to the Association, and to submit copies of the audited finan-cial statements and the auditors' report to the Association, within sixia-Eths after the end of each financial year.
3.10 The insurance position of PNiGHB is unsatisfactory. There is com-pulsory insurance of motor vehicles, workmen's compensation and third-partyinjury. Other assets are not insured but PINGhB is creating a reserve bysetting aside 0.52% of asset value which, in 1971, had reached A$ 66,800 onfixed assets of about A$ 10 million. The reserve is not funded. There isno public liability coverage for cargo, although under the Ordinance PNGHBappears to have considerable responsibility. During negotiations PNGHBagreed to engage competent insurance experts to advise on the insurablerisks borne by PNiGIB and to make provision satisfactory to the Associationfor adequate insurance.

4. THE PROJECT PORTS
A. Port Traffic, Current and Required Facilities
4.01 Current and projected traffic for the project ports is detailedin Table 4(a-e) with forecasts explained in Annex 7. Annex 3 providesdetails of existing facilities at each port. The following paragraphsprovide a brief summary of the current situation and the immediate require-ments.
Port Moresby (Hiap 2)
4.02 Located in a well-protected deep-water bay, Port ,Ioresby servesthe Central District of New Guinea. Exports are mainly rubber and copra.General cargo traffic has grown 7$ annually from 211,000 tons in 1963/64 to337,000 tons in 1970/71; bulk petroleum grew from 30,000 tons to 83,000(15% p.a.). The T-shaped wharf provides three berths - one of 700 ft with26.5 ft of water alongside at LWOST and two inshore berths of 390 ft and210 ft respectively with 15 ft of water alongside. iiaintenance is good,and the wharf has an effective life of at least 20 years.
4.03 The trend to cargo unitization has had the effect of substantiallyincreasing berth capacity and slightly reducing the number of ship calls;in 1970/71, 212 overseas ships and 164 coasters called at the main wharfand some 1,000 small craft entered the port. Available berth length issufficient for some years but storage space is severely restricted and willbe insufficient for expected traffic growth. The project provides foradditional open and covered storage space.
4.04 Expansion at the existing port site is restricted because of itsproximity to the town's business district. Future port development, includ-ing the present project, will be at a new site some 500 yd eastward.
Lae (Hap 3)
4.05 The existing wharf, located in a sheltered bay, is 808 ft long and40 ft wide with an alongside draft of 30 ft at LWOST. The wharf has aneffective remaining life of 25 years. In 1970/71 it handled 393,000 tons ofgeneral cargo and 105,000 tons of bulk petroleum. As a result of the roadlink into the Highlands, traffic has increased rapidly - 17% annually overthe past three years. Exports consist largely of coffee, tiL'ber and copra.Ship movements in 1970/71 totalled 250 overseas ships and 229 coastalvessels. The number of overseas vessels has remained fairly stable in recentyears but, with larger ships operating more direct schedules, the averageload per ship has increased rapidly to reach 1,250 tons in 1970/71.
4.06 The present very high dry cargo throughput of nearly 1,500 tonsper yard of berth (in addition to petroleum traffic) has been achieved only

- 10 -
by working a three-shift system; even so ship delays are serious and in-creasing. Lightering has been tried but has proved impracticable. imme-
diate requirements include an additional deep-water berth, with a transitshed and adequate storage areas, and dolphins to accomnodate coastaltankers. Improvements beyond these immediate requirements, and theirtiming, will depend on whether a new road will be built from the port ofi-Iadang into the Highlands.
Kieta (iHap 4)
4.07 The port at Kieta,the main administrative center of BougainvilleIsland, started operations in 1967. In 1968/69 traffic amounted to35,700 tons. By 1970/71, under the impetus of construction activitiesrelated to the copper mining development, traffic rose to 345,100 tons ofoverseas and 25,600 tons of coastal cargo. iluch of the overseas traffic,however, was handled at the copper company's private LoLoho wharf nearby
which, when the mine is in production, will handle exports of copper concen-
trates and imports of bulk petroleum; traffic over the public wharf atKieta will then decline to a level more consistent with the 1968/69 movements,based largely on copra exports.
4.08 The wharf is 208 ft long with an alongside depth of 26 ft at LWOST.Sections on each side of the deep-wvater berth are used for coastal vessels.However, additioinial coaster berths and cargo sheds are required which wouldpermit the diversion of coastal traffic from the single short deep-waterberth aind avoid current delays to overseas shipping.
Alotau/Samarai (1.ap 5)
4.09 In 1968, the administrative center of the IIilne Bay District wasmoved from the island of Samarai to Alotau on the mainland where a new town-ship is developing. A small wharf was built at Alotau to handle buildingmaterials but overseas traff-c continued to be handled at Samarai and distrib-
uted from that port. However, its facilities (a 300 ft long outshore berthwith 26e5 ft of water alongside at LWOST) are old and unsafe for medium orheavy loads. As a result, overseas lines, specializing in container and
palletized traffic, are bypassing the port to an increasing degree andtraffic has increased only 2.5.c annually over the past seven years and isnow showing signs of stagnating.
4.10 The small wharf recently built at Alotau attracted 3-4,000 tons ofgeneral cargo in 1970/71. It is now intended to build a new port here, suit-able for modern overseas services to serve the new administrative center and
replace the obsolete port at Samarai. This construction is part of theproposed project.
B. Port operations
4.11 All four ports operate seven days a week throughout the year. PortIMoresbyp Kieta and Samarai work a two-shift system and Lae three shifts. For

- 11 -
unitized cargo productivity is good, up to 60 tons/ship hour but for break-bulk it is low, about 20 tons and coastal cargo is handled at less than 10tons/ship hour. Improirement can be effected by better operating proceduresoTraditionally, at each port, several companies operate their otm stevedoringservices (under license from PNGHB), hiring local labor from nearby villages,providing their owqn equipment, working the ships and cargo of certain ship-ping lines and reserving wharf and storage space from the port managers.Cargo-handling methods are poor and labor is untrainedc PN11G has adequate-powers under its By-laws to control stevedoring activities and enforce effi-cient operating procedures but had not applied them. PNGHB will providethe equipment for Alotau and some specialized equipment at other ports notalready provided by the stevedoring companies.
4.12 During appraisal, discussions were held with the PNG Administrationand the Australian Government on the question of improving port operations.The need for improvement was accepted and it was agreed that consider- --able improvement could be effected immediately by enforcing existing By-laws;this, PNGHB are now doing and have arranged to collect data to assess theextent of resultant improvements in port efficiency. The Administrationalso undertook to consider, in the light of experience gained from thisaction, what additional organizational changes should be taken over thelonger term.
14.13 Since proper operational control requires trained staff, atraining progran is of immediate importance to PNGHB. The PNG Administrationand the Australian Government have fairly extensive programs underway orunder development. Prior to negotiations the respective Governments re-Viewed their training programs, and evidence, satisfactory to the Associ-ation, of the adequacy of the programs was provided.

- 12 -
5. THE PROJECT
A. ProMect Items
5.01 The project, details of which are given in Annex 5, wouldessentially consist of:
i) land reclamation, a storage shed and stacling area atPort Moresby (Map 2);
ii) construction of one deep-water berth at Lae, designed toaccommodate container traffic, as an extension of theexisting wharf (Map 3);
iii) construction of coaster berth facilities at the portof Kieta (map 4);
iv) construction of a small new port at Alotau (Map 5);
v) consulting services for detailed engineering, suxpervisionn" constructioci of items (i) to (iv) above, soil surveys andhydrographic investigations;
vi) provision of ca.go-handling equipment;
vii) a training program;
and covers most of PNGHBts firm investment program up to 1975/76 with theexception of a proposed port extension of Madang, the justification forwhich is subject to Qther factors (para. 5.13).
B. Cost Estimates
5.02 The total estimated cost of the project would be A$ 9.35 million(US$)1.1 million equivalent) with an off-shore component of US$9.2 millionequivalent. A summary follows and details are given in Table 1.
% ofTotal Ex-
Local Off-shore Total Local Off-shore Total penditure- - - - (As ?O000- - - OU'0o0 Equivale-T-
1. Construction 1,085 4,950 6,035 1,292 5,895 7,187 64.52. Engineering 145 280 425 175 330 505 4.63. Equipment - 500 500 - 595 595 5.34. Training 50 100 150 70 110 180 1.7
Sub-total 1,280 5,830 7,110 1,537 6,930 8,467 76.1
ContingenciesPhysical 175 1,150 1,325 201 1,347 1,548 13.9Price 170 745 915 197 923 1L120 10.0
Total 1,625 7,725 9,350 3,935 9,200 11,135 100.C

- 13 -
subdivided as follows:
Off_ Off_ % of TotalLocal shore Total Local shoe Total Expendit-xreeeQ OAIUO)............ U 1,0 00 - quW)LvaIe*nt _
Port Moresby 149 705 856 177 835 1,012 9.2
Lae 970 4,400 5,370 1,1148 5,261 6,409 57.0
Kieta 180 825 1,005 213 981 1,194 10.9
Alotau 271 1,120 1,389 321 1,330 1,651 15.0
Equipment - 550 550 - 655 655 5.9
Training 55 125 180 76 138 214 2.0
-1,625 7,725 9,350 1,935 9,200 11,135 100.0
5,03 The cost of the sivi1 engineering works is based on known costsof labor and materials in PNG, ard on costs of port construction works under-taken there recently, Because of uncertainties regarding the possible risein construction costs in the area in view of mining and other developments,And to allow for inflation generally, a price contingency of 15% is providedbased on an assumed inflation rate of 6% per year. A quantities contingencyof 20% is included for construction and engineering as further soi.i inves-tigations fcr detailed design are still being carried out. Off-shore costswould be about 80% of the total estimated construction cost because PNGlacks most construction materials. Materials and equipment are not subjectto import restrictions, nor is any duty imposed on equipment, provided thatit is re-exported upon completion of the project. Papua iew Guinea has nopreference arrangements with regard to imports.
5.04 Neither the equipment requirements (para. 4.11) nor the trainingprogram (para. 3,08) can be defined precisely, and provisional sums havetherefore been included for these two items.
C. Subsoil Conditions
5.05 Subsoil conditions at all ports, based on past pile-driving experi-ence, are favorable~ Further borings and pile test loadings are to be under-taken during the detailed design stages. Because PNG lies in the center of acircumpacific earthquake belt and medium-to-severe tremors often occur,all wharves would be founded on steel piles. The piled structures in Lae,Kieta and Alotau and the rock embankments in Port Moresby would be designed toresist the lateral accelerations caused by high-scale tremors up to 7.0 onthe Richter Scale.

- 14 -
D. Execution
5.06 PNGHB will be responsible for execution of the project, underthe general supervision of the PNG Department of Transportation and theproject agreement between the Association and PNGHB.
E. Engineering Consultant Services
5.07 PNGHB have engaged the Australian Department of Wilorks to completedetailed engineering, prepare tender documents and supervise constructionworks for Port Moresby and Lae. The PNG Public Works Department has beenengaged for similar activities for Kieta and Alotau. Engaging the PNGPublic Works Department conforms with that Department's policy of providingengineering training for its staff and of avoiding the expense of usingconsultants whenever work is within the physical and technical capability ofthe Department. Australian Department of Works staff engaged on suchconsultancy work do not form part of the PNG Administration staff but arecontracted separately for such work.
F. Procurement and Disbursement
5.o0 Construction and supply contracts would be awarded on the basisof international competitive bidding in accordarce with Bank Group guide-lines and would be subject to Association approval.
5.09 Based upon the estimated off-shore component of total cost, dis-bursement from the credit account would be 82% for all civil engineeringworks, actual foreign exchange cost of the engineering consultant servicesand training schemes and the c.i.f. landed cost of imported cargo-handlingequipment.
5.10 Including engineering, soil surveys, hydrographic investigationsand bidding procedures, the whole project would take 48 months to complete.Assuming credit effectiveness on August 1, 1972, total expenditure and creditdisbursement could be expected to be as summarized below and detailed inTables 2(a) and 2(b). Any surplus funds available on completion of theproject would be cancelled.
US$1 000 Equivalent1971/72 1972/73 1973/74 1974/75 1975/76 Total
Project Expenditure 12 2,217 4,419 2,687 1,800 11,135Credit Disbursements - 1,815 3,580 2,250 1,555 9,200

- 15 -
G. Land Acquisitimn
5.11 What little land is required for the project at Port Moresby, Laeand Alotau is state land, but the small area necessary at Kieta is privatelyswned and assurances have been mbtained that all necessary steps to obtainlegal title to land necessary for the project shall have been taken by June 30,1972.
H. Finance
5.12 The proposed IDA cmdit of US 9.2 million would finance the estima-ted off-shore or foreign exchange conponcnt of the proiect. PNGHB would beexpected to prnvide the lecal currency, estimated at US$1.9 million equivalent,from internally generated resources. Retroactive financing would be requiredto ccrer engineering and soil investigations started in November 1971, and isexpected to amount to about US$250,000.
I. Other Port Develop1 ents
5.13 In addition to the proposed project works, PNGHB is now constructingcoaster wharf facilities at the western extreme of Lae's existing deep-waterwharf (Map 3) at an estimated cost of A$ h00,000. These facilities willenable all coasters of t.p to 1,500 dwt to be handled away from the main wharf.An investment of A$ 430,000 is alsm under way at Rabau. Table 3 summarizesthe development program which provides for an investment of A$ 4.7 million atMadang during 1973-77, A$ 4.5 million for further expansion at Lae during1976-80 and A$ 2.7 million at Port Moresby during 1973-77. If the projectedMadang-Highlands road is built, the investment at Madang will be necessaryto enable it to handle the estimated volume of traffic that would be divertedfrom Lae. If the road is not constructed, an equivalent investment may berequired at Lae. Total investment program is A$ 13 million (other than the project)
J. Ecology
5.14 The proposed project would not resu)t in any ecological disturbancesin the ports of Port Moresby, Lae, Kieta and Alotau. There is no conmercialfishing carried out in the immediate areas of the four ports. Further, thesmall amounts of dredging to be carried out along the wharf front at Lae andAl*tau involve sand and silt and no coral. Appropriate arrangements fordealing with any possible oil spillage will be made.

- 16 -
6. TRAFFIC FORECASTS AND ECO-i0IEC TJAUJATION
A. Traffic Forecasts
6.0o The project ports - Port i;oresby, Lae, Kieta and Alotau/Samarai -handle about two-thirds of total PNG cargo traffic. Iln 1970/71, these portshandled 1,'140,000 freight tons of general cargo and 190,000 tons of petroleumproducts over their public wharves; 200,000 tons of this total traffic werein coastal trade.
6.02 Traffic forecasts for the project ports were prepared by theappraisal mission on the basis of various consultants' reports and discus-sions with PNGH3, the PNG Administration and informed sources in the privatesector,and are summarized below (see Annex 7).
Total Traffic ('000 tons)
Port Moresby Lae_ Kieta Samzarai/AlotauOverseas Coastal Overseas Coastal Overseas Coastal Overseas Coastal
1967/68 22)4 33 232 15 22g/* 13 18</ 17
1970/71 256 80 318 75 345* 26 20 19
1975/76 327 92 366 101 51 35 24 30
1980/81 417 118 609 135 79 56 38 38
1/ Assuming traffic diversion to iladang from 1975/76L, 1968/69* Including private copper port of Loloho, near Kieta.
6.03 Overseas dry cargo traffic is forecast to increase by approximately5% p.a. in Port iioresby. Imports are expected to increase by 10% p.a. inLae and Samarai/Alotau, and by 8% in Kieta; exports by 8% p.a. in Lae and10% p.a. in Kieta and Samarai/Alotau. These high growth rates are not, however,expected to materialize before the project is completed. Coastal trafficis expected to increase by 6%' p.a. in Lae, and by 5% in Port iHoresby andAlotau/Samarai; in Kieta, incoming coastal cargo by 10, outgoing by 5%.
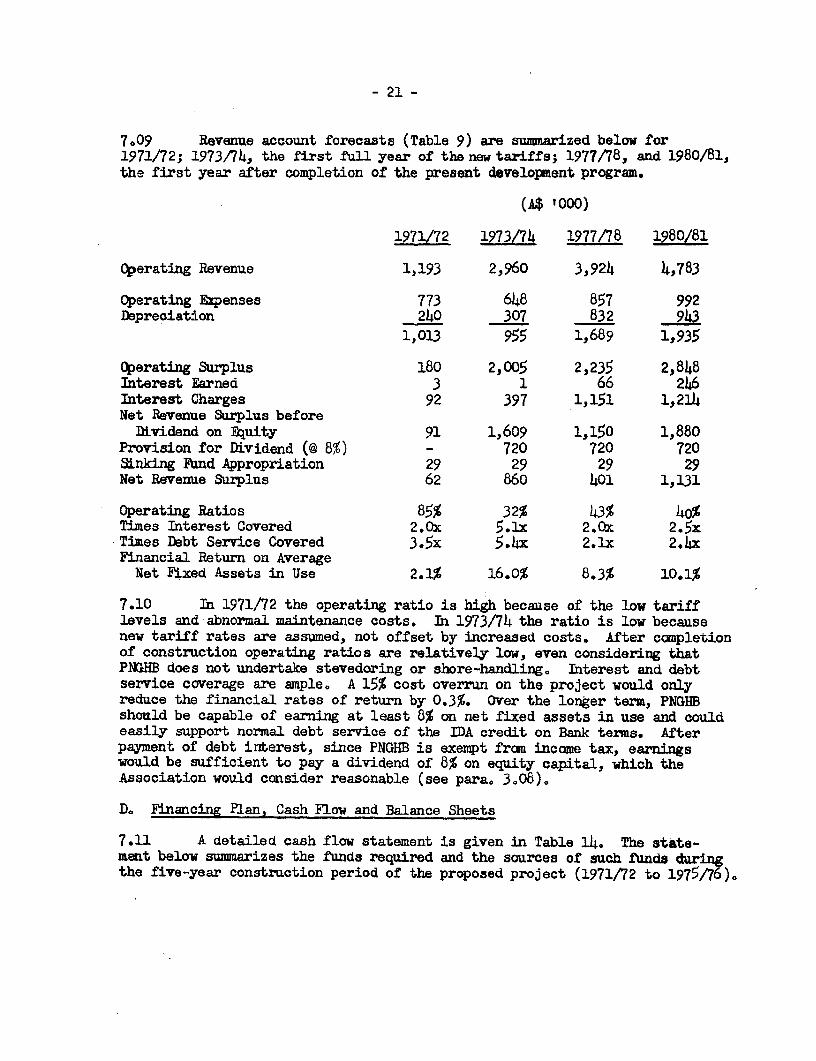
6.o4 The forecasts are conservative and generally lower than those ofthe consultants. In the case of Lae, overseas traffic expected to bediverted from Lae to hladang, after completion of the proposed ,'adang-Highlandsroad, amounts to about 100,000 tons in the first year (assumed to be 1975/76) rising to 187,000 tons in 1980/AI. Considering the uncertainty regardingthis road, traffic has been forecast with and without the road (Tables 4(b)and (c)).

- 17 -
B. Economic Evaluation
Port Capacity
6.05 Before evaluating the benefits of the project, an assessment wasmade of the extent to which present port productivity could be improvedsolely by inproving operating procedures (paras. 4.11 and 4.12). The follow-ing table shows estimated average handling rates in the different ports andcompares 1971 conditions withl rates aclievable with and without furtherinvestment. The rate which can be achieved without the project would not beadequate to meet the forecast traffic.
(Tons per Ship/Day)
1971 Future Rates Future RatesE~~t~e Without Project With Project
Port iioresby 550 600 6po
Lae 450 550 6°50
Alo'uau/Samarai 160 160 375
laieta 280 280 420
Ben-fits
6.06 The project is designed to increase capacity and improve cargo-handling rates in all ports. The principal benefits will be:
(i) reduction in anticipated ship waiting time which willrise sharply if port capacity is not increased soon;
(ii) reduction in ship service time through increasedcargo-handling rates; and
(iii) reduction in cargo-handling costs.
6.07 The reduction in ship wTaiting and service times has been evaluatedby the use of a mathematical model developed by the Bank Grotup. Benefitsfrom lower cargo-handling costs have been estimated on the anticipated inpro-vements in handling rates. Since a major portion of cargo-handling costsis labor costs and labor is not in short supply in PYG, a further analysiswas made on the assumption that real savings in cargo-handling costs willbe only 50% of the financial cost.
6.o8 The rationale in estimating the benefits is outlined in Annex 8.Benefits from generated traffic are not included in the cost-benefit analysis.Except in the case of Alotau/Samarai, these are small and will not affectthe conclusions. At Alotau/Samarai, the generated benefits just about

- 16 -
offset the relatively large costs of moving part of the port from Samaraito Alotau (Annex 9).
Internal Rates of Return
6.09 Based on the benefits as outlined above, the internal rates ofreturn are estimated as follows:
Kieta 3 1JSamarai/Alotau 31'5Lae 23,Port iloresby 50ic
Total Project 27/o
These very satisfactory economic returns are due to substantial benefitsfrom the fact that the project is somewhat overdue and to the relativelysmall investments, which will permit the further development of unitizedcargo handling. Details of th3ss benefits for the first full year afterproject completioln are given In J_able 5. About one-half° of the sarings inship time (see para. 7.16) and all of the savings in cargo-handlint costswill a-,crue directly to the PNG econorny and will by themselves yieljd aneconoimic return of about 20, on the investments.
6.10 The returns were tested for sensitivity to changes in the valuesof the principal variables. Variation in the capital costs of the projectis the area of greatest sensitivity. A i5% capital cost overrun would lowerthe ecornomic return of the project to 23%, The return is relatively insen-sitive to variations in the value of savings in cargo-handling costs. A50% reduction in these savings, to allow for the fact that the full financial.costs of labor do not represent econoriLc costs, only reduced the return to24` The resultcs are shown in ''able 6, As already explained in para. 6.04the traffic forecasts are conservative and the returns were therefore nottested for sensitivity to changes in tr-affic volumes.
6.11 Should the proposed Ladanc-Highlands road not be constructed,Hiadang port could not serve uhe interior by truck, and further port develop-ment at- Lae would be necessary by 1978/70 (see Annex 6) as air tranisportfrom the Highlands to lIadang, at an average cost of US$75/ton, is the onlyalternative.
6.12 Because of the many capacity and traffic possibilities in Lae, asimulation study was carried out. The results (discussed in Annex 7O) indicatethat the project is already overdue and will be sufficient to handletraffic up to 1981/82 provided that the Hadang-Eighlands road is constructed.
- 19 -
7. FINANCIAL ASPECTS
A. Present Position
7.01 The present tariff structure and levels of rates have remainedalmost unchanged since 1958 except for an increase in the storage charge toencourage clearance of cargoes from the transit sheds. The tariff hasdeveloped piecemeal and, although not over-complicated, is not related tocosts. In particular, berthage dues on ships are not related to time or tolong-run marginal costs and in 1970/71 provided only about 11% of totalrevenue. An undue proportion of total revenue (about 44% in 1970/71) isderived from wharfage on cargo. Since ships do not carry a direct chargeclosely related to cost, there is no incentive for owners to use facilitieseconomically. A summary of the present tariff is given in Table 7. It isgenerally accepted by port users that the level of tariffs is low.
7.02 The draft financial accounts ancd balance sheets to June 30, 1971have been modified by Association staff to take account of accrued intereston sinking funds and the provisional land valuation. The modified revenueaccounts are given in Table 9 and balance sheets in Table 11.
7.03 The Administration's interest in the Port assets transferred toPNGHB is represented by equity capital. PNGHB's investment funds have beenprovided largely by loans from the Administration. Details are given inTable 12. All loans are for 25 years repayable by annual sinking fundappropriations of 2% of the capital amount (Table 13). Interest is payableon the full amount half-yearly. The total amount of loans to June 1971 isA$ 1,457,000 (US$1.74 million). As yet, sinking fuind appropriations arenot properly funded in income earning investments. firing negotiationsPNGHB undertook to invest the appropriations so as to produce the full amountsdue at maturity.
7.o4 Up to 1969/70, the financial rate of return on net fixed assetswas more than 5%. However, operating expenses in 1970/71 and 1971/72 showsubstantial increases, because of unusual expenditures on maintenance arrears,thus depressing the rate of return to 4.0% and 2.1% respectively.
7.o5 The present tariffs are adequate to earn a moderate financialreturn on the present asset valuation, but are too low to enable PNGHB toachieve acceptable financial targets.
B. Financial and Tariff Policy
7.06 In their recent report on port charges, EIU recommended that theprinciple of wharfage be retained but that the berthage charge be restruc-tured on the basis of time and length of berth occupied. In the absence ofa costing system, their recommended rate levels are based on total resultsand take into account the possibility of paying a dividend on original

- 20 -
equity, as well as financing a share of the investment program. A summaryof the recommendations is given in Table 8. The consultants' approach issatisfactory to the Association. The consultants show that port costs inPNG are relatively small in relation to total transportation costs, andthat substantial tariff increases would have very little effect on suchcosts and therefore no harmful effects an PNG's economy. The main changesrecommended would be a) ships' berthage charge changed from A$ 0.05 per fourgross registered tons per day to A$ 0.03 per ft length per hour; effectivelyan increase of some 350%, and (b) an effective increase in wharfage on cargoof about 130%. Overall, the tariff increases would about double PNGHB'soperating revenues.
7.07 The Ordinance does not specify any financial policy, other thanthe provision in the amendment regarding payments to the Administration outof PNGHB's profits (para. 3.08). However, during negotiations this matterwas discussed and agreement reached in principle as follows:
a) As an essential transportation link in the country's economy,PNGHB should be required to provide efficient port servicesat reasonable cost anci, as a commercial Government enter-prise responsible for substantial investments, it should beable to pay to the Administration a reasonable dividend onits equity capital.
b) PNGHB should relieve the Adainistration from the burden offinancing its own investment so far as it can do so by apply-ing reasonable tariffs.
o) These objeatives require good operations procedures, propercost control systems and a pricing (tariff) policy relevantto its needs. Ports provide a variety of services to twoprincipal types of user, ships and cargo, and while totalfinancial costs must be covered, the customer should paythe economic costs of the individual services he uses. Thisis important, to avoid undesirable cross-subsidization, toensure that the cargo owner does not pay twice for ships'port costs (in freight rates andin port tariffs on cargo),and so that uneconomic port activities are not encouraged.
d) Separate tariffs shoula be levied for individual categoriesof services and facilities, based on the costs of providingthe services and facilities, including adequate maintenanceand depreciation, and should be set to recover to theeconomy so much of the economic benefits of investments,which would otherwise accrue elsewhere, as would not adverselyaffect such external pricing policies as ocean freight rates.
C. Future Earnings
7.08 Forecast revenues for PNGHB are based on the traffic forecasts forall PNGHB ports and on the new tariff structure and levels of rates recommendedby EIU becoming effective by July 1, 1972 for services other than wharfage,and for wharfage by July 1, 1973. Assumptions used are given in Annex 11.Debt service forecasts are given in Table 10.
- 21 -
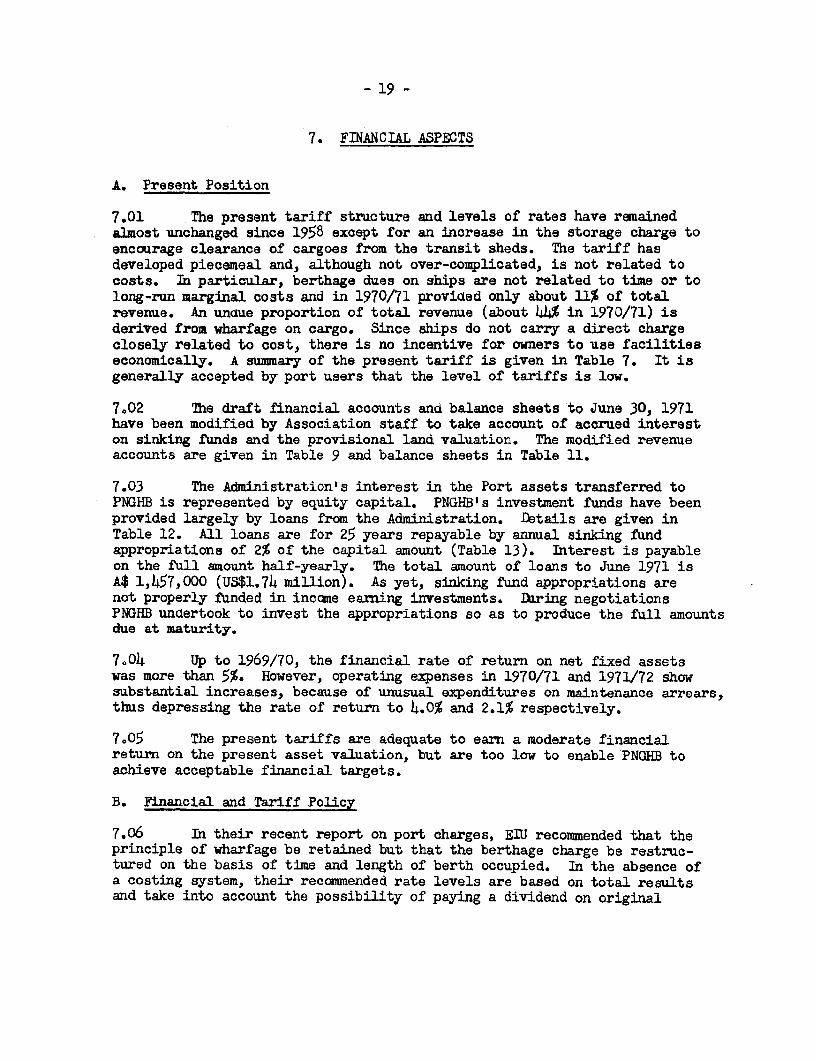
7.09 Revenue account forecasts (Table 9) are summarized below for1971/72; 1973/74, the first full year of the new tariffs; 1977/78, and 1980/81,the first year after completion of the present development program.
(A$ '000)
1971/72 1973/74 1977/78 1980/81
Operating Revenue 1,193 2,960 3,924 4,783
Operating Exenses 773 648 857 992Depreciation 240 307 832 943
1,013 955 1,689 1,935
Operating Surplus 180 2,005 2,235 2,848Interest Earned 3 1 66 246Interest Charges 92 397 1,151 1,214Net Revenue Surplus beforeDividend on Equity 91 1,609 1,150 1,880
Provision for Dividend (@ 8%) - 720 720 720Sinking Fand Appropriation 29 29 29 29Net Revenue Surplus 62 860 401 1,131
Operating Ratios 85% 32% 43% 4o%Times Interest Covered 2.Ox 5.1x 2.Ox 2.5xTimes Debt Service Covered 3.5x 5.4x 2.lx 2.4xFinancial Return on Average
Net Fixed Assets in Use 2.1% 16.0% 8.3% 10.1%
7.10 In 1971/72 the operating ratio is high because of the low tarifflevels and abnormal maintenance costs. In 1973/74 the ratio is low becausenew tariff rates are assumed, not offset by increased costs. After completionof construction operating ratios are relatively low, even considering thatPNGHB does not undertake stevedoring or shore-handling. Interest and debtservice coverage are ample. A 15% cost overrun on the project would onlyreduce the financial rates of return by 0.3%. Over the longer term, PNGHBshould be capable of earning at least 8% on net fixed assets in use and couldeasily support normal debt service of the IDA credit on Bank terms. Afterpayment of debt interest, since PNGHB is exempt from income tax, earningswould be sufficient to pay a dividend of 8% on equity capital, which theAssociation would consider reasonable (see para. 3,08).
D. Financing Plan, Cash Flow and Balance Sheets
7.11 A detailed cash flow statement is given in Table 14. The state-ment below summarizes the funds required and the sources of such funds duringthe five-year construction period of the proposed project (1971/72 to 1975/76)o

- 22 -
Million US$Million A$ Equivalent %
Funds Required
Proposed IDA Project 9.3 11.1 57Other Capital Expenditures 7.0 8.3 42Working Capital 0.2 0.2 1
16.5 19.6 100
Sources of Funds
Cash Generated during Period 9.6 11.4 58Less: Debt Service (2.4) (2.9) (14)
Dividend (2.1) (2.5) (13)Increase in Cash Balance (0.2) (0.2)
Net Cash Generated appliedto Investment 4.9 5.8 30
Proceeds of Proposed IDA Credit 7.7 9.2 47Other Assumed Borrowings 3.9 4.6 23
16.5 19.6 100
7.12 PNGHB would be able to finance with internally generated fundsone-third of its total financial requirements, leaving a small cashsurplus available for further investments. During negotiations it wasagreed that the Credit would be relent by the Administration to PNGHB onBank terms, i.e. for a period of 25 years including four years of gracewith interest at 7V p.a. Although no firm arrangements have yet beenmade for other borrowings, PNGHB should have no difficulty in securingloans to finance other capital expenditures. The financing plan issatisfactory. Should there be any project cost over-run or any shortfallin the internal cash generation during the construction period, the assumeddividend could be reduced. During negotiations the Administration under-took to provide funds as may be required to complete the project.
7.13 After the completion of the project, PNGHB would be able to make areasonable contribution to the cost of the further investments planned, whileretaining substantial cash balances. The projections show that cash reserveswould amount to about A$ 5 million at June 30, 1981 after paying an annualdividend of 8% on the Administration's original equity.
7.14 Tne forecast balance sheets (Table 11) show a healthg position.The highest debt/equity ratio, at a satisfactory 55/45, occurs in 1977 and1978.

- 23 -
E. Conclusions and Undertakings on Financial Aspects
7.15 Increases in tariffs to levels recommended by the consultants,to be readjusted as between individual services and facilities to achievethe same overall revenue when costing data are available, would enablePNGHB to finance its investment program and generally comply with thefinancial policy detailed in para. 7.07. The financial forecasts indicatethat the longer-term financial targets would be met by earning a financialrate of return of 8% after completion of construction of the project. Asubstantial proportion of the economic benefits from the project which wouldotherwise not immediately accrue to the economy would be recovered by cost-based tariffs on ships. Berthage under the existing tariff is estimated atA$ 139,0L00 for 1971/72, and under the new tariff at As 651,000 in 1972/73rising to A$ 768,000 in 1975/76 and A$ 915,000 in 1978/79, thus directlyrecovering about 50% of those savings. When new costing systems canidentify the respective costs there should be scope for further adjustmentof rates as between ship and cargo and opportunity to recover furthersavings for the economy.
7.16 Over the longer term, after completion of the present investmentprograms, and in the absence of economic developments requiring additionalport investments, the tariffs are likely to be higher than necessary toachieve the targets and may earn unnecessarily high financial rates ofreturn. In that event, principal alternative solutions would be to increasethe dividend on equity or to reduce the tariffs, especially those on cargo.
7.17 To meet the agreed financial objectives and pricing policy under-takings were obtained that PNGHB would:
a) (subject to approval by the Administrator in Council) introducetariffs for services and facilities other than wharfage no laterthan July 1, 1972, and for wharfage no later than July 1,1973, and thereafter maintain them, substantially at thelevels recommended by EIU;
b) introduce as soon as possible a cost accounting system todetermine the relevant costs of the various services andfacilities it provides;
c) promptly thereafter, but not later than July 1, 1976,introduce and maintain tariffs of dues and rates:
i) set as far as practical for each port individually;
ii) levied for all ships and goods using its services andfacilities; and
iii) based on, and not less than, the economic costs ofthese services and facilities, taking into account thedesirability of ensuring that a sufficient proportionof total economic benefits (particularly those enjoyedby ships) resulting from the port investments accrueto PNG's economy;

- 24 -
d) except as the Association and the Borrower shall otherwiseagree, take all necessary measures, including but not limitedto adjustments in tariffs, as may be required to earn anannual rate of return of not less than 8% on not fixed assetsin operation; and
e) except as the Association should otherwise agree, not incurany debt unless its net revenue (before providing for depre-ciation) for the fiscal year next preceding the date of suchincurrence or for a later twelve-month period ending priorto the date of such incurrence, whichever is greater, shallbe not less than 1.5 times the maximum debt service require-ments for any succeeding year on all the debt of PNGHB, in-cluding the debt to be incurred.
7,18 Since approval by the Administrator in Council to the introductionof tariffs under para. 7.17 (a) above has not yet been received, receipt ofsuch approval is a condition of signing,

- 25 -
8. RECOMMENDATIONS
8.01 During credit negotiations, agreement was reached on thefollowing principal points:
(a) PNGHB will continue to collect and evaluate data to assessthe results of training programs presently in operationand the efficiency of port operations (paras. 4.12 and 4.13);
(b) a pricing policy was agreed to, including the desirabilityof ensuring that a sufficient proportion of the economicbenefits arising from port investments accrue to PNG'seconomy (para. 7.07);
(c) port tariffs will be increased to enable PNGHB to financethe project and other investments (para. 7.17(a));
(d) PNGHB will introduce costing systems to enable cost-basedtariffs to be introduced by July 1, 1976 (para. 7.17(b)and (c)); and
(e) an 8% financial return on net fixed assets in use by PNGHB(para. 7.17(d).
8.02 A condition of signing the credit is the receipt by the Associationof approval by the Administrator in Council to tariff increases in 8.01(c)above (para. 7.18).
8.03 The proposed project is suitable for an IDA credit of US$9.2 millionto Papua New Guinea to be relent to PNGHB for a term of 25 years including afour-year grace period with interest at 740 p.a.
4Aril 10, 1972

TABL. 1
PAPUA NEW GUINEA
APPRAISAL OF PORT PROJECT
Cost Estimates
A$ (000) Us$ (000) Equivalent % TotalLocal Off-Shore Total Local Cf-Sore Total Experditure
Descriptior
PCRT CRESBY
1. Construction 105 485 590 123 560 7032. Engineering 10 30 LO 11 36 07
115 3 630 134 616 750
Contingencies
Physical 20 110 130 25 120 1L5Price 16 80 96 18 99 117
151 701 177 7 3 1,012 9.2LAE
1. Constructior. 675 3,075 3,750 805 3,660 4,4652. 5r.ireering 85 175 260 104 205 309
760 3,250 4,010 30 78b 4,774
Contingencis
Physical 105 68o 785 115 810 925Price 105 470 575 124 586 710
970 7,7000 5,370 5,261 6,009 57.0
KIE TA
1. Construction 125 575 700 1L9 685 8302. Engineering 15 35 50 18 42 60
100 i 750 16-C7 5 0 727 -TC
Cortingencies
Physical 15 135 150 17 155 172Price 25 80 105 29 99 128
180 b25 1,005 213 -98 1,194 10.9
ALC TAI
1. Construction 180 815 995 215 97C 1,1852. Engineering 35 40 75 42 07 89
215 655 1,070 257 Z,7 1,270
Contingencies
Physical 35 175 210 44 202 206Price 19 90 109 20 111 131
269 1,120 139 321 1,33 1,651 15.C
CTH:R ITsEMS
1. Equipment - 500 500 - 595 5952. Training and Managemient
Consultants 50 100 i5o 70 110 180600 650 70 703 775
Contingencies
Physical - 50 50 - 60 60Price 5 25 30 6 28 30
55 6-75 730 ;7 793 869 7.cSUX'DTAY 1-00.0
Construction 1,085 4,950 6,035 1,292 5,895 7,1E7 6L.5Engineering 145 280 425 175 330 505 b.6Equipment - 500 500 - 595 595 5.3Training and ManagernentConsultants 50 100 150 70 11 180 2.7
1,20O 5,830 7,110 I-,5 6,930 b,467
Contingencies
Physical 175 1,150 1,325 201 1,307 1,5L8 13.9Price 170 745 915 197 923 1 120 10.01 w 7,72 7 9,350 1,93 11,3
P.pril 10, 1572

PAPUA EVW GUIEZA
APPRAISAL OF PORT PROJECT
Project ExpendituresUS$ (000) Equivalent
PORT 1971/72 1972/73 1973/74 1974/75 1975/76 Total 1971-1976
Port Moresby _ 325 687 - - 1,012
Lae 1,186 3,142 2,081 - 6,409
Kieta 12 646 536 - _ 1,194
Alotau - - - 280 1,371 1,651
Equipment 280 375 655
Training _ 60 6C 60 34 214
12 2,217 4,425 2,701 1,780 11,135
April 10, 1972

TABLE 2(b)
PAPUA NEWN GUINEA
APPRAISAL CF PORT PROJECT
Disbursement Schedule(US$000)
Bank FY
Estimated Disbursement1973 Year Quarter Cumulative Total
1st Quarter 300 3002nd Quarter 375 6753rd Quarter 1,815 500 1,1754th Quarter 640 1,815
1_97
1st Quarter 800 2,6152nd Quarter 850 3,;4653rd Quarter= 3,580 950 4,415hth Quarter 980 5,395
1975
1st Quarter 750 6,1452nd Quarter 550 6,6953rd Quarter 2,250 500 7,1954.th Quarter 450 7,645
1976
1st Quarter h50 8,o952nd Quarter 450 6,5453rd Quarter 1,555 450 8,9954th Quarter 205 9,200
April 10, 1972

PAPUA NEW GUINEA
APPRAISAL OF PORT PROJECT
PAPUA NEW GUINEA HARBOURS BOARD
Port Developwrnt Program 1971/72 - 1979/80 (in A$ '000)
1971/72 1972/73 1973/74 1974/75 1975/76 1976/77 1977/78 1I978/79 1979/80 Total
Association-Financed Projects 10 1,862 3,716 2,268 1,1494 9,350
Others:
Madang 30 682 1,128 1,306 1,581 4,727LAE 360 453 440 - 151 541 1,051 1,051 898 4,545Port Moresby 100 95 856 846 861 2,758Rabaul 60 214 214 488Miscellaneous 112 175 5 10 44 40 471
7 812 1,081 2,248 2,317 3,023 1,051 1,051 1,9
Totals 482 2,680 4,797 4,516 3,841 3,023 1,051 1,051 898 22,339
Transfers in Fixed Assets 1,100 1,955 6,129 1,749 7,714 - - 3,692
Work in Progress 482 2,062 4,904 3,291 5,383 692 1,743 2,794 -
Source: PNGHB
P;"51 10, 1`;72

TABLE 4(a'
PAPUA NEW GUINEA
APPRAISAL OF PORT PROJECT
Actual and Future Traffic Forecasts - Port Moresby
Revenue Tons (Excluding Petroleum) (0OO's)
Overseas Coastal Grand Consultants't/Imports Exports Inwards Outwards Total Total
1967/68 192,9 31.5 11.4 21.4 257.3 n.a.
1968/69 212.2 30.1 13.4 39.2 295.0 306.3
1969/70 221.2 41.5 18.4 22.8 304.0 418.3
1970/71 207.1 49.2 39.6 40.5 336.8
1971/72Z/ 217 52 42 34 345
1972/73B/ 228 55 44 36 363
1973/74A/ 240 57 46 39 382
1974/75a/ 252 60 48 40 400
1975/76W' 264 63 51 42 420
1976/77.&/ 278 66 53 44 441
1977/784/ 291 69 56 46 462
1978/79a!' 306 73 59 48 486
1979/80a! 321 76 61 51 509 621
1980/81-a/ 337 80 65 53 535
/ 1971/72-1980/81 - Association forecasts.el Consultantst forecasts.
SOURCES: PNGHB and Maunsell and Partners Report
April 10, 1972
TABLE 4(b)
PAPUA NEW GUINEA
APPRAISAL OF PORT PROJECT
Actual and. Future Traffic Forecasts - Lae1/
Revenue Tons (Excluding Petroleum) (000's)
Overseas Coastal Grand Consultants&b/Imports Exports Inwards Outwards Total Total
1967/68 171.5 61.5 4.4 10.4 247.9 n.a.
1968/69 177.8 54.6 9.8 25.9 268.2 2b3.0
1969/70 262.0 66.3 11.1 37.0 376.3 330.0
1970/71 253.b 64.0 19.3 55.9 393.1 37b.0
1971/72a/ 279 69 20 59 427 426
1972/7a/ 307 75 22 63 467 475
1973/74a/ 338 81 23 67 509 531
1974/75a/ 37T 87 24 71 554
1975/76a/ 309 77 26 75 487 455
1976/77a/ 340 83 27 79 529 497
1977/78&/ 374 89 29 84 576 548
1978/79a/ 411 96 31 89 627 600
1979/bO-/ 45i 102 33 95 66- 656
1980/d1a/ 49b 111 35 100 744 71$
1/ 1975/76-1980/81 - Part of traffic diverted to Madang.ai 1971/72-1980/bl - Association forecasts.b/ Consultants' forecasts.
SOURCES: PNGHB and NEDECO
April 10, 1972
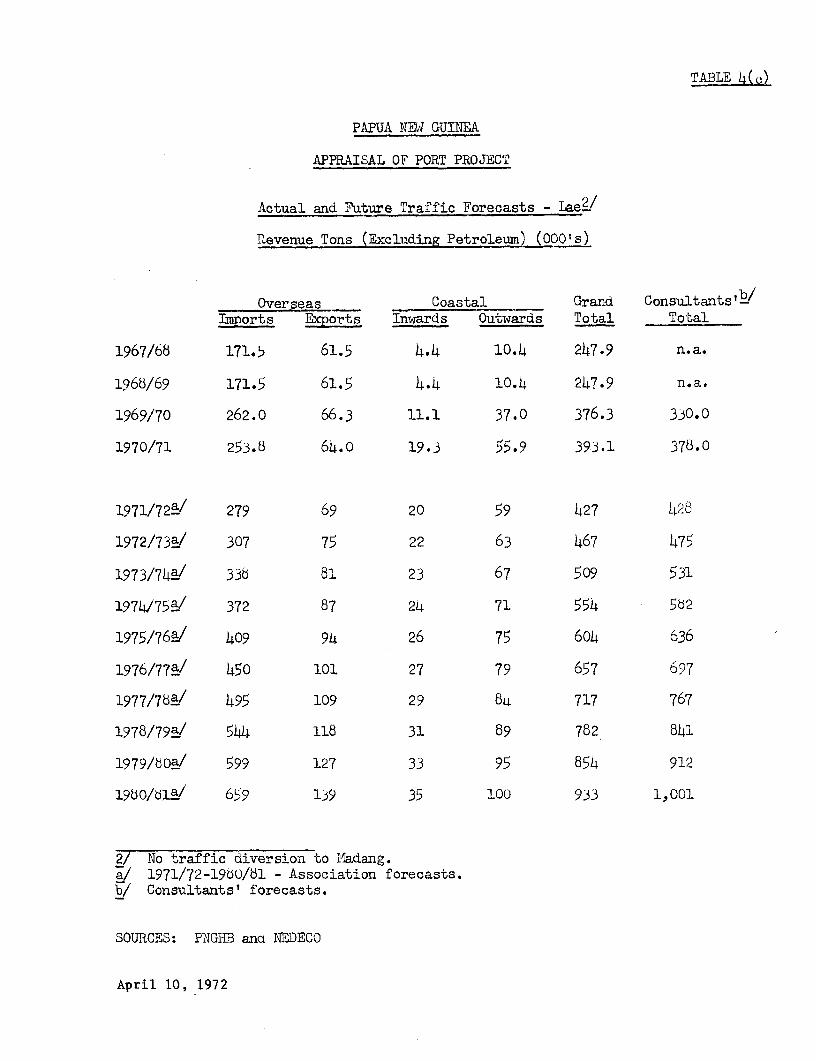
TABLE 4(c)
PAPUA NEW GUIIEA
APPRAISAL OF PORT PROJECT
Actual and Future Traffic Forecasts - Lae2/
R2evenue Tons (Excluiding Petroleum) (000's)
Overseas Coastal Grand Consultants'b/Imports Exports Inwards Outwards Total Total
1967/68 171.5 61.5 4.4 10.4 247.9 n.a.
1968/69 171.5 61.5 4.4 10.4 247.9 n.a.
1969/70 262.0 66.3 11.1 37.0 376.3 330.0
1970/71 253.8 64.0 19.3 55.9 393.1 378.0
1971/72a/ 279 69 20 59 427 1x28
1972/73a/ 307 75 22 63 467 475
1973/742/ 335 81 23 67 509 531
1974/75_/ 372 87 24 71 554 562
1975/76a/ 409 94 26 75 604 636
1976/77a/ 450 101 27 79 657 697
1977/78a/ 495 109 29 84, 717 767
1978/79a/ 544 118 31 89 782 841
1979/bOA/ 599 127 33 95 854 912
1950/dla/ 659 139 35 100 933 1,001
2/ No traffic diversion to Iladang.a/ 1971/72-1960/81 - Association forecasts.b/ Consultants' forecasts.
SOURCES: PNGHB ana NEDECO
April 10, 1972

TABLE 4(d)
PAPUA NEW GUINEA
APPRAISAL OF PORT PROJECT
Actual and Future Traffic Forecasts - Kieta
Revenue Tons (Excluding Petroleum) (000's)
Overseas Coastal Grand Consultants'tC/Imports Exports Inwards Outwards Total Total
1967/6b n.a. n.a. n.a. n.a. n.a. n.a.
1968/69 19.9 2.3 10.3 3.2 35.7
1969/70 147.3 13.0 7.2 1.5 169.9
1970/71 302.5a/ 42.6 22.1 3.5 370.7
1971/72_ 22 14 22 3 61
1972/73W/ 24 16 24 3 67
19 73 /74b/ 26 17 27 3 73 90
1974/75_/ 28 19 29 3 79
1975/76W/ 31 21 3E 3 87
1976/77b-/ 33 23 35 3 96
1977/76b' 36 25 39 4 104
197b/79Y 36 28 4- 4 113
1979/80b/ 4a 31 47 4 124 140
19b0/blb/ 45 34 52 4 135
a/ PNGIIB's estima'e._/ 1971/72-19b0/81 - Association forecasts.c/ Consultantst estimates.
SOURMCS: PGI'IB anc MEDECO
April 10, 1972

TABLE 4_(e)
PAPUA NEW GUINEA
APPRAISAL OF PORT PROJECT
Actual and Future Traffic Forecasts - Samarai/Alotau
Revenue Tons (Excluding Petroleum) (OOOs)
Overseas Coastal Grand ConsultantsbJImports Exports Inwards Outwards Total Total
1967/68 n.a. n.a. n.a. n.a. n.a. n.a.
1968/59 9.' 8.4 9.2 7.7 35.1
1969/70 10.3 9.2 10.3 8.8 36.0
1970/71 8.9 7.2 12.2 11.2 39.6
1971/72a/ 10 9 13 12 44
1972/73_/ 11 9 13 12 45
1973/74a/ 11 10 14 13 4b
1974/75a/ 12 11 15 13 51 51
1975/76a/ 13 12 16 14 55
1976/77a/ 14 13 16 15 55
1977/78ai/ 15 14 17 15 61
1978/79a/ 17 15 18 16 66,
1979/bo0/ 19 16 19 17 71 61
1980/81.a/ 21 18 20 1 77
a/ 1971/72-19dO/81 - Association forecasts.b/ Consultants' estimates.
SOURCES: PNGHB and NEDECO
April 10, 1972

PAPUA NE-V GUINEA
APPRAISAL OF PORT PROJECT
First-Year (1975-1976) Economic Benefits of the Project
Savings in Total SavirgsShpWiigTm Shp Srvce :e Cargo-Handling Costs FU000)
____ ~~~~~~OO (US$000(US000Das USOO)DM US$(000) Dy (US$000)
Kieta 6 9 103 155 87 251
Samarai/Alotau 85 85 194 194 108 387
Lao 531 796 I148 222 195 1,213
Port Moresby 22 33 91 137 251 421
Total Project 644 923 536 708 641 2,272
April 10, 1972

PAPUA NEW GUINEA
APPRAISAL OF PORT PROJECT
Economic Return Sensitivity Analysis
15% increase in 25% increase in 50% deerease inBest Construction Maintenance 25% increase 25% decrease savings in cargo-Estimates Costs Costs in Benefits in Benefits handling Costs
Kieta 30.9 26.0 30.6 35.7 25.6 27.7
Samnarai/Alotau 30.5 25.0 30.3 36.3 24.3 27.6
Lae 23.1 19.3 22.8 27.9 17.8 18.6
Port Moresby 50.0 41.3 49.8 58.2 41.0 42.7
Total Project 26.9 22.7 26.5 31.9 21.3 24.0
April10 , 1972
0o\
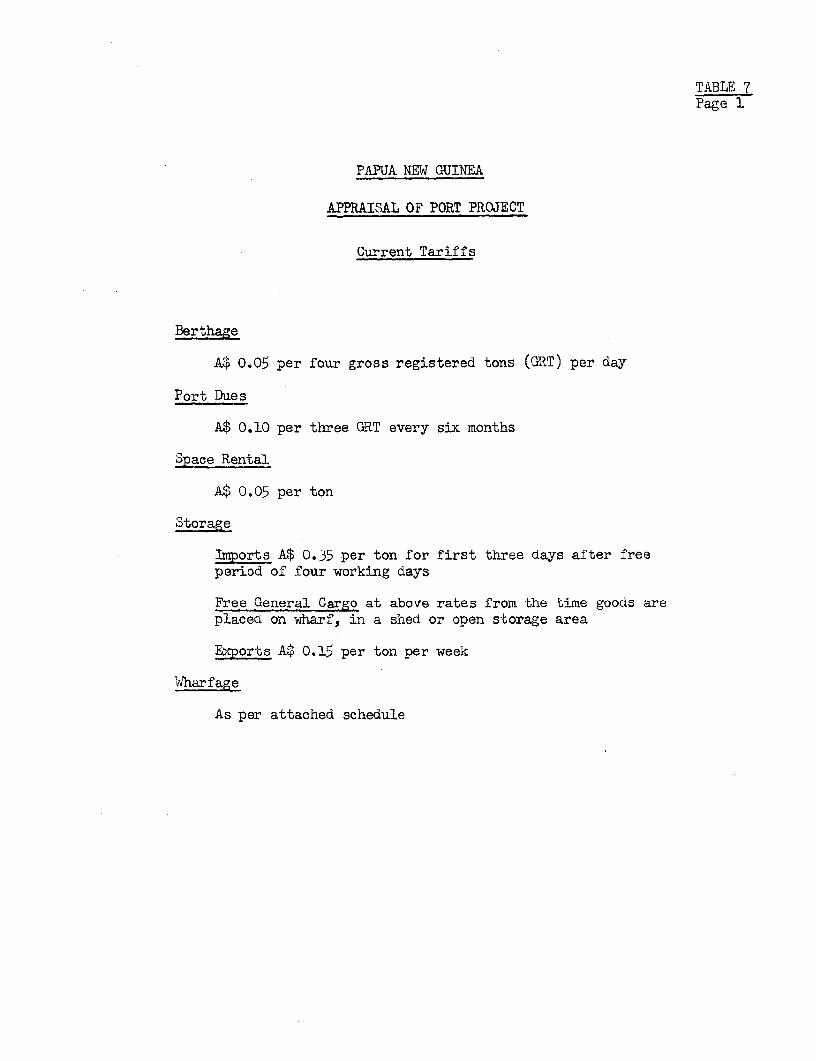
TABLE 7Page I
PAPUA NEW GUINEA
APPRAISAL OF PORT PROJECT
Current Tariffs
Berthage
A$ 0.05 per four gross registered tons (GRT) per day
Port Dues
A$ 0.10 per three GRT every six months
Space Rental
A$ 0.05 per ton
Storage
Imports A$ 0.35 per ton for first three days after freeperiod of four working days
Free General Cargo at above rates from the time goods areplaced on wharf, in a shed or open storage area
Exports A$ 0.15 per ton per week
lharfage
As per attached schedule
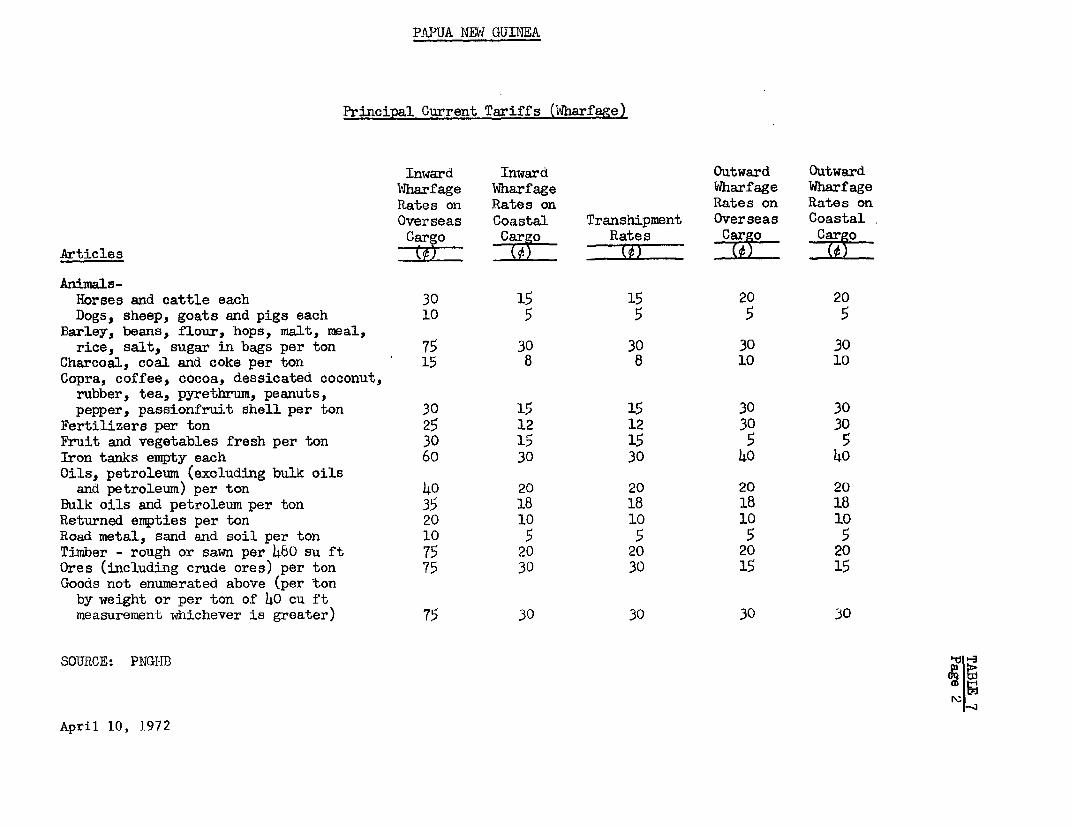
PAPUA NMI GUINEA
Principal Current Tariffs (Wharfage)
Inward Inward Outward OutwardWharfage Wharfage Wharfage WharfageRates on Rates on Rates on Rates onOverseas Coastal Transhipment Overseas CoastalCargo Car_o Rates Cargo Cargo
Articles __ (_ (_)
Animals-Horses and cattle each 30 15 15 20 20Dogs, sheep, goats and pigs each 10 5 5 5 5
Barley, beans, flour, hops, malt, meal,rice, salt, sugar in bags per ton 75 30 30 30 30
Charcoal, coal and coke per ton 15 8 8 10 10Copra, coffee, cocoa, dessicated coconut,rubber, tea, pyrethrum, peanuts,pepper, passionfruit shell per ton 30 15 15 30 30
Fertilizers per ton 25 12 12 30 30Fruit and vegetables fresh per ton 30 15 15 5 5Iron tanks empty each 60 30 30 40 40Oils, petroleum (excluding bulk oilsand petroleum) per ton 40 20 20 20 20
Bulk oils and petroleum per ton 35 18 18 18 18Returned empties per ton 20 10 10 10 10Road metal, sand and soil per ton 10 5 5 5 5Timber - rough or sawn per 430 su ft 75 20 20 20 20Ores (including crude ores) per ton 75 30 30 15 15Goods not enumerated above (per tonby weight or per ton of 40 cu ftmeasurement whichever is greater) 75 30 30 30 30
SOURCE: PNGIHB
April 10, 1972

TABLE 8
PAPUA NEW GUINEA
APPRAISAL OF PORT PROJECT
Recommended Tariffs (EIU)
(A$)
BerthageOverseas wharves $0.03 per ft length per hrCoastal wharves $0.02 per ft length per hr
WharfageLevied on weight or measurement,
whichever is greater
Overseas InwardsCement, fertilizer, charcoalcoal and coke road metalsand and soil $0.90 Per Ton
Bulk oils and petroleumpumped over the wharf $0.50 "
Goods not enumerated above $1.40 :' it
Overseas OutwardsBulk oils and petroleumpumped over the wharf $0.4o " "
Goods not enumerated above $0.0 n
Coastal CargoesBulk oils and petroleumpumped over the wharf $0.40 "
Goods not enumerated above $0.90 H "
Special Handling GroupsBoats and iron tanks empty $0.50 per ft
Port Dues $0.25 per ft length leviedc quaruerly
Storage of Containers, Flats and Pallets
1st Month Succeeding IMfonthsISO standard containers $5 0o ;QTL5.CGSmall containers $2.00 .00Flats $0.560 4.50Pallets $0.10 $0.30
Storage of Goods Not Constituting CargoFlat rate $0.20 per ton
April 10, 1972

1~~~~~~ HCCCC NA IC C rA N OCMC I NA CAN >SN
D0 @-1 CM HQ |M CA N-IMM CI CA| 0 CA CA 0 CA CA CA °M CAs C N
C1 CAl 1H CAN
o~~~ ~ CCC ' " 4|eC x _ X
CA~~~~ OCA rD I CA H| CA CA CA C CA CAt CMw U0 CM CMCC '0 CA CA H CMCMC,ACAC A
o~~~~~~~~A CMI G Da 1Nl2 D HIC H H CAOt
t1 ~ ~ ~ ~ ~ ~ ~ ~ ~ ~ ~ ~ ' '0 CC X
CA CM0 CMI CM l CMltH°ls|x ICN CA CACACACMC_CC'X X
~~~~CCC M '0 CA M -C CA| CCAC |M OC A r1'C; U 2
DJ H \0C N N %r ICr' H H\ GCA
CC CMI CMr U lU |v :v 'I CI CM r H - .1
CC.~~~~~~~~~~~~~~~~~~~~~~~~~~~ rC C
;~~~~~~~~~~~' '0
u -a tjC. t3e

TABLE 10
PAPUA NEW GUINEA
APPRAISAL OF PORT PROJECT
PAPUA NEW GUINEA HARBOURS BOARD
Debt Service (in A$ '000)
Administration Relending Other Assumed BorrowingLoans IDA Credit Madang P.M. LAE Total
Interest
1968/69 0.31969/70 1.3 11970/71 24.7 251971/72 91.9 921972i73 93.6 104 1981973/74 95.5 254 47 3971974/75 97.5 413 95 38 6441975/76 99.5 515 157 82 8541976/77 10107 553 233 127 143 1,0551977/78 103.9 541 273 147 86 1,1511978/79 106.4 527 267 145 141 ',1861979/80 108.9 514 260 141 191 1,2151980/81 111.6 498 254 137 213 1,214
Sinking Funds and Amortization
1968/69 12 121,969/70 27 271970/71 29 291971/72 29 251972/73 29 291973/74 29 291974/75 29 291975/76 29 291976/77 29 163 1921977/78 29 175 81 45 3301978/79 29 189 87 47 3521979/80 29 202 94 51 3761980/81 29 218 100 55 63 465
Source: Bank Staff
April 10, 1972
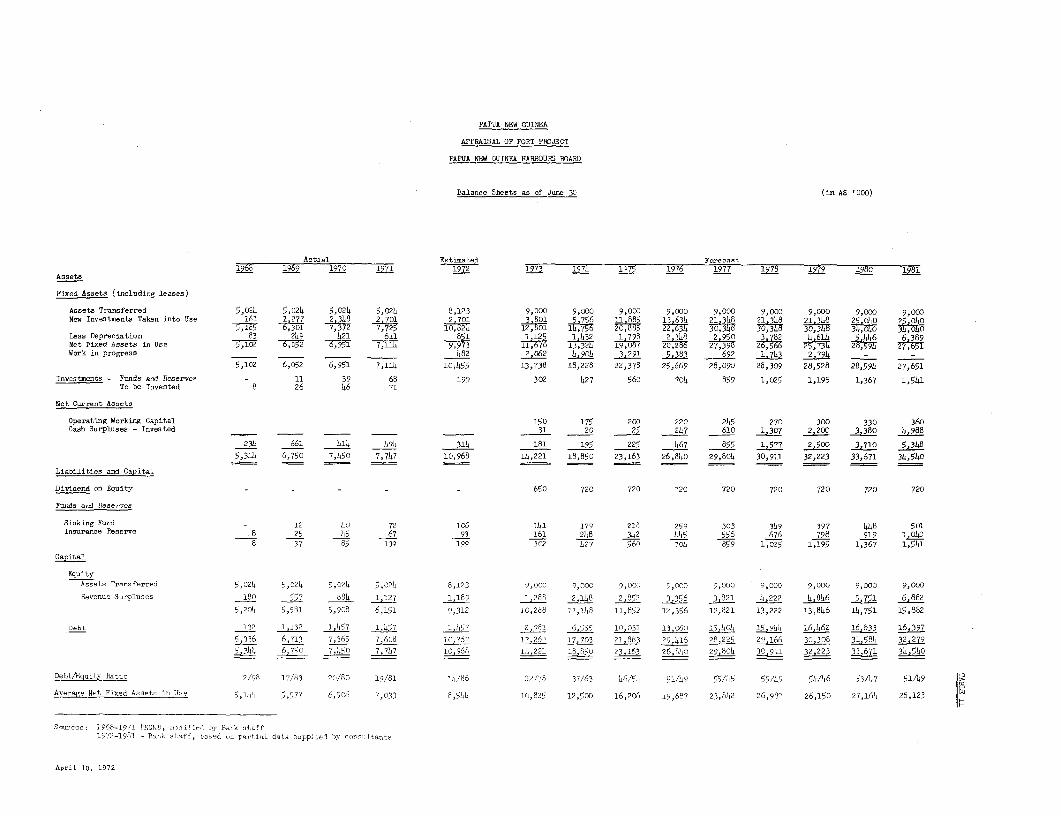
PAPUA NEW GUINEA
APPRAISAL OF FORT FROJECT
PAPUA NEW GUINEA RARBOURS BOARD
Balance Sheets as of June 30 (in A$ '000)
Actual Eetimated Foreca-t1968 1969 1970 1971 1972 1973 1974 1L75 1976 1977 1978 1979 1980 1?981
Assets
Fixed Assets (including leases)
Assets Transferred 5,024 5,024 5,024 5,024 8,123 9,000 9,000 9,000 9,000 9,000 9,000 9,000 9,000 9,OO0New Investments Taken into Use 161 1,277 2,348 2,701 2 701 3,801 5 756 11 885 13 634 21 318 21 348 21 318 25,040 2,os0
5,185 6,301 7,372 7,725 10,82 4 12,801 0 22,634 30,348 30;348 3,00 3L;O4DLess Depreciation 83 249 421 611 851 1 125 1 ?32 1 798 2 348 2.959 3 782 4 614 5,446 6 389Net Fixed Assets in Use S,1G2 6,052 , 7,114 9,973 t11T 6 7 1 3 3240,2 27,398 26566 25,73 287,594Work in progress 4_ 82 2.062 4.90° 3,291 5,383 692 1,743 2.794 - '
5,102 6,052 6,951 7,111 10,455 13,738 18,228 22,378 25,669 28,090 28,309 28,528 28,591 27,651
Investments - Funds and Reserves - 11 39 68 199 302 427 560 104 859 1,025 1,195 1,367 1,541To be Invested 8 26 46 71
Net Current Assets
Operating Working Capital 150 175 200 220 215 270 300 330 360lash Surpluses - Invested _ 31 20 25 247 610 1,307 2,200 3,380 4,988
234 661 414 494 314 181 195 225 467 855 1,577 2,500 3,710 5,348
5,344 6,750 7,450 7,747 10,968 11,221 18,850 23,163 26,810 29,801 30,911 32,223 33,671 34,540
Liabilities sod Caoital
Dividend on Equity - - - - 650 720 720 720 720 720 720 720 720
Fulds and Reserves
Sinkieg Fund _ 12 4° 72 106 4i1 179 218 259 303 349 397 448 501Insurance Reserve 8 25 45 67 93 161 248 342 445 556 676 798 919 1,040
8 37 85 130 199 302 127 560 704 859 1,025 1,195 1,367 1,51
Capital
Equity
Assets Transferred 5,024 5,224 5,024 5,024 8,123 9,000 9,000 9,o00 9,Coo 9,000O 9,0o0 9,000 9,000 9,000
Revenue Surpluses 180 557 884 1,127 1,189 1,28R 8 2 ,81 152 3.356 3,871 4,222 4,846 5,751 6,882
5,204 5,581 5,908 6,151 9,312 30,288 11,148 11,852 12,356 12,821 13,222 13,846 14,751 15,882
Debt 132 1,132 1,457 1,152 1, 17 2,981 6,555 10,031 13,060 15L404 15.9L1 16,462 16.833 16,397
5,336 6,713 7,365 7,608 i(, 76'' 11,26, 17,703 21,863 25,116 185,25 29,166 30,308 31,58 32,279
5,344 j,155 7,ZJ50 7,747 ,1096B 14,221 18,850 23,163 26,5° 29,00 30.911 32,223 33.671 34,540
Debt,/Equity Ratio 2/98 17/83 20/80 19/81 14/86 22 /78 37/63 46/54 51/4,9 55/45 55/45 54/46 53/17 51/49
Average Set Fixed Assets tn Usc 5,111 5,577 6,506 7,033 8,544 10,825 12,500 16,206 19,687 23,842 26,987 26,150 27,161 28,123
Soorcos: 1968-1971 PNCD?, aJ0ifi-i by Batk dtuff1977-198i - B,b stcsff, baoed on pss-t!,u dots sepplied by co,sq,1tst,ts
April 1, 1972

PAPUA NEW GUINEA
APPRAISAL OF PORT PROJECT
PAPUA NEi GUINEA HARBOURS BOARD
Existing Debt, Due to Administration
(In A$000o)
Date of Amount InterestAmount Interest Interest First of First Accrued Annual
Loan No. Date A$'000 Rate % Due - ayment Payment June 30/71 Interest
1 Feb 9/68) 132 5.875 Apr 1 Oct 1/71 3,888.12 1,933 7,755.00Apr 1/68) Oct 1
2 Aug 1/68 200 5.875 Feb 1 Aug 1/71 3,927.40 2,929 11,750.00Aug 1
3 Dec 2/68 250 5.875 Jun 1 Dec 1/71 9,818,49 3,661 14,687.50Dec 1
4 Feb 14/69 300 5.875 Mar 1 Sep 1/71 7,358.01 4,394 17,625.00Sep 1
5 Apr 30/69 250 5.875 May 1 Nov 1/71 8,611.30 3,661 14,687.50Nov 1
6 Nov 27/69 200 6.4 Jun 1 Dec 1/71 8,566.71 3,191 12,800.00Dec 1
7 Apr 15/70 125 6.4 May 1 Nov 1/71 4,690.41 1,994 8,000.00Nlov 1
1,457 21,763 87,305SOURCE: PNGHB
April 10, 1972
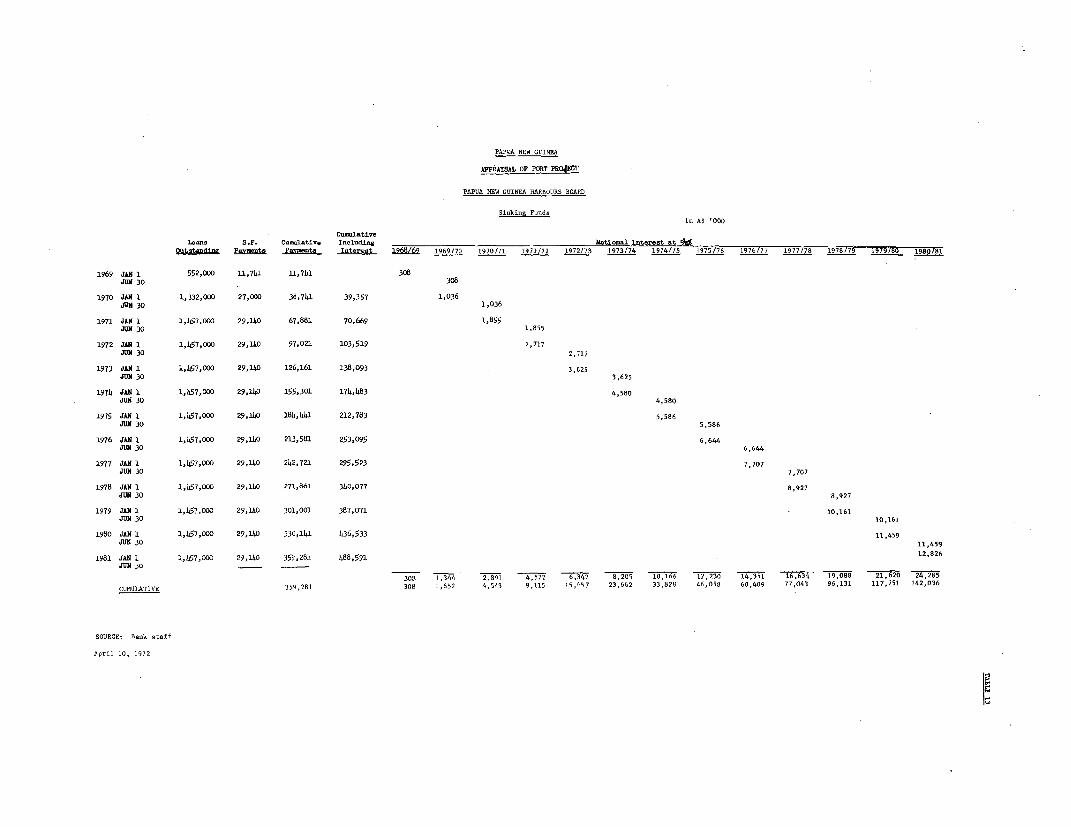
PAPUJA NEW GUINEA
APPRATSAL OF PORtT PRC{8CT
PAPUA NEW GUINEA HARBOURS BOARD
Sinking F-udAin AS '000
Cu.lativeInan S.F. C-mll.tive Inniuding NRotion1 Interest aI 9d
Outstandi a ntn Payents Ianterst 196L6 1969/70 1970/71 1971/72 1972/73 1973/74 1974/75 1975/76 1976/77 _717 9798OT98081
1969 JAN 1 552,000 11,741 1.,741. 308JUN 30
308
1970 JAN 1 1,332,000 27,000 38,741 39,357 1,036
JUN 30 1,026
1971 JAN 1 1,457,000 29,140 67,881 70,669 1,855JUN 30
1,855
1972 JAN 1 1,1457,000 29,140 97,021 103,519 2,717
JUN 30 2,717
1973 JAN 1 1,457,000 29,140 126,161 138,093 3,625
JUN 30 3,625
1974 JAN 1 1,457,000 29,140 155,301 174,483 4,580
JUN 30 4,580
1975 JAN 1 1,457,000 29,140 184,441 212,783 5,586
JUN 30 5,586
1976 JAN 1 1,1.57,000 29,140 213,581 253,095 6,644
JUN 30 6.644
1977 JAN 1 1,1.57,000 29,140 242,721 295,523 7,707
JUN 30 7,707
1978 JAN 1 1,157,000 29,140 271,861 340,077 8,927
JUN 30 8,927
1979 JAN 1 1,457,000 29,140 301,001 387,071 10,161
JUN 30 10,161
1980 JAN 1 1,457,000 29,110 330,1141 436,533 11,459
JUN 30 1,5
1981 JAN 1 1,457,000 29,140 359,281 488,591 12,826
JUN 30 - -
308 T,344 7,191 4.572 6,342 1,205 10,166 12.230 14,351 16,634 19,088 21,620 24,285
CIJkULATIVE 359,281 308 1,652 4,543 9,115 15,457 23,662 33,828 46,058 60,409 77,043 96,131 117,751 142,036
SOURCE: Bank ntaff
April 10, 1972

PAPTlA NEW GUINEA
APPRAISAL OF PORT PFiOJECT
PAPUA NEW GUINEA IIARBOUYS BOARID
Cash Fla.; Statement 1971/72 - 1980/81 (in A$ '000)
1971/72 1972/73 1973/74 1974/75 1975/76 Sub-Total 1976/77 1977/78 1978/79 1979/80 1980/81 TOTALFunds Required ___
Inve1 tments
IDA Projects 10 1,862 3,716 7,268 1,494 9,350 9,350Others 472 818 1,081 2 248 2 347 6 966 3 023 1 0S1 1 051 898 12,989Tr2 3,680 h ,797 4 ,1 3,02 1 16,3 16 T5T 7 F 22,339Debt Service
Interest 92 198 397 644 854 2,185 1,055 1,151 1,186 1,215 1,214 8,006Amortization 29 29 29 29 29 145 2 352 376 465 1 860121 227 173 2 2,330 9 1,24 7 1,538 1,5 9 7Operating Working Capital
Increase - 150 25 25 20 220 25 25 30 30 30 360
Tatal Funds Reauired 603 3,067 5,248 5,214 4,744 18,866 14295 2,6S7 2,619 2,519 1,709 32,66Balance of Funds Forward 494 494 494Borrowings
Relending IDA Credit 1,524 3,004 1,889 1,308 7,725 7,725Other 570 1 587 1 721 3 878 2 507 841 NI,1 718 8 7851,T2T4 Y3,57h 3F iT,7 1 T 5 8 7Internally Generated Funds - - - _Required 109 1,533 1,674 1,738 1,715 6,769 1,788 1,716 1,778 1,B01 1,709 15,561
Cash Generated
Operating Surplus 180 976 2,005 2,094 2,094 7,349 2,236 2,235 2,447 2,699 2,848 19,814Depreciation 240 274 307 366 550 1,737 602 832 832 832 943 5,778Interest Earned 3 - 1 3 13 20 33 66 112 .170 246 647423 1,250 2,313 2,63 2,657 9,106 2,871 3,133 37,91 3,701 4,037 2629Surplus (Deficit) - Annual 31)4 (283) 639 725 942 1,083 1,417 1,613 1,900 2,328Cumulative 314 31 670 1,305 2,337 2,337 3,420 4,837 6,45o 8,360 lo,678 10,678Assumed Distribution of Profits of
previou3 year:As 8% dividend on original equity - - 650 720 720 2,090 720 720 720 720 720 5,690Cumulative - - 650 1,370 2,090 2,810 3,530 4,250 4,970 5,690
Net Cash Surplus after dividend 314 (283) (11) 5 222 363 697 893 1,180 1,608Cumulative 314 31 20 25 217 247 610 1,307 2,200 3,380 4,988 4,988
Source; Bank staff
April 10, 1972

ANNEX 1Page 1
PAPUA NEW GUINEA
APPRAISAL OF PORT PROJECT
Total Foreign Traffic Development
The Economist Intelligence Unit recently made an extensive trafficforecast, based upon the forecasts made by Sir Wgilliam Halcrow and Partnersand recent developments in the area, covering all twelve ports in PNGhandling foreign cargo.
Foreign traffic increased from one million tons in 1966/69 to 14million tons in 1970/71, and is expected to increase to 2.6 million tonsin 1900/ol, corresponding to an average growth rate of 6% p.a. This isconsidered reasonable.
The forecast does not include the export of copper and copper orewhich will move over private facilities. It also does not include logs(estimated to increase from 150 million su ft in 1970/71 to 217 millionsu ft in 1974/75) since most are loaded overside from the water and notover the wharves.
The particulars for each of the 12 ports follow.
A C T U A L F O R E C A S T1968/69 1969/70 1970/71 1972/73 1977/75 1980/81
PORT MORESBY(0O00 tons)
ImportsGeneral 212 221 207 228 291 337Petroleum 67 66 74 82 105 122
Exports 30 42 49 52 59 65Total 309 329 330 362 55 52
LAE
ImportsGeneral 178 262 253 359 406 542Petroleum 60 70 90 116 155 221
Exports X5 66 64 61 64 81Total 293 398 407 5 627 8
MADANG
ImportsGeneral 42 50 4° 37 252 277Petroleum 12 14 17 23 112 170
Exports 27 25 2 18 41 49Total -§F -F9 -& 7 385 9-6

ANNEX 1Page 2
A C T U A L F O R E C A S T1968/69 1969/70 1970/71 1972/73 1977/78 1980/81
SAAMRAI (INCLUDING AIOTAU)
ImportsGeneral 10 10 9 11 15 18-Petroleum 2 2 3 2 3 3
Exports 8 9 7 10 13 14Total 20 21 19 23 31 5
RABAUL
ImportsGeneral 110 126 104 118 140 156Petroleum 21 24 29 34 50 63
Exports 82 61 58 62 69 75Total 213 211 191 214 259 294
KIETA
ImportsGeneral 201i/ 1471/ 3 031/ 30 47 68Petroleum - - - - - -
Exports 2 14 412 20 26
Total 22 346 3 7 9
TOTAL MAIN PORTS
ImportsGeneral 572 816 916 783 1,133 1,398Petroleum 162 176 213 257 425 579
Exports 204 217 245 215 266 310Total 93 1,209 1,37li 1,25 1,824
TOTAL PAPUA 'NE1 GULNhFA
ImportsGeneral 603 867 945 859 1,276 1,571Petroleum 162 176 213 257 425 579
Exports 223?/ 2382/ 267?V 280 382 435Total 935 1.271 1,3295 _ 8 2 8
1/ Includes Ioloho (Copper Company wharf).2/ Excluding minor ports data not available.
January 7, 1972

ANIEM 2Page T-
PAPUA NThw GUrm;A
APPRAISAL OF POY'3_1 P`OJECT
Port Operations
A. Functional Responsibilit4es within Port Areas
Orgaziizations carrying out various port operations are:
(a) Pilotage - the Administration.
(b) Towage - private operators.
(c) Berthing and urberthing - authorized by the Board's PortMamagers but undertaken by the ships assisted by privatelyoperated tenders.
(d) Providing boats and launches - private operators.
(e) Conservancy of harbor and approach channels - PNGBB withinport limits. Outside port limits - the Administration.
(f) Lighting and marking of harbor and approach chanunels -as for (e).
(g) Stevedoring (from ship's hold to point of rest on quayor in lighter and vice versa) - private operators, subjectto PINGHB By-laws.
(h) Cargo handling - private operators, subject to PNGHB By-laws,
Ci) Storage in the port operating area - private operators,subject to PINGBB By-laws supervision.
(j) Lighterage - private operators, subject to PNGBB By-lawvs.
(k) M4aintenance of wiharves, buildings, etc. - PBGHB.
(1) PDNGHB is responsible for piLicing, wJatching and tr-afficcontrol in the port area,
B. Labor
Labor employed at each of the ports can be divided into privatesector and government sector employment.
The major sector employment figures are as follows:

ANMEXI 2Page 2
Port Moresby Lae Kieta
Berthing and Unberthing 12 (P) 14 (P)Stevedoring a1 (P) 100 (P)
70 (C)Cargo Handling 228 (P) 16 (P)
53 (P) 60 (C)Storage 30 (P)
Total 146 (P) 242 (P) 146 (P)70 (C) 60 (C)
P - permanent employmentC - casual employment
Companies concerned are as follows:
Port Moresby Iae Kieta
Steamships Rabaul Stevedores Rabaul StevedoresBurns Philp Burns Philp R. LaurieJ. C. IJaller Pacific Island Shipping Carpenter ShippingH. S. Craig Buntings
Permanent employees are usually paid on a salary basis plus overtime, andcasual employees are paid on a time rate; labor conditions are governed byawards under the Industrial Relations Ordinance, 1962-70 (see Annex 4).The ouher major employer is tlhe PNGHB and details of the numbers employedare given below:
Port Moresby Lao Kieta
Management/Secretarial 8 8 1Gatekeepers 10 7 -Maintenance (Buildings) 6 1Laborers 7 16
Total 31 32 1
C. Labor Productivity
Statistics on stevedore: andquay labor productivity are limited.The only statistics which are kept continuously relate to gross and net cargodischarge rates per gang hour. These are taken from the stevedoring reportsubmitted for each ship calling at the port and relate to total cargo dis-charged and loaded. Statistics are not available for different types ofcargo. An analysis of these reports for the year 1970-71 for Port 1Moresbyand Lae and a six week period (17th July-31st August, 1971) for Kieta yieldsthe following results:

1.NPJEX 2Page 3
Port loresby Lae KietaG.H.R. N.H.-R. G.H.R. N. H. R. G. H. R. N. H.R.
July-Dec., 1970
Overseas Ships
- with reservations 26.6 29.6 18.3 27.e -
- without reservations 12.7 1511 8.3 10.9 -
Coastal Ships 10.4 12.0 5.4 10.5 -
Total Ships 14.5 16.7 9.9 13.2 -
(17/7/71 -31/8/71 only)
Jan. -June1 1971
Overseas Ships
- with reservat,'ons 27.4 32.9 20.5 355 ) 156 23.- without reservations 12.8 16.1 9.6 12.5 )
Coastal Ships 10.3 12.2 9.5 11.7 12.6 16.5
Total Ships 15.0 18.2 1110 14.5 14.4 206,5
G.H.R0 - Gross Handling Rate (revenue tons/gang hour)N.H.R. - Net Handling Rate (revenue tons/gang hour)
Since those ships with reservations are required to have at least 85% oftheir cargo unitized in either containers, flats or pallets, the differencein handling rates between these two classes of overseas ships gives anapproximate indication of the differential between handling cargo which isunitized and that in the conventional form.
The average number of men per hoolc during discharge and loadingoperations differs as between types of cargo and thcse estimates are givenbelow:
Containers Flats Pallets §lings
No. on wharf 3 3 3 4NIo. in hold
(including relief) 6 6 6 8No. on deck
(including relief) 5 5 5 5
Total 14 14 14 17

ANINEX 2Page 4
D. Cargo-Handling Methods Used
Overseas cargo is handled either by sl-ips' c,ear or i.a s.de z,.:ts;Coastal cargo is usually handled either manually or bmy ahips' de.Cckcsdepending on the size and the cargo concerned.
All cargo-handling equipment at each of the three ports is privatelyowned by stevedoring companies and is used in conjunction with the ship'sequipment to load and discharge cargo, Consistent with oirmership, thisequipment is maintained and operated by the respective stevedoring companiesand is generally in very good condition. A summary of available cargo-handlingequipment is 2iven belo..:
FORKLIFTS X )
11 1 1 3/4 2 2 3/4 3L 5 7 8
Port Moresby 4 8 32 12 3 1 2 2Lae 2 2 8 2 7 3 10 2 1 1 2Kieta 5 4 3 5 1
MOBILE C1M?AES i=XJ,UM CAPACITY (TONS)
3 5 6 8 10 1$ 16
Port Moresby 1 7 2 1 1Lae 1 1Kieta 1
Forklifts Total Klo. Mobile Cranes Total NoJ
Port Moresby 64 Port Moresby 12Lae 40 Lae 2Kieta 13 Kieta 1
In addition, tractors and flat-top trailers are used at each port as follows:
Port Moresby Lae Eieta
Tractors 11 9 3Trailers 48 37 6
Only a very small portion, representing 5 - 10% in each port, of the coastalcargo carried is unitized and containers are 50clloL1 used.

PAPUA NEW GUINEA
APPRAISAL OF PORT PROJECT
Existing Port Facilities in Project Ports
PORT MORESBY IAE KIETA ALOTAU
(a) WHARVES Main wharf 700'x6O' T-head, 800'x40' head, connected to Main wharf 208'x38' of Small ships wharf only,connected to shore by 270'x3
6' shore by five approaches 105' precast concrete slabs L-shaped with head
access way. long, two being 22' wide and on steel piles, located 120'x21', shore connec-Concrete deck on steel piles, others 30'. in front of a steel tion 75'x2i' and 100'General condition: good. Concrete deck on steel piles. sheetpile retaining long causeway.
Condition good except for wall. Sheet piles Prefabricated concretefendering. Privately owned provide 100' and 196' slabs on steel piles.
Coastal feeder wharves - five coastal feeder wharves in respectively at western Condition good.privately owned, to east of area outside of the designated and eastern ends formain port area. port. coastal feeder berths.
General condition - good.Two privately ownedcoastal feeder wharvesexist.
(b) COVERED Two sheds, each 240'x8O'; Five sheds - one 200'x60', One shed 150'x80'; oneSTORAGE one shed 140'xlOO', closed two 180'x80', two 18O'x1O0'. open storage shed 60'x30'.
only on eastern end andprovided with 20' canopyto sides.
(c) OPEN 61,400 sq ft 130,000 sq ft (currently 29,000 sq ft
STORAGE being increased)
(d) RAMPS Available concrete ramps:i)PNGHB ramp - 30' wideii)Australasian Petroleum
Company - 20' wideiii)Marine Naval Base -
30' wide
April 10, 1972

ANN,X 4
PAPUA 1iW GUINEA
APFRAIDAL OF PORT' PROJECT
StevedoringZ Labor Awards
Stevedoring labor conditions are governed by awards under theIndustrial Relations Ordinance, 1962-70. An award takes the form of anagreement between the Employers, Federation of Papua New Guinea and theWorkers' Associ.ation, Union or village headmen of the district in hichthe port is situated, certified by the Inadustrial Registrar. The provisionsof the Native ETnployment Ordinance apply to all such awards.
The awards regulate stevedores' rates of pay, holidays, workinghours and overtime, provision of meals, accommodation and transport, andreasons for dismissal. Rates of pay for normal working hours vary at theproject ports as follows:
(a) Port IToresbZ: Casual employees engaged as laborersrccnAie A',, 0: per hour :nd as einchraen A$ o.28 perhour. Permaneilt employees receive a basic wage of.A; 7.00 per wee! rlus Au 0.03 an hour for laborers andA1,' 0.07 an hour for winclrmen, Trainee foremen arepaid a weekly wage of A$ 11. 00.
(b) Lae: Employec i are paid At 1.92 for a full shift whenengaged in general laboring; i`' 2.24 w1hen engaged asAwinchmen; and A$ 2.56 whern engaged as foremen.
(c) Kieta: The rates of pay are the same as at Iae for afull shift.
(d) Alotau: The rates of pay at Alotau. are governed by theSamaarai-Alotau General fuployment Award and are similarto Port Moresby.
November 29, 1971

AINTNEX 5
Page 1
PAPUA NEW GUINEM
APPRAISAL OF PORT PROJECT
Project Items
(i) Port Moresby -
(a) Land reclamation adjacent to the existing port, providingapproximately three acres of storage area fronting theforeshore;
(b) construction of a cargo shed of 18,000 sq ft;
(c) provision of one acre of asphalted hard standing foropen storage;
(d) consultant ser,rices for detailed engineering and super-vision of construction.
(ii) Lae -
(a) Construction of one deep-water berth (as an extensionof the existing wharf) 606 ft long with an alongsidedepth of 36 ft at LNOST for oceangoing vessels up to18,000 dwt;
(b) construction of one transit shed of 40,000 sq ft andadequate open storage areas and necessary ancillaryservices;
(c) construction of a mooring post and breasting dolphinsfor coastal tankers;
(d) consultant services for detailed engineering and super-vision of construction.
(iii) Kieta -
(a) Construction of two coaster berths each 190 ft long withalongside depth of 18 ft at LbUOST for vessels up to3,000 dwt;
(b) construction of two, small, cargo sheds with total areaof 14,400 sq ft and adequate open storage areas andnecessary ancillary facilities;
(c) consultant services for detailed engineering and super-vision of constructlon.

!A.NET, 5
Page 2
(iv) Alotau - Building a new port 5 providing --he folloi.ing facilities:
(a) a deep-w2ater bertn 300 ft lonrg -Tith an alongside depth of36 ft at I1 wOST for oceangoing vessels up to 13,000 dwt;
(b) one berth 180 ft long with an alongside depth of 18 ft atIATOST for coasters up to 3,000 dwrt;
(c) one transit shed of 17,000 sq ft and one copra storage ehedof 10,000 sq ft and adequate open storage areas and necessarxancillary services;
(d) consultant services for detailed engineering and supervisionof construction.
(v) Provision of cargo-handling equipment comprising forC.Lifts, tractoLrs,trailers, and mobile cranes; and
(vi) Training and accounting consultants' services.
November 29, 1971

ALYEX 6Pg 1
PAPUA NEW GUIREA
A PPRAISAL 07 POiT PROJEECT
Analysis of Alternative Port Development Schemes
1. Alternative port development schemes in all ports were consideredby the mission, based partly on investigations by the consultants.
2. For Port 14oresbb several development alternatives were considered,both outside and inside the present port area. The main alternatives analyzedwere:
(a) to provide an open storage area and a new shed outsidethe present port area; and
(b) to provide similar facilities as above, but inside thepresent port area and including two coastal berths.
Alternative (a) has been chosen by the Administration as the best from along-term developmental point of view. Alternative (b) was more costlybut showed a sliglatly higher internal rate of return.
3. In Alotau/Samarai only two alternatives exist because of thedilapidated condition of the wharf:
(a) moving the present port in Samarai to the new districtcapital, Alotau, and
(b) modernizing or rebuilding present facilities in Samarai.
Although the direct costs were considered to be the same in both alternatives,the net benefits off moving the port to the new regional capital were con-sidered to be much greater. A further alternative of transporting part ofthe cargo by lighter was rejected as uneconomical.
4. Five alternative sites were considered by the consultants inBougainville because of the present drawbacks (swells etc.) in Kieta.Only a new port at a nearby island, having wharves on a dradged lagoon,would eliminate the swells, but this alternative was rejected as too costly.
5. Becauise of the many development possibilities in Lae each dependingupon certain traffic developments, a simulation study was carried out toinvestigate the following alternatives:

A5DEX 5Page 2
(a) the construction of one berth (600 ft) extension to theexisting wharf (the project);
(b) the construction of a separate coaster berth;
(c) the construction of a separate oil berth; and
(d) a longer version of (a).
The codaination of alternatives (a), (b) and (c) was found to be the mosteconomical solution independent of the various traffic developmentalternatives.
6. The project is generally consistent with the most economical long-term solutions. It will provide sufficient capacity in all four ports forat least 10 years with the exception of Lae. In Lae further exeansionsmay be needed before 1978/79 if the new road to the Highlands is not imple-mented, and inl191/C,2 if the road is completed.
November 29, 1971

Page 1
PAPUA N-U GJUINEA
Future Car ows through the Project Ports
A. Bases for Pro.jections
1. PMG presents a traffic forecasting problem because of the smallbut rapidly grawing economy, the difference between the size and per capitaincome of the expatriate and the indigenous population, and the unpredict-able results of impending self-govenIment and independence.
2. The expatriates number 50,000 with a per capita income of US$)4,800while the indigenous people number 2.5 million with a per capita income ofabout US$120 existing largely on subsistence agricultureO There is a greatdifference between the import requirements and exportu capacity of the twtopopulation groups.
3. The monetary sector of the econony has been growndg at an overallrate of 10% p.a. and has soared to as much as 25% p.a. in some parts of thecountry over tlhe past two years. This high growth rate has been influencedby some large investments over the past five years. The Bougainville
opnc r p2ro$Ct, all :il XnvC&Olc.Cnt of kI !'O0 hO llion, halS had a substmntialimpact on growth, GITP and imloorts. Other projects in the oil explorationand mining fields have also had an effect on G-NP and on the demand forimports.
4. Private investments in growth industries such as mining, agri-culture and forestry will affect both the volume and value of exports. Therate of grmoth, the capacity to industrialize and the effect of future poli-tical development on private investment, will determine the extent of importsubstitution. The present Governnmnt's development strategy is to attractprivate investment.
5. Coastal cargo is bound to increase rapidly, and will require, toan increasing degree, separate port facilities to alleviate congestion andship waiting time, particularly at Lae, Kieta and Port Moresby.
6. The traffic forecasts have been influenced by the various con-sultantst reports, discussions with those Government departments respon-sible for planning and programming and with private business. The trafficfigures submitted by the PNIGIE3, on which it bases its levies, have beenconsidered the most accurate.
B. Port Moresby-
7. There are some factors which tend to affect the traffic developmentpotential of Port M4oresby. They include divergent views regarding the sit±ns

iF,-X 7Page 2
of the capital after independence; the lack of a foreseeable largefuture developiment of Port 1M1oresby wJhich i~ould create a large growth rateof overseas and coastal traffic; the developrment of neighboring ports suchas Alotau which will reduce thie flowi of traffic, part-icularly coastal traffic.It was observed that actual traffic movements through the port, in general,fell short of the projections made by Haunsell and Partners. For example,YMaunsell and Partners forecast that total traffic, excluding petroleum,passing throagh the port would be 418,000 tons in 1969/70; this compareswith actual throughput of 304,000 tons in the same year and 336,000 tons in1970/71. From Table 4 it can be seen that actual irports have been relativelystatic for the past three years and a growth rate of 5% for imports, whichis in line with the rate of growth of populatiorb was adopted.
8. Exports, at 31,000 tons in 1967/69, decreased slightly to 30,000tons in 1968/69 and then increased again to 49,000 tons in 1970/71. Thislatter level is about double Haunsell's 1979/80 projection, .largely becauseof the rapid development of cargo unitization. In 1470, 50% of the outwardcargo consisted of returned pallets.
9. It was agreed with the Economic Adviser's Office in Port Horesbythat the increase in the production of rubber and copra, the main commodities,will not exceed 5% p.a. The actual 1970/71 export figures were used as thebasis for export projections which were made up to 1981. The projected growthrates are considered to represent the upper limit of the anticipated develop-ment of Port Moresby.
C. Lae
10. A comparison between actual traffic, which went through the port ofLae for the period 1968/69 to 1970/71, and WEBJECO traffic projections follows.
1968/69 1969/70 1970/71Actual NEDECO Actual NEB4C0 Actual NEDECO
Overseas . . . . . . . .(tons) . . . . . . . . .
Imports 177,812 168,000 262,064 227,000 253,892 273,000Exports 54 ,64o 45,000 6j6,353 50,000 64 051 53ooo
Q23452 233,000 328,417 273,000 317,943 326,000
Coastal
Inwards 9,807 11,000 11,190 11,000 19,311 12,000Outwards 25,991 39,000 37,033 42,000 55,944 40,000
35,718 50,000 48,223 53,000 75,255 52,000

ANmEX 7Page 3
11. It follows from the above figures that the actuial figures fluctu-ated around NEDECOIs projections with some deviation in 1979/70 in the caseof overseas traffic and relative>l,r marked deviatf.on in th'.e case of coast,altraffic in 1970/71. One of the mainr reasons for this is the effect of thelarge imports required by the Bougainville copper project.
12. NEDECO assumed ani import growth rate of 10% for Lae and vicinityin line with the rise in monet+ary GNP, and a much higher growth rate in theHighlands. Lae is a rapidly growing industrial town and a 10% growth ratefor imports is not unrealistic.
13. NEDECO assumed that if the road linking xladang with the Highlandswere to be completed by 1976, it would divert 165,000 tons of incoming cargofrom Lae to Madang. This diversion is considered to be too highl. The topo-graphy of the Highlands is very rugged and transport costs of moving thediverted traffic will be rather high. Also, iviadang may not be able to handlethis diverted traffic if port facilities are not extended, despite its naturalphysical advantage over Lae. In view of the transport costs, it is consideredthat not more than 100,000 tons of imports will be diverted to NAadang in, 1976.
14. For outgoing traffic from the Highlands, a groizth rate of 8% p.a.as against IEDECO's 10% or more was adopted. This is in line with the expectedgrowth rate of coffee, copra, cocoa and timber production in the Highlands.Outgoing traffic, estimated at 17,000 tons as against NEDECO's 16,000 tons,will be diverted to INladang from Lae after 1976. For coastal traffic NEDECO's6% growth rate is considered realistic.
D. Kieta
15. There are three ports on the island of Bougainville serving threedifferent purposes: (i) Loloho, which used to handle both general cargo andoil but now handles only oil; (ii) the Bougainville Copper Proprietary's(BCP) separate port about 12 mi from Kieta handling only the export ofcopper and import of oil needed by the copper mines. (The copper companyhas given the PNG Administration an undertaking that all other products,including its spare parts and other imported goods, will be imported throughKieta.) (iii) Kieta, which is the main administrative center of the island.The port wds constructed in 1969 and overseas cargo imports for Kieta andLoloho together rose 19,000 tons in 1968/69 to an estimated 302,500 tons in1970/71; separate data for each port are not available.
16. Considering the type of development actually taking place on theisland, a 10% annual increase in imports comprising mostly building materialsfor the toum and the copper mines as well as general cargo was assumed asopposed to the 7.8% growth rate adopted by NEDECO.
17. Exports through Kieta consist mainly of agricultural products:copra, cocoa and coffee. Total copra production on the island in 1970 was20,000 tons, which is expected to increase by 5% over the next five yearsand fall slightly after 1978 because of a shortage of labor. This was con-firmed by the Rural Development Office in Kieta. Of this figure only 8,000

AIiNEX 7Page 4
tons went through Kieta; the rest was exported through Rabaul. After thecompletion of the port project and the road, which is beizi' conctz.Ucted tolink Kieta with the production areas, Kieta!s share of copra eJ-pots isexpected to increase by at least 10%.
18. 6,C00 tons of cocoa were produced on the island of which about2,000 tons were shipped thrcugh Kieta. Cocoa prodluction will continue torise by 5% p.a. up to 1976, thereafter falling slightly because of laborshortages. For projection purposes, a total export figure for coffee, copraand cocoa of 13,000 tons in 1971 was used, rising by 10, p.a. to 1980/81.
E. Samarai/Alotau
19. Samarai is a small island just off the mainland, handling allforeign trade of the Hilne Bay district. Alotau is the proposed new port andthe administrative center of the district. The Alotau traffic forecast isbased on past and present trends in traffic movements in Samnarai and possi-bilities of future development of the Yilne Bay district.
20. Prospects for the Milne Bay district depend mainly on:
(a) expansion of copra production;
(b) exploitation and export of its vast forest resources; and
(c) mining and oil de-velopment.
(a) From information supplied by the Australian Department of Agricul-ture, Stock and Fisheries, plantings of coconut trees by indigenous and non-indigenous growers have been exceptionally high during the last three years.The total acreage involved is 40,000 with a production capacity of 7,000tons of cocG1ut.
(b) Forestry, on the other hand, has shoi.n no marked increase up to1969/70, but the prospects are very promising. NEDECO estimated that some20 million su ft of timber can be produced p.a. from the Sagarai forests witha value of A$ 3.5 million. A higher estimate of 50 million was made by thelocal people. A reasonable figure is expected to be between 30 and 50 million.However, in the absence of any detailed study, it is difficult to in,cludethe timber figures in the traffic forecast.
21. Nining and oil exploration remain less significant. The Adminis-kration confirmed, however, that about A$ 22 million will be spent aroundthe Milne Bay area on oil exploration. This, again, will have a strongeffect on imports. There is a possibility that most of the timnber andtimber products will be shipped through a private facility. If this happens,a substantial proportion of the general cargo and equipment which will be.required by the forest industries "Till have to go through the port of Alotau.Also, the multiplier effects produced by spending on timber will induce anincrease in the general cargo imports. Although the volume of general cargoto be generated could not be accurately quantified, it has been taken intoaccount in the import projections.

AIJNE 7Page 5
22. Overseas cargo in Samna-ri has been oscillating bet-veen 16,000 and20,000 tons over the past three year;., and coastal c&r:.o bet;-,Tee-. 1,CI00and 23,000 tons; total cargo throug'-iput doar-ng th_. p'eod is aliouX 38-O00
tons. Laport projections are based on the average of thie past three years.A growth rate of 5 up to 175 has been adopted, in the light of develop-ments envisaged, but after 1975, a growth rate of 10% is foreseen. Theexport growth rate is expected to be 6% up to 1975 ard 10% up to 1980/81as against NEDECOs 7% p.a. on average. Although NEDECO's coastal trafficprojection of 5% xras adcpted, it is considered conservative.
November 29, 1971
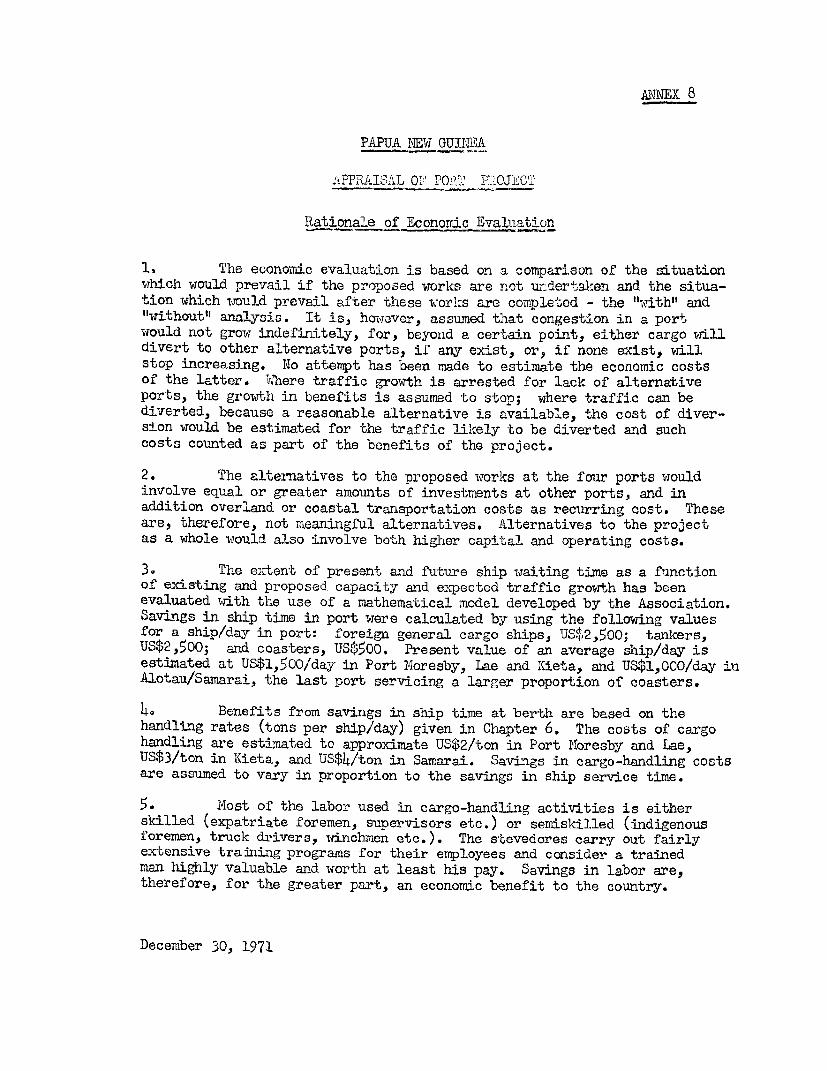
ANNEX 8
PAPUA NEW GUITEA
APPRAIOAL 0? PO91 .1 :'OJLI.T
Rationale of Economic Evaluation
1. The economic evaluation is based on a comparison of the situationwhich would prevail if the proposed works are not underta1:en and the situa-tion which nould prevail after these work:s are completed - the "with" and"1without" analysis. It is, howover, assumed that congesti-on in a portwould not grow indefinitely, for, beyond a certain point, either cargo rill
divert to other alternative ports, if any exist, or, if none exist, willstop increasing. No attempt has been made to estimate the economic costsof the latter. 'Nhere traffic growth is arrested for lack of alternativeports, the growth in benefits is assumed to stop; where traffic can bediverted, because a reasonable alternative is available, the cost of diver-sion would be estimated for the traffic likely to be diverted and suchcosts counted as part of the benefits of the project.
2. The alternatives to the proposed works at the four ports wouldinvolve equal or greater amounts of investments at other ports, and inaddition over:land or coastal transportation costs as recurring cost. Theseare, therefore, not meaningful alternatives. Alternatives to the projectas a whole would also involve both higher capital and operating costs.
3. The extent of present and future ship waiting time as a functionof existing and piroposed capacity and expected traffic growth has beenevaluated with the use of a mathematical model developed by the Association.Savings in ship time in port were calculated by using the following valuesfor a ship/day in port: foreign general cargo ships, US$2,500; tankers,US$2,50O; and coasters, US$500, Present value of an average ship/day isestimated at US$,0500/day in Port Moresby, Lae and Kieta, and US$1,000/day inAlotau/Samarai, the last port servicing a larger proportion of coasters.
4, Benefits from savings in ship time at berth are based on thehandling rates (tons per ship/day) given in Chapter 6. The costs of cargohandling are estimated to approximate US$2/ton in Port Noresby and Lae,US$3/ton in Kieta, and US$4/ton in Samarai. Savings in cargo-handling costsare assumed to vary in proportion to the savings in ship service time.
5. M4ost of the labor used in cargo-handling activities is eitherskilled (expatriate foremen, supervisors etc.) or semiskilled (indigenousforemen, truck drivers, winchmen etc.). The stevedores carry out fairlyextensive training programs for their employees and consider a trainedman highly valuable and worth at least his pay. Savings in labor are,therefore, for the greater part, an economic benefit to the country.
December 30, 1971

P',^c 1
PAPUA ITMW GUII{\.P?A
APPRAISAL OF PO-" PROJECT
Generated and Negative Beneclts - AlotaLU
1. Present log production in the Milne Bay district is about 1.5
million su ft per annum. The forest areas in MAilne Bay cover 370,000acres and are estimated to contain at least one billion su ft of saleable
timber, 1/3 to 2/5 of which is expected to be exported through Alotau.
Calculating on a 35-year growth basis, log production in the area mayreach at least 30 million su ft by 1980, of which hcu!u 12 million su ftmay be exported through Alotau.
Present value of log output is approximately A$ 30/1,000 su ft orA'P. P 100 ,pc,r tor.
Average distance to port by truck - 50 miles.
Average truck transport costs - A$ 0.08 x 50 - A$ 4/ton.
Allowing for empty backhaul, inlanid transport costs averageA^ 8/ton,
Other economic costs, soine A$ 2-3/1,000 su ft, or A$ 8/ton.
Net output value of logs is A$ 5h/ton.
Assuming thau half of the timber would not have been exportedunless a port is ccnstructed in Alotau, the benefits generated by the
constructiGn of the port in 1980 are:
.4 - (1.2 rillior 3 = 10 co.2 1,000
This benefit is assumed to grow as follows:
1975 $25,0001976 50,°0001977 75,0001978 100,0001979 125,0001980 150,000

A1*;KEX 9Page 2
2. lTegative benefits (costs) consist of the economic consequencesaccruing from the removal of overseas shUps from Samarai. The value ofthe present investments in Samarai may be sev at A$ 4 millJJon, the economiclife of which (excluding port facilities) is 20 years according to theconsultants. At an interest rate of 10%, the aLnnual value amounts to~2.pproiitel" r X 50L00. The present port will, however, continue as acoastal port, and since other activities such as tourism, schools, com-munications etc. are expected to develop further, only one-third of theexisting investments in Samarai may be considered a total economic loss.
December 30, 1971

ANrEX Page 1
PAPUA hEW GU LTEA
APPF;.AI2AL o P O..h VP2
Simnlation of Port, Activities - Lae
A siP2lationl study was carried out in Lae to evaluate the economicsof the port development. The basic assumptions are as follows-
(a) Traffic will increase by 10% p.a.
(b) Average load per ship and port productivity will increaseto 1075 and from then on remain stable, leaving shipservice times fairly stable.
(c) The number of ships ill- increase by 51O p.a. up to 1975.Thereafter the number of ships will increase in proportionto traffic (average load constant),
(d) Average costs of ships:
US$
(1) Unitized ships 2,500/day(2) Break bulk ships 25500/day(3) Tankers 2, 500/day(1h) Coasters, general cargo 500/day
(e) Ship productivity 1971: Tons/honir
(1) Unitized ships 60(2) Break bulk ships 20(3) Tankers &0(4) Coasters 10
(f) Berth reservations for unitized ships carrying 85% or moreulitized cargo.
On the above basis, the following conclusions can be drawn:
(i) The project is already overdue. Assuming that the projectwere finished in 1971/72, US$523,000/year in ship waitingtime would be saved,

A'J\AX 10Page 2
(ii) It is economical, on the basis of present traffic, toconstruct separate coaster and tanker berths. The con-struction of a separate coaster berth would saveUS$142,500/year, and the construction of a separate tankerberth would save US$189,200/year in ship waiting time.
(iii) The project will be sufficient to handle projected trafficup to 1981/52, At that time estimated waitirg times willapproach present levels,
(iv) If traffic is 10% greater than projected, the project willonly be sufficient to serve traffic up to 1976/790 A 10%traffic increase would happen if the anticipated diversionof traffic to M4adang does not occur 0
(v) The standard deviation of waiting times is very large.Some ships do not wait at all, while otlers wait farabove average,
jovember 29, l971

ANNEX 11
PA?TTA TITEJ SUTIJA
APPRAISAL OF PORT PROJECT
PAPTJA iDAW GUINEA HARBOTJRS BOQRD
Financial AFsumpti
1. The credit will be relent to PNGHB on Bank terms (para. 7.12),
2. Debt will be incurred to finance 80% of the cost of otherprincipal programmed civil works, at 8% p.ac,, with repaymlent over 21 yearsafter completion of each project.
3. Payments to the Administration out of profits will equal 8% onthe capital amount of original equity 0
4. The capital value of fixed assets and land leases as providedin the Amendment to the Ordinance (parao 3.08) will take effect July 1,1972. The earLier valuation hlas been retained for earlier financialstatements O
5. The tariff struculre and levels of rates recommended by EIUwill become effective July 1, 1972 for charges for services and facilitiesother than wharfage, and July 1, 1973 for wharfage.
April 10, 1972

I II
*r MANUS N E WI MUSSAU/S I PAPUA NEW GUINEA
MANIUS IS LA FIRST PORTS PROJECTLOREGAUN EW I RE LANDGE RA
GENRALLOCATION- EAST NW ANOVER' KAVIENG
SEPIK N EW HAN01I|
WEST 1WEWAK SM A R NEW |
) I WEST \\ * PW I W)Z'ZA/W I B O~~~~~~~~~~~~8 U G A t N V I L L Eu S E P I K tMAPRIK k AMA LA IGELAL -- OURABNVIL4E
O e-'5 A R C f/ / R AG ,0 I
X '\ G ,J2 <\oo U ,/ I ,\ / E I A A
! IWESTERN HIGHLANDS\ 2 I DANSKINS NORTH--
WES ~ ~~~~ON~ 'WET7SOHANO
I X 2 - v z E | | I SOOMON/
z ; <S/s7 ' 1 ) ' / t ) K A I A P I T O 8UYGAINV/LIEIS ,KlETA {<1 Il 4^ -- ATR I MOROBE N E W |J a ,
LCY* .DOR LARES8~ I rjPosbeftueraNontuto
W E ST E RN I E A ST NEW BR I T A
' \ 9 ~~~~~ ~ ~~~~~WAU; B R I TA N
Q o |o|\ > R NCA /0 Terriory burtnd-,-fary
OCEAN iAGUTA Xr.x too 50 0Proect p2rts
NEW ~~~~~~~~~~~~~~~~~~~~~~~~~~~~~~D ARA' I
XI , DARS | oq | \ > \ / f,< WOODdA,?K /S ~~~~~~~~~~~~~~~~~~~~~~~~Projected rrod
ZEALANO ~ ~ ~ POR MilesB
JANUARY 1972 ORtPREssble f.t.re .ad co-truct,o,| \ | Ex <\ 4t % M~~~~~~~~~~~~~~~~~~~~MI L N E B AY Exmsting main roodl
DI El,tmg mam r z.| Tood -!e c n 0.*d- ust,.ch.nlG'-
;NtSIA+<S, OCEA \ | f < | ---- ~~~~~~~~~~~~~~~~~~~~~~~~~~~~~~~D,stmtc bo.ndaury
, nPPA . SAMARAI ('
INDIAz / : / C E N T R AL u o 5 5 20
2 A U S I r A L~~~~~~~~~~~~~~~~~~~~~~~~~~~~~~~~~~I A)t}|% S1?1 5100 O20
t--1/ ~ZEALANEDQ I -TA,T _/S Im,les >
iO gS t- ~~145° |* 150'- 155-
)ANUARY 1972 IBRD-3692R

N 'E W
G U A
-~~~~ P~~APUA NEW GUINEA
I'; V : :; X 9 i; , ,, \ S ' :Frs Ports Pi ( I RE: '1M/I
c-~ ~ ~ ~ ~ ~ ~~ec
I I ,,,/a b ,,,,A .,,;,, ,a ,,; a a ,h;w ,', 0 < ; 9 5 0 :; S E D
;JANUARYS S f f , A ; 1972 , ) >t frX f \ S E;/; > ttV tf t IB K Se V D s j
0 0 t' ; ; ;; ;0 00; t000;; ; ' 00 00 ; ;i lX t ; ; 00 ;t__ 00000 044 8Ro&Fd 0f 0
t00g,V11t4|$1 o'd;1t0||fff01't0 [-- S / ~~~~~~~~~~~~~~~~REREAION 0f;S ;;;;t;S t:t40000 :;; t:t 0'; ';'i;; f;0':;;;';E:::Xft';V;; t;440000X;' ";; ti;;i E, , it0ff;;ti!:;:40,5r,B,S,S,S,(05e,ft;Si;;0000Xt;';i;0000000t0R E S E R V E
0~~~~~~~~~~~~~~~~~ A GXtt0 AtSE; H I L0 0 0 0 :0 ^ t0 / LX
;00t |}0 0f; 00 0f;i:iS:0 5ttvX /J~~~~~~~~~W;;;0SAid;tE0;iit0 i00000000ffUtt:000:|:StESES:S!00:j:S;;t0000^t:llSL^LSt0kSSgi$S:rSC:ft ;.... .. .... L / S / i@it,4:^;t$iS§F4''1.§^gg'M!i'tg'!."'::"^U'5C'^^ T:0: i: l 5: : ::) i: :'^:'::"i:': :504 : ' k :@i;tt't:>g.'-... ....... .... _. ... \/. ../.
JANU00lARYl;W00 197:;;2'0'E ; ';lE0 'M-^^' '^ ^;4 F \,X 2 t

PACIFC CE * AN
G ~~~~ ~APAPUA NEW GUINEA f
PORT OF LAEFirst Ports Project |
/d.--h bcccdc, Whoc, un rIb map do no,/ k / ttt~~~~~~~~~~~~~~~~~~~~~~~~~~~~~~~~~~~~~~~~~~~~~obly od:otneIsfimen nOnla,e s
0
04<<C
L XZi / No. 3 Berth development\ 5 D- /> (Pnodobn In~psrtwto &F // - -- Possible future extension
…Proposed costol f.cilities
financed by Htariours Board
E2 = Existing building
Eutst,ng structures to be denolshedSTOR fE E~~~~~~~~~~~~~~~~~~~~~~~~~ ~~ New buildings
G-el S, ~ ~ ~ ~ ~ ~ ~ ~ ?'~n --- io'-. Contours shown in feet
-OPEN STORAGE ARE A
< d \ \ / 100 Coo 10( 3? 00
\~~~~~~~~~~~~~~~~~S1 ==, f..,~~ '
IBRD- 3694 fRs
t ~ ~ ~ ~ ~ ~ ~ ~ ~ ~ ~ ~ ~ ~ ~ ~ ~ ~ ~ ~ ~ ~~ ~ ~~~~~~~~~~~~~~~na' YF1 ce7/

PACIfIC OC NN E W
LAE
___ _ ~~~~~~~~~~~~~~~~~~~EDGEin OFoclt REXISTING RECLAMAIOND
P ~~~~~IDTAUF ~ ~ ~ KITAMOE
X Sealed access3r,e3s (neww~ork) t 5;;a pE X_
L-- =. Sealed stor3ge 3re3s (new ~wok) w$<; 00 0ti
/,//%///XX Dredged aea TO ARe 50 0 50 100 I=O 200ANEWAAWBAAY CIAONI
-'------Fence Feet
-30'- Contours shown, in feet LOCALITY PLAN - PSCALE: I to 8000 AS
The bl'ou,odar,rhiiio orZ thIlis nlapl i1}lt, 3, s Ro4-°4?g Xg;tripSl rrirsI>rrilterrtirar rep;rrrree hi tcile:ThIretrl/ Think uit in, h,,I . INt
JANUARY 1972 IBRD- 3695 I

MAP 5
< . . ' ' iC; C: ' . P A C I iC 0 C A N
N E NW
I : . G - : I N YVV EN A
SAi :25dND 2 5 N I < !; t i\|- . t ''er~z '.:=;g 2 i
_-- - ; g A r , ; 0 W; | z_ _ _ _ _ I N t ¾-
EMS! SMALL StEEPS f - tWIWF L1x
PAPUA NEW GUINEAPORT OF ALOTAU
First Ports Project
__________ \Proposed port focilit,es- 60 --- Contours is feet
i ;t;; = E ;: 4 .2:: Xi 5 =' \ l;: :: u: : i i\ 2 ' +., ' ~~~Dredging
:0~ = =. =00 ' :' fS200 300 400
F-1t
420' 300' 240' SM' ,~~~~~~~~ ~~ FUTURE EEOPEN RN
JANUARY 1072 EeO-300S I A;E
; i; ;X | ii 0 3 ti 4t/0 i ii ; e. dd XXXr ::; ;E;; '>\;;, i H; it ;! T? i! tt1fiE 2 TQ r = =' E \~~~~~~~~FF C
: 0 : 0 \: \ X i E X : : C : a i D .; D ; a 1 # ti 1 . A : ; \ , 4~~~~~~~~60'
T: X , N L !;!i yf1tf: : A
D -f: . Li .= * i \ > \;: ~~~~~~~~~~~ :" DF i i! ;REA VAIABL I EOT .\m=zS*
4:; : \ 0; ;;: 0 \ : i: (0; 0 i 0 1; 0 ;l tf t; 0 : 0 FUTURE DEVELO
JANAR 197 Br L :\D-3 696RfR0r Z & i i :