Embed Size (px)
Citation preview
Produced by the Analytical Services team at the Higher Education Statistics Agency (HESA) for the International Baccalaureate Organization
INTERNATIONAL BACCALAUREATE STUDENTS STUDYING AT UK HIGHER EDUCATION INSTITUTIONS: HOW DO THEY PERFORM IN COMPARISON WITH A LEVEL STUDENTS?
1
Executive Summary Students enter higher education (HE) in the UK from a wide variety of educational backgrounds with differing academic qualifications. It is of interest to explore any differences in the characteristics or trends in the cohorts of students with different academic qualification prior to higher education, during and after their student journey. The aim of this report is to compare students who enter UK HE with a qualification awarded by the International Baccalaureate Organization (IBO) and those entering with a more typical A level or Advanced Highers qualification (referred to collectively as A level). The report begins by investigating differences between full-time, first year, first degree International Baccalaureate (IB) and A level students enrolled in UK HE in the 2012/2013 school year by their background characteristics including domicile, pre-HE qualification grade, equal opportunities and widening participation. Following this, comparisons are made on the type of HE providers that IB and A level students attend and the subject areas that they are enrolled on. On successful completion of a HE qualification, students become “qualifiers”. Differences between the achievement of qualifiers in 2012/13 who hold an IB or A level qualification are analysed; this is further investigated by subject. The Higher Education Statistics Agency (HESA) Destinations of Leavers from Higher Education (DLHE) survey is collected 6 months after successful completion of their qualification; qualifiers become known as “leavers”. The survey results give insight into whether leavers engage in work or study post-HE. Differences between leavers in 2012/13 who hold an IB or A level qualification by post-HE activity are explored, including type of further study, occupation, and industry, as applicable. The median salaries of IB and A level leavers in work by subject area of study are compared. Investigations into background demographics in the report show that the cohorts of IB and A level students, qualifiers and leavers differ. Propensity score matching is used to create matched IB and A level samples for each of the student, qualifier and leaver cohorts to examine the effect of enrolling on an IB diploma on several outcomes of interest. These outcomes of interest include, amongst others, enrolment at a Top 20 HE provider for students, achieving a first class honours degree for qualifiers and engagement in an activity with a study element for leavers. The results show that students holding an IB Diploma are more likely than students holding an A level qualification to enrol at a Top 20 higher education provider, after controlling for academic ability. At the same time, students holding an IB Diploma are less likely to enrol in a STEM subject course in their first year of study, when compared with students with an A level qualification. There was no significant difference between the continuation rates of IB diploma holders and A level holders. Among students awarded first degree qualifications in the UK, students holding an IB Diploma have higher odds of earning a first class honours degree than A level holders, when controlling for academic ability. Furthermore, IB Diploma holders are more likely to be engaged in further study six months after successful completion of HE degree, compared with A level holders.
2
Contents Executive Summary ................................................................................................................................. 1
Introduction ............................................................................................................................................ 4
Data sources ........................................................................................................................................ 4
Section 1. Descriptive comparison of IB and A level qualification holders ............................................. 5
Time series of student cohorts ........................................................................................................... 5
Domicile of students ........................................................................................................................... 7
Region of domicile for UK domiciled students.................................................................................... 9
Equal opportunity and widening participation ................................................................................... 9
Student pre-HE achievement ............................................................................................................ 11
Region of HE provider ....................................................................................................................... 13
Top-ranked HE provider .................................................................................................................... 14
Subject Area ...................................................................................................................................... 16
Continuation of students .................................................................................................................. 20
Time series of qualifier cohorts ........................................................................................................ 25
Achievement ..................................................................................................................................... 25
Time Series of DLHE cohort ............................................................................................................... 32
Activities of Leavers .......................................................................................................................... 33
Occupations and industries of employed leavers ............................................................................. 35
Salary of leavers ................................................................................................................................ 39
Section 2. The impact of achieving an IB diploma on higher education enrolment and outcomes ..... 43
Methods ............................................................................................................................................ 43
PSM within the student cohort ......................................................................................................... 45
PSM within the qualifier cohort ........................................................................................................ 54
Qualifier cohort results ..................................................................................................................... 56
PSM within the leaver cohort ........................................................................................................... 60
Leaver cohort results ........................................................................................................................ 61
Summary ............................................................................................................................................... 66
Student cohort .................................................................................................................................. 66
Propensity score matching in student cohort ................................................................................... 67
Qualifiers cohort ............................................................................................................................... 67
Propensity score matching in qualifiers cohort ................................................................................ 68
Leaver cohort .................................................................................................................................... 68
Propensity score matching in leaver cohort ..................................................................................... 69
Appendices ............................................................................................................................................ 70
Appendix A: Histogram and jitter plot of the propensity scores of the student data ...................... 71
Appendix B: Histogram and jitter plot of the propensity scores of the qualifier data ..................... 73
3
Appendix C: Histogram and jitter plot of the propensity scores of the leaver data ......................... 75
Appendix D: Comparison of IB diploma and A level students within each tariff grouping .............. 77
References ............................................................................................................................................ 78
Definitions ............................................................................................................................................. 79
A level students ................................................................................................................................. 79
A level tariff points ............................................................................................................................ 79
Activity .............................................................................................................................................. 79
Classification of first degree.............................................................................................................. 80
Continuation status ........................................................................................................................... 80
Country/ Region of HE provider ........................................................................................................ 80
DLHE target and response ................................................................................................................ 80
Domicile ............................................................................................................................................ 81
Ethnicity ............................................................................................................................................ 81
First degree ....................................................................................................................................... 82
Full-time students ............................................................................................................................. 82
HESA Destinations of Leavers from Higher Education (DLHE) population ....................................... 82
HESA qualifiers population ............................................................................................................... 82
HESA student population .................................................................................................................. 82
Higher education (HE) students ........................................................................................................ 82
IB Points ............................................................................................................................................ 82
IB qualification .................................................................................................................................. 82
Level of study .................................................................................................................................... 83
Low-participation neighbourhoods (POLAR3) .................................................................................. 83
Postgraduate courses........................................................................................................................ 83
Rounding strategy ............................................................................................................................. 84
Salary ................................................................................................................................................. 84
Sex ..................................................................................................................................................... 84
Socio-economic classification (SEC) .................................................................................................. 84
Standard Industrial Classification (SIC) ............................................................................................. 85
Standard Occupational Classification (SOC)...................................................................................... 85
State school marker .......................................................................................................................... 85
STEM subject marker ........................................................................................................................ 85
Subject areas/ FPE............................................................................................................................. 85
Top 20 HE Providers .......................................................................................................................... 86
Type of further qualification ............................................................................................................. 86
Year of study/ first year marker ........................................................................................................ 86
4
Introduction This report provides a comparative in depth-analysis of students who enter UK higher education with an International Baccalaureate (IB) qualification to those who enter with A level or Advanced Higher qualifications, with a focus on enrolment at Top 20 UK higher education providers, enrolment in STEM subject courses, continuation into the second year, achievement of first class honours degree, and activity six months post completion of first degree. The IB qualification is studied by students aged 16-19 in schools around the world. The diploma curriculum consists of courses in 6 subjects groups (studies in language and literature, language acquisition, individuals and society, sciences, mathematics and the arts) and the DP core. The DP core comprises theory of knowledge (TOK), an extended essay (EE) and a project about creativity, activity and service (CAS). Students are awarded 1-7 points on completion of the subject courses and up to 3 extra points for their performance in TOK and EE. The full diploma is awarded to students who achieve at least 24 points; those who achieve fewer than this or take fewer subject courses are awarded IB diploma programme course results. The full IB diploma qualification is referred to as IB diploma and IB diploma programme course qualifications are referred to as IB course throughout this report. A level qualifications are traditionally studied by UK (except Scotland) school students aged 16-18 over two years and are offered in a wide variety of subjects. Students have the freedom to study subjects of their choice. The qualification is made up of two parts: the AS level, which is studied during the first year, and the A2 level, which provides more in depth study during the second year. A levels are graded A* to E based on student performance (see Definitions section for more information). There is no limit to the number of A level subjects a student can study, but typically it is 3 or 4. HE providers (HEPs) have different entrance requirements; A level qualifications are one of them, with offers to students usually being made on 3 A levels. Advanced Higher qualifications are taken by school students in Scotland aged 16-18 after they have completed Higher qualifications and are also used as entrance requirements to HE. Advanced Highers are graded A to D. Throughout this report A levels and Advanced Higher qualifications are referred to as A levels. Data sources The report combines data sourced from both the International Baccalaureate Organization (IBO) and the Higher Education Statistics Agency (HESA). IBO maintains an information system (IBIS) that holds information about students around the world who have taken at least one IB examination. HESA collects information about the academic career of students prior to their enrolment in HE, their achievement at HE and their destination after leaving HE. HESA have linked the individual IB student records to HESA student records to identify students holding IB qualifications to enable the tracking of students through their academic career. The HESA record has also been used to identify a comparison cohort of students holding A level qualifications. The IB cohort is based on students known to hold an IB qualification in the HESA student record plus IB students from IBIS who successfully link to the HESA data. Detailed information about students’ qualifications prior to starting HE was collected by HESA for entrants from 2007/08 onwards. This information only covers a subset of students who apply to HE through the admissions service responsible for managing applications to HE courses in the UK (UCAS). Only information on qualifications for which the students passed prior to entering HE are held in the HESA record. IBIS also includes qualifications which were taken but not passed.
5
Successful linking between the HESA record and IBIS enabled HESA to identify students in the HESA record who were known to hold an IB qualification. The IBO cohort is therefore comprised of all students in the HESA record who either have detailed information about their IB qualifications in the HESA record or have a successful link to the IBO datasets and the qualification information from that record can be utilised. Some of the information that the HESA record contains is returned from an entrant’s UCAS application form via the student’s HEP. If an entrant does not apply through UCAS, the HEP is encouraged to complete this information but that is not always the case and so may return unknown. This creates missing values for qualifications on entry, a student’s previous school and Socio-Economic classification (SEC), to name but a few. The IB cohort comprises those with an IB diploma or at least one IB course qualification. The data specifies whether this qualification is received or not received and the points awarded on the completion of the qualification. The A level cohort is defined as a student whose highest qualification on entry is at least 3 A levels, double A levels (counted as two qualifications) or Advanced Highers with grades A* through E. The report contains two parts. The first section provides an overview and descriptive statistics of the IB cohorts shown alongside the equivalent A level cohorts. The second section examines higher education enrolment and outcomes of IB Diploma and A level holders matched using propensity score matching. Throughout the report, any percentages, medians and quartiles calculated on small populations have been suppressed (see rounding strategy for details). Suppressed values are represented as '..' in the tables.
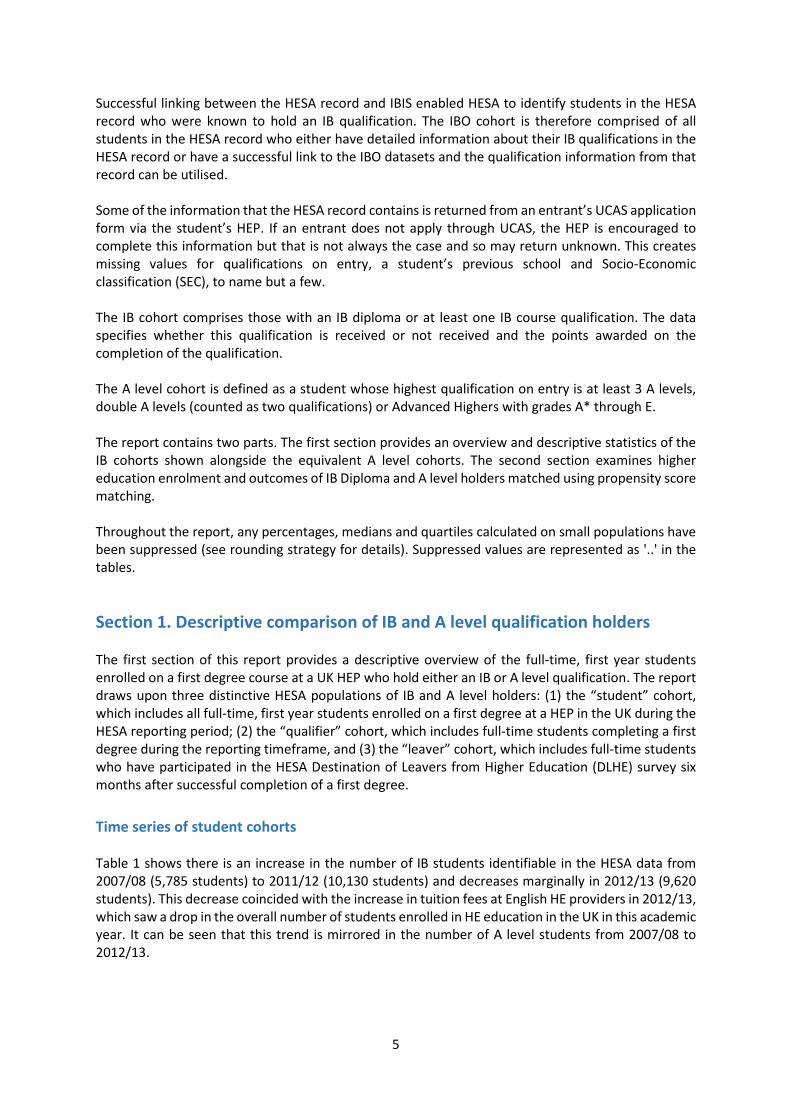
Section 1. Descriptive comparison of IB and A level qualification holders The first section of this report provides a descriptive overview of the full-time, first year students enrolled on a first degree course at a UK HEP who hold either an IB or A level qualification. The report draws upon three distinctive HESA populations of IB and A level holders: (1) the “student” cohort, which includes all full-time, first year students enrolled on a first degree at a HEP in the UK during the HESA reporting period; (2) the “qualifier” cohort, which includes full-time students completing a first degree during the reporting timeframe, and (3) the “leaver” cohort, which includes full-time students who have participated in the HESA Destination of Leavers from Higher Education (DLHE) survey six months after successful completion of a first degree. Time series of student cohorts Table 1 shows there is an increase in the number of IB students identifiable in the HESA data from 2007/08 (5,785 students) to 2011/12 (10,130 students) and decreases marginally in 2012/13 (9,620 students). This decrease coincided with the increase in tuition fees at English HE providers in 2012/13, which saw a drop in the overall number of students enrolled in HE education in the UK in this academic year. It can be seen that this trend is mirrored in the number of A level students from 2007/08 to 2012/13.
6
Table 1- Time series of first year full-time first degree IB students and equivalent A level students 2007/08 to 2012/13
Qualification type
2007/08 2008/09 2009/10 2010/11 2011/12 2012/13 Total
IB Diploma 5,450 6,230 7,560 8,210 9,625 9,075 46,155 IB Course 335 345 445 410 505 550 2,580 IB TOTAL 5,785 6,575 8,005 8,620 10,130 9,620 48,740 A level 176,490 190,745 199,510 210,185 228,280 195,720 1,200,930
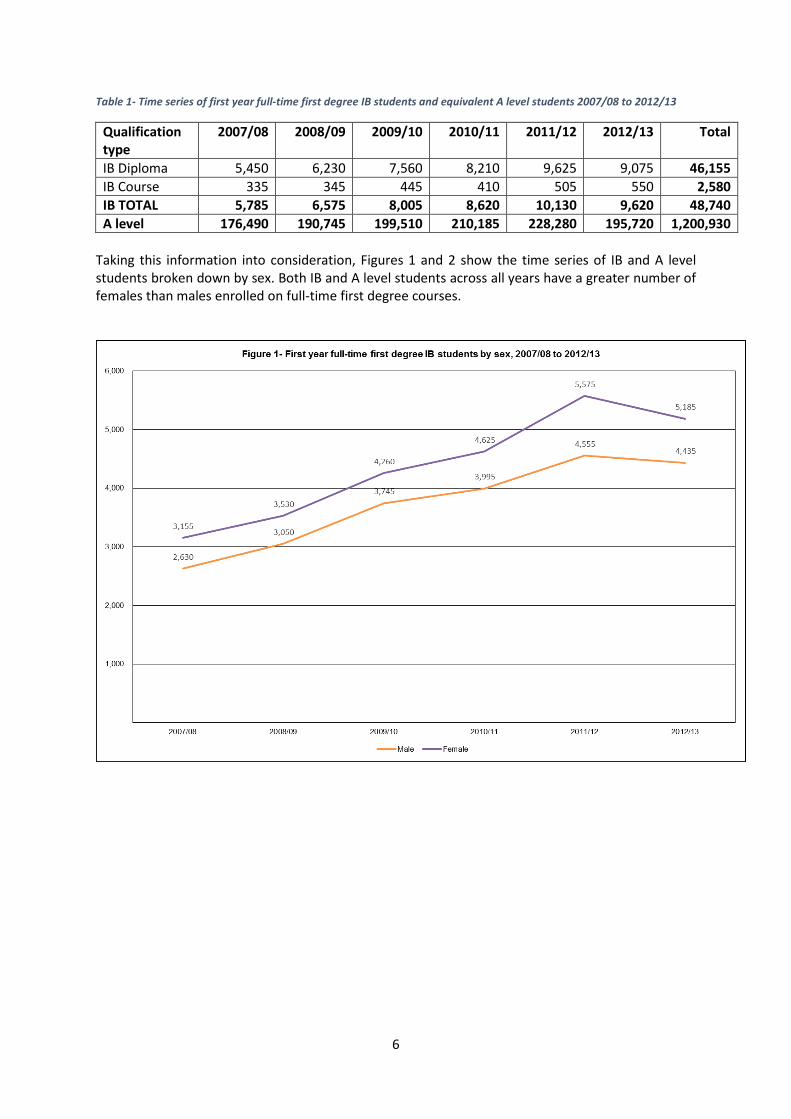
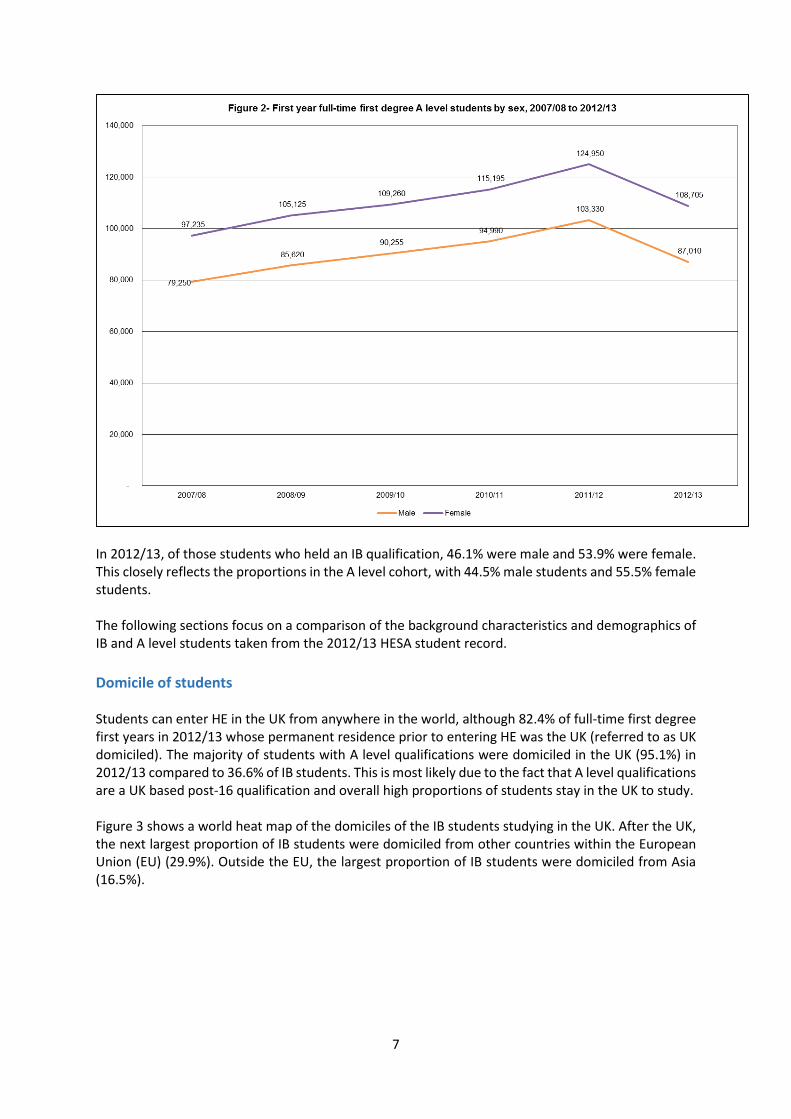
Taking this information into consideration, Figures 1 and 2 show the time series of IB and A level students broken down by sex. Both IB and A level students across all years have a greater number of females than males enrolled on full-time first degree courses.
7
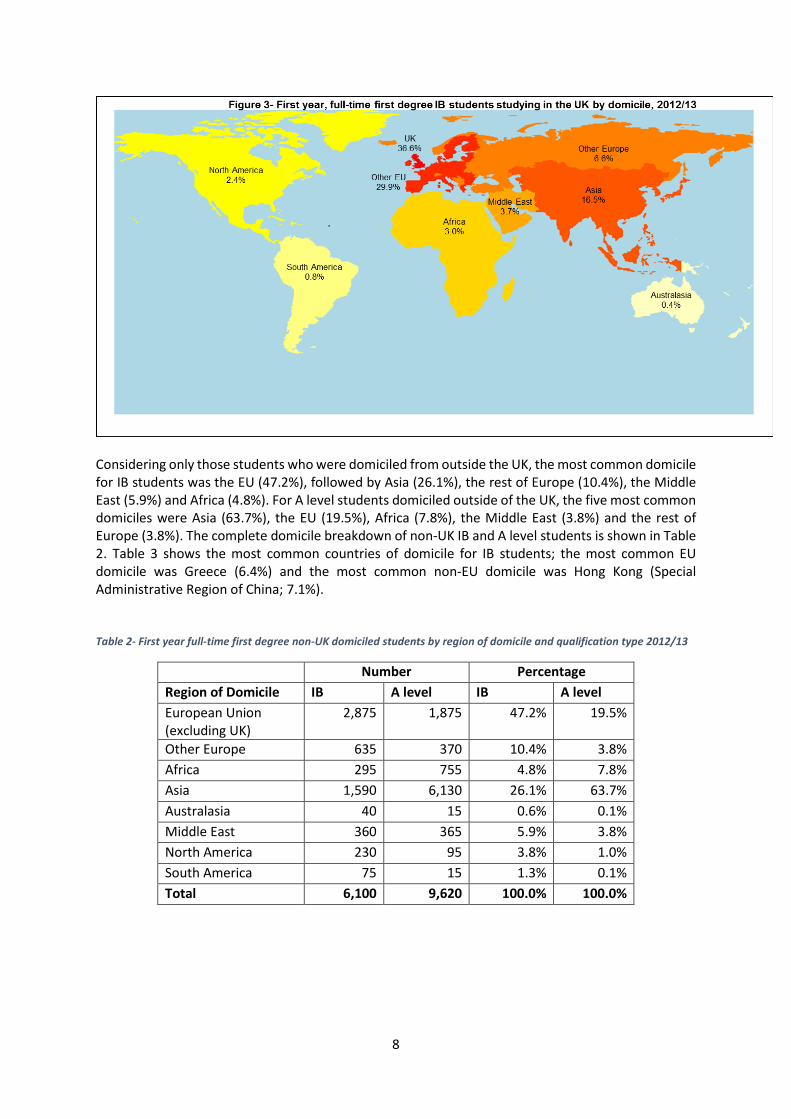
In 2012/13, of those students who held an IB qualification, 46.1% were male and 53.9% were female. This closely reflects the proportions in the A level cohort, with 44.5% male students and 55.5% female students. The following sections focus on a comparison of the background characteristics and demographics of IB and A level students taken from the 2012/13 HESA student record. Domicile of students Students can enter HE in the UK from anywhere in the world, although 82.4% of full-time first degree first years in 2012/13 whose permanent residence prior to entering HE was the UK (referred to as UK domiciled). The majority of students with A level qualifications were domiciled in the UK (95.1%) in 2012/13 compared to 36.6% of IB students. This is most likely due to the fact that A level qualifications are a UK based post-16 qualification and overall high proportions of students stay in the UK to study. Figure 3 shows a world heat map of the domiciles of the IB students studying in the UK. After the UK, the next largest proportion of IB students were domiciled from other countries within the European Union (EU) (29.9%). Outside the EU, the largest proportion of IB students were domiciled from Asia (16.5%).
8
Considering only those students who were domiciled from outside the UK, the most common domicile for IB students was the EU (47.2%), followed by Asia (26.1%), the rest of Europe (10.4%), the Middle East (5.9%) and Africa (4.8%). For A level students domiciled outside of the UK, the five most common domiciles were Asia (63.7%), the EU (19.5%), Africa (7.8%), the Middle East (3.8%) and the rest of Europe (3.8%). The complete domicile breakdown of non-UK IB and A level students is shown in Table 2. Table 3 shows the most common countries of domicile for IB students; the most common EU domicile was Greece (6.4%) and the most common non-EU domicile was Hong Kong (Special Administrative Region of China; 7.1%). Table 2- First year full-time first degree non-UK domiciled students by region of domicile and qualification type 2012/13
Number Percentage Region of Domicile IB A level IB A level European Union (excluding UK)
2,875 1,875 47.2% 19.5%
Other Europe 635 370 10.4% 3.8% Africa 295 755 4.8% 7.8% Asia 1,590 6,130 26.1% 63.7% Australasia 40 15 0.6% 0.1% Middle East 360 365 5.9% 3.8% North America 230 95 3.8% 1.0% South America 75 15 1.3% 0.1% Total 6,100 9,620 100.0% 100.0%
9
Table 3- First year full-time first degree non-UK domiciled IB students by country of domicile 2012/13
Country of domicile % of all non-UK domiciled IB Hong Kong (Special Administrative Region of China) 7.1% Greece 6.4% Germany 6.1% Switzerland 5.2% Italy {Includes Sardinia, Sicily} 4.9% India 4.1% Singapore 4.0% Poland 3.7% France {includes Corsica} 3.4% Sweden 3.3%
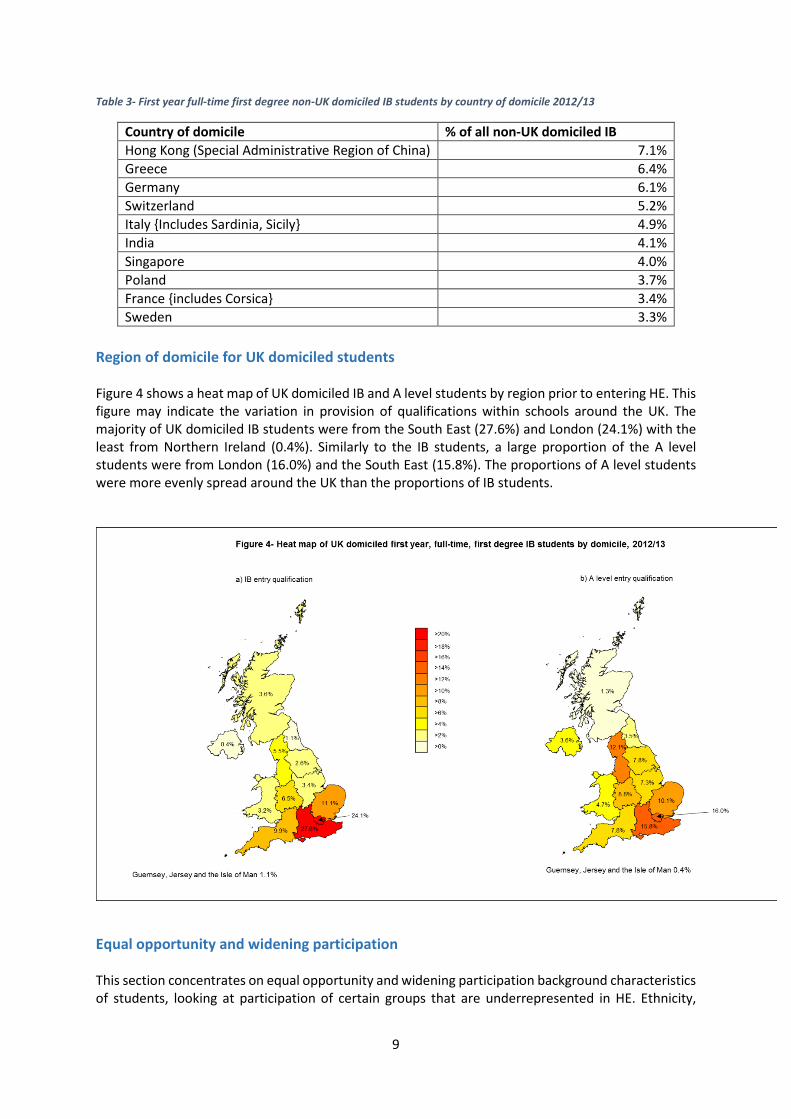
Region of domicile for UK domiciled students Figure 4 shows a heat map of UK domiciled IB and A level students by region prior to entering HE. This figure may indicate the variation in provision of qualifications within schools around the UK. The majority of UK domiciled IB students were from the South East (27.6%) and London (24.1%) with the least from Northern Ireland (0.4%). Similarly to the IB students, a large proportion of the A level students were from London (16.0%) and the South East (15.8%). The proportions of A level students were more evenly spread around the UK than the proportions of IB students.
Equal opportunity and widening participation This section concentrates on equal opportunity and widening participation background characteristics of students, looking at participation of certain groups that are underrepresented in HE. Ethnicity,
10
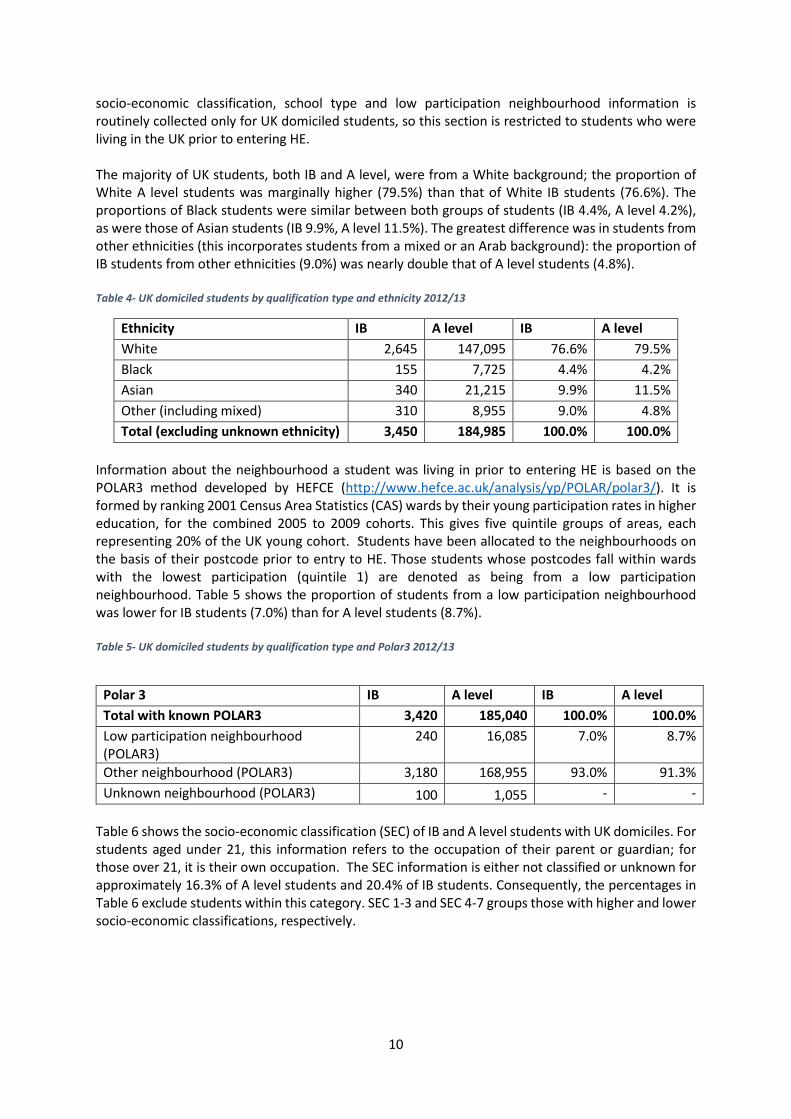
socio-economic classification, school type and low participation neighbourhood information is routinely collected only for UK domiciled students, so this section is restricted to students who were living in the UK prior to entering HE. The majority of UK students, both IB and A level, were from a White background; the proportion of White A level students was marginally higher (79.5%) than that of White IB students (76.6%). The proportions of Black students were similar between both groups of students (IB 4.4%, A level 4.2%), as were those of Asian students (IB 9.9%, A level 11.5%). The greatest difference was in students from other ethnicities (this incorporates students from a mixed or an Arab background): the proportion of IB students from other ethnicities (9.0%) was nearly double that of A level students (4.8%). Table 4- UK domiciled students by qualification type and ethnicity 2012/13
Ethnicity IB A level IB A level White 2,645 147,095 76.6% 79.5% Black 155 7,725 4.4% 4.2% Asian 340 21,215 9.9% 11.5% Other (including mixed) 310 8,955 9.0% 4.8% Total (excluding unknown ethnicity) 3,450 184,985 100.0% 100.0%
Information about the neighbourhood a student was living in prior to entering HE is based on the POLAR3 method developed by HEFCE (http://www.hefce.ac.uk/analysis/yp/POLAR/polar3/). It is formed by ranking 2001 Census Area Statistics (CAS) wards by their young participation rates in higher education, for the combined 2005 to 2009 cohorts. This gives five quintile groups of areas, each representing 20% of the UK young cohort. Students have been allocated to the neighbourhoods on the basis of their postcode prior to entry to HE. Those students whose postcodes fall within wards with the lowest participation (quintile 1) are denoted as being from a low participation neighbourhood. Table 5 shows the proportion of students from a low participation neighbourhood was lower for IB students (7.0%) than for A level students (8.7%). Table 5- UK domiciled students by qualification type and Polar3 2012/13
Polar 3 IB A level IB A level Total with known POLAR3 3,420 185,040 100.0% 100.0% Low participation neighbourhood (POLAR3)
240 16,085 7.0% 8.7%
Other neighbourhood (POLAR3) 3,180 168,955 93.0% 91.3% Unknown neighbourhood (POLAR3) 100 1,055 - -
Table 6 shows the socio-economic classification (SEC) of IB and A level students with UK domiciles. For students aged under 21, this information refers to the occupation of their parent or guardian; for those over 21, it is their own occupation. The SEC information is either not classified or unknown for approximately 16.3% of A level students and 20.4% of IB students. Consequently, the percentages in Table 6 exclude students within this category. SEC 1-3 and SEC 4-7 groups those with higher and lower socio-economic classifications, respectively.
11
Table 6- UK domiciled students by qualification type and SEC 2012/13
Socio-Economic Classification (SEC)
IB A level IB A level
Total with known SEC 2,800 155,740 100.0% 100.0% SEC 1-3 2,255
111,255 80.5% 71.4%
1. Higher managerial & professional occupations 1,045 43,685 37.3% 28.0% 2. Lower managerial & professional occupations 895 48,040 32.0% 30.8% 3. Intermediate occupations 315 19,535 11.2% 12.5% SEC 4-7 535 44,020 19.1% 28.3% 4. Small employers & own account workers 140 11,480 5.1% 7.4% 5. Lower supervisory & technical occupations 85 7,050 3.1% 4.5% 6. Semi-routine occupations 220 17,490 7.9% 11.2% 7. Routine occupations 85 7,995 3.1% 5.1% Never worked & long-term unemployed 10 465 0.3% 0.3% Not classified/ Unknown 720 30,360 - -
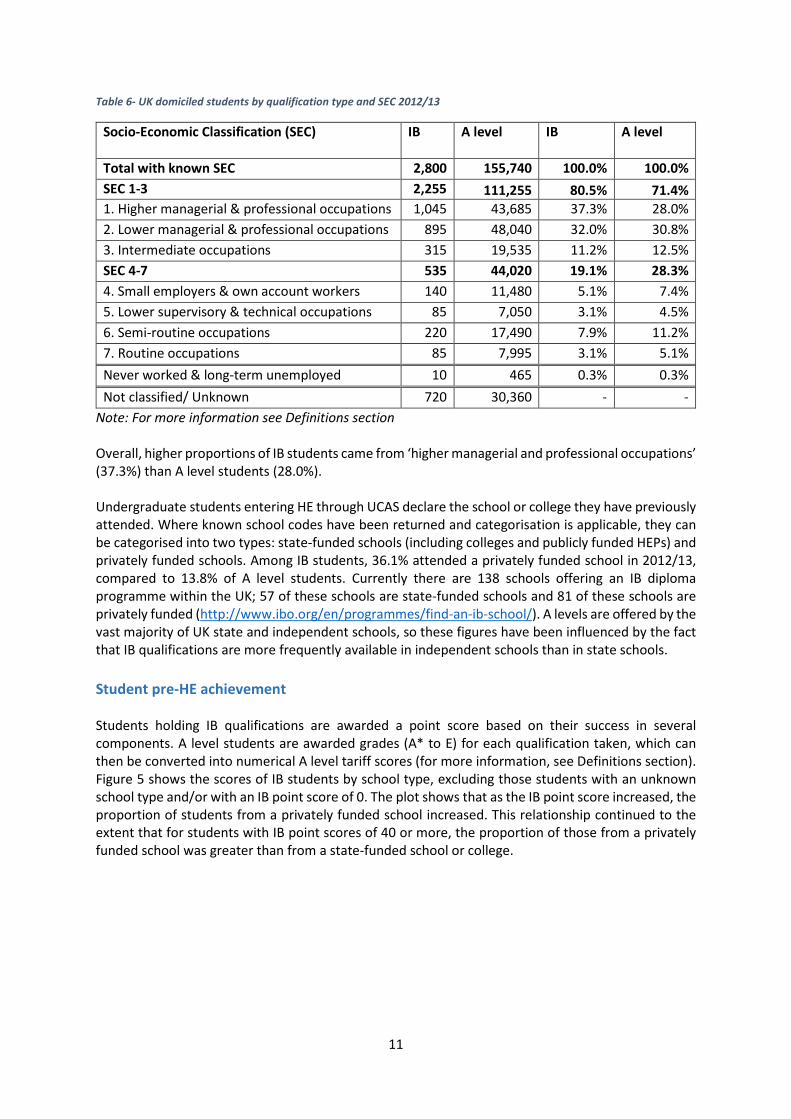
Note: For more information see Definitions section Overall, higher proportions of IB students came from ‘higher managerial and professional occupations’ (37.3%) than A level students (28.0%). Undergraduate students entering HE through UCAS declare the school or college they have previously attended. Where known school codes have been returned and categorisation is applicable, they can be categorised into two types: state-funded schools (including colleges and publicly funded HEPs) and privately funded schools. Among IB students, 36.1% attended a privately funded school in 2012/13, compared to 13.8% of A level students. Currently there are 138 schools offering an IB diploma programme within the UK; 57 of these schools are state-funded schools and 81 of these schools are privately funded (http://www.ibo.org/en/programmes/find-an-ib-school/). A levels are offered by the vast majority of UK state and independent schools, so these figures have been influenced by the fact that IB qualifications are more frequently available in independent schools than in state schools. Student pre-HE achievement Students holding IB qualifications are awarded a point score based on their success in several components. A level students are awarded grades (A* to E) for each qualification taken, which can then be converted into numerical A level tariff scores (for more information, see Definitions section). Figure 5 shows the scores of IB students by school type, excluding those students with an unknown school type and/or with an IB point score of 0. The plot shows that as the IB point score increased, the proportion of students from a privately funded school increased. This relationship continued to the extent that for students with IB point scores of 40 or more, the proportion of those from a privately funded school was greater than from a state-funded school or college.
12
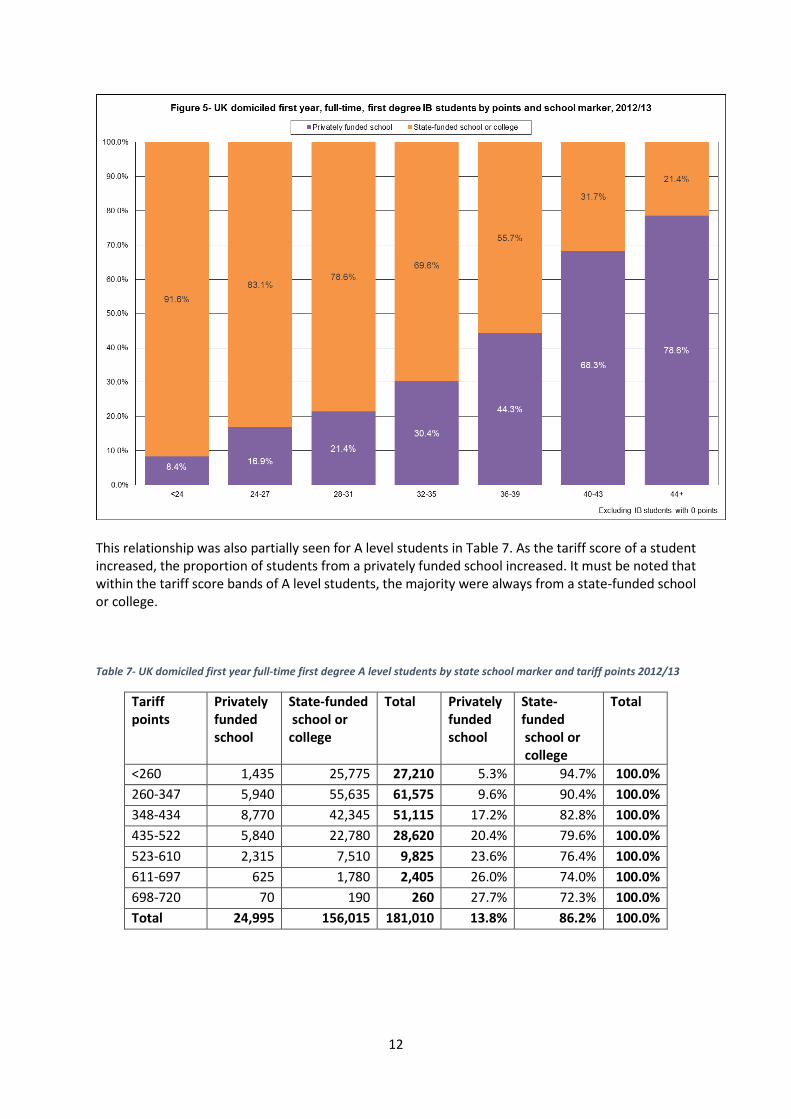
This relationship was also partially seen for A level students in Table 7. As the tariff score of a student increased, the proportion of students from a privately funded school increased. It must be noted that within the tariff score bands of A level students, the majority were always from a state-funded school or college. Table 7- UK domiciled first year full-time first degree A level students by state school marker and tariff points 2012/13
Tariff points
Privately funded school
State-funded school or college
Total Privately funded school
State-funded school or college
Total
<260 1,435 25,775 27,210 5.3% 94.7% 100.0% 260-347 5,940 55,635 61,575 9.6% 90.4% 100.0% 348-434 8,770 42,345 51,115 17.2% 82.8% 100.0% 435-522 5,840 22,780 28,620 20.4% 79.6% 100.0% 523-610 2,315 7,510 9,825 23.6% 76.4% 100.0% 611-697 625 1,780 2,405 26.0% 74.0% 100.0% 698-720 70 190 260 27.7% 72.3% 100.0% Total 24,995 156,015 181,010 13.8% 86.2% 100.0%
13
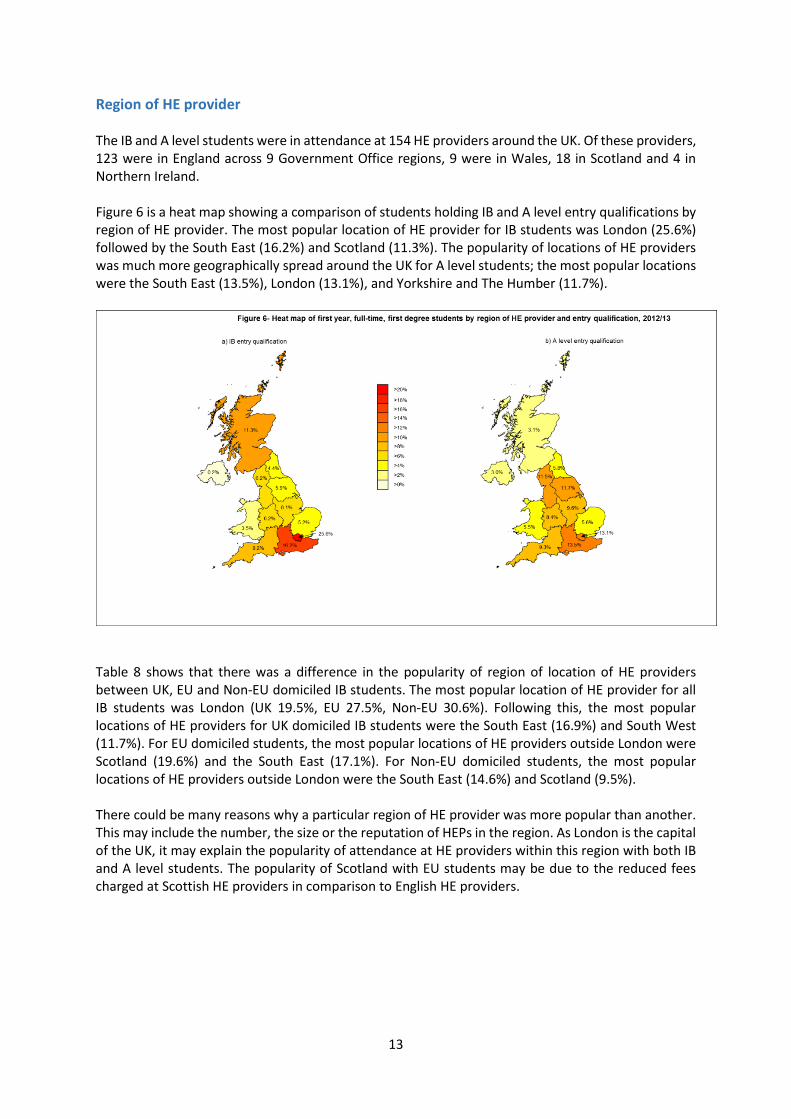
Region of HE provider The IB and A level students were in attendance at 154 HE providers around the UK. Of these providers, 123 were in England across 9 Government Office regions, 9 were in Wales, 18 in Scotland and 4 in Northern Ireland. Figure 6 is a heat map showing a comparison of students holding IB and A level entry qualifications by region of HE provider. The most popular location of HE provider for IB students was London (25.6%) followed by the South East (16.2%) and Scotland (11.3%). The popularity of locations of HE providers was much more geographically spread around the UK for A level students; the most popular locations were the South East (13.5%), London (13.1%), and Yorkshire and The Humber (11.7%).
Table 8 shows that there was a difference in the popularity of region of location of HE providers between UK, EU and Non-EU domiciled IB students. The most popular location of HE provider for all IB students was London (UK 19.5%, EU 27.5%, Non-EU 30.6%). Following this, the most popular locations of HE providers for UK domiciled IB students were the South East (16.9%) and South West (11.7%). For EU domiciled students, the most popular locations of HE providers outside London were Scotland (19.6%) and the South East (17.1%). For Non-EU domiciled students, the most popular locations of HE providers outside London were the South East (14.6%) and Scotland (9.5%). There could be many reasons why a particular region of HE provider was more popular than another. This may include the number, the size or the reputation of HEPs in the region. As London is the capital of the UK, it may explain the popularity of attendance at HE providers within this region with both IB and A level students. The popularity of Scotland with EU students may be due to the reduced fees charged at Scottish HE providers in comparison to English HE providers.
14
Table 8- First year full-time first degree IB students by region of HE provider and domicile 2012/13
Region of HE provider
UK domiciled
EU domiciled
Non-EU domiciled
Total UK domiciled
EU domiciled
Non-EU domiciled
Total
North East 200 75 145 420 5.7% 2.6% 4.6% 4.4% North West 240 140 215 595 6.9% 4.8% 6.7% 6.2% Yorkshire and The Humber
260 125 185 565 7.3% 4.3% 5.7% 5.9%
East Midlands 250 130 210 590 7.1% 4.4% 6.6% 6.1% West Midlands 250 140 210 595 7.0% 4.8% 6.5% 6.2% East of England 245 125 135 505 7.0% 4.4% 4.1% 5.2% London 685 790 985 2,460 19.5% 27.5% 30.6% 25.6% South East 595 490 470 1,555 16.9% 17.1% 14.6% 16.2% South West 415 215 250 880 11.7% 7.5% 7.8% 9.2% Wales 160 85 95 340 4.5% 2.9% 2.9% 3.5% Scotland 220 565 305 1,090 6.2% 19.6% 9.5% 11.3% Northern Ireland
5 0 15 20 0.1% 0.1% 0.5% 0.2%
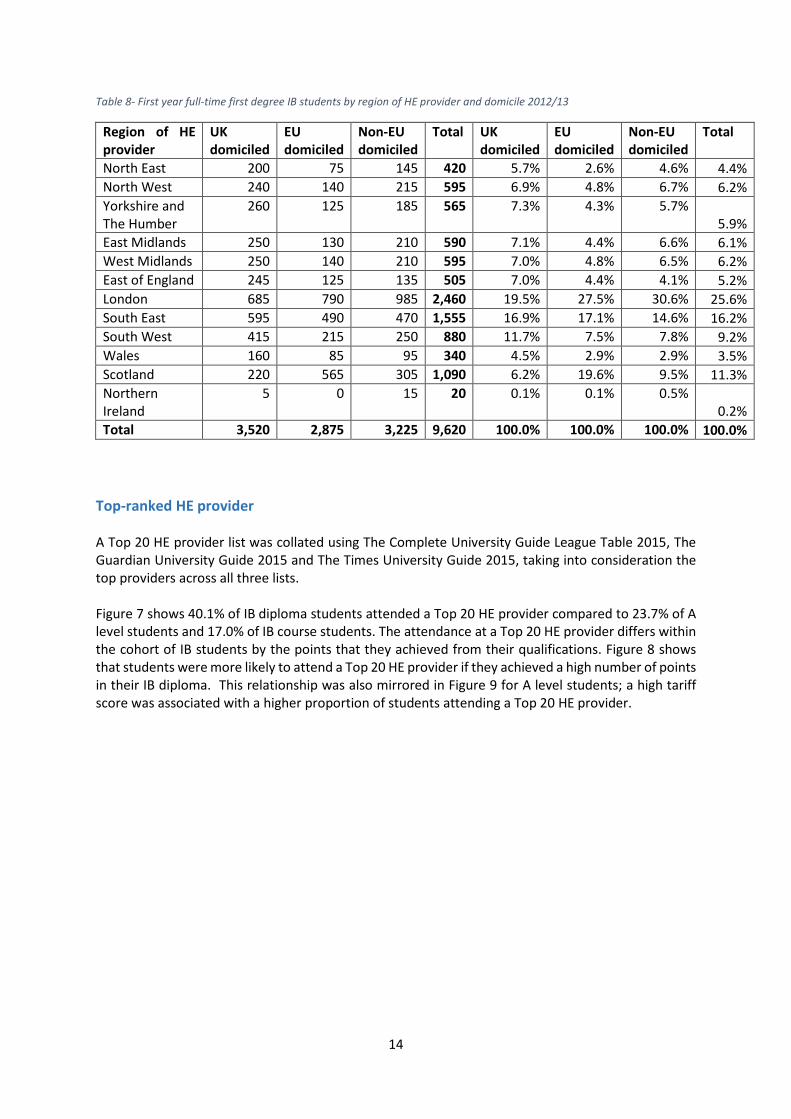
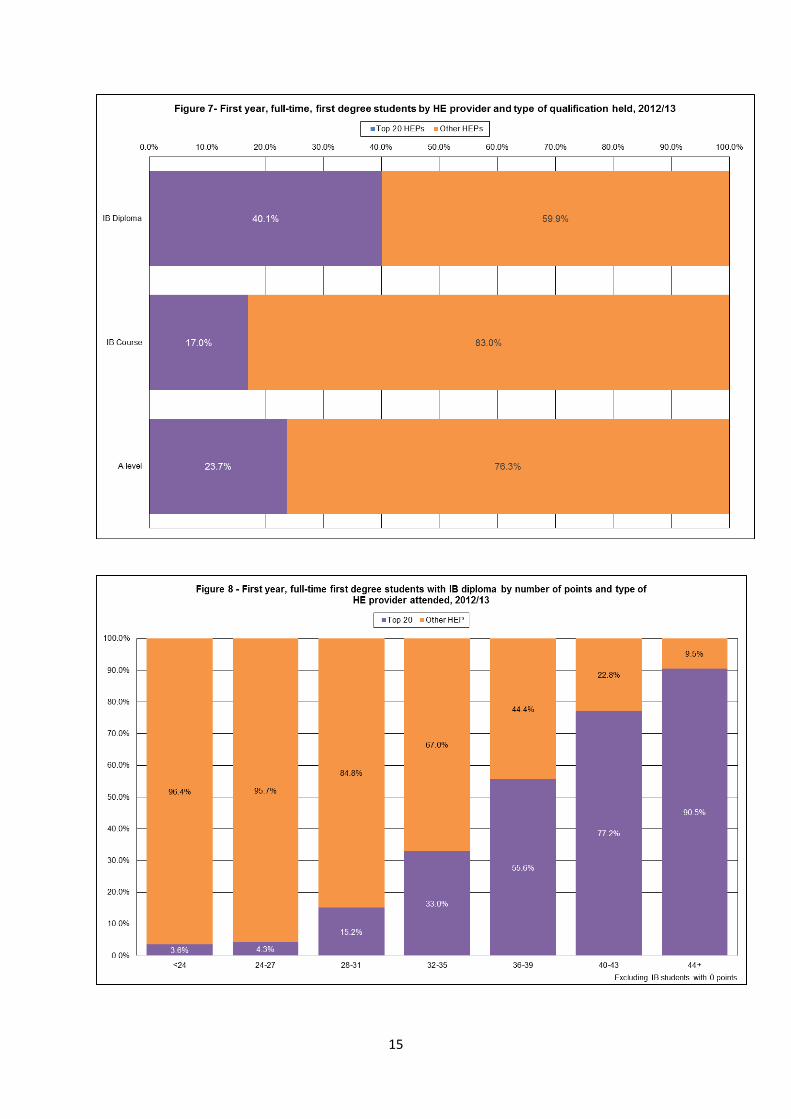
Total 3,520 2,875 3,225 9,620 100.0% 100.0% 100.0% 100.0% Top-ranked HE provider A Top 20 HE provider list was collated using The Complete University Guide League Table 2015, The Guardian University Guide 2015 and The Times University Guide 2015, taking into consideration the top providers across all three lists. Figure 7 shows 40.1% of IB diploma students attended a Top 20 HE provider compared to 23.7% of A level students and 17.0% of IB course students. The attendance at a Top 20 HE provider differs within the cohort of IB students by the points that they achieved from their qualifications. Figure 8 shows that students were more likely to attend a Top 20 HE provider if they achieved a high number of points in their IB diploma. This relationship was also mirrored in Figure 9 for A level students; a high tariff score was associated with a higher proportion of students attending a Top 20 HE provider.
15
16
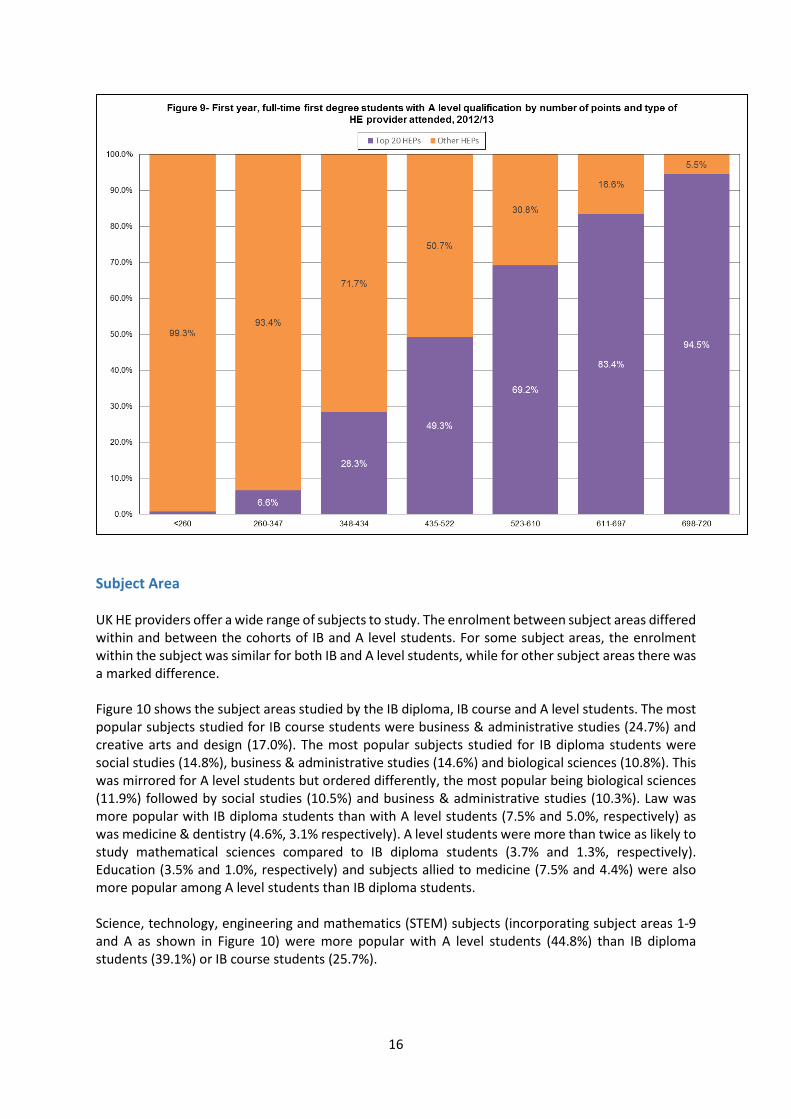
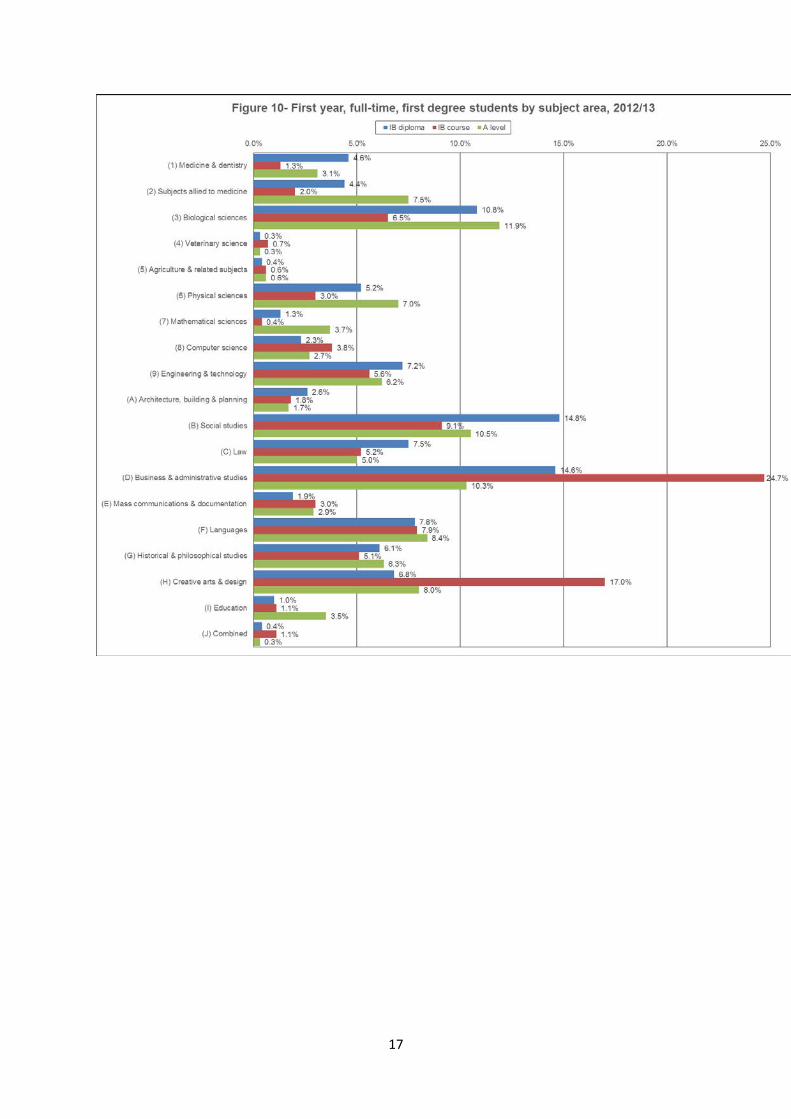
Subject Area UK HE providers offer a wide range of subjects to study. The enrolment between subject areas differed within and between the cohorts of IB and A level students. For some subject areas, the enrolment within the subject was similar for both IB and A level students, while for other subject areas there was a marked difference. Figure 10 shows the subject areas studied by the IB diploma, IB course and A level students. The most popular subjects studied for IB course students were business & administrative studies (24.7%) and creative arts and design (17.0%). The most popular subjects studied for IB diploma students were social studies (14.8%), business & administrative studies (14.6%) and biological sciences (10.8%). This was mirrored for A level students but ordered differently, the most popular being biological sciences (11.9%) followed by social studies (10.5%) and business & administrative studies (10.3%). Law was more popular with IB diploma students than with A level students (7.5% and 5.0%, respectively) as was medicine & dentistry (4.6%, 3.1% respectively). A level students were more than twice as likely to study mathematical sciences compared to IB diploma students (3.7% and 1.3%, respectively). Education (3.5% and 1.0%, respectively) and subjects allied to medicine (7.5% and 4.4%) were also more popular among A level students than IB diploma students. Science, technology, engineering and mathematics (STEM) subjects (incorporating subject areas 1-9 and A as shown in Figure 10) were more popular with A level students (44.8%) than IB diploma students (39.1%) or IB course students (25.7%).
17
18
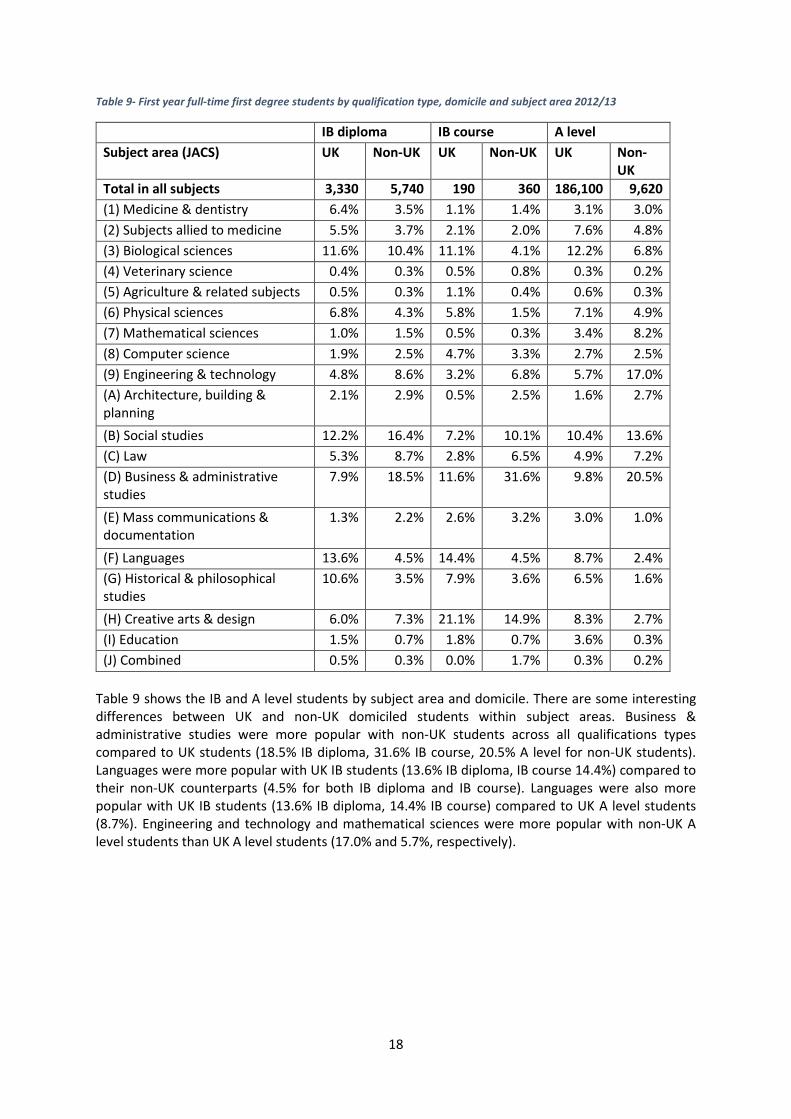
Table 9- First year full-time first degree students by qualification type, domicile and subject area 2012/13
IB diploma IB course A level Subject area (JACS) UK Non-UK UK Non-UK UK Non-
UK Total in all subjects 3,330 5,740 190 360 186,100 9,620 (1) Medicine & dentistry 6.4% 3.5% 1.1% 1.4% 3.1% 3.0% (2) Subjects allied to medicine 5.5% 3.7% 2.1% 2.0% 7.6% 4.8% (3) Biological sciences 11.6% 10.4% 11.1% 4.1% 12.2% 6.8% (4) Veterinary science 0.4% 0.3% 0.5% 0.8% 0.3% 0.2% (5) Agriculture & related subjects 0.5% 0.3% 1.1% 0.4% 0.6% 0.3% (6) Physical sciences 6.8% 4.3% 5.8% 1.5% 7.1% 4.9% (7) Mathematical sciences 1.0% 1.5% 0.5% 0.3% 3.4% 8.2% (8) Computer science 1.9% 2.5% 4.7% 3.3% 2.7% 2.5% (9) Engineering & technology 4.8% 8.6% 3.2% 6.8% 5.7% 17.0% (A) Architecture, building & planning
2.1% 2.9% 0.5% 2.5% 1.6% 2.7%
(B) Social studies 12.2% 16.4% 7.2% 10.1% 10.4% 13.6% (C) Law 5.3% 8.7% 2.8% 6.5% 4.9% 7.2% (D) Business & administrative studies
7.9% 18.5% 11.6% 31.6% 9.8% 20.5%
(E) Mass communications & documentation
1.3% 2.2% 2.6% 3.2% 3.0% 1.0%
(F) Languages 13.6% 4.5% 14.4% 4.5% 8.7% 2.4% (G) Historical & philosophical studies
10.6% 3.5% 7.9% 3.6% 6.5% 1.6%
(H) Creative arts & design 6.0% 7.3% 21.1% 14.9% 8.3% 2.7% (I) Education 1.5% 0.7% 1.8% 0.7% 3.6% 0.3% (J) Combined 0.5% 0.3% 0.0% 1.7% 0.3% 0.2%
Table 9 shows the IB and A level students by subject area and domicile. There are some interesting differences between UK and non-UK domiciled students within subject areas. Business & administrative studies were more popular with non-UK students across all qualifications types compared to UK students (18.5% IB diploma, 31.6% IB course, 20.5% A level for non-UK students). Languages were more popular with UK IB students (13.6% IB diploma, IB course 14.4%) compared to their non-UK counterparts (4.5% for both IB diploma and IB course). Languages were also more popular with UK IB students (13.6% IB diploma, 14.4% IB course) compared to UK A level students (8.7%). Engineering and technology and mathematical sciences were more popular with non-UK A level students than UK A level students (17.0% and 5.7%, respectively).
19
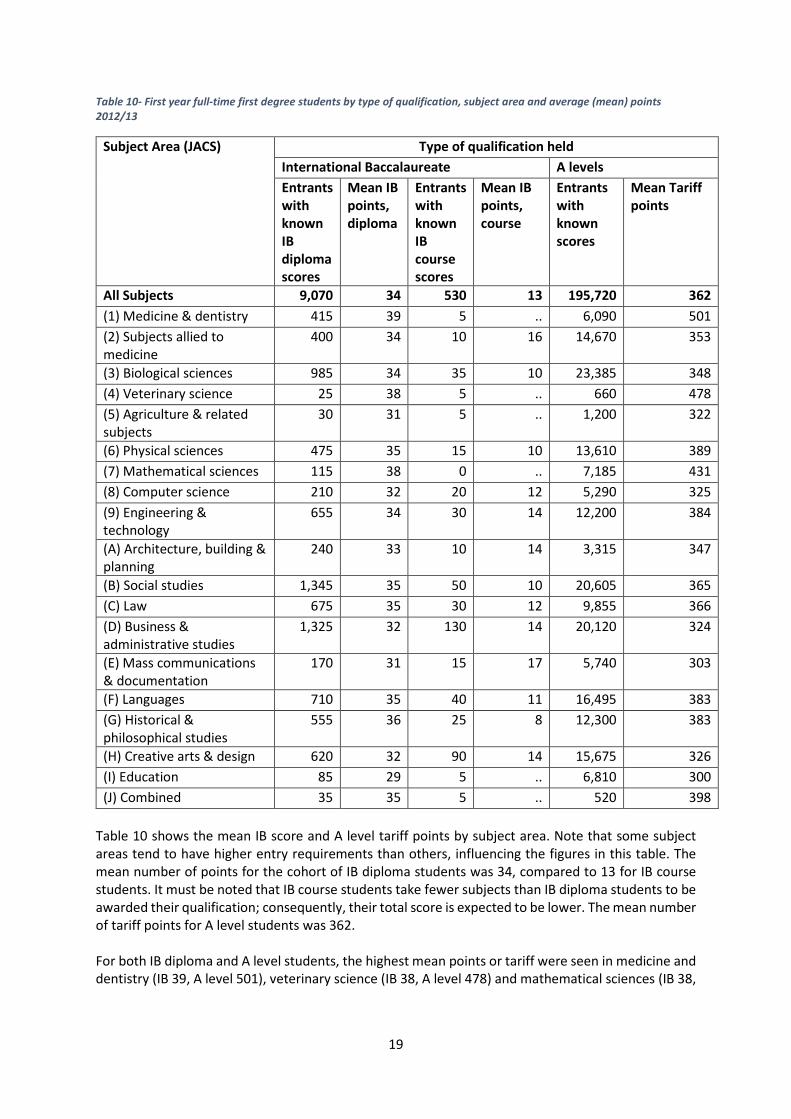
Table 10- First year full-time first degree students by type of qualification, subject area and average (mean) points 2012/13
Subject Area (JACS) Type of qualification held International Baccalaureate A levels Entrants with known IB diploma scores
Mean IB points, diploma
Entrants with known IB course scores
Mean IB points, course
Entrants with known scores
Mean Tariff points
All Subjects 9,070 34 530 13 195,720 362 (1) Medicine & dentistry 415 39 5 .. 6,090 501 (2) Subjects allied to medicine
400 34 10 16 14,670 353
(3) Biological sciences 985 34 35 10 23,385 348 (4) Veterinary science 25 38 5 .. 660 478 (5) Agriculture & related subjects
30 31 5 .. 1,200 322
(6) Physical sciences 475 35 15 10 13,610 389 (7) Mathematical sciences 115 38 0 .. 7,185 431 (8) Computer science 210 32 20 12 5,290 325 (9) Engineering & technology
655 34 30 14 12,200 384
(A) Architecture, building & planning
240 33 10 14 3,315 347
(B) Social studies 1,345 35 50 10 20,605 365 (C) Law 675 35 30 12 9,855 366 (D) Business & administrative studies
1,325 32 130 14 20,120 324
(E) Mass communications & documentation
170 31 15 17 5,740 303
(F) Languages 710 35 40 11 16,495 383 (G) Historical & philosophical studies
555 36 25 8 12,300 383
(H) Creative arts & design 620 32 90 14 15,675 326 (I) Education 85 29 5 .. 6,810 300 (J) Combined 35 35 5 .. 520 398
Table 10 shows the mean IB score and A level tariff points by subject area. Note that some subject areas tend to have higher entry requirements than others, influencing the figures in this table. The mean number of points for the cohort of IB diploma students was 34, compared to 13 for IB course students. It must be noted that IB course students take fewer subjects than IB diploma students to be awarded their qualification; consequently, their total score is expected to be lower. The mean number of tariff points for A level students was 362. For both IB diploma and A level students, the highest mean points or tariff were seen in medicine and dentistry (IB 39, A level 501), veterinary science (IB 38, A level 478) and mathematical sciences (IB 38,
20
A level 431) and the lowest were seen in agriculture and related subjects (IB 31, A level 322), mass communications and documentation (IB 31, A level 303) and education (IB 29, A level 300). Continuation of students It is not the case that students always continue from one academic year to the next. Students may leave their studies, gain a different award or go dormant by the following year. The IB and A level students from 2012/13 were followed into 2013/14 to investigate their academic status in the second year of their HE studies. Table 11 shows the continuation status of the cohorts of students, using the method consistent with that used within UNISTATS: https://unistats.direct.gov.uk/.
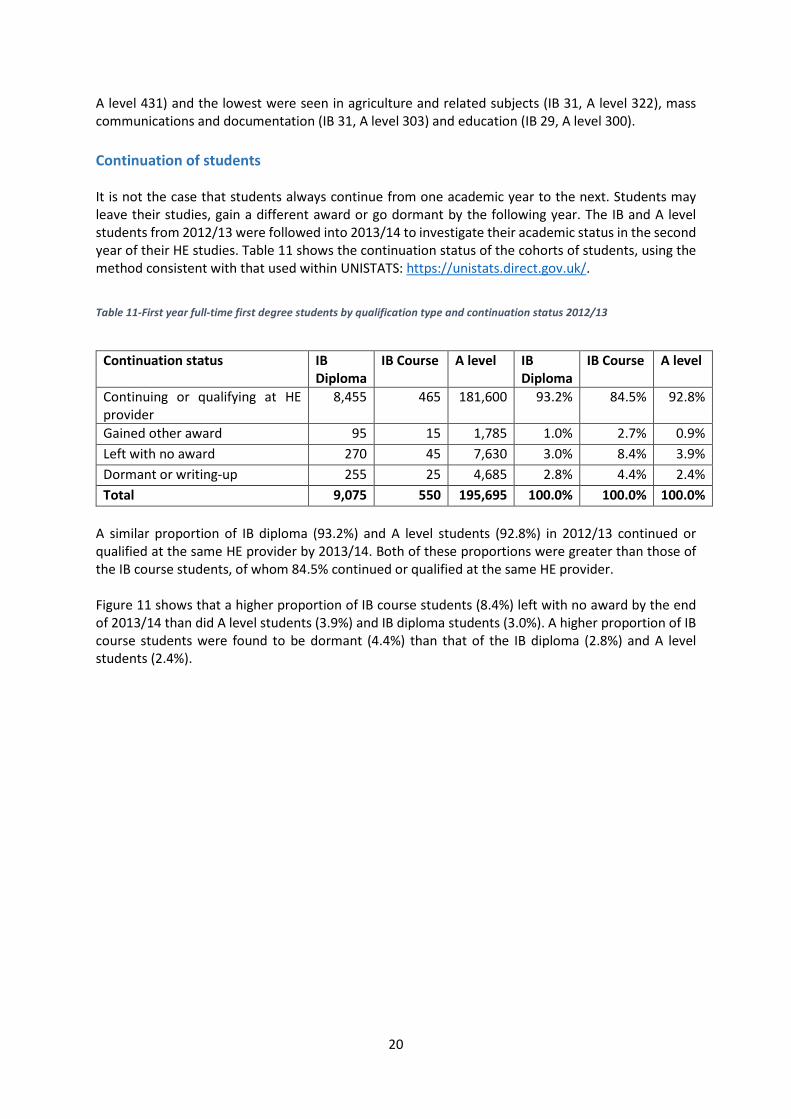
Table 11-First year full-time first degree students by qualification type and continuation status 2012/13
Continuation status IB
Diploma IB Course A level IB
Diploma IB Course A level
Continuing or qualifying at HE provider
8,455 465 181,600 93.2% 84.5% 92.8%
Gained other award 95 15 1,785 1.0% 2.7% 0.9% Left with no award 270 45 7,630 3.0% 8.4% 3.9% Dormant or writing-up 255 25 4,685 2.8% 4.4% 2.4% Total 9,075 550 195,695 100.0% 100.0% 100.0%
A similar proportion of IB diploma (93.2%) and A level students (92.8%) in 2012/13 continued or qualified at the same HE provider by 2013/14. Both of these proportions were greater than those of the IB course students, of whom 84.5% continued or qualified at the same HE provider. Figure 11 shows that a higher proportion of IB course students (8.4%) left with no award by the end of 2013/14 than did A level students (3.9%) and IB diploma students (3.0%). A higher proportion of IB course students were found to be dormant (4.4%) than that of the IB diploma (2.8%) and A level students (2.4%).
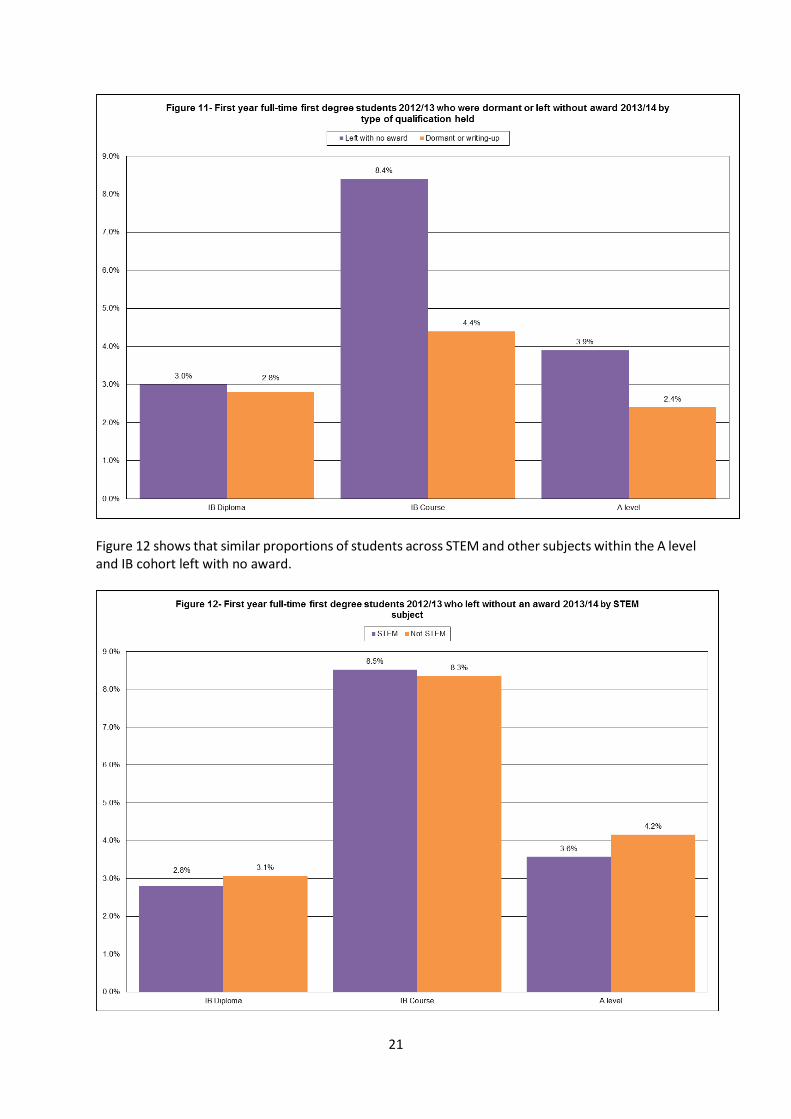
21
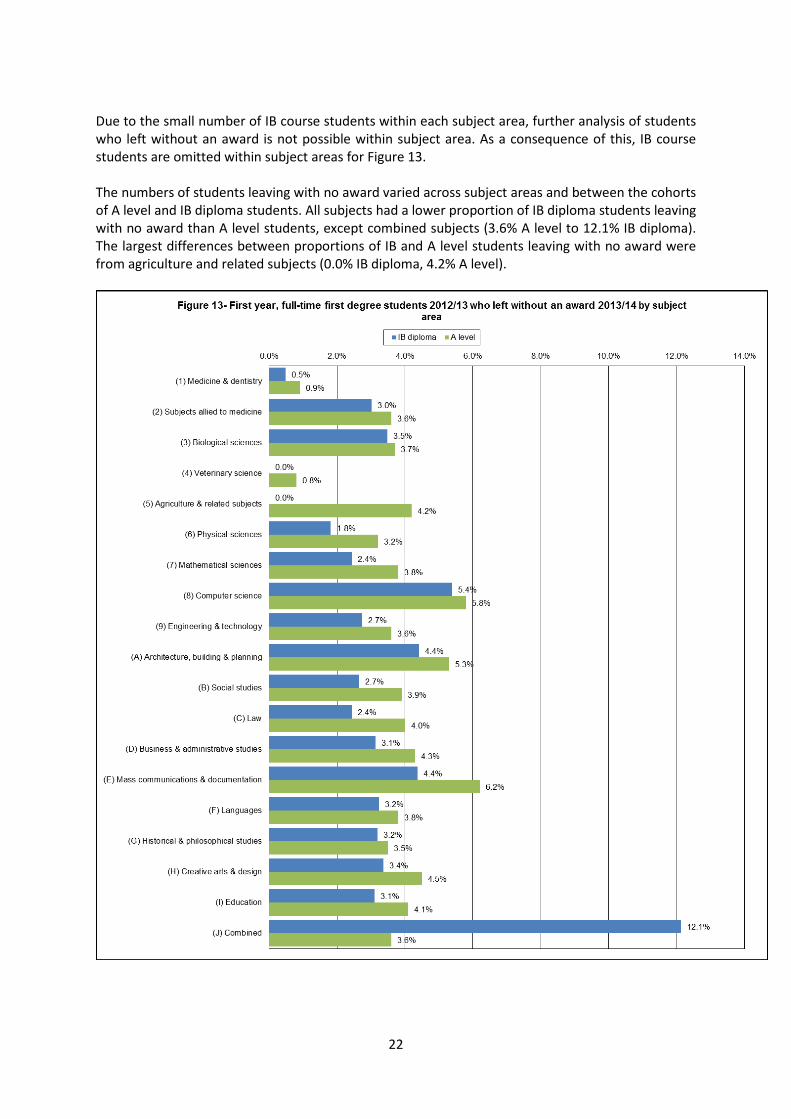
Figure 12 shows that similar proportions of students across STEM and other subjects within the A level and IB cohort left with no award.
22
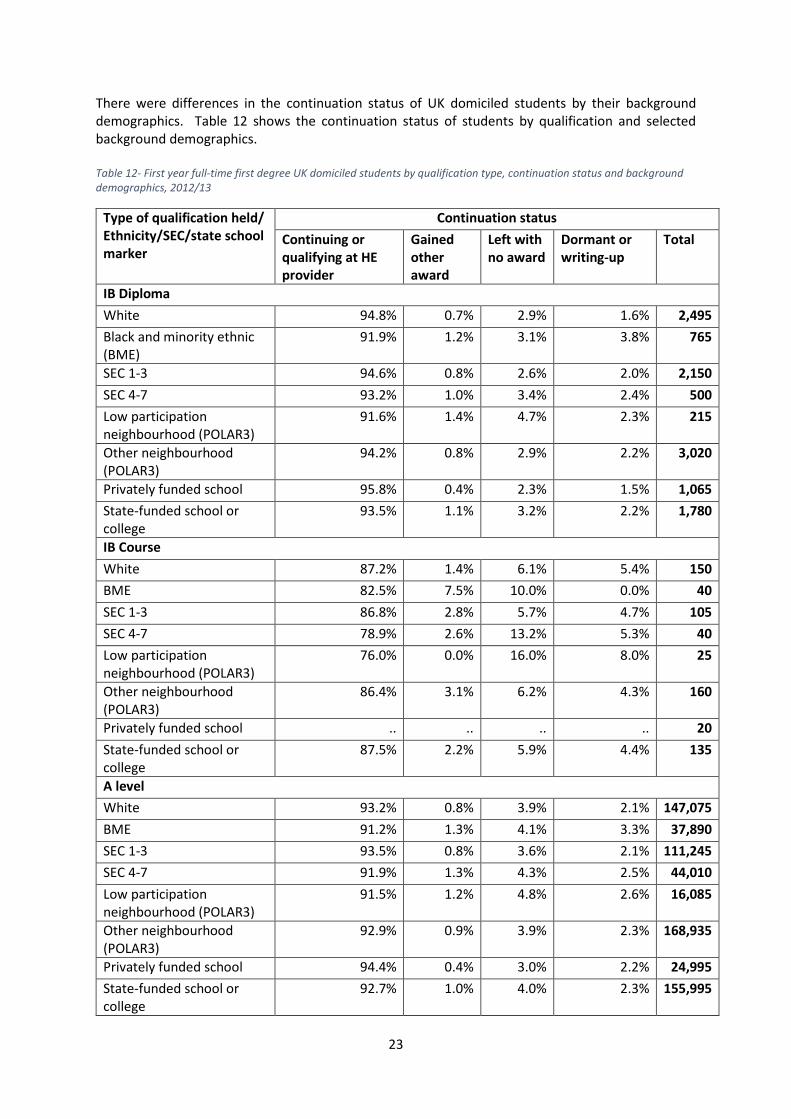
Due to the small number of IB course students within each subject area, further analysis of students who left without an award is not possible within subject area. As a consequence of this, IB course students are omitted within subject areas for Figure 13. The numbers of students leaving with no award varied across subject areas and between the cohorts of A level and IB diploma students. All subjects had a lower proportion of IB diploma students leaving with no award than A level students, except combined subjects (3.6% A level to 12.1% IB diploma). The largest differences between proportions of IB and A level students leaving with no award were from agriculture and related subjects (0.0% IB diploma, 4.2% A level).
23
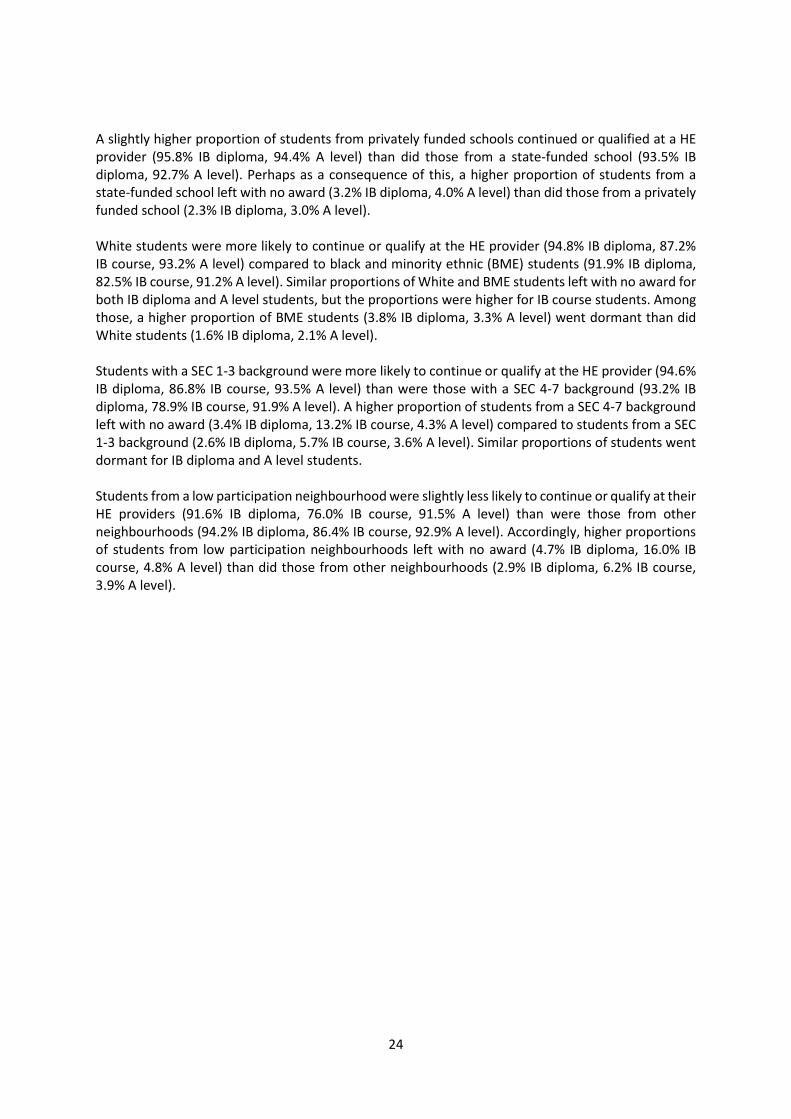
There were differences in the continuation status of UK domiciled students by their background demographics. Table 12 shows the continuation status of students by qualification and selected background demographics. Table 12- First year full-time first degree UK domiciled students by qualification type, continuation status and background demographics, 2012/13
Type of qualification held/ Ethnicity/SEC/state school marker
Continuation status Continuing or qualifying at HE provider
Gained other award
Left with no award
Dormant or writing-up
Total
IB Diploma White 94.8% 0.7% 2.9% 1.6% 2,495 Black and minority ethnic (BME)
91.9% 1.2% 3.1% 3.8% 765
SEC 1-3 94.6% 0.8% 2.6% 2.0% 2,150 SEC 4-7 93.2% 1.0% 3.4% 2.4% 500 Low participation neighbourhood (POLAR3)
91.6% 1.4% 4.7% 2.3% 215
Other neighbourhood (POLAR3)
94.2% 0.8% 2.9% 2.2% 3,020
Privately funded school 95.8% 0.4% 2.3% 1.5% 1,065 State-funded school or college
93.5% 1.1% 3.2% 2.2% 1,780
IB Course White 87.2% 1.4% 6.1% 5.4% 150 BME 82.5% 7.5% 10.0% 0.0% 40 SEC 1-3 86.8% 2.8% 5.7% 4.7% 105 SEC 4-7 78.9% 2.6% 13.2% 5.3% 40 Low participation neighbourhood (POLAR3)
76.0% 0.0% 16.0% 8.0% 25
Other neighbourhood (POLAR3)
86.4% 3.1% 6.2% 4.3% 160
Privately funded school .. .. .. .. 20 State-funded school or college
87.5% 2.2% 5.9% 4.4% 135
A level White 93.2% 0.8% 3.9% 2.1% 147,075 BME 91.2% 1.3% 4.1% 3.3% 37,890 SEC 1-3 93.5% 0.8% 3.6% 2.1% 111,245 SEC 4-7 91.9% 1.3% 4.3% 2.5% 44,010 Low participation neighbourhood (POLAR3)
91.5% 1.2% 4.8% 2.6% 16,085
Other neighbourhood (POLAR3)
92.9% 0.9% 3.9% 2.3% 168,935
Privately funded school 94.4% 0.4% 3.0% 2.2% 24,995 State-funded school or college
92.7% 1.0% 4.0% 2.3% 155,995
24
A slightly higher proportion of students from privately funded schools continued or qualified at a HE provider (95.8% IB diploma, 94.4% A level) than did those from a state-funded school (93.5% IB diploma, 92.7% A level). Perhaps as a consequence of this, a higher proportion of students from a state-funded school left with no award (3.2% IB diploma, 4.0% A level) than did those from a privately funded school (2.3% IB diploma, 3.0% A level). White students were more likely to continue or qualify at the HE provider (94.8% IB diploma, 87.2% IB course, 93.2% A level) compared to black and minority ethnic (BME) students (91.9% IB diploma, 82.5% IB course, 91.2% A level). Similar proportions of White and BME students left with no award for both IB diploma and A level students, but the proportions were higher for IB course students. Among those, a higher proportion of BME students (3.8% IB diploma, 3.3% A level) went dormant than did White students (1.6% IB diploma, 2.1% A level). Students with a SEC 1-3 background were more likely to continue or qualify at the HE provider (94.6% IB diploma, 86.8% IB course, 93.5% A level) than were those with a SEC 4-7 background (93.2% IB diploma, 78.9% IB course, 91.9% A level). A higher proportion of students from a SEC 4-7 background left with no award (3.4% IB diploma, 13.2% IB course, 4.3% A level) compared to students from a SEC 1-3 background (2.6% IB diploma, 5.7% IB course, 3.6% A level). Similar proportions of students went dormant for IB diploma and A level students. Students from a low participation neighbourhood were slightly less likely to continue or qualify at their HE providers (91.6% IB diploma, 76.0% IB course, 91.5% A level) than were those from other neighbourhoods (94.2% IB diploma, 86.4% IB course, 92.9% A level). Accordingly, higher proportions of students from low participation neighbourhoods left with no award (4.7% IB diploma, 16.0% IB course, 4.8% A level) than did those from other neighbourhoods (2.9% IB diploma, 6.2% IB course, 3.9% A level).
25
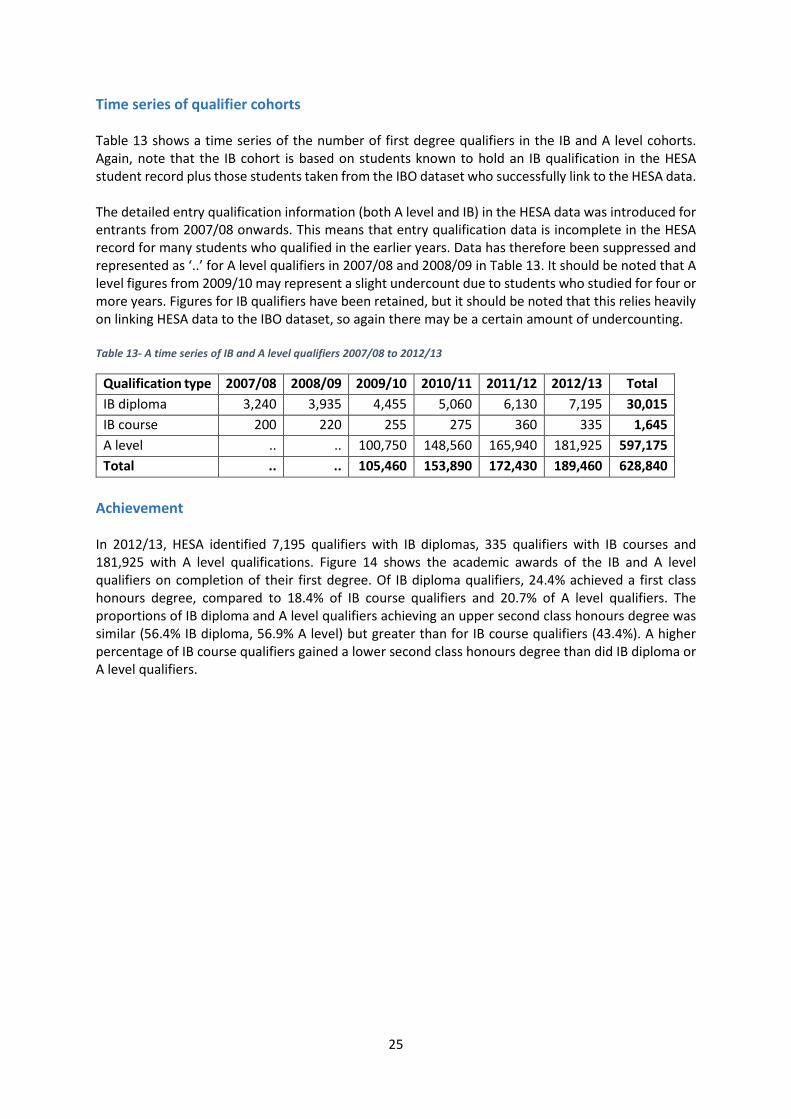
Time series of qualifier cohorts Table 13 shows a time series of the number of first degree qualifiers in the IB and A level cohorts. Again, note that the IB cohort is based on students known to hold an IB qualification in the HESA student record plus those students taken from the IBO dataset who successfully link to the HESA data. The detailed entry qualification information (both A level and IB) in the HESA data was introduced for entrants from 2007/08 onwards. This means that entry qualification data is incomplete in the HESA record for many students who qualified in the earlier years. Data has therefore been suppressed and represented as ‘..’ for A level qualifiers in 2007/08 and 2008/09 in Table 13. It should be noted that A level figures from 2009/10 may represent a slight undercount due to students who studied for four or more years. Figures for IB qualifiers have been retained, but it should be noted that this relies heavily on linking HESA data to the IBO dataset, so again there may be a certain amount of undercounting. Table 13- A time series of IB and A level qualifiers 2007/08 to 2012/13
Qualification type 2007/08 2008/09 2009/10 2010/11 2011/12 2012/13 Total IB diploma 3,240 3,935 4,455 5,060 6,130 7,195 30,015 IB course 200 220 255 275 360 335 1,645 A level .. .. 100,750 148,560 165,940 181,925 597,175 Total .. .. 105,460 153,890 172,430 189,460 628,840
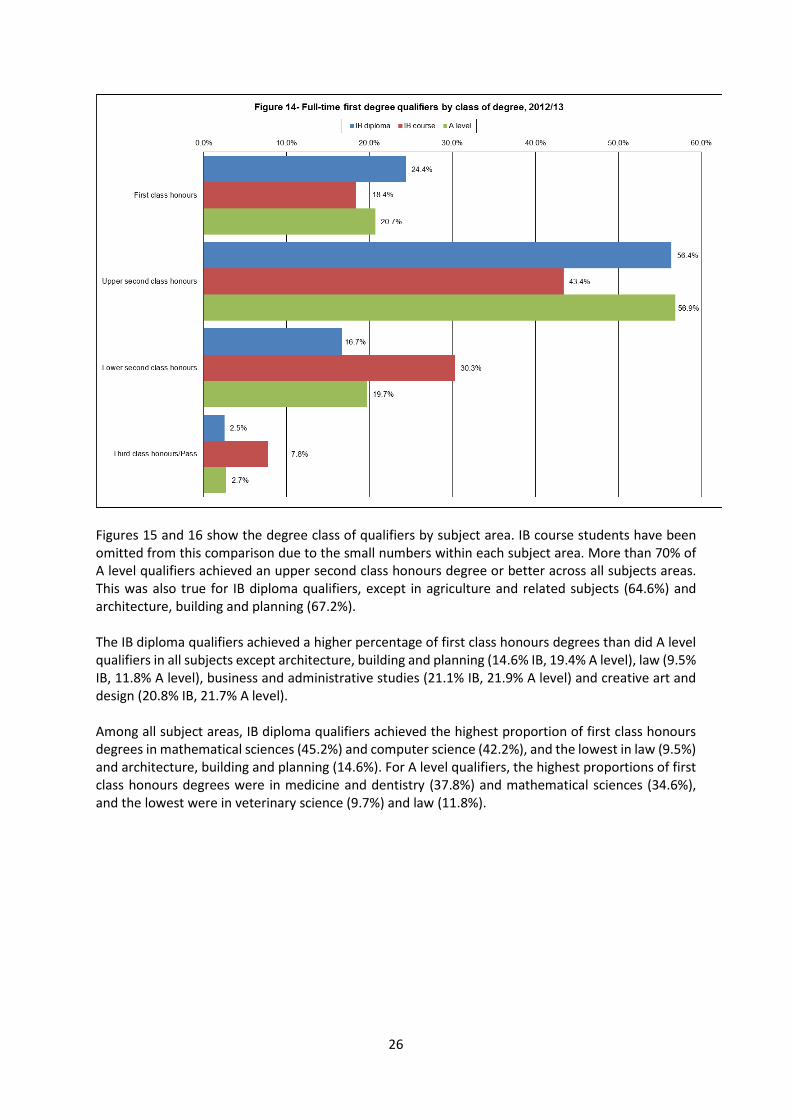
Achievement In 2012/13, HESA identified 7,195 qualifiers with IB diplomas, 335 qualifiers with IB courses and 181,925 with A level qualifications. Figure 14 shows the academic awards of the IB and A level qualifiers on completion of their first degree. Of IB diploma qualifiers, 24.4% achieved a first class honours degree, compared to 18.4% of IB course qualifiers and 20.7% of A level qualifiers. The proportions of IB diploma and A level qualifiers achieving an upper second class honours degree was similar (56.4% IB diploma, 56.9% A level) but greater than for IB course qualifiers (43.4%). A higher percentage of IB course qualifiers gained a lower second class honours degree than did IB diploma or A level qualifiers.
26
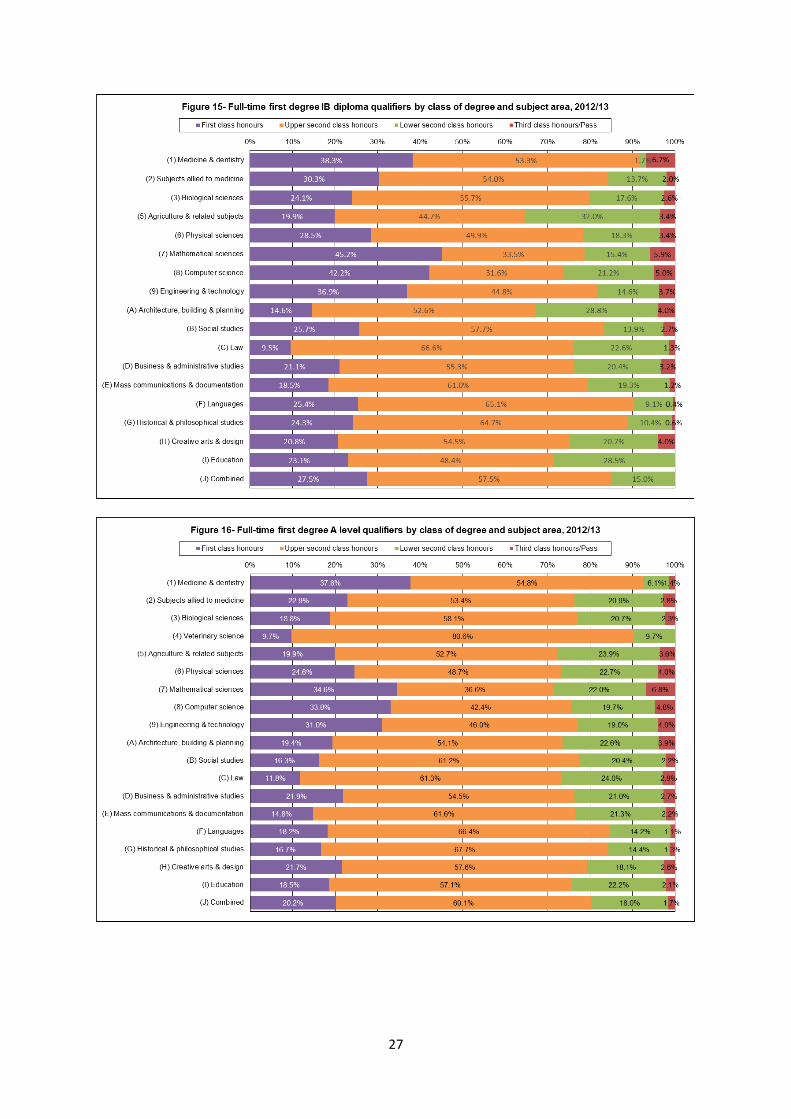
Figures 15 and 16 show the degree class of qualifiers by subject area. IB course students have been omitted from this comparison due to the small numbers within each subject area. More than 70% of A level qualifiers achieved an upper second class honours degree or better across all subjects areas. This was also true for IB diploma qualifiers, except in agriculture and related subjects (64.6%) and architecture, building and planning (67.2%). The IB diploma qualifiers achieved a higher percentage of first class honours degrees than did A level qualifiers in all subjects except architecture, building and planning (14.6% IB, 19.4% A level), law (9.5% IB, 11.8% A level), business and administrative studies (21.1% IB, 21.9% A level) and creative art and design (20.8% IB, 21.7% A level). Among all subject areas, IB diploma qualifiers achieved the highest proportion of first class honours degrees in mathematical sciences (45.2%) and computer science (42.2%), and the lowest in law (9.5%) and architecture, building and planning (14.6%). For A level qualifiers, the highest proportions of first class honours degrees were in medicine and dentistry (37.8%) and mathematical sciences (34.6%), and the lowest were in veterinary science (9.7%) and law (11.8%).
27
28
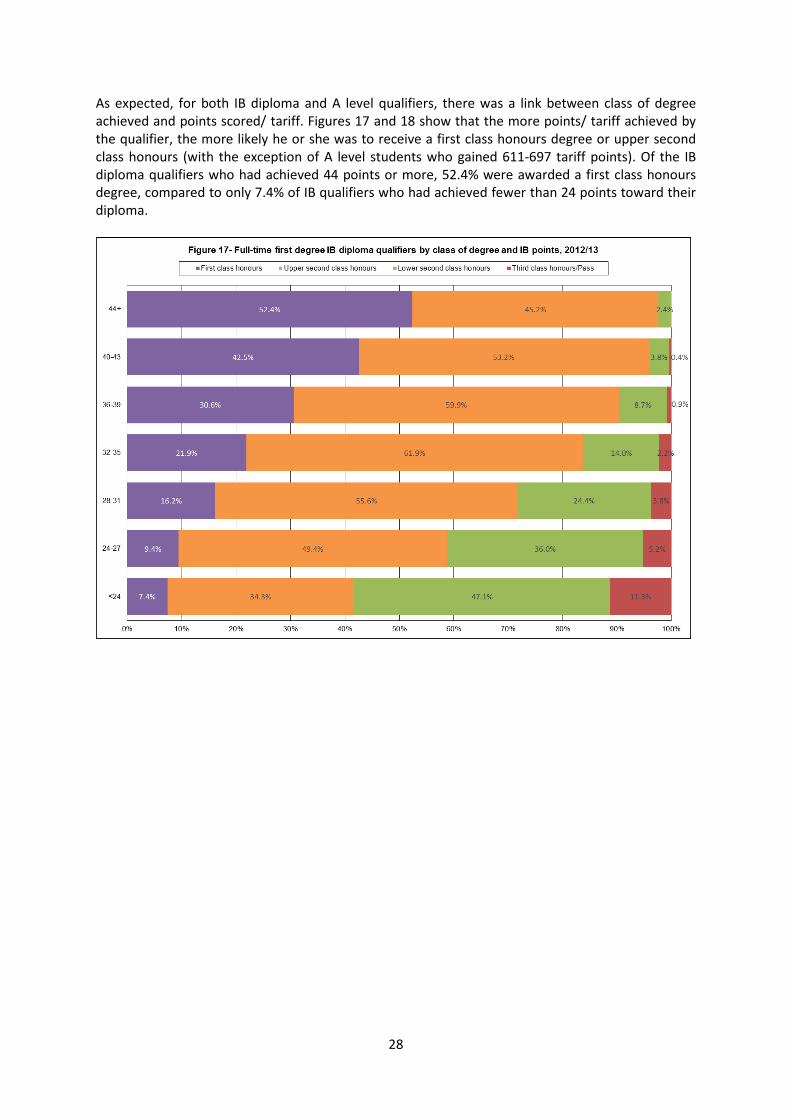
As expected, for both IB diploma and A level qualifiers, there was a link between class of degree achieved and points scored/ tariff. Figures 17 and 18 show that the more points/ tariff achieved by the qualifier, the more likely he or she was to receive a first class honours degree or upper second class honours (with the exception of A level students who gained 611-697 tariff points). Of the IB diploma qualifiers who had achieved 44 points or more, 52.4% were awarded a first class honours degree, compared to only 7.4% of IB qualifiers who had achieved fewer than 24 points toward their diploma.
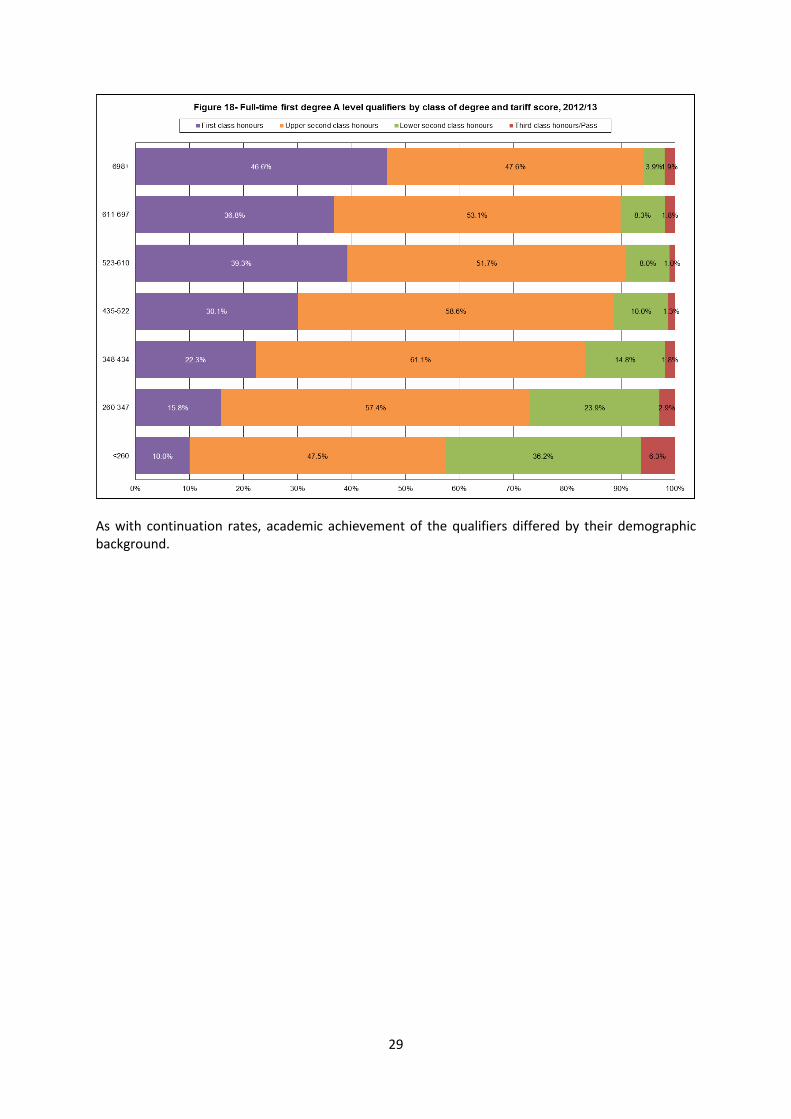
29
As with continuation rates, academic achievement of the qualifiers differed by their demographic background.
30
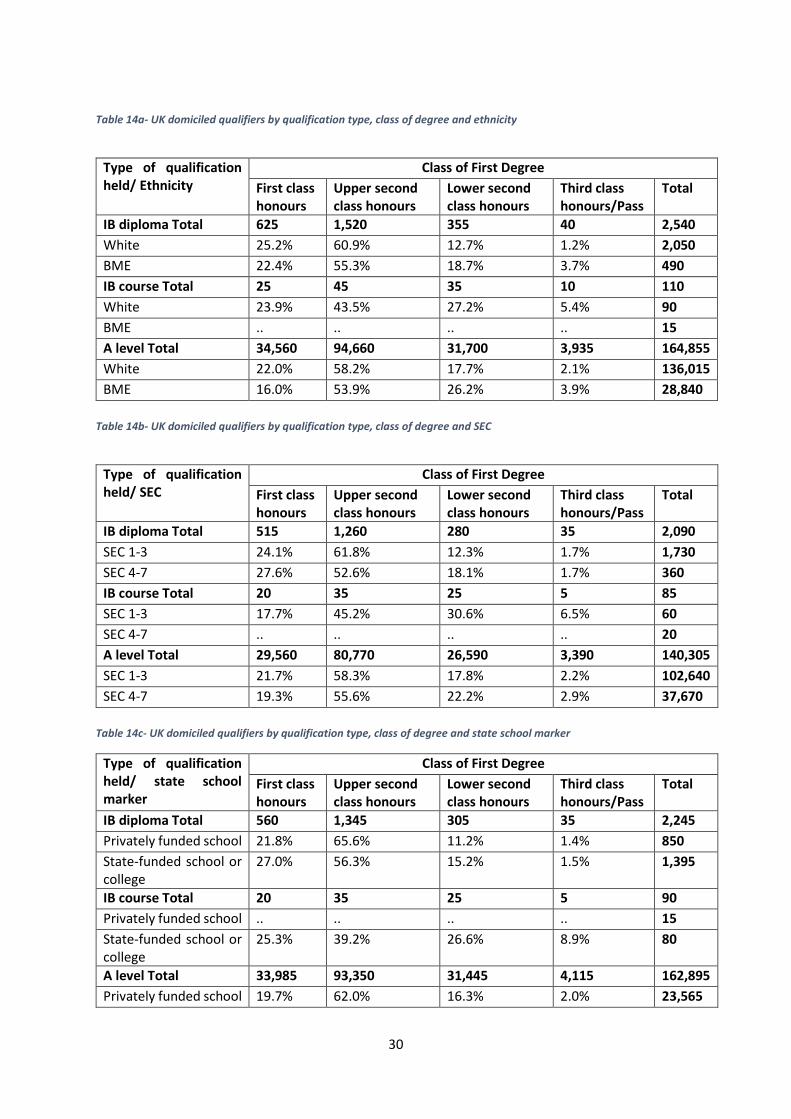
Table 14a- UK domiciled qualifiers by qualification type, class of degree and ethnicity
Type of qualification held/ Ethnicity
Class of First Degree First class honours
Upper second class honours
Lower second class honours
Third class honours/Pass
Total
IB diploma Total 625 1,520 355 40 2,540 White 25.2% 60.9% 12.7% 1.2% 2,050 BME 22.4% 55.3% 18.7% 3.7% 490 IB course Total 25 45 35 10 110 White 23.9% 43.5% 27.2% 5.4% 90 BME .. .. .. .. 15 A level Total 34,560 94,660 31,700 3,935 164,855 White 22.0% 58.2% 17.7% 2.1% 136,015 BME 16.0% 53.9% 26.2% 3.9% 28,840
Table 14b- UK domiciled qualifiers by qualification type, class of degree and SEC
Type of qualification held/ SEC
Class of First Degree First class honours
Upper second class honours
Lower second class honours
Third class honours/Pass
Total
IB diploma Total 515 1,260 280 35 2,090 SEC 1-3 24.1% 61.8% 12.3% 1.7% 1,730 SEC 4-7 27.6% 52.6% 18.1% 1.7% 360 IB course Total 20 35 25 5 85 SEC 1-3 17.7% 45.2% 30.6% 6.5% 60 SEC 4-7 .. .. .. .. 20 A level Total 29,560 80,770 26,590 3,390 140,305 SEC 1-3 21.7% 58.3% 17.8% 2.2% 102,640 SEC 4-7 19.3% 55.6% 22.2% 2.9% 37,670
Table 14c- UK domiciled qualifiers by qualification type, class of degree and state school marker
Type of qualification held/ state school marker
Class of First Degree First class honours
Upper second class honours
Lower second class honours
Third class honours/Pass
Total
IB diploma Total 560 1,345 305 35 2,245 Privately funded school 21.8% 65.6% 11.2% 1.4% 850 State-funded school or college
27.0% 56.3% 15.2% 1.5% 1,395
IB course Total 20 35 25 5 90 Privately funded school .. .. .. .. 15 State-funded school or college
25.3% 39.2% 26.6% 8.9% 80
A level Total 33,985 93,350 31,445 4,115 162,895 Privately funded school 19.7% 62.0% 16.3% 2.0% 23,565

31
State-funded school or college
21.1% 56.5% 19.8% 2.6% 139,330
Table 14a shows that White qualifiers tended to achieve a higher class of degree than did BME qualifiers across all qualification types where comparisons could be made. For A level qualifiers, those from a SEC 1-3 background performed better than those from a SEC 4-7 background shown in Table 14b. This trend did not follow for IB diploma qualifiers; those from a SEC 4-7 background gained a higher percentage of first class honour degrees than did those from a SEC 1-3 background. Table 14c shows that qualifiers from state-funded schools achieved a higher proportion of first class honours degrees than did those from privately funded schools, this relationship was reversed for second class honours degrees.
32
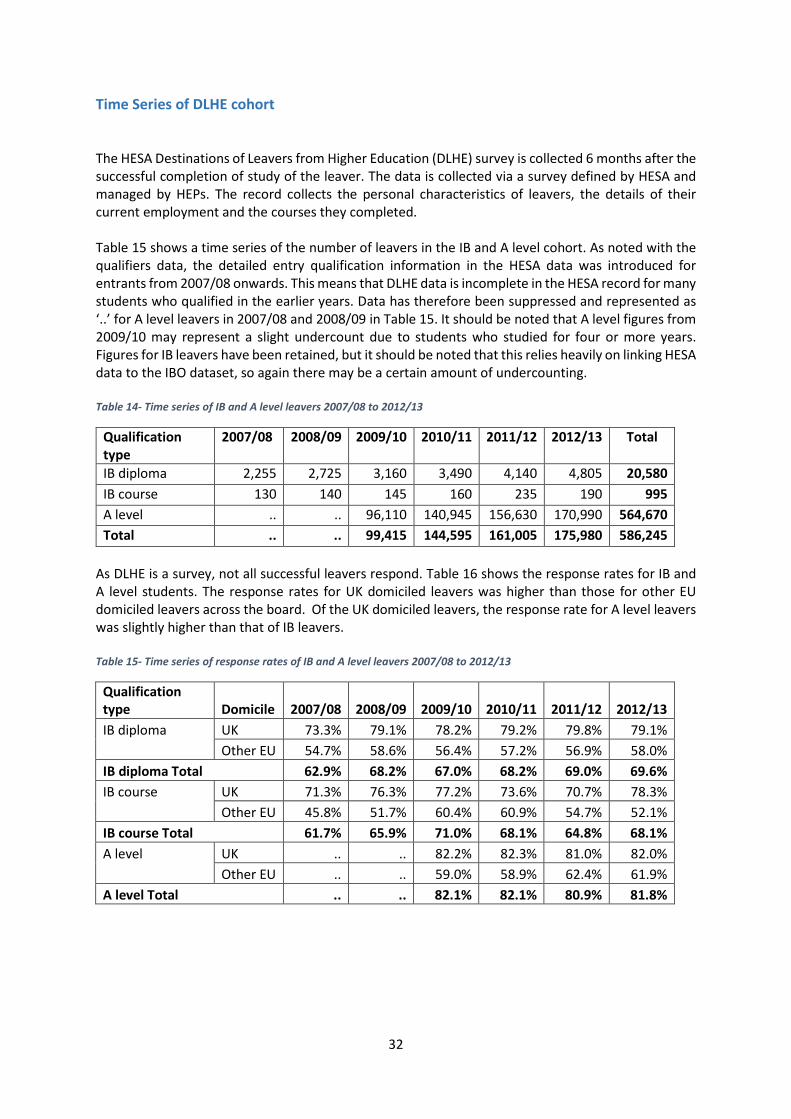
Time Series of DLHE cohort The HESA Destinations of Leavers from Higher Education (DLHE) survey is collected 6 months after the successful completion of study of the leaver. The data is collected via a survey defined by HESA and managed by HEPs. The record collects the personal characteristics of leavers, the details of their current employment and the courses they completed. Table 15 shows a time series of the number of leavers in the IB and A level cohort. As noted with the qualifiers data, the detailed entry qualification information in the HESA data was introduced for entrants from 2007/08 onwards. This means that DLHE data is incomplete in the HESA record for many students who qualified in the earlier years. Data has therefore been suppressed and represented as ‘..’ for A level leavers in 2007/08 and 2008/09 in Table 15. It should be noted that A level figures from 2009/10 may represent a slight undercount due to students who studied for four or more years. Figures for IB leavers have been retained, but it should be noted that this relies heavily on linking HESA data to the IBO dataset, so again there may be a certain amount of undercounting. Table 14- Time series of IB and A level leavers 2007/08 to 2012/13
Qualification type
2007/08 2008/09 2009/10 2010/11 2011/12 2012/13 Total
IB diploma 2,255 2,725 3,160 3,490 4,140 4,805 20,580 IB course 130 140 145 160 235 190 995 A level .. .. 96,110 140,945 156,630 170,990 564,670 Total .. .. 99,415 144,595 161,005 175,980 586,245
As DLHE is a survey, not all successful leavers respond. Table 16 shows the response rates for IB and A level students. The response rates for UK domiciled leavers was higher than those for other EU domiciled leavers across the board. Of the UK domiciled leavers, the response rate for A level leavers was slightly higher than that of IB leavers. Table 15- Time series of response rates of IB and A level leavers 2007/08 to 2012/13
Qualification type Domicile 2007/08 2008/09 2009/10 2010/11 2011/12 2012/13 IB diploma UK 73.3% 79.1% 78.2% 79.2% 79.8% 79.1% Other EU 54.7% 58.6% 56.4% 57.2% 56.9% 58.0% IB diploma Total 62.9% 68.2% 67.0% 68.2% 69.0% 69.6% IB course UK 71.3% 76.3% 77.2% 73.6% 70.7% 78.3% Other EU 45.8% 51.7% 60.4% 60.9% 54.7% 52.1% IB course Total 61.7% 65.9% 71.0% 68.1% 64.8% 68.1% A level UK .. .. 82.2% 82.3% 81.0% 82.0% Other EU .. .. 59.0% 58.9% 62.4% 61.9% A level Total .. .. 82.1% 82.1% 80.9% 81.8%
33
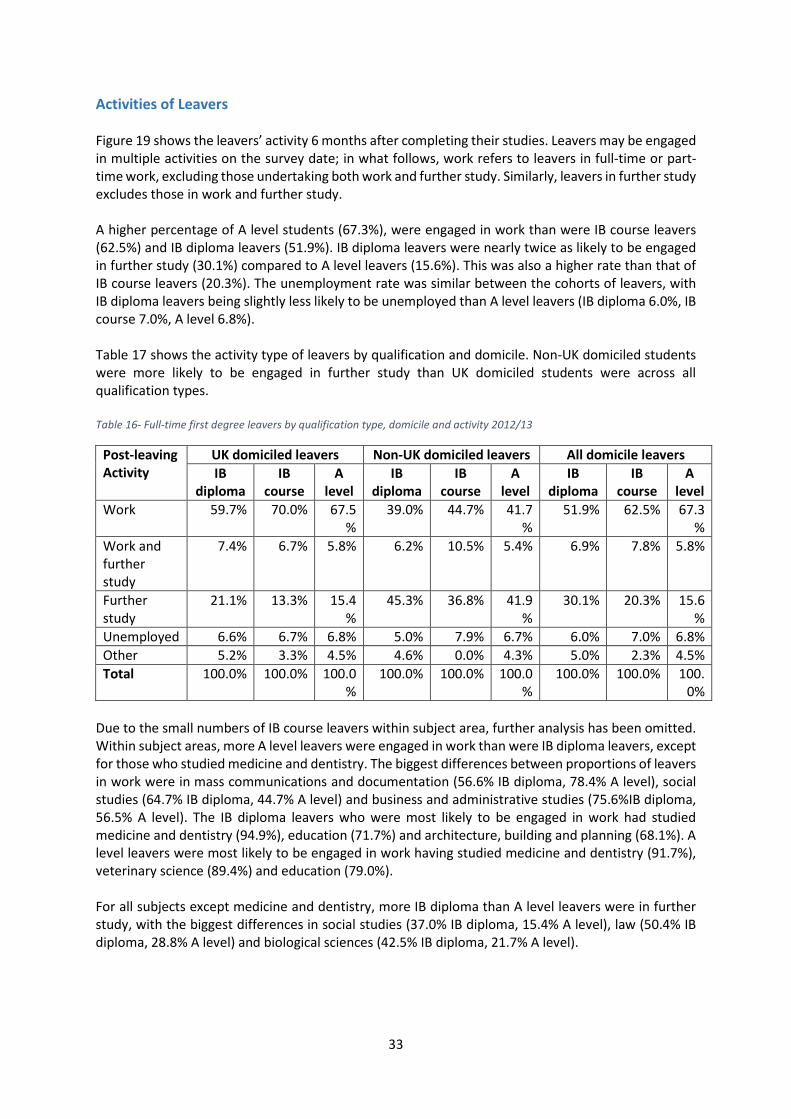
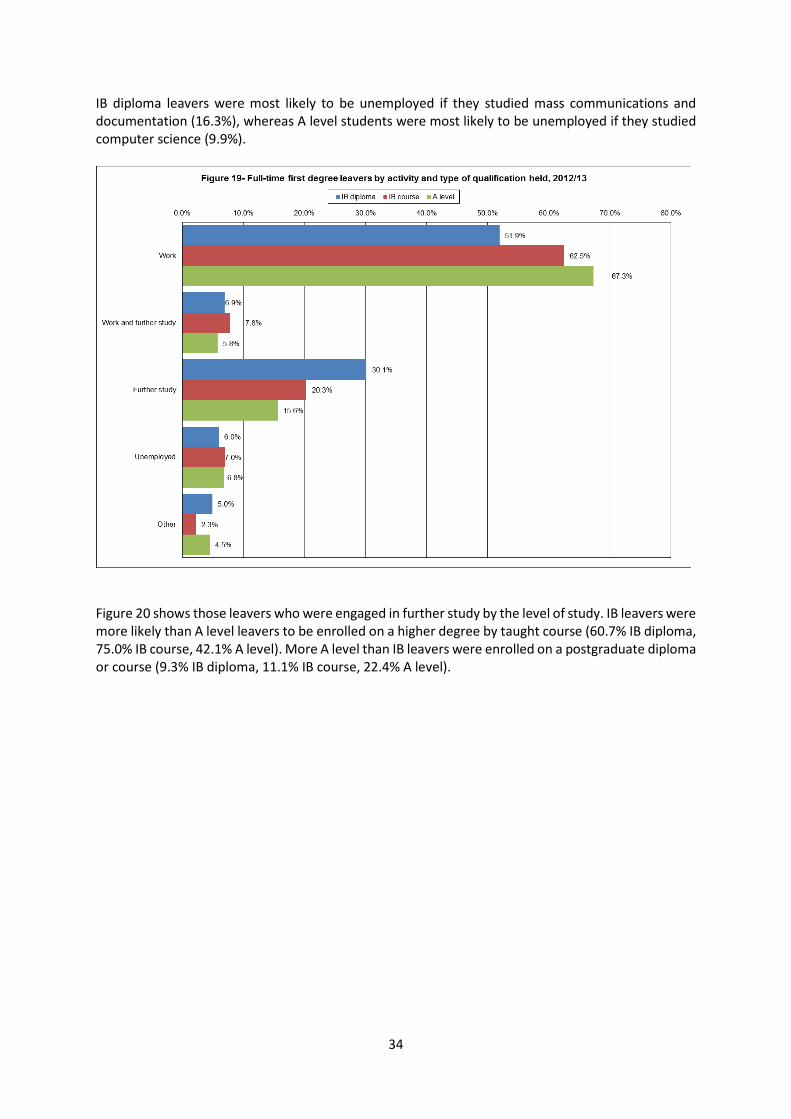
Activities of Leavers Figure 19 shows the leavers’ activity 6 months after completing their studies. Leavers may be engaged in multiple activities on the survey date; in what follows, work refers to leavers in full-time or part-time work, excluding those undertaking both work and further study. Similarly, leavers in further study excludes those in work and further study. A higher percentage of A level students (67.3%), were engaged in work than were IB course leavers (62.5%) and IB diploma leavers (51.9%). IB diploma leavers were nearly twice as likely to be engaged in further study (30.1%) compared to A level leavers (15.6%). This was also a higher rate than that of IB course leavers (20.3%). The unemployment rate was similar between the cohorts of leavers, with IB diploma leavers being slightly less likely to be unemployed than A level leavers (IB diploma 6.0%, IB course 7.0%, A level 6.8%). Table 17 shows the activity type of leavers by qualification and domicile. Non-UK domiciled students were more likely to be engaged in further study than UK domiciled students were across all qualification types. Table 16- Full-time first degree leavers by qualification type, domicile and activity 2012/13
Post-leaving Activity
UK domiciled leavers Non-UK domiciled leavers All domicile leavers IB
diploma IB
course A
level IB
diploma IB
course A
level IB
diploma IB
course A
level Work 59.7% 70.0% 67.5
% 39.0% 44.7% 41.7
% 51.9% 62.5% 67.3
% Work and further study
7.4% 6.7% 5.8% 6.2% 10.5% 5.4% 6.9% 7.8% 5.8%
Further study
21.1% 13.3% 15.4%
45.3% 36.8% 41.9%
30.1% 20.3% 15.6%
Unemployed 6.6% 6.7% 6.8% 5.0% 7.9% 6.7% 6.0% 7.0% 6.8% Other 5.2% 3.3% 4.5% 4.6% 0.0% 4.3% 5.0% 2.3% 4.5% Total 100.0% 100.0% 100.0
% 100.0% 100.0% 100.0
% 100.0% 100.0% 100.
0% Due to the small numbers of IB course leavers within subject area, further analysis has been omitted. Within subject areas, more A level leavers were engaged in work than were IB diploma leavers, except for those who studied medicine and dentistry. The biggest differences between proportions of leavers in work were in mass communications and documentation (56.6% IB diploma, 78.4% A level), social studies (64.7% IB diploma, 44.7% A level) and business and administrative studies (75.6%IB diploma, 56.5% A level). The IB diploma leavers who were most likely to be engaged in work had studied medicine and dentistry (94.9%), education (71.7%) and architecture, building and planning (68.1%). A level leavers were most likely to be engaged in work having studied medicine and dentistry (91.7%), veterinary science (89.4%) and education (79.0%). For all subjects except medicine and dentistry, more IB diploma than A level leavers were in further study, with the biggest differences in social studies (37.0% IB diploma, 15.4% A level), law (50.4% IB diploma, 28.8% A level) and biological sciences (42.5% IB diploma, 21.7% A level).
34
IB diploma leavers were most likely to be unemployed if they studied mass communications and documentation (16.3%), whereas A level students were most likely to be unemployed if they studied computer science (9.9%).
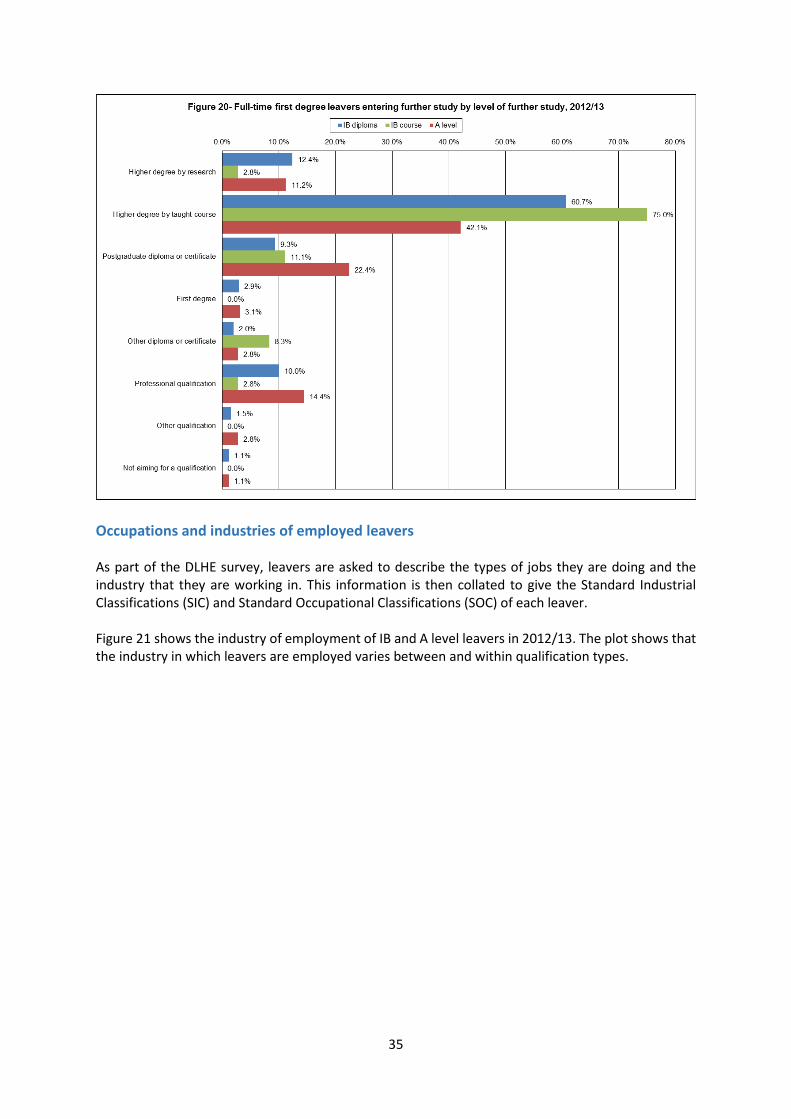
Figure 20 shows those leavers who were engaged in further study by the level of study. IB leavers were more likely than A level leavers to be enrolled on a higher degree by taught course (60.7% IB diploma, 75.0% IB course, 42.1% A level). More A level than IB leavers were enrolled on a postgraduate diploma or course (9.3% IB diploma, 11.1% IB course, 22.4% A level).
35
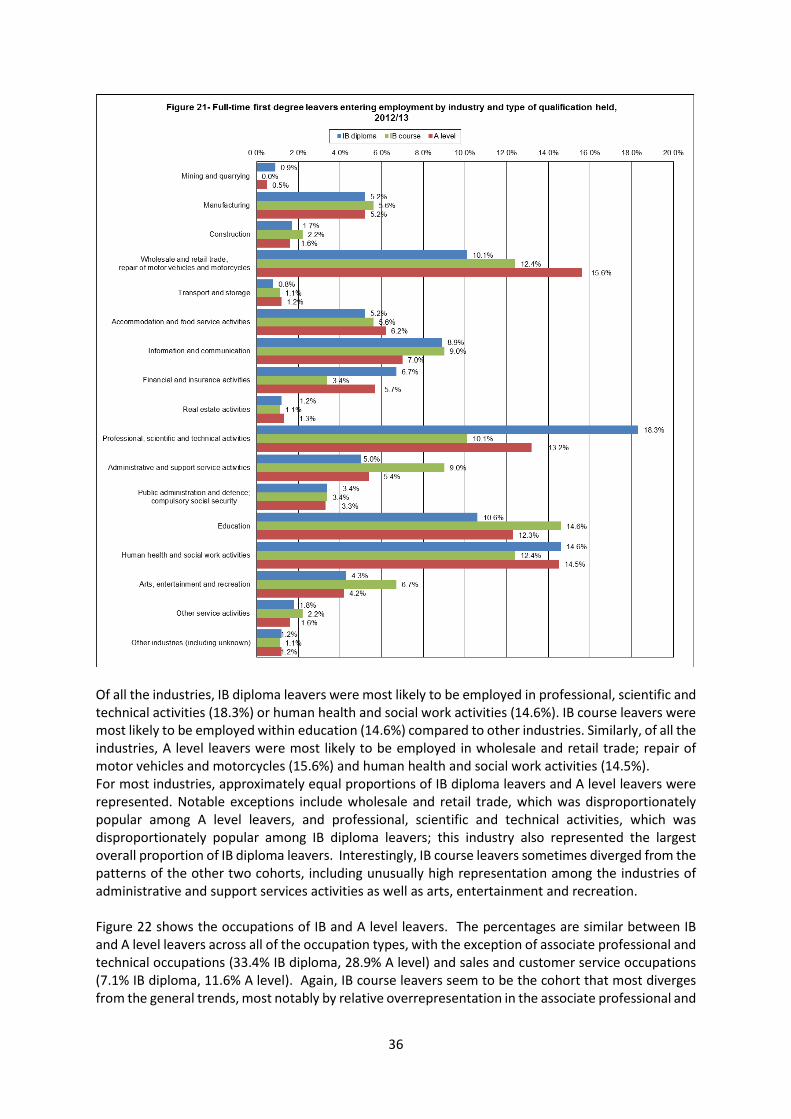
Occupations and industries of employed leavers As part of the DLHE survey, leavers are asked to describe the types of jobs they are doing and the industry that they are working in. This information is then collated to give the Standard Industrial Classifications (SIC) and Standard Occupational Classifications (SOC) of each leaver. Figure 21 shows the industry of employment of IB and A level leavers in 2012/13. The plot shows that the industry in which leavers are employed varies between and within qualification types.
36
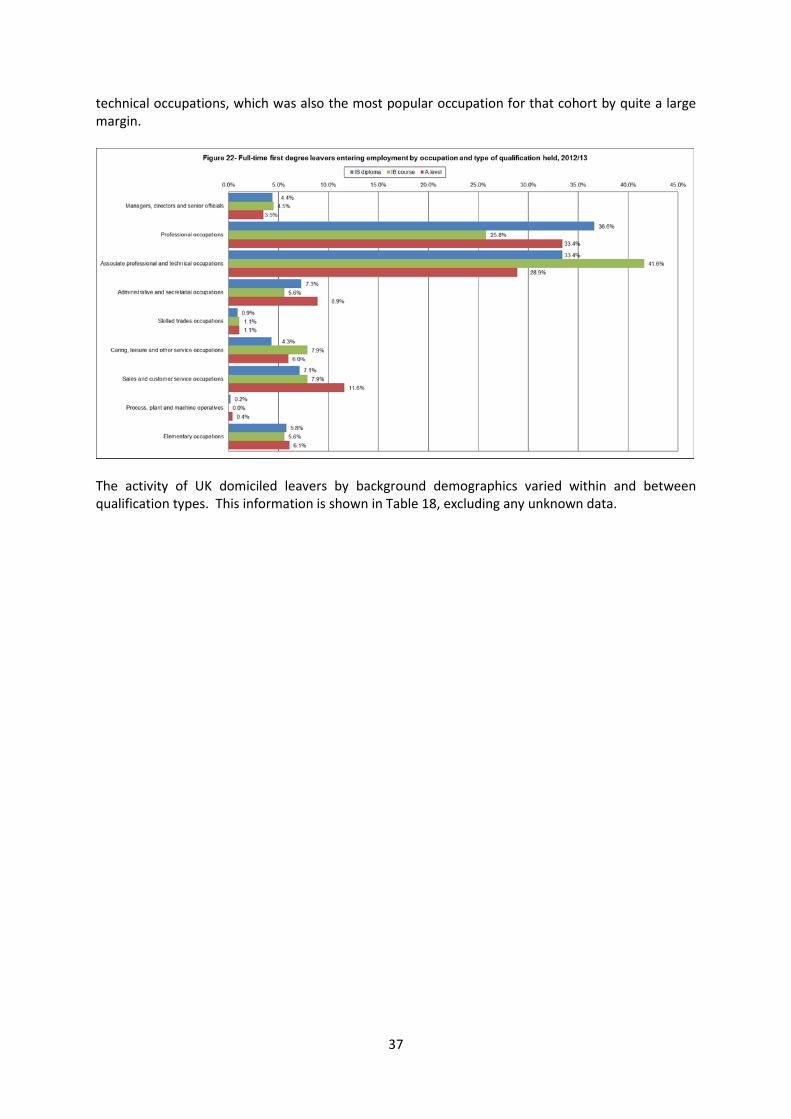
Of all the industries, IB diploma leavers were most likely to be employed in professional, scientific and technical activities (18.3%) or human health and social work activities (14.6%). IB course leavers were most likely to be employed within education (14.6%) compared to other industries. Similarly, of all the industries, A level leavers were most likely to be employed in wholesale and retail trade; repair of motor vehicles and motorcycles (15.6%) and human health and social work activities (14.5%). For most industries, approximately equal proportions of IB diploma leavers and A level leavers were represented. Notable exceptions include wholesale and retail trade, which was disproportionately popular among A level leavers, and professional, scientific and technical activities, which was disproportionately popular among IB diploma leavers; this industry also represented the largest overall proportion of IB diploma leavers. Interestingly, IB course leavers sometimes diverged from the patterns of the other two cohorts, including unusually high representation among the industries of administrative and support services activities as well as arts, entertainment and recreation. Figure 22 shows the occupations of IB and A level leavers. The percentages are similar between IB and A level leavers across all of the occupation types, with the exception of associate professional and technical occupations (33.4% IB diploma, 28.9% A level) and sales and customer service occupations (7.1% IB diploma, 11.6% A level). Again, IB course leavers seem to be the cohort that most diverges from the general trends, most notably by relative overrepresentation in the associate professional and
37
technical occupations, which was also the most popular occupation for that cohort by quite a large margin.
The activity of UK domiciled leavers by background demographics varied within and between qualification types. This information is shown in Table 18, excluding any unknown data.
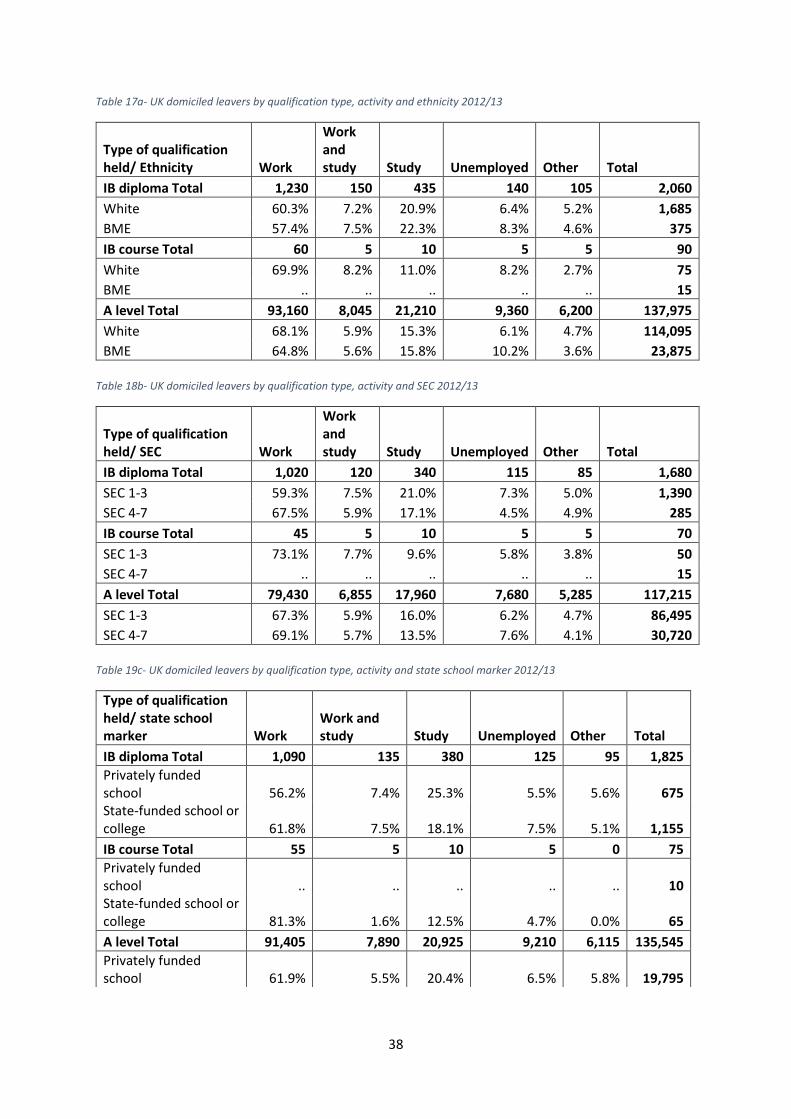
38
Table 17a- UK domiciled leavers by qualification type, activity and ethnicity 2012/13
Type of qualification held/ Ethnicity Work
Work and study Study Unemployed Other Total
IB diploma Total 1,230 150 435 140 105 2,060 White 60.3% 7.2% 20.9% 6.4% 5.2% 1,685 BME 57.4% 7.5% 22.3% 8.3% 4.6% 375 IB course Total 60 5 10 5 5 90 White 69.9% 8.2% 11.0% 8.2% 2.7% 75 BME .. .. .. .. .. 15 A level Total 93,160 8,045 21,210 9,360 6,200 137,975 White 68.1% 5.9% 15.3% 6.1% 4.7% 114,095 BME 64.8% 5.6% 15.8% 10.2% 3.6% 23,875
Table 18b- UK domiciled leavers by qualification type, activity and SEC 2012/13
Type of qualification held/ SEC Work
Work and study Study Unemployed Other Total
IB diploma Total 1,020 120 340 115 85 1,680 SEC 1-3 59.3% 7.5% 21.0% 7.3% 5.0% 1,390 SEC 4-7 67.5% 5.9% 17.1% 4.5% 4.9% 285 IB course Total 45 5 10 5 5 70 SEC 1-3 73.1% 7.7% 9.6% 5.8% 3.8% 50 SEC 4-7 .. .. .. .. .. 15 A level Total 79,430 6,855 17,960 7,680 5,285 117,215 SEC 1-3 67.3% 5.9% 16.0% 6.2% 4.7% 86,495 SEC 4-7 69.1% 5.7% 13.5% 7.6% 4.1% 30,720
Table 19c- UK domiciled leavers by qualification type, activity and state school marker 2012/13
Type of qualification held/ state school marker Work
Work and study Study Unemployed Other Total
IB diploma Total 1,090 135 380 125 95 1,825 Privately funded school 56.2% 7.4% 25.3% 5.5% 5.6% 675 State-funded school or college 61.8% 7.5% 18.1% 7.5% 5.1% 1,155 IB course Total 55 5 10 5 0 75 Privately funded school .. .. .. .. .. 10 State-funded school or college 81.3% 1.6% 12.5% 4.7% 0.0% 65 A level Total 91,405 7,890 20,925 9,210 6,115 135,545 Privately funded school 61.9% 5.5% 20.4% 6.5% 5.8% 19,795
39
State-funded school or college 68.4% 5.9% 14.6% 6.9% 4.3% 115,750
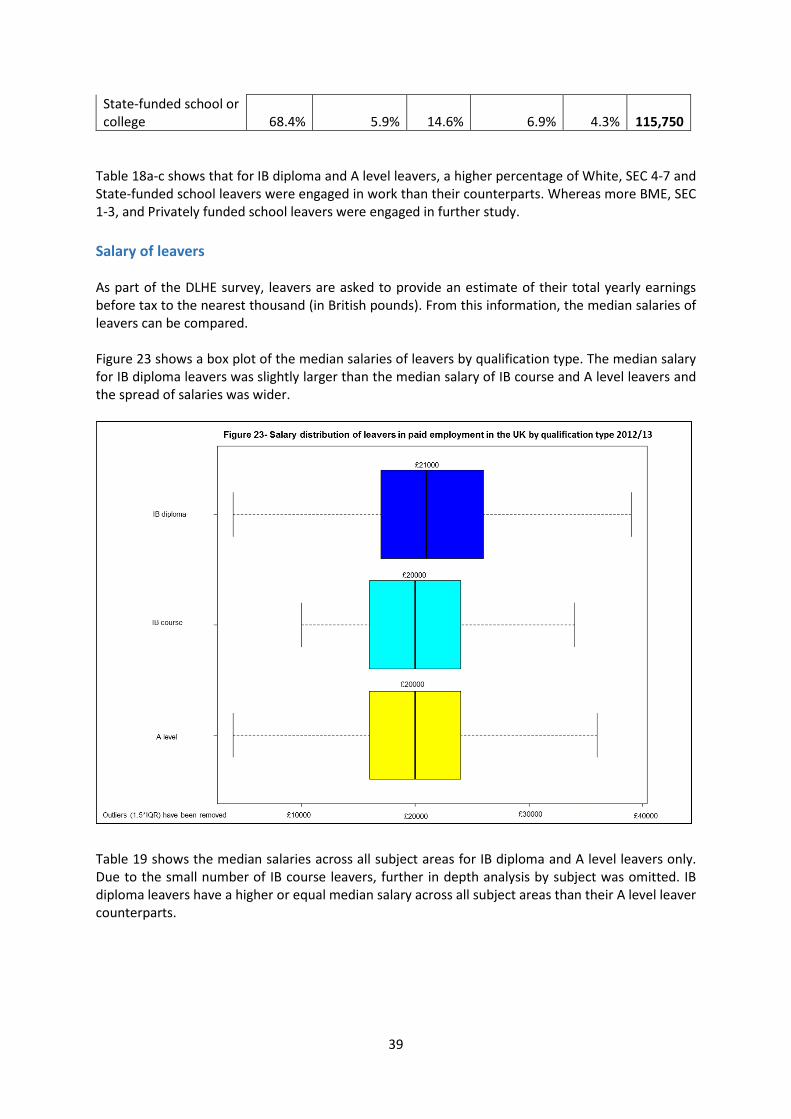
Table 18a-c shows that for IB diploma and A level leavers, a higher percentage of White, SEC 4-7 and State-funded school leavers were engaged in work than their counterparts. Whereas more BME, SEC 1-3, and Privately funded school leavers were engaged in further study. Salary of leavers As part of the DLHE survey, leavers are asked to provide an estimate of their total yearly earnings before tax to the nearest thousand (in British pounds). From this information, the median salaries of leavers can be compared. Figure 23 shows a box plot of the median salaries of leavers by qualification type. The median salary for IB diploma leavers was slightly larger than the median salary of IB course and A level leavers and the spread of salaries was wider.
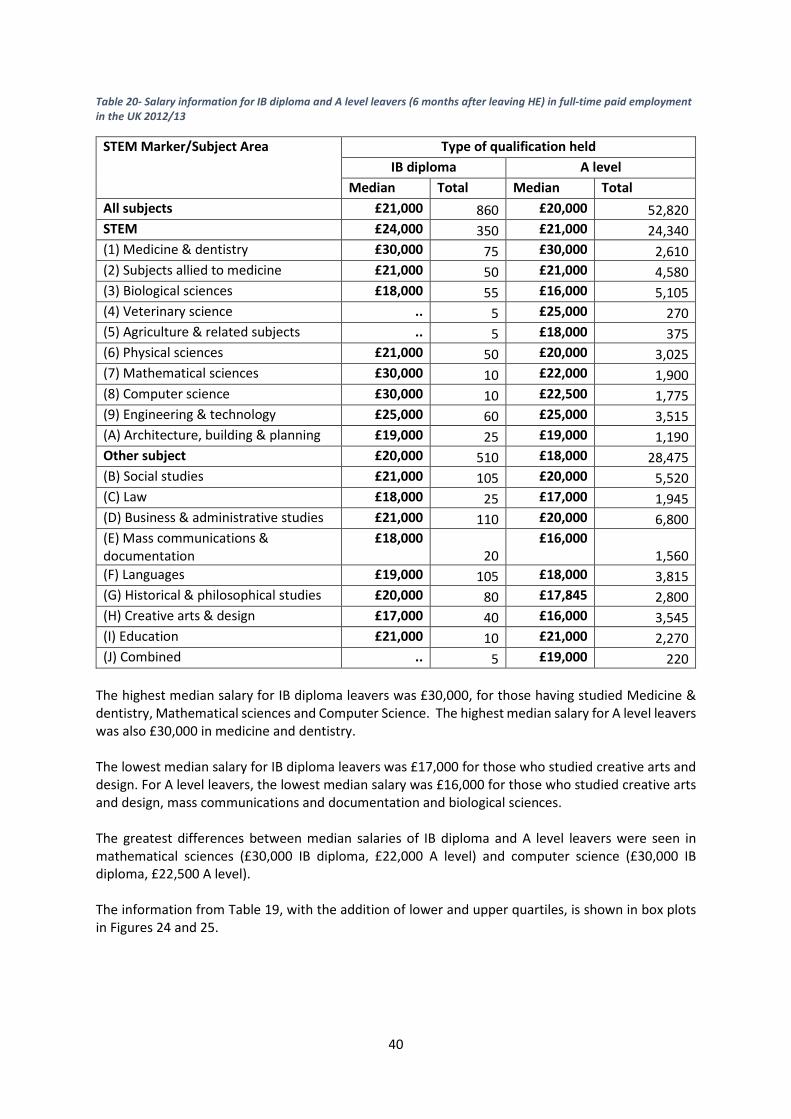
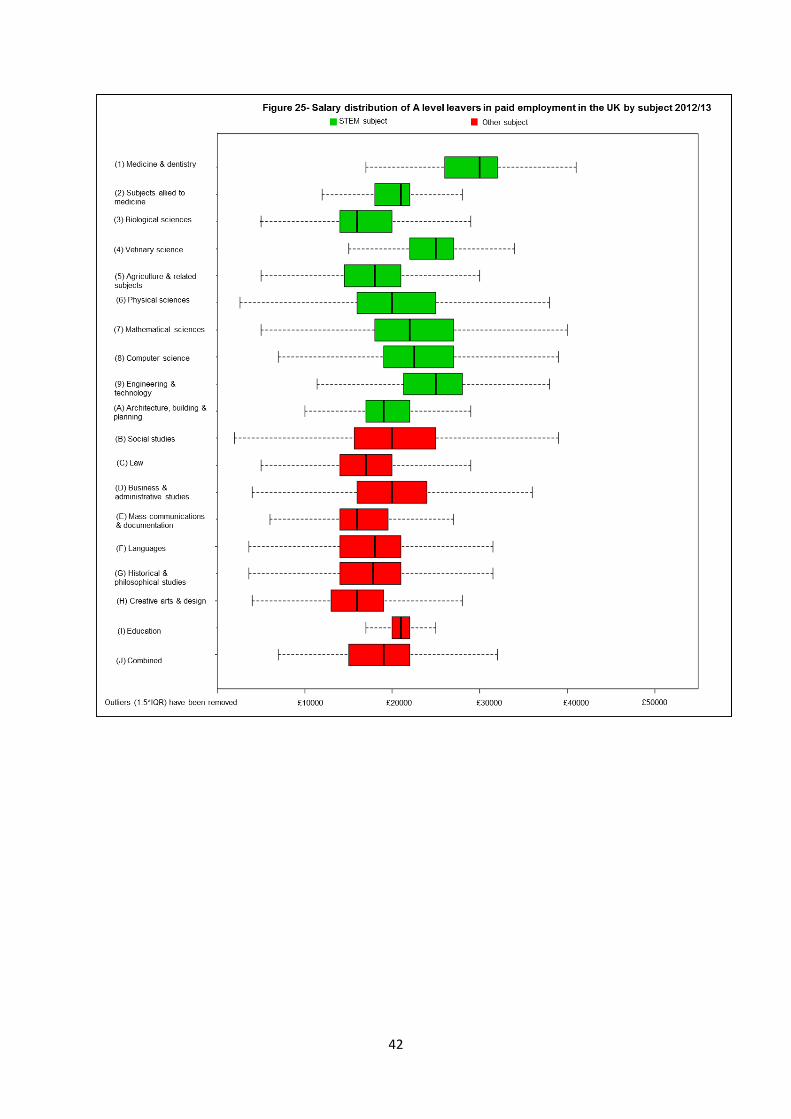
Table 19 shows the median salaries across all subject areas for IB diploma and A level leavers only. Due to the small number of IB course leavers, further in depth analysis by subject was omitted. IB diploma leavers have a higher or equal median salary across all subject areas than their A level leaver counterparts.
40
Table 20- Salary information for IB diploma and A level leavers (6 months after leaving HE) in full-time paid employment in the UK 2012/13
STEM Marker/Subject Area Type of qualification held IB diploma A level
Median Total Median Total All subjects £21,000 860 £20,000 52,820 STEM £24,000 350 £21,000 24,340 (1) Medicine & dentistry £30,000 75 £30,000 2,610 (2) Subjects allied to medicine £21,000 50 £21,000 4,580 (3) Biological sciences £18,000 55 £16,000 5,105 (4) Veterinary science .. 5 £25,000 270 (5) Agriculture & related subjects .. 5 £18,000 375 (6) Physical sciences £21,000 50 £20,000 3,025 (7) Mathematical sciences £30,000 10 £22,000 1,900 (8) Computer science £30,000 10 £22,500 1,775 (9) Engineering & technology £25,000 60 £25,000 3,515 (A) Architecture, building & planning £19,000 25 £19,000 1,190 Other subject £20,000 510 £18,000 28,475 (B) Social studies £21,000 105 £20,000 5,520 (C) Law £18,000 25 £17,000 1,945 (D) Business & administrative studies £21,000 110 £20,000 6,800 (E) Mass communications & documentation
£18,000 20
£16,000 1,560
(F) Languages £19,000 105 £18,000 3,815 (G) Historical & philosophical studies £20,000 80 £17,845 2,800 (H) Creative arts & design £17,000 40 £16,000 3,545 (I) Education £21,000 10 £21,000 2,270 (J) Combined .. 5 £19,000 220
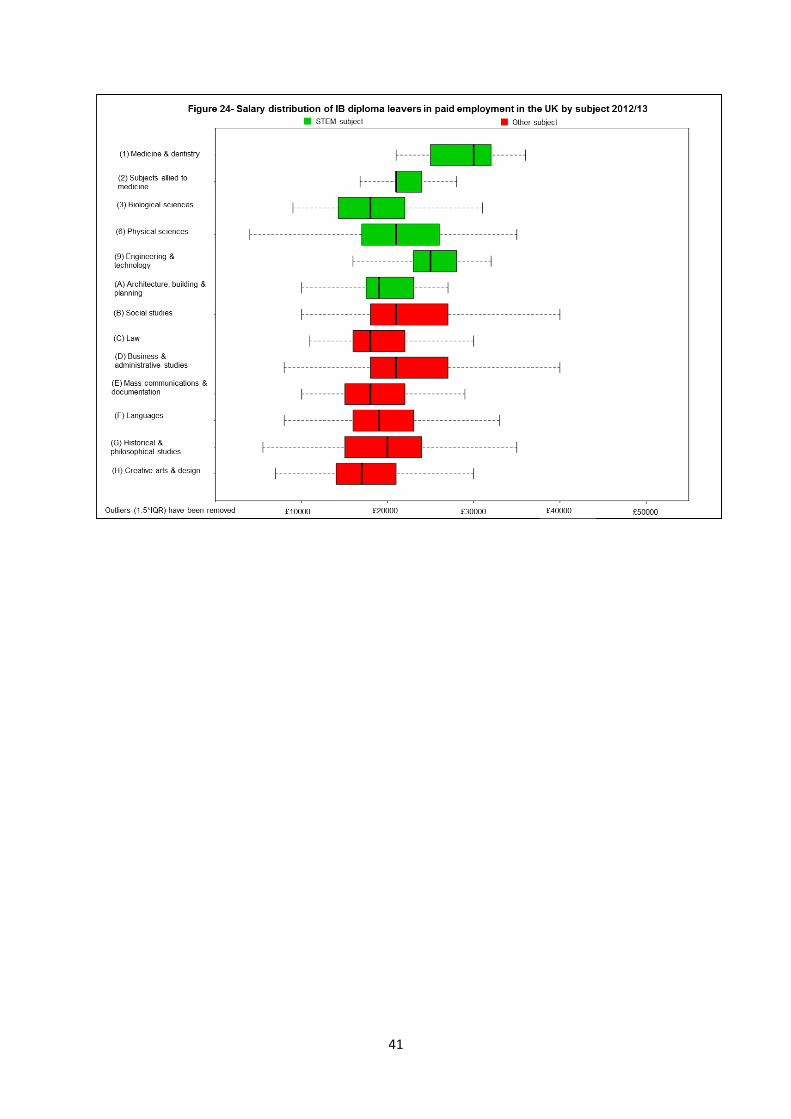
The highest median salary for IB diploma leavers was £30,000, for those having studied Medicine & dentistry, Mathematical sciences and Computer Science. The highest median salary for A level leavers was also £30,000 in medicine and dentistry. The lowest median salary for IB diploma leavers was £17,000 for those who studied creative arts and design. For A level leavers, the lowest median salary was £16,000 for those who studied creative arts and design, mass communications and documentation and biological sciences. The greatest differences between median salaries of IB diploma and A level leavers were seen in mathematical sciences (£30,000 IB diploma, £22,000 A level) and computer science (£30,000 IB diploma, £22,500 A level). The information from Table 19, with the addition of lower and upper quartiles, is shown in box plots in Figures 24 and 25.
41
42
43
Section 2. The impact of achieving an IB diploma on higher education enrolment and outcomes The summary statistics in the first part of this report have shown that the cohorts of IB and A level students, qualifiers and leavers differed both in size and on background demographics across all academic years of linked data. It is of interest to investigate if there are significant differences between IB diploma students and A level students on student, qualifier and leaver outcomes. In an ideal world, a randomised control trial would be undertaken, prior to undertaking the pre-HE qualification, to randomly assign students to either an IB (the treatment) or A level (the control) study programme. A randomised control trial ensures that the students are only randomly different to each other on all background variables (Stuart, 2010), so significant differences between the two qualifications can be estimated. Randomised control trials are not always possible due to ethical or financial reasons; as a consequence, observational data is used to estimate the effects. Difficulty arises in the estimation of effects from observational data due to imbalance or lack of overlap between treatment and control groups. D’Agostino and D’Agostinto (2007) note that this imbalance between treatment and control groups can lead to biased estimate of treatment effects and Stuart (2010) comments that regression models used to estimate treatment effects can perform poorly where there is insufficient overlap. It has been noted that the background demographics of IB and A level students are very different; for example, attendance at a state-funded school or college compared to a privately-funded one could be associated with both the pre-HE qualification (treatment/control of interest) and the attendance at a Top 20 HE provider (an outcome of interest). The pre-HE school type is an example of a potential confounder and there may be other examples of this. A confounder is a variable which is associated with both the outcome and the independent variable (Hosmer and Lemeshow, 2000, p.70). Not taking into account confounding variables can provide misleading effects. A solution to this problem is to use a statistical technique known as propensity score matching (PSM). Methods PSM enables the comparison of a treatment and a control group in order to estimate the average effect of a treatment on an outcome using observational data (Rosenbaum and Rubin, 1983). Section 1 has shown that the IB and A level groups of students, qualifiers and leavers differ greatly in size across all years and in their background characteristics and demographics. It has already been noted that differences in background characteristics of groups can lead to biased treatment effects, such that a difference in outcome may be due to a difference in a background characteristic rather than the study programme that they undertook. Consequently, PSM is conducted to counteract this. PSM selects a group of IB students who are similar in size and balanced with good overlap in their background characteristics to a group of A level students. By creating similar groups of IB and A level students, the background characteristics should not have an impact on the outcome and so analysis of the effect of studying an IB qualification on the outcome can be conducted. Note that PSM is implemented twice more to create a similar group of IB and A level qualifiers and a similar group of IB and A level leavers. Nearest neighbour PSM was implemented, without replacement, to provide matched 1:1 comparison groups for IB and A level student, qualifier, and leaver cohorts. The matched comparison groups were used to analyse the effect of undertaking an IB on several outcomes within the student, qualifier and leaver cohorts. All outcomes were dichotomous, such that the student either achieved or did not achieve the outcome of interest. Outcomes of interest for the student cohort were attendance at a Top 20 HEP, enrolment on a STEM subject course and continuation from first year to second year of study. Outcomes of interest for the qualifier cohort were focussed on achievement after attendance
44
and course completion at a HEP; specifically, the achievement of a first class honours degree and achieving at least an upper second class honours degree or better. For the leaver cohort, surveyed six months after leaving their HEPs, outcomes of interest include whether they were engaged in work or further study. As there was a limited number of IB students within the cohort for each academic year, students from across the academic years 2007/08 to 2012/13 were combined and used within PSM to maximise the number of students in the matched comparison groups. A similar approach was taken for the qualifier and leaver PSM procedures, except that the A level qualifiers and leavers were restricted to 2009/10 to 2012/13. The detailed entry qualification information (both A level and IB) in the HESA data was introduced for entrants from 2007/08 onwards. This means that entry qualification data is incomplete in the HESA record for many students who qualified in the earlier years. Data has therefore been suppressed for these years for A level qualifiers and leavers. The matched groups were created to be similar on a student’s background demographics: gender, SEC, ethnicity, state school marker and low participation marker, as shown in Table 20. As noted in the first part of the report, the majority of this demographic data is not returned to HESA for non-UK domiciled students; consequently, the matched groups are restricted to UK domiciled students only to prevent matching students, qualifiers or leavers with missing data within the analysis. As a consequence of this, any reference to IB and A level students, qualifiers and leavers in this analysis refers to those who are UK domiciled only. Students, qualifiers or leavers with unknown or unclassified information for any of the background characteristics or outcomes were omitted from PSM. The IB and A level have a different grading system. A level students are awarded individual grades for each A level they have undertaken. There is no limit to the number of A levels a student can take but typically it is 3 or 4, and HE providers (HEP) usually make offers on 3 A levels. UCAS created the concept of tariff, which allocates points to post-16 qualifications. Tariff’s main purpose is to specify entrance requirements for UK HEPs but also allows broad comparisons to be made about a wide range of qualifications (https://www.ucas.com/ucas/undergraduate/getting-started/entryrequirements/tariff). As there were small numbers of IB course students, qualifiers and leavers in the data, the analysis was restricted to those who had achieved an IB diploma only. The point threshold for an IB diploma is 24, which is equivalent to 260 UCAS tariff points. To ensure comparability in terms of academic achievement, only A level students, qualifiers and leavers were included in the analysis with grade combinations equivalent to at least 240 tariff points. An example of this combination is an A level score of CCC (see Appendix D). Tariff score is not used as an entrance criterion by all HE providers; some HE providers specify entrance criteria for each qualification. Taking into consideration equivalent IB diploma and A level entrance requirements at several HE providers within the UK and from courses in several subjects, a grouping of IB scores and A level grade combinations was created. Three groups were created; academic ability group 1 - those with lower graded HE entrance qualifications, academic ability group 2 - those with a mid-level graded HE entrance qualifications and academic ability group 3 - those with the higher graded HE entrance qualifications. Appendix D contains further information about the groupings suggested between the two qualifications and the number of students within group.
45
Table 21- Background characteristics used in PSM
Characteristics SEC 1. Higher managerial & professional occupations
2. Lower managerial & professional occupations 3. Intermediate occupations 4. Small employers & own account workers 5. Lower supervisory & technical occupations 6. Semi-routine occupations 7. Routine occupations
Gender 1. Male 2. Female
State- school marker 1. State-funded school or college 2. Privately funded school
Low participation marker 1. Low participation neighbourhood (POLAR3) 2. Other neighbourhood (POLAR3)
Ethnicity 1. White 2. Black 3. Asian, excluding Chinese 4. Chinese 5. Other, including Mixed and Arab
The PSM methodology for the student cohort is as follows. The propensity scores are calculated by fitting a logistic regression model to the complete IB diploma and A level data with the dependent variable as the qualification marker (IB diploma/ A level), and the independent variables being the background demographics; gender, SEC, ethnicity, state school marker and low participation marker. The propensity scores are the fitted values from this model. The nearest neighbour approach matches an IB diploma student to an A level student with the closest propensity score. After this, analysis can be conducted on the matched IB diploma and A level students. There is debate in the literature about whether or not the paired nature of the data needs to be accounted for in the follow-up analysis (Austin, 2008; Stuart, 2010). As the matched pairs have not been made based on the outcomes of interest, it is not a case-control study, and so the paired nature of the data is not accounted for in the follow-up analysis. Stuart (2010) notes that after the matched samples have been formed, the same outcome analysis that would have been run on the full data can be run on the matched data. As a consequence of this, a logistic regression model is fitted to the IB diploma and A level matched data to estimate the effect of undertaking the IB diploma on the student’s outcomes and its statistical significance. All analysis was conducted in R. The PSM was conducted using the MatchIt package (http://cran.r-project.org/web/packages/MatchIt/MatchIt.pdf).
PSM within the student cohort The student cohort included full-time, first year students enrolled at HEPs on a first degree in the UK during the HESA reporting period. There were 11,055 IB diploma students with known background characteristics compared to 773,070 A level students. Prior to matching, the background demographics of the two cohorts of students were very different for several variables; this is shown in Table 21. The proportion of IB diploma students from a higher socio-economic categories, SEC 1-2 background, was larger than the A level students (considerably so for SEC 1). The percentage of

46
students previously at a state school or from a low participation neighbourhood was larger for A level students than for IB diploma students. The majority of students were White within both qualification groups, with a slightly higher proportion in the A level group.
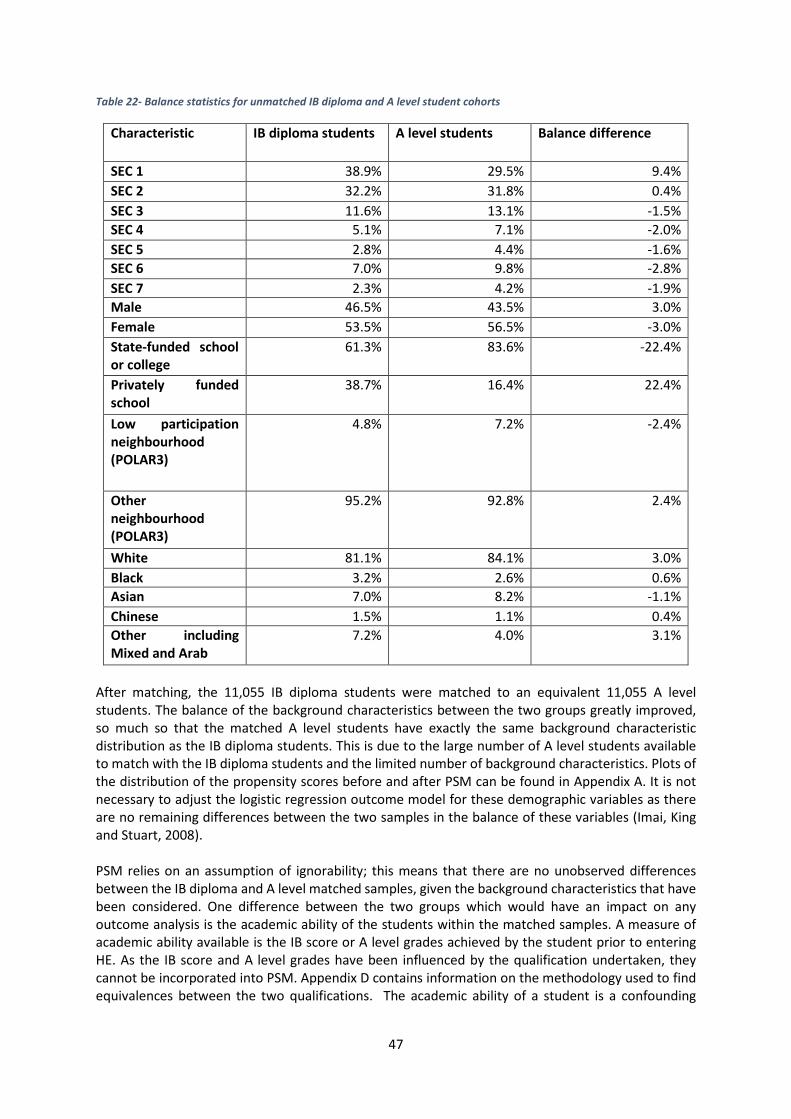
47
Table 22- Balance statistics for unmatched IB diploma and A level student cohorts
Characteristic IB diploma students A level students Balance difference
SEC 1 38.9% 29.5% 9.4% SEC 2 32.2% 31.8% 0.4% SEC 3 11.6% 13.1% -1.5% SEC 4 5.1% 7.1% -2.0% SEC 5 2.8% 4.4% -1.6% SEC 6 7.0% 9.8% -2.8% SEC 7 2.3% 4.2% -1.9% Male 46.5% 43.5% 3.0% Female 53.5% 56.5% -3.0% State-funded school or college
61.3% 83.6% -22.4%
Privately funded school
38.7% 16.4% 22.4%
Low participation neighbourhood (POLAR3)
4.8% 7.2% -2.4%
Other neighbourhood (POLAR3)
95.2% 92.8% 2.4%
White 81.1% 84.1% 3.0% Black 3.2% 2.6% 0.6% Asian 7.0% 8.2% -1.1% Chinese 1.5% 1.1% 0.4% Other including Mixed and Arab
7.2% 4.0% 3.1%
After matching, the 11,055 IB diploma students were matched to an equivalent 11,055 A level students. The balance of the background characteristics between the two groups greatly improved, so much so that the matched A level students have exactly the same background characteristic distribution as the IB diploma students. This is due to the large number of A level students available to match with the IB diploma students and the limited number of background characteristics. Plots of the distribution of the propensity scores before and after PSM can be found in Appendix A. It is not necessary to adjust the logistic regression outcome model for these demographic variables as there are no remaining differences between the two samples in the balance of these variables (Imai, King and Stuart, 2008). PSM relies on an assumption of ignorability; this means that there are no unobserved differences between the IB diploma and A level matched samples, given the background characteristics that have been considered. One difference between the two groups which would have an impact on any outcome analysis is the academic ability of the students within the matched samples. A measure of academic ability available is the IB score or A level grades achieved by the student prior to entering HE. As the IB score and A level grades have been influenced by the qualification undertaken, they cannot be incorporated into PSM. Appendix D contains information on the methodology used to find equivalences between the two qualifications. The academic ability of a student is a confounding
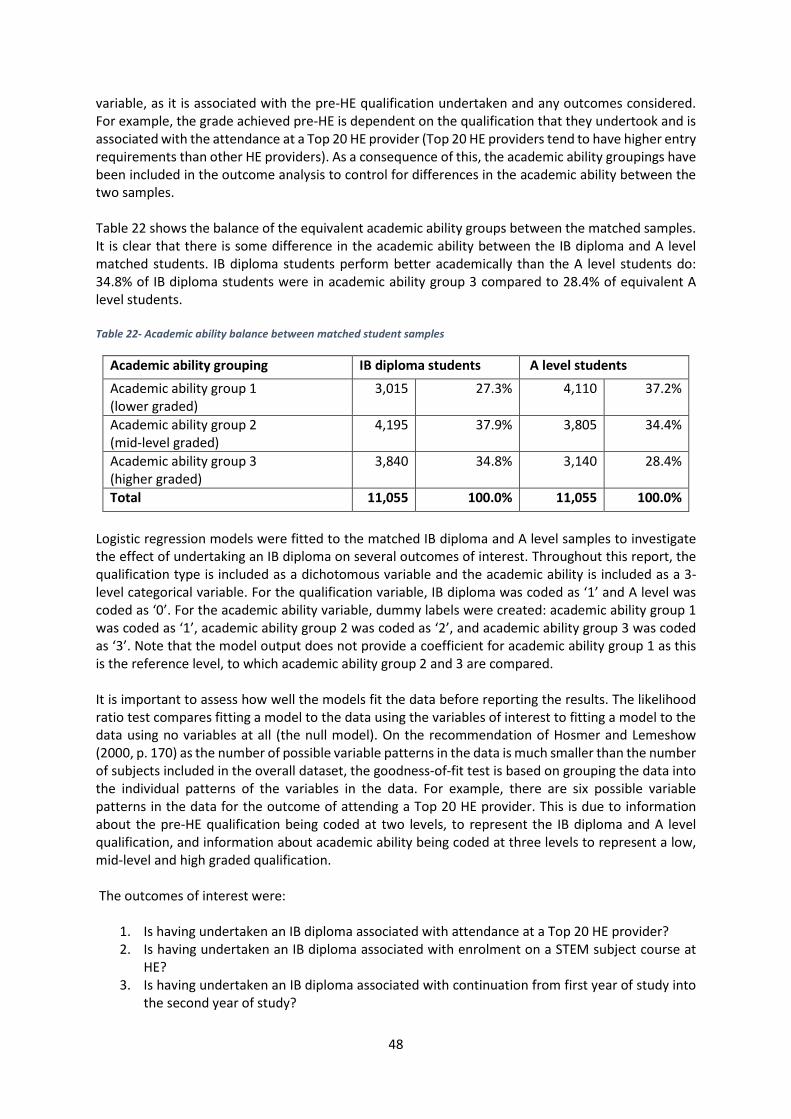
48
variable, as it is associated with the pre-HE qualification undertaken and any outcomes considered. For example, the grade achieved pre-HE is dependent on the qualification that they undertook and is associated with the attendance at a Top 20 HE provider (Top 20 HE providers tend to have higher entry requirements than other HE providers). As a consequence of this, the academic ability groupings have been included in the outcome analysis to control for differences in the academic ability between the two samples. Table 22 shows the balance of the equivalent academic ability groups between the matched samples. It is clear that there is some difference in the academic ability between the IB diploma and A level matched students. IB diploma students perform better academically than the A level students do: 34.8% of IB diploma students were in academic ability group 3 compared to 28.4% of equivalent A level students. Table 22- Academic ability balance between matched student samples
Academic ability grouping IB diploma students A level students Academic ability group 1 (lower graded)
3,015 27.3% 4,110 37.2%
Academic ability group 2 (mid-level graded)
4,195 37.9% 3,805 34.4%
Academic ability group 3 (higher graded)
3,840 34.8% 3,140 28.4%
Total 11,055 100.0% 11,055 100.0%
Logistic regression models were fitted to the matched IB diploma and A level samples to investigate the effect of undertaking an IB diploma on several outcomes of interest. Throughout this report, the qualification type is included as a dichotomous variable and the academic ability is included as a 3-level categorical variable. For the qualification variable, IB diploma was coded as ‘1’ and A level was coded as ‘0’. For the academic ability variable, dummy labels were created: academic ability group 1 was coded as ‘1’, academic ability group 2 was coded as ‘2’, and academic ability group 3 was coded as ‘3’. Note that the model output does not provide a coefficient for academic ability group 1 as this is the reference level, to which academic ability group 2 and 3 are compared. It is important to assess how well the models fit the data before reporting the results. The likelihood ratio test compares fitting a model to the data using the variables of interest to fitting a model to the data using no variables at all (the null model). On the recommendation of Hosmer and Lemeshow (2000, p. 170) as the number of possible variable patterns in the data is much smaller than the number of subjects included in the overall dataset, the goodness-of-fit test is based on grouping the data into the individual patterns of the variables in the data. For example, there are six possible variable patterns in the data for the outcome of attending a Top 20 HE provider. This is due to information about the pre-HE qualification being coded at two levels, to represent the IB diploma and A level qualification, and information about academic ability being coded at three levels to represent a low, mid-level and high graded qualification. The outcomes of interest were:
1. Is having undertaken an IB diploma associated with attendance at a Top 20 HE provider? 2. Is having undertaken an IB diploma associated with enrolment on a STEM subject course at
HE? 3. Is having undertaken an IB diploma associated with continuation from first year of study into
the second year of study?
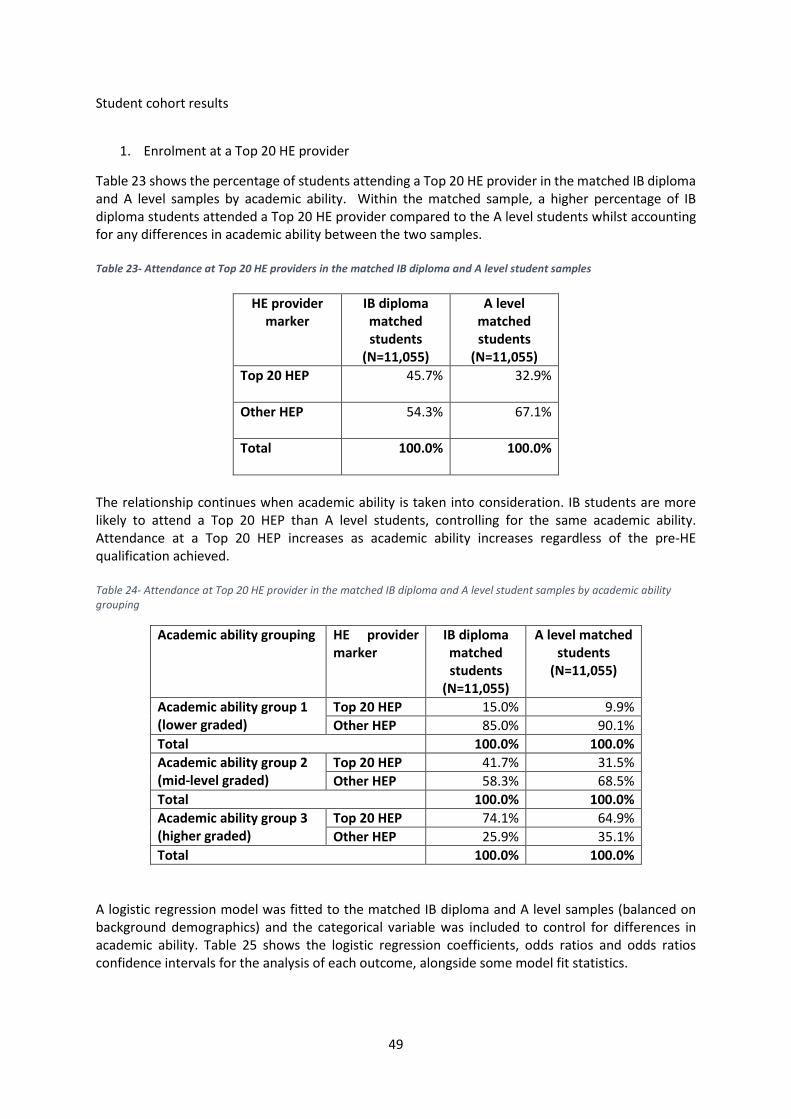
49
Student cohort results
1. Enrolment at a Top 20 HE provider
Table 23 shows the percentage of students attending a Top 20 HE provider in the matched IB diploma and A level samples by academic ability. Within the matched sample, a higher percentage of IB diploma students attended a Top 20 HE provider compared to the A level students whilst accounting for any differences in academic ability between the two samples. Table 23- Attendance at Top 20 HE providers in the matched IB diploma and A level student samples
HE provider marker
IB diploma matched students
(N=11,055)
A level matched students
(N=11,055) Top 20 HEP 45.7% 32.9%
Other HEP 54.3% 67.1%
Total 100.0% 100.0%
The relationship continues when academic ability is taken into consideration. IB students are more likely to attend a Top 20 HEP than A level students, controlling for the same academic ability. Attendance at a Top 20 HEP increases as academic ability increases regardless of the pre-HE qualification achieved. Table 24- Attendance at Top 20 HE provider in the matched IB diploma and A level student samples by academic ability grouping
Academic ability grouping HE provider marker
IB diploma matched students
(N=11,055)
A level matched students
(N=11,055)
Academic ability group 1 (lower graded)
Top 20 HEP 15.0% 9.9% Other HEP 85.0% 90.1%
Total 100.0% 100.0% Academic ability group 2 (mid-level graded)
Top 20 HEP 41.7% 31.5% Other HEP 58.3% 68.5%
Total 100.0% 100.0% Academic ability group 3 (higher graded)
Top 20 HEP 74.1% 64.9% Other HEP 25.9% 35.1%
Total 100.0% 100.0% A logistic regression model was fitted to the matched IB diploma and A level samples (balanced on background demographics) and the categorical variable was included to control for differences in academic ability. Table 25 shows the logistic regression coefficients, odds ratios and odds ratios confidence intervals for the analysis of each outcome, alongside some model fit statistics.
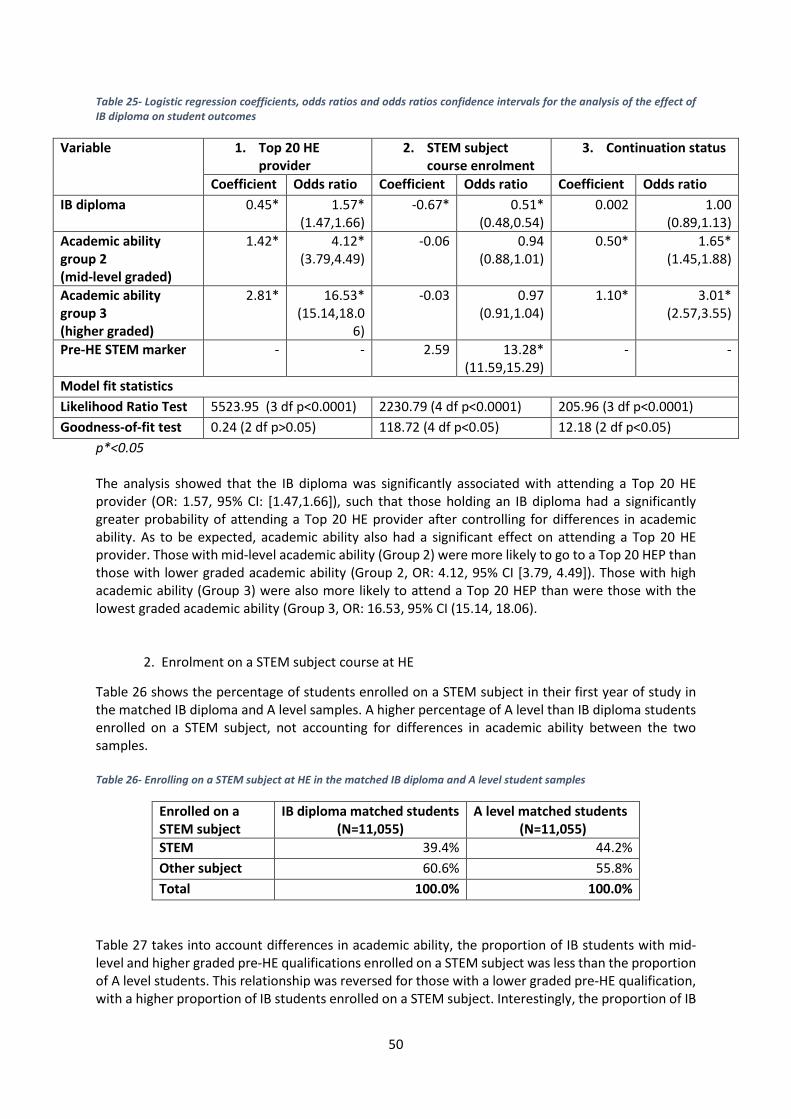
50
Table 25- Logistic regression coefficients, odds ratios and odds ratios confidence intervals for the analysis of the effect of IB diploma on student outcomes
Variable 1. Top 20 HE provider
2. STEM subject course enrolment
3. Continuation status
Coefficient Odds ratio Coefficient Odds ratio Coefficient Odds ratio IB diploma 0.45* 1.57*
(1.47,1.66) -0.67* 0.51*
(0.48,0.54) 0.002 1.00
(0.89,1.13) Academic ability group 2 (mid-level graded)
1.42* 4.12* (3.79,4.49)
-0.06 0.94 (0.88,1.01)
0.50* 1.65* (1.45,1.88)
Academic ability group 3 (higher graded)
2.81* 16.53* (15.14,18.0
6)
-0.03 0.97 (0.91,1.04)
1.10* 3.01* (2.57,3.55)
Pre-HE STEM marker - - 2.59 13.28* (11.59,15.29)
- -
Model fit statistics Likelihood Ratio Test 5523.95 (3 df p<0.0001) 2230.79 (4 df p<0.0001) 205.96 (3 df p<0.0001) Goodness-of-fit test 0.24 (2 df p>0.05) 118.72 (4 df p<0.05) 12.18 (2 df p<0.05)
p*<0.05 The analysis showed that the IB diploma was significantly associated with attending a Top 20 HE provider (OR: 1.57, 95% CI: [1.47,1.66]), such that those holding an IB diploma had a significantly greater probability of attending a Top 20 HE provider after controlling for differences in academic ability. As to be expected, academic ability also had a significant effect on attending a Top 20 HE provider. Those with mid-level academic ability (Group 2) were more likely to go to a Top 20 HEP than those with lower graded academic ability (Group 2, OR: 4.12, 95% CI [3.79, 4.49]). Those with high academic ability (Group 3) were also more likely to attend a Top 20 HEP than were those with the lowest graded academic ability (Group 3, OR: 16.53, 95% CI (15.14, 18.06).
2. Enrolment on a STEM subject course at HE
Table 26 shows the percentage of students enrolled on a STEM subject in their first year of study in the matched IB diploma and A level samples. A higher percentage of A level than IB diploma students enrolled on a STEM subject, not accounting for differences in academic ability between the two samples. Table 26- Enrolling on a STEM subject at HE in the matched IB diploma and A level student samples
Enrolled on a STEM subject
IB diploma matched students (N=11,055)
A level matched students (N=11,055)
STEM 39.4% 44.2% Other subject 60.6% 55.8% Total 100.0% 100.0%
Table 27 takes into account differences in academic ability, the proportion of IB students with mid-level and higher graded pre-HE qualifications enrolled on a STEM subject was less than the proportion of A level students. This relationship was reversed for those with a lower graded pre-HE qualification, with a higher proportion of IB students enrolled on a STEM subject. Interestingly, the proportion of IB
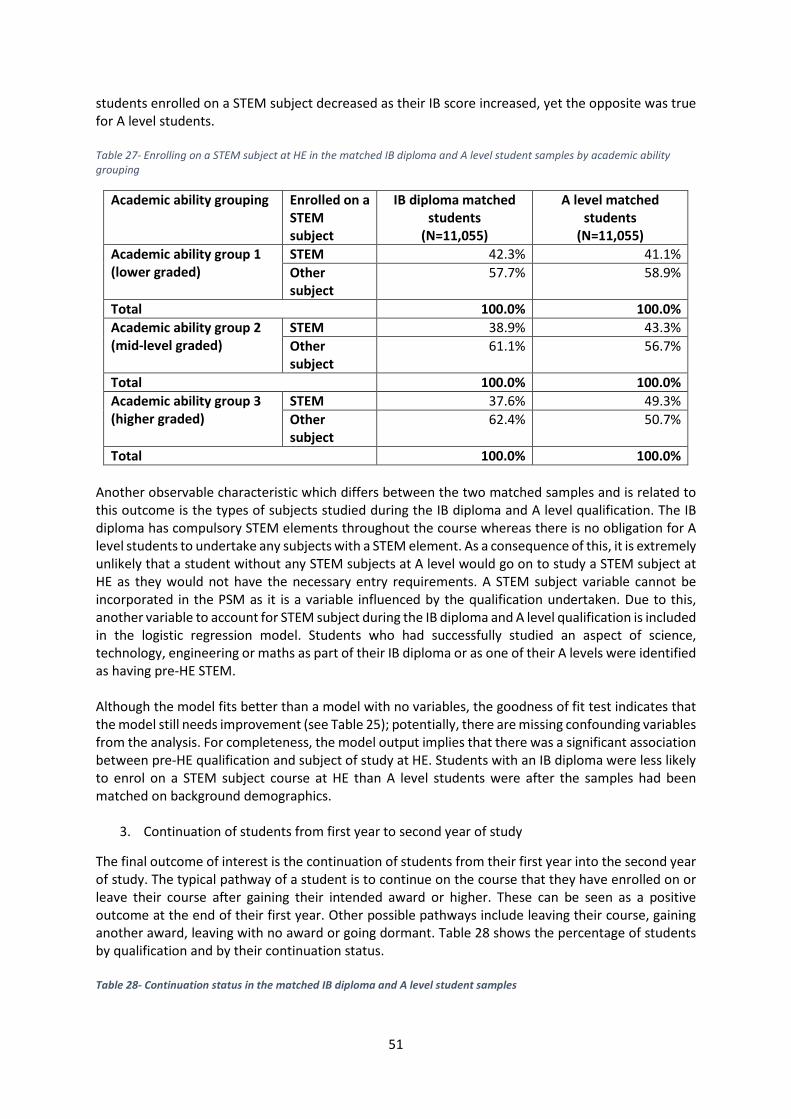
51
students enrolled on a STEM subject decreased as their IB score increased, yet the opposite was true for A level students. Table 27- Enrolling on a STEM subject at HE in the matched IB diploma and A level student samples by academic ability grouping
Academic ability grouping Enrolled on a STEM subject
IB diploma matched students
(N=11,055)
A level matched students
(N=11,055) Academic ability group 1 (lower graded)
STEM 42.3% 41.1% Other subject
57.7% 58.9%
Total 100.0% 100.0% Academic ability group 2 (mid-level graded)
STEM 38.9% 43.3% Other subject
61.1% 56.7%
Total 100.0% 100.0% Academic ability group 3 (higher graded)
STEM 37.6% 49.3% Other subject
62.4% 50.7%
Total 100.0% 100.0% Another observable characteristic which differs between the two matched samples and is related to this outcome is the types of subjects studied during the IB diploma and A level qualification. The IB diploma has compulsory STEM elements throughout the course whereas there is no obligation for A level students to undertake any subjects with a STEM element. As a consequence of this, it is extremely unlikely that a student without any STEM subjects at A level would go on to study a STEM subject at HE as they would not have the necessary entry requirements. A STEM subject variable cannot be incorporated in the PSM as it is a variable influenced by the qualification undertaken. Due to this, another variable to account for STEM subject during the IB diploma and A level qualification is included in the logistic regression model. Students who had successfully studied an aspect of science, technology, engineering or maths as part of their IB diploma or as one of their A levels were identified as having pre-HE STEM. Although the model fits better than a model with no variables, the goodness of fit test indicates that the model still needs improvement (see Table 25); potentially, there are missing confounding variables from the analysis. For completeness, the model output implies that there was a significant association between pre-HE qualification and subject of study at HE. Students with an IB diploma were less likely to enrol on a STEM subject course at HE than A level students were after the samples had been matched on background demographics.
3. Continuation of students from first year to second year of study
The final outcome of interest is the continuation of students from their first year into the second year of study. The typical pathway of a student is to continue on the course that they have enrolled on or leave their course after gaining their intended award or higher. These can be seen as a positive outcome at the end of their first year. Other possible pathways include leaving their course, gaining another award, leaving with no award or going dormant. Table 28 shows the percentage of students by qualification and by their continuation status. Table 28- Continuation status in the matched IB diploma and A level student samples
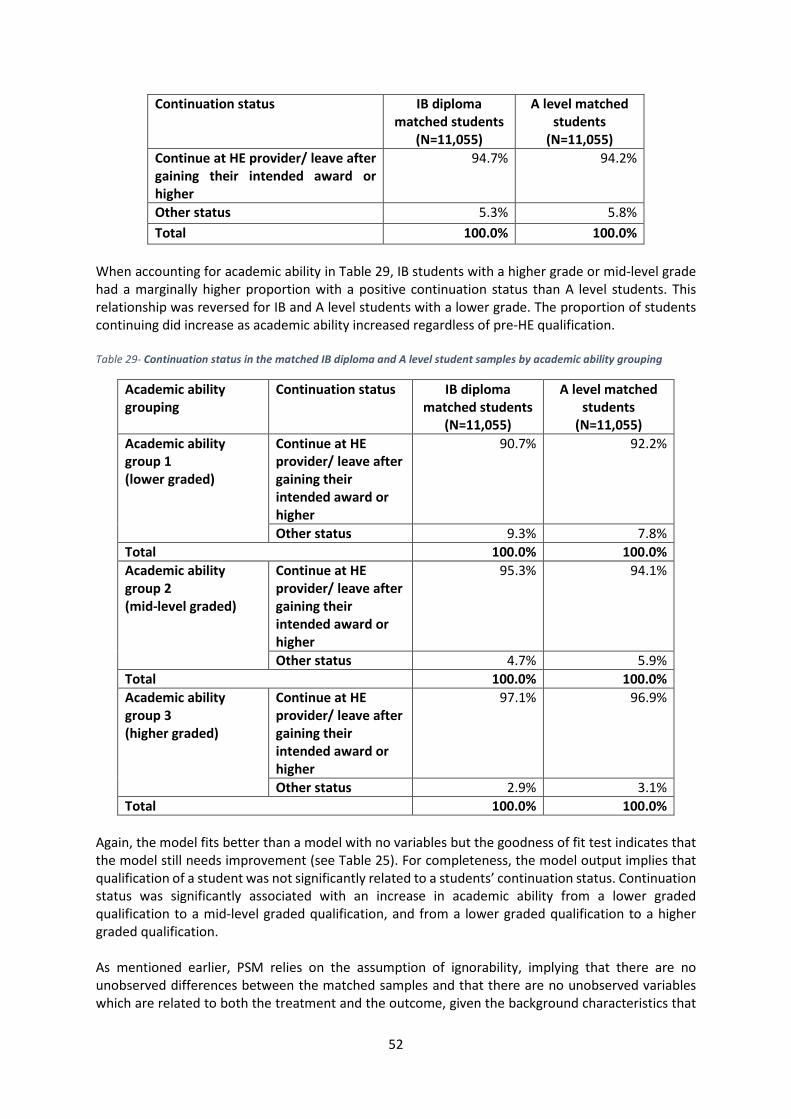
52
Continuation status
IB diploma matched students
(N=11,055)
A level matched students
(N=11,055) Continue at HE provider/ leave after gaining their intended award or higher
94.7% 94.2%
Other status 5.3% 5.8% Total 100.0% 100.0%
When accounting for academic ability in Table 29, IB students with a higher grade or mid-level grade had a marginally higher proportion with a positive continuation status than A level students. This relationship was reversed for IB and A level students with a lower grade. The proportion of students continuing did increase as academic ability increased regardless of pre-HE qualification. Table 29- Continuation status in the matched IB diploma and A level student samples by academic ability grouping
Academic ability grouping
Continuation status
IB diploma matched students
(N=11,055)
A level matched students
(N=11,055) Academic ability group 1 (lower graded)
Continue at HE provider/ leave after gaining their intended award or higher
90.7% 92.2%
Other status 9.3% 7.8% Total 100.0% 100.0% Academic ability group 2 (mid-level graded)
Continue at HE provider/ leave after gaining their intended award or higher
95.3% 94.1%
Other status 4.7% 5.9% Total 100.0% 100.0% Academic ability group 3 (higher graded)
Continue at HE provider/ leave after gaining their intended award or higher
97.1% 96.9%
Other status 2.9% 3.1% Total 100.0% 100.0%
Again, the model fits better than a model with no variables but the goodness of fit test indicates that the model still needs improvement (see Table 25). For completeness, the model output implies that qualification of a student was not significantly related to a students’ continuation status. Continuation status was significantly associated with an increase in academic ability from a lower graded qualification to a mid-level graded qualification, and from a lower graded qualification to a higher graded qualification. As mentioned earlier, PSM relies on the assumption of ignorability, implying that there are no unobserved differences between the matched samples and that there are no unobserved variables which are related to both the treatment and the outcome, given the background characteristics that
53
have been considered. If a variable of this type existed, it would violate the assumption of ignorability and lead to biased significant treatment effects. In a randomised control trial, this is not an issue as a student (from a large comparable group) is randomly assigned a pre-HE qualification to study, and so they would have the same probability of studying either an IB or an A level. Consequently, the groups of students are comparable if the only difference between them is the pre-HE qualification they are studying and the effect of this pre-HE qualification on the outcome can be estimated (Rosenbaum, 2005a). As this report is a retrospective, observational study, the students have not been randomly assigned a pre-HE qualification and PSM has been used to create comparable groups of students based on a selection of their background characteristics. Note that there are limited background variables that have been measured on the IB diploma and A level students, so it is likely that there are other variables which could have been measured and included which would alter a students’ propensity score and thus improve PSM. An example of this could be a student’s work ethic. Even though the students have been matched on some background characteristics, if a student’s work ethic increases the odds of them being assigned the IB qualification over the A level qualification, then it may have an impact on the outcomes of interest. This is a variable that has not been measured and is not accounted, for but it obviously violates our assumption of ignorability. Rosenbaum bounds is a method to assess the sensitivity of PSM to the presence of any unobserved differences in the matched samples that were not accounted for in PSM. This was implemented using the rbounds package in R (http://cran.r-project.org/web/packages/rbounds/rbounds.pdf). The sensitivity analysis uses a sensitivity parameter, Γ (gamma). If there is no difference in which pre-HE qualification is assigned, everyone would have the same odds of being assigned the IB or A level qualification. Even if the students do not differ on the background variables we examined, there may still be an unobserved variable which increases the odds for a student to be assigned, say, the IB qualification over the A level. If Γ=2, then one student may be twice as likely as another to receive the IB qualification than the A level due to an unobserved variable. The Rosenbaum bounds sensitivity analysis examines how big Γ can be before conclusions from our study change. Γ is unknown and so several values are used to see when the inference changes. Rosenbaum (2005b) indicates that if Γ is larger than 1 then the study is highly sensitive to hidden bias and is insensitive to change for large values of Γ. Table 30 shows the results of the Rosenbaum bounds. An asterisk represents a Γ that does not affect the inference from the analysis. For example, if Γ=2 has an asterisk, it implies that the unobserved variable causes the student to be twice as likely to be assigned the IB qualification over the A level qualification, but this does not change the conclusions of the analysis.
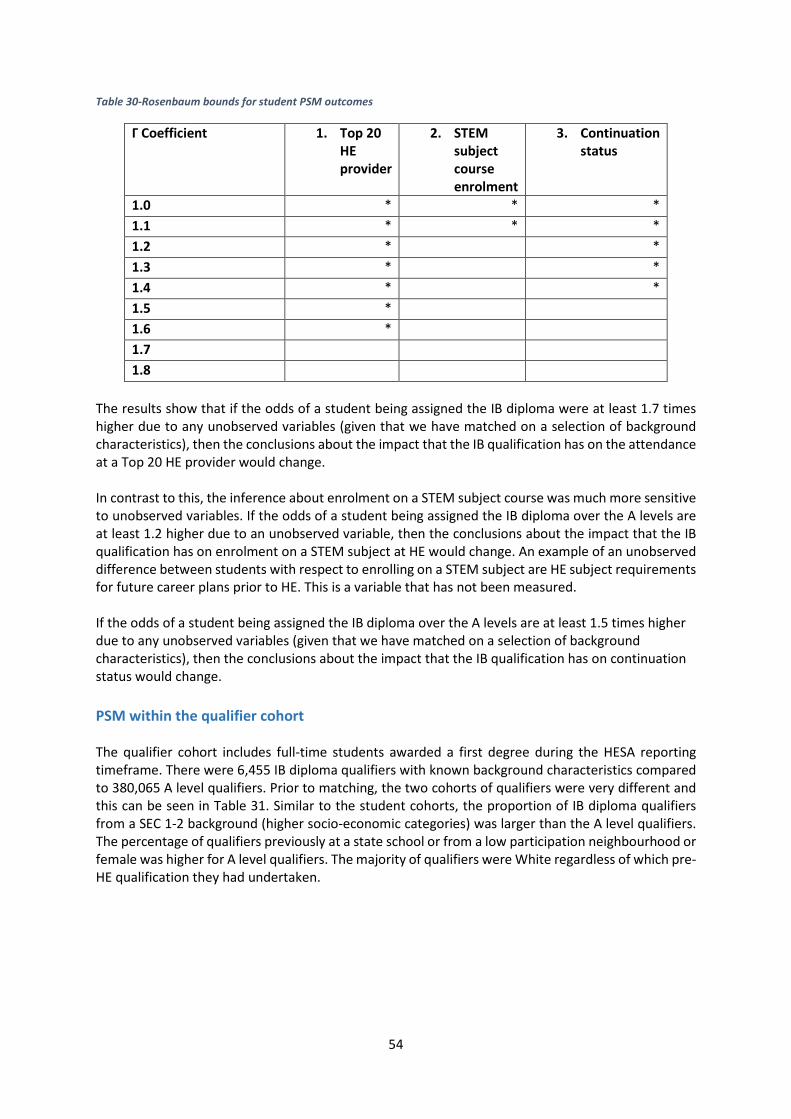
54
Table 30-Rosenbaum bounds for student PSM outcomes
Γ Coefficient 1. Top 20 HE provider
2. STEM subject course enrolment
3. Continuation status
1.0 * * * 1.1 * * * 1.2 * * 1.3 * * 1.4 * * 1.5 * 1.6 * 1.7 1.8
The results show that if the odds of a student being assigned the IB diploma were at least 1.7 times higher due to any unobserved variables (given that we have matched on a selection of background characteristics), then the conclusions about the impact that the IB qualification has on the attendance at a Top 20 HE provider would change. In contrast to this, the inference about enrolment on a STEM subject course was much more sensitive to unobserved variables. If the odds of a student being assigned the IB diploma over the A levels are at least 1.2 higher due to an unobserved variable, then the conclusions about the impact that the IB qualification has on enrolment on a STEM subject at HE would change. An example of an unobserved difference between students with respect to enrolling on a STEM subject are HE subject requirements for future career plans prior to HE. This is a variable that has not been measured. If the odds of a student being assigned the IB diploma over the A levels are at least 1.5 times higher due to any unobserved variables (given that we have matched on a selection of background characteristics), then the conclusions about the impact that the IB qualification has on continuation status would change. PSM within the qualifier cohort The qualifier cohort includes full-time students awarded a first degree during the HESA reporting timeframe. There were 6,455 IB diploma qualifiers with known background characteristics compared to 380,065 A level qualifiers. Prior to matching, the two cohorts of qualifiers were very different and this can be seen in Table 31. Similar to the student cohorts, the proportion of IB diploma qualifiers from a SEC 1-2 background (higher socio-economic categories) was larger than the A level qualifiers. The percentage of qualifiers previously at a state school or from a low participation neighbourhood or female was higher for A level qualifiers. The majority of qualifiers were White regardless of which pre-HE qualification they had undertaken.
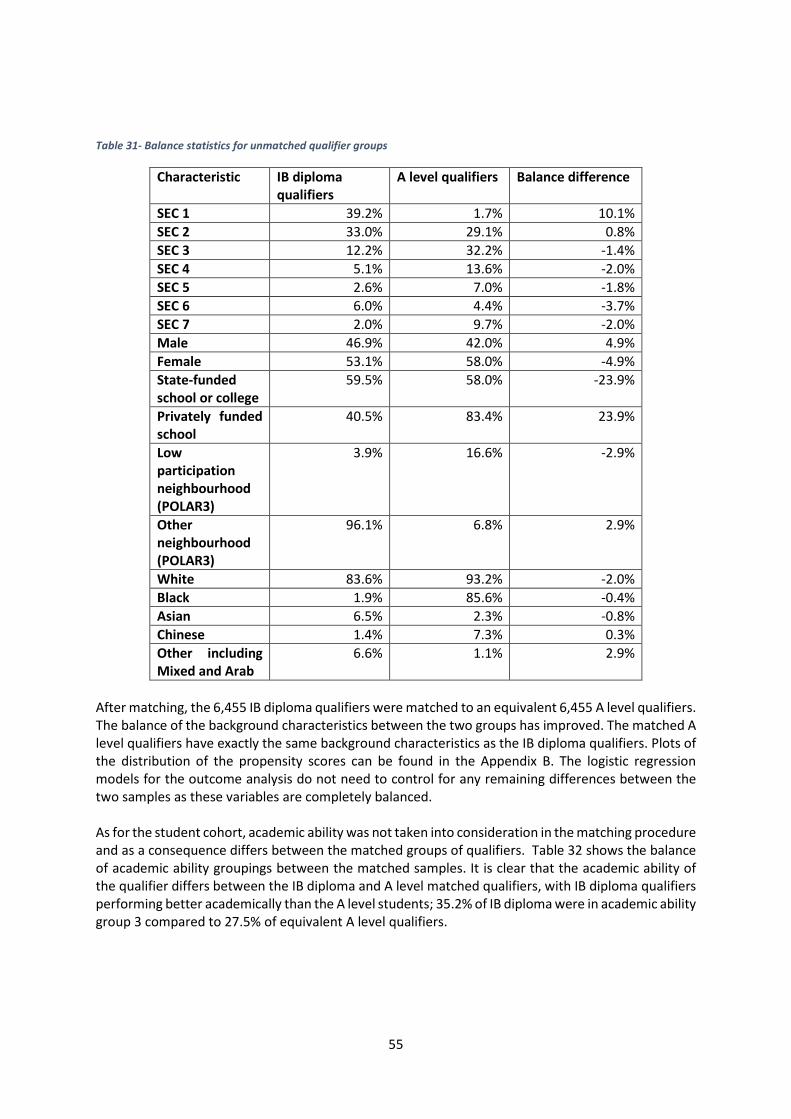
55
Table 31- Balance statistics for unmatched qualifier groups
Characteristic IB diploma qualifiers
A level qualifiers Balance difference
SEC 1 39.2% 1.7% 10.1% SEC 2 33.0% 29.1% 0.8% SEC 3 12.2% 32.2% -1.4% SEC 4 5.1% 13.6% -2.0% SEC 5 2.6% 7.0% -1.8% SEC 6 6.0% 4.4% -3.7% SEC 7 2.0% 9.7% -2.0% Male 46.9% 42.0% 4.9% Female 53.1% 58.0% -4.9% State-funded school or college
59.5% 58.0% -23.9%
Privately funded school
40.5% 83.4% 23.9%
Low participation neighbourhood (POLAR3)
3.9% 16.6% -2.9%
Other neighbourhood (POLAR3)
96.1% 6.8% 2.9%
White 83.6% 93.2% -2.0% Black 1.9% 85.6% -0.4% Asian 6.5% 2.3% -0.8% Chinese 1.4% 7.3% 0.3% Other including Mixed and Arab
6.6% 1.1% 2.9%
After matching, the 6,455 IB diploma qualifiers were matched to an equivalent 6,455 A level qualifiers. The balance of the background characteristics between the two groups has improved. The matched A level qualifiers have exactly the same background characteristics as the IB diploma qualifiers. Plots of the distribution of the propensity scores can be found in the Appendix B. The logistic regression models for the outcome analysis do not need to control for any remaining differences between the two samples as these variables are completely balanced. As for the student cohort, academic ability was not taken into consideration in the matching procedure and as a consequence differs between the matched groups of qualifiers. Table 32 shows the balance of academic ability groupings between the matched samples. It is clear that the academic ability of the qualifier differs between the IB diploma and A level matched qualifiers, with IB diploma qualifiers performing better academically than the A level students; 35.2% of IB diploma were in academic ability group 3 compared to 27.5% of equivalent A level qualifiers.
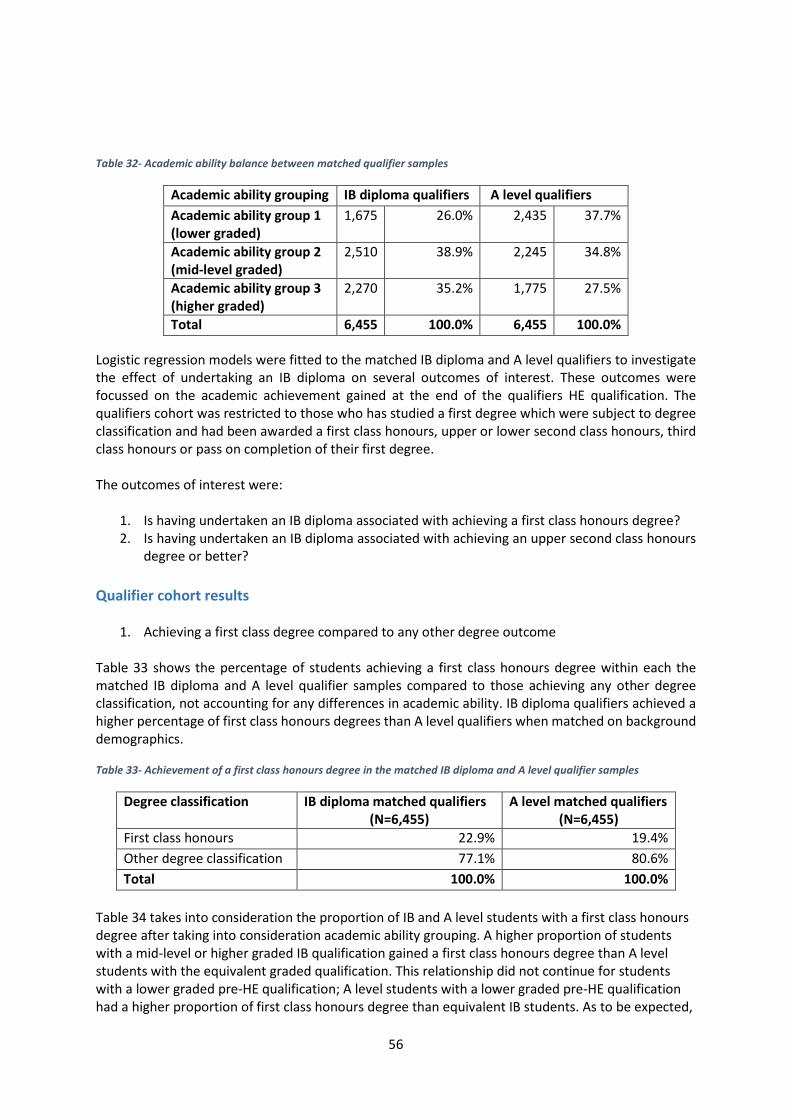
56
Table 32- Academic ability balance between matched qualifier samples
Academic ability grouping IB diploma qualifiers A level qualifiers Academic ability group 1 (lower graded)
1,675 26.0% 2,435 37.7%
Academic ability group 2 (mid-level graded)
2,510 38.9% 2,245 34.8%
Academic ability group 3 (higher graded)
2,270 35.2% 1,775 27.5%
Total 6,455 100.0% 6,455 100.0% Logistic regression models were fitted to the matched IB diploma and A level qualifiers to investigate the effect of undertaking an IB diploma on several outcomes of interest. These outcomes were focussed on the academic achievement gained at the end of the qualifiers HE qualification. The qualifiers cohort was restricted to those who has studied a first degree which were subject to degree classification and had been awarded a first class honours, upper or lower second class honours, third class honours or pass on completion of their first degree. The outcomes of interest were:
1. Is having undertaken an IB diploma associated with achieving a first class honours degree? 2. Is having undertaken an IB diploma associated with achieving an upper second class honours
degree or better?
Qualifier cohort results
1. Achieving a first class degree compared to any other degree outcome
Table 33 shows the percentage of students achieving a first class honours degree within each the matched IB diploma and A level qualifier samples compared to those achieving any other degree classification, not accounting for any differences in academic ability. IB diploma qualifiers achieved a higher percentage of first class honours degrees than A level qualifiers when matched on background demographics. Table 33- Achievement of a first class honours degree in the matched IB diploma and A level qualifier samples
Degree classification IB diploma matched qualifiers (N=6,455)
A level matched qualifiers (N=6,455)
First class honours 22.9% 19.4% Other degree classification 77.1% 80.6% Total 100.0% 100.0%
Table 34 takes into consideration the proportion of IB and A level students with a first class honours degree after taking into consideration academic ability grouping. A higher proportion of students with a mid-level or higher graded IB qualification gained a first class honours degree than A level students with the equivalent graded qualification. This relationship did not continue for students with a lower graded pre-HE qualification; A level students with a lower graded pre-HE qualification had a higher proportion of first class honours degree than equivalent IB students. As to be expected,
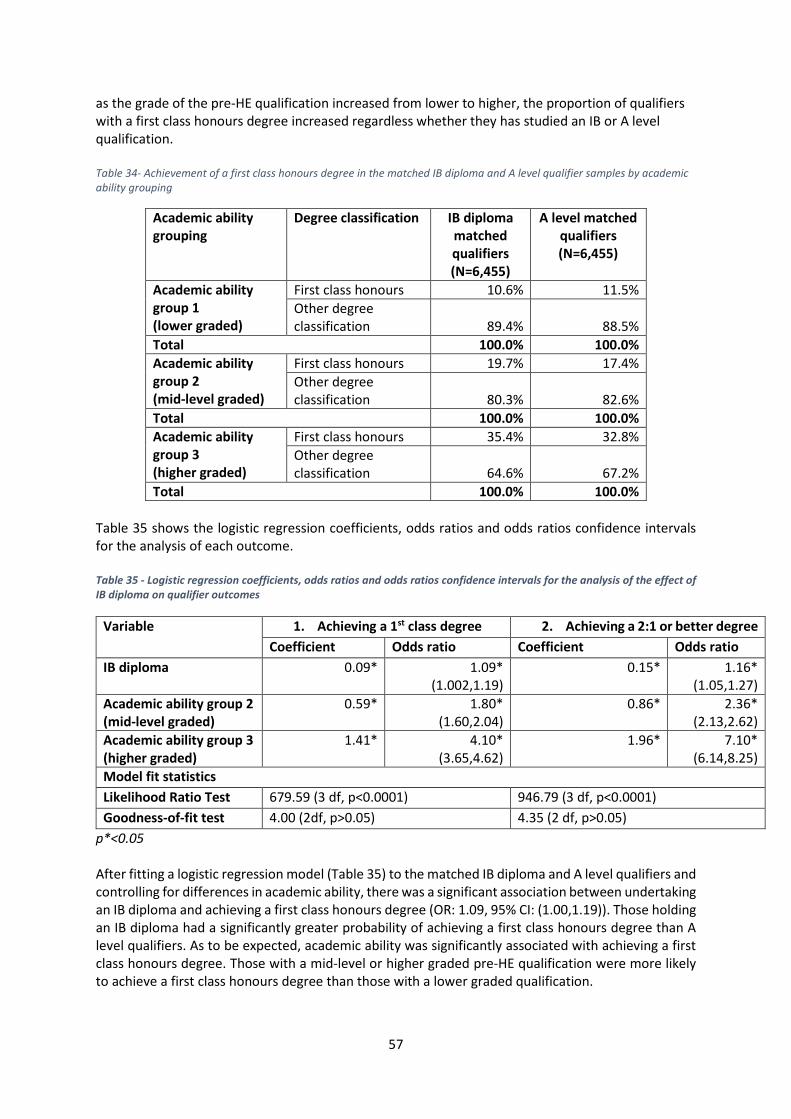
57
as the grade of the pre-HE qualification increased from lower to higher, the proportion of qualifiers with a first class honours degree increased regardless whether they has studied an IB or A level qualification. Table 34- Achievement of a first class honours degree in the matched IB diploma and A level qualifier samples by academic ability grouping
Academic ability grouping
Degree classification IB diploma matched qualifiers (N=6,455)
A level matched qualifiers (N=6,455)
Academic ability group 1 (lower graded)
First class honours 10.6% 11.5% Other degree classification 89.4% 88.5%
Total 100.0% 100.0% Academic ability group 2 (mid-level graded)
First class honours 19.7% 17.4% Other degree classification 80.3% 82.6%
Total 100.0% 100.0% Academic ability group 3 (higher graded)
First class honours 35.4% 32.8% Other degree classification 64.6% 67.2%
Total 100.0% 100.0% Table 35 shows the logistic regression coefficients, odds ratios and odds ratios confidence intervals for the analysis of each outcome. Table 35 - Logistic regression coefficients, odds ratios and odds ratios confidence intervals for the analysis of the effect of IB diploma on qualifier outcomes
Variable 1. Achieving a 1st class degree 2. Achieving a 2:1 or better degree Coefficient Odds ratio Coefficient Odds ratio
IB diploma 0.09* 1.09* (1.002,1.19)
0.15* 1.16* (1.05,1.27)
Academic ability group 2 (mid-level graded)
0.59* 1.80* (1.60,2.04)
0.86* 2.36* (2.13,2.62)
Academic ability group 3 (higher graded)
1.41* 4.10* (3.65,4.62)
1.96* 7.10* (6.14,8.25)
Model fit statistics Likelihood Ratio Test 679.59 (3 df, p<0.0001) 946.79 (3 df, p<0.0001) Goodness-of-fit test 4.00 (2df, p>0.05) 4.35 (2 df, p>0.05)
p*<0.05 After fitting a logistic regression model (Table 35) to the matched IB diploma and A level qualifiers and controlling for differences in academic ability, there was a significant association between undertaking an IB diploma and achieving a first class honours degree (OR: 1.09, 95% CI: (1.00,1.19)). Those holding an IB diploma had a significantly greater probability of achieving a first class honours degree than A level qualifiers. As to be expected, academic ability was significantly associated with achieving a first class honours degree. Those with a mid-level or higher graded pre-HE qualification were more likely to achieve a first class honours degree than those with a lower graded qualification.
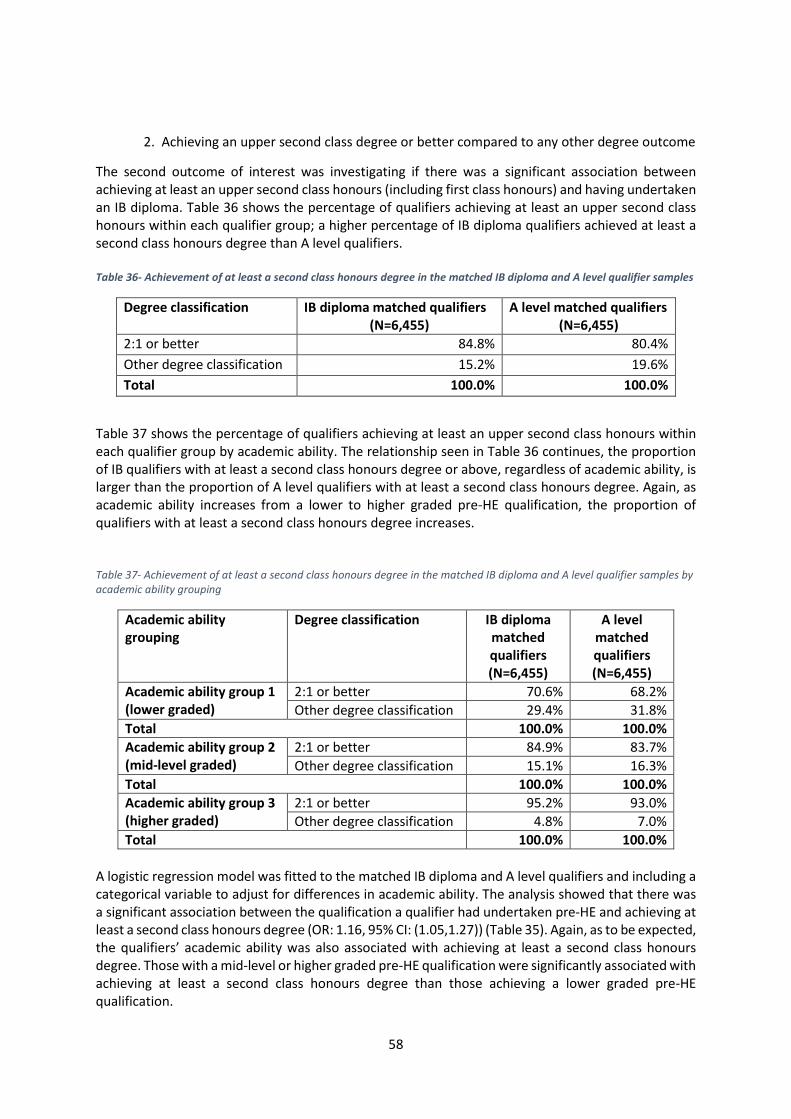
58
2. Achieving an upper second class degree or better compared to any other degree outcome
The second outcome of interest was investigating if there was a significant association between achieving at least an upper second class honours (including first class honours) and having undertaken an IB diploma. Table 36 shows the percentage of qualifiers achieving at least an upper second class honours within each qualifier group; a higher percentage of IB diploma qualifiers achieved at least a second class honours degree than A level qualifiers. Table 36- Achievement of at least a second class honours degree in the matched IB diploma and A level qualifier samples
Degree classification IB diploma matched qualifiers (N=6,455)
A level matched qualifiers (N=6,455)
2:1 or better 84.8% 80.4% Other degree classification 15.2% 19.6% Total 100.0% 100.0%
Table 37 shows the percentage of qualifiers achieving at least an upper second class honours within each qualifier group by academic ability. The relationship seen in Table 36 continues, the proportion of IB qualifiers with at least a second class honours degree or above, regardless of academic ability, is larger than the proportion of A level qualifiers with at least a second class honours degree. Again, as academic ability increases from a lower to higher graded pre-HE qualification, the proportion of qualifiers with at least a second class honours degree increases. Table 37- Achievement of at least a second class honours degree in the matched IB diploma and A level qualifier samples by academic ability grouping
Academic ability grouping
Degree classification IB diploma matched qualifiers (N=6,455)
A level matched qualifiers (N=6,455)
Academic ability group 1 (lower graded)
2:1 or better 70.6% 68.2% Other degree classification 29.4% 31.8%
Total 100.0% 100.0% Academic ability group 2 (mid-level graded)
2:1 or better 84.9% 83.7% Other degree classification 15.1% 16.3%
Total 100.0% 100.0% Academic ability group 3 (higher graded)
2:1 or better 95.2% 93.0% Other degree classification 4.8% 7.0%
Total 100.0% 100.0% A logistic regression model was fitted to the matched IB diploma and A level qualifiers and including a categorical variable to adjust for differences in academic ability. The analysis showed that there was a significant association between the qualification a qualifier had undertaken pre-HE and achieving at least a second class honours degree (OR: 1.16, 95% CI: (1.05,1.27)) (Table 35). Again, as to be expected, the qualifiers’ academic ability was also associated with achieving at least a second class honours degree. Those with a mid-level or higher graded pre-HE qualification were significantly associated with achieving at least a second class honours degree than those achieving a lower graded pre-HE qualification.
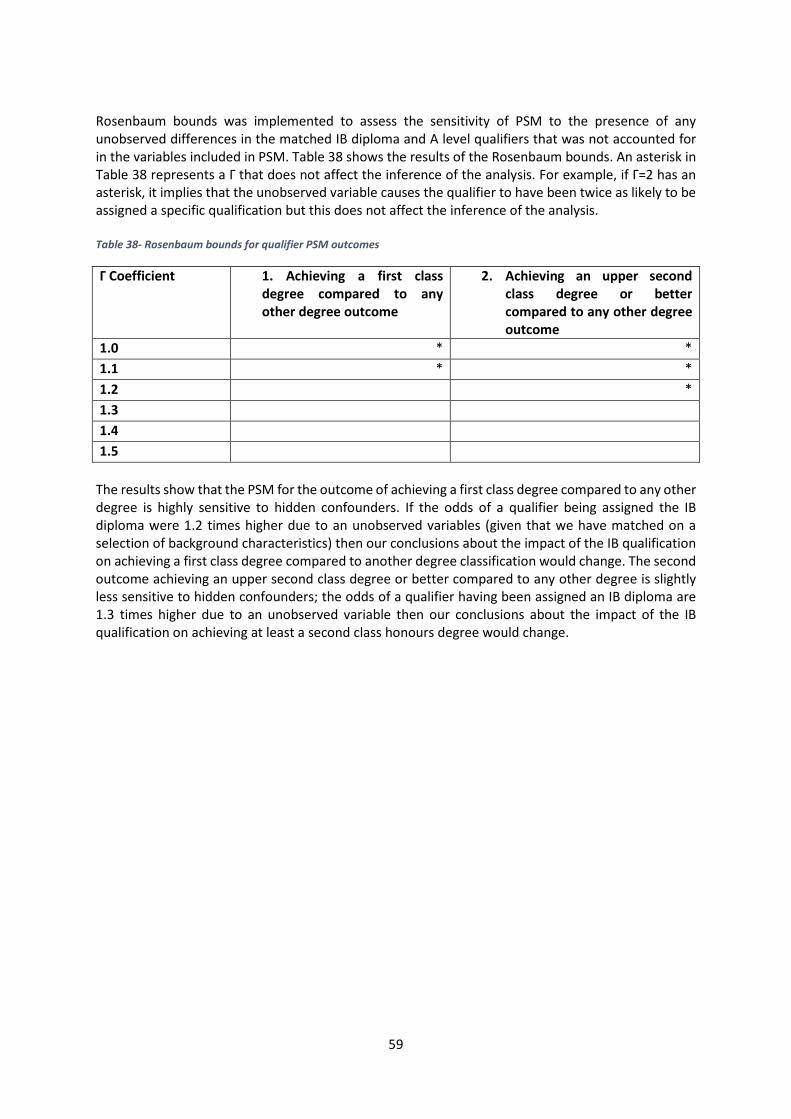
59
Rosenbaum bounds was implemented to assess the sensitivity of PSM to the presence of any unobserved differences in the matched IB diploma and A level qualifiers that was not accounted for in the variables included in PSM. Table 38 shows the results of the Rosenbaum bounds. An asterisk in Table 38 represents a Γ that does not affect the inference of the analysis. For example, if Γ=2 has an asterisk, it implies that the unobserved variable causes the qualifier to have been twice as likely to be assigned a specific qualification but this does not affect the inference of the analysis. Table 38- Rosenbaum bounds for qualifier PSM outcomes Γ Coefficient 1. Achieving a first class
degree compared to any other degree outcome
2. Achieving an upper second class degree or better compared to any other degree outcome
1.0 * * 1.1 * * 1.2 * 1.3 1.4 1.5
The results show that the PSM for the outcome of achieving a first class degree compared to any other degree is highly sensitive to hidden confounders. If the odds of a qualifier being assigned the IB diploma were 1.2 times higher due to an unobserved variables (given that we have matched on a selection of background characteristics) then our conclusions about the impact of the IB qualification on achieving a first class degree compared to another degree classification would change. The second outcome achieving an upper second class degree or better compared to any other degree is slightly less sensitive to hidden confounders; the odds of a qualifier having been assigned an IB diploma are 1.3 times higher due to an unobserved variable then our conclusions about the impact of the IB qualification on achieving at least a second class honours degree would change.
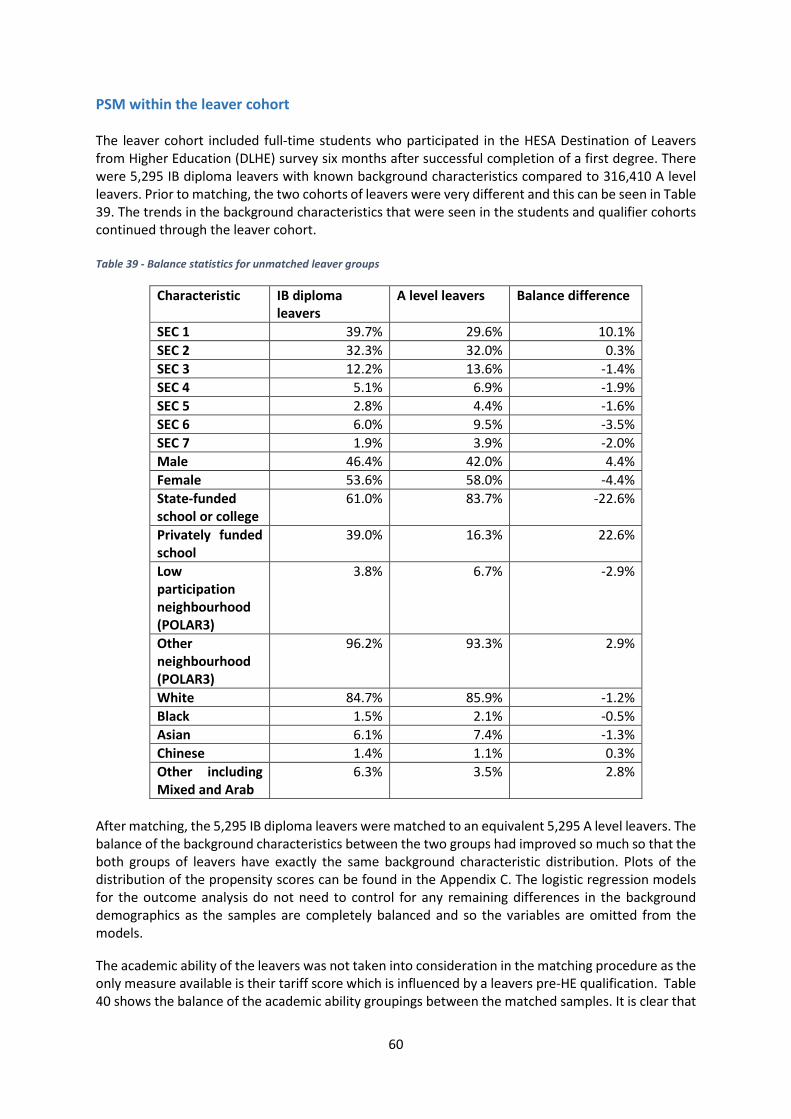
60
PSM within the leaver cohort The leaver cohort included full-time students who participated in the HESA Destination of Leavers from Higher Education (DLHE) survey six months after successful completion of a first degree. There were 5,295 IB diploma leavers with known background characteristics compared to 316,410 A level leavers. Prior to matching, the two cohorts of leavers were very different and this can be seen in Table 39. The trends in the background characteristics that were seen in the students and qualifier cohorts continued through the leaver cohort. Table 39 - Balance statistics for unmatched leaver groups
Characteristic IB diploma leavers
A level leavers Balance difference
SEC 1 39.7% 29.6% 10.1% SEC 2 32.3% 32.0% 0.3% SEC 3 12.2% 13.6% -1.4% SEC 4 5.1% 6.9% -1.9% SEC 5 2.8% 4.4% -1.6% SEC 6 6.0% 9.5% -3.5% SEC 7 1.9% 3.9% -2.0% Male 46.4% 42.0% 4.4% Female 53.6% 58.0% -4.4% State-funded school or college
61.0% 83.7% -22.6%
Privately funded school
39.0% 16.3% 22.6%
Low participation neighbourhood (POLAR3)
3.8% 6.7% -2.9%
Other neighbourhood (POLAR3)
96.2% 93.3% 2.9%
White 84.7% 85.9% -1.2% Black 1.5% 2.1% -0.5% Asian 6.1% 7.4% -1.3% Chinese 1.4% 1.1% 0.3% Other including Mixed and Arab
6.3% 3.5% 2.8%
After matching, the 5,295 IB diploma leavers were matched to an equivalent 5,295 A level leavers. The balance of the background characteristics between the two groups had improved so much so that the both groups of leavers have exactly the same background characteristic distribution. Plots of the distribution of the propensity scores can be found in the Appendix C. The logistic regression models for the outcome analysis do not need to control for any remaining differences in the background demographics as the samples are completely balanced and so the variables are omitted from the models. The academic ability of the leavers was not taken into consideration in the matching procedure as the only measure available is their tariff score which is influenced by a leavers pre-HE qualification. Table 40 shows the balance of the academic ability groupings between the matched samples. It is clear that
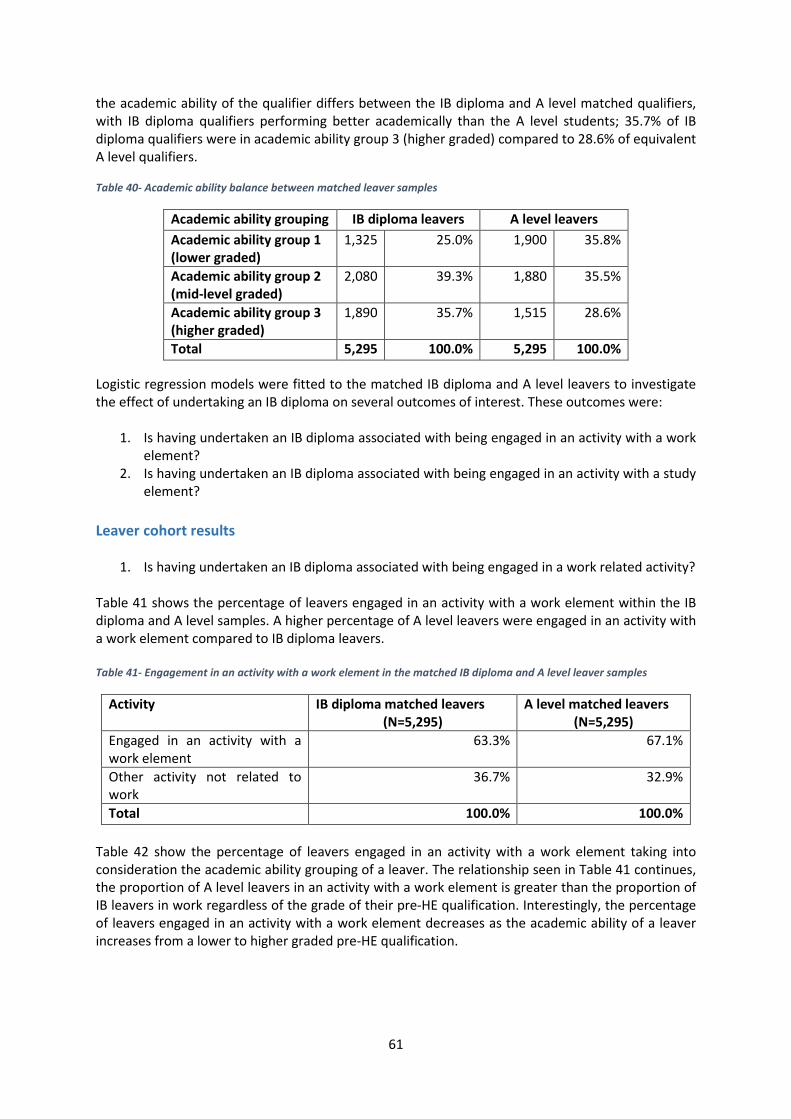
61
the academic ability of the qualifier differs between the IB diploma and A level matched qualifiers, with IB diploma qualifiers performing better academically than the A level students; 35.7% of IB diploma qualifiers were in academic ability group 3 (higher graded) compared to 28.6% of equivalent A level qualifiers. Table 40- Academic ability balance between matched leaver samples
Academic ability grouping IB diploma leavers A level leavers Academic ability group 1 (lower graded)
1,325 25.0% 1,900 35.8%
Academic ability group 2 (mid-level graded)
2,080 39.3% 1,880 35.5%
Academic ability group 3 (higher graded)
1,890 35.7% 1,515 28.6%
Total 5,295 100.0% 5,295 100.0% Logistic regression models were fitted to the matched IB diploma and A level leavers to investigate the effect of undertaking an IB diploma on several outcomes of interest. These outcomes were:
1. Is having undertaken an IB diploma associated with being engaged in an activity with a work element?
2. Is having undertaken an IB diploma associated with being engaged in an activity with a study element?
Leaver cohort results
1. Is having undertaken an IB diploma associated with being engaged in a work related activity? Table 41 shows the percentage of leavers engaged in an activity with a work element within the IB diploma and A level samples. A higher percentage of A level leavers were engaged in an activity with a work element compared to IB diploma leavers. Table 41- Engagement in an activity with a work element in the matched IB diploma and A level leaver samples
Activity IB diploma matched leavers (N=5,295)
A level matched leavers (N=5,295)
Engaged in an activity with a work element
63.3% 67.1%
Other activity not related to work
36.7% 32.9%
Total 100.0% 100.0% Table 42 show the percentage of leavers engaged in an activity with a work element taking into consideration the academic ability grouping of a leaver. The relationship seen in Table 41 continues, the proportion of A level leavers in an activity with a work element is greater than the proportion of IB leavers in work regardless of the grade of their pre-HE qualification. Interestingly, the percentage of leavers engaged in an activity with a work element decreases as the academic ability of a leaver increases from a lower to higher graded pre-HE qualification.
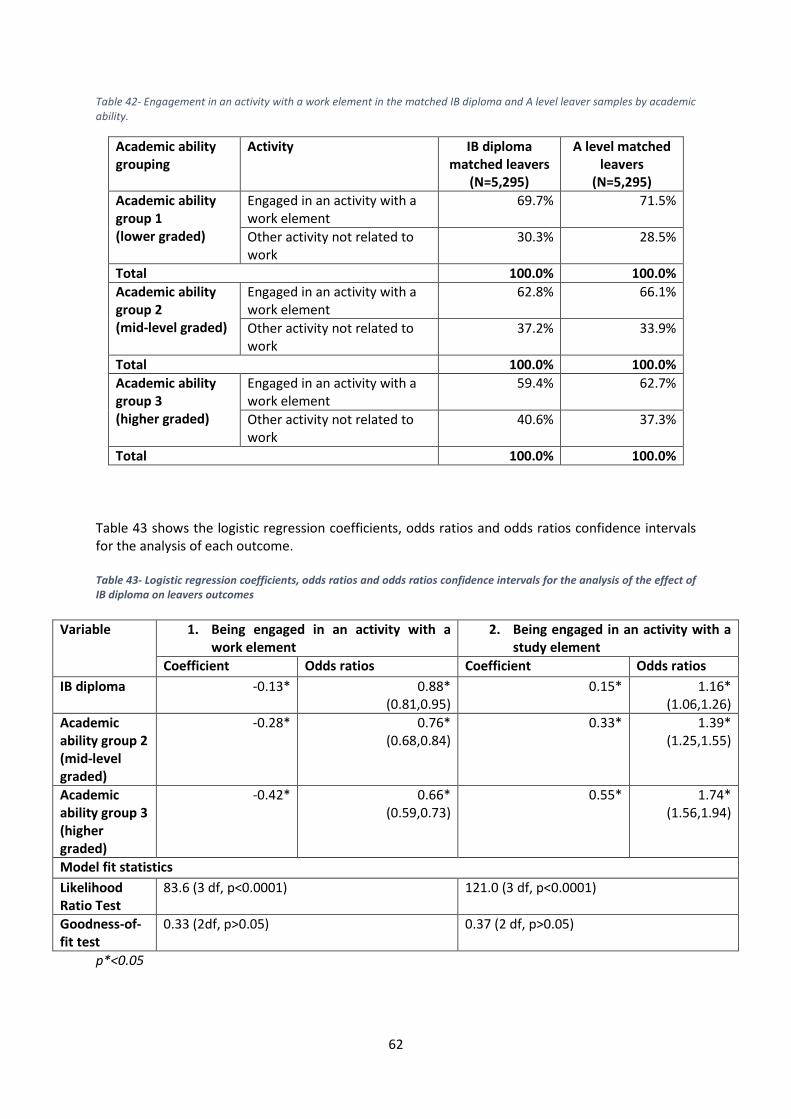
62
Table 42- Engagement in an activity with a work element in the matched IB diploma and A level leaver samples by academic ability.
Academic ability grouping
Activity IB diploma matched leavers
(N=5,295)
A level matched leavers
(N=5,295) Academic ability group 1 (lower graded)
Engaged in an activity with a work element
69.7% 71.5%
Other activity not related to work
30.3% 28.5%
Total 100.0% 100.0% Academic ability group 2 (mid-level graded)
Engaged in an activity with a work element
62.8% 66.1%
Other activity not related to work
37.2% 33.9%
Total 100.0% 100.0% Academic ability group 3 (higher graded)
Engaged in an activity with a work element
59.4% 62.7%
Other activity not related to work
40.6% 37.3%
Total 100.0% 100.0% Table 43 shows the logistic regression coefficients, odds ratios and odds ratios confidence intervals for the analysis of each outcome.
Table 43- Logistic regression coefficients, odds ratios and odds ratios confidence intervals for the analysis of the effect of IB diploma on leavers outcomes
Variable 1. Being engaged in an activity with a work element
2. Being engaged in an activity with a study element
Coefficient Odds ratios Coefficient Odds ratios IB diploma -0.13* 0.88*
(0.81,0.95) 0.15* 1.16*
(1.06,1.26) Academic ability group 2 (mid-level graded)
-0.28* 0.76* (0.68,0.84)
0.33* 1.39* (1.25,1.55)
Academic ability group 3 (higher graded)
-0.42* 0.66* (0.59,0.73)
0.55* 1.74* (1.56,1.94)
Model fit statistics Likelihood Ratio Test
83.6 (3 df, p<0.0001) 121.0 (3 df, p<0.0001)
Goodness-of-fit test
0.33 (2df, p>0.05) 0.37 (2 df, p>0.05)
p*<0.05
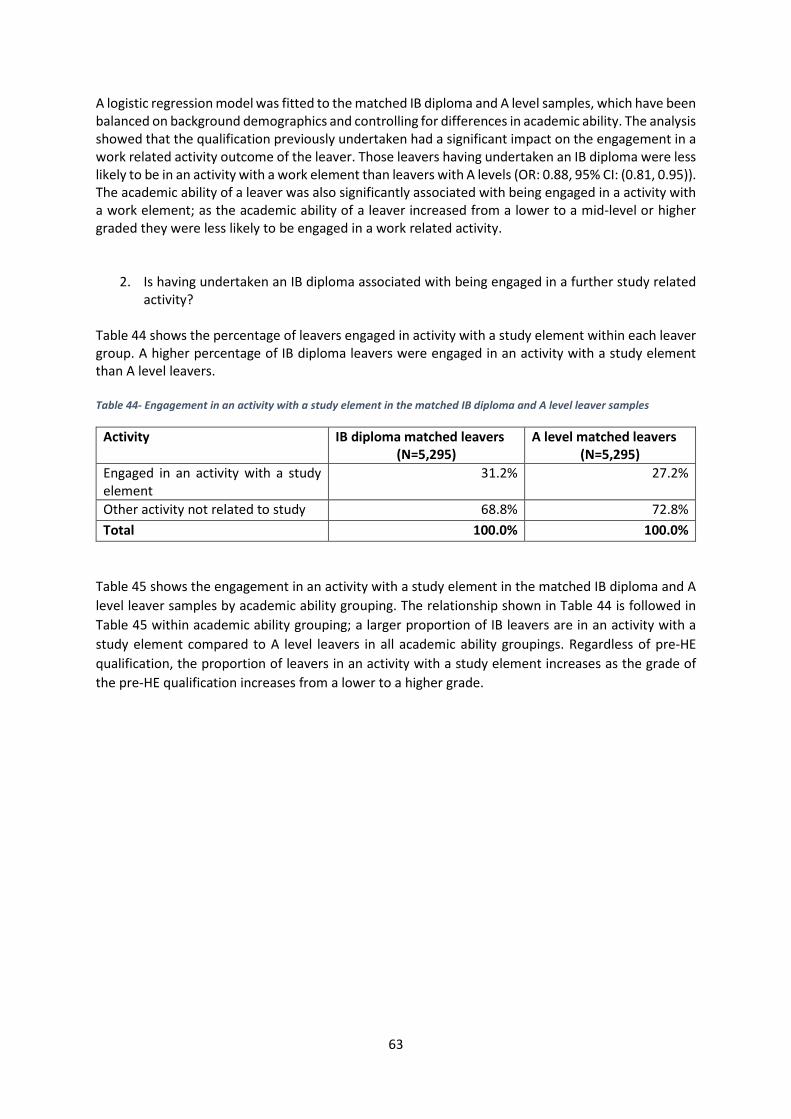
63
A logistic regression model was fitted to the matched IB diploma and A level samples, which have been balanced on background demographics and controlling for differences in academic ability. The analysis showed that the qualification previously undertaken had a significant impact on the engagement in a work related activity outcome of the leaver. Those leavers having undertaken an IB diploma were less likely to be in an activity with a work element than leavers with A levels (OR: 0.88, 95% CI: (0.81, 0.95)). The academic ability of a leaver was also significantly associated with being engaged in a activity with a work element; as the academic ability of a leaver increased from a lower to a mid-level or higher graded they were less likely to be engaged in a work related activity.
2. Is having undertaken an IB diploma associated with being engaged in a further study related activity?
Table 44 shows the percentage of leavers engaged in activity with a study element within each leaver group. A higher percentage of IB diploma leavers were engaged in an activity with a study element than A level leavers. Table 44- Engagement in an activity with a study element in the matched IB diploma and A level leaver samples
Activity IB diploma matched leavers (N=5,295)
A level matched leavers (N=5,295)
Engaged in an activity with a study element
31.2% 27.2%
Other activity not related to study 68.8% 72.8% Total 100.0% 100.0%
Table 45 shows the engagement in an activity with a study element in the matched IB diploma and A level leaver samples by academic ability grouping. The relationship shown in Table 44 is followed in Table 45 within academic ability grouping; a larger proportion of IB leavers are in an activity with a study element compared to A level leavers in all academic ability groupings. Regardless of pre-HE qualification, the proportion of leavers in an activity with a study element increases as the grade of the pre-HE qualification increases from a lower to a higher grade.
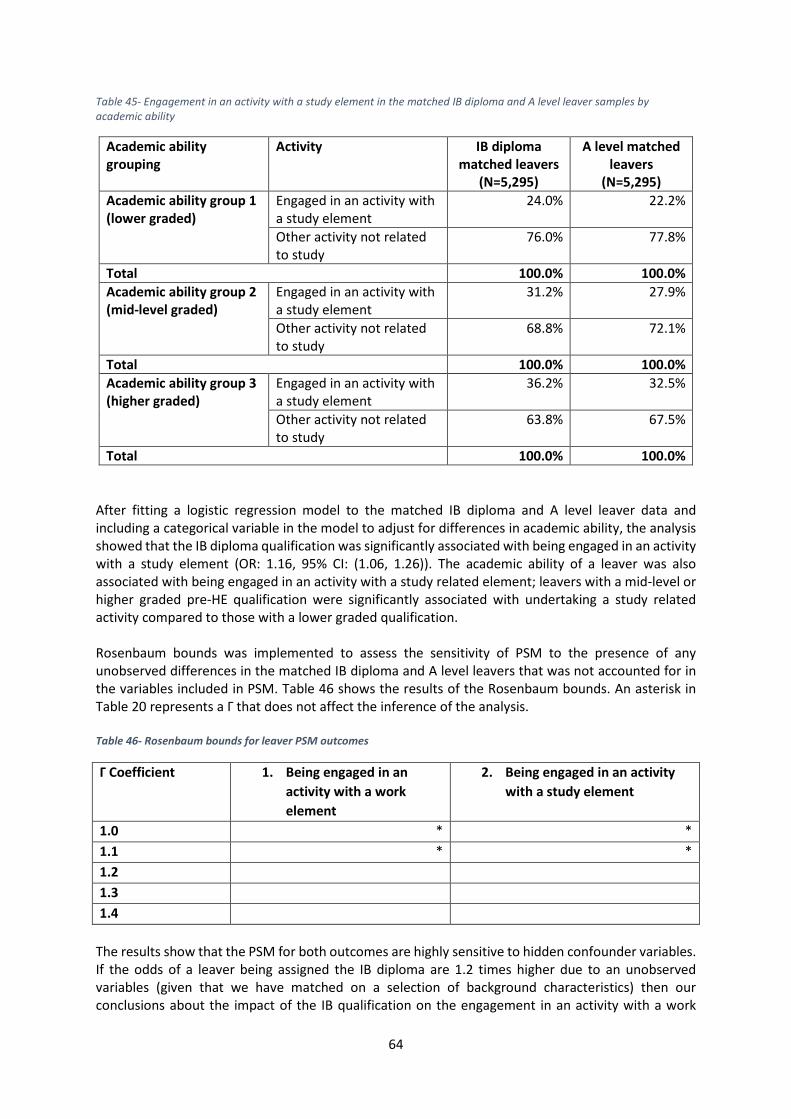
64
Table 45- Engagement in an activity with a study element in the matched IB diploma and A level leaver samples by academic ability
Academic ability grouping
Activity IB diploma matched leavers
(N=5,295)
A level matched leavers
(N=5,295) Academic ability group 1 (lower graded)
Engaged in an activity with a study element
24.0% 22.2%
Other activity not related to study
76.0% 77.8%
Total 100.0% 100.0% Academic ability group 2 (mid-level graded)
Engaged in an activity with a study element
31.2% 27.9%
Other activity not related to study
68.8% 72.1%
Total 100.0% 100.0% Academic ability group 3 (higher graded)
Engaged in an activity with a study element
36.2% 32.5%
Other activity not related to study
63.8% 67.5%
Total 100.0% 100.0% After fitting a logistic regression model to the matched IB diploma and A level leaver data and including a categorical variable in the model to adjust for differences in academic ability, the analysis showed that the IB diploma qualification was significantly associated with being engaged in an activity with a study element (OR: 1.16, 95% CI: (1.06, 1.26)). The academic ability of a leaver was also associated with being engaged in an activity with a study related element; leavers with a mid-level or higher graded pre-HE qualification were significantly associated with undertaking a study related activity compared to those with a lower graded qualification. Rosenbaum bounds was implemented to assess the sensitivity of PSM to the presence of any unobserved differences in the matched IB diploma and A level leavers that was not accounted for in the variables included in PSM. Table 46 shows the results of the Rosenbaum bounds. An asterisk in Table 20 represents a Γ that does not affect the inference of the analysis. Table 46- Rosenbaum bounds for leaver PSM outcomes Γ Coefficient 1. Being engaged in an
activity with a work element
2. Being engaged in an activity with a study element
1.0 * * 1.1 * * 1.2 1.3 1.4
The results show that the PSM for both outcomes are highly sensitive to hidden confounder variables. If the odds of a leaver being assigned the IB diploma are 1.2 times higher due to an unobserved variables (given that we have matched on a selection of background characteristics) then our conclusions about the impact of the IB qualification on the engagement in an activity with a work

65
element would change. If the odds of a leaver being assigned the IB diploma are 1.2 times higher due to an unobserved variables (given that we have matched on a selection of background characteristics) then our conclusions about the impact of the IB qualification on the engagement in an activity with a study element would change.
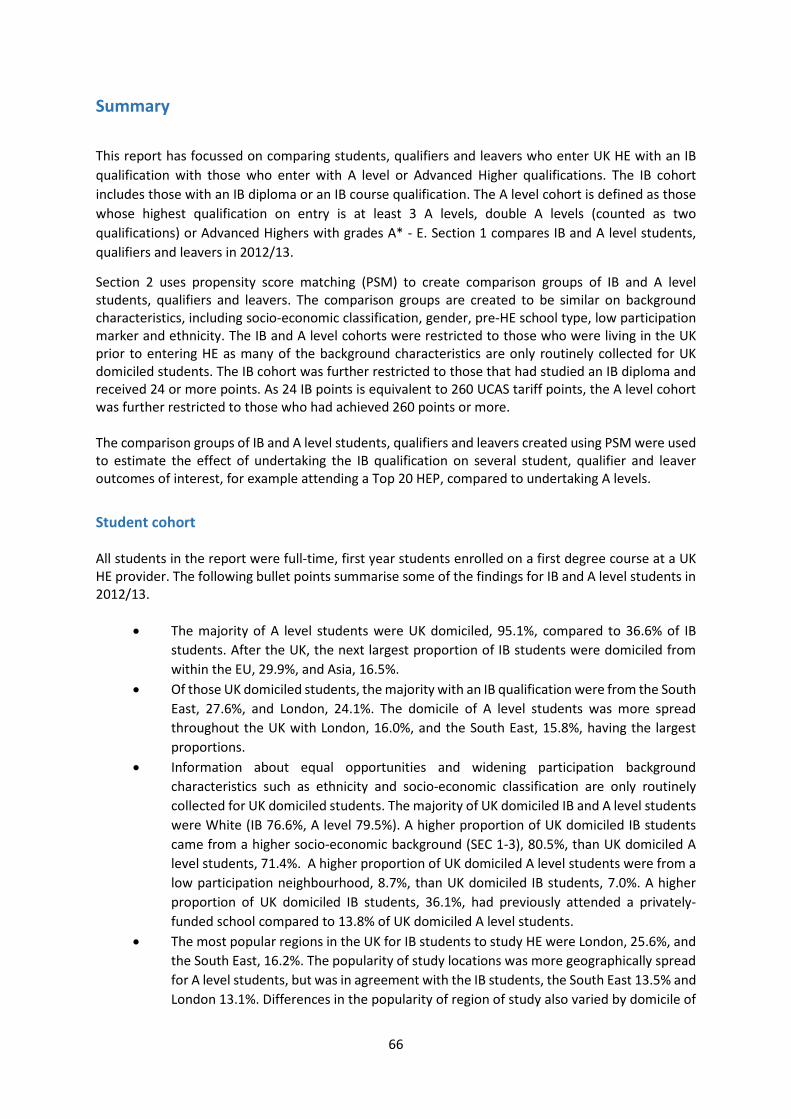
66
Summary
This report has focussed on comparing students, qualifiers and leavers who enter UK HE with an IB qualification with those who enter with A level or Advanced Higher qualifications. The IB cohort includes those with an IB diploma or an IB course qualification. The A level cohort is defined as those whose highest qualification on entry is at least 3 A levels, double A levels (counted as two qualifications) or Advanced Highers with grades A* - E. Section 1 compares IB and A level students, qualifiers and leavers in 2012/13.
Section 2 uses propensity score matching (PSM) to create comparison groups of IB and A level students, qualifiers and leavers. The comparison groups are created to be similar on background characteristics, including socio-economic classification, gender, pre-HE school type, low participation marker and ethnicity. The IB and A level cohorts were restricted to those who were living in the UK prior to entering HE as many of the background characteristics are only routinely collected for UK domiciled students. The IB cohort was further restricted to those that had studied an IB diploma and received 24 or more points. As 24 IB points is equivalent to 260 UCAS tariff points, the A level cohort was further restricted to those who had achieved 260 points or more. The comparison groups of IB and A level students, qualifiers and leavers created using PSM were used to estimate the effect of undertaking the IB qualification on several student, qualifier and leaver outcomes of interest, for example attending a Top 20 HEP, compared to undertaking A levels. Student cohort All students in the report were full-time, first year students enrolled on a first degree course at a UK HE provider. The following bullet points summarise some of the findings for IB and A level students in 2012/13.
• The majority of A level students were UK domiciled, 95.1%, compared to 36.6% of IB students. After the UK, the next largest proportion of IB students were domiciled from within the EU, 29.9%, and Asia, 16.5%.
• Of those UK domiciled students, the majority with an IB qualification were from the South East, 27.6%, and London, 24.1%. The domicile of A level students was more spread throughout the UK with London, 16.0%, and the South East, 15.8%, having the largest proportions.
• Information about equal opportunities and widening participation background characteristics such as ethnicity and socio-economic classification are only routinely collected for UK domiciled students. The majority of UK domiciled IB and A level students were White (IB 76.6%, A level 79.5%). A higher proportion of UK domiciled IB students came from a higher socio-economic background (SEC 1-3), 80.5%, than UK domiciled A level students, 71.4%. A higher proportion of UK domiciled A level students were from a low participation neighbourhood, 8.7%, than UK domiciled IB students, 7.0%. A higher proportion of UK domiciled IB students, 36.1%, had previously attended a privately-funded school compared to 13.8% of UK domiciled A level students.
• The most popular regions in the UK for IB students to study HE were London, 25.6%, and the South East, 16.2%. The popularity of study locations was more geographically spread for A level students, but was in agreement with the IB students, the South East 13.5% and London 13.1%. Differences in the popularity of region of study also varied by domicile of
67
the IB students, notable difference was the popularity of studying at HEPs in Scotland, UK domiciled 6.2%, EU domiciled 19.6% and Non-EU domiciled 9.5%.
• A higher proportion of IB diploma students attended a Top 20 HEP, 40.1%, compared to 23.7% A level students and 17.0% IB course students. As to be expected, as pre-HE academic achievement improved (either by an increase in IB points or tariff points) the proportion of students attending a Top 20 HEP increased for both IB and A level students.
• The most popular subject of study for IB diploma students were Social Studies, 14.8%, and Business & administrative studies, 14.6%. The most popular subject of study for A level students were Biological sciences, 11.9%, and Social studies, 10.5%. The most popular subject of study for IB course students were Business & administrative studies, 24.7%, and Creative Arts and Design, 17.0%. A higher proportion of A level students studied a STEM subject, 44.8%, than IB diploma students, 39.1%, and IB course students, 25.7%.
• The continuation from first to second year or qualification at the same HE provider of IB diploma students, 93.2%, and A level students, 92.8%, were similar. This was greater than for the IB course students, 84.5%.
Propensity score matching in student cohort • Outcomes of interest for investigation in the matched IB and A level student samples
were enrolment at a Top 20 HEP, enrolment on a STEM subject course at HE and continuation of students from first to second year of study. Differences in academic ability between the IB and A level students had not been accounted for in the propensity score matching and would impact on the effect on the outcome, so this was taken into consideration in the follow-up analysis (a confounding variable). Logistic regression models were fitted to the IB and A level student matched samples to investigate the effect of studying an IB qualification compared to an A level pre-HE on each of the outcomes of interest whilst adjusting for any differences in academic ability.
• The results showed that enrolment at a Top 20 HEP was significantly associated with having studied an IB diploma (OR: 1.57, 95% CI:(1.47,1.66)). As to be expected, academic ability was also significantly associated with attendance at a Top 20 HEP as academic ability increased.
• The second outcome of interest was enrolment on a STEM subject course at HE. A higher proportion of A level students were enrolled on a STEM subject course at HE than IB diploma students.
• The third outcome of interest was if the student had continued from first to second year or left after gaining their intended award or higher compared to another status. The proportion of IB diploma and A level students continuing or leaving after gaining their award or higher were similar.
Qualifiers cohort All qualifiers in the report had successfully completed a full-time, first degree course at a UK HE provider. The following bullet points summarise some of the findings for IB and A level qualifiers in 2012/13.
• The proportion of IB qualifiers who achieved a first class honours degree was higher for IB diploma qualifiers, 24.4%, than A level qualifiers, 20.7%. Both IB and A level qualifiers achieved a higher proportion of first class honours degrees than IB course qualifiers, 18.4%. The proportion of IB diploma and A level qualifiers achieving an upper second class honours degree was similar (IB diploma 56.4%, A level 56.9%).
68
• IB qualifiers achieved a higher percentage of first class honours degrees than A level qualifiers in all subjects except Architecture, building & planning, Law, Business & administrative studies, and Creative Art & design.
• As to be expected, as academic achievement increased (increase in IB points and UCAS tariff score) the percentage of qualifiers achieving a first class honours degree increased in both qualifications.
Propensity score matching in qualifiers cohort
• Outcomes of interest for investigation in the matched IB and A level qualifier samples were achieving a first class honours degree and achieving at least an upper second class honours degree or better. Differences in academic ability between the IB and A level students had not been accounted for in the propensity score matching and would impact on the effect on the outcome, so this was taken into consideration in the follow-up analysis (a confounding variable). Logistic regression models were fitted to the IB and A level qualifier matched samples to investigate the effect of studying an IB qualification compared to an A level pre-HE on each of the outcomes of interest whilst adjusting for any differences in academic ability.
• The results showed that achieving a first class honours degree was significantly associated with having studied an IB diploma (OR: 1.09, 95% CI: (1.00,1.19)). As to be expected, academic ability was also significantly associated with achieving a first class honours degree as academic ability increased.
• The second outcome of interest showed that achieving at least a second class honours degree was significantly associated with having studied an IB diploma (OR: 1.16, 95% CI:(1.05,1.27)). As to be expected, academic ability was also significantly associated with achieving at least an upper second class honours degree as academic ability increased.
Leaver cohort All leavers in the report had successfully completed a full-time, first degree course at a UK HE provider and had completed the HESA Destinations of Leavers from Higher Education (DLHE) survey 6 months later. The following bullet points summarise some of the findings for IB and A level leavers in 2012/13.
• The proportion of A level leavers in work, 67.3%, was higher than the proportion of IB diploma leavers in work, 51.9%, and IB course leavers, 62.5% in work.
• The proportion of IB diploma leavers in further study, 30.1%, was higher than the proportion of A level leavers in further study, 15.6%, and IB course leavers in further study, 20.3%.
• Of those in further study, the majority of all leavers were enrolled on a higher degree by taught course; the highest proportion of which was IB course leavers, 75.0%, followed by IB diploma leavers, 60.7% and A level leavers, 42.1%. A higher percentage of A level leavers were enrolled on a Postgraduate diploma or certificate, 22.4%, than IB diploma leavers, 9.3%.
• Of those in work by industry type, IB diploma leavers were more likely to be employed in Professional, scientific and technical activities, 18.3%, or Human health and social work activities (14.6%). A level leavers were more likely to be employed in Wholesale and retail trade; repair of motor vehicles and motorcycles, 15.6%, or Human health and social work activities, 14.5%.
69
• Of those in work by occupation type, the percentages were similar between IB and A level leavers across all of the occupation types, with the exception of Associate professional and technical occupations (IB diploma 33.4%, A level 28.9%) and Sales and customer service occupations (IB diploma 7.1%, A level 11.6%).
• The median salary for IB diploma leavers was £21,000, for IB course leavers was £20,000 and for A level leavers was £20,000.
• IB diploma leavers had a higher or equal median salary across all subject areas than A level leavers.
• The greatest differences between median salaries of IB diploma and A level leavers were seen in Mathematical Sciences (IB diploma £30,000, A level £22,000) and Computer science (IB diploma £30,000, A level £22,500).
Propensity score matching in leaver cohort
• Outcomes of interest for investigation in the matched IB and A level qualifier samples were engagement in an activity with a work element and engagement in an activity with a study element.
• The results showed that those having studied an IB diploma were less likely to be engaged in an activity with a work element than A level leavers (OR: 0.88, 95% CI: (0.81:0.95)).
• The results showed that being engaged in an activity with a study element was significantly associated with the IB qualification (OR: 1.16, 95% CI: (1.06, 1.26)). As to be expected, academic ability was also significantly associated with being engaged in an activity with a study element as academic ability increased.

70
Appendices The histograms and the jitter plots show the distribution of the propensity scores. The propensity scores are generated by fitting a logistic regression model to the complete dataset with the dependent variable as the qualification marker (IB diploma/ A level) and the independent variables as the background demographics. The propensity scores are the fitted values from this model. For PSM, it is important that there is enough overlap between the treatment and the control groups, i.e. that their propensity scores overlap in order for matching to be successful. Another key feature of PSM is that the distribution of the variables must be balanced between the treatment and the control groups. Both the jitter plot and histogram are used to investigate these requirements.
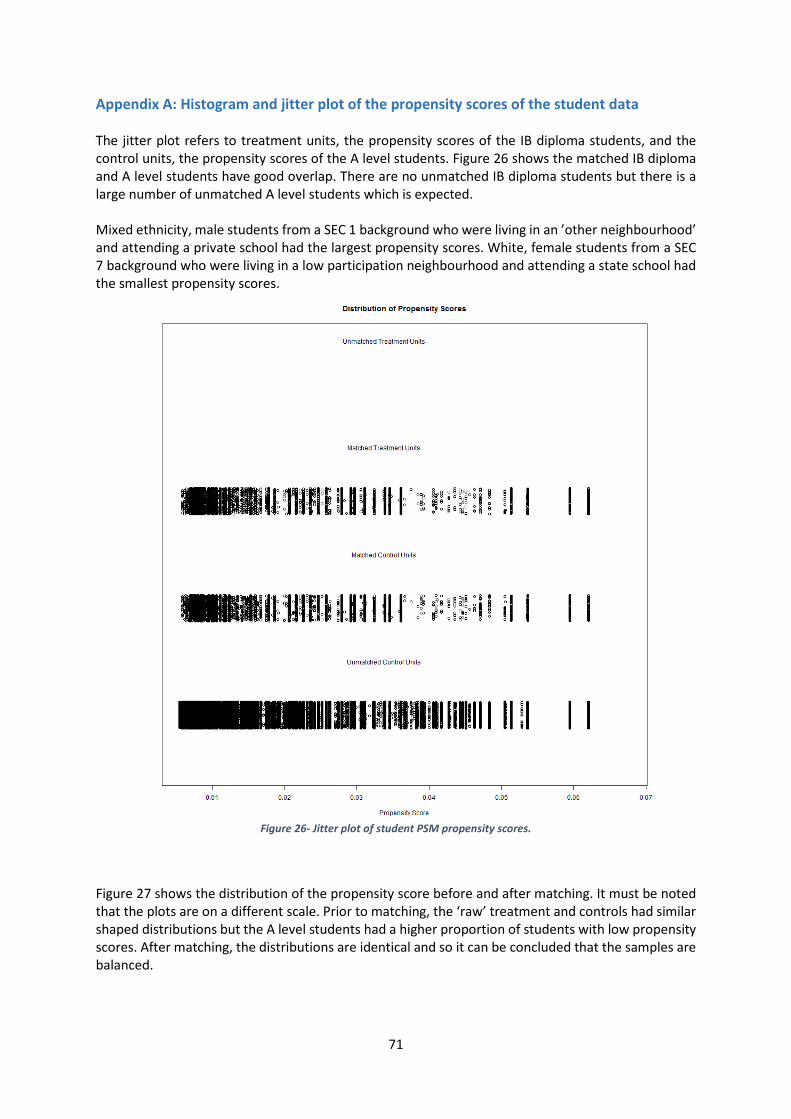
71
Appendix A: Histogram and jitter plot of the propensity scores of the student data The jitter plot refers to treatment units, the propensity scores of the IB diploma students, and the control units, the propensity scores of the A level students. Figure 26 shows the matched IB diploma and A level students have good overlap. There are no unmatched IB diploma students but there is a large number of unmatched A level students which is expected. Mixed ethnicity, male students from a SEC 1 background who were living in an ’other neighbourhood’ and attending a private school had the largest propensity scores. White, female students from a SEC 7 background who were living in a low participation neighbourhood and attending a state school had the smallest propensity scores.
Figure 26- Jitter plot of student PSM propensity scores.
Figure 27 shows the distribution of the propensity score before and after matching. It must be noted that the plots are on a different scale. Prior to matching, the ‘raw’ treatment and controls had similar shaped distributions but the A level students had a higher proportion of students with low propensity scores. After matching, the distributions are identical and so it can be concluded that the samples are balanced.
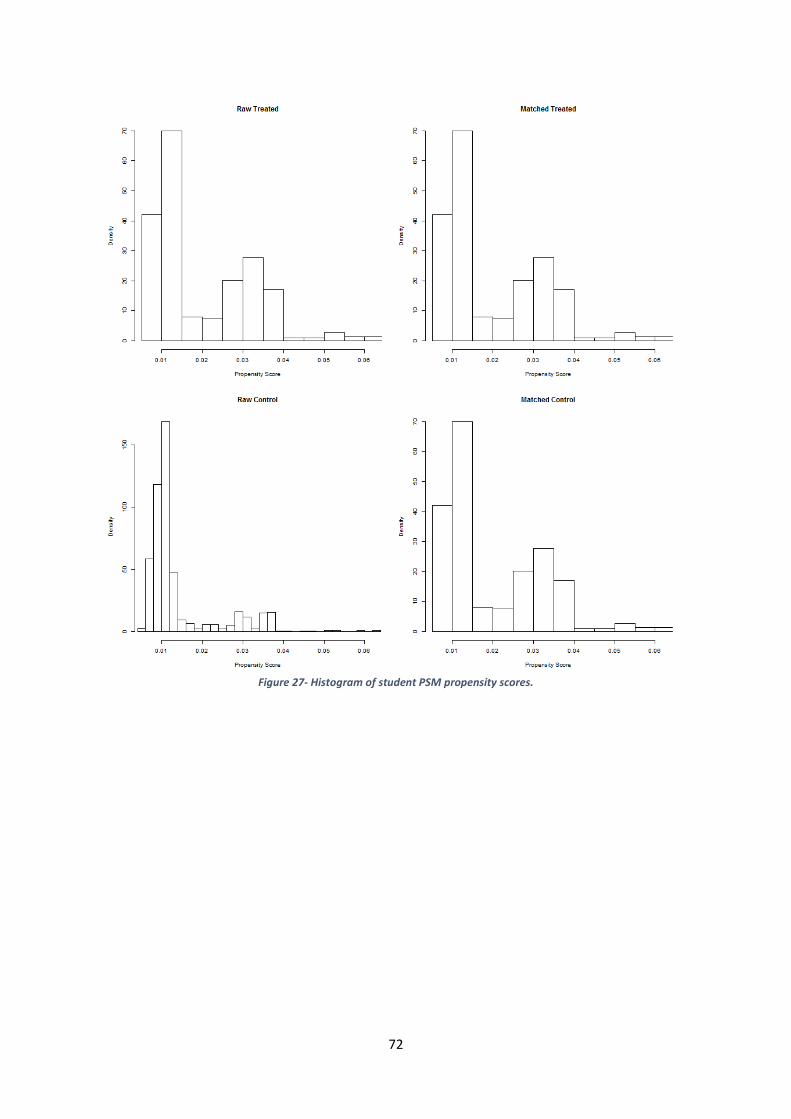
72
Figure 27- Histogram of student PSM propensity scores.
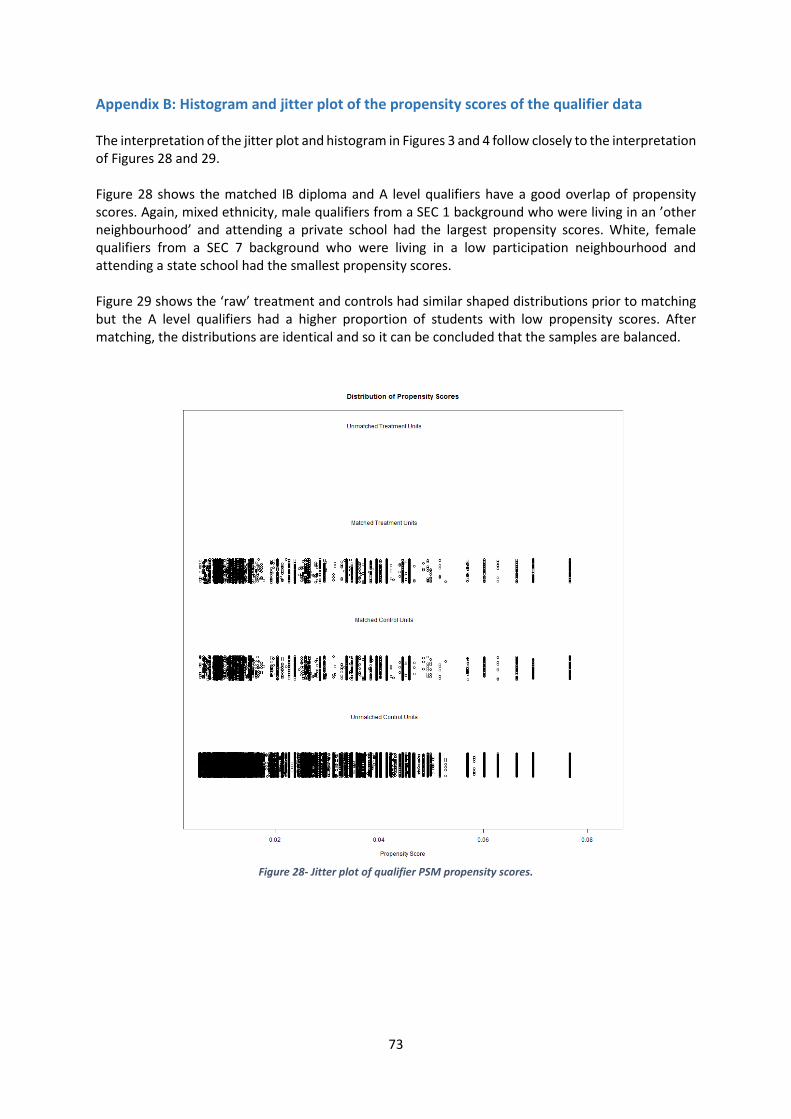
73
Appendix B: Histogram and jitter plot of the propensity scores of the qualifier data The interpretation of the jitter plot and histogram in Figures 3 and 4 follow closely to the interpretation of Figures 28 and 29. Figure 28 shows the matched IB diploma and A level qualifiers have a good overlap of propensity scores. Again, mixed ethnicity, male qualifiers from a SEC 1 background who were living in an ’other neighbourhood’ and attending a private school had the largest propensity scores. White, female qualifiers from a SEC 7 background who were living in a low participation neighbourhood and attending a state school had the smallest propensity scores. Figure 29 shows the ‘raw’ treatment and controls had similar shaped distributions prior to matching but the A level qualifiers had a higher proportion of students with low propensity scores. After matching, the distributions are identical and so it can be concluded that the samples are balanced.
Figure 28- Jitter plot of qualifier PSM propensity scores.
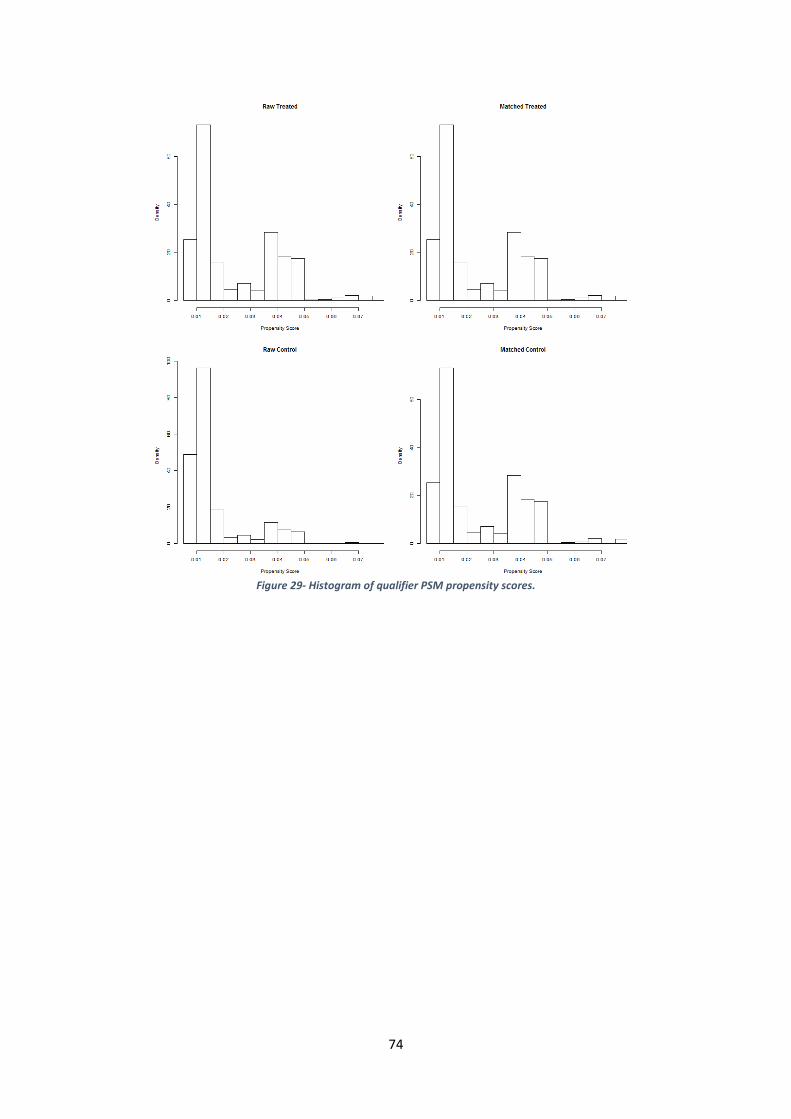
74
Figure 29- Histogram of qualifier PSM propensity scores.
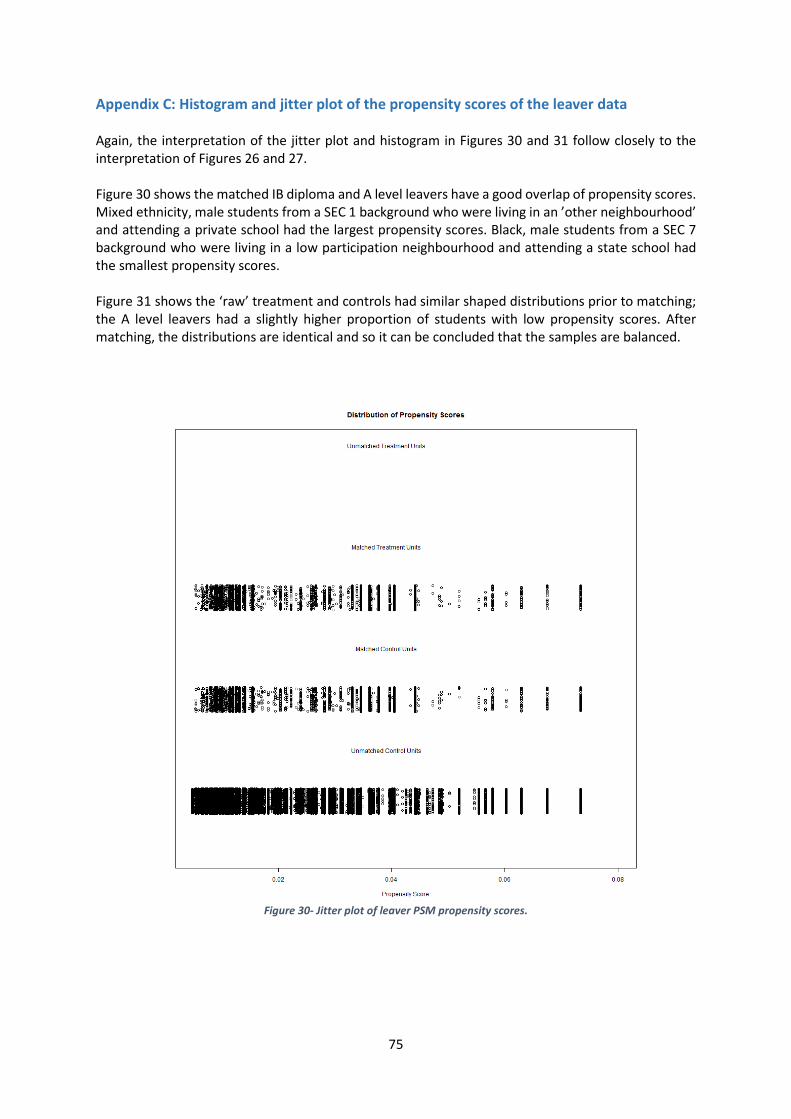
75
Appendix C: Histogram and jitter plot of the propensity scores of the leaver data Again, the interpretation of the jitter plot and histogram in Figures 30 and 31 follow closely to the interpretation of Figures 26 and 27. Figure 30 shows the matched IB diploma and A level leavers have a good overlap of propensity scores. Mixed ethnicity, male students from a SEC 1 background who were living in an ’other neighbourhood’ and attending a private school had the largest propensity scores. Black, male students from a SEC 7 background who were living in a low participation neighbourhood and attending a state school had the smallest propensity scores. Figure 31 shows the ‘raw’ treatment and controls had similar shaped distributions prior to matching; the A level leavers had a slightly higher proportion of students with low propensity scores. After matching, the distributions are identical and so it can be concluded that the samples are balanced.
Figure 30- Jitter plot of leaver PSM propensity scores.
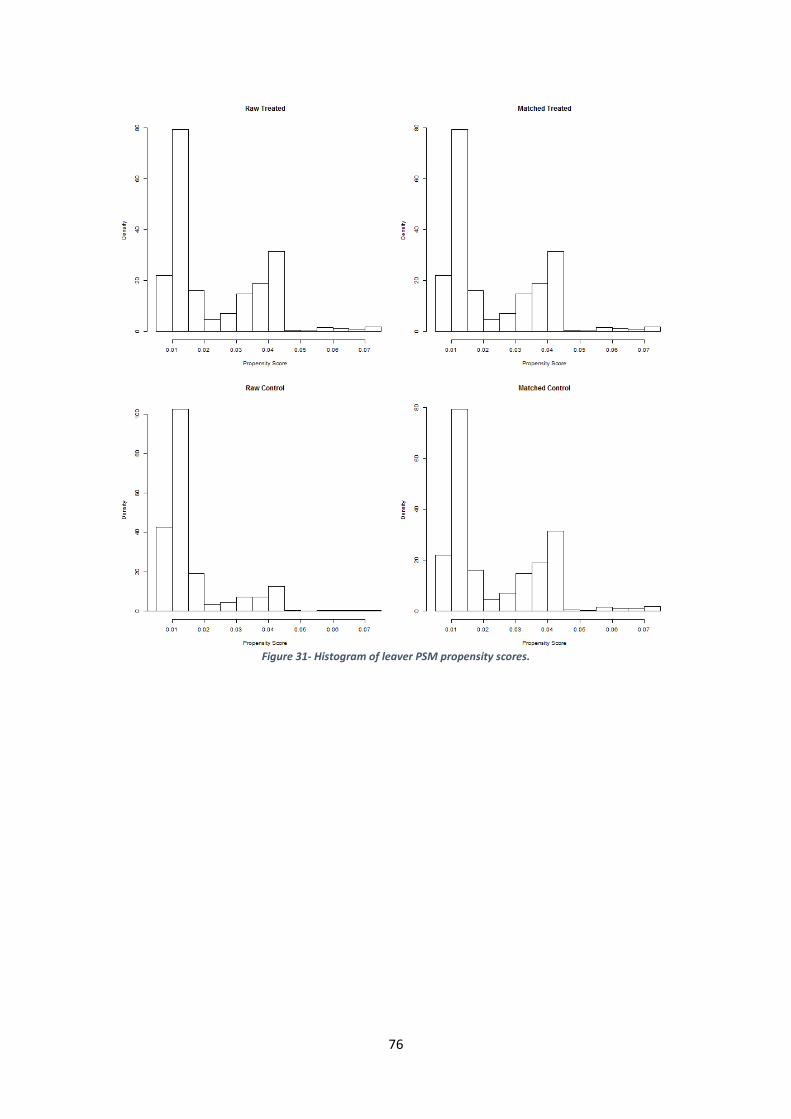
76
Figure 31- Histogram of leaver PSM propensity scores.
77
Appendix D: Comparison of IB diploma and A level students within each tariff grouping Grade boundary groupings were decided upon after examining typical entry requirements for IB diploma and A level students in 2015 for entering a UK HEP offering a range of different courses. Entry requirements varied between HEPs and courses, but typical offers were made for 3 or more A levels. The highest achievement for 3 A levels (***) had offers equivalent to approximately 40 IB points. The IB scores and A level grades were grouped into three levels; a higher, middle and lower score grouping. This ensured a proportionally good overlap of students, qualifiers and leavers with similar academic ability, as can be seen in Tables 47 and 48. Table 47- Academic ability groupings.
IB score A level Grade Academic ability grouping 37+ (***), (**A), (**B), (*AA),
(AAA) Academic ability group 3 (higher graded)
31-36 (**C), (*AB), (*AC), (AAB), (*BC), (*BB), (**D), (AAC), (ABB), (**E), (*AD), (ABC), (*AE), (AAD)
Academic ability group 2 (mid-level graded)
24-30 (BBB), (*CC), (*BD), (*BE), (AAE), (ABD), (BBC), (ACC) (*CD), (*CE), (ABE), (BBD), (BCC),(*DD), (ACD), (ACE), (BBE),(CCC), (*DE), (ADD), (BCD)
Academic ability group 1 (lower graded)
Table 48- Unmatched sample sizes.
Academic ability
IB diploma students
A level Students
IB diploma qualifiers
A level Qualifiers
IB diploma leavers
A level leavers
24-30 3,015 326,005 1,675 160,060 1,325 73,595 31-36 4,195 267,450 2,510 135,820 2,080 112,655 37+ 3,840 179,615 2,270 84,185 1,890 130,160 Total 11,055 773,070 6,455 380,065 5,295 316,410
78
References D’Agostino, Jr, R. B. and D’Agostino, Sr, R. B. 2007. Estimating treatment effects using observational data. JAMA, 297(3), pp. 314- 316. Austin, P. C. 2008. A critical appraisal of propensity-score matching in the medical literature between 1996 and 2003. Statistics in Medicine, 27(12). pp.2037-2049 Gelman, A. and Hill, J. 2007. Data analysis using regression and multilevel/hierarchical models. New York: Cambridge University Press. Hosmer, D,W. and Lemeshow, S. 2000. Applied logistic regression. Second Edition, New York: John Wiley & Sons. Imai, K., King, G. and Stuart, E,A. 2008. Misunderstandings between experimentalists and observationalists about causal inference. Journal of the Royal Statistical Society Series A, 171(2): pp.481-502. Office for National Statistics (2010) Standard Occupational Classification 2010, Volume 3 The National Statistics Socio-economic Classification: (Rebased on the SOC2010) User Manual. Hampshire: Palgrave Macmilllan. Available from http://www.ons.gov.uk/ons/guide-method/classifications/current-standard-classifications/soc2010/soc2010-volume-3-ns-sec--rebased-on-soc2010--user-manual/soc2010-volume-3.pdf [Accessed 10 November 2015]. Rosenbaum, P.R. 2005a. Observational study. In Everitt, B. S., and Howell, D.C. eds. Encyclopedia of statistics in behavioural science. Chichester: Wiley, pp. 1451-1462 Rosenbaum, P.R. 2005b. Sensitivity analysis in observational studies. In Everitt, B. S., and Howell, D.C. eds. Encyclopedia of statistics in behavioural science. Chichester: Wiley, pp. 1809-1184 Rosenbaum, P. R., and Rubin, D. B. 1983. The central role of the propensity score in observational studies for causal effects. Biometrika, 70(1). pp.41-55. Stuart, E. A. 2010 Matching methods for causal inference: A review and a look forward. Statistical Science. 25(1), pp.1-21.
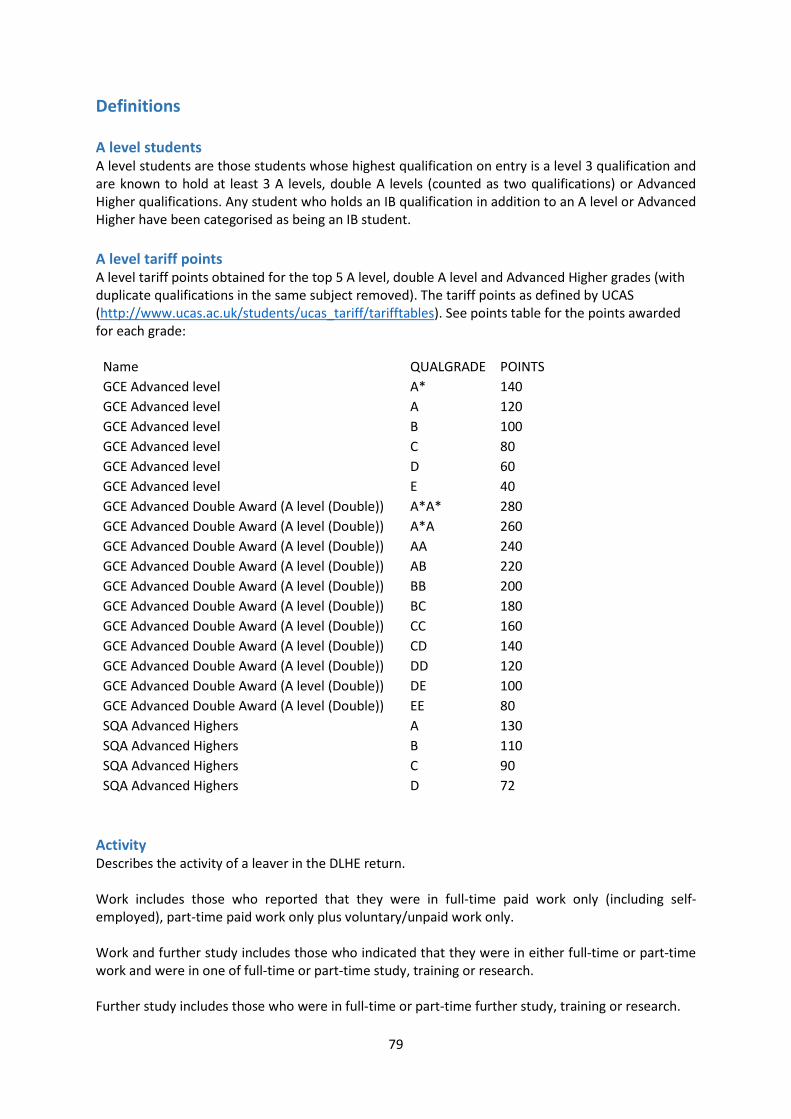
79
Definitions A level students A level students are those students whose highest qualification on entry is a level 3 qualification and are known to hold at least 3 A levels, double A levels (counted as two qualifications) or Advanced Higher qualifications. Any student who holds an IB qualification in addition to an A level or Advanced Higher have been categorised as being an IB student. A level tariff points A level tariff points obtained for the top 5 A level, double A level and Advanced Higher grades (with duplicate qualifications in the same subject removed). The tariff points as defined by UCAS (http://www.ucas.ac.uk/students/ucas_tariff/tarifftables). See points table for the points awarded for each grade:
Name QUALGRADE POINTS GCE Advanced level A* 140 GCE Advanced level A 120 GCE Advanced level B 100 GCE Advanced level C 80 GCE Advanced level D 60 GCE Advanced level E 40 GCE Advanced Double Award (A level (Double)) A*A* 280 GCE Advanced Double Award (A level (Double)) A*A 260 GCE Advanced Double Award (A level (Double)) AA 240 GCE Advanced Double Award (A level (Double)) AB 220 GCE Advanced Double Award (A level (Double)) BB 200 GCE Advanced Double Award (A level (Double)) BC 180 GCE Advanced Double Award (A level (Double)) CC 160 GCE Advanced Double Award (A level (Double)) CD 140 GCE Advanced Double Award (A level (Double)) DD 120 GCE Advanced Double Award (A level (Double)) DE 100 GCE Advanced Double Award (A level (Double)) EE 80 SQA Advanced Highers A 130 SQA Advanced Highers B 110 SQA Advanced Highers C 90 SQA Advanced Highers D 72
Activity Describes the activity of a leaver in the DLHE return. Work includes those who reported that they were in full-time paid work only (including self-employed), part-time paid work only plus voluntary/unpaid work only. Work and further study includes those who indicated that they were in either full-time or part-time work and were in one of full-time or part-time study, training or research. Further study includes those who were in full-time or part-time further study, training or research.
80
Unemployed includes those who stated they were unemployed or due to start work. Other includes those who were taking time out to travel or doing something else. Classification of first degree The class obtained from first degree qualifications. Certain qualifications obtained at first degree level are not subject to classification of award, notably medical and general degrees. These, together with ordinary degrees and aegrotat qualifications have been included within Unclassified. Third class honours, fourth class honours and the pass have been aggregated as Third class/pass. Lower second and undivided second class honours have been aggregated as Lower second class. Continuation status This has been created for full-time first degree entrants in 2012/13 who, where possible, have been linked to 2013/14. This method is consistent with that used within the Unistats data: http://unistats.direct.gov.uk Continuing or qualifying at HE provider- Defined as all students who are progressing into their following year of study at the same HE provider and fall within the HESA student population. It also includes those students who are not progressing into their following year of study and who have achieved a qualification in one of the two comparison years with that qualification deemed as being equivalent to or higher than the qualification aimed for. Gained other award- Those students who are not progressing into their following year of study and who have achieved a qualification in one of the two comparison years with that qualification deemed as being lower than the qualification aimed for. Left with no award- Those students who are not continuing into their following year of study and have not been awarded a qualification in either of the two comparison years. Dormant- Those students who have not obtained an award and are not active or have dormant or writing-up mode. Country/ Region of HE provider The allocation of a HE provider to a geographical region is done by reference to the administrative centre of that HE provider. Regions in this context are the nine England Regions (formerly Government Office Regions) and Wales, Scotland and Northern Ireland. There may be students registered at HE providers who are studying in regions other than that of the administrative centre of the HE provider. DLHE target and response Eligible DLHE population includes those instances identified in the HESA Student record that met criteria within the DLHE target population based on location of study, mode of study, end date of instance and qualification awarded. Known destination includes leavers within the eligible DLHE population who replied to the DLHE questionnaire providing destination information. Explicit refusal includes leavers within the eligible DLHE population who replied to the DLHE questionnaire explicitly refusing to provide information.
81
Response includes leavers who replied to the DLHE questionnaire (i.e. known destination plus explicit refusals). Response rate is the number of responses expressed as a percentage of the eligible DLHE population. Domicile Indicates the location of the student's permanent or home address prior to entry to the course. UK domicile students are those whose normal residence is in the UK, and for the purposes of this report includes Guernsey, Jersey and the Isle of Man. Other European Union domiciled students are those whose normal residence prior to commencing their programme of study was in countries which were European Union (EU) members as at 1 December of the reporting period. EU countries includes Austria, Belgium, Bulgaria, Cyprus, Czech Republic, Denmark, Estonia, Finland, France, Germany, Gibraltar, Greece, Hungary, Ireland, Italy, Latvia, Lithuania, Luxembourg, Malta, Netherlands, Poland, Portugal, Romania, Slovakia, Slovenia, Spain and Sweden. Where European Union countries are shown separately, individual country figures exclude those domiciled in the Åland Islands, the Canary Islands, and the French overseas departments of French Guiana, Guadeloupe, Martinique and Réunion. These figures are included in European Union not otherwise specified. Other Europe includes Albania, Andorra, Armenia, Azerbaijan, Belarus, Bosnia and Herzegovina, Croatia, Cyprus (Non-European-Union), Faroe Islands, Georgia, Kosovo, Macedonia, Moldova, Monaco, Montenegro, Russia, San Marino, Serbia, Svalbard and Jan Mayen, Switzerland, Turkey, Ukraine, Vatican City and Europe not otherwise specified. Ethnicity Students domiciled in England, Wales, Scotland, Northern Ireland, Guernsey, Jersey and the Isle of Man are required to report their ethnic origin. Data on the ethnicity of students has therefore been restricted to UK domiciled students. The coding frame is that recommended by the Office for National Statistics (ONS) for UK-wide data collection. White includes White, White - Scottish, Irish Traveller, Gypsy or Traveller, plus Other White background. Black includes Black or Black British - Caribbean, Black or Black British - African, and other Black background. Asian includes Asian or Asian British - Indian, Asian or Asian British - Pakistani, Asian or Asian British - Bangladeshi, Chinese, and other Asian background. Other (including mixed) includes mixed - White and Black Caribbean, mixed - White and Black African, mixed - White and Asian, other mixed background, Arab, plus other ethnic background. Not known includes not known and information refused. BME includes all non-white categories excluding not known.
82
First degree First degrees (including eligibility to register to practice with a health or social care or veterinary statutory regulatory body), first degrees with Qualified Teacher Status (QTS)/registration with a General Teaching Council (GTC), enhanced first degrees, first degrees obtained concurrently with a diploma and intercalated first degrees. Full-time students Those normally required to attend an HEP for periods amounting to at least 24 weeks within the year of study, on thick or thin sandwich courses, and those on a study-related year out of their HEP. During that time students are normally expected to undertake periods of study, tuition or work experience which amount to an average of at least 21 hours per week. For qualifiers and leavers this includes writing-up status where the mode of study was previously full-time and students changing to dormant status previously full-time. HESA Destinations of Leavers from Higher Education (DLHE) population Contains all United Kingdom (UK) and European Union (EU) domiciled students reported to HESA for the reporting period 1 August to 31 July as obtaining relevant qualifications. Awards from dormant status are not included in the population. DLHE data is based on an instance of engagement. HESA qualifiers population A count of student instances associated with the award of an HE qualification (excluding HE institutional credits) during the HESA reporting period 1 August to 31 July. This includes qualifications awarded from dormant, writing-up and sabbatical status, but excludes incoming visiting and exchange students. HESA student population A count of the number of HE student instances active at a reporting HE provider (HEP) in the reporting period 1 August to 31 July. Dormant students (those who have ceased studying but have not formally de-registered); incoming visiting and exchange students; students where the whole of the programme of study is outside of the UK; students on sabbatical, and writing-up students are excluded from the population. Higher education (HE) students Students on courses for which the level of instruction is above that of level 3 of the Qualifications and Curriculum Authority (QCA) National Qualifications Framework (NQF) (e.g. courses at the level of Certificate of HE and above). IB Points The total number of points awarded from International Baccalaureate qualifications held by IB students. The maximum number of points awarded is 45. Students with 24 or more points may be eligible for an International Baccalaureate Diploma. Students with less than 24 points may be eligible for an International Baccalaureate Course qualification. This information is taken from either the IB data (TOTAL_SCORE for diploma candidates or sum SUBJECT_GRADE for certificate candidates) or the HESA data Total IB points (diplomas only). IB qualification International Baccalaureate (IB) students have been identified using data supplied by the International Baccalaureate organization which has been linked to the HESA student data. Any student known to hold an IB qualification has been categorised as an IB student regardless of other qualifications they
83
may hold. In addition, any students known to hold an IB according to the HESA student data have been categorised as an IB student. Diploma pass -In the IB dataset with a CATEGORY of 'DIPLOMA' (or 'RETAKE' as long as they have a 'DIPLOMA' record in a previous year) with a RESULT_CODE of 'B' or 'D' or in the HESA dataset they have a IB diploma with at least 24 points and an IB Overall result of 'B' or 'D'. Diploma fail - In the IB dataset with a CATEGORY of 'DIPLOMA' (or 'RETAKE' as long as they have a 'DIPLOMA' record in a previous year) with a RESULT_CODE of 'F' or in the HESA dataset they have a IB diploma which has points >0 and IB Overall result of 'F'. Course pass - In the IB dataset with a CATEGORY of 'CERTIFICATE' or 'COURSE' and at least one SUBJECT_GRADE of 4 or more. Not identifiable in the HESA data. Course fail - In the IB dataset with a CATEGORY of 'CERTIFICATE' or 'COURSE' and no SUBJECT_GRADE is greater than 3. Not identifiable in the HESA data. Level of study This illustrates the study level undertaken by the student. Low-participation neighbourhoods (POLAR3) POLAR3 is based on the HE participation rates of people who were aged 18 between 2005 and 2009 and entered a HE course in a UK higher education provider or English or Scottish further education college, aged 18 or 19, between academic years 2005-06 and 2010-11. The POLAR3 classification is formed by ranking 2001 Census Area Statistics (CAS) wards by their young participation rates for the combined 2005 to 2009 cohorts. This gives five quintile groups of areas ordered from ‘1’ (those wards with the lowest participation) to ‘5’ (those wards with the highest participation), each representing 20 per cent of UK young cohort. Students have been allocated to the neighbourhoods on the basis of their postcode. Those students whose postcode falls within wards with the lowest participation (quintile 1) are denoted as being from a low participation neighbourhood. Postgraduate courses Are those leading to higher degrees, diplomas and certificates (including Postgraduate Certificate in Education (PGCE at level M) (unless shown separately) and professional qualifications) which usually require a first degree as an entry qualification (i.e. already qualified at level H). Higher degree (research) includes doctorate (incorporating New Route PhD) and masters degrees studied primarily through research. Higher degree (taught) includes doctorate and masters degrees not studied primarily through research, and postgraduate bachelors degrees at level M. Masters in Teaching and Learning are included in this category. Other postgraduate includes postgraduate diplomas, certificates and professional qualifications, Postgraduate Certificate in Education (PGCE at level M), level 7 Diploma in Teaching in the Lifelong Learning Sector, HE provider postgraduate credits and non-formal postgraduate qualifications.
84
Rounding strategy Due to the provisions of the Data Protection Act 1998 and the Human Rights Act 1998, HESA implements a strategy in published and released tabulations designed to prevent the disclosure of personal information about any individual. This strategy involves rounding all numbers to the nearest multiple of 5. This rounding strategy is also applied to total figures, the consequence of which is that the sum of numbers in each row or column rarely matches the total shown precisely. Average values and proportions values prepared by HESA have been calculated on precise raw numbers. However, percentages calculated on populations which contain fewer than 22.5 FPE have been suppressed and represented as '..' as have averages based on populations of 7 or fewer. Salary Describes the annual salary to the nearest thousand pounds (£) before tax, for leavers employed in full-time paid work, excluding those who were self-employed, returned a zero salary or refused to give this information. Boxplots have been produced removing outliers that fall outside 1.5*IQR. Sex This records the sex of the student. Other is included for students whose sex aligns with terms such as intersex, androgyne, intergender, ambigender, gender fluid, polygender and gender queer. Socio-economic classification (SEC) SEC is used to identify the socio-economic classification of students participating in HE. This data is compulsory for undergraduate students entering through UCAS. 'Not classified' is a valid code and includes students; occupations not stated or inadequately described and not classifiable for other reasons. Percentages are based on those students with classified known SEC data. In line with the Performance Indicators (http://www.hesa.ac.uk/pi), SEC data has been grouped into categories with examples (Office for National Statistics, 2010) : SEC 1-3:
1 Higher managerial and professional occupations (e.g., Solicitors, Architects, Medical practitioners , Chief executives, Economists
2 Lower managerial and professional occupations (e.g., Social workers, Nurses, Journalists, Managers and directors in retail and wholesale, Teaching professionals (Further education/ Secondary education/ Primary and nursery/ Special needs))
3 Intermediate occupations (e.g., Paramedics, Nursery Nurses and assistants, Police officers (sergeant and below), Bank and post office clerks, Graphic designers
SEC 4-7:
4 Small employers and own account workers (e.g., Farmers, Shopkeepers and proprietors –wholesale and retail, Taxi and cab drivers and chauffeurs, Driving instructors, Window cleaners)
5 Lower supervisory and technical occupations (e.g., Mechanics, Chefs, Train and tram drivers, Plumbers, Electricians
6 Semi-routine occupations (e.g., Receptionists, Shelf fillers, Care workers and home carers, Telephonists, Fitness instructors
7 Routine occupations (e.g., Bar staff, cleaners and domestics, Butchers, Bus and coach drivers, Van drivers)
8 Never worked and long-term unemployed 9 Not classified
85
Standard Industrial Classification (SIC) Describes the employing organisations of those HE leavers who were employed, using the UK Standard Industrial Classification of Economic Activities 2007 (SIC 2007). Standard industry codes for economic activity are used to describe the relationship between the inputs and outputs of such activity. In cases where multiple activities take place, classification usually relates to the single most important activity. In the case of DLHE statistics, this will usually be the most important activity undertaken by an employer (or self-employed person). Economic activities are measured by enquiring into the nature of an employer's (or self-employed person's) business. Standard Occupational Classification (SOC) Describes the types of job of those HE leavers who were employed, using the SOC2000 Standard Occupational Classification. State school marker This is created for all students whose previous institution attended is returned. This data is compulsory for undergraduate students entering through UCAS, although generic unknown school type codes may be returned. Where the school type is known, the previous provider and last provider attended codes can be grouped up into state and independent. Students from sixth-form, further education colleges and HE providers are included as being from state schools: Privately funded school From state-funded school or college Unknown school type Percentages are based on those students with known school type. STEM subject marker Identifies students studying in Medicine & dentistry; Subjects allied to medicine; Biological sciences; Veterinary science; Agriculture & related subjects; Physical sciences; Mathematical sciences; Computer science; Engineering & technology; Architecture, building & planning. Non-STEM subject areas include: Social studies; Law; Business & administrative studies; Mass communications & documentation; Languages; Historical & philosophical studies; Creative arts & design; Education; Combined. Subject areas/ FPE Uses the Joint Academic Coding System (JACS) Version 3 subject coding frame (www.hesa.ac.uk/jacs3). Additionally, a procedure of apportionment is used. Under apportionment, each student instance is, where necessary, divided in a way that in broad-brush terms reflects the pattern of a split course. For split courses not involving an ITT component, institutions assign their own percentages based on a broad assessment of the relative contribution of subjects to a course, rather than detailed analysis of the contributions of subjects to individual students' courses of study. The recommended standard percentages are: 50% for each of the two subjects for balanced combinations; 67% and 33% for major – minor combinations and 34%, 33% and 33% for triple combinations. The sum of the percentages allocated to each subject studied on a course must equal 100%.
86
Initial Teacher Training (ITT) students at undergraduate level who also have specialism subjects recorded (typically, secondary ITT students) are apportioned 50% to the ‘Education’ subject area and the remaining 50% is further assigned according to the percentages recommended above. Where no subject other than education is recorded, or where the student is on a PGCE course, apportionment is 100% to the ‘Education’ subject area. Top 20 HE Providers Although there is no standard measure of the ‘top’ HEPs in the UK, various league tables have been published by media which attempt to rank the HEPs based on various factors. For the purpose of this report, a ‘top 20’ has been created by using a combination The Complete University Guide League Table 2015, The Guardian University Guide 2015 and The Times University Guide 2015. All other HEPs are grouped together into 'Other'. Type of further qualification This identifies the type of qualification the leaver was aiming for, if they were engaged in further study on the census date. Year of study/ first year marker First years includes those students who commenced their programme instance within the reporting period and is based on the HESA standard registration population. In some cases the student's first year of study may be the second or subsequent year of a programme. All years includes all student instances regardless of their commencement date and is based on the HESA standard registration population.