Embed Size (px)
Citation preview
CONTINUOUSLY DEFORMATION MONITORING OF SUBWAY TUNNEL BASED ON TERRESTRIAL POINT CLOUDS
Zhizhong Kang a, *, Lei Tuoa, Sisi Zlatanovab
a School of Land Science and Technology, China University of Geosciences, 29 Xueyuan Road, Haidian District, Beijing 100083, China - [email protected], [email protected]
b OTB Research Institute for Housing, Urban and Mobility Studies, Delft University of Technology, Jaffalaan 9, 2628 BX Delft, The Netherlands - [email protected]
Commission V, WG V/3
KEY WORDS: Deformation Monitoring, Vertical Section, Quadric Fitting, Random Sample Consensus, Terrestrial Laser Scanner (TLS)
ABSTRACT:
The deformation monitoring of subway tunnel is of extraordinary necessity. Therefore, a method for deformation monitoring based on terrestrial point clouds is proposed in this paper. First, the traditional adjacent stations registration is replaced by section-controlled registration, so that the common control points can be used by each station and thus the error accumulation avoided within a section. Afterwards, the central axis of the subway tunnel is determined through RANSAC (Random Sample Consensus) algorithm and curve fitting. Although with very high resolution, laser points are still discrete and thus the vertical section is computed via the quadric fitting of the vicinity of interest, instead of the fitting of the whole model of a subway tunnel, which is determined by the intersection line rotated about the central axis of tunnel within a vertical plane. The extraction of the vertical section is then optimized using RANSAC for the purpose of filtering out noises. Based on the extracted vertical sections, the volume of tunnel deformation is estimated by the comparison between vertical sections extracted at the same position from different epochs of point clouds. Furthermore, the continuously extracted vertical sections are deployed to evaluate the convergent tendency of the tunnel. The proposed algorithms are verified using real datasets in terms of accuracy and computation efficiency. The experimental result of fitting accuracy analysis shows the maximum deviation between interpolated point and real point is 1.5mm, and the minimum one is 0.1mm; the convergent tendency of the tunnel was detected by the comparison of adjacent fitting radius. The maximum error is 6mm, while the minimum one is 1mm. The computation cost of vertical section abstraction is within 3 seconds/section, which proves high efficiency..
* Corresponding author. E-mail address: [email protected].
1. INTRODUCTION
In order to alleviate the pressure of the ground transportation, subway has been the main component of public transport system with high carrying capacity, in consideration of its advantages of high efficiency, safety and low consumption. However, the deformation of subway tunnel and surrounding building which is unavoidable would make a negative impact to each other and then endanger the whole urban transportation system. Thus, the deformation monitoring of subway tunnel is of extraordinary necessity. The main approaches of deformation monitoring applied on subway tunnel can be divided into two types, i.e. contact and non-contact. The contact measurement obtains the slope and deformation of tunnel by the inclinometer in different position, such as convergence ruler, BASSETT CONVERGENCE SYSTEM(BCS)(LI and FANG, 2004), etc. The main way of non-contact measurement is intelligent total station, such as Topcon GPT-9000A and Leica TCRA1201. A method of deformation monitoring based on phase shift laser ranging device is proposed by Zhou et al. (2010). The intelligent total station can determine the vertical section through control software or PDA, such as the TM tunnel section measurement system (Tao and He, 2008). The software EasyScan applied on GPT-9000A is developed based on WinCE (Huang and Xie, 2009). Leica TCRA1101 integrated
with the TPSPRO section measurement system is applied on abstracting section in reference (Liu and Qin, 2009). However, the disadvantages of monitoring methods mentioned above include limited monitoring points, low efficiency, and the accuracy is prone to be impacted by environmental factors, which can be tackled by applying 3D laser scanning technology.
As a new approach of measurement, TLS (Terrestrial laser scanner) is more appropriate for monitoring of subway tunnel by comparison, which can acquire mass 3D point clouds with high density and high resolution, meanwhile, no reflection prism and low requirement for light and temperature. Tsakiri et al. (2006) discussed methods of surface modelling implemented for deformation monitoring and approaches used to measure the deformation from surfaces. By using a weighted-constraint, least-squares curve-fitting approach, Gordon and Lichti (2007) developed a modeling strategy from fundamental beam-deflection equations to permit coarse-precision terrestrial laser scanner observations to be used to accurately measure vertical deflections of deforming beams. Gosliga et al. (2006) described a work flow for the use of terrestrial laser scanning for detecting deformation by gaining benefit from both data redundancy and individual point quality. Schneider (2006) applied the analysis of highly redundant unstructured point clouds which represent the surface of objects the determination monitoring of the
International Archives of the Photogrammetry, Remote Sensing and Spatial Information Sciences, Volume XXXIX-B5, 2012 XXII ISPRS Congress, 25 August – 01 September 2012, Melbourne, Australia
199
bending line of a television tower. Monserrat and Crosetto (2008) proposed a procedure for measuring land deformation using repeated TLS acquisitions and least squares surface matching algorithm proposed by Gruen and Akca (2005).
What’s more, different form the subway tunnel in progress, the subway tunnel in operation has a high requirement for measurement time and safety. Taking into account the strict limits of operation hours and security, TLS as a new means of monitoring has more obvious advantages than the traditional means. Therefore, a method of continuous vertical section abstraction for the deformation monitoring of subway tunnel in operation based on 3D point clouds is proposed in this paper.
2. CONTINUOUS VERTICAL SECTION EXTRACTION
The vertical section of subway tunnel can be obtained through point clouds registration, determining central axis, coordinate transformation and quadric fitting. And the central axis determining includes steps of RANSAC algorithm and curve fitting. The process is given in Fig.1.
Fig.1 The flowchart of the proposed algorithm
2.1 Point Cloud Registration
As far as deformation monitoring is concerned, registration accuracy is of great importance. Therefore, based on the coarse registration using retro-reflecting targets as tiepoints, an optimized ICP algorithm is proposed to refine the registration result.
Iterative Closest Point (ICP, Besl and McKay, 1992) is an algorithm employed to minimize the difference between two clouds of points. Efficient variants of the ICP algorithm had been proposed to circumvent the exhaustive search of nearest neighbor for the purpose of improving their efficiency (e.g. Godin & Boulanger, 1995; Sharp et al., 2002).
According to the scanning mechanism of terrestrial laser scanner, the neighborhood relations of scanning laser rays directly reflect those of resulting laser points. In general, each instrument observation comprises four values, namely, horizontal and vertical angles, range and reflectance value. 3D points are calculated as a combination of the horizontal and vertical angles of the laser beam plus the measured distance.
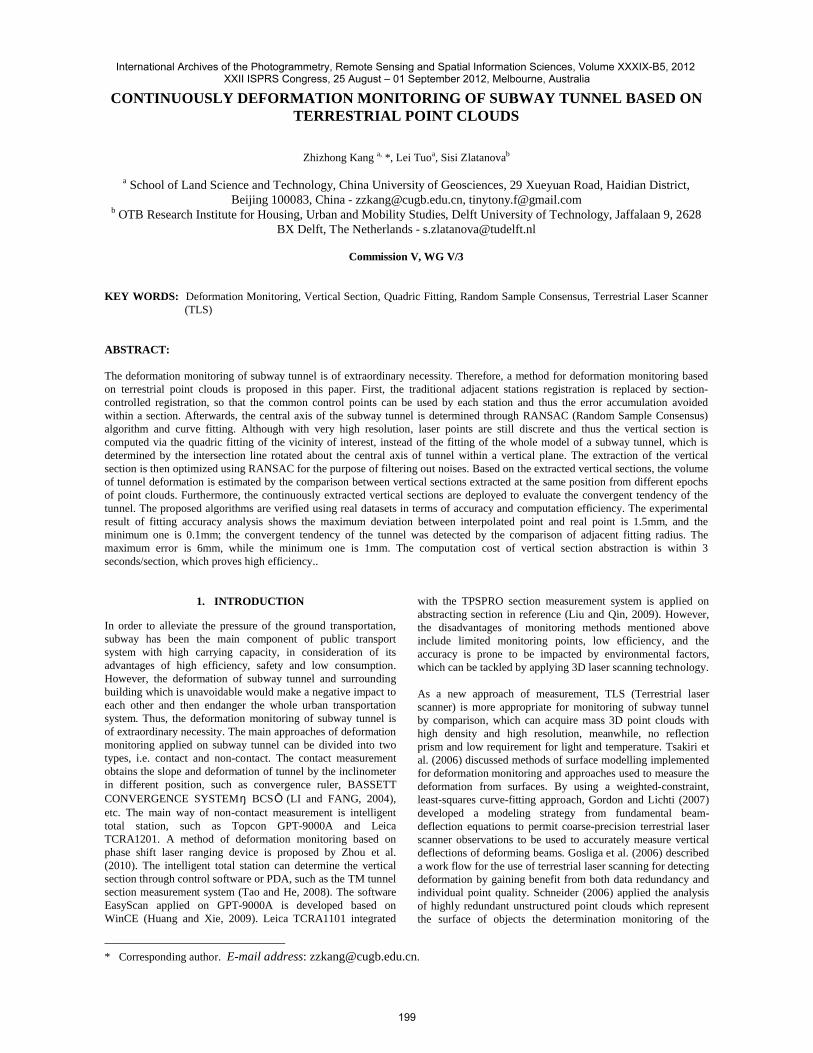
Fig.2 The determination of neighboring points
Concerning scattered point clouds, the neighbor searching based on spatial coordinates may suffer from negative factors, e.g. uneven point sampling, variant scale and resolution, etc., and cause low searching efficiency and expensive computation cost.
As Fig. 2, supposed A1 and A2 are neighbors, their 3D Cartesiancoordinate differences may significantly vary with the range values so that it is hard to determine an appropriate searching range. However, in the 3D polar coordinate system, the angular discrepancies and both in horizontal and vertical directions
between A1 and A2 are independent of their range values. The spatially neighboring relationship between laser points is expected to be represented via their scanning angles in terms of the laser scanning mechanism. Therefore, we implement the neighbor searching using the scanning angles of laser points, which is expected to tackle the challenges facing by the searching process in Cartesian coordinate system.
2.2 Determination of the central axis of tunnel
The central axis of a tunnel comprises two components respectively on XOY and YOZ planes. The calculate procedure is as follows:
The projections of the tunnel point clouds are made separatelyonto XOY and YOZ planes, from which we extract the boundary points of both sides of the tunnel.
Curve fitting from the boundary points is implemented usingquadratic model, and note the two fitted curves as boundary1 and boundary2.
322
1 xyxyxy PyPyPX
322
1 yzyzyz PyPyPZ Where
xyiP is the parameter of the fitting curve in XOY plane,
yziP is the parameter of fitting curve in YOZ plane, i=1, 2, 3.
The RANSAC ( Random Sample Consensus ) algorithm (Fischler and Bolles, 1981) is used for parameter estimating of quadratic equation. Rather than using as much of the data as possible to obtain an initial solution and then attempting to eliminate the invalid data points, RANSAC uses as small an initial data set as feasible and enlarges this set with consistent data when possible. The RANSAC paradigm contains three unspecified parameters: (1) the error tolerance used to determine whether or not a point is compatible with a model, (2) the number of subsets to try, and (3) the threshold t, which is the number of compatible points used to imply that the correct model has been found. The determination of these three parameters is dicussed in the introduction of RANSAC (Fischler and Bolles, 1981).
(1)
X
Y
Z
A1
A2
x1
y1
z1
x2
y2
z2
11
22
R1
R2
o
International Archives of the Photogrammetry, Remote Sensing and Spatial Information Sciences, Volume XXXIX-B5, 2012 XXII ISPRS Congress, 25 August – 01 September 2012, Melbourne, Australia
200
Concerning the central axis fitting, the number of points from which the function coefficients are estimated is 3. The criterion of outlier identification is based on the evaluation of fitted function error. Moreover, optimal parameters are computed through least-squares adjustment.
Resample 50 points (note as pointset1) from boundary1 equidistantly, and calculate 50 intersection points (note as pointset2) of boundary2 and the normal vector that pass each points of pointset1 separately. In the same way, pointset3 can be worked out through pointset2 and boundary1. Noting the midpoint of pointset1,2 and pointset2,3 as pointset4 and pointset5, then the central axis can be finally determined by curve fitting to the mean value of pointset4 and pointset5.
In order to abstract vertical section in the orthogonal direction of central axis, the corresponding relationship between direction of central axis and coordinate axis has to be determined firstly. Then the 3D point clouds can be rotated surround Z-axis and X-axis through rotate matrix.
In this paper, the point clouds is rotated surround Z-axis and X-axis with angle A, .
After both 3D point clouds Tiii zyx and the abstracting
point (x0,y0,z0) are rotated surround Z-axis and X-axis, the vertical section can be abstracted at the rotated abstracting point (x0’,y0’,z0’).
i
i
i
i
i
i
z
y
x
AA
AA
z
y
x
cossin0
sincos0
001
100
0cossin
0sincos
'
'
' (2)
0
0
0
0
0
0
cossin0
sincos0
001
100
0cossin
0sincos
'
'
'
z
y
x
AA
AA
z
y
x
(3)The point of vertical section (x’,y’,z’) can be determined through shift and rotation. Angle A and in rotation matrix
obtained from 2.2.
sin
0
cos
'
'
'
'
'
'
0
0
0
R
z
y
x
z
y
x (4)
The vertical section has to be inverse rotated to the initial position finally
'
'
'
100
0cossin
0sincos
cossin0
sincos0
001
z
y
x
AA
AA
z
y
x
(5)
2.3 Abstraction based on Quadric fitting of the vicinity of interest
The abstraction can be completed by using the 3D point clouds, although there are mass points, they are discrete. Thus, the quadric fitting is necessary, because there are no corresponding points on every abstracting position.
In this paper, the vertical section can be computed through quadric fitting to the partial data of tunnel on every angle of
abstraction. Assuming compute an intersection every 2° and the description of method at an angle as follow.
Firstly, the closest point from the straight line at the direction of this angle should be determined. The formula for computing distance from a 3D point (x1, y1, z1) to straight line L:
0 0 0x x y y z zR
rx ry rz
can be written as follow:
2 2 2
1 0 1 0 1 0 1 0 1 0 1 02 2 2
( ) ( ) ( ) ( ) ( ) ( )ry x x rx y y rz y y ry z z rx z z rz x xd
rx ry rz
(6)Where cosrx , 0ry , sinrz .
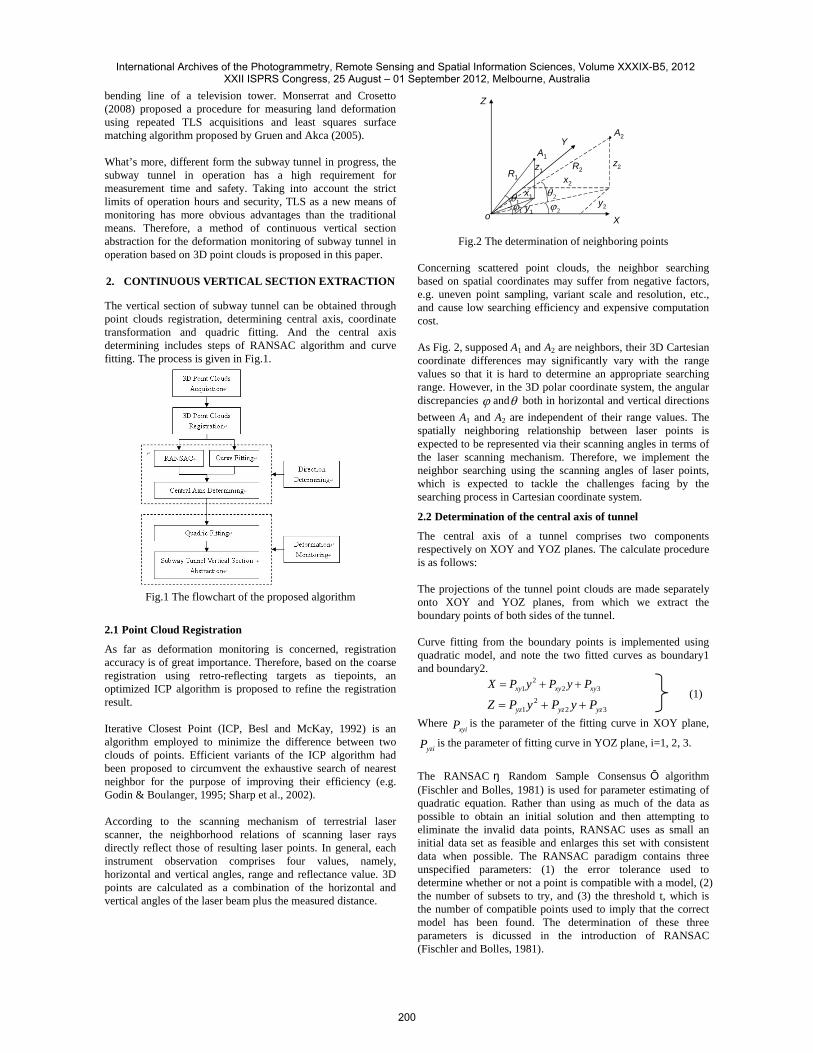
Filter out the closest point as the center, and then determine a region with a threshold so that quadratic fitting can be implemented using all points within this region (Fig.3). The fitting equation is as follow:
2 2 21 2 3 4 5 6 7 8 9 10 0a x a y a z a xy a yz a xz a x a y a z a (7)
2 2 2 2 2 2 2 2 2 21 2 3 4 5 6 7 8 9 10 1a a a a a a a a a a (8)Where a1, a2,⋯⋯ , a10 are the constrained least squares solution for fitting equation (Rabbani, 2006).
(a) Abstracting direction (b) Extracted Region
Fig.3 Quadric fitting of the vicinity of interest
The intersection of fitted quadric and the straight line in the abstraction direction can be obtained after the quadric parameters have been computed out. The coordinates can be written as follow:
sin
0
cos
0
0
0
R
z
y
x
z
y
x
(9)Where ∈ [0,2 ].
Substitute x, y, z in equation (7) with eqs. (9), the equation can be rewritten as 02 CBRAR , and the vertical section can be obtained by the solution R.
Based on the steps introduced above, the deformation of the tunnel can be monitored by different vertical sections abstracted at the same position. Meanwhile, the vertical section can be abstracted continuously by inputting different Y coordinates, and then those sections can reflect the tendency of the tunnel.
3. EXPERIMENT AND ANALYSIS
The proposed approach was tested with a real dataset acquiredby a laser scanner of RIEGL VZ-400 in a subway tunnel in Shanghai. The registration accuracies reach sub-millimeter
International Archives of the Photogrammetry, Remote Sensing and Spatial Information Sciences, Volume XXXIX-B5, 2012 XXII ISPRS Congress, 25 August – 01 September 2012, Melbourne, Australia
201
order by apply the optimized ICP algorithm presented in this paper.
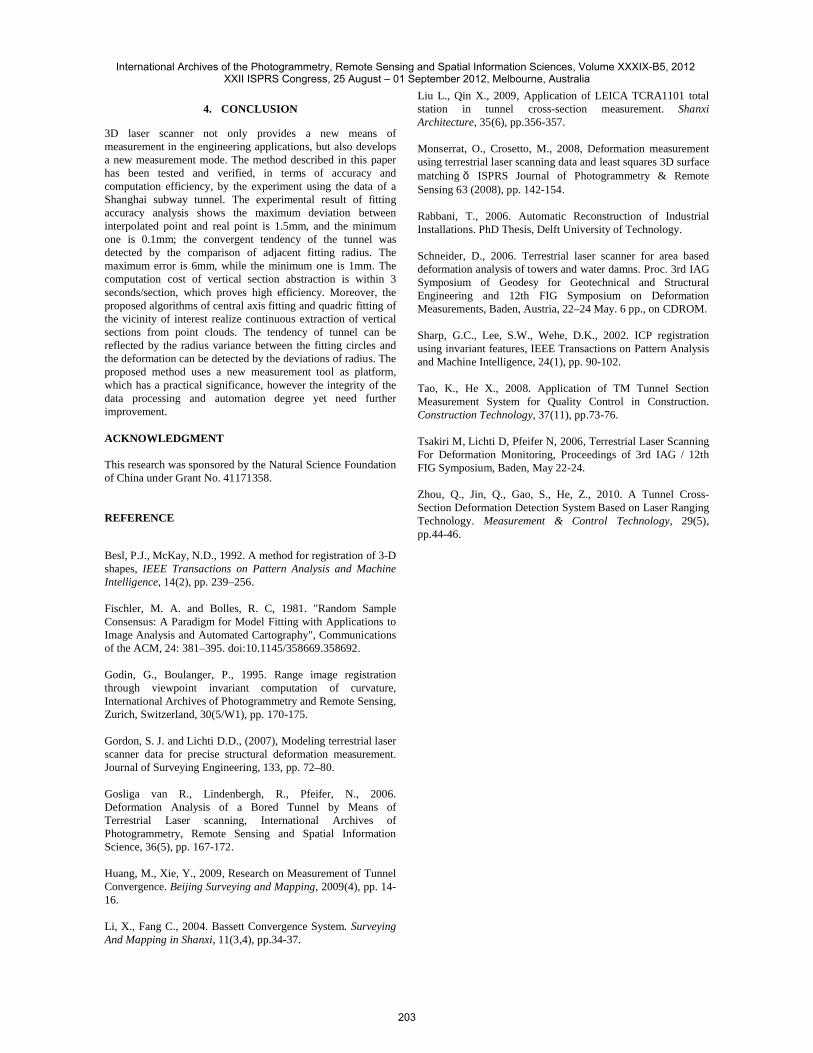
3.1 Central axis fitting
In this paper, the vertical section abstraction was fulfilled through the approach proposed in section 2.2. Firstly, the 3D point clouds were projected onto XOY-plane and YOZ-plane as Fig. 4, and the boundary points were extracted through a floating range. The fitting equation was obtained by parametersestimating through the RANSAC algorithm. To improve the computation efficiency, one more point in each sample was picked out for checking the temporary parameters. If the point is not conform to this model, the process of computing the consensus pointset will be skipped. The central axis of subway tunnel were calculated through the method presented in section2.2.
(a) Central axis in XOY-plane
(b) Central axis in YO Z-plane
Fig.4 Tunnel axis fitting
3.2 Abstraction based on Quadric fitting of the vicinity of interest
The vertical section can be continuously abstracted along the fitted central axis. Through the Y value the corresponding X and Z were computed out. Fig. 3 shows the extracting a region at each abstraction angle, and quadric fitting all the points in this region.
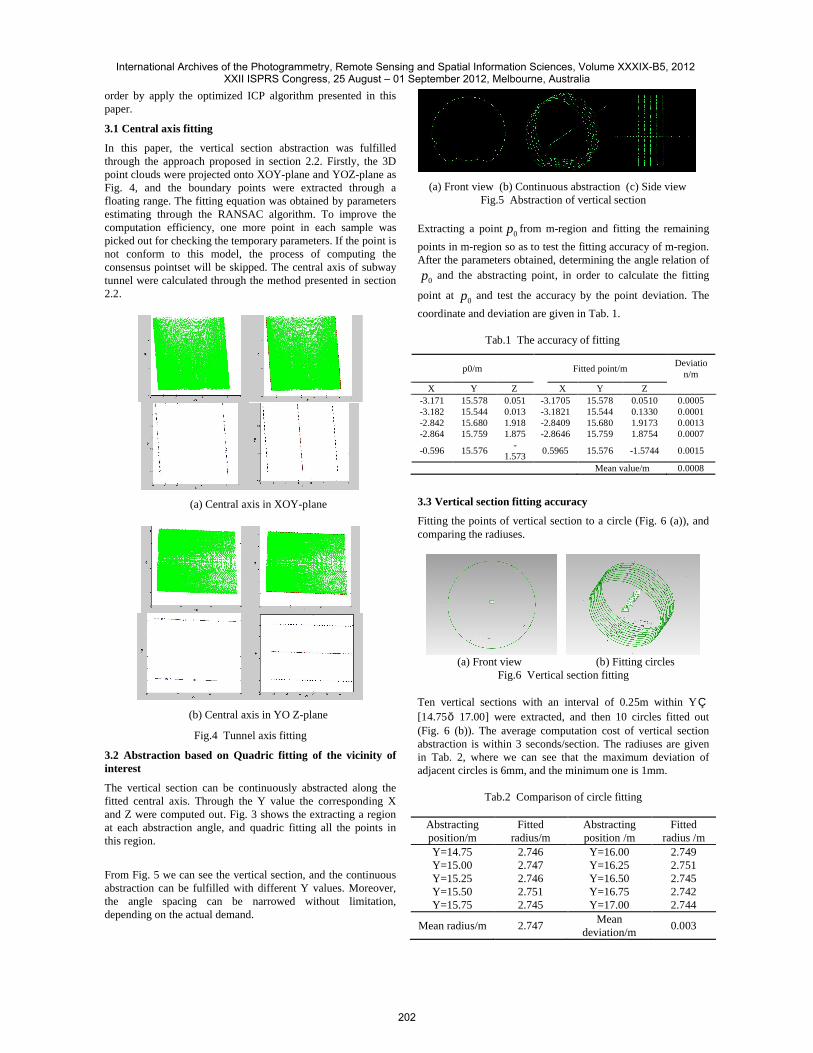
From Fig. 5 we can see the vertical section, and the continuous abstraction can be fulfilled with different Y values. Moreover, the angle spacing can be narrowed without limitation, depending on the actual demand.
(a) Front view (b) Continuous abstraction (c) Side viewFig.5 Abstraction of vertical section
Extracting a point 0p from m-region and fitting the remaining
points in m-region so as to test the fitting accuracy of m-region. After the parameters obtained, determining the angle relation of
0p and the abstracting point, in order to calculate the fitting
point at 0p and test the accuracy by the point deviation. The
coordinate and deviation are given in Tab. 1.
Tab.1 The accuracy of fitting
p0/m Fitted point/mDeviatio
n/m
X Y Z X Y Z-3.171 15.578 0.051 -3.1705 15.578 0.0510 0.0005-3.182 15.544 0.013 -3.1821 15.544 0.1330 0.0001-2.842 15.680 1.918 -2.8409 15.680 1.9173 0.0013-2.864 15.759 1.875 -2.8646 15.759 1.8754 0.0007
-0.596 15.576-
1.5730.5965 15.576 -1.5744 0.0015
Mean value/m 0.0008
3.3 Vertical section fitting accuracy
Fitting the points of vertical section to a circle (Fig. 6 (a)), and comparing the radiuses.
(a) Front view (b) Fitting circles
Fig.6 Vertical section fitting
Ten vertical sections with an interval of 0.25m within Y∈[14.75,17.00] were extracted, and then 10 circles fitted out (Fig. 6 (b)). The average computation cost of vertical section abstraction is within 3 seconds/section. The radiuses are given in Tab. 2, where we can see that the maximum deviation of adjacent circles is 6mm, and the minimum one is 1mm.
Tab.2 Comparison of circle fitting
Abstracting position/m
Fitted radius/m
Abstracting position /m
Fitted radius /m
Y=14.75 2.746 Y=16.00 2.749Y=15.00 2.747 Y=16.25 2.751Y=15.25 2.746 Y=16.50 2.745Y=15.50 2.751 Y=16.75 2.742Y=15.75 2.745 Y=17.00 2.744
Mean radius/m 2.747Mean
deviation/m0.003
International Archives of the Photogrammetry, Remote Sensing and Spatial Information Sciences, Volume XXXIX-B5, 2012 XXII ISPRS Congress, 25 August – 01 September 2012, Melbourne, Australia
202
4. CONCLUSION
3D laser scanner not only provides a new means of measurement in the engineering applications, but also develops a new measurement mode. The method described in this paper has been tested and verified, in terms of accuracy and computation efficiency, by the experiment using the data of a Shanghai subway tunnel. The experimental result of fitting accuracy analysis shows the maximum deviation between interpolated point and real point is 1.5mm, and the minimum one is 0.1mm; the convergent tendency of the tunnel was detected by the comparison of adjacent fitting radius. The maximum error is 6mm, while the minimum one is 1mm. The computation cost of vertical section abstraction is within 3 seconds/section, which proves high efficiency. Moreover, the proposed algorithms of central axis fitting and quadric fitting of the vicinity of interest realize continuous extraction of vertical sections from point clouds. The tendency of tunnel can be reflected by the radius variance between the fitting circles and the deformation can be detected by the deviations of radius. The proposed method uses a new measurement tool as platform, which has a practical significance, however the integrity of the data processing and automation degree yet need further improvement.
ACKNOWLEDGMENT
This research was sponsored by the Natural Science Foundation of China under Grant No. 41171358.
REFERENCE
Besl, P.J., McKay, N.D., 1992. A method for registration of 3-D shapes, IEEE Transactions on Pattern Analysis and Machine Intelligence, 14(2), pp. 239–256.
Fischler, M. A. and Bolles, R. C, 1981. "Random Sample Consensus: A Paradigm for Model Fitting with Applications to Image Analysis and Automated Cartography", Communications of the ACM, 24: 381–395. doi:10.1145/358669.358692.
Godin, G., Boulanger, P., 1995. Range image registration through viewpoint invariant computation of curvature, International Archives of Photogrammetry and Remote Sensing, Zurich, Switzerland, 30(5/W1), pp. 170-175.
Gordon, S. J. and Lichti D.D., (2007), Modeling terrestrial laser scanner data for precise structural deformation measurement. Journal of Surveying Engineering, 133, pp. 72–80.
Gosliga van R., Lindenbergh, R., Pfeifer, N., 2006. Deformation Analysis of a Bored Tunnel by Means of Terrestrial Laser scanning, International Archives of Photogrammetry, Remote Sensing and Spatial Information Science, 36(5), pp. 167-172.
Huang, M., Xie, Y., 2009, Research on Measurement of Tunnel Convergence. Beijing Surveying and Mapping, 2009(4), pp. 14-16.
Li, X., Fang C., 2004. Bassett Convergence System. Surveying And Mapping in Shanxi, 11(3,4), pp.34-37.
Liu L., Qin X., 2009, Application of LEICA TCRA1101 total station in tunnel cross-section measurement. Shanxi Architecture, 35(6), pp.356-357.
Monserrat, O., Crosetto, M., 2008, Deformation measurement using terrestrial laser scanning data and least squares 3D surface matching, ISPRS Journal of Photogrammetry & Remote Sensing 63 (2008), pp. 142-154.
Rabbani, T., 2006. Automatic Reconstruction of Industrial Installations. PhD Thesis, Delft University of Technology.
Schneider, D., 2006. Terrestrial laser scanner for area based deformation analysis of towers and water damns. Proc. 3rd IAG Symposium of Geodesy for Geotechnical and Structural Engineering and 12th FIG Symposium on Deformation Measurements, Baden, Austria, 22–24 May. 6 pp., on CDROM.
Sharp, G.C., Lee, S.W., Wehe, D.K., 2002. ICP registration using invariant features, IEEE Transactions on Pattern Analysis and Machine Intelligence, 24(1), pp. 90-102.
Tao, K., He X., 2008. Application of TM Tunnel Section Measurement System for Quality Control in Construction. Construction Technology, 37(11), pp.73-76.
Tsakiri M, Lichti D, Pfeifer N, 2006, Terrestrial Laser Scanning For Deformation Monitoring, Proceedings of 3rd IAG / 12th FIG Symposium, Baden, May 22-24.
Zhou, Q., Jin, Q., Gao, S., He, Z., 2010. A Tunnel Cross-Section Deformation Detection System Based on Laser Ranging Technology. Measurement & Control Technology, 29(5), pp.44-46.
International Archives of the Photogrammetry, Remote Sensing and Spatial Information Sciences, Volume XXXIX-B5, 2012 XXII ISPRS Congress, 25 August – 01 September 2012, Melbourne, Australia
203


![$ UDGLRPHWULF QRUPDOL]DWLRQ PHWKRG RI &RQWUROOLQJ … · The International Archives of the Photogrammetry, Remote Sensing and Spatial Information Sciences, Volume XLII-3/W10, 2020](https://img.pdfslide.us/doc/110x75/5fc25fffbcb70703bf51fbc5/-udglrphwulf-qrupdoldwlrq-phwkrg-ri-rqwuroolqj-the-international-archives.jpg)