Embed Size (px)
Citation preview
International Adjustmentand the
Great Recession
Dr. Catherine L. Mann
Professor, Brandeis International Business School Visiting Scholar, Federal Reserve Bank of Boston
Senior Fellow, Peterson Institute for International Economics
CLMann @Brandeis.edu
Northeastern University, January 26, 2010
2
Outline
Why an international lens?
Domestic vs. International adjustment in Great Recession
Adjustment in trade patterns and products
Adjustment in asset ownership and instruments
Observations for policymakers
3
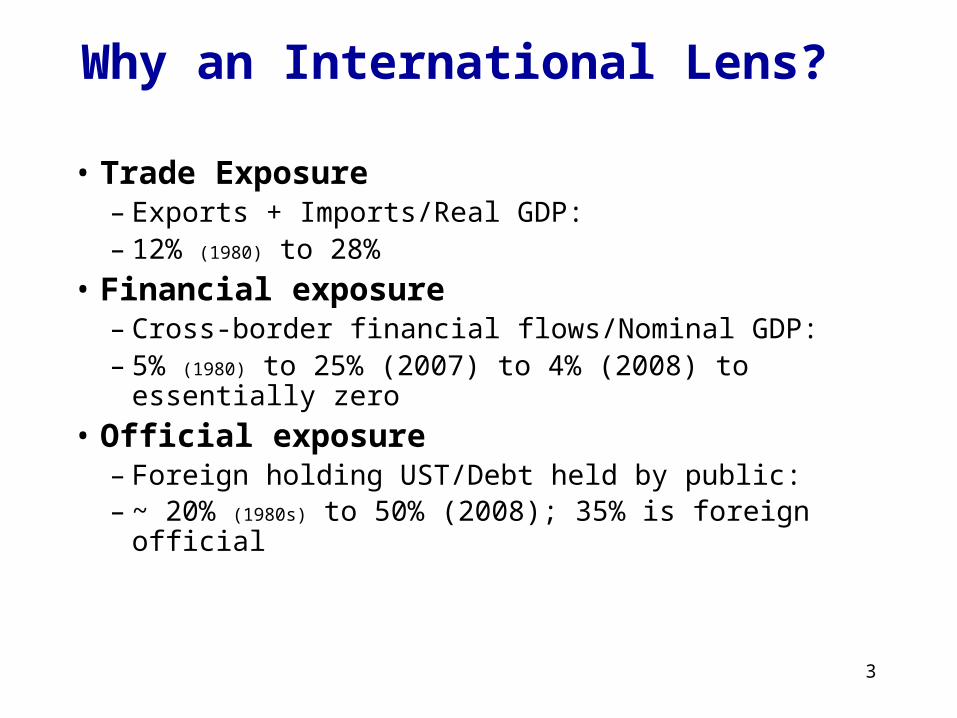
Why an International Lens?
• Trade Exposure– Exports + Imports/Real GDP: – 12% (1980) to 28%
• Financial exposure– Cross-border financial flows/Nominal GDP:– 5% (1980) to 25% (2007) to 4% (2008) to essentially zero
• Official exposure– Foreign holding UST/Debt held by public:– ~ 20% (1980s) to 50% (2008); 35% is foreign official
4
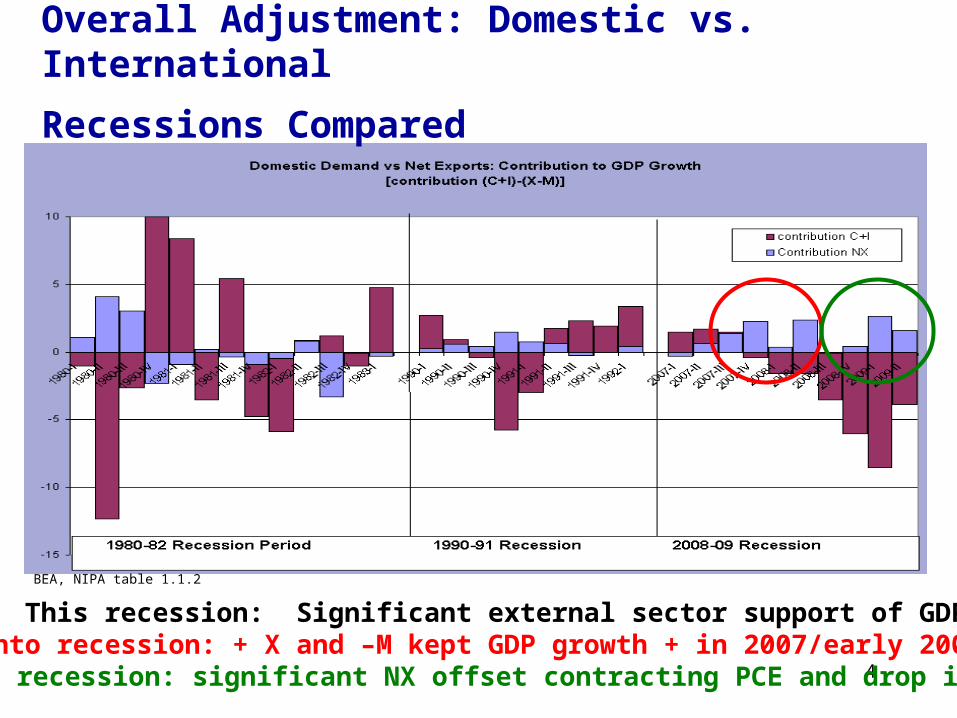
Overall Adjustment: Domestic vs. International
Recessions Compared
This recession: Significant external sector support of GDPInto recession: + X and –M kept GDP growth + in 2007/early 2008, In recession: significant NX offset contracting PCE and drop in I
BEA, NIPA table 1.1.2
5
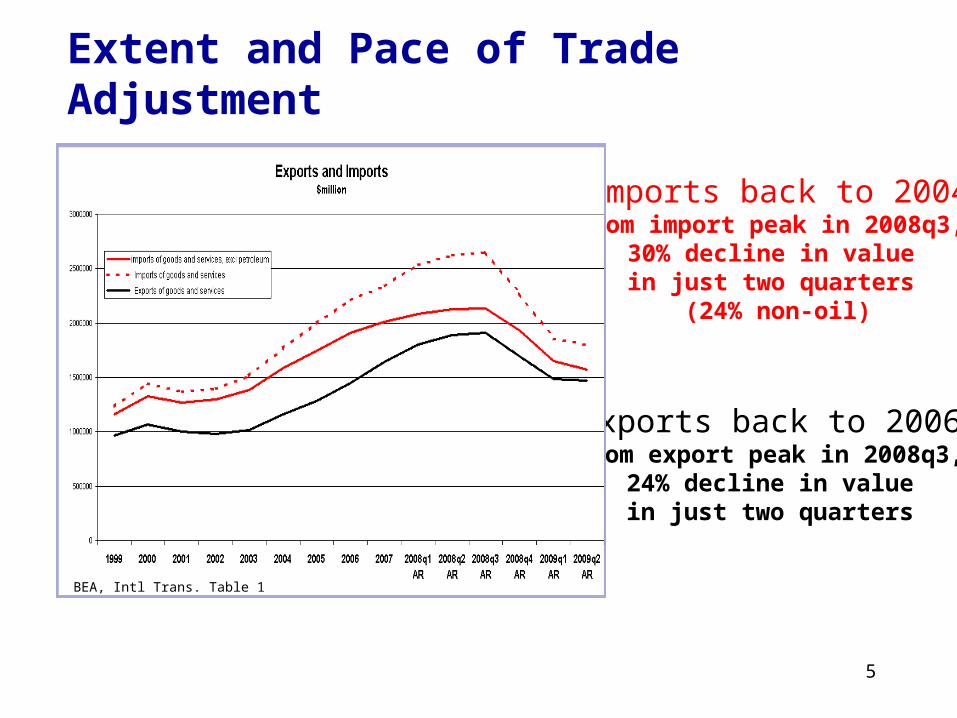
Imports back to 2004From import peak in 2008q3,
30% decline in value in just two quarters
(24% non-oil)
Exports back to 2006From export peak in 2008q3,
24% decline in value in just two quarters
Extent and Pace of Trade Adjustment
BEA, Intl Trans. Table 1
6
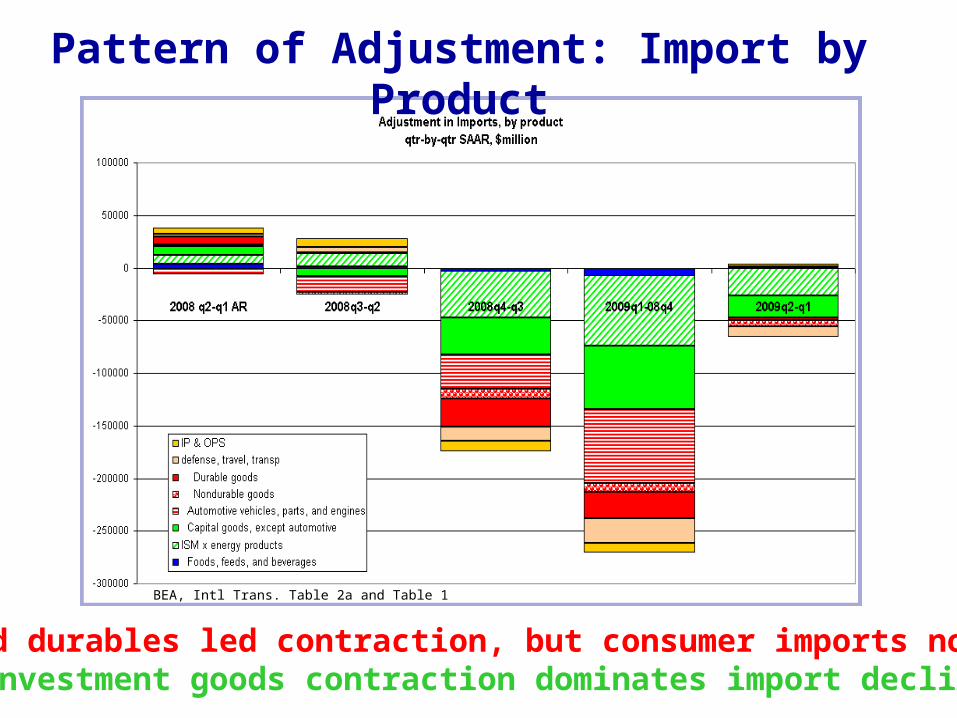
Pattern of Adjustment: Import by Product
Auto and durables led contraction, but consumer imports now stableInvestment goods contraction dominates import decline
BEA, Intl Trans. Table 2a and Table 1
7
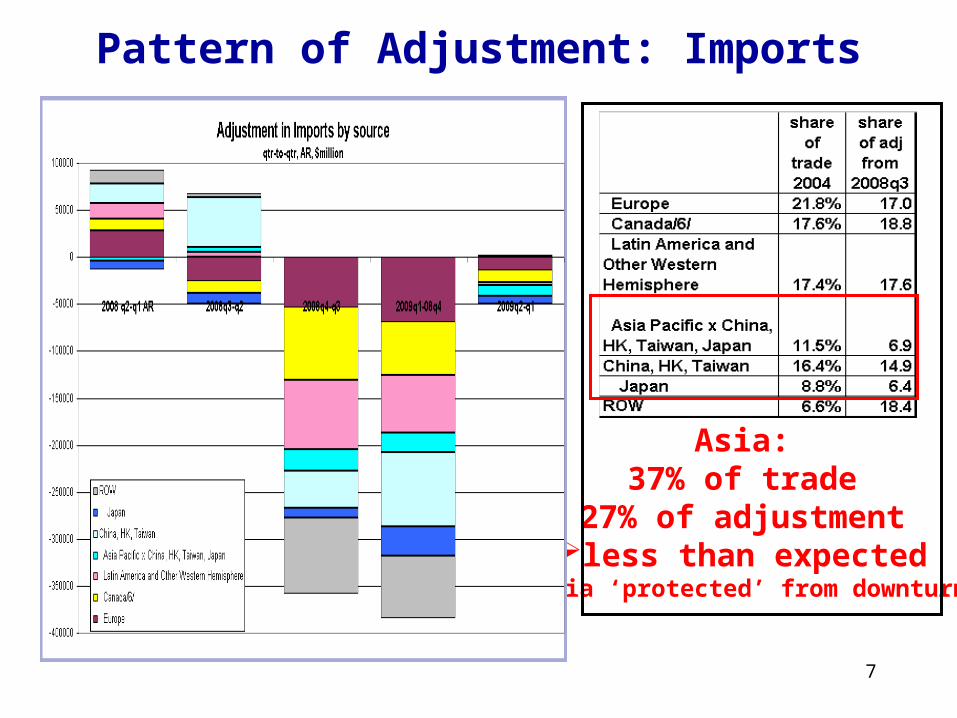
Pattern of Adjustment: Imports
Asia:37% of trade
27% of adjustmentless than expected
Asia ‘protected’ from downturn
8
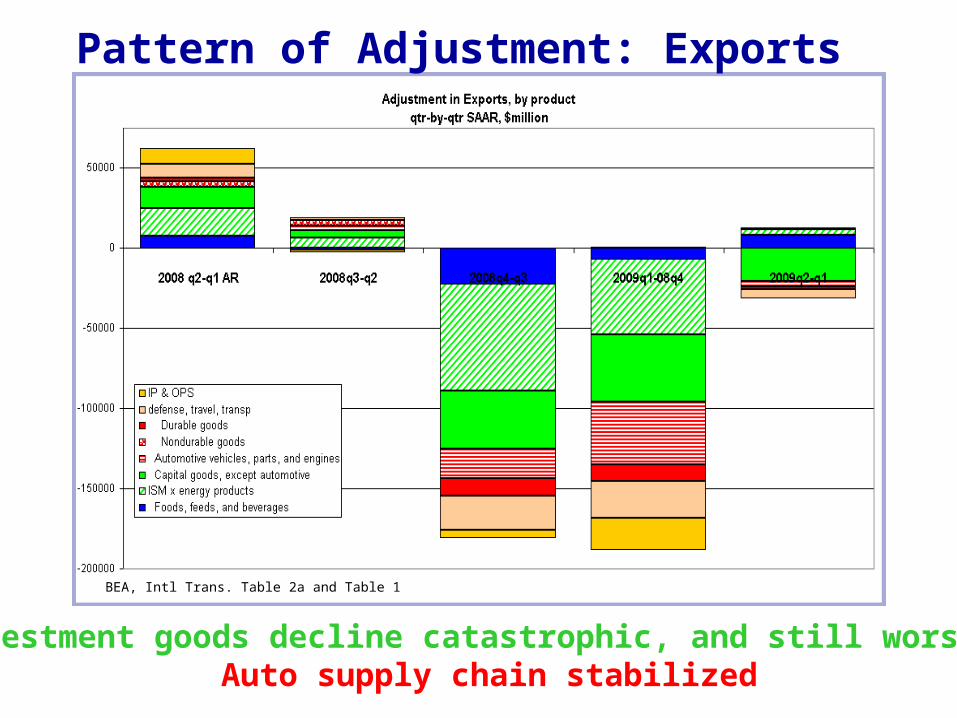
Pattern of Adjustment: Exports
Investment goods decline catastrophic, and still worseningAuto supply chain stabilized
BEA, Intl Trans. Table 2a and Table 1
9
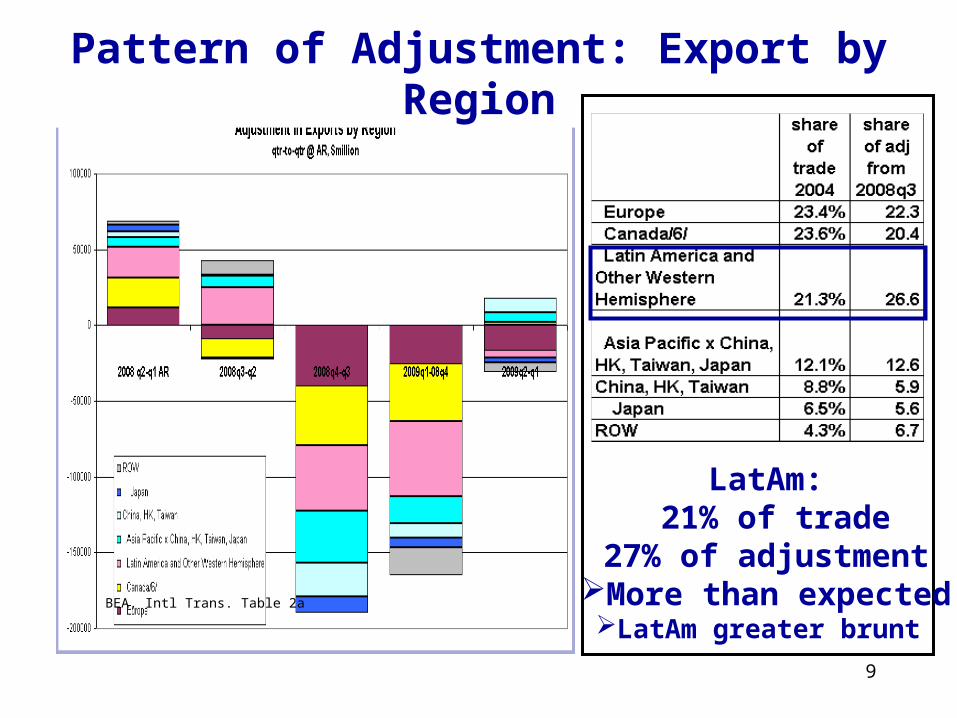
Pattern of Adjustment: Export by Region
BEA, Intl Trans. Table 2a
LatAm: 21% of trade
27% of adjustmentMore than expectedLatAm greater brunt
10
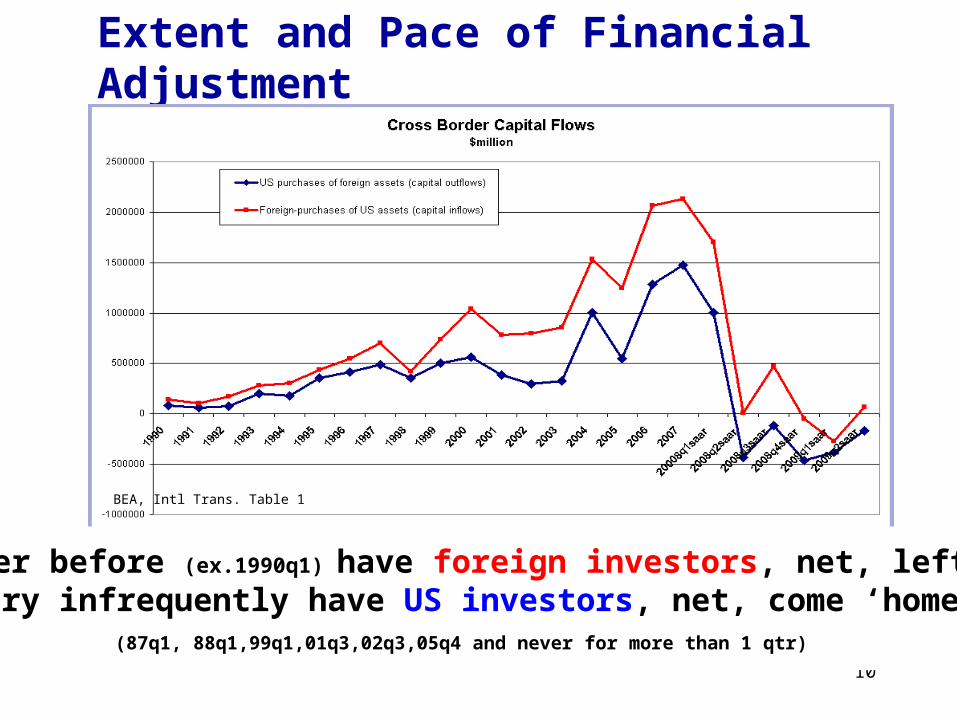
Extent and Pace of Financial AdjustmentUnprecedented
Almost never before (ex.1990q1) have foreign investors, net, left the U.S.Very infrequently have US investors, net, come ‘home’
(87q1, 88q1,99q1,01q3,02q3,05q4 and never for more than 1 qtr)
BEA, Intl Trans. Table 1
11
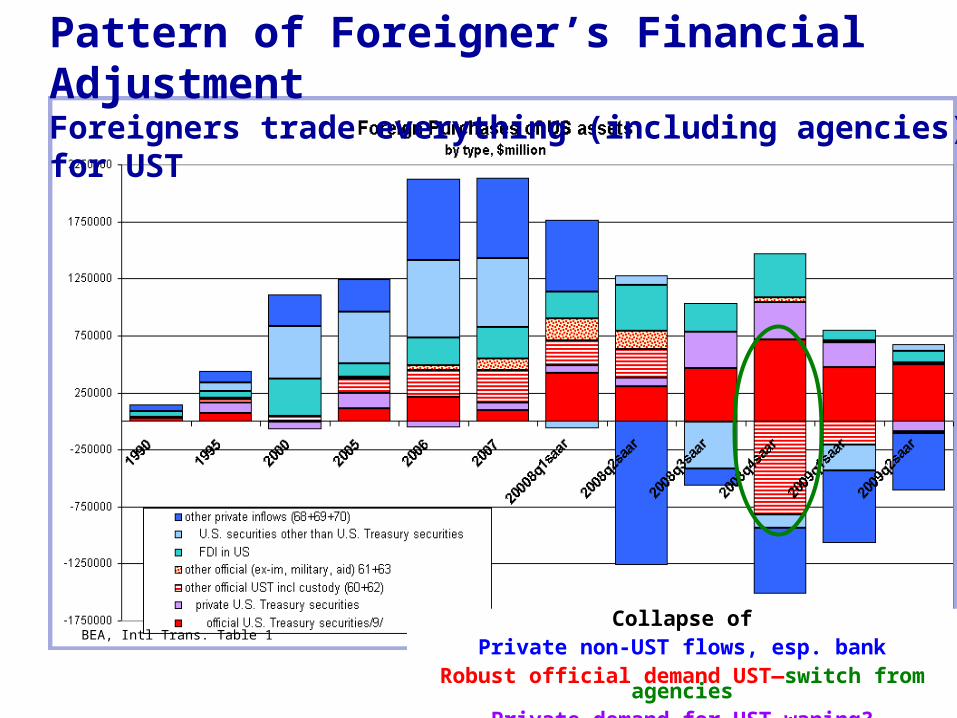
Pattern of Foreigner’s Financial AdjustmentForeigners trade everything (including agencies) for UST
BEA, Intl Trans. Table 1 Collapse of
Private non-UST flows, esp. bankRobust official demand UST—switch from agencies
Private demand for UST waning?
12
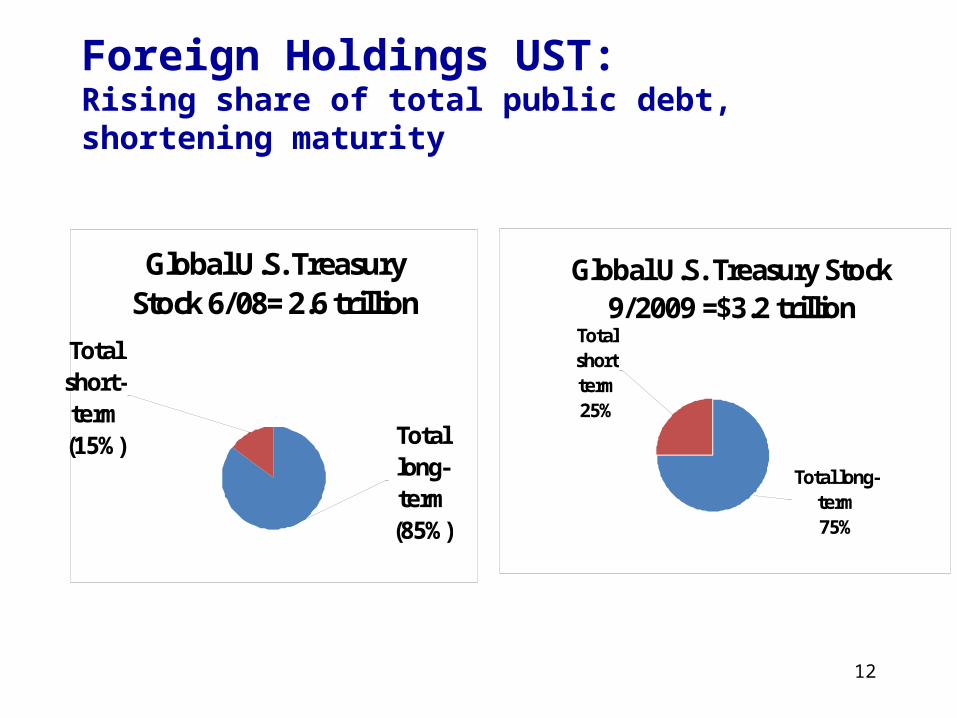
Foreign Holdings UST: Rising share of total public debt, shortening maturity
Global U.S. Treasury Stock 6/08= 2.6 trillion
Total long-term (85%)
Total short-term (15%)
Global U.S. Treasury Stock 9/2009 =$3.2 trillion
Total short term 25%
Total long-term 75%
13
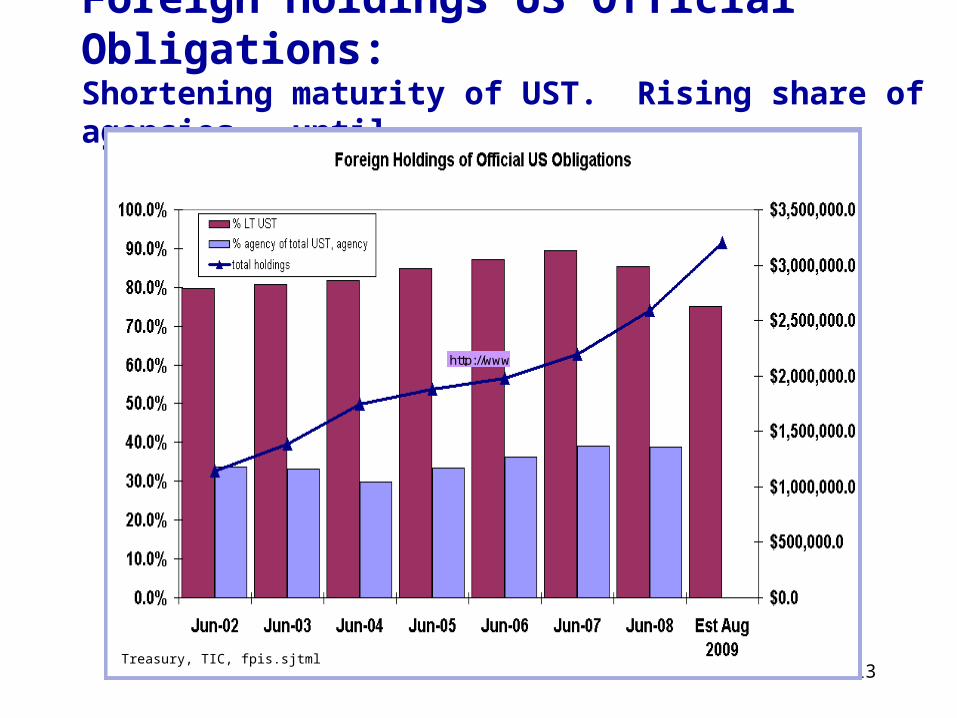
Foreign Holdings US Official Obligations: Shortening maturity of UST. Rising share of agencies.. until…
http://www.ustreas.gov/tic/fpis.shtml
Treasury, TIC, fpis.sjtml
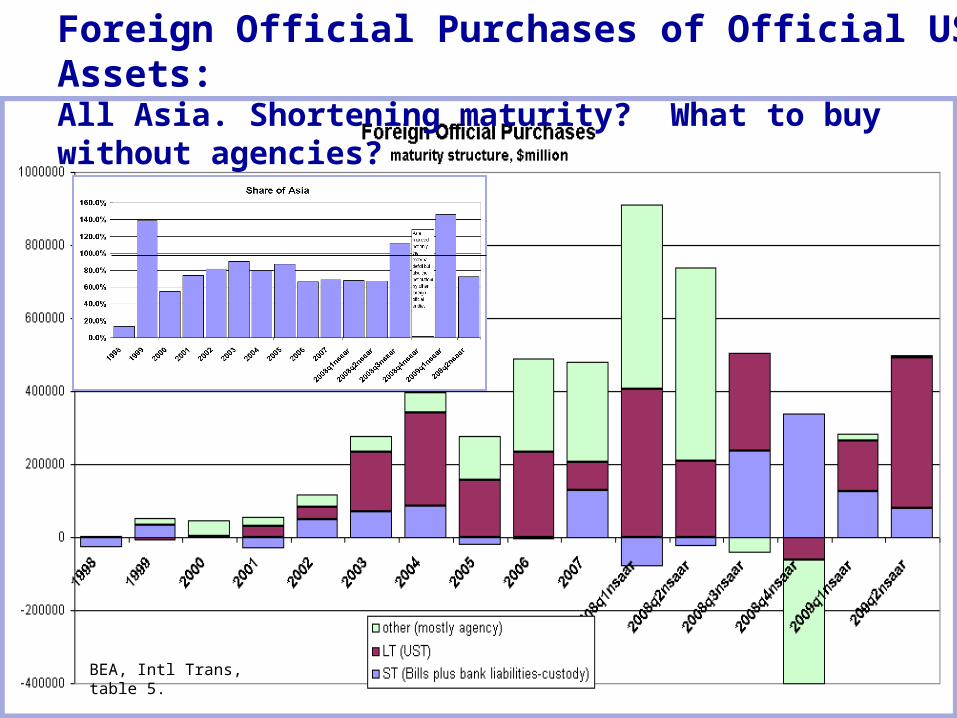
14BEA, Intl Trans, table 5.
Foreign Official Purchases of Official US Assets: All Asia. Shortening maturity? What to buy without agencies?
15
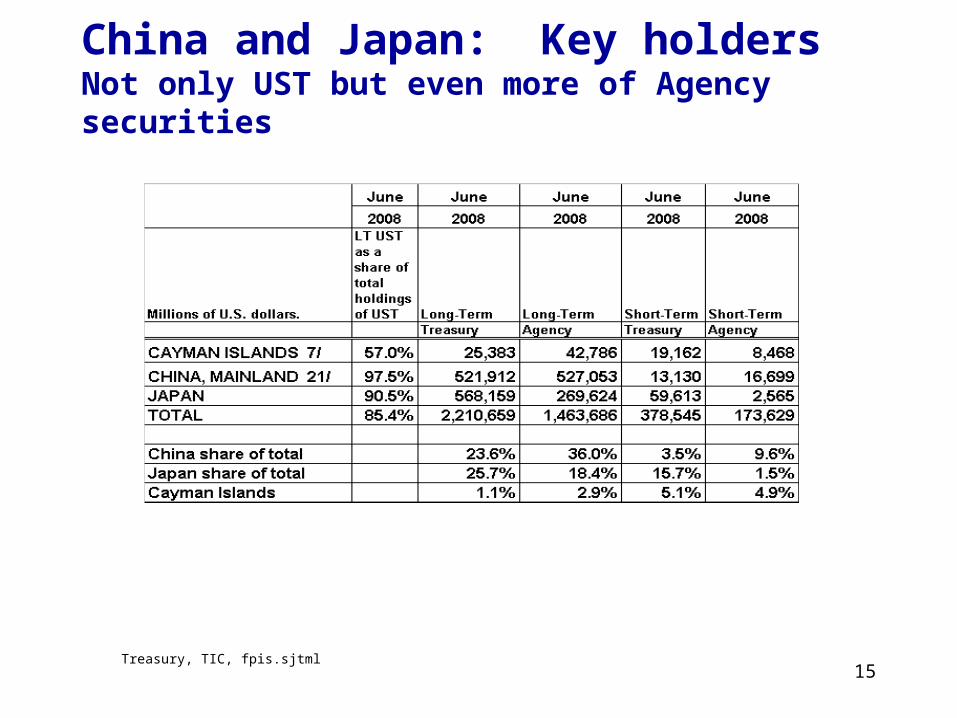
China and Japan: Key holdersNot only UST but even more of Agency securities
Treasury, TIC, fpis.sjtml
16
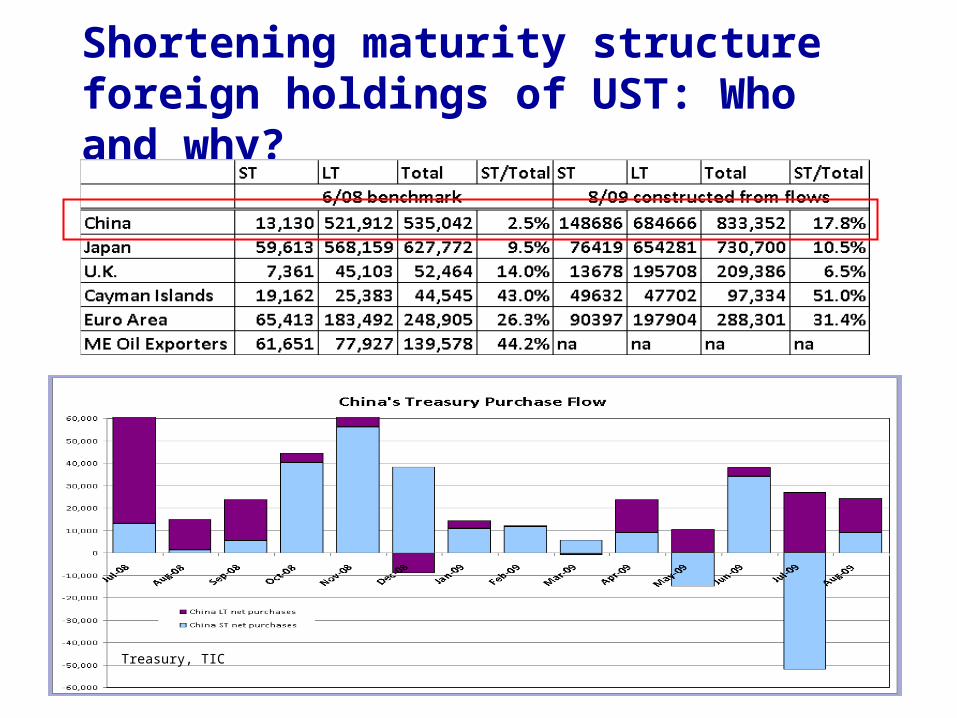
Shortening maturity structure foreign holdings of UST: Who and why?
Treasury, TIC
17
Summary: Trade Story
• Consumer-led recession
– but biggest import adjustment is via investment goods.
• Reviving consumer demand
– implies imports and return to a widening trade deficit,
sustainability issues
• Adjustment is less via Asia imports than expected,
more via LatAm exports than expected
– In large part due to differences in exchange rate adjustment
18
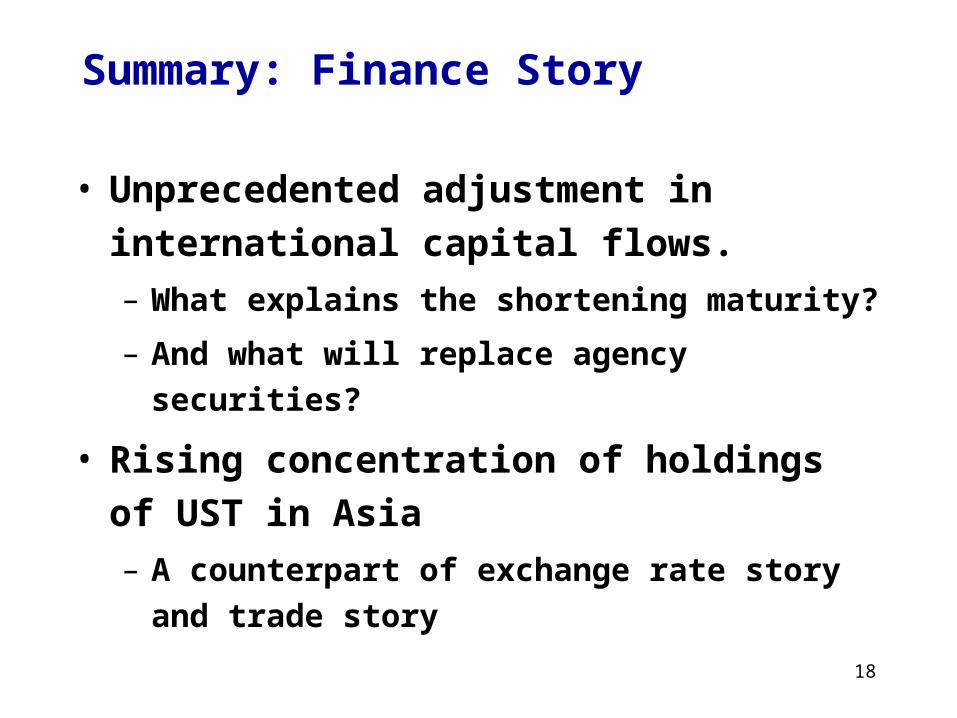
Summary: Finance Story
• Unprecedented adjustment in international capital
flows. – What explains the shortening maturity?
– And what will replace agency securities?
• Rising concentration of holdings of UST in Asia– A counterpart of exchange rate story and trade story
19
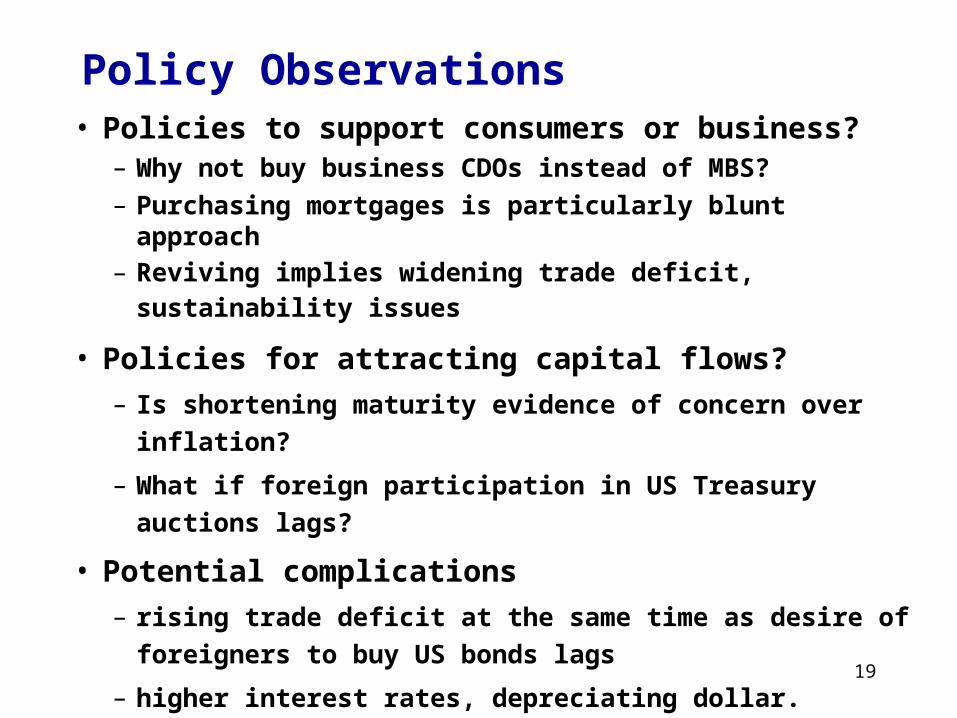
Policy Observations• Policies to support consumers or business?
– Why not buy business CDOs instead of MBS?– Purchasing mortgages is particularly blunt approach
– Reviving implies widening trade deficit, sustainability issues • Policies for attracting capital flows?
– Is shortening maturity evidence of concern over inflation?
– What if foreign participation in US Treasury auctions lags?
• Potential complications – rising trade deficit at the same time as desire of foreigners to
buy US bonds lags
– higher interest rates, depreciating dollar.