Embed Size (px)
Citation preview
International Accounting Standards and Accounting Quality
Mary Barth* Stanford University
Wayne Landsman and Mark Lang
University of North Carolina
March 2005 * Corresponding author: Graduate School of Business, Stanford University, 94305-5015, [email protected]. We appreciate research assistance of Yang Gui and Yaniv Konchitchki and funding from the Center for Finance and Accounting Research, Kenan-Flagler Business School.
International Accounting Standards and Accounting Quality
Abstract
We compare characteristics of accounting data for firms that adopt International Accounting Standards (IAS) to a matched sample of firms that do not to investigate whether reporting under IAS is associated with predictable differences in accounting quality and cost of capital. After IAS adoption, firms evidence less earnings management, more timely loss recognition, and more value relevance of accounting data than firms that do not adopt. Also, IAS adopting firms evidence higher accounting quality after adoption than before suggesting that IAS adoption is associated with an improvement in accounting quality. While more speculative, our results also provide weak evidence that IAS-adopting firms may enjoy lower cost of capital after adoption than non-adopting firms, and a reduction in cost of capital following adoption. Overall, our results suggest an improvement in accounting quality associated with IAS adoption.
I INTRODUCTION
We compare characteristics of accounting amounts for firms that adopt International
Accounting Standards (IAS) to a matched sample of firms that do not to investigate whether
reporting under IAS is associated with predictable differences in accounting quality and cost of
capital. In particular, we investigate whether applying IAS is associated with less earnings
management, more timely loss recognition, higher value relevance of accounting amounts, and a
lower cost of capital. We first conduct a cross-sectional comparison of IAS and matched non-
IAS firms in the period after IAS firms adopt. We then conduct a time-series examination of
whether IAS adopting firms increase accounting quality and decrease their cost of capital after
adopting IAS. Our results suggest that IAS firms have higher accounting quality and may have a
lower cost of capital than non-IAS firms. Further, we provide evidence of an improvement in
accounting quality and a reduction in cost of capital around the adoption of IAS, changes that are
not present to the same extent in our non-adoption sample over the same period.
Notwithstanding the formidable design hurdles that limit our ability to draw strong conclusions
from this type of analysis, the findings suggest that using IAS improves financial reporting. In
light of the impending changes to IAS promulgated by the International Accounting Standards
Board (IASB), our findings support the prospect of improvement in financial reporting as more
countries and firms adopt international accounting standards.1
The first IAS was published in 1975 by the International Accounting Standards
Committee (IASC), which was formed in 1973. Since then, the process for setting international
accounting standards has undergone substantial evolution, culminating in the 2001 restructuring
1 Given the inherent limitations of this type of research, one must be careful about drawing conclusions for the future from past experience. In particular, the effectiveness of IAS going forward will be a function of the evolution of the standards and the implementation of those standards. However, our results suggest that IAS may have improved financial reporting in the past which suggests that it may also do so in the future.

2
of the IASC into the IASB. As of January 1, 2005, all publicly listed companies in the European
Union are required to prepare financial statements in accordance with International Financial
Reporting Standards (IFRS), and the International Organization of Securities Commissions
recommends that the world’s securities regulators permit foreign issuers to use IFRS for cross-
border offerings.2 In addition, the Financial Accounting Standards Board has embarked on a
comprehensive project aimed at convergence between IFRS and US Generally Accepted
Accounting Standards (GAAP).
Despite the increasing importance of IAS, there is relatively little empirical evidence on
whether IAS appears to have improved accounting quality for firms that have adopted it, and the
existing evidence is mixed. As discussed in the next section, studies on Germany (Hung and
Subramanyam, 2004 and Bartov, Goldberg, and Kim, 2004) and China (Eccher and Healy, 2003)
provide mixed evidence on whether international accounting standards have improved reporting,
based on association of the resulting accounting data with share price. Other research suggests
that IAS lead to smaller analyst forecast errors, although forecast errors reflect a wide range of
influences beyond simply the quality of accounting data (Ashbaugh and Pincus, 2001).
Although it might seem inevitable that IAS would improve accounting, Cairns (1999), Street and
Gray (2001) and Ball, Kothari and Robin (2000) suggest that lax enforcement may result in
limited compliance with the standards, thereby limiting their effectiveness.
Our study differs from prior research on IAS in at least two ways. First, our study
encompasses a broad sample of firms using IAS in 23 countries, and includes adoption years
covering 1994-2003, thereby resulting in a much longer and broader sample period than those in
2 IFRS are the standards issued by the IASB, and IAS are the standards issued by the IASC, some of which have been amended by the IASB after it succeeded the IASC. Because the IASB adopted all of the standards issued by the IASC, IFRS encompasses all standards by the IASC and the IASB. Our sample period predates the effective dates of standards issued by the IASB. Thus, throughout we refer to use by our sample firms of IAS rather than IFRS.
3
prior research. There are advantages and disadvantages associated with studies focused on
particular countries and time periods relative to those involving broader sampling criteria.
Whereas studies focusing on a single country benefit from having research designs that control
for other country-specific factors, it is difficult to extrapolate inferences relating to their findings
to other countries. By considering a broader sample, we hope to be able to draw conclusions that
are more representative of the effects of IAS. Also, because we consider a range of countries
and years, we are more comfortable that results are not limited to a small subset of countries or
years.
Second, we directly focus on the characteristics of the resulting accounting amounts
under IAS. Whereas several studies provide indirect evidence of the quality of accounting
amounts (e.g., analyst earning forecast errors or value relevance), results are generally mixed,
and other confounding aspects of markets and firms’ information environments make it more
difficult to attribute results to the effect of IAS. Although we include measures based on value
relevance, we follow prior research (e.g., Leuz, Nanda, and Wysocki, 2003) in focusing more
directly on the characteristics of accounting data to provide evidence on earnings management,
particularly earnings smoothing, and timely loss recognition. We focus on earnings management
metrics because a common concern with applying IAS is that the inherent flexibility IAS affords
allows firms to manage earnings, which has long been a concern of securities markets regulators
(e.g., Breeden, 1994).3
Our metrics of earnings management are the variance of the change in net income, the
ratio of the variance of the change in net income to the variance of the change in cash flows, the
3 Admittedly, a concern with our analysis is that IAS continue to evolve, so the past is not necessarily representative of the future. However, we believe that providing evidence on the effectiveness of current standards while new standards are being developed is potentially more valuable than waiting until the standards are issued. Further, results suggesting that even the early stages of IAS development provided improvements in accounting quality provide some comfort that IAS may improve accounting quality going forward.
4
correlation between accruals and cash flows, and the frequency of small positive net income
(Leuz, Nanda, and Wysocki, 2003; Lang, Raedy and Yetman, 2003; Lang, Raedy and Wilson,
2005). We argue that higher quality earnings are those that evidence less earnings management.
Therefore, following prior research, we interpret higher variance of the change in net income,
higher ratio of the variances of the change in net income and change in cash flows, less negative
correlation between accruals and cash flows, and a lower frequency of small positive net income
as evidence of less earnings management. Our metric of timely loss recognition is the frequency
of large negative net income (Lang, Raedy, and Yetman, 2003; Lang, Raedy, and Wilson, 2005).
Consistent with prior research we interpret a higher frequency of large negative net income as
evidence of higher earnings quality. Finally, our metrics for value relevance are the explanatory
power of income and equity book value for prices, and stock return for earnings. We interpret
higher explanatory power as evidence of higher accounting quality.4
Finally, we provide preliminary evidence on the effects of using IAS on firms’ cost of
equity capital. Cost of capital reduction is a benefit of using IAS anticipated by standard setters.5
We estimate equity cost of capital based on the three factor model of Fama and French (1993).
If firms using IAS have higher quality accounting amounts and there is a link between
accounting quality and equity cost of capital, then firms using IAS may enjoy a lower cost of
capital. We view this analysis as exploratory because it is well known that obtaining accurate
estimates of cost of capital is difficult.
4 The importance of examining multiple dimensions of accounting quality is illustrated by asset impairments. The presence of large asset impairments likely is positively associated with frequency of large negative net income, but could reduce the value relevance of accounting earnings because extreme losses tend to have a low correlation with share prices and returns. See also Wysocki (2005) for a discussion of various approaches to assessing accounting quality. 5 For example, in discussing adoption of IFRS, Bob Herz, chairman of the FASB notes, “It’s about lowering the cost of capital, lowering the cost of preparation and lowering the cost of using information” (http://business.timesonline.co.uk/article/0,,16649-1245761,00.html).
5
We find that after adoption, IAS-adopting firms evidence less earnings management,
more timely loss recognition, and more value relevance of accounting amounts than firms that do
not adopt. In particular, firms adopting IAS have significantly higher variance of the change in
net income, a higher ratio of the variances of the change in net income and change in cash flows,
and a lower frequency of small positive net income. In addition, they have a higher frequency of
large negative net income and higher value relevance of accounting amounts. Pre-adoption
differences between IAS adopting and non-IAS adopting firms do not explain the post-adoption
differences in earnings quality. Prior to adopting IAS, firms either insignificantly differ from
non-adopting firms or have metrics consistent with lower accounting quality. Consistent with
these findings relating to accounting quality, we also find weak evidence that IAS adopting firms
may enjoy a lower cost of capital after adoption than non-adopting firms.
The remainder of our paper is organized as follows. The next section discusses prior
research. This is followed by sections describing our empirical approach, an overview of our
sample and data, and the study’s primary results. These are followed by a section on cost of
capital and a final section presenting conclusions and ongoing analyses.
II. PRIOR RESEARCH
As noted earlier, several studies compare IAS to local-GAAP accounting amounts in
particular countries. Hung and Subramanyam (2004) compares the effects of using IAS to those
of using German GAAP for a sample of eighty German firms that elected to adopt IAS. The
study exploits a unique requirement that adopting firms provide both IAS and German GAAP
amounts in the year of adoption, and documents that the most common sources of reconciling
items relate to deferred taxes, pensions and property, plant and equipment. Further, the
adjustments to net income generally are not value relevant. Although the results are interesting,
6
they may not generalize to other environments for several reasons. First, the sample is relatively
small and fairly unique. Further, as Lang, Raedy, and Yetman (2003) observe, firms preparing to
adopt new accounting standards likely transition gradually, changing accounting in their local
GAAP financial statements to avoid reconciling items. Consistent with that, Hung and
Subramanyam (2004) finds relatively few reconciling items related to earnings management,
such as hidden reserves, which is striking because the existence of such earnings management
items is a common concern with German GAAP.
Second, the conclusions in Hung and Subramanyam (2004) are inconsistent with those in
Bartov, Goldberg, and Kim (2004), which also compares the effects of IAS and German GAAP.
In particular, Bartov, Goldberg, and Kim (2004) examines the value relevance of earnings by
focusing on the magnitude of its coefficients in regressions of returns on earnings based on US
GAAP, IAS, and German GAAP. In contrast to Hung and Subramanyam (2004), Bartov,
Goldberg, and Kim (2004) conduct their analysis in cross-section and provide evidence that
accounting earnings based on IAS are more value relevant than those based on German GAAP
(although less value relevant than those under US GAAP). Again, the difference in results may
reflect the fact that, at the time of IAS adoption, differences between IAS and local GAAP are
less pronounced than in the typical year.
Eccher and Healy (2003) compares the value relevance of accounting amounts based on
IAS to those based on Chinese GAAP for a sample of firms in the People’s Republic of China.
The study finds that accounting amounts based on IAS are not more value relevant than those
based on Chinese GAAP for firms that can be owned by foreign investors. Further, accounting
amounts based on IAS are less value relevant than those based on Chinese GAAP for firms that

7
are limited to domestic investors. The authors posit that one reason for the modest performance
of IAS may be the lack of effective controls and infrastructure to monitor reporting under IAS.
Using an alternative approach, Ashbaugh and Pincus (2001) investigates whether
deviations of local standards relative to IAS cause earnings to be more difficult to forecast, and
whether forecasts errors are smaller following adoption of IAS. The study finds that the greater
the difference between domestic GAAP and IAS, the greater are the forecast errors and that
forecast errors tend to be smaller after firms adopt IAS. Although earnings forecastability may
be correlated with accounting quality, it confounds accounting quality with the effects of factors
present in the firm’s information environment, including analyst private information acquisition
and the transparency of other disclosures. Because adoption of IAS and development of
domestic GAAP similar to IAS likely occur together, financial statements for firms that adopt
IAS or in countries that develop domestic GAAP that is similar to IAS are likely to be more
transparent in general. In addition, the enforcement and attestation environment in countries
with accounting standards closer to IAS also are more likely to have better implementation of
those standards. Further, it is not clear that forecastable earnings are of higher quality because,
for example, smoothed earnings will typically be more forecastable, but are not necessarily of
higher quality.
The findings from these papers offer mixed evidence concerning whether IAS adoption
improves accounting quality. One potential reason for this suggested by the findings in Cairns
(1999) and Street and Gray (2001) is substantial noncompliance with IAS among firms
purportedly using IAS. In particular, Street and Gray (2001) examines the 1998 financial
statements for 279 firms that refer to use of IAS in their financial statements. The study
8
examines disclosed accounting policies for consistency with major IAS pronouncements and
finds that, in many cases, disclosed accounting policies are inconsistent with IAS.
Although not directly focused on IAS, Ball, Kothari, and Robin (2000) reaches similar
conclusions based on attributes of accounting amounts for firms in Hong Kong, Malaysia,
Singapore, and Thailand, where accounting standards are largely derived from common law
sources and therefore are similar to IAS. The study finds that accounting amounts of firms in
these countries are of no higher quality (as measured by timely recognition of economic income)
than are those of firms in code law countries. The authors attribute this finding to differing
incentives of managers and auditors across these reporting regimes, thereby highlighting the
importance of considering factors beyond accounting standards when comparing the quality of
accounting amounts associated with domestic GAAP and IAS.
Several papers also provide comparisons of IAS to US GAAP. For example, Leuz (2003)
compares measures of information asymmetry and market liquidity for firms trading in
Germany’s New Market, which must choose between IAS and US GAAP in preparing their
financial statements. The study finds that there is little evidence of differences in measures of
information asymmetry for German firms that adopt US GAAP relative to those that adopt IAS.
However, Harris and Muller (1999) documents that, for a small sample of IAS firms cross-listing
on US markets, accounting amounts reconciled to US GAAP are more value relevant than the
original IAS amounts.6 As with the evidence comparing IAS to domestic GAAP, existing
research provides mixed evidence on the superiority of IAS relative to US GAAP. Overall,
therefore, we view the extent to which IAS improve accounting quality as an open question.
6 One study that indirectly compares IAS and US GAAP, Ashbaugh and Olsson (2002), compares valuation models apparently used in valuing non-US firms that are cross-listed on the International Stock Exchange in London, and finds that firms using IAS appear to be valued based on an earnings capitalization model, whereas those using US GAAP appear to be valued based on a residual income model.
9
III. EMPIRICAL DESIGN
We base our inferences on a consistent pattern of evidence provided by a series of
measures of accounting quality identified in prior research. We group our measures into three
categories: earnings management, timely loss recognition, and value relevance. Similar to those
studies examining differences between cross-listed and other firms (Lang, Raedy, and Yetman,
2003; Lang, Raedy, and Wilson, 2005), it is possible that firms’ decisions to use IAS are
associated with underlying firm characteristics that could also be associated with our accounting
quality measures. As a result, we utilize a matched sample based on home country, industry, and
size. Consistent with Lang, Raedy, and Yetman (2003) and Lang Raedy, and Wilson (2005) but
modified to our context, we first match each ADOPT firm exactly on country and industry
(three-digit SIC code). We then select the NADOPT firm from potential non-adopting firms as
that firm whose equity market value is closest to the ADOPT firm’s at the end of the year of
adoption. Once a non-adopting firm is selected as a match, it is not considered as a potential
match for other ADOPT firms. In a few cases, potential matching firms do not have market
value of equity available in the adoption year. In those cases, we consider market value of equity
for the two years before and after the adoption year.7
We first compare ADOPT and NADOPT firms in the post-adoption period to see if
accounting amounts determined using international accounting standards evidence higher
quality. It is possible that despite our matching procedure, ADOPT and NADOPT firms exhibit
differences in quality in the post-adoption period because they differ before adoption. Thus, we
also compare their accounting quality in the pre-adoption period. Finally, to assess whether
adoption of international accounting standards changes accounting quality for the typical 7 We also considered a variety of other matching procedures (e.g., permitting the same matching firms to be used multiple times and considering only matching firms with market value of equity in the adoption year). Inferences are similar using these alternative procedures.
10
ADOPT firm, we compare accounting quality for our ADOPT firms in the pre-adoption period to
the post-adoption period.
Earnings Management
We employ several measures of earnings management. To the extent that results are
consistent across the measures, there is greater assurance that findings can be attributed to
earnings management rather than other factors. Our measures are designed to detect earnings
smoothing and managing earnings towards a target of positive earnings.
Our measures of earnings smoothing focus on variability of earnings (Leuz, Nanda, and
Wysocki, 2003; Lang, Raedy, and Yetman, 2003; Lang, Raedy, and Wilson, 2005). Earnings
that are smoothed should be less variable than those that are not. We predict that ADOPT firms
have less smooth earnings than NADOPT firms. The basis of this prediction is that international
accounting standards are based on a conceptual framework similar to that found in common law
countries, and Leuz et al. (2002) finds that earnings smoothing is more pronounced non-common
law countries. The three earnings smoothing measures we use are similar to those in Leuz et al.
(2003).
The first earnings smoothing measure is the variability of the change in net income scaled
by total assets, NI∆ . A smaller variance is evidence consistent with earnings smoothing. Our
second measure of earnings smoothing is the ratio of the variability of the change in net income,
NI∆ , to the variability of the change in operating cash flows, CF∆ . Firms with more volatile
cash flows typically have more volatile net income, and our second measure controls for this. If
firms use accruals to manage earnings, the variability of the change in net income should be

11
lower than that of operating cash flows.8 We winsorize these two measures at the 5% level
because variance measures are sensitive to outliers.
Our third measure of earnings smoothing is the Spearman correlation between accruals,
ACC, and cash flows, CF. Because accounting accruals reverse over time, we expect that
accruals and cash flows are negatively correlated. Myers and Skinner (2002) and Land and Lang
(2002), among others, argue that a more negative correlation is suggestive of earnings smoothing
because managers appear to respond to poor cash flow outcomes by increasing accruals.
Another approach to examining earnings management is to focus on targets toward which
firms might manage earnings. A common target is small positive earnings (Burgstahler and
Dichev, 1997 and Leuz, Nanda, and Wysocki, 2003). The notion underlying this measure is that
management prefers to report small positive earnings rather than negative earnings. Our measure
is the coefficient on small positive net income, SPOS, in the following regression:9
itititit
itititit
SPOSCFTURNDISSUE
LEVEISSUEGROWTHSIZEADOPT
εαααα
ααααα
++++
+++++=
8765
43210)1,0( (1)
where )1,0(ADOPT is an indicator variable set to one for ADOPT firms and zero for NADOPT
firms, SPOS is an indicator variable that equals one if net income scaled by total assets is
between 0 and 0.01 (Lang, Raedy, and Yetman, 2003), SIZE is the natural log of end of year
market value of equity, LEV is end of year total liabilities divided by end of year total equity
book value, GROWTH is percentage change in sales, EISSUE is percentage change in common
8 Datastream provides several definitions of operating income. The one we use does not include extraordinary items and other non-operating income. However, because of the concern that the criterion for extraordinary items differs across countries and that excluding extraordinary items would result in differences based on the location on the income statement of one-time items, we replicate the analysis including extraordinary and non-operating items. Results are similar. 9 In both the analysis of small positive net income and large negative net income, we report results from OLS estimation rather than from a logit estimation because the model rejects the test for homoskedasticity at the 1% level. Greene (1993) reports that logit models are extremely sensitive to the effects of heteroskedasticity.
12
stock, DISSUE is percentage change in total liabilities, CF is annual net cash flow from
operating activities, and TURN is sales divided by end of year total assets. A negative
coefficient on SPOS suggests that NADOPT firms manage earnings toward small positive
amounts more frequently than do ADOPT firms. Equation (1) includes variables to control for
differences in economic factors associated with firms adopting IAS that might not be captured by
the matched sample design.10
Timely Loss Recognition
The next dimension of accounting quality we consider is timely loss recognition. Ball,
Kothari, and Robin (2000), Lang, Raedy, and Yetman (2003), and Lang, Raedy, and Wilson
(2005) suggest that one characteristic of higher quality earnings is that large losses are
recognized as they occur rather than being deferred to future periods. This characteristic is
closely related to earnings smoothing in that if earnings are smoothed, large losses should be
relatively rare. Following Lang, Raedy, and Yetman (2003), and Lang, Raedy, and Wilson
(2005), we measure timely loss recognition as the coefficient on the percentage of large negative
net income, LNEG, in the following regression:
itititit
itititit
LNEGCFTURNDISSUE
LEVEISSUEGROWTHSIZEADOPT
εαααα
ααααα
++++
+++++=
8765
43210)1,0( (2)
where all variables are defined as in equation (1) except for LNEG, which is an indicator variable
set to one for observations for which annual net income scaled by total assets is less than −0.20,
and zero otherwise. A positive coefficient on LNEG suggests that ADOPT firms recognize large
losses more readily than NADOPT firms. As with equation (1), equation (2) includes variables
10 The control variables are based on those found in Pagano et al. (2002), which models firms’ decisions to cross list their securities, and Lang, Raedy, and Yetman (2003) and Lang, Raedy, and Wilson (2005) which examine accounting quality in an international context. Another approach would be to use SPOS as the dependent variable and ADOPT as an independent variable. Results are similar for that specification.
13
to control for differences in economic factors associated with firms adopting IAS that might not
be captured by the matched sample design.
Value Relevance
The final measures of accounting quality we consider relate to value relevance. The
presumption is that higher quality accounting amounts have a higher association with share
prices and returns (Barth, Beaver, and Landsman, 2001; Lang, Raedy, and Yetman, 2003; Lang,
Raedy, and Wilson, 2005). Because we expect ADOPT firms to have higher quality accounting
amounts, we predict that ADOPT firms will have higher value relevance measures. The first
value relevance measure is the R2 from a regression of stock price on earnings and equity book
value. Following Lang, Raedy, and Yetman (2003) and Lang, Raedy, and Wilson (2005), we
regress price, PRICE, as of six months after year-end on book value per share, BVEPS, and net
income per share, NIPS, separately for ADOPT and NADOPT firms: 11
itititit NIPSBVEPSPRICE εβββ +++= 210 (3)
The second value relevance measure is based on the R2 from a regression of earnings on
stock returns, which we estimate separately for ADOPT and NADOPT firms:
ititit RETURNPNI εββ ++= 10/ (4)
where PNI / is net income divided by beginning of year stock price, and RETURN is the
twelve-month stock return, commencing nine months before fiscal year end and ending three
months after fiscal year end (Lang, Raedy, and Wilson, 2005). Higher quality earnings should
result in a higher association with stock returns to the extent that firms that manage earnings
have a lower association between earnings and stock returns. We estimate equation (4) as a
11 Brown, Lo, and Lys (1999) discusses scale issues related to inferences from price level regressions when samples differ in terms of general share price levels. The study recommends deflating the regression variables by past price to mitigate the effect of scale. As a consequence, consistent with Lang, Raedy, and Wilson (2005), we deflate all variables by price as of six months after the preceding year end.
14
“reverse” regression with accounting earnings as the dependent variable rather than stock return
because this permits us to partition firms based on the sign of the return when considering
whether the association differs for good news, i.e., positive stock return, and bad news, i.e.,
negative stock return. Ball, Kothari, and Robin (2000) predicts that accounting quality
differences will be most pronounced for bad news because when firms have good news they
have less incentive to manage earnings. To examine whether this is the case, we also estimate
equation (4) separately for positive and negative return subsamples of ADOPT and NADOPT
firms.
IV. DATA
Our sample comprises 2,295 firm year observations for 411 firms adopting IAS for which
Datastream data are available over the period 1990 through 2004. We obtain our sample of IAS
adopters from Worldscope, and gather financial and accounting data from Datastream.
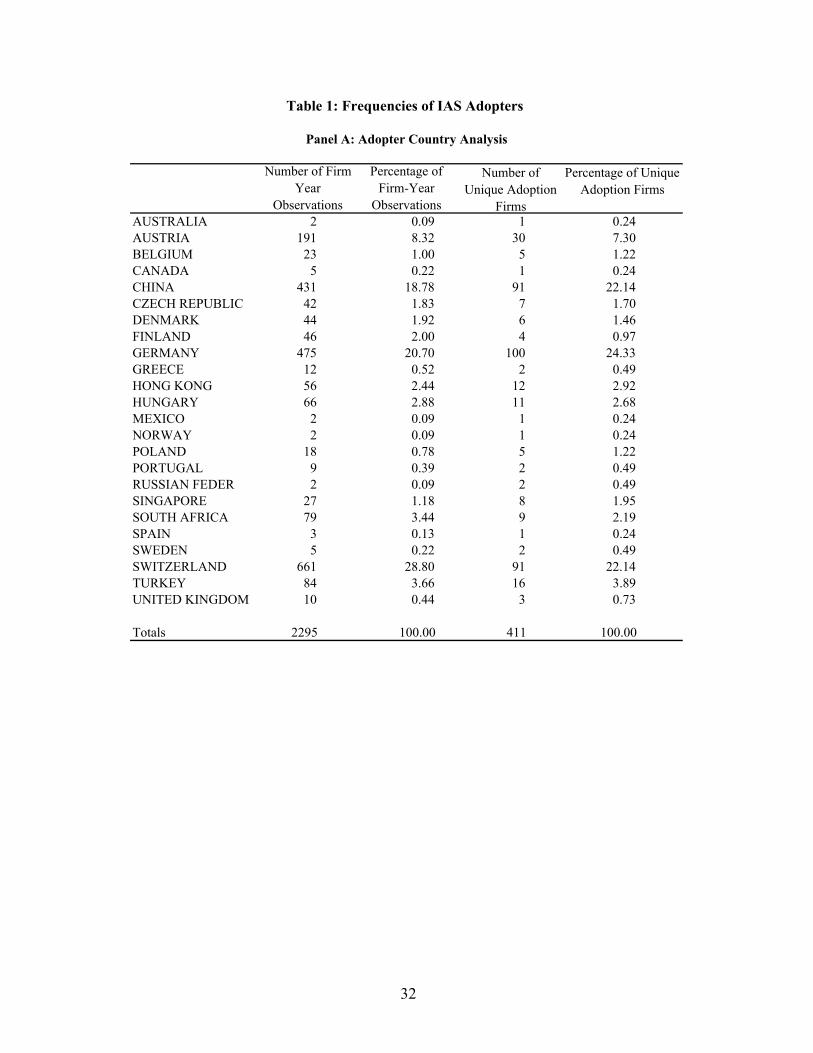
Table 1, panel A, includes descriptive statistics for our sample firms in terms of country
representation. In general, the sample firm-years are from a wide range of countries, with
greatest representation from Switzerland, Germany, and China. Panel B of table 1 reports
representation by industry. The sample also comprises a range of industries, with most firms in
manufacturing, financing or services. However, given our matching criteria, industry effects
should be naturally controlled. Panel C of table 1 reports representation by number of
observations and adoption year. The sample observations are from a wide range of years, as are
the IAS adoptions.
Table 2, panel A, reports descriptive statistics for the ADOPT and NADOPT firms. In
terms of the variables of interest, the ADOPT firms have significantly fewer incidents of small
positive earnings and more incidents of large negative earnings. Although these results do not
15
control for other factors, they suggest that ADOPT firms are less likely to manage earnings
towards a target and more likely to recognize losses in a timely manner than NADOPT firms. In
terms of control variables, the ADOPT firms are higher growth than the NADOPT firms (median
7% vs. 6%). Despite the size match, the ADOPT firms are somewhat larger than the NADOPT
firms, although there is a good deal of overlap between the two distributions. Further, there is
some evidence that the ADOPT firms are more likely to issue debt (mean but not median
difference is significant), more likely to issue equity (median but not mean difference is
significant) and are less highly levered (mean but not median difference is significant).12 We
control for these factors where possible in our empirical analysis.
V. RESULTS
Post-Adoption Period
Table 3 presents our primary results for earnings management, timely loss recognition
and stock price associations for ADOPT and NADOPT firms in the post-adoption period.
Earnings Management
The first finding relating to earnings management indicates that ADOPT firms exhibit
significantly higher variability in the change in net income, NI∆ (using a variance ratio F-test),
0.0040 versus 0.0033. This finding is consistent with ADOPT firms reporting less smooth
earnings than NADOPT firms in the post-adoption period. Of course, the variance of net income
could be driven by the variability of cash flows. However, the second finding indicates that the
ratio of the variance of change in net income, NI∆ , to the variance in the change in cash flow,
CF∆ , is also consistent with ADOPT firms exhibiting less smooth income. In particular, the
ratios are 0.729 and 0.696 for ADOPT and NADOPT firms, suggesting that the difference in net 12 With the exception of the descriptive statistics in table 2 for which statistical significance is assessed using a two-sided alternative, throughout we use a 5% significance level to assess statistical significance based on a one-sided alternative.
16
income variability is not solely a result of a difference in cash flow variability. As in Lang,
Raedy, and Wilson (2005), we do not test the differences between ADOPT and NADOPT firms
because we are unaware of any statistical test for differences in the ratios of variances.
Consistent with the first two measures, the third finding indicates that the correlation
between accruals, ACC, and cash flow, CF, is –0.517 for the ADOPT firms and -0.560 for the
NADOPT firms, which suggests more smoothing for the non-adopters, although the difference is
not significantly different.
Finally, the coefficient on SPOS from equation (1) is significantly negative, which
indicates that NADOPT firms more frequently report small positive earnings, consistent with
managing earnings towards an earnings target. This finding complements the earnings
smoothing findings by indicating that not only do ADOPT firms evidence less earnings
smoothing than NADOPT firms, but also they appear less likely to manage earnings toward a
target.
Timely Loss Recognition
The next finding in table 3 relates to timely loss recognition. The significantly positive
coefficient on LNEG in equation (2) suggests that, controlling for other factors, ADOPT firms
recognize large losses more readily than NADOPT firms. This finding suggests that relative to
ADOPT firms, NADOPT firms smooth earnings by delaying the effects of large negative
outcomes. In particular, one interpretation of the results relating to SPOS and LNEG is that
managers of NADOPT firms smooth away from large negative earnings and toward small
positive earnings, resulting in less timely recognition of losses.
17
Value Relevance
Our final set of findings in table 3 relates to value relevance of accounting information.
First, regressions of price on earnings and equity book value for ADOPT and NADOPT firms
reveal that the R2 for ADOPT firms is significantly greater than that for NADOPT firms, 13.6%
vs. 10.3%. Untabulated regression summary statistics indicate that, as expected, the coefficients
on earnings and equity book value are significantly positive for both ADOPT and NADOPT
firms, and that both coefficients are smaller for NADOPT firms. The findings are consistent
with accounting data being more value relevant for ADOPT than for NADOPT firms.
R2s from a regression of earnings on returns are 10.5% for ADOPT firms and 8.3%
NADOPT firms, a significant difference which is consistent with higher earnings quality for
ADOPT firms. R2s for ADOPT firms are higher for both good news (3.1% versus 0%) and for
bad news (9.7% versus 9.4%), although the differences are only statistically significant for the
good news firms. Taken together, there is evidence of greater value relevance for ADOPT firms
based on both the price and returns regressions.
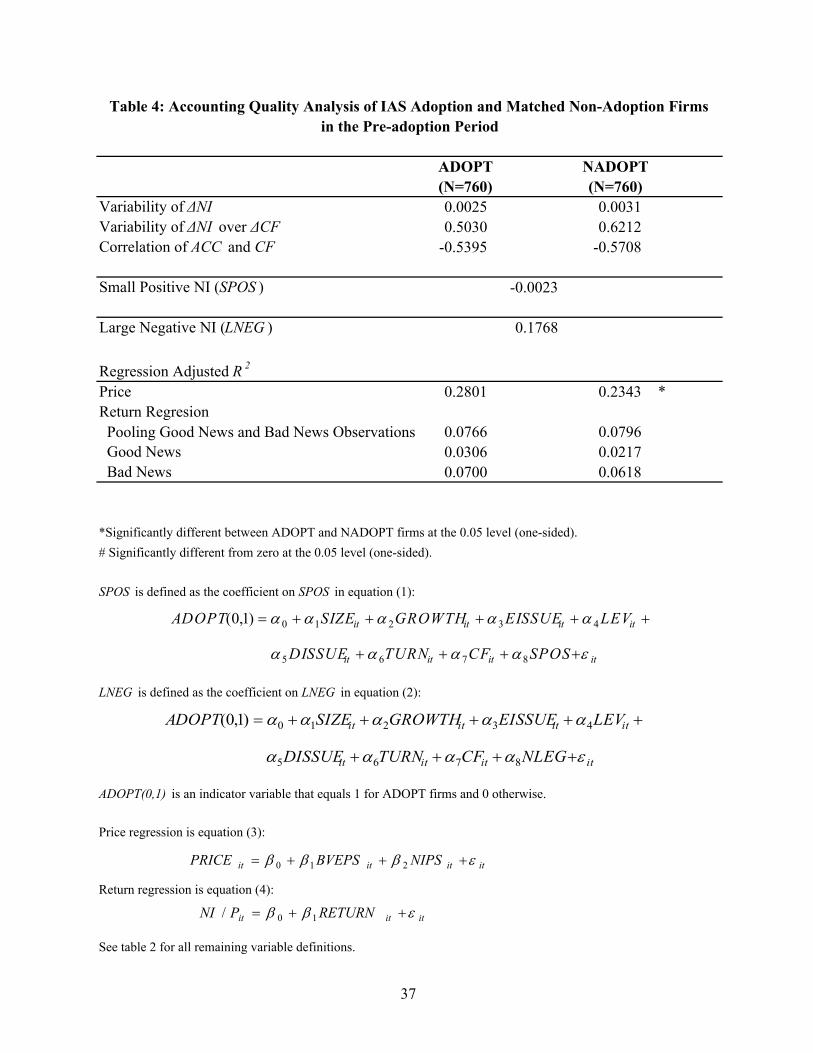
Pre-Adoption Period
One potential concern in interpreting the preceding results is that we may be capturing
the effect of self-selection. In particular, if firms with high quality accounting are more likely to
adopt IAS, IAS may serve a sorting role but not improve the quality of firms’ accounting. To
examine this possibility, we replicate our analysis for the period prior to IAS adoption. Table 4
presents findings for earnings management, timely loss recognition, and value relevance for
ADOPT and NADOPT firms in the pre-adoption period.

18
Earnings Management
The first finding relating to earnings management indicates that ADOPT firms exhibit a
lower variance in the change in net income, NI∆ , than NADOPT firms in the pre-adoption
period, 0.0025 versus 0.0031. This finding contrasts with that from the post-adoption period in
which ADOPT firms have significantly higher variance in NI∆ . This indicates that the higher
NI∆ variance for ADOPT firms in table 3 in the post-adoption period is not a result of higher
NI∆ variance for ADOPT firms in the pre-adoption period. The second finding indicates that
the ratio of the variance of change in net income, NI∆ , to the variance in the change in cash
flow, CF∆ , is substantially higher for NADOPT firms than for ADOPT firms, 0.62 vs. 0.50.
This suggests that ADOPT firms evidence more earnings smoothing than NADOPT firms in the
pre-adoption period. This is in contrast with the finding for the post-adoption period, in which
NADOPT firms have a somewhat lower ratio in the two variances, indicating that ADOPT firms
evidence less earnings smoothing in the post-adoption period. This again indicates that the
higher ratio of the variances in NI∆ to CF∆ in table 3 in the post-adoption period is not a result
of a higher ratio for ADOPT firms in the pre-adoption period
The third finding indicates that the correlations between accruals, ACC, and cash flow,
CF, are lower for ADOPT firms, –0.54 and –0.57, suggesting that the ADOPT firms smooth
earnings more than the NADOPT firms in the pre-adoption period, although the difference is not
significant.
Finally, the coefficient on SPOS from equation (1) is insignificantly different from zero
in the pre-adoption period, which indicates that NADOPT and ADOPT firms report small
positive earnings with similar frequencies in the pre-adoption period. Similar to our other
measures of earnings management, this finding indicates that the significant SPOS finding in
19
table 3 is not solely attributable to pre-adoption differences in small positive earnings
frequencies.
Timely Loss Recognition
The next finding in table 4 relating to timely loss recognition indicates that the LNEG
coefficient is insignificantly higher for ADOPT than NADOPT firms, providing weak evidence
that ADOPT firms recognize losses more readily even in the pre-adoption period. However, the
relation strengthens after adoption.
Value Relevance
Our final set of findings in table 4 relates to value relevance of accounting information.
In contrast to the results for earnings smoothing and timely loss recognition, regressions of price
on earnings and equity book value for ADOPT and NADOPT firms reveal that the R2 for
ADOPT firms is significantly greater than that for NADOPT firms, 28% versus 23%. Thus, the
higher value relevance in the post-adoption period evidenced by price regressions for ADOPT
firms could be attributable to their having higher value relevance before adoption of international
accounting standards. However, the R2s from a regression of earnings on returns for ADOPT
and NADOPT firms in the pre-adoption period are 7.7% and 8.0%, respectively, suggesting that
differences in value relevance as measured by the earnings-returns regression did not exist prior
to IAS adoption.
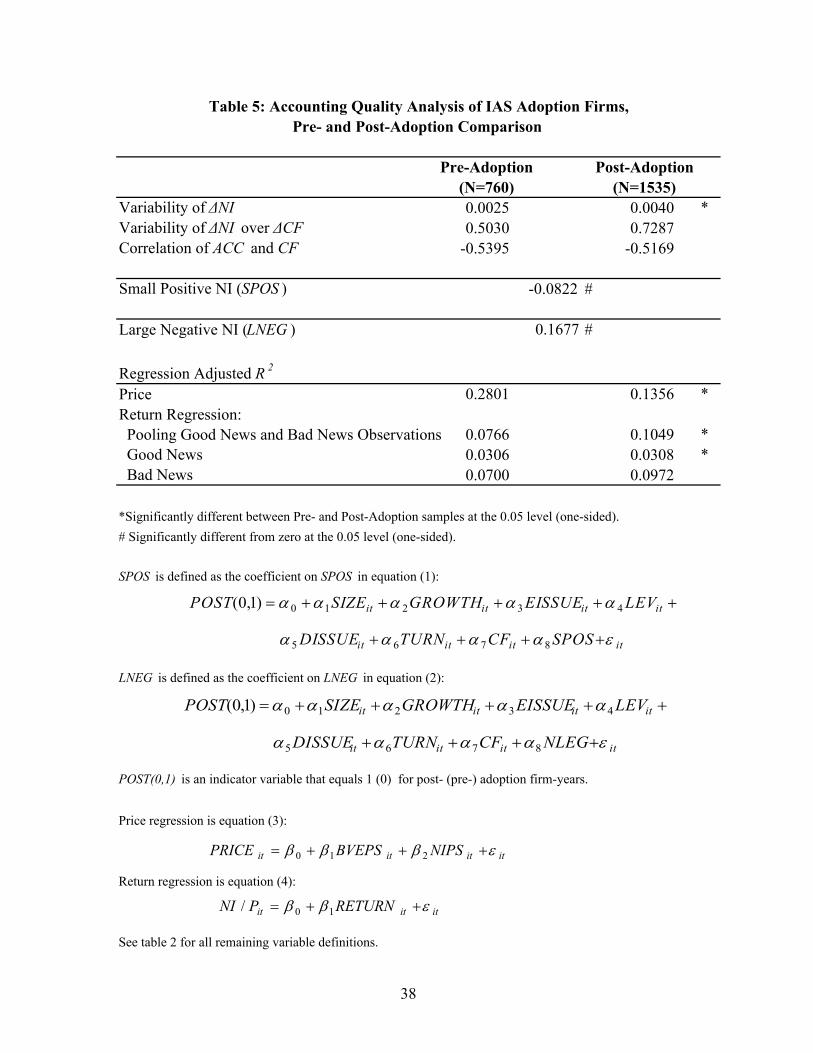
Comparison of Post- and Pre-Adoption Periods
Overall, results for the pre-adoption period provide little evidence that the results in the
post-adoption period were also in evidence prior to IAS adoption. To investigate more directly
the issue of whether our post-adoption results reflect pre-existing differences or the effect of
changes associated with IAS adoption, we conduct an analysis of changes in our measures

20
around the adoption year for ADOPT and NONADOPT firms. While this analysis has the
advantage of effectively using the firm as its own control, there are important caveats. First,
because there are different numbers of pre- and post-adoption years for firms in our sample, the
pre- and post-adoption panels are unbalanced in terms of number of observations. Second, if
firms transition gradually to IAS, some of the observations around the adoption date will be
confounded, potentially weakening our results. Third, it is possible that some of the effects of
IAS are also manifested in the non-IAS firms because, for example, of local GAAP changing to
be more similar to IAS, potentially understating the effects of IAS for the ADOPT firms relative
to the NADOPT firms.
Table 5 presents a comparison of findings for earnings management, timely loss
recognition, and value relevance for ADOPT firms in the pre- and post-adoption period, as well
as significance tests. Tests for all measures except price level regressions suggest improvements
in accounting quality. In particular, variability of net income and variability of net income
relative to cash flows increase around IAS adoption. The correlation between accruals and cash
flows also becomes less negative after adoption, although the change is not statistically
significant. Similarly, the proportion of small positive net income decreases significantly after
adoption, suggesting less of a tendency to manage toward a target.13 In terms of timely loss
recognition, the proportion of large negative earnings is significantly higher post-adoption than
pre-adoption. The R2 from the returns regression also increases (although not significantly),
which is driven primarily by an increase in the R2 for bad news. Only the price level regressions
do not improve between the pre- and post- periods. However, the drop in R2 is mirrored by the
13 For the tests of small positive and large negative earnings, we re-estimate equations (1) and (2) with the dependent variable changed from an adoption indicator to a post-adoption indicator, so that the tests examine whether there is a higher proportion of small positive and large negative earnings post-adoption relative to pre-adoption.

21
drop in R2 for the control firms. As a consequence, it appears that the drop in price regression
explanatory power may be driven by factors that are not unique to the adoption firms.
More generally, a relevant question is to what extent the changes we observe for the
ADOPT firms are mirrored for the NADOPT sample. For example, Land and Lang (2002)
suggests that accounting quality may be improving worldwide. From the preceding analysis we
know that the post-adoption differences between the ADOPT and NADOPT firms are generally
not reflected in pre-adoption differences, indicating that the changes we observe around adoption
for the ADOPT firms do not occur to the same extent for NADOPT firms. Moreover, results in
table 3 and 4 suggest that the change in our measures for the ADOPT firms are larger than for
the NADOPT firms, except for the price level regression R2s which decrease by similar amounts
for both samples of firms. Taken together, our results suggest that improvements in accounting
quality occur around the adoption of IAS, providing additional support for our cross-sectional
results.
VI. EFFECTS OF IAS ADOPTION ON EQUITY COST OF CAPITAL
Next we consider whether adoption of IAS is associated with a reduction in equity cost of
capital as a result of providing investors with accounting information of higher quality. Findings
from the information economics literature provide theoretical links between accounting
information and the cost of capital arising from information asymmetry. An important study is
Easley and O’Hara (2004) which develops an asset pricing model in which both public and
private information affect asset returns, thereby linking a firm’s information structure to its cost
of capital. A key result of their model is that firms can influence their cost of capital by affecting
the precision and quantity of information available to investors. In particular, the authors note
“this can be accomplished by a firm’s selection of its accounting standards, as well as through its

22
corporate disclosure policies.” Related research includes Amihud and Mendelson (1986) which
develops an asset pricing model in which investors require a liquidity premium to compensate
them for the costs of trading in a firm’s securities. In addition, several studies, relying on
somewhat different assumptions, link information and cost of capital by suggesting that
increased information provided by financial disclosure can reduce estimation risk, thereby
lowering the cost of capital (Klein and Bawa, 1977; Barry and Brown, 1985; Coles and
Loewenstein, 1988; Clarkson and Thompson, 1990; and Handa and Linn, 1993).
Several studies provide empirical evidence linking accounting quality and equity cost of
capital. Botosan (1997) and Botosan and Plumlee (2002) provide evidence that proxies for
expected cost of equity capital are negatively related to the voluntary disclosure level as
measured by AIMR corporate disclosure scores. Francis, et al. (2004) relates measures of
earnings quality to proxies for equity cost of capital. Bhattacharya, Daouk, and Welker (2003)
finds a link between three earnings quality measures (earnings aggressiveness, loss avoidance,
and earnings smoothing) and a proxy for cost of equity capital in country-level tests. Barth,
Konchitchki, and Landsman (2005) provided evidence that a measure of accounting quality loads
incrementally to the Fama-French factors in a returns prediction model, and is correlated with
equity cost of capital constructed from a three-factor Fama-French approach similar to the one
used here.
Collectively, the theoretical and empirical research linking accounting quality and equity
cost of capital leads us to predict that IAS adoption will be associated with a reduction of equity
cost of capital. We test this by comparing our estimate of the equity cost of capital for ADOPT
firms in the pre- and post-adoption periods, using the matched sample of NADOPT firms to

23
control for intertemporal changes in equity cost of capital unrelated to IAS adoption. We next
describe how we estimate equity cost of capital.
Estimation of Equity Cost of Capital
Botosan and Plumlee (2002) infer cost of capital from share price and earnings forecasts.
Because we do not have earnings forecasts for many of our sample firms, we instead follow the
approach in Griffin (2002), Ang and Liu (2004) and Massa, Peyer, and Tong (2004), in
estimating expected equity cost of capital using the Fama and French (1993) three-factor model,
which expresses the firm’s equity return in excess of the risk-free rate of return, fi RR − , as a
linear function of the excess return of the market portfolio, fm RR − , the return on the high minus
low book-to-market ( HML ) factor mimicking portfolio, and the return on the small-minus-big
( SMB ) factor mimicking portfolio. The procedure has two main steps. First, for each firm, i, we
estimate the sensitivity of the firm’s return to each of the three Fama-French factors by
estimating the following monthly time-series regression:
mimiSMBmiHMLmfmMiRMRFimfmi SMBHMLRRRRET ,,,,,,,, )()()( εβββα +++−+=− (5)
where iRMRF ,β , iHML,β , and iSMB,β are the respective factor coefficients estimated using the most
recent 60 months returns, if available, prior to the beginning of firm i’s fiscal year t. For fiscal
year t, monthly betas are set equal to the same fitted coefficient estimates,
tiSMBtiHMLtiRMRF ,,,,,,ˆ,ˆ,ˆ βββ . Betas are updated annually using a rolling 60-month window.14
Second, we estimate the expected annual factor returns by first calculating each factor’s
average monthly return over the 60 months prior to month m, and then compounding the
resulting average monthly returns over the twelve months prior to the beginning of firm i’s fiscal
14 Data availability limits the number of firms for which there are 60 months of data. We require a minimum of 24 monthly returns to estimate equation (5).
24
year.15 We obtain our estimate of the annual expected equity cost of capital, ECC, for firm i and
year t (based on data available at the beginning of year t) by multiplying the expected factor
returns by their respective estimated factor loadings:
ttiSMBttiHMLtfMtiRMRFtft SMBHMLRRRECC ][ˆ][ˆ][ˆ,,,,,,, ∗+∗+−∗+= βββ (6)
where tfM RR ][ − , tHML][ , and tSMB][ are the expected annual factor returns for year t + 1.
Equity Cost of Capital Results
Table 6 presents equity cost of capital results.16 Panels A and B tabulate ECC summary
statistics for ADOPT and NADOPT firms in the pre- and post-adoption periods. Whereas panel
A indicates that both ADOPT and NADOPT firms have essentially the same (and statistically
indistinguishable) ECC means in the pre-adoption period, 11.48% and 11.42%, mean ECC for
ADOPT firms is 0.77% lower than that for NADOPT firms in the post-adoption period, 5.67%
vs. 6.44%, although the difference is not statistically significant because of the large standard
errors of the estimates. Panels C and D, which tabulate ECC statistics separately for ADOPT
and NADOPT firms, indicate that mean ECC is significantly smaller for both sets of firms in the
post-adoption period than in the pre-adoption period. It appears that the drop in our estimate of
the cost of capital between the pre- and post-adoptions periods may be attributable, at least in
part, to the effects of IAS adoption because the fall in cost of capital is greater in magnitude
(albeit insignificant) for adopting firms.
15 Note that because five-year rolling windows may result in an outdated estimated risk-free rate, we calculate the expected monthly risk-free rate based on a one-year rolling risk-free rate, updated monthly. The expected annual risk-free rate, tfR , , is obtained by compounding the expected monthly risk-free rate. 16 The smaller sample sizes in table 6 relative to earlier tables because of the loss of sample years when estimating the parameters used to estimate ECC in equation (5). In addition, to deal with extreme outliers, we effectively winsorize all ECC estimates by setting ECC to an average of the fitted value from equation (6) and the sample average ECC for each year. Untabulated results based on the non-winsorized ECCs result in similar inferences to those drawn from the findings in table 6.
25
VII. CONCLUSIONS AND ONGOING ANALYSES
Overall, our results suggest that IAS improve accounting quality and reduce the cost of
capital. In particular, firms that adopt IAS show less evidence of earnings smoothing, less
evidence of managing earnings towards a target, more timely recognition of losses, and a higher
association with returns. Results are generally consistent in cross-section as well as comparing
firms before and after adopting IAS, suggesting that the change occurs in conjunction with IAS
adoption. Although somewhat more speculative, the cost of capital results provide weak
evidence that the improvements in quality may also reduce firms’ cost of capital.
Taken as a whole, our results are encouraging in suggesting that IAS adoption appears to
improve financial reporting. This conclusion is particularly heartening in that the period we
consider is one in which IAS was undergoing substantial change and enforcement was
potentially spotty. Assuming increased specificity and enforcement of IAS, our results suggest
that IAS could continue to improve financial reporting going forward.
Of course, our results are only suggestive and are subject to numerous caveats. For
example, we cannot be sure that our results reflect the effect of IAS and not some omitted
correlated variable. However, the facts that results are robust to matching and controls and
obtain for the pre-/post-adoption analysis reduce the likelihood of significant omitted correlated
variables. Further, it is not clear what the role of IAS is in improving accounting quality. For
example, it is possible that firms claiming IAS compliance may attract additional audit or
regulatory scrutiny. However, that possibility should be mitigated by the fact that our
comparisons are within-country, which should, at least partially, control for regulatory
environment.
26
In ongoing work, we are conducting additional refinements of our analyses. First, we are
comparing the effects of IAS across different countries and time periods. Although it seems
clear that the effect of IAS likely differs across time periods and countries, it is difficult to
predict ex ante where IAS should make the biggest difference. On the one hand, countries such
as Germany have a stakeholder focus whereas IAS has a shareholder focus, suggesting that the
underlying standards may be quite different. On the other hand, Ball, Kothari, and Robin (2000)
points to the importance of enforcement in the application of IAS. Because enforcement differs
across countries, the application of IAS may as well. Further, although IAS has become better
defined in recent years, accounting standards have likely improved worldwide over time (Land
and Lang, 2002), so the improvement under IAS may be less pronounced, even if IAS standards
are higher quality on average. As a consequence, we view evidence from such analyses as
descriptive rather than as a test of a specific hypothesis.
Preliminary analyses splitting the sample between code and common law countries
suggest that results are strongest for code law countries. In part, that is not particularly
surprising because the majority of our sample observations pertain to code law countries and
differences between local GAAP and IAS are likely to be greatest there. Preliminary analyses by
time period suggest that results are strongest after 1998, the year when the core standards were
completed and IAS adopters were first required to comply completely with IAS. We continue to
refine these analyses.
Similarly, we are presently investigating whether cross-listing is an important
determinant of IAS adoption and influential in affecting our reported findings. Most previous
cross-listing studies focus on US cross-listing because of the additional regulatory oversight
associated with US listing. It seems unlikely that firms adopt IAS to cross-list onto US markets

27
because IAS users must reconcile to US GAAP. Further, our controls for equity issuance should,
at least partially, control for cross-listing to raise equity capital.
28
REFERENCES
Amihud, Y., and H. Mendelson. 1986. Asset Pricing and the Bid-Ask Spread. Journal of
Financial Economics 17, 223-249.
Ang, A., and J. Liu. 2004. How to Discount Cashflows with Time-Varying Expected Returns.
Journal of Finance 59: 2745-2783.
Ashbaugh, H., and P. Olsson. 2002. An Exploratory Study of the Valuation Properties of Cross-
listed Firms’ IAS and U.S. GAAP Earnings and Book values. The Accounting Review 77:
107-126.
Ashbaugh, H., and M. Pincus, 2001. Domestic Accounting Standards, International Accounting
Standards, and the Predictability of Earnings, Journal of Accounting Research 39: 417-434,
Ball, R.; S.P. Kothari; and A. Robin. 2000. The Effect of International Institutional Factors on
Properties of Accounting Earnings.” Journal of Accounting and Economics 29: 1–51.
Barry, C. B., and S. J. Brown. 1985. Differential Information and Security Market Equilibrium.
Journal of Financial and Quantitative Analysis 20, 407-422.
Barth, M.E., W.H. Beaver and W.R. Landsman (2001). The Relevance of the Value Relevance
Literature for Accounting Standard Setting: Another View. Journal of Accounting and
Economics 31: 77-104.
Barth, M., Y. Konchitchki, and W.R. Landsman. 2005. Cost of Capital and Financial Statement
Transparency. Working paper, Stanford University and University of North Carolina.
Bartov, E., S. Goldberg, and M. Kim. 2004. Comparative Value Relevance among German, U.S.
and International Accounting Standards: A German Stock Market Perspective. Working
paper, New York University.

29
Bhattacharya, U., H. Daouk, and M. Welker. (2003). “The World Price of Earnings Opacity.”
Working paper, Queen's University.
Botosan, C.A. 1997. Disclosure Level and the Cost of Equity Capital. The Accounting Review 7:
323-349.
Botosan, C.A., and M. Plumlee. 2002. A Re-examination of Disclosure Level and Expected
Cost of Equity Capital. Journal of Accounting Research 40, 21-40.
Breeden, R., 1994. Foreign Companies and U.S. Markets in a Time of Economic
Transformation. Fordham International Law Journal 17.
Brown, S., K. Lo, and T. Lys. 1999. Use of R2 in Accounting Research: Measuring Changes in
Value Relevance over the last Four Decades. Journal of Accounting and Economics 28: 83-
115.
Burgstahler, D., and I. Dichev. 1997. Earnings Management to Avoid Earnings Decreases and
Losses.” Journal of Accounting and Economics 24: 99–126.
Cairns, D. 1999. Degrees of compliance. Accountancy International (September): 68-69.
Clarkson, P., and R. Thompson. 1990. The Empirical Estimates of Beta when Investors Face
Estimation Risk. Journal of Finance 45, 431-453.
Coles, J. and U. Loewenstein. 1988. Equilibrium Pricing and Portfolio Composition in the
Presence of Uncertain Parameters. Journal of Financial Economics, 279-303.
Easley, D., and M. O’Hara. 2004. Information and the Cost of Capital.” Journal of Finance 59:
1553 - 1583.
Eccher, E. and P. Healy, 2003. The Role of International Accounting Standards in Transitional
Economies: A Study of the People's Republic of China. Working paper, Massachusetts
Institute of Technology.

30
Fama, E.F., and K.R. French. 1993. Common Risk Factors in the Returns of Stocks and Bonds.
Journal of Financial Economics 33: 3-56.
Francis, J., R. LaFond, P. Olsson, and K. Schipper. 2004. Costs of Equity and Earnings
Attributes.” The Accounting Review 79, 967-1010.
Greene, W., 1993. Econometric Analysis. MacMillan, New York.
Griffin, J.M. 2003. Are the Fama and French Factors Global or Country Specific? Review of
Financial Studies 15: 723-750
Handa, P., and S. Linn. 1993. Arbitrage Pricing with Estimation Risk. Journal of Financial
Economics, 81-100.
Harris, M., and K. Muller. 1999. The Market Valuation of IAS versus US GAAP Accounting
Measures Using Form 20-F Reconciliations. Journal of Accounting and Economics 26: 285-
312.
Hung, M. and K.R. Subramanyam, 2004, Financial Statement Effects of Adopting International
Accounting Standards: The Case of Germany. Working paper, University of Southern
California.
Klein, R., and V. Bawa. 1976. The Effect of Estimation Risk on Optimal Portfolio Choice.
Journal of Financial Economics 3, 215-231.
Land, J., and M. Lang. 2002. Empirical Evidence on the Evolution of International Earnings. The
Accounting Review 77, 115-134.
Lang, M., J. Raedy, and M. Yetman. 2003. How Representative are Firms that are Cross Listed
in the United States? An Analysis of Accounting Quality. Journal of Accounting Research
41, 363-386.

31
Lang, M., J. Raedy, and W. Wilson. 2005. Earnings Management and Cross Listing: Are
Reconciled Earnings Comparable to US Earnings? Working paper, University of North
Carolina.
Leuz, C. 2003. IAS Versus U.S. GAAP: Information Asymmetry-based Evidence from
Germany’s New Market. Journal of Accounting Research 41: 445-427.
Leuz, C.; D. Nanda; and P. Wysocki. 2003. Earnings Management and Investor Protection: An
International Comparison. Journal of Financial Economics 69: 505-527.
Massa, M., U. Peyer and Z. Tong. 2004. Limits of Arbitrage and Corporate Financial Policies”,
Working Paper, INSEAD.
Myers, L.A., and D.J. Skinner. 2002. Earnings Momentum and Earnings Management. Working
paper, University of Michigan.
Pagano, M.; A. Röell; and J. Zehner. 2002. The Geography of Equity Listings: Why do
Companies List Abroad? Journal of Finance 57: 2651-2694.
Street, D. and S. Gray. 2001. “Observance of international accounting standards: Factors
explaining non-compliance. ACCA Research Report No. 74.
Wysocki, P. 2005. Assessing Earnings and Accruals Quality: US and International Evidence.
Working Paper, Massachusetts Institute of Technology.
Number of FirmYear
Observations
Percentage of Firm-Year
Observations
Number of Unique Adoption
Firms
Percentage of Unique Adoption Firms
AUSTRALIA 2 0.09 1 0.24AUSTRIA 191 8.32 30 7.30BELGIUM 23 1.00 5 1.22CANADA 5 0.22 1 0.24CHINA 431 18.78 91 22.14CZECH REPUBLIC 42 1.83 7 1.70DENMARK 44 1.92 6 1.46FINLAND 46 2.00 4 0.97GERMANY 475 20.70 100 24.33GREECE 12 0.52 2 0.49HONG KONG 56 2.44 12 2.92HUNGARY 66 2.88 11 2.68MEXICO 2 0.09 1 0.24NORWAY 2 0.09 1 0.24POLAND 18 0.78 5 1.22PORTUGAL 9 0.39 2 0.49RUSSIAN FEDER 2 0.09 2 0.49SINGAPORE 27 1.18 8 1.95SOUTH AFRICA 79 3.44 9 2.19SPAIN 3 0.13 1 0.24SWEDEN 5 0.22 2 0.49SWITZERLAND 661 28.80 91 22.14TURKEY 84 3.66 16 3.89UNITED KINGDOM 10 0.44 3 0.73
Totals 2295 100.00 411 100.00
Table 1: Frequencies of IAS Adopters
Panel A: Adopter Country Analysis
32
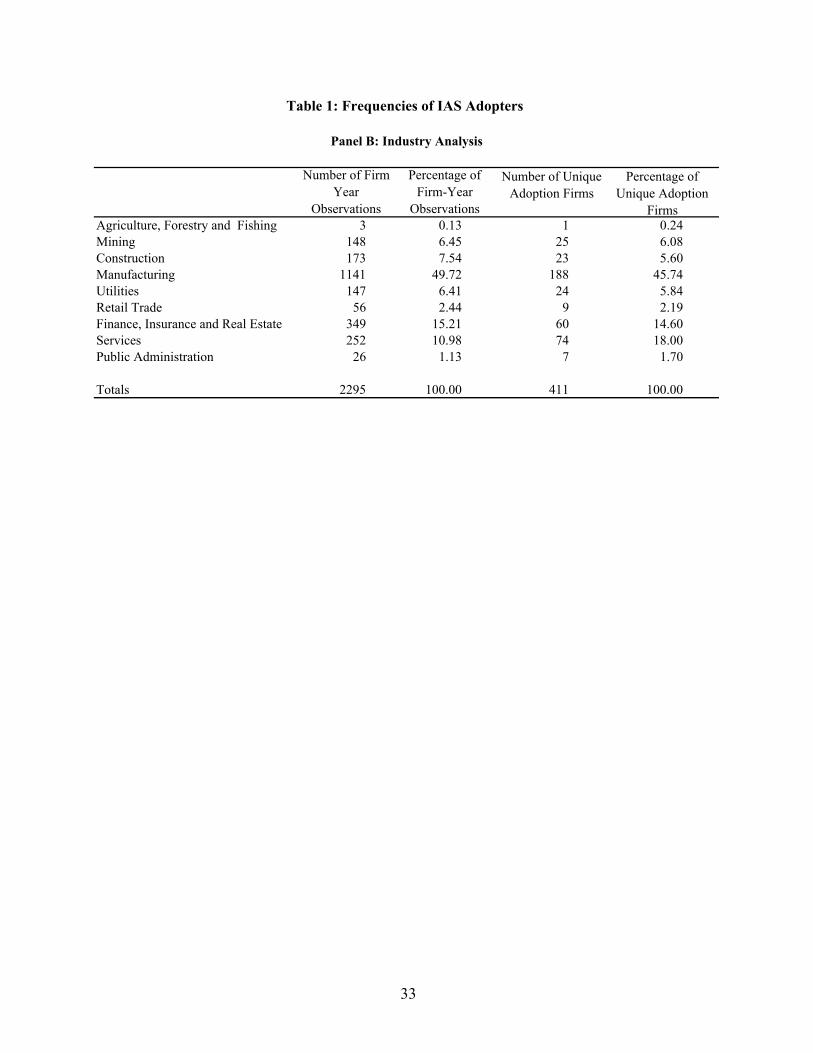
Number of FirmYear
Observations
Percentage of Firm-Year
Observations
Number of Unique Adoption Firms
Percentage of Unique Adoption
FirmsAgriculture, Forestry and Fishing 3 0.13 1 0.24Mining 148 6.45 25 6.08Construction 173 7.54 23 5.60Manufacturing 1141 49.72 188 45.74Utilities 147 6.41 24 5.84Retail Trade 56 2.44 9 2.19Finance, Insurance and Real Estate 349 15.21 60 14.60Services 252 10.98 74 18.00Public Administration 26 1.13 7 1.70
Totals 2295 100.00 411 100.00
Table 1: Frequencies of IAS Adopters
Panel B: Industry Analysis
33
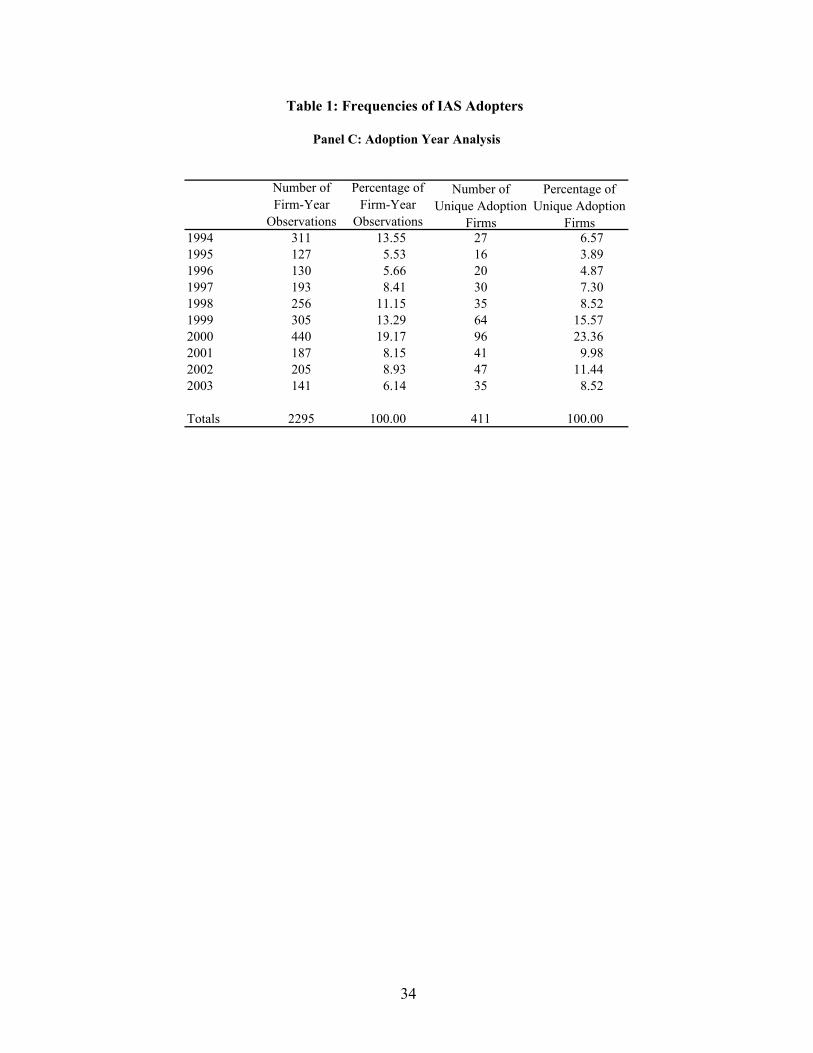
Number of Firm-Year
Observations
Percentage of Firm-Year
Observations
Number of Unique Adoption
Firms
Percentage of Unique Adoption
Firms1994 311 13.55 27 6.571995 127 5.53 16 3.891996 130 5.66 20 4.871997 193 8.41 30 7.301998 256 11.15 35 8.521999 305 13.29 64 15.572000 440 19.17 96 23.362001 187 8.15 41 9.982002 205 8.93 47 11.442003 141 6.14 35 8.52
Totals 2295 100.00 411 100.00
Table 1: Frequencies of IAS Adopters
Panel C: Adoption Year Analysis
34

TABLE 2Descriptive Statistics for IAS Adoptor (ADOPT) and Non-Adopting Firms (NADOPT)
Variablea Mean MedianStandard Deviation Q1 Q3 Mean Median
Standard Deviation Q1 Q3
Test Variables:∆ NI 0.0024 0.0023 0.0591 -0.0137 0.0211 -0.0002 0.0017 0.0568 -0.0130 0.0177∆ CF 0.0065 0.0069 0.0729 -0.0269 0.0437 0.0022 * 0.0038 * 0.0695 -0.0282 0.0387ACC -0.0453 -0.0413 0.0614 -0.0812 -0.0060 -0.0417 * -0.0376 * 0.0580 -0.0749 -0.0047CF 0.0727 0.0720 0.0702 0.0243 0.1157 0.0692 0.0667 0.0661 0.0208 0.1115SPOS 0.1434 0.0000 0.3505 0.0000 0.0000 0.1752 * 0.0000 * 0.3802 0.0000 0.0000LNEG 0.0327 0.0000 0.1778 0.0000 0.0000 0.0222 * 0.0000 * 0.1474 0.0000 0.0000RETURN 0.0146 0.0000 0.4082 -0.2379 0.2714 0.0177 0.0185 0.3818 -0.2140 0.2471EPS/P 0.0749 0.0606 0.1562 0.0166 0.1239 0.0848 * 0.0624 0.1626 0.0149 0.1441PRICE 1.1456 1.0096 0.5810 0.7707 1.3399 1.1312 1.0135 0.5459 0.7913 1.3205BVEPS 0.2855 0.1376 0.3863 0.0582 0.3059 0.3082 0.1379 0.4186 0.0655 0.3480NIPS 0.0516 0.0489 0.1196 0.0125 0.0889 0.0518 0.0485 0.1150 0.0124 0.0943
Control Variables:LEV 3.2684 1.4665 4.9997 0.7957 2.8393 3.6889 * 1.5515 5.4827 0.7364 3.0777GROWTH 0.1746 0.0683 0.5053 -0.0479 0.2269 0.1425 * 0.0587 * 0.4695 -0.0611 0.2091EISSUE 0.1681 0.0753 0.4984 -0.0537 0.2419 0.1401 0.0543 * 0.4777 -0.0664 0.2151DISSUE 0.2333 0.0592 0.6644 -0.0771 0.2519 0.1814 * 0.0533 0.5897 -0.0832 0.2391TURN 0.7922 0.7419 0.5265 0.3621 1.1214 0.7837 0.7105 0.5463 0.3314 1.1256SIZE 11.9986 12.0983 1.7551 10.7657 13.2880 11.5264 * 11.5886 * 1.7279 10.4162 12.6287CF 0.0727 0.0720 0.0702 0.0243 0.1157 0.0692 0.0667 0.0661 0.0208 0.1115
* Significantly different between ADOPT and NADOPT firms at the 0.05 levels respectively (two-tailed).
ADOPT (Number of firm-years = 2295) NADOPT (Number of firm-years = 2295)
a We define ∆ NI as the change in annual earnings, where earnings is scaled by end-of-year total assets; ∆ CF as the change in annual net cash flow, where cash flow is scaled by end-of-year total assets; ACC as earnings less cash flow from operating activities, scaled by end-of-year total assets; CF as annual net cash flow from operating activities, scaled by end-of-year total assets; SPOS as an indicator set to 1 for observations for which annual earnings scaled by total assets is between 0 and 0.01; LNEG as an indicator set to 1 for observations for which annual earnings scaled by total assets is less than -0.20, RETURN as the annual return from nine month prior to and three month after the fiscal year end; PRICE as price as of six months after the fiscal year-end; EPS/P as earnings per share scaled by price per share at the beginning of the year; LEV as end-of-year total liabilities divided by end-of-year total equity, GROWTH as percentage change in sales; EISSUE as percentage change in common stock; DISSUE as the percentage change in total liabilities during the period; TURN as sales divided by end-of-year total assets; SIZE as the natural log of market value of equity in millionsas of the end of the year; BVPS as book value of shareholders’ equity per share; NIPS as net income per share.
35
Table 3: Accounting Quality Analysis of IAS Adoption and Matched Non-Adoption Firms
ADOPT NADOPT(N=1535) (N=1535)
Variability of ∆NI 0.0040 0.0033 *Variability of ∆NI over ∆CF 0.7287 0.6957Correlation of ACC and CF -0.5169 -0.5600
Small Positive NI (SPOS ) -0.0668 #
Large Negative NI (LNEG ) 0.1913 #
Regression Adjusted R 2
Price 0.1356 0.1033 *Return Regression: Pooling Good News and Bad News Observations 0.1049 0.0830 * Good News 0.0308 0.0030 * Bad News 0.0972 0.0941
*Significantly different between ADOPT and NADOPT firms at the 0.05 level (one-sided).# Significantly different from zero at the 0.05 level (one-sided).
SPOS is defined as the coefficient on SPOS in equation (1):
LNEG is defined as the coefficient on LNEG in equation (2):
ADOPT(0,1) is an indicator variable that equals 1 for ADOPT firms and 0 otherwise.
Price regression is equation (3):
Return regression is equation (4):
See table 2 for all remaining variable definitions.
in the Post-Adoption Period
itititit
itititit
SPOSCFTURNDISSUE
LEVEISSUEGROWTHSIZEADOPT
εαααα
ααααα
++++
+++++=
8765
43210)1,0(
itititit
itititit
NLEGCFTURNDISSUE
LEVEISSUEGROWTHSIZEADOPT
εαααα
ααααα
++++
+++++=
8765
43210)1,0(
itititit NIPSBVEPSPRICE εβββ +++= 210
ititit RETURNPNI εββ ++= 10/
36
ADOPT NADOPT(N=760) (N=760)
Variability of ∆NI 0.0025 0.0031Variability of ∆NI over ∆CF 0.5030 0.6212Correlation of ACC and CF -0.5395 -0.5708
Small Positive NI (SPOS ) -0.0023
Large Negative NI (LNEG ) 0.1768
Regression Adjusted R 2
Price 0.2801 0.2343 *Return Regresion Pooling Good News and Bad News Observations 0.0766 0.0796 Good News 0.0306 0.0217 Bad News 0.0700 0.0618
*Significantly different between ADOPT and NADOPT firms at the 0.05 level (one-sided).# Significantly different from zero at the 0.05 level (one-sided).
SPOS is defined as the coefficient on SPOS in equation (1):
LNEG is defined as the coefficient on LNEG in equation (2):
ADOPT(0,1) is an indicator variable that equals 1 for ADOPT firms and 0 otherwise.
Price regression is equation (3):
Return regression is equation (4):
See table 2 for all remaining variable definitions.
Table 4: Accounting Quality Analysis of IAS Adoption and Matched Non-Adoption Firmsin the Pre-adoption Period
itititit
itititit
SPOSCFTURNDISSUE
LEVEISSUEGROWTHSIZEADOPT
εαααα
ααααα
++++
+++++=
8765
43210)1,0(
itititit
itititit
NLEGCFTURNDISSUE
LEVEISSUEGROWTHSIZEADOPT
εαααα
ααααα
++++
+++++=
8765
43210)1,0(
itititit NIPSBVEPSPRICE εβββ +++= 210
ititit RETURNPNI εββ ++= 10/
37
Pre-Adoption Post-Adoption(N=760) (N=1535)
Variability of ∆NI 0.0025 0.0040 *Variability of ∆NI over ∆CF 0.5030 0.7287Correlation of ACC and CF -0.5395 -0.5169
Small Positive NI (SPOS ) -0.0822 #
Large Negative NI (LNEG ) 0.1677 #
Regression Adjusted R 2
Price 0.2801 0.1356 *Return Regression: Pooling Good News and Bad News Observations 0.0766 0.1049 * Good News 0.0306 0.0308 * Bad News 0.0700 0.0972
*Significantly different between Pre- and Post-Adoption samples at the 0.05 level (one-sided).# Significantly different from zero at the 0.05 level (one-sided).
SPOS is defined as the coefficient on SPOS in equation (1):
LNEG is defined as the coefficient on LNEG in equation (2):
POST(0,1) is an indicator variable that equals 1 (0) for post- (pre-) adoption firm-years.
Price regression is equation (3):
Return regression is equation (4):
See table 2 for all remaining variable definitions.
Pre- and Post-Adoption Comparison Table 5: Accounting Quality Analysis of IAS Adoption Firms,
itititit
itititit
SPOSCFTURNDISSUE
LEVEISSUEGROWTHSIZEPOST
εαααα
ααααα
++++
+++++=
8765
43210)1,0(
itititit
itititit
NLEGCFTURNDISSUE
LEVEISSUEGROWTHSIZEPOST
εαααα
ααααα
++++
+++++=
8765
43210)1,0(
itititit NIPSBVEPSPRICE εβββ +++= 210
ititit RETURNPNI εββ ++= 10/
38
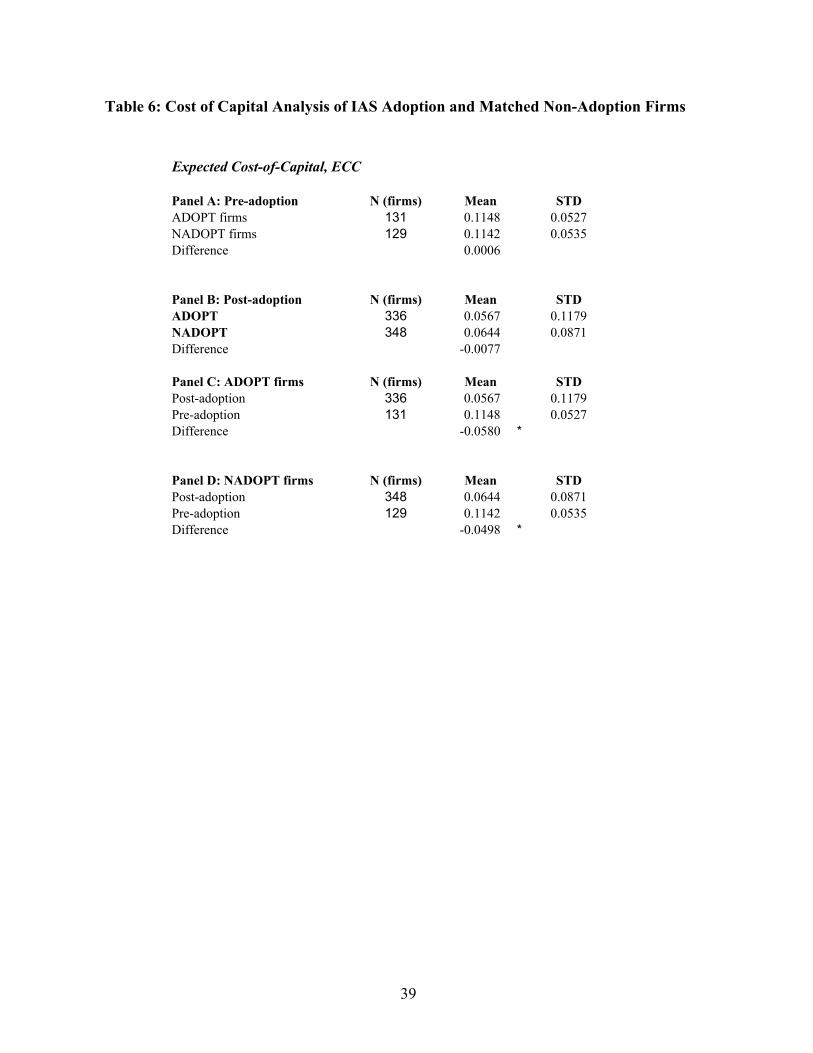
Table 6: Cost of Capital Analysis of IAS Adoption and Matched Non-Adoption Firms
Expected Cost-of-Capital, ECC
Panel A: Pre-adoption N (firms) Mean STDADOPT firms 131 0.1148 0.0527NADOPT firms 129 0.1142 0.0535Difference 0.0006
Panel B: Post-adoption N (firms) Mean STDADOPT 336 0.0567 0.1179NADOPT 348 0.0644 0.0871Difference -0.0077
Panel C: ADOPT firms N (firms) Mean STDPost-adoption 336 0.0567 0.1179Pre-adoption 131 0.1148 0.0527Difference -0.0580 *
Panel D: NADOPT firms N (firms) Mean STDPost-adoption 348 0.0644 0.0871Pre-adoption 129 0.1142 0.0535Difference -0.0498 *
39