Embed Size (px)
Citation preview

International Accounting StandardsFinancial Reporting in Hyperinflationary EconomiesUnderstanding IAS 29

PricewaterhouseCoopers (www.pwcglobal.com), is the world’s largest professional services organisation. Drawing on theknowledge and skills of 150,000 people in 150 countries, we help our clients solve complex business problems andmeasurably enhance their ability to build value, manage risk and improve performance. PricewaterhouseCoopers refers tothe member firms of the worldwide PricewaterhouseCoopers organisation.
PricewaterhouseCoopers 1
International Accounting Standards (IAS) areincreasingly popular with enterprises raisinginternational capital through debt or equity. Thisincludes many enterprises in emerging markets andfast developing economies – which may behyperinflationary environments.
IAS 29 “Financial Reporting in HyperinflationaryEconomies” is an integral and mandatory part of theIAS body of standards. It requires the IAS financialstatements of any enterprise reporting in the currencyof a hyperinflationary economy to take full accountof the effects of inflation using a current purchasingpower approach.
The requirements of IAS 29 also need to beconsidered by any enterprise located outside thehyperinflationary environment preparing IAS
consolidated financial statements that include aforeign entity (such as a subsidiary, associate, jointventure or branch) which reports in the currency ofa hyperinflationary economy.
Preparation of financial statements using a currentpurchasing power approach requires both anunderstanding of the underlying economic concepts and a complex series of procedures andreconciliations to ensure accurate results.
This guide has been prepared to serve as a practical aid for those enterprises applying IAS 29.PricewaterhouseCoopers has helped manyenterprises to apply this difficult standard. Ourexperience and our proven methodology, describedin this guide, will make applying IAS 29 lessburdensome for your company.
Preface
Other publications on IASThe following publications on International Accounting Standards have been published byPricewaterhouseCoopers and are available from your nearest PricewaterhouseCoopers office:
International Accounting Standards – A Pocket Guide – 2001International Accounting Standards – Disclosure Checklist – 2001International Accounting Standards – Illustrative Corporate Financial Statements – 2001International Accounting Standards – Illustrative Bank Financial Statements – 2001International Accounting Standards – Illustrative Fund Financial Statements – 2001International Accounting Standards – Understanding IAS 39 International Accounting - Similarities & Differences – IAS, US GAAP and UK GAAP
and on wider aspects of international reporting:Audit Committees – Good Practices for Meeting Market ExpectationsReporting Progress – Good Practices for Meeting Market ExpectationsYou can find latest news, discussions and publications on our website athttp://www.pwcglobal.com/extweb/corprep.nsf/docid/
Contents
2 PricewaterhouseCoopers
Chapter 1
Chapter 2 Applying the standard 9
Overview 9
Selection of the price index 9
Segregation of monetary and non-monetary items 10
Restatement of non-monetary items 11
Income statement 11
The calculation of monetary gain or loss 12
Cash flow statement 12
Restatement of corresponding figures 12
Disclosures 13
Economies ceasing to be hyperinflationary 13
Chapter 3 Restatement procedures for non-monetary balance sheet items 15
Introduction 15
Non-monetary items at fair value or NRV 15
Prepaid expenses 15
Advances paid on purchases 16
Inventories 16
Investments in associates 16
Property, plant and equipment and accumulated depreciation 17
Intangible assets 18
Advances received 18
Deferred income (for instance grants) 19
Deferred tax assets and liabilities 19
Restatement of shareholders’ equity 19–20
Introduction 5
Why is this guide needed? 5
Inflation or changes in the general purchasing power of money 5
Characteristics of hyperinflation 5
Benefits of purchasing power adjusted financial statements 6
Objectives of IAS 29 6
Who must apply IAS 29 6
Reporting in a stable currency 6
Intra-group reporting 7
Contents
PricewaterhouseCoopers 3
Chapter 4 Restatement of the income statement 21
Revenue 21
Cost of goods sold 21
Depreciation, amortisation of intangible assets and realisation of prepaid expenses and deferred income (grant) 22
Other items included in the income statement 22
Adjustments and/or reclassifications made to statutory financial statements in order to arrive at IAS historic financial statements 22
Taxation on income 22
Monetary gain/loss 23
Chapter 6
Chapter 5 Monetary gain or loss 25
Proof – average monetary position method 25
Proof – statement of sources and application of net monetary assets and liabilities method 25–27
Cash flows 29–30
Chapter 7 Practical example of IAS 31

4 PricewaterhouseCoopers

PricewaterhouseCoopers 5
Why is this guide needed?IAS 29 is based on current purchasing powerprinciples and requires that financial statementsprepared in the currency of a hyperinflationaryeconomy be stated in terms of the value of money at the reporting balance sheet date.
This straightforward requirement needs anunderstanding of complex economic concepts, athorough knowledge of the enterprise’s financialand operating patterns and a detailed series ofprocedures to implement. It represents a realchallenge for enterprises and auditors.
The guide provides an overview of the concepts inthe standard, descriptions of the necessaryprocedures and a detailed worked example. Thischapter of the implementation guide covers theeconomic concepts, the objectives of the standardand who must apply it.
Inflation or changes in the generalpurchasing power of moneyThe purchasing power of money declines as thegeneral level of prices of goods and services rises. In an inflationary environment, the generalpurchasing power of money and the general pricelevel are interdependent.
Financial statements unadjusted for inflation in mostcountries are prepared on the basis of historic costwithout regard to changes in the general level ofprices. Consequently, the individual assets,liabilities, shareholders’ equity, revenue, expenses
and gains and losses are stated at cost at the timethese items originated. The impact of inflation isthus ignored. This produces a meaningful resultprovided that there are not dramatic changes in thepurchasing power of money.
Significant changes in the purchasing power ofmoney mean that financial statements unadjustedfor inflation are likely to be misleading. Amounts arenot comparable between periods and the gain orloss in general purchasing power that arises in thereporting period is not recorded. Financial statementsunadjusted for inflation do not reflect an accurateposition of the company at the balance sheet date or the results of its operations or cash flows.
Inflation adjusted financial statements are anextension to and not a departure from historic costaccounting. IAS 29 seeks to overcome thelimitations of historic cost financial reporting inhyperinflationary conditions.
Characteristics of hyperinflationIAS 29 does not provide an absolute definition ofhyperinflation. The general characteristics identifiedin IAS 29 are the following:
• people accumulate wealth in non-monetary assetsor in a stable foreign currency;
• monetary amounts are expressed in terms of arelatively stable foreign currency. Prices (forexample, rent, wages and capital goods) may bequoted in that currency;
Introduction
Chapter 1
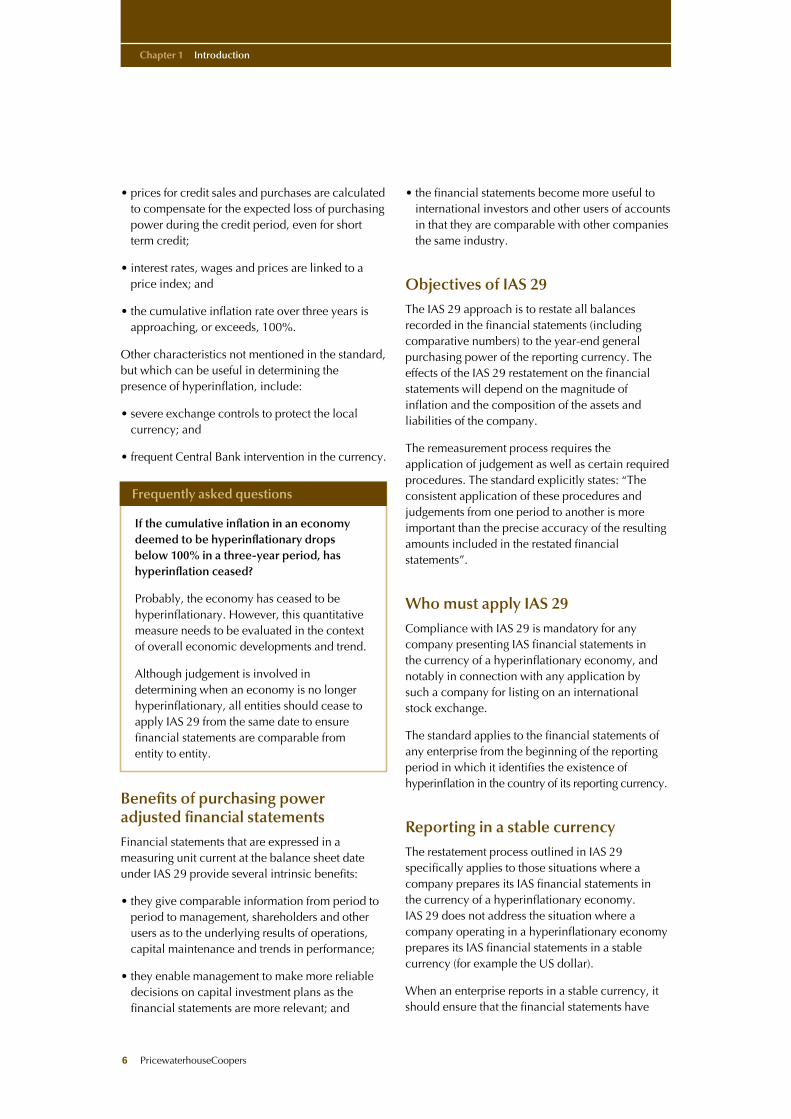
• prices for credit sales and purchases are calculatedto compensate for the expected loss of purchasingpower during the credit period, even for shortterm credit;
• interest rates, wages and prices are linked to aprice index; and
• the cumulative inflation rate over three years isapproaching, or exceeds, 100%.
Other characteristics not mentioned in the standard,but which can be useful in determining thepresence of hyperinflation, include:
• severe exchange controls to protect the localcurrency; and
• frequent Central Bank intervention in the currency.
Benefits of purchasing poweradjusted financial statementsFinancial statements that are expressed in ameasuring unit current at the balance sheet dateunder IAS 29 provide several intrinsic benefits:
• they give comparable information from period toperiod to management, shareholders and otherusers as to the underlying results of operations,capital maintenance and trends in performance;
• they enable management to make more reliabledecisions on capital investment plans as thefinancial statements are more relevant; and
• the financial statements become more useful tointernational investors and other users of accountsin that they are comparable with other companiesthe same industry.
Objectives of IAS 29The IAS 29 approach is to restate all balancesrecorded in the financial statements (includingcomparative numbers) to the year-end generalpurchasing power of the reporting currency. Theeffects of the IAS 29 restatement on the financialstatements will depend on the magnitude ofinflation and the composition of the assets andliabilities of the company.
The remeasurement process requires theapplication of judgement as well as certain requiredprocedures. The standard explicitly states: “Theconsistent application of these procedures andjudgements from one period to another is moreimportant than the precise accuracy of the resultingamounts included in the restated financialstatements”.
Who must apply IAS 29Compliance with IAS 29 is mandatory for anycompany presenting IAS financial statements in the currency of a hyperinflationary economy, andnotably in connection with any application by such a company for listing on an international stock exchange.
The standard applies to the financial statements ofany enterprise from the beginning of the reportingperiod in which it identifies the existence ofhyperinflation in the country of its reporting currency.
Reporting in a stable currencyThe restatement process outlined in IAS 29specifically applies to those situations where acompany prepares its IAS financial statements in the currency of a hyperinflationary economy. IAS 29 does not address the situation where acompany operating in a hyperinflationary economyprepares its IAS financial statements in a stablecurrency (for example the US dollar).
When an enterprise reports in a stable currency, itshould ensure that the financial statements have
Chapter 1 Introduction
6 PricewaterhouseCoopers
If the cumulative inflation in an economydeemed to be hyperinflationary dropsbelow 100% in a three-year period, hashyperinflation ceased?
Probably, the economy has ceased to behyperinflationary. However, this quantitativemeasure needs to be evaluated in the contextof overall economic developments and trend.
Although judgement is involved indetermining when an economy is no longerhyperinflationary, all entities should cease toapply IAS 29 from the same date to ensurefinancial statements are comparable fromentity to entity.
Frequently asked questions
appropriately dealt with the impact ofhyperinflation. Enterprises should restate the localcurrency IAS financial statements in accordancewith IAS 29. The year-end exchange rate is used totranslate the financial statements into the stablecurrency for all periods presented.
Intra-group reportingA foreign entity operating in a hyperinflationaryeconomy may be required for group purposes toreport to its overseas parent in a stable currency,usually the parent’s reporting currency.
IAS 21 states that the foreign entity must restate itslocal currency IAS financial statements inaccordance with IAS 29 before translation into theparent’s reporting currency.
A foreign operation’s activities may be an integralpart of those of the reporting enterprise, wheresubstantially all its transactions are in the currencyof its parent. An integral foreign operation locatedin a hyperinflationary economy reporting to itsparent in a stable currency, treats all local currencytransactions as if they are foreign currencytransactions in accordance with IAS 21 p9.
Chapter 1 Introduction
PricewaterhouseCoopers 7

8 PricewaterhouseCoopers

PricewaterhouseCoopers 9
OverviewApplication of IAS 29 requires the restatement of thefinancial statements, including the cash flowstatements, into current purchasing power at thebalance sheet date. This requires a number ofprocedural steps plus the application of judgement.Consistent application of procedures is moreimportant than the precise accuracy of the results.
In outline form, the restatement procedures consistof the following:
• selection of a general price index,
• segregation of monetary and non-monetary items,
• restatement of non-monetary items,
• restatement of the income statement,
• calculation and proof of the monetary gain or loss,
• preparation of the cash flow statement withrecognition of inflationary effects, and
• restatement of corresponding figures
This chapter gives an overview of the restatementprocess. Further chapters provide detailed guidanceon complex areas. An extensive worked example isshown in the second half of this publication.
Selection of the price indexIAS 29 requires the use of a general price index toreflect changes in purchasing power. Mostgovernments issue several periodic price indicesthat vary in their scope.
The standard does not indicate which index to use.It is preferable that all enterprises that report in thecurrency of the same economy use the same index.
The most reliable indicators of changes in generalprice levels are the consumer price index and thewholesale price index. In some countries, becauseof differences in the scope and the weighting ofitems included, the two indices may indicate slightlydifferent rates of inflation in the short-term. Over thelong-term, however, the two indices should showapproximately the same rate of inflation.
Applying the Standard
Chapter 2
The most important attributes for a reliablegeneral price index are:
• wide range of reference, such as inclusionof most of the goods and services producedin the economy, in order to reflect varyingprice fluctuations;
• accurate reflection of price changes;
• availability of prior year indices as well asthose of the current year;
• regular, preferably monthly, updating; and
• consistency, uniformity and continuity.
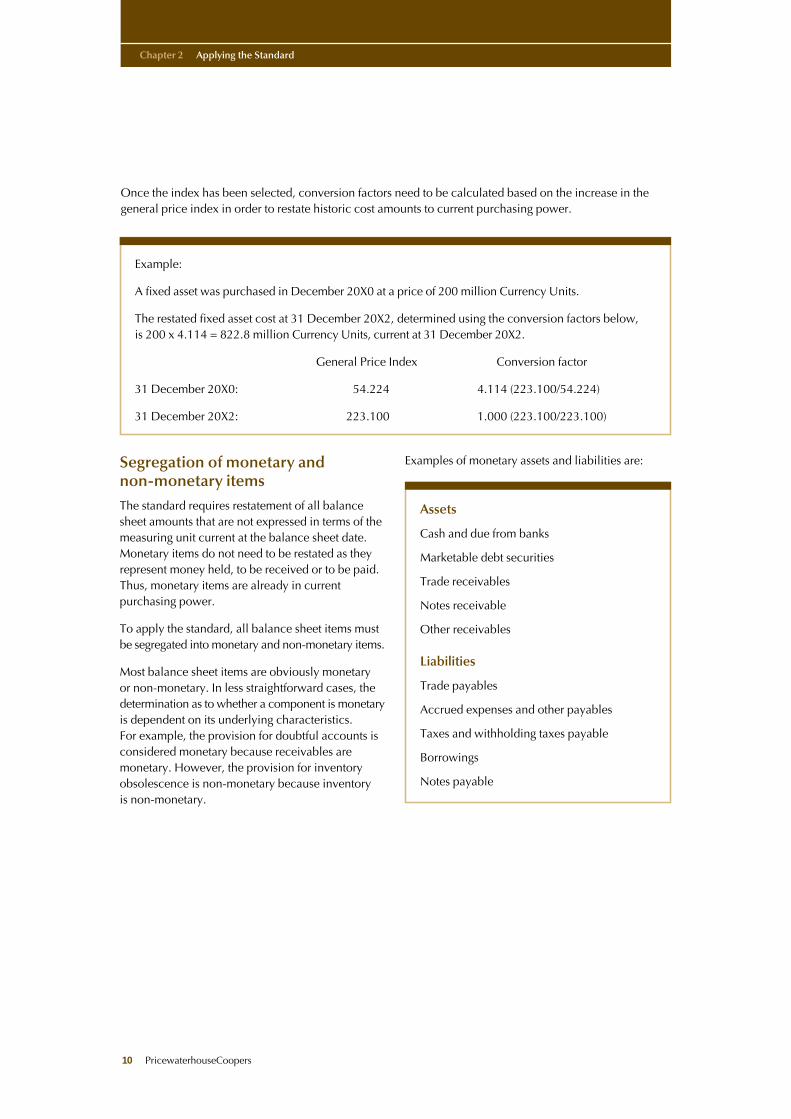
Once the index has been selected, conversion factors need to be calculated based on the increase in thegeneral price index in order to restate historic cost amounts to current purchasing power.
Chapter 2 Applying the Standard
10 PricewaterhouseCoopers
Example:
A fixed asset was purchased in December 20X0 at a price of 200 million Currency Units.
The restated fixed asset cost at 31 December 20X2, determined using the conversion factors below, is 200 x 4.114 = 822.8 million Currency Units, current at 31 December 20X2.
General Price Index Conversion factor
31 December 20X0: 54.224 4.114 (223.100/54.224)
31 December 20X2: 223.100 1.000 (223.100/223.100)
Segregation of monetary and non-monetary itemsThe standard requires restatement of all balancesheet amounts that are not expressed in terms of themeasuring unit current at the balance sheet date.Monetary items do not need to be restated as theyrepresent money held, to be received or to be paid.Thus, monetary items are already in currentpurchasing power.
To apply the standard, all balance sheet items mustbe segregated into monetary and non-monetary items.
Most balance sheet items are obviously monetary or non-monetary. In less straightforward cases, thedetermination as to whether a component is monetaryis dependent on its underlying characteristics. For example, the provision for doubtful accounts isconsidered monetary because receivables aremonetary. However, the provision for inventoryobsolescence is non-monetary because inventory is non-monetary.
Examples of monetary assets and liabilities are:
Assets
Cash and due from banks
Marketable debt securities
Trade receivables
Notes receivable
Other receivables
Liabilities
Trade payables
Accrued expenses and other payables
Taxes and withholding taxes payable
Borrowings
Notes payable
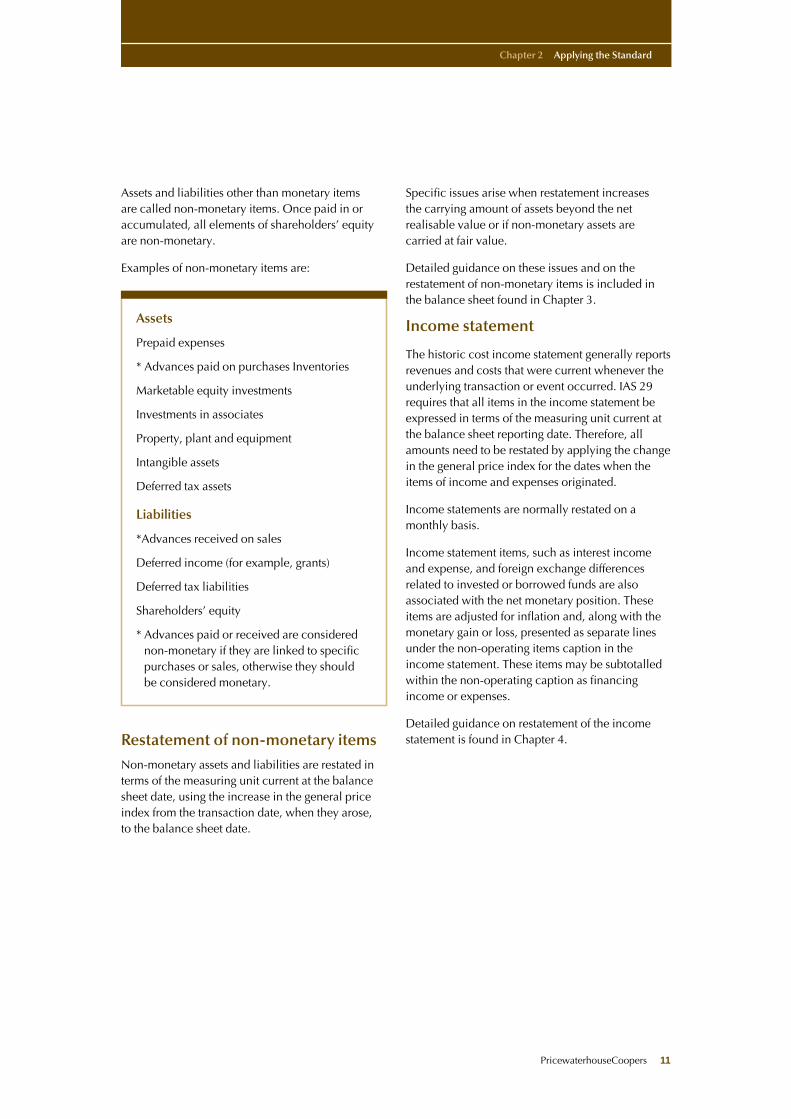
Assets and liabilities other than monetary items are called non-monetary items. Once paid in oraccumulated, all elements of shareholders’ equityare non-monetary.
Examples of non-monetary items are:
Restatement of non-monetary itemsNon-monetary assets and liabilities are restated interms of the measuring unit current at the balancesheet date, using the increase in the general priceindex from the transaction date, when they arose, to the balance sheet date.
Specific issues arise when restatement increases the carrying amount of assets beyond the netrealisable value or if non-monetary assets arecarried at fair value.
Detailed guidance on these issues and on therestatement of non-monetary items is included inthe balance sheet found in Chapter 3.
Income statement
The historic cost income statement generally reportsrevenues and costs that were current whenever theunderlying transaction or event occurred. IAS 29requires that all items in the income statement beexpressed in terms of the measuring unit current atthe balance sheet reporting date. Therefore, allamounts need to be restated by applying the changein the general price index for the dates when theitems of income and expenses originated.
Income statements are normally restated on amonthly basis.
Income statement items, such as interest incomeand expense, and foreign exchange differencesrelated to invested or borrowed funds are alsoassociated with the net monetary position. Theseitems are adjusted for inflation and, along with themonetary gain or loss, presented as separate linesunder the non-operating items caption in theincome statement. These items may be subtotalledwithin the non-operating caption as financingincome or expenses.
Detailed guidance on restatement of the incomestatement is found in Chapter 4.
Chapter 2 Applying the Standard
PricewaterhouseCoopers 11
Assets
Prepaid expenses
* Advances paid on purchases Inventories
Marketable equity investments
Investments in associates
Property, plant and equipment
Intangible assets
Deferred tax assets
Liabilities
*Advances received on sales
Deferred income (for example, grants)
Deferred tax liabilities
Shareholders’ equity
* Advances paid or received are considerednon-monetary if they are linked to specificpurchases or sales, otherwise they should be considered monetary.
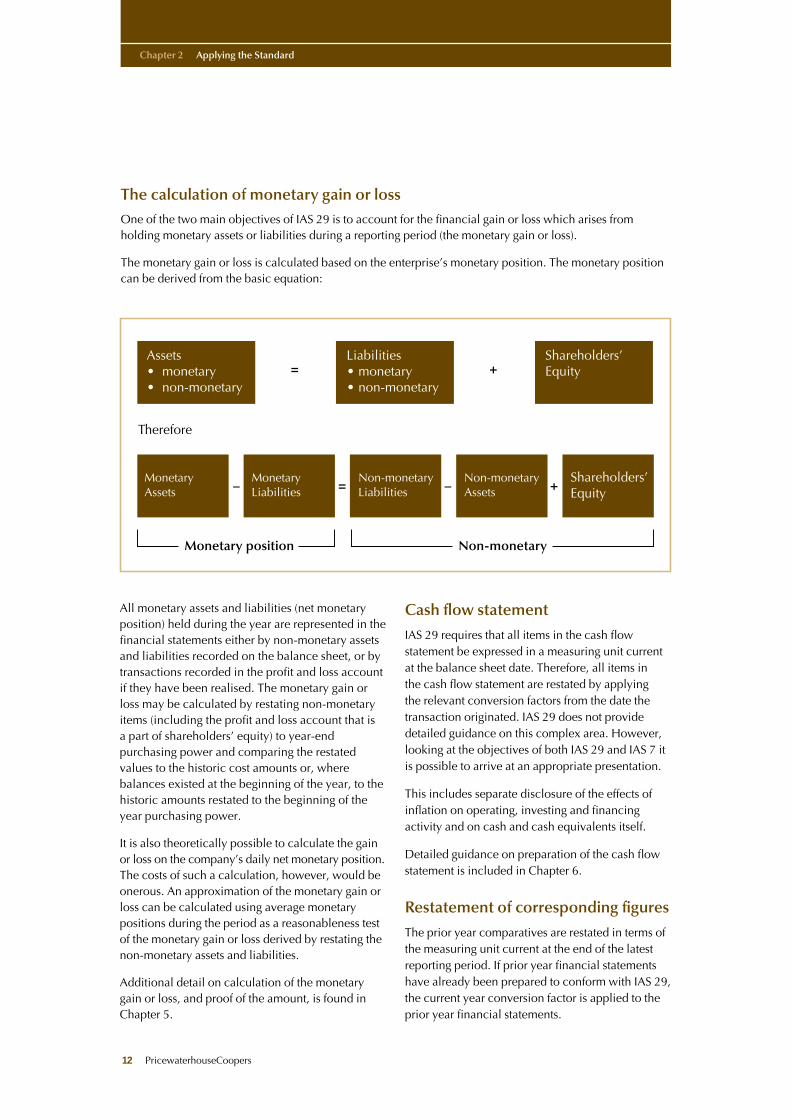
The calculation of monetary gain or lossOne of the two main objectives of IAS 29 is to account for the financial gain or loss which arises fromholding monetary assets or liabilities during a reporting period (the monetary gain or loss).
The monetary gain or loss is calculated based on the enterprise’s monetary position. The monetary positioncan be derived from the basic equation:
Chapter 2 Applying the Standard
12 PricewaterhouseCoopers
Shareholders’Equity
Assets• monetary• non-monetary
Liabilities• monetary• non-monetary
MonetaryAssets
MonetaryLiabilities
Non-monetaryAssets
Shareholders’Equity
Monetary position Non-monetary
Therefore
= +
Non-monetary Liabilities– = – +
All monetary assets and liabilities (net monetaryposition) held during the year are represented in thefinancial statements either by non-monetary assetsand liabilities recorded on the balance sheet, or bytransactions recorded in the profit and loss accountif they have been realised. The monetary gain orloss may be calculated by restating non-monetaryitems (including the profit and loss account that isa part of shareholders’ equity) to year-endpurchasing power and comparing the restatedvalues to the historic cost amounts or, wherebalances existed at the beginning of the year, to thehistoric amounts restated to the beginning of theyear purchasing power.
It is also theoretically possible to calculate the gainor loss on the company’s daily net monetary position.The costs of such a calculation, however, would beonerous. An approximation of the monetary gain orloss can be calculated using average monetarypositions during the period as a reasonableness testof the monetary gain or loss derived by restating thenon-monetary assets and liabilities.
Additional detail on calculation of the monetarygain or loss, and proof of the amount, is found inChapter 5.
Cash flow statement
IAS 29 requires that all items in the cash flowstatement be expressed in a measuring unit currentat the balance sheet date. Therefore, all items in the cash flow statement are restated by applying the relevant conversion factors from the date thetransaction originated. IAS 29 does not providedetailed guidance on this complex area. However,looking at the objectives of both IAS 29 and IAS 7 itis possible to arrive at an appropriate presentation.
This includes separate disclosure of the effects ofinflation on operating, investing and financingactivity and on cash and cash equivalents itself.
Detailed guidance on preparation of the cash flowstatement is included in Chapter 6.
Restatement of corresponding figures
The prior year comparatives are restated in terms ofthe measuring unit current at the end of the latestreporting period. If prior year financial statementshave already been prepared to conform with IAS 29,the current year conversion factor is applied to theprior year financial statements.
DisclosuresEnterprises should describe in their accountingpolicy note the methodology used in applying IAS29. The following specific information should bedisclosed in accordance with IAS 29:
• the fact that the financial statements and thecorresponding figures for previous periods havebeen restated for the changes in the generalpurchasing power of the reporting currency and,as a result, are stated in terms of the measuringunit current at the balance sheet date;
• the identity and level of the price index at thebalance sheet date and the movement in theindex during the current and the previousreporting period; and
• whilst not required by the standard it is useful todisclose the three-year cumulative inflation rate atthe balance sheet date for each period presentedin the financial statements.
Economies ceasing to behyperinflationaryWhen an economy ceases to be hyperinflationaryand a company discontinues the preparation andpresentation of financial statements in accordancewith IAS 29, it should treat the amounts expressedin the measuring unit current at the end of theprevious reporting period as the basis for the carryingamounts in its subsequent financial statements.Practically speaking, an enterprise will continue touse the restated amounts as the cost basis of thenon-monetary items in the balance sheet.
Enterprises preparing IAS accounts for the first time in economies which have ceased to behyperinflationary will need to make a cumulativeadjustment to the non-monetary items in the balancesheet. All adjustments to non-monetary items willbe charged or credited to retained earnings.
Although IAS 29 is no longer applicable in thissituation, an enterprise may, if it wishes, providesupplementary information reflecting the effects ofchanging prices using the guidance in IAS 15.
Chapter 2 Applying the Standard
PricewaterhouseCoopers 13

14 PricewaterhouseCoopers
PricewaterhouseCoopers 15
IntroductionAll non-monetary components of the balance sheet,excluding retained earnings, are restated by applyinga general price index from the dates on which theitems arose at the first application of IAS 29. Restatedretained earnings, excluding current year earnings,are the balancing figure derived from all the otheramounts in the opening restated balance sheet.
This chapter describes the detailed procedures forrestating non-monetary assets and liabilities.
Non-monetary items at fair value or net realisable valueSome non-monetary assets may be carried at fairvalue at the balance sheet date such as fixed assetsrevalued by an independent appraiser as allowedunder IAS 16, marketable equity securities fairvalued under IAS 39 and investment propertiescarried at fair value under fair value model ofIAS 40. The historic cost amounts should be restatedin order to obtain the appropriate monetary gain orloss. The restated carrying amount should then becompared to the “current” values and thedifference, if any, charged or credited to the incomestatement or shareholders’ equity in accordancewith the appropriate IAS.
The net realisable value of an asset may be less than its restated amount. Application of the normal“lower of cost and market value” rule wouldtherefore result in a write-down to net realisablevalue in the restated financial statements, even if
no write-down of the asset was required in thehistoric cost financial statements.
Prepaid expenses• Obtain the ageing of prepaid expenses.
• Restate prepaid expenses from the date of thepayments to the balance sheet date.
Restatement procedures for non-monetarybalance sheet items
Chapter 3
Marketable Securities
Should equity securities that are carried atfair value be restated?
Equity securities classified as either held fortrading assets or available-for-sale assets arecarried at fair value on the balance sheetunder IAS 39. Fair value gains and losses onheld for trading assets are recognisedimmediately in the income statement wherefair value gains and losses on available-for-sale assets are recognised, under a one-timepolicy choice, either in equity or in theincome statement. Fair value gains and lossesdeferred in equity are recycled to the incomestatement on disposal or impairment.
The treatment for IAS 29 requires the historiccost of the equity securities be restated. Thedifference between the fair value of the equitysecurities and the restated historic cost of theequity securities is the fair value gain or loss.
Frequently asked questions
Advances paid on purchases• Obtain a breakdown of advances paid ensuring
that where appropriate, the relevant specificadvances have already been netted off againstaccounts payable.
• For advances paid in respect of purchases offuture inventories or fixed assets, obtain theageing of advances, including the amounts andpayment dates.
• Restate advances according to the ageing schedulefrom the payment dates to the balance sheet date.
• When the inventory or fixed asset is received therestated carrying value of the advance should beadded to the restated cost base of the asset.
Inventories
Raw materials
• Obtain the historic cost prices and acquisitiondates of raw materials. If a detailed ageing ofinventory cannot be obtained, the average ageingof items could (subject to materiality considerations)be estimated using inventory turnover.
• If the FIFO or moving average method is used,restate raw materials inventories based on theageing of the related items using the increase inthe general price index for the period from thepurchase dates to the balance sheet date.
• If a yearly average is used, restate raw materialsusing the yearly average increase in the generalprice index.
Semi-finished/finished goods
• Obtain the ageing of semi-finished and finishedgoods.
• Deduct the historic depreciation expense ofproperty, plant and equipment that is included incost of semi-finished goods as this will bereplaced with the restated depreciation expense.
• If the FIFO or moving average method is used,restate the balance of semi-finished goods, basedon the ageing of the composition of cost elementsincluded in inventories. If yearly average costingis used, restate using the yearly average increasein the general price index.
• After completion of the restatement as mentionedabove, add back to inventory the attributabledepreciation calculated by reference to therestated property, plant and equipment balances.
• After the inventory has been restated, review therestated balances to determine the need for anynet realisable value provisioning.
Investments in associates• Obtain the historic cost prices and acquisition
dates of investments according to the purchasedate and cost of purchase.
• Restate the balance of investments, using theincrease in the general price index from thepurchase date to the balance sheet date.
• Compare the restated investment balance with the market value, and adjust the investmentbalance, if necessary, based on the lower ofrestated cost and market value.
Chapter 3 Restatement procedures for non-monetary balance sheet items
16 PricewaterhouseCoopers
Inventory
Will the costing method of inventory (forexample FIFO, LIFO, or weighted average)have an impact on the IAS 29 restatement?
The costing method should have no impacton the final restated value of the inventoryif there are no price changes in real terms.For example under both the FIFO and LIFOinventory costing methods, the historic cost of the inventory would be restated to year-endpurchasing power. In practice, there is likelyto be slightly different results as the changesin the cost of inventory may not be exactlyequal to the change in the general price index.
How are inventory and the related provisionfor impairment treated when the inventoryis subsequently sold or disposed of?
Inventory, and any provision against thecarrying value, is a non-monetary item. Assuch, the carrying value of both the inventoryand the provision should be inflated up to thedate of the sale or disposal.
Frequently asked questions

Chapter 3 Restatement procedures for non-monetary balance sheet items
PricewaterhouseCoopers 17
Property, plant and equipment andaccumulated depreciation• Obtain the original historic cost prices and
acquisition dates of property, plant andequipment. The restatement should be based onthe original purchase date of the asset, not thecapitalisation date.
• If existing, eliminate from the IAS historicfinancial statements any revaluation ofconstruction in progress, property, plant andequipment and the associated accumulateddepreciation that does not meet the conditionsof IAS 16.
• Restate the original purchase cost of property,plant and equipment from the date of thepurchase of each item to the balance sheet date,using the general price index.
• Calculate the depreciation charge for the periodon the basis of the restated property, plant andequipment. Opening accumulated depreciation isalso calculated on the basis of restated property,plant and equipment.
• For disposals determine the original date ofpurchase and the historic cost. Calculate and thendeduct the restated property, plant and equipmentbalance that has been disposed of and itsaccumulated depreciation.
• Historic depreciation charges included in generaladministrative expenses, idle time expenses, costof goods sold and inventory balances should bereplaced with the depreciation expensecalculated on the basis of the restated property,plant and equipment balances.
Subsidiaries and associates
What exchange rates should be used whenconsolidating a foreign subsidiary of an entityreporting in a hyperinflationary economy?
If the foreign subsidiary is operating in aneconomy that is not experiencing hyperinflationthe income statement should be translated usingthe historic exchange rates (in practice averageexchange rates may be used). The incomestatement items should then be restated inaccordance with IAS 29 from the date of thetransaction (which would be the same date usedto translate the foreign currency into the localhyperinflationary currency). This will facilitatethe elimination of any inter-companytransactions as the transactions will be on thesame basis of accounting and thus be comparable.
The balance sheet should be translated into thehyperinflationary currency using the closing ratemethod. The investor’s share of net assets in thesubsidiary at the beginning of the year (ascalculated by the equity method of accounting)should be adjusted for current year inflation.The difference between the parent’s share of theclosing net assets and the opening balance and
earnings for the period both adjusted for inflationas described above should be charged to equityas a translation adjustment.
What exchange rates should be used whenequity accounting for a foreign associate of anentity reporting in a hyperinflationaryeconomy?
The investor’s share of the results of operationswould be translated into the reporting entitiescurrency at the dates the earnings accrued. Theearnings would then be restated to year-endpurchasing power in accordance with IAS 29 in theconsolidated accounts from the date of translation.
The opening investment balance accounted forusing the equity method at opening exchangerates should be adjusted for inflation to year-endpurchasing power. To calculate the netinvestment in the associate, the investee’sbalance sheet should be translated into thereporting currency at year end rates, which formsthe basis for carrying value of the investment.The difference between the carrying value andthe opening balance plus earnings for the period,both adjusted for inflation, should be charged toequity as a translation adjustment.
Frequently asked questions
• Obtain the historic cost prices and acquisitiondates of the construction in progress balance andrestate the balances by applying indicesaccording to transaction date. When theconstruction in progress is subsequentlytransferred to fixed assets the related inflationadjustment should be transferred and applied tothe asset.
• If the company capitalises interest in accordancewith IAS 23, the part of the capitalised borrowingcost that compensates for the inflation during thesame period should be recognised as an expensein the period in which those costs were incurred.
• If the company capitalises exchange losses inaccordance with the allowed alternativetreatment in IAS 21, such exchange losses should(for the purpose of IAS 29) be recognised as anexpense in the period in which they arise.
• For the initial year of adopting the IAS 16 alternativetreatment for measurement, the historic cost of thefixed asset would be restated in accordance withIAS 29 in order to obtain the correct monetarygain or loss in the income statement. The carryingvalue would then be replaced with the appraisedvalue, the difference should be treated inaccordance with IAS 16.39 or 16.40.
• Assess for impairment in accordance with IAS 36.
Intangible assets• Intangible assets, including goodwill, are inflated in
the same manner as property, plant, and equipment.
Advances received• Obtain a breakdown of advances received
ensuring that, where appropriate, the relevantspecific advances have been netted off against the relevant accounts receivable.
• Obtain the ageing of advances received.
• Restate advances according to the ageing andincrease in the general price level from the date of receipt to the balance sheet date.
• When the sale is realised the restated advancesreceived should be added to the sales value.
Deferred income (for instance grants)• Obtain the ageing of deferred income according
to the date of receipt.
• Restate the original amount of deferred incomereceived from the transaction date to the balancesheet date.
• Calculate accumulated amortisation and currentperiod amortisation on the basis of the restateddeferred income balance.
• Replace historic amortisation credited to theincome statement with the amortisation calculatedon the basis of the restated deferred income.
Chapter 3 Restatement procedures for non-monetary balance sheet items
18 PricewaterhouseCoopers
Property, plant, and equipment
What indices are used to restate constructionin progress (CIP)? How does the restatementof CIP affect the future value of fixed assets?
CIP should be restated from the date thepayment was made. An asset or project withinCIP should be restated within CIP. Whencapitalised, the related inflation adjustmentshould be transferred to fixed assets and addedto the cost base of the item being transferred.
When an entity is initially adopting IAS 29where the economy of the reporting entity hasbeen experiencing hyperinflation in previousyears, it is important to consider the inflationeffect on fixed assets which were previouslyheld in CIP
Frequently asked questions
▼
How are assets that have been remeasuredby an independent appraiser in accordancewith IAS 16 treated when restating the fixedassets in accordance with IAS 29?
If assets are revalued during a year ofrestatement the historic cost should be restatedin order to arrive at the correct monetary gainor loss. The restated cost would then becompared to the appraised amount, thedifference would be treated as noted in IAS 16.In subsequent years the appraised carryingamount and the revaluation reserve (unless itis first year of IAS 29 application wheneliminated) would be restated.
Deferred tax assets and liabilities• See “Taxation on income” on page 22.
Restatement of shareholders’ equity• At the beginning of the first period of application
of IAS 29, the components of shareholders’ equityin the opening balance sheet, excluding retainedearnings, are restated by applying a general priceindex from the dates on which the items arose. Anyrevaluation surplus that arose in previous periods iseliminated. Restated retained earnings is thebalancing figure derived from all the other restatedamounts in the restated opening balance sheet.
• At the end of the first period and in subsequentperiods, all components of shareholders’ equityare restated by applying a general price indexfrom the beginning of the period, or the dates onwhich the items arose if later. This restatementforms part of the monetary gain or loss calculation.
• Any statutory revaluation surplus (that is not inaccordance with IAS 16) arising in subsequentperiods is eliminated against the related assetsrevalued.
• Current year restated net income is added to thebalance of the restated opening retained earnings.
• For the purpose of the statement of changes inshareholders’ equity, dividends paid during aperiod should be restated by applying a general
price index from the date when the shareholders’right to receive payment is established to thebalance sheet date.
Chapter 3 Restatement procedures for non-monetary balance sheet items
PricewaterhouseCoopers 19
Provisions for liabilities and charges
Are provisions for liabilities and chargesmonetary or non-monetary items, forexample should we recognise a gain as aresult of holding provision or not?
Provisions for liabilities and charges could bemonetary, monetary but inflation linked, ornon-monetary. Their classification dependson the nature of liability exposed. If warrantyobligations are limited to a defined originalamount, the warranty provision is monetary.If the enterprise’s liability is specified as arepair or exchange of the item under warranty,the liability is non-monetary.
Frequently asked questions
Equity
What are the components of shareholders’equity that need to be restated? Which datesshould be used for the restatement?
All components of shareholders’ equity shouldbe restated, with certain exceptions forrevaluation reserves. Legal and extraordinaryreserves are generally become a part ofretained earnings in IAS accounts. Thesereserves are not considered for restatementpurposes. It may be beneficial to disclose thehistoric statutory reserves in the footnotes tothe financial statements.
Capital increases should be restated from the date the consideration was received. If consideration was received in the form of anon-monetary contribution (such as fixedassets contributed), the fair value of the assetshould be used as the historic cost.
How is the revaluation reserve in equity treated?
Very often statutory regulations for countriesoperating in a hyperinflationary economyallow companies to increase the carrying valueof fixed assets based on prescribed rules, with acorresponding increase to the equity – usuallycalled the revaluation reserve. Generally, thesestatutory revaluation adjustments are not inaccordance with IAS 16, Property Plant, andEquipment, and, should be eliminated from theIAS accounts.
If a revaluation has been performed at year-endin accordance with IAS 16, the revaluationreserve would be the difference between the historic values restated in accordancewith IAS 29 and the revalued amounts per IAS16. There would be no need to inflate therevaluation reserve, as it would be current atyear-end. In subsequent years the revaluationreserve would be inflated.
Frequently asked questions
▼
Chapter 3 Restatement procedures for non-monetary balance sheet items
20 PricewaterhouseCoopers
Equity – continuedHow should a share capital increase by way of a transfer from the statutory revaluation surplusbe treated?
As noted above, the statutory revaluationsurplus is eliminated from the IAS restatedfinancial statements. Thus, a share capitalincrease by way of a transfer from the statutoryrevaluation surplus is not considered incalculating the restated paid-in capital. Theincrease of the share capital will be offset by areduction of retained earnings. The amount ofthe increase to be disclosed is the restatedamount of statutory increase inflated as from thedate of increase authorisation.
How are dividends payable treated?
A dividend payable is a monetary liability thatwill result in a monetary gain for the company.Therefore, the dividend amount should beexcluded from retained earnings at the date thedividend becomes payable.
Should unpaid capital that the shareholdershave committed to pay be inflated?
The treatment of the unpaid share capital dependson whether the shareholder is legally bound to
pay-up the capital or whether the commitmentis nothing more than an unbinding promiseto pay.
If the shareholder has no legal obligation to paythis capital there would be no receivablerecorded in the company’s books. The unpaidcapital and commitment would be disclosed inthe footnotes at the historic amounts which isthe consideration expected to be received bythe company. There is no effect on monetarygain or loss, as the company does not have anenforceable receivable.
However, if the capital increase is legallybinding, and approved by the generalassembly, the company would show areceivable from shareholders with acorresponding increase in share capital (thefact that the share capital has not been paid-upwould be disclosed in the footnotes). The sharecapital would be restated to account for anysubsequent changes in inflation that creates amonetary loss in the income statement fromholding the receivable.
PricewaterhouseCoopers 21
All items in the income statement should be restatedby applying the change in the general price indexfrom the dates when the items of income andexpense were originally recorded.
Provided inflation is occurring at a relatively stablerate during the year, most enterprises will restateactivity on a monthly average basis, with alltransactions presumed to occur evenly throughout therelevant period. This chapter describes the detailedprocedures for restating the income statement.
Revenue• Obtain a monthly break down of revenue.
Restate each period using the appropriate indicesto year-end.
Cost of goods sold• Obtain the monthly breakdown of the items
included in production costs.
• Restate all components of production costs,except depreciation and raw materials, from the month when the costs were incurred to theyear-end.
• Calculate raw material used in the productionprocess through the reconciliation of restatedopening raw materials and closing raw materials balances.
• Calculate depreciation related to production costs on the basis of the restated property, plantand equipment, as explained on balance sheetsection, and replace the historic depreciation with this restated depreciation.
• Restate opening and closing historic finished andsemi-finished goods as explained on balancesheet section.
• The restated cost of goods sold figure is obtainedby adding to purchases and other productioncosts restated from the date when the cost was
Restatement of the Income Statement
Chapter 4
Selection of the indexWhat is the correct index to be used torestate the income statement?
The items within the income statement shouldbe restated from the date of the transaction.Having said this, it is generally not practical torestate the items from the date of the transaction,therefore, average indices may be used as approx-imations. The average indices to use woulddepend on the frequency of the transaction (in other words sales earned evenly throughoutthe period) and whether inflation wasrelatively constant throughout the period.
Frequently asked questions
▼
If the income statement transactions occurredevenly throughout the year, without seasonalfluctuations, and inflation was relativelyconstant during the year, the yearly averageindex may be used for the restatement. Inpractical terms, this is never the case and useof monthly indices is more appropriate.
incurred the restated opening finished and semi-finished goods and deducting the restatedclosing finished and semi-finished goods. The restated opening finished goods and semi-finished goods is derived by:
– Restating amounts to the prior balance sheet datepurchasing power, and
– Inflating the restated cost of opening amounts ascalculated above by the conversion factor for theentire year.
Depreciation, amortisation ofintangible assets and realisation ofprepaid expenses and deferredincome (grant)• Depreciation of property, plant and equipment,
amortisation of intangible assets and realisation of prepaid expenses and deferred income iscalculated on the basis of the restated asset and/orliability balance.
Other items included in the incomestatement• Obtain the monthly breakdown of all items.
• Restate all items for each month using theincrease in the general price index from therelated month or quarter until the year-end.
• Certain non-monetary items being included in theopening balance sheet could be realised throughthe income statement for the period, for exampleinventory and disposed property, plant andequipment. In that case the restatement should beapplied with taking into account the restatementsurplus accumulated whilst the item wasrecognised on the balance sheet.
Adjustments and/or reclassificationsmade to statutory financialstatements in order to arrive at IAShistoric financial statements• If the adjustment and/or reclassification made in
accordance with IAS is related to a specific period or specific date, the adjustment and/orreclassification calculated in historic terms shouldbe restated for the related time period, using theincrease in the general price index from thespecific date to the balance sheet date.
Taxation on income
Current taxation
• Obtain details of monthly or quarterly taxationcalculated on the basis of the monthly or quarterlytaxable income of the company. Restate monthlyor quarterly tax expenses for each month orquarter in terms of balance sheet date purchasingpower, using the increase in the general priceindex from the related month or quarter until thereporting date.
Chapter 4 Restatement of the Income Statement
22 PricewaterhouseCoopers
Foreign exchange
Should interest income or expense andforeign exchange gains or losses be restated?
IAS 29.26 states that all items in the incomestatement should be restated. There are noexceptions to this rule.
Frequently asked questions
Bad debts
If the bad debt expense is inflated themovement schedule of the provision does not reconcile. How then does the openingand closing balance reconcile?
At the time the debt is considered bad it isprovided against. The provision is a monetaryitem as the underlying asset it relates to ismonetary. Therefore a monetary gain willresult from carrying this provision (whichactually offsets the monetary loss beingincurred as a result of holding the receivable).The bad debt expense is inflated from the date the provision was made.
To ensure the reconciliation of the provisionaccount, all items must be in terms of themeasuring unit current at the balance sheetdate. The difference between the restatedopening balance, restated current periodexpense (net of any restated provision reversals)and the closing balance is a monetary gain.
Frequently asked questions
Deferred taxation
• Calculate deferred tax expense/income anddeferred tax liability/asset with reference tohistoric adjustments made (if any) in moving fromthe tax accounts to the IAS historic financialstatements.
• Calculate deferred tax in relation to temporarydifferences arising from the restatement of non-monetary assets and liabilities. According to IAS 12 (revised) deferred tax is calculated in fullon the temporary differences arising from therestatement of non-monetary assets and liabilities.
• As the closing deferred tax position is calculatedas the difference between the tax base and the IAS 29 adjusted financial statements (that is to saymeasuring unit current at the balance sheet date)there is no need to adjust the closing deferred taxbalance for inflation. The difference between theopening deferred tax balance, adjusted to year-end purchasing power, and the closing deferredtax balance is the deferred tax expense or creditfor the period.
Monetary gain/loss
• The gain or loss on the net monetary position arisesfrom holding monetary assets and liabilities, andis reported as a separate item in the restated incomestatement (see Chapter 5 for additional detail onthe monetary gain or loss). The monetary gain orloss is derived from restating the closing balancesheet (less the inflation adjustments to the openingbalance sheet in prior year-end purchasingpower) and the items in the income statement.
• The derived amount may need additional nettingoff with the indexation differences occurred in theincome statement on those monetary items thatare linked to inflation index and as such, beingnot subject to inflationary risks or holdingbenefits, such as monetary gains or losses.
Chapter 4 Restatement of the Income Statement
PricewaterhouseCoopers 23

24 PricewaterhouseCoopers
PricewaterhouseCoopers 25
Calculation and proof of the monetary gain or loss isan important element of applying IAS 29. This chaptercontains several methods to prove the accuracy ofthe monetary gain or loss arising from restatement.
The monetary gain or loss may be estimated byapplying the change in a general price index to theweighted average difference between monetaryassets and monetary liabilities. The weightedaverage of the opening monetary position and themonetary position at year-end may be used for thepurpose of this calculation. It is possible, however,that a large difference may arise between themonetary gain or loss in the income statement andthe estimate as calculated by the proof if themonetary position has not been relatively constantthroughout the year.
Therefore, if the monetary position is changingsignificantly a more accurate proof of the monetarygain or loss would be obtained by using thequarterly or monthly weighted average monetaryposition in the proof calculation.
Proof – average monetary position methodA simple example with a constant monetaryposition is set forth below. In this example it wouldbe appropriate to use the weighted average of theopening and closing monetary position.
Proof – statement of sources andapplication of net monetary assetsand liabilities methodIn addition, a statement of source and application of net monetary assets or liabilities is often preparedas alternative proof of the net monetary gain or loss(see below). The items which cause changes in themonetary assets/liabilities are analysed, and the net balance of the monetary assets/liabilities isdetermined as if there were no changes first, andthen you should adjust for current year movements.Restatements are performed and the comparisonwith the actual net balance and movements ofmonetary assets or liabilities enables the monetarygain or loss to be approximated.
Monetary gain or loss
Chapter 5
Chapter 5 Monetary gain or loss
26 PricewaterhouseCoopers
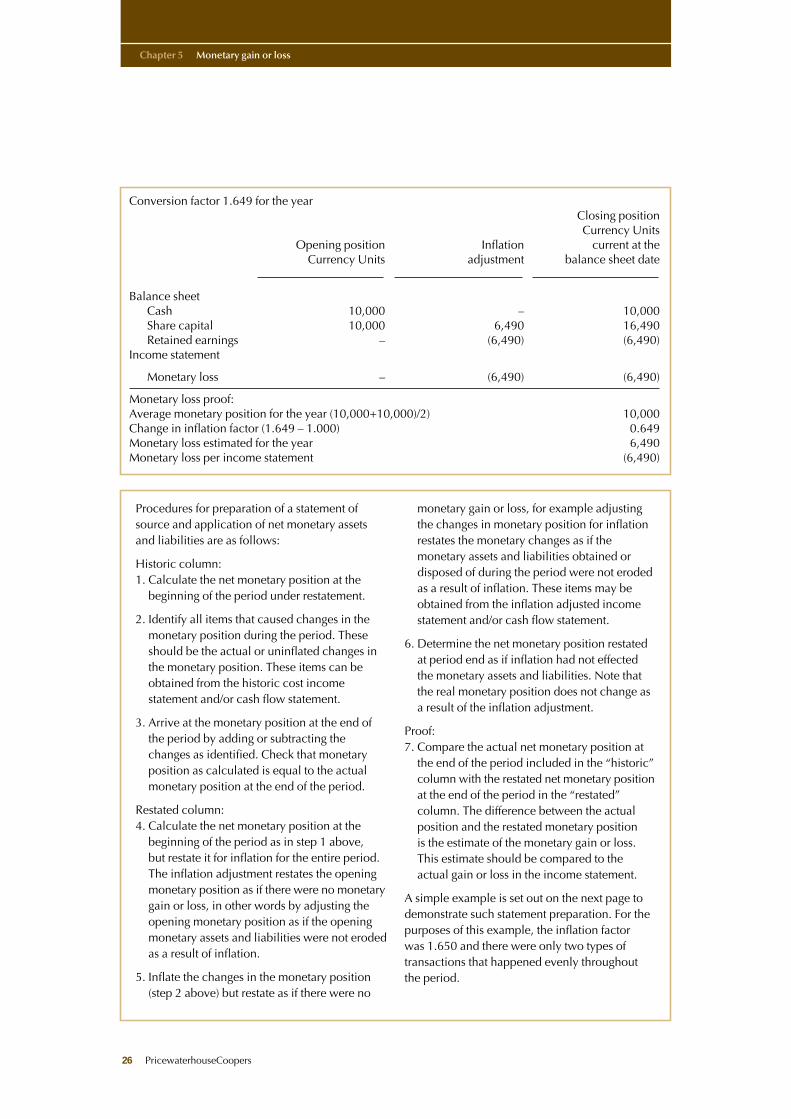
Procedures for preparation of a statement ofsource and application of net monetary assetsand liabilities are as follows:
Historic column:1. Calculate the net monetary position at the
beginning of the period under restatement.
2. Identify all items that caused changes in themonetary position during the period. Theseshould be the actual or uninflated changes inthe monetary position. These items can beobtained from the historic cost incomestatement and/or cash flow statement.
3. Arrive at the monetary position at the end ofthe period by adding or subtracting thechanges as identified. Check that monetaryposition as calculated is equal to the actualmonetary position at the end of the period.
Restated column:4. Calculate the net monetary position at the
beginning of the period as in step 1 above, but restate it for inflation for the entire period.The inflation adjustment restates the openingmonetary position as if there were no monetarygain or loss, in other words by adjusting theopening monetary position as if the openingmonetary assets and liabilities were not erodedas a result of inflation.
5. Inflate the changes in the monetary position(step 2 above) but restate as if there were no
monetary gain or loss, for example adjustingthe changes in monetary position for inflationrestates the monetary changes as if themonetary assets and liabilities obtained ordisposed of during the period were not erodedas a result of inflation. These items may beobtained from the inflation adjusted incomestatement and/or cash flow statement.
6. Determine the net monetary position restatedat period end as if inflation had not effectedthe monetary assets and liabilities. Note thatthe real monetary position does not change asa result of the inflation adjustment.
Proof:7. Compare the actual net monetary position at
the end of the period included in the “historic”column with the restated net monetary positionat the end of the period in the “restated”column. The difference between the actualposition and the restated monetary position is the estimate of the monetary gain or loss.This estimate should be compared to theactual gain or loss in the income statement.
A simple example is set out on the next page todemonstrate such statement preparation. For thepurposes of this example, the inflation factor was 1.650 and there were only two types oftransactions that happened evenly throughoutthe period.
Conversion factor 1.649 for the yearClosing positionCurrency Units
Opening position Inflation current at theCurrency Units adjustment balance sheet date
Balance sheetCash 10,000 – 10,000Share capital 10,000 6,490 16,490Retained earnings – (6,490) (6,490)
Income statement
Monetary loss – (6,490) (6,490)
Monetary loss proof:Average monetary position for the year (10,000+10,000)/2) 10,000Change in inflation factor (1.649 – 1.000) 0.649Monetary loss estimated for the year 6,490Monetary loss per income statement (6,490)
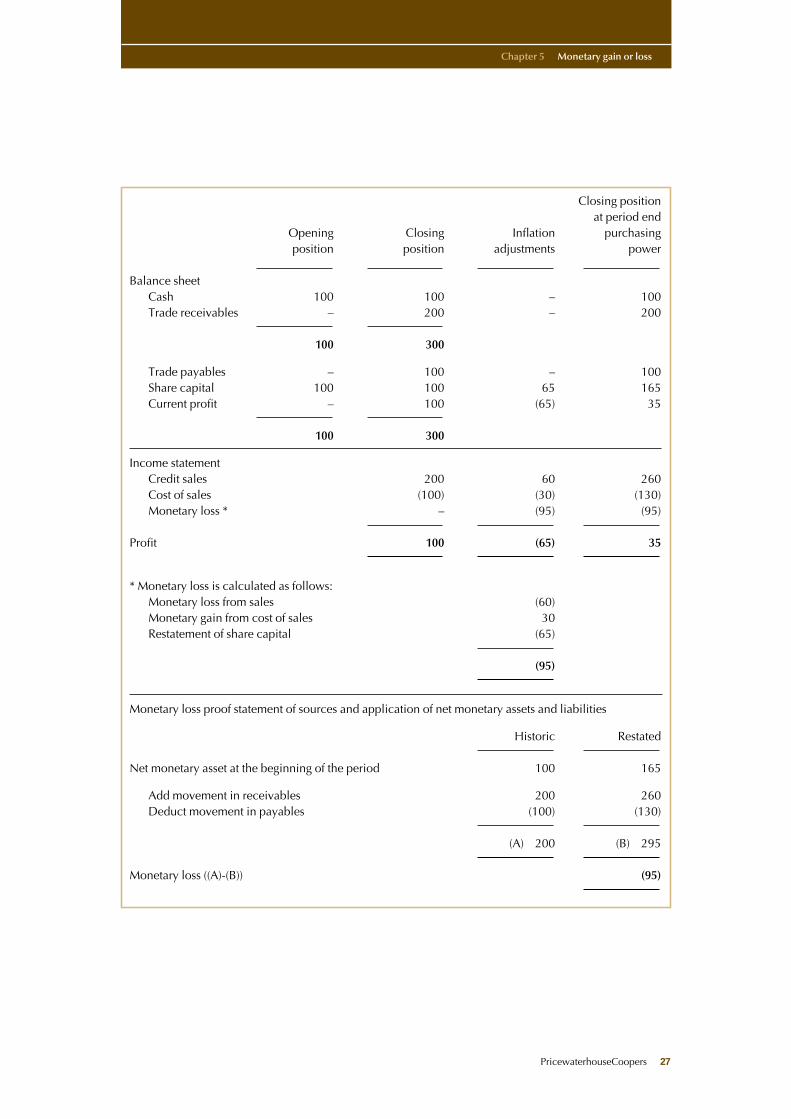
Closing positionat period end
Opening Closing Inflation purchasingposition position adjustments power
Balance sheetCash 100 100 – 100Trade receivables – 200 – 200
100 300
Trade payables – 100 – 100Share capital 100 100 65 165Current profit – 100 (65) 35
100 300
Income statementCredit sales 200 60 260Cost of sales (100) (30) (130)Monetary loss * – (95) (95)
Profit 100 (65) 35
* Monetary loss is calculated as follows:Monetary loss from sales (60)Monetary gain from cost of sales 30Restatement of share capital (65)
(95)
Monetary loss proof statement of sources and application of net monetary assets and liabilities
Historic Restated
Net monetary asset at the beginning of the period 100 165
Add movement in receivables 200 260Deduct movement in payables (100) (130)
(A) 200 (B) 295
Monetary loss ((A)-(B)) (95)
Chapter 5 Monetary gain or loss
PricewaterhouseCoopers 27

28 PricewaterhouseCoopers
PricewaterhouseCoopers 29
Preparation of a cash flow statement under IAS 29presents some unique challenges. All activity needsto be presented in current purchasing power, butreaders of the financial statements must also be ableto follow cash flows between the restated balancesheets and income statements. Most enterprises usethe indirect method although both methods arepresented in the detailed example in Practicalexample of IAS 29.
There are three unique elements in the hyper-inflationary cash flow statement:
• net income before tax is adjusted for the monetarygain or loss for the period;
• the effect of inflation on operating, financing andinvesting activity is disclosed separately; and
• the monetary loss on cash and cash equivalents ispresented separately.
The example below shows how the monetary gainelement impacts financing activity.
Cash flows
Chapter 6
Example:
Below are the historic and price level adjusted movements on a loan account. Inflation in the year is100%, average inflation for the year is 41%; assume movements occur rateably over the year.
Balance Draw down Repaid Monetary Balance20X7 gain 20X8
Historic movements 1,000 500 (700) – 800
Conversion factor 2.0 1.41 1.41 1.0
Price level adjusted 2,000 705 (987) (918) 800A B C
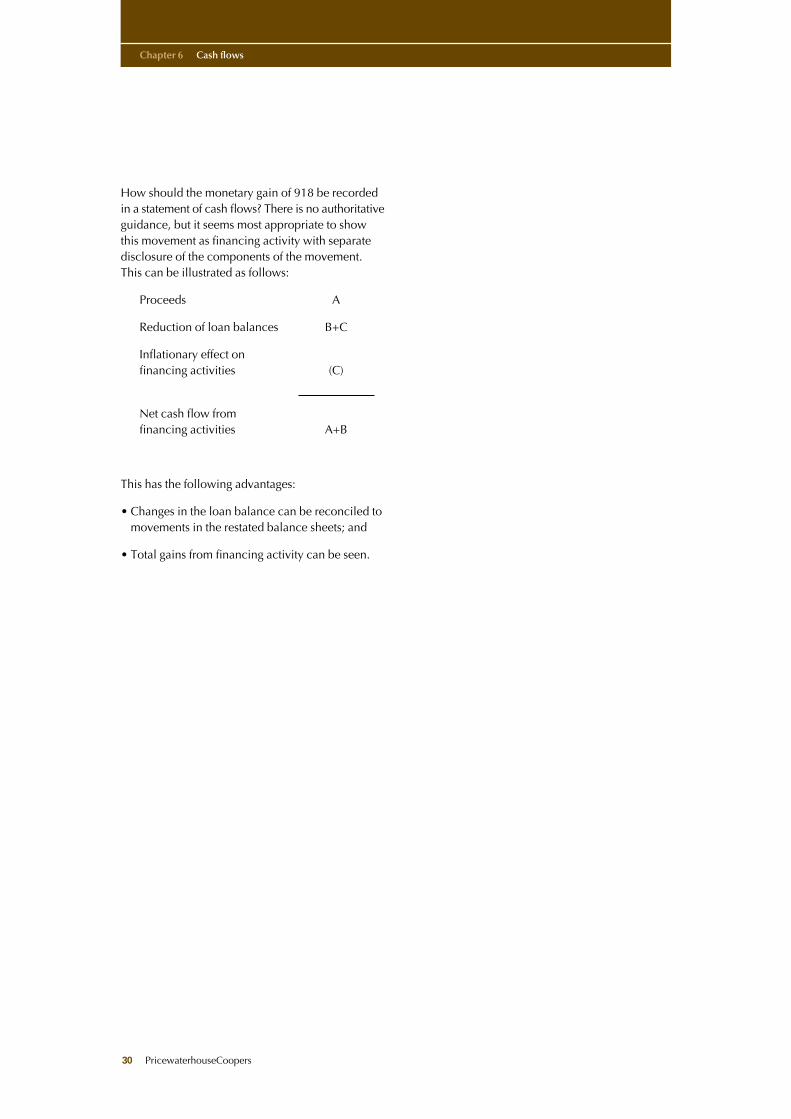
How should the monetary gain of 918 be recordedin a statement of cash flows? There is no authoritativeguidance, but it seems most appropriate to showthis movement as financing activity with separatedisclosure of the components of the movement.This can be illustrated as follows:
Proceeds A
Reduction of loan balances B+C
Inflationary effect on financing activities (C)
Net cash flow from financing activities A+B
This has the following advantages:
• Changes in the loan balance can be reconciled tomovements in the restated balance sheets; and
• Total gains from financing activity can be seen.
Chapter 6 Cash flows
30 PricewaterhouseCoopers
PricewaterhouseCoopers 31
This section of the guide provides a detailedpractical example of the application of IAS 29. The term ‘restated’ is used to describe financialstatements after the application of IAS 29. Theterm ‘historic’ is used to describe financialstatements before restatement to currentpurchasing power. This example is prepared forillustrative purposes only, income statement,statement of changes in shareholders’ equity andstatement of cash flows are presented for one year.
Under IAS 1 comparative figures of thesestatements are required to be disclosed by thereporting enterprise.
This example does not cover all possiblecircumstances, nor does it take account of anyspecific legal framework. Depending on thecircumstances, further specific information may berequired in order to ensure fair presentation underInternational Accounting Standards.
Practical example of IAS 29
Chapter 7
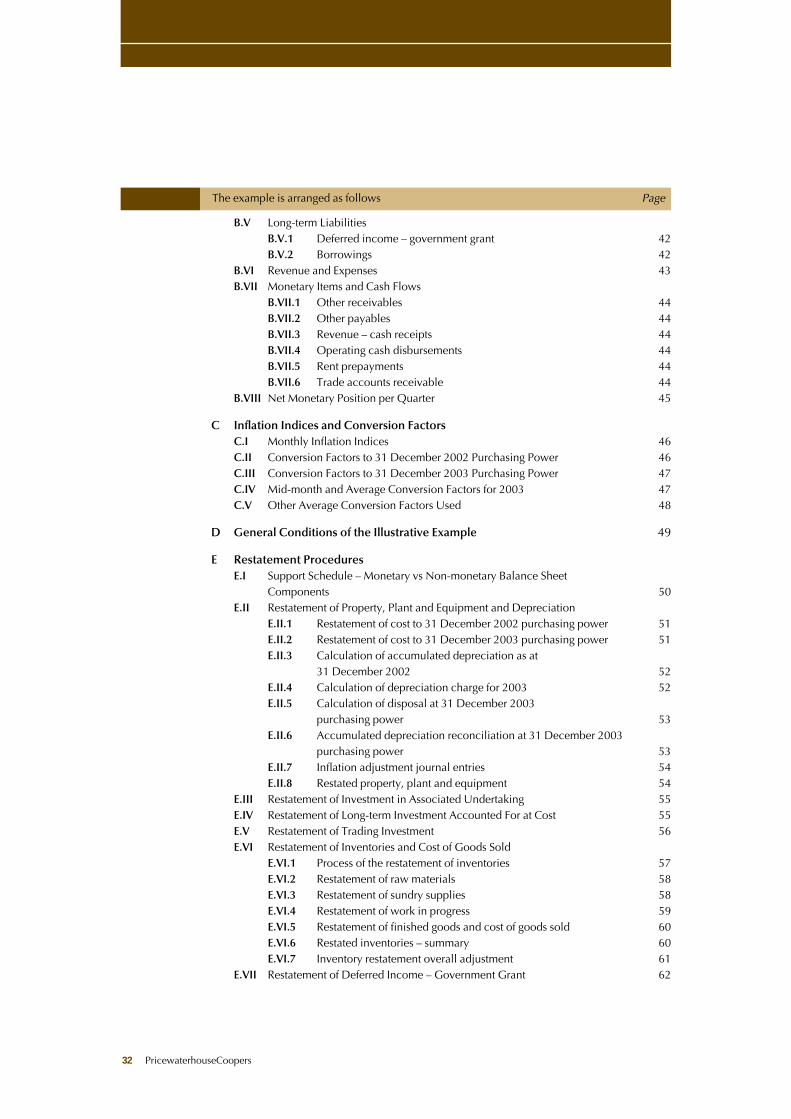
A Historical Financial Statements (without notes)A.I Historical Balance Sheets as at 31 December 2003 and 2002 34A.II Historical Income Statement for the year ended 31 December 2003 35A.III Historical Statement of Cash Flows for the year ended 31 December 2003 36–37A.IV Historical Statement of Changes in Equity for the year ended
31 December 2003 38
B Additional Historical Information Required for IAS 29 RestatementB.I Property, Plant and Equipment 39B.II Investments
B.II.1 Investment in associated undertaking 40B.II.2 Other long-term investments 40B.II.3 Trading investments 40
B.III Inventories and Production Expenditures IncurredB.III.1 Inventory movements for the year 41B.III.2 Analysis of production costs incurred within the period 41B.III.3 Holding period of inventory 41
B.IV EquityB.IV.1 Share capital 42B.IV.2 Dividends 42
The example is arranged as follows Page
B.V Long-term LiabilitiesB.V.1 Deferred income – government grant 42B.V.2 Borrowings 42
B.VI Revenue and Expenses 43B.VII Monetary Items and Cash Flows
B.VII.1 Other receivables 44B.VII.2 Other payables 44B.VII.3 Revenue – cash receipts 44B.VII.4 Operating cash disbursements 44B.VII.5 Rent prepayments 44B.VII.6 Trade accounts receivable 44
B.VIII Net Monetary Position per Quarter 45
C Inflation Indices and Conversion FactorsC.I Monthly Inflation Indices 46C.II Conversion Factors to 31 December 2002 Purchasing Power 46C.III Conversion Factors to 31 December 2003 Purchasing Power 47C.IV Mid-month and Average Conversion Factors for 2003 47C.V Other Average Conversion Factors Used 48
D General Conditions of the Illustrative Example 49
E Restatement ProceduresE.I Support Schedule – Monetary vs Non-monetary Balance Sheet
Components 50E.II Restatement of Property, Plant and Equipment and Depreciation
E.II.1 Restatement of cost to 31 December 2002 purchasing power 51E.II.2 Restatement of cost to 31 December 2003 purchasing power 51E.II.3 Calculation of accumulated depreciation as at
31 December 2002 52E.II.4 Calculation of depreciation charge for 2003 52E.II.5 Calculation of disposal at 31 December 2003
purchasing power 53E.II.6 Accumulated depreciation reconciliation at 31 December 2003
purchasing power 53E.II.7 Inflation adjustment journal entries 54E.II.8 Restated property, plant and equipment 54
E.III Restatement of Investment in Associated Undertaking 55E.IV Restatement of Long-term Investment Accounted For at Cost 55E.V Restatement of Trading Investment 56E.VI Restatement of Inventories and Cost of Goods Sold
E.VI.1 Process of the restatement of inventories 57E.VI.2 Restatement of raw materials 58E.VI.3 Restatement of sundry supplies 58E.VI.4 Restatement of work in progress 59E.VI.5 Restatement of finished goods and cost of goods sold 60E.VI.6 Restated inventories – summary 60E.VI.7 Inventory restatement overall adjustment 61
E.VII Restatement of Deferred Income – Government Grant 62
32 PricewaterhouseCoopers
The example is arranged as follows Page
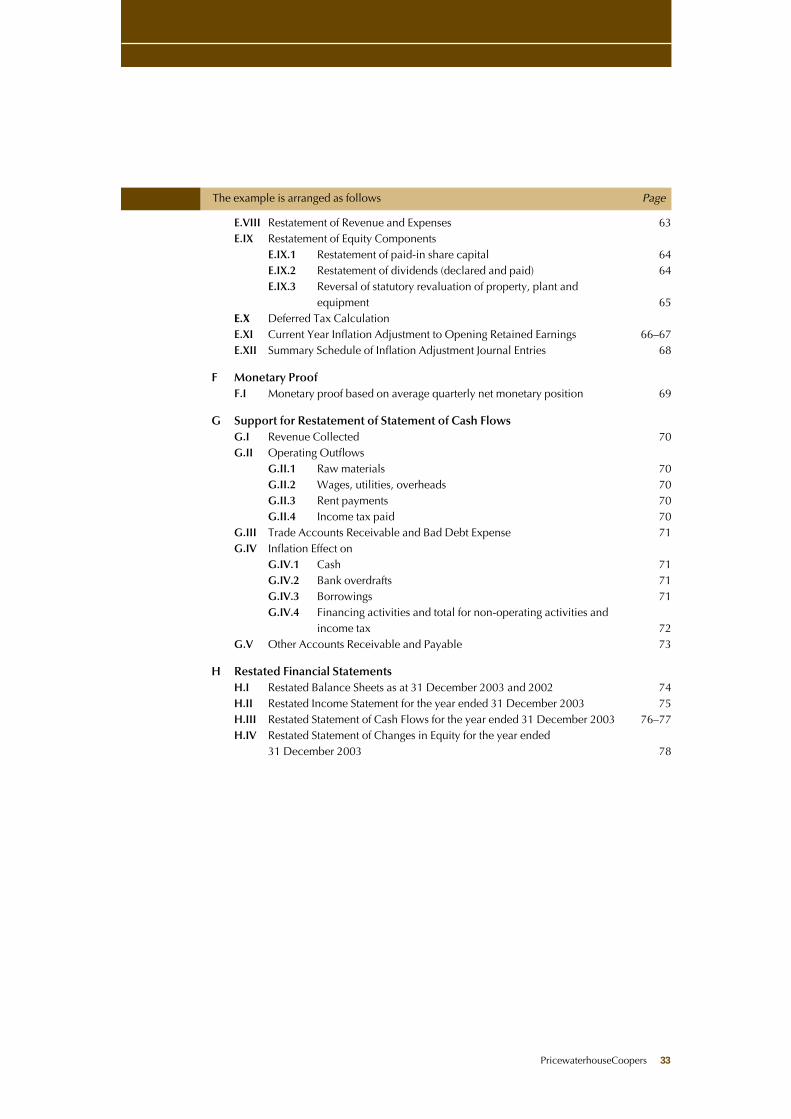
E.VIII Restatement of Revenue and Expenses 63E.IX Restatement of Equity Components
E.IX.1 Restatement of paid-in share capital 64E.IX.2 Restatement of dividends (declared and paid) 64E.IX.3 Reversal of statutory revaluation of property, plant and
equipment 65E.X Deferred Tax CalculationE.XI Current Year Inflation Adjustment to Opening Retained Earnings 66–67E.XII Summary Schedule of Inflation Adjustment Journal Entries 68
F Monetary ProofF.I Monetary proof based on average quarterly net monetary position 69
G Support for Restatement of Statement of Cash FlowsG.I Revenue Collected 70G.II Operating Outflows
G.II.1 Raw materials 70G.II.2 Wages, utilities, overheads 70G.II.3 Rent payments 70G.II.4 Income tax paid 70
G.III Trade Accounts Receivable and Bad Debt Expense 71G.IV Inflation Effect on
G.IV.1 Cash 71G.IV.2 Bank overdrafts 71G.IV.3 Borrowings 71G.IV.4 Financing activities and total for non-operating activities and
income tax 72G.V Other Accounts Receivable and Payable 73
H Restated Financial StatementsH.I Restated Balance Sheets as at 31 December 2003 and 2002 74H.II Restated Income Statement for the year ended 31 December 2003 75H.III Restated Statement of Cash Flows for the year ended 31 December 2003 76–77H.IV Restated Statement of Changes in Equity for the year ended
31 December 2003 78
PricewaterhouseCoopers 33
The example is arranged as follows Page
x
34 PricewaterhouseCoopers
HCU – Historical Currency Units CCU – Current Currency Units
Chapter 7 – Practical example of IAS 29 A. Historical Financial Statements
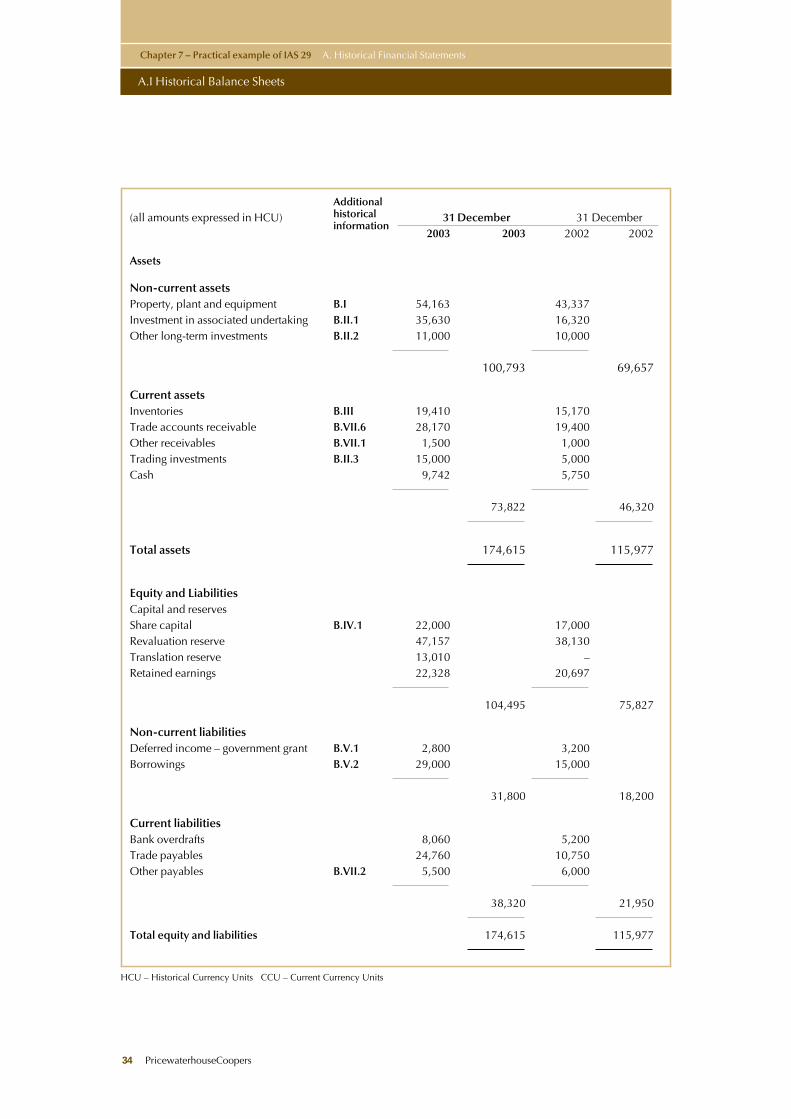
A.I Historical Balance Sheets
Additional
(all amounts expressed in HCU) historical 31 December 31 Decemberinformation
2003 2003 2002 2002
Assets
Non-current assetsProperty, plant and equipment B.I 54,163 43,337 Investment in associated undertaking B.II.1 35,630 16,320Other long-term investments B.II.2 11,000 10,000
100,793 69,657
Current assetsInventories B.III 19,410 15,170Trade accounts receivable B.VII.6 28,170 19,400Other receivables B.VII.1 1,500 1,000Trading investments B.II.3 15,000 5,000Cash 9,742 5,750
73,822 46,320
Total assets 174,615 115,977
Equity and LiabilitiesCapital and reservesShare capital B.IV.1 22,000 17,000Revaluation reserve 47,157 38,130Translation reserve 13,010 –Retained earnings 22,328 20,697
104,495 75,827
Non-current liabilitiesDeferred income – government grant B.V.1 2,800 3,200Borrowings B.V.2 29,000 15,000
31,800 18,200
Current liabilitiesBank overdrafts 8,060 5,200Trade payables 24,760 10,750Other payables B.VII.2 5,500 6,000
38,320 21,950
Total equity and liabilities 174,615 115,977
PricewaterhouseCoopers 35
HCU – Historical Currency Units CCU – Current Currency Units
Chapter 7 – Illustrative example of IAS 29 A. Historical Financial Statements
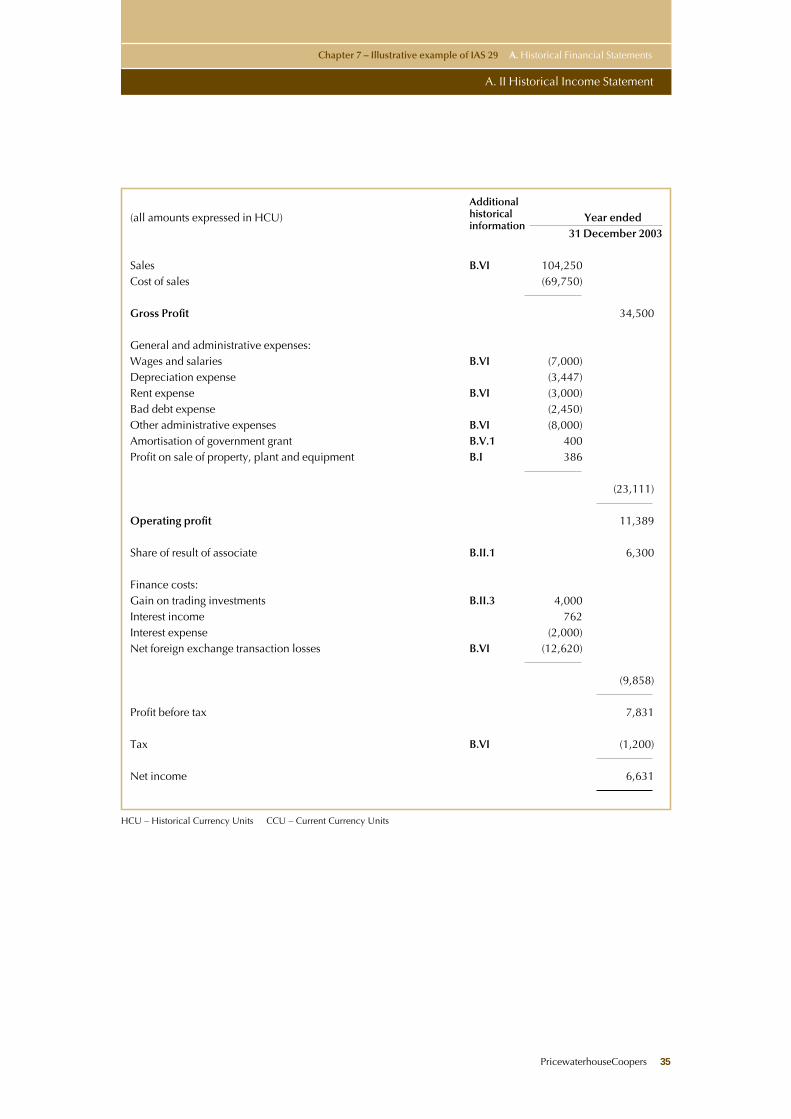
A. II Historical Income Statement
Additional
(all amounts expressed in HCU) historical Year endedinformation
31 December 2003
Sales B.VI 104,250Cost of sales (69,750)
Gross Profit 34,500
General and administrative expenses:Wages and salaries B.VI (7,000)Depreciation expense (3,447)Rent expense B.VI (3,000)Bad debt expense (2,450)Other administrative expenses B.VI (8,000)Amortisation of government grant B.V.1 400Profit on sale of property, plant and equipment B.I 386
(23,111)
Operating profit 11,389
Share of result of associate B.II.1 6,300
Finance costs:Gain on trading investments B.II.3 4,000Interest income 762Interest expense (2,000)Net foreign exchange transaction losses B.VI (12,620)
(9,858)
Profit before tax 7,831
Tax B.VI (1,200)
Net income 6,631
HCU – Historical Currency Units CCU – Current Currency Units
Chapter 7 – Illustrative example of IAS 29 A. Historical Financial Statements
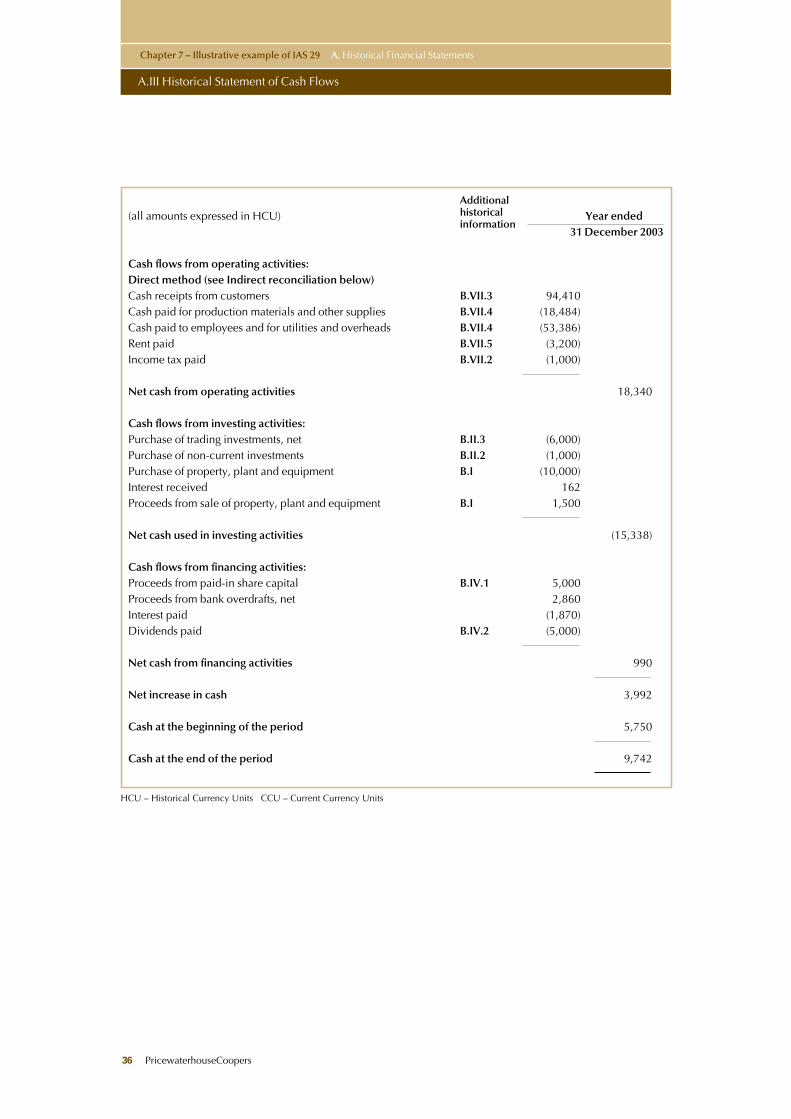
A.III Historical Statement of Cash Flows
36 PricewaterhouseCoopers
Additional
(all amounts expressed in HCU) historical Year endedinformation
31 December 2003
Cash flows from operating activities:Direct method (see Indirect reconciliation below)Cash receipts from customers B.VII.3 94,410Cash paid for production materials and other supplies B.VII.4 (18,484)Cash paid to employees and for utilities and overheads B.VII.4 (53,386)Rent paid B.VII.5 (3,200)Income tax paid B.VII.2 (1,000)
Net cash from operating activities 18,340
Cash flows from investing activities:Purchase of trading investments, net B.II.3 (6,000)Purchase of non-current investments B.II.2 (1,000)Purchase of property, plant and equipment B.I (10,000)Interest received 162Proceeds from sale of property, plant and equipment B.I 1,500
Net cash used in investing activities (15,338)
Cash flows from financing activities:Proceeds from paid-in share capital B.IV.1 5,000Proceeds from bank overdrafts, net 2,860Interest paid (1,870)Dividends paid B.IV.2 (5,000)
Net cash from financing activities 990
Net increase in cash 3,992
Cash at the beginning of the period 5,750
Cash at the end of the period 9,742
Chapter 7 – Illustrative example of IAS 29 A. Historical Financial Statements
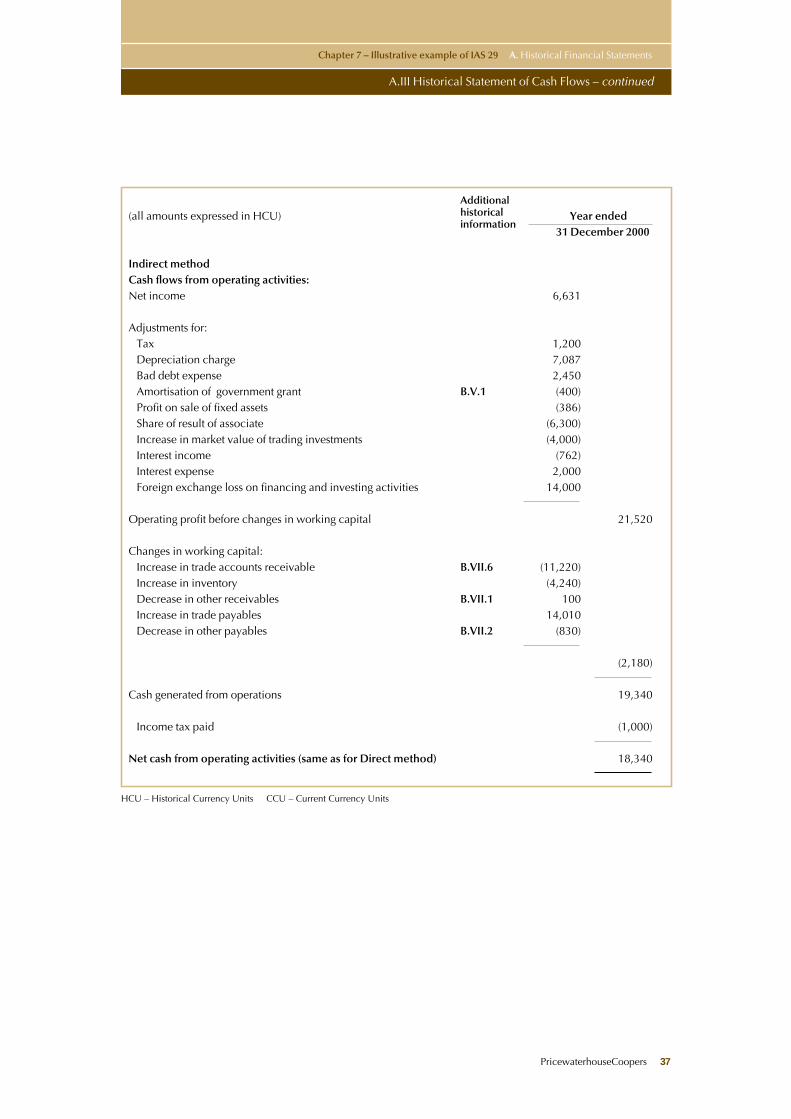
A.III Historical Statement of Cash Flows – continued
Additional
(all amounts expressed in HCU) historical Year endedinformation
31 December 2000
Indirect methodCash flows from operating activities:Net income 6,631
Adjustments for:Tax 1,200Depreciation charge 7,087Bad debt expense 2,450Amortisation of government grant B.V.1 (400)Profit on sale of fixed assets (386)Share of result of associate (6,300)Increase in market value of trading investments (4,000)Interest income (762)Interest expense 2,000Foreign exchange loss on financing and investing activities 14,000
Operating profit before changes in working capital 21,520
Changes in working capital:Increase in trade accounts receivable B.VII.6 (11,220)Increase in inventory (4,240)Decrease in other receivables B.VII.1 100Increase in trade payables 14,010Decrease in other payables B.VII.2 (830)
(2,180)
Cash generated from operations 19,340
Income tax paid (1,000)
Net cash from operating activities (same as for Direct method) 18,340
HCU – Historical Currency Units CCU – Current Currency Units
PricewaterhouseCoopers 37
HCU – Historical Currency Units CCU – Current Currency Units
Chapter 7 – Illustrative example of IAS 29 A. Historical Financial Statements
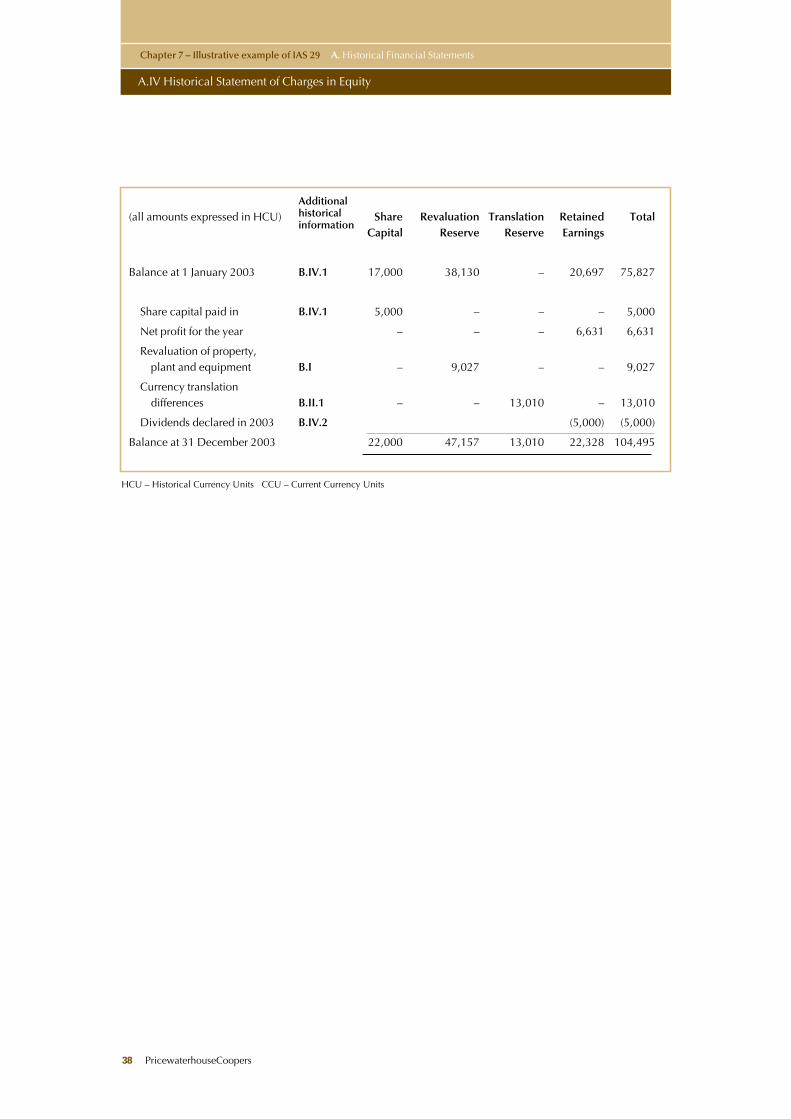
A.IV Historical Statement of Charges in Equity
38 PricewaterhouseCoopers
Additional
(all amounts expressed in HCU) historical Share Revaluation Translation Retained Totalinformation
Capital Reserve Reserve Earnings
Balance at 1 January 2003 B.IV.1 17,000 38,130 – 20,697 75,827
Share capital paid in B.IV.1 5,000 – – – 5,000
Net profit for the year – – – 6,631 6,631
Revaluation of property, plant and equipment B.I – 9,027 – – 9,027
Currency translation differences B.II.1 – – 13,010 – 13,010
Dividends declared in 2003 B.IV.2 (5,000) (5,000)
Balance at 31 December 2003 22,000 47,157 13,010 22,328 104,495
PricewaterhouseCoopers 39
HCU – Historical Currency Units CCU – Current Currency Units
Chapter 7 – Illustrative example of IAS 29 B. Additional Historical Information Required for IAS 29 Restatement
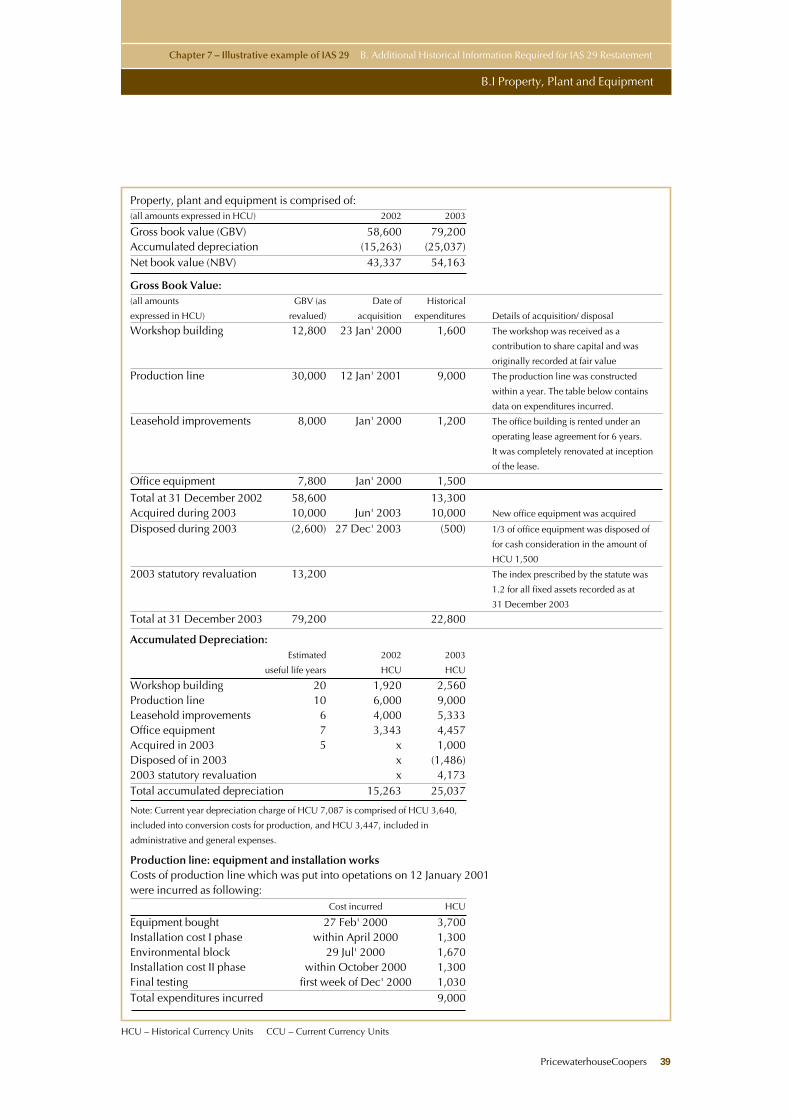
B.I Property, Plant and Equipment
Property, plant and equipment is comprised of:(all amounts expressed in HCU) 2002 2003
Gross book value (GBV) 58,600 79,200Accumulated depreciation (15,263) (25,037)Net book value (NBV) 43,337 54,163
Gross Book Value:(all amounts GBV (as Date of Historical
expressed in HCU) revalued) acquisition expenditures Details of acquisition/ disposal
Workshop building 12,800 23 Jan' 2000 1,600 The workshop was received as a
contribution to share capital and was
originally recorded at fair value
Production line 30,000 12 Jan' 2001 9,000 The production line was constructed
within a year. The table below contains
data on expenditures incurred.
Leasehold improvements 8,000 Jan' 2000 1,200 The office building is rented under an
operating lease agreement for 6 years.
It was completely renovated at inception
of the lease.
Office equipment 7,800 Jan' 2000 1,500
Total at 31 December 2002 58,600 13,300Acquired during 2003 10,000 Jun' 2003 10,000 New office equipment was acquired
Disposed during 2003 (2,600) 27 Dec' 2003 (500) 1/3 of office equipment was disposed of
for cash consideration in the amount of
HCU 1,500
2003 statutory revaluation 13,200 The index prescribed by the statute was
1.2 for all fixed assets recorded as at
31 December 2003
Total at 31 December 2003 79,200 22,800
Accumulated Depreciation:Estimated 2002 2003
useful life years HCU HCU
Workshop building 20 1,920 2,560Production line 10 6,000 9,000Leasehold improvements 6 4,000 5,333Office equipment 7 3,343 4,457Acquired in 2003 5 x 1,000Disposed of in 2003 x (1,486)2003 statutory revaluation x 4,173Total accumulated depreciation 15,263 25,037
Note: Current year depreciation charge of HCU 7,087 is comprised of HCU 3,640,
included into conversion costs for production, and HCU 3,447, included in
administrative and general expenses.
Production line: equipment and installation worksCosts of production line which was put into opetations on 12 January 2001 were incurred as following:
Cost incurred HCU
Equipment bought 27 Feb' 2000 3,700Installation cost I phase within April 2000 1,300Environmental block 29 Jul' 2000 1,670Installation cost II phase within October 2000 1,300Final testing first week of Dec' 2000 1,030Total expenditures incurred 9,000
HCU – Historical Currency Units CCU – Current Currency Units
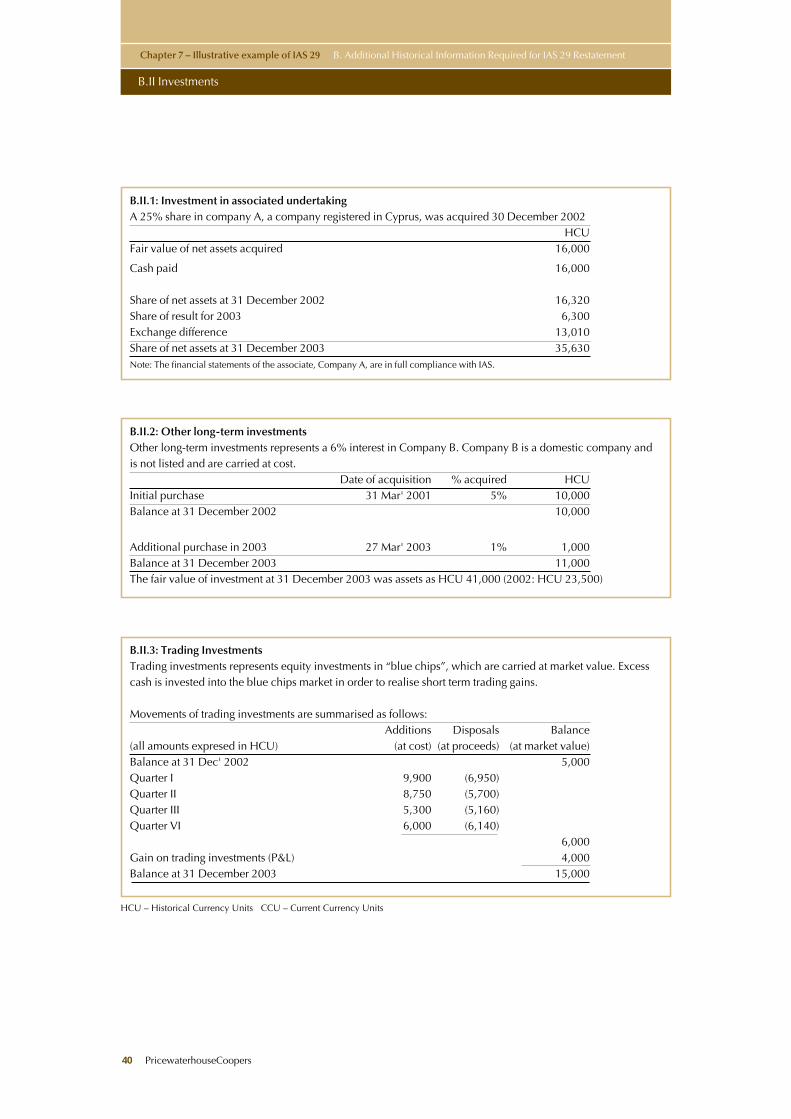
B.II.1: Investment in associated undertakingA 25% share in company A, a company registered in Cyprus, was acquired 30 December 2002
HCUFair value of net assets acquired 16,000
Cash paid 16,000
Share of net assets at 31 December 2002 16,320Share of result for 2003 6,300Exchange difference 13,010Share of net assets at 31 December 2003 35,630Note: The financial statements of the associate, Company A, are in full compliance with IAS.
B.II.2: Other long-term investmentsOther long-term investments represents a 6% interest in Company B. Company B is a domestic company andis not listed and are carried at cost.
Date of acquisition % acquired HCUInitial purchase 31 Mar' 2001 5% 10,000Balance at 31 December 2002 10,000
Additional purchase in 2003 27 Mar' 2003 1% 1,000Balance at 31 December 2003 11,000The fair value of investment at 31 December 2003 was assets as HCU 41,000 (2002: HCU 23,500)
B.II.3: Trading InvestmentsTrading investments represents equity investments in “blue chips”, which are carried at market value. Excesscash is invested into the blue chips market in order to realise short term trading gains.
Movements of trading investments are summarised as follows:Additions Disposals Balance
(all amounts expresed in HCU) (at cost) (at proceeds) (at market value)Balance at 31 Dec' 2002 5,000Quarter I 9,900 (6,950)Quarter II 8,750 (5,700)Quarter III 5,300 (5,160)Quarter VI 6,000 (6,140)
6,000Gain on trading investments (P&L) 4,000Balance at 31 December 2003 15,000
Chapter 7 – Illustrative example of IAS 29 B. Additional Historical Information Required for IAS 29 Restatement
B.II Investments
40 PricewaterhouseCoopers
PricewaterhouseCoopers 41
HCU – Historical Currency Units CCU – Current Currency Units
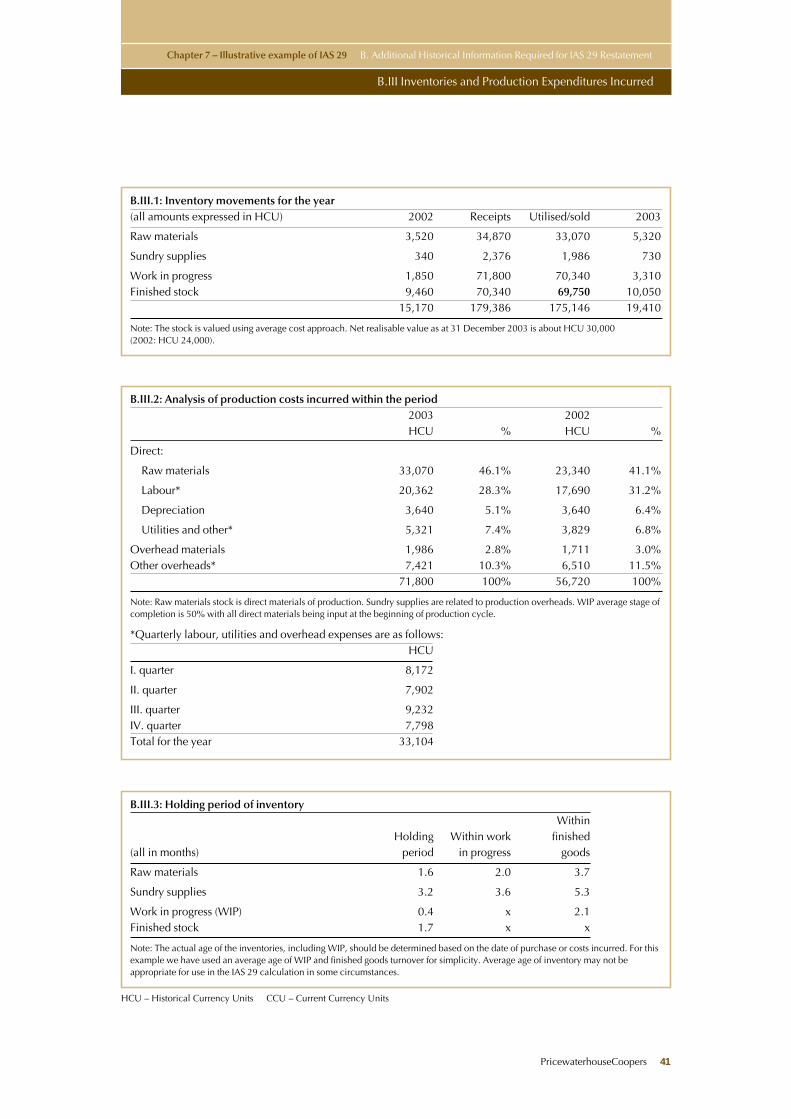
B.III.1: Inventory movements for the year(all amounts expressed in HCU) 2002 Receipts Utilised/sold 2003
Raw materials 3,520 34,870 33,070 5,320
Sundry supplies 340 2,376 1,986 730
Work in progress 1,850 71,800 70,340 3,310Finished stock 9,460 70,340 69,750 10,050
15,170 179,386 175,146 19,410
Note: The stock is valued using average cost approach. Net realisable value as at 31 December 2003 is about HCU 30,000(2002: HCU 24,000).
B.III.3: Holding period of inventoryWithin
Holding Within work finished (all in months) period in progress goods
Raw materials 1.6 2.0 3.7
Sundry supplies 3.2 3.6 5.3
Work in progress (WIP) 0.4 x 2.1Finished stock 1.7 x x
Note: The actual age of the inventories, including WIP, should be determined based on the date of purchase or costs incurred. For thisexample we have used an average age of WIP and finished goods turnover for simplicity. Average age of inventory may not beappropriate for use in the IAS 29 calculation in some circumstances.
B.III.2: Analysis of production costs incurred within the period2003 2002HCU % HCU %
Direct:
Raw materials 33,070 46.1% 23,340 41.1%
Labour* 20,362 28.3% 17,690 31.2%
Depreciation 3,640 5.1% 3,640 6.4%
Utilities and other* 5,321 7.4% 3,829 6.8%
Overhead materials 1,986 2.8% 1,711 3.0%Other overheads* 7,421 10.3% 6,510 11.5%
71,800 100% 56,720 100%
Note: Raw materials stock is direct materials of production. Sundry supplies are related to production overheads. WIP average stage ofcompletion is 50% with all direct materials being input at the beginning of production cycle.
*Quarterly labour, utilities and overhead expenses are as follows:HCU
I. quarter 8,172
II. quarter 7,902
III. quarter 9,232IV. quarter 7,798Total for the year 33,104
Chapter 7 – Illustrative example of IAS 29 B. Additional Historical Information Required for IAS 29 Restatement
B.III Inventories and Production Expenditures Incurred
HCU – Historical Currency Units CCU – Current Currency Units
Chapter 7 – Illustrative example of IAS 29 B. Additional Historical Information Required for IAS 29 Restatement
B.IV: Equity
BV: Long-Term Liabilities
42 PricewaterhouseCoopers
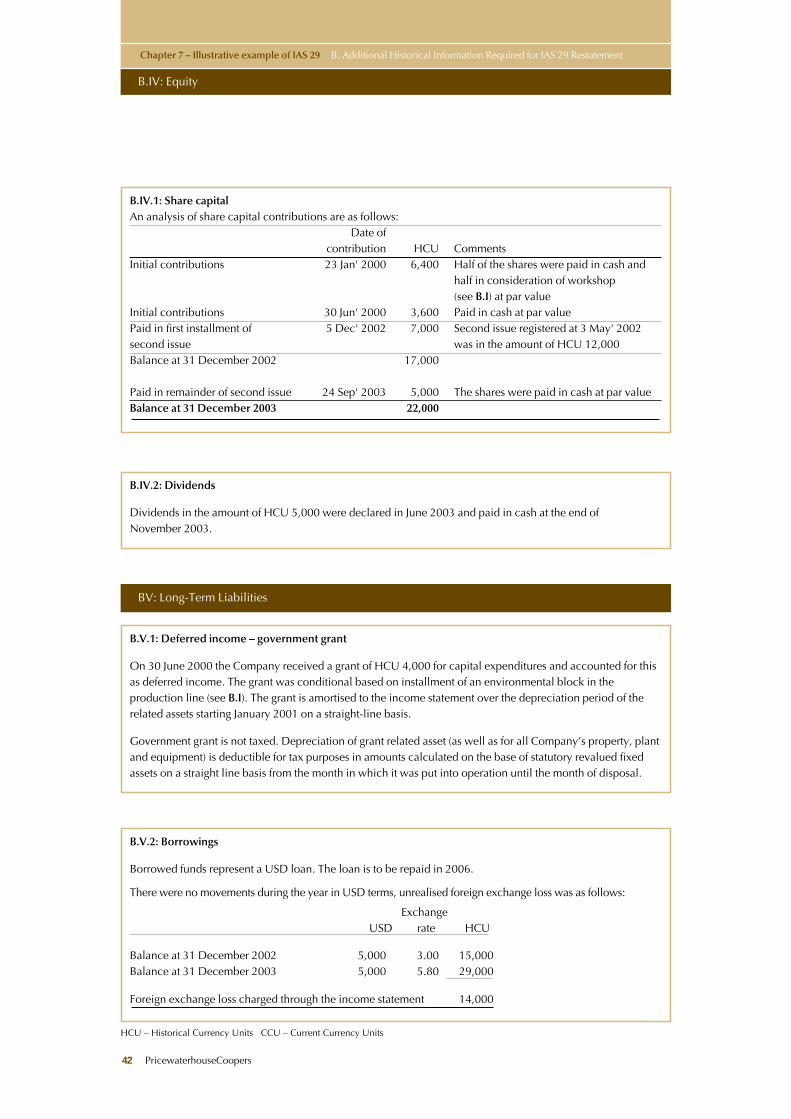
B.IV.1: Share capitalAn analysis of share capital contributions are as follows:
Date ofcontribution HCU Comments
Initial contributions 23 Jan' 2000 6,400 Half of the shares were paid in cash and half in consideration of workshop (see B.I) at par value
Initial contributions 30 Jun' 2000 3,600 Paid in cash at par valuePaid in first installment of 5 Dec' 2002 7,000 Second issue registered at 3 May' 2002 second issue was in the amount of HCU 12,000Balance at 31 December 2002 17,000
Paid in remainder of second issue 24 Sep' 2003 5,000 The shares were paid in cash at par valueBalance at 31 December 2003 22,000
B.IV.2: Dividends
Dividends in the amount of HCU 5,000 were declared in June 2003 and paid in cash at the end ofNovember 2003.
B.V.2: Borrowings
Borrowed funds represent a USD loan. The loan is to be repaid in 2006.
There were no movements during the year in USD terms, unrealised foreign exchange loss was as follows:
ExchangeUSD rate HCU
Balance at 31 December 2002 5,000 3.00 15,000Balance at 31 December 2003 5,000 5.80 29,000
Foreign exchange loss charged through the income statement 14,000
B.V.1: Deferred income – government grant
On 30 June 2000 the Company received a grant of HCU 4,000 for capital expenditures and accounted for thisas deferred income. The grant was conditional based on installment of an environmental block in theproduction line (see B.I). The grant is amortised to the income statement over the depreciation period of therelated assets starting January 2001 on a straight-line basis.
Government grant is not taxed. Depreciation of grant related asset (as well as for all Company’s property, plantand equipment) is deductible for tax purposes in amounts calculated on the base of statutory revalued fixedassets on a straight line basis from the month in which it was put into operation until the month of disposal.
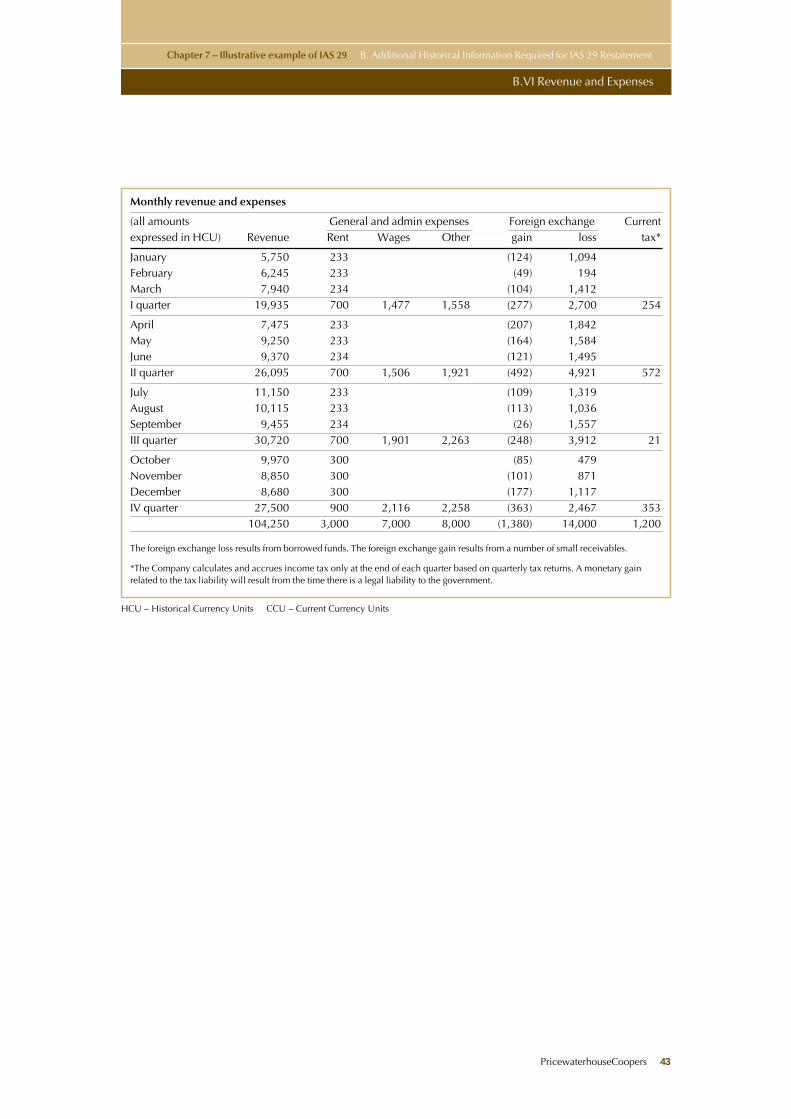
PricewaterhouseCoopers 43
HCU – Historical Currency Units CCU – Current Currency Units
Chapter 7 – Illustrative example of IAS 29 B. Additional Historical Information Required for IAS 29 Restatement
B.VI Revenue and Expenses
Monthly revenue and expenses
(all amounts General and admin expenses Foreign exchange Currentexpressed in HCU) Revenue Rent Wages Other gain loss tax*
January 5,750 233 (124) 1,094February 6,245 233 (49) 194March 7,940 234 (104) 1,412I quarter 19,935 700 1,477 1,558 (277) 2,700 254
April 7,475 233 (207) 1,842May 9,250 233 (164) 1,584June 9,370 234 (121) 1,495II quarter 26,095 700 1,506 1,921 (492) 4,921 572
July 11,150 233 (109) 1,319August 10,115 233 (113) 1,036September 9,455 234 (26) 1,557III quarter 30,720 700 1,901 2,263 (248) 3,912 21
October 9,970 300 (85) 479November 8,850 300 (101) 871December 8,680 300 (177) 1,117IV quarter 27,500 900 2,116 2,258 (363) 2,467 353
104,250 3,000 7,000 8,000 (1,380) 14,000 1,200
The foreign exchange loss results from borrowed funds. The foreign exchange gain results from a number of small receivables.
*The Company calculates and accrues income tax only at the end of each quarter based on quarterly tax returns. A monetary gainrelated to the tax liability will result from the time there is a legal liability to the government.
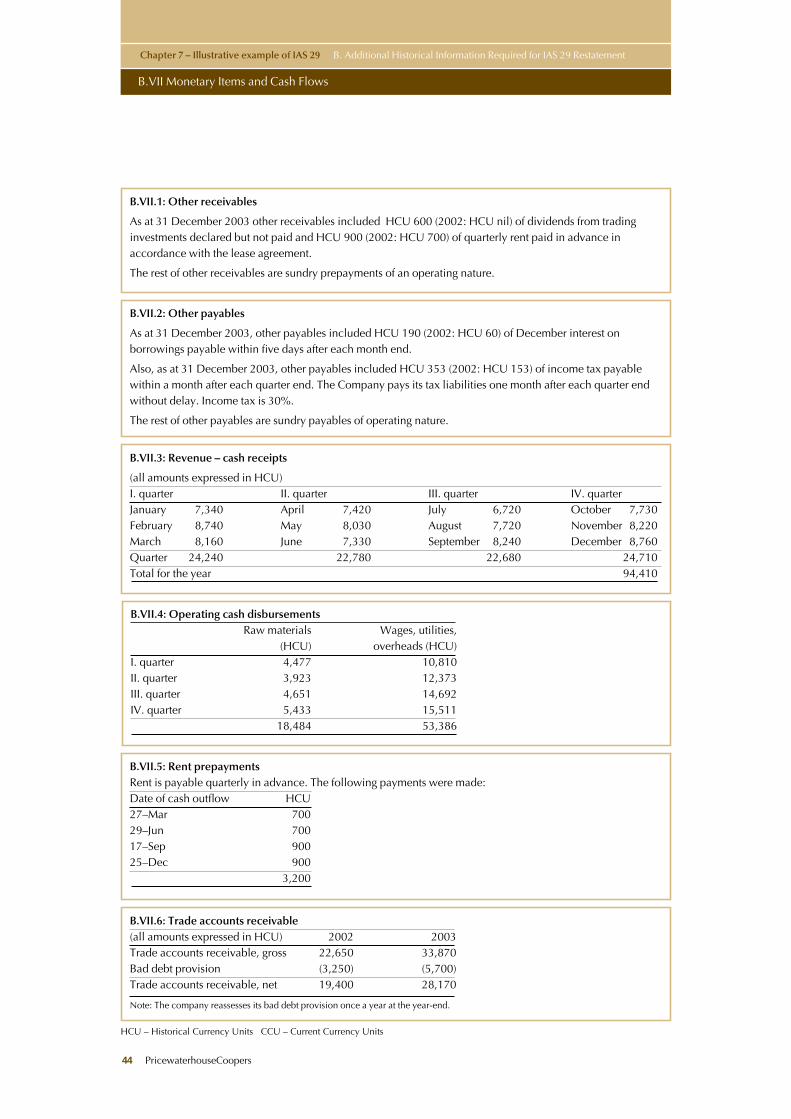
HCU – Historical Currency Units CCU – Current Currency Units
Chapter 7 – Illustrative example of IAS 29 B. Additional Historical Information Required for IAS 29 Restatement
B.VII Monetary Items and Cash Flows
44 PricewaterhouseCoopers
B.VII.1: Other receivables
As at 31 December 2003 other receivables included HCU 600 (2002: HCU nil) of dividends from tradinginvestments declared but not paid and HCU 900 (2002: HCU 700) of quarterly rent paid in advance inaccordance with the lease agreement.
The rest of other receivables are sundry prepayments of an operating nature.
B.VII.2: Other payables
As at 31 December 2003, other payables included HCU 190 (2002: HCU 60) of December interest onborrowings payable within five days after each month end.
Also, as at 31 December 2003, other payables included HCU 353 (2002: HCU 153) of income tax payablewithin a month after each quarter end. The Company pays its tax liabilities one month after each quarter endwithout delay. Income tax is 30%.
The rest of other payables are sundry payables of operating nature.
B.VII.3: Revenue – cash receipts
(all amounts expressed in HCU)I. quarter II. quarter III. quarter IV. quarterJanuary 7,340 April 7,420 July 6,720 October 7,730February 8,740 May 8,030 August 7,720 November 8,220March 8,160 June 7,330 September 8,240 December 8,760Quarter 24,240 22,780 22,680 24,710Total for the year 94,410
B.VII.4: Operating cash disbursementsRaw materials Wages, utilities,
(HCU) overheads (HCU)I. quarter 4,477 10,810II. quarter 3,923 12,373III. quarter 4,651 14,692IV. quarter 5,433 15,511
18,484 53,386
B.VII.5: Rent prepaymentsRent is payable quarterly in advance. The following payments were made:Date of cash outflow HCU27–Mar 70029–Jun 70017–Sep 90025–Dec 900
3,200
B.VII.6: Trade accounts receivable(all amounts expressed in HCU) 2002 2003Trade accounts receivable, gross 22,650 33,870Bad debt provision (3,250) (5,700)Trade accounts receivable, net 19,400 28,170
Note: The company reassesses its bad debt provision once a year at the year-end.
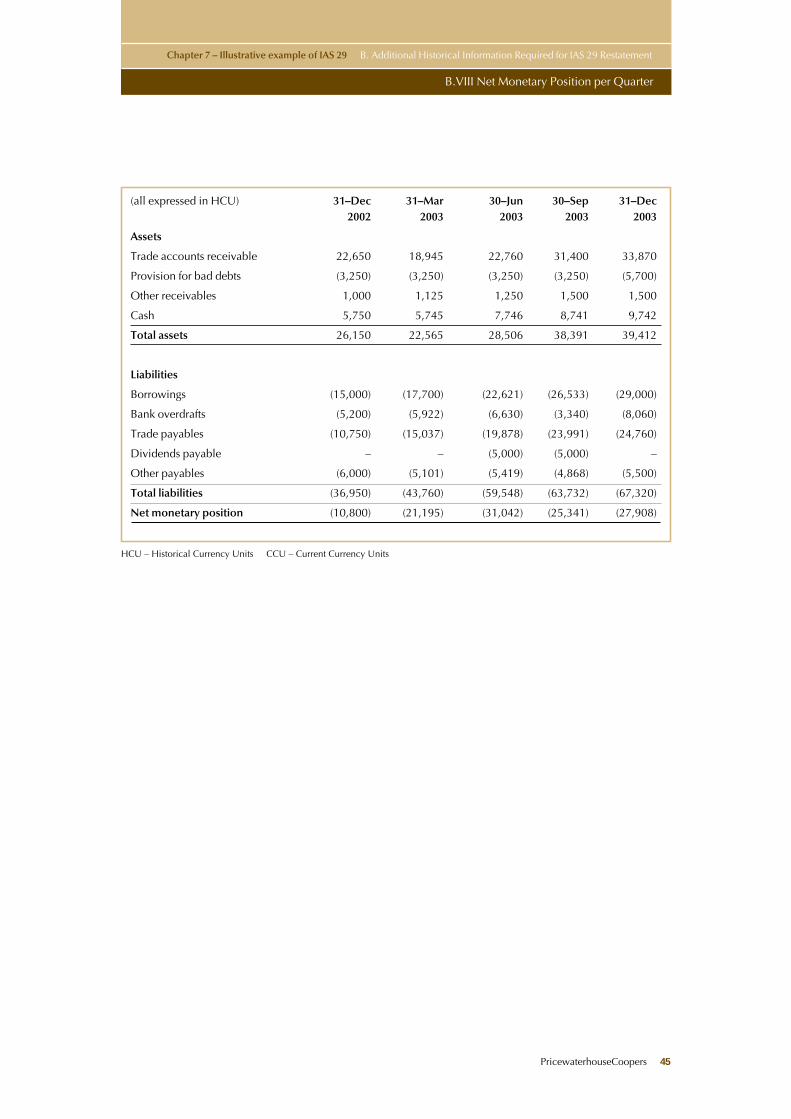
PricewaterhouseCoopers 45
HCU – Historical Currency Units CCU – Current Currency Units
Chapter 7 – Illustrative example of IAS 29 B. Additional Historical Information Required for IAS 29 Restatement
B.VIII Net Monetary Position per Quarter
(all expressed in HCU) 31–Dec 31–Mar 30–Jun 30–Sep 31–Dec2002 2003 2003 2003 2003
Assets
Trade accounts receivable 22,650 18,945 22,760 31,400 33,870
Provision for bad debts (3,250) (3,250) (3,250) (3,250) (5,700)
Other receivables 1,000 1,125 1,250 1,500 1,500
Cash 5,750 5,745 7,746 8,741 9,742
Total assets 26,150 22,565 28,506 38,391 39,412
Liabilities
Borrowings (15,000) (17,700) (22,621) (26,533) (29,000)
Bank overdrafts (5,200) (5,922) (6,630) (3,340) (8,060)
Trade payables (10,750) (15,037) (19,878) (23,991) (24,760)
Dividends payable – – (5,000) (5,000) –
Other payables (6,000) (5,101) (5,419) (4,868) (5,500)
Total liabilities (36,950) (43,760) (59,548) (63,732) (67,320)
Net monetary position (10,800) (21,195) (31,042) (25,341) (27,908)
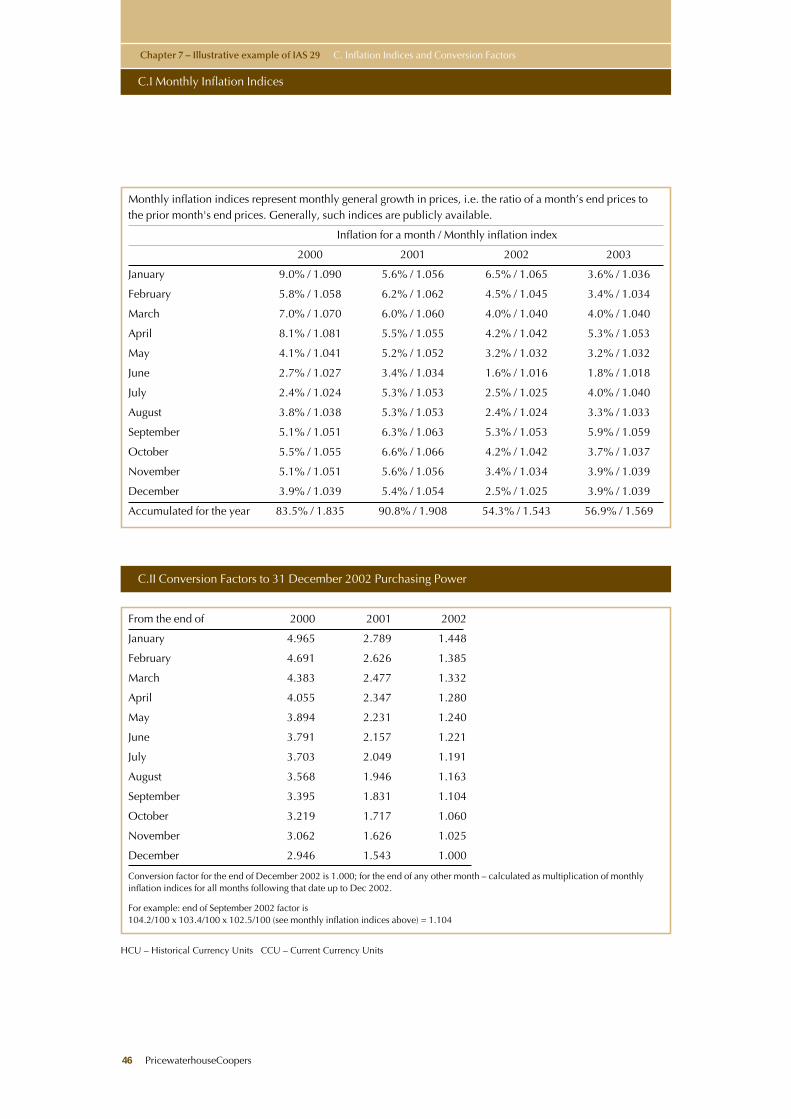
HCU – Historical Currency Units CCU – Current Currency Units
Chapter 7 – Illustrative example of IAS 29 C. Inflation Indices and Conversion Factors
C.I Monthly Inflation Indices
C.II Conversion Factors to 31 December 2002 Purchasing Power
46 PricewaterhouseCoopers
Monthly inflation indices represent monthly general growth in prices, i.e. the ratio of a month’s end prices tothe prior month's end prices. Generally, such indices are publicly available.
Inflation for a month / Monthly inflation index
2000 2001 2002 2003
January 9.0% / 1.090 5.6% / 1.056 6.5% / 1.065 3.6% / 1.036
February 5.8% / 1.058 6.2% / 1.062 4.5% / 1.045 3.4% / 1.034
March 7.0% / 1.070 6.0% / 1.060 4.0% / 1.040 4.0% / 1.040
April 8.1% / 1.081 5.5% / 1.055 4.2% / 1.042 5.3% / 1.053
May 4.1% / 1.041 5.2% / 1.052 3.2% / 1.032 3.2% / 1.032
June 2.7% / 1.027 3.4% / 1.034 1.6% / 1.016 1.8% / 1.018
July 2.4% / 1.024 5.3% / 1.053 2.5% / 1.025 4.0% / 1.040
August 3.8% / 1.038 5.3% / 1.053 2.4% / 1.024 3.3% / 1.033
September 5.1% / 1.051 6.3% / 1.063 5.3% / 1.053 5.9% / 1.059
October 5.5% / 1.055 6.6% / 1.066 4.2% / 1.042 3.7% / 1.037
November 5.1% / 1.051 5.6% / 1.056 3.4% / 1.034 3.9% / 1.039
December 3.9% / 1.039 5.4% / 1.054 2.5% / 1.025 3.9% / 1.039
Accumulated for the year 83.5% / 1.835 90.8% / 1.908 54.3% / 1.543 56.9% / 1.569
From the end of 2000 2001 2002
January 4.965 2.789 1.448
February 4.691 2.626 1.385
March 4.383 2.477 1.332
April 4.055 2.347 1.280
May 3.894 2.231 1.240
June 3.791 2.157 1.221
July 3.703 2.049 1.191
August 3.568 1.946 1.163
September 3.395 1.831 1.104
October 3.219 1.717 1.060
November 3.062 1.626 1.025
December 2.946 1.543 1.000
Conversion factor for the end of December 2002 is 1.000; for the end of any other month – calculated as multiplication of monthlyinflation indices for all months following that date up to Dec 2002.
For example: end of September 2002 factor is104.2/100 x 103.4/100 x 102.5/100 (see monthly inflation indices above) = 1.104
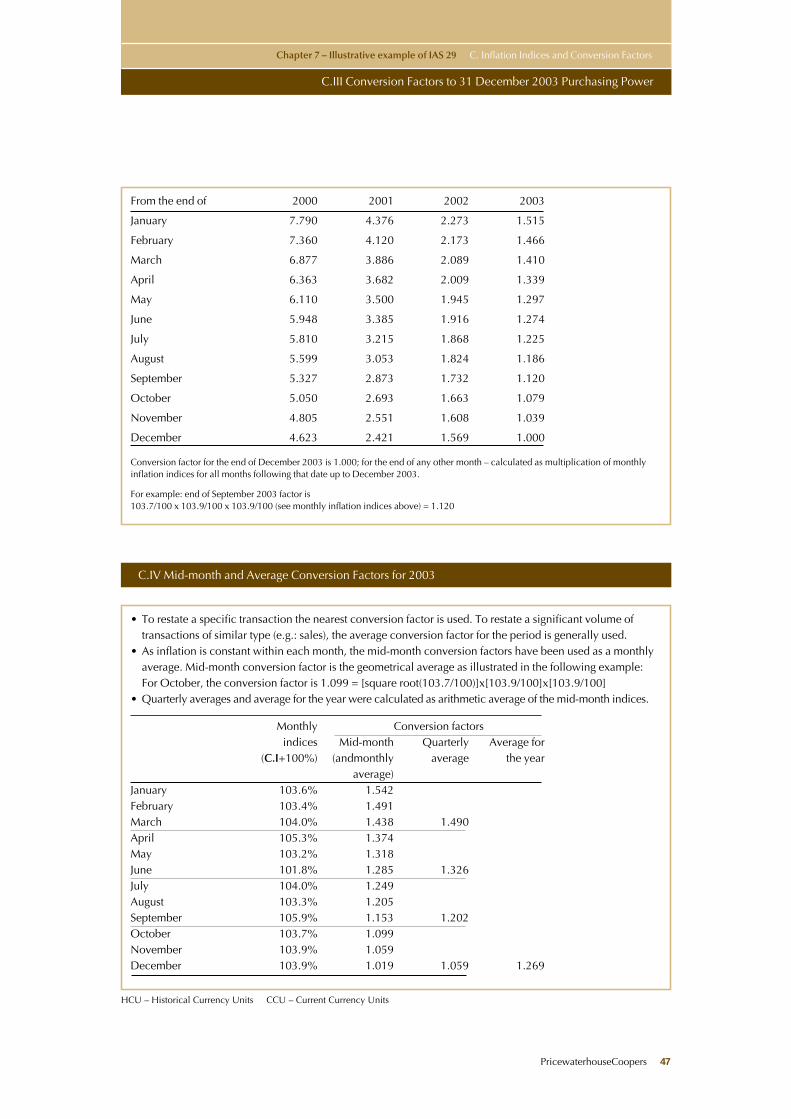
PricewaterhouseCoopers 47
HCU – Historical Currency Units CCU – Current Currency Units
Chapter 7 – Illustrative example of IAS 29 C. Inflation Indices and Conversion Factors
C.III Conversion Factors to 31 December 2003 Purchasing Power
C.IV Mid-month and Average Conversion Factors for 2003
• To restate a specific transaction the nearest conversion factor is used. To restate a significant volume oftransactions of similar type (e.g.: sales), the average conversion factor for the period is generally used.
• As inflation is constant within each month, the mid-month conversion factors have been used as a monthlyaverage. Mid-month conversion factor is the geometrical average as illustrated in the following example:For October, the conversion factor is 1.099 = [square root(103.7/100)]x[103.9/100]x[103.9/100]
• Quarterly averages and average for the year were calculated as arithmetic average of the mid-month indices.
Monthly Conversion factorsindices Mid-month Quarterly Average for
(C.I+100%) (andmonthly average the yearaverage)
January 103.6% 1.542February 103.4% 1.491March 104.0% 1.438 1.490April 105.3% 1.374May 103.2% 1.318June 101.8% 1.285 1.326July 104.0% 1.249August 103.3% 1.205September 105.9% 1.153 1.202October 103.7% 1.099November 103.9% 1.059December 103.9% 1.019 1.059 1.269
From the end of 2000 2001 2002 2003
January 7.790 4.376 2.273 1.515
February 7.360 4.120 2.173 1.466
March 6.877 3.886 2.089 1.410
April 6.363 3.682 2.009 1.339
May 6.110 3.500 1.945 1.297
June 5.948 3.385 1.916 1.274
July 5.810 3.215 1.868 1.225
August 5.599 3.053 1.824 1.186
September 5.327 2.873 1.732 1.120
October 5.050 2.693 1.663 1.079
November 4.805 2.551 1.608 1.039
December 4.623 2.421 1.569 1.000
Conversion factor for the end of December 2003 is 1.000; for the end of any other month – calculated as multiplication of monthlyinflation indices for all months following that date up to December 2003.
For example: end of September 2003 factor is 103.7/100 x 103.9/100 x 103.9/100 (see monthly inflation indices above) = 1.120
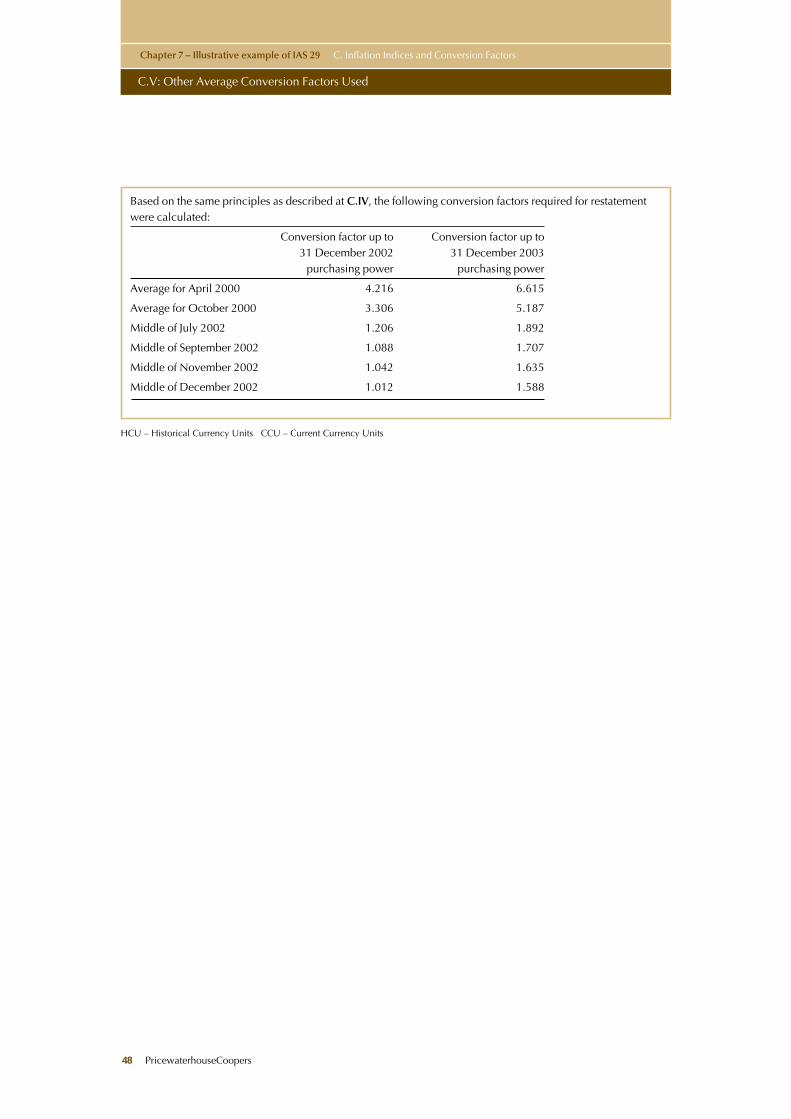
HCU – Historical Currency Units CCU – Current Currency Units
Chapter 7 – Illustrative example of IAS 29 C. Inflation Indices and Conversion Factors
C.V: Other Average Conversion Factors Used
48 PricewaterhouseCoopers
Based on the same principles as described at C.IV, the following conversion factors required for restatementwere calculated:
Conversion factor up to Conversion factor up to31 December 2002 31 December 2003
purchasing power purchasing power
Average for April 2000 4.216 6.615
Average for October 2000 3.306 5.187
Middle of July 2002 1.206 1.892
Middle of September 2002 1.088 1.707
Middle of November 2002 1.042 1.635
Middle of December 2002 1.012 1.588
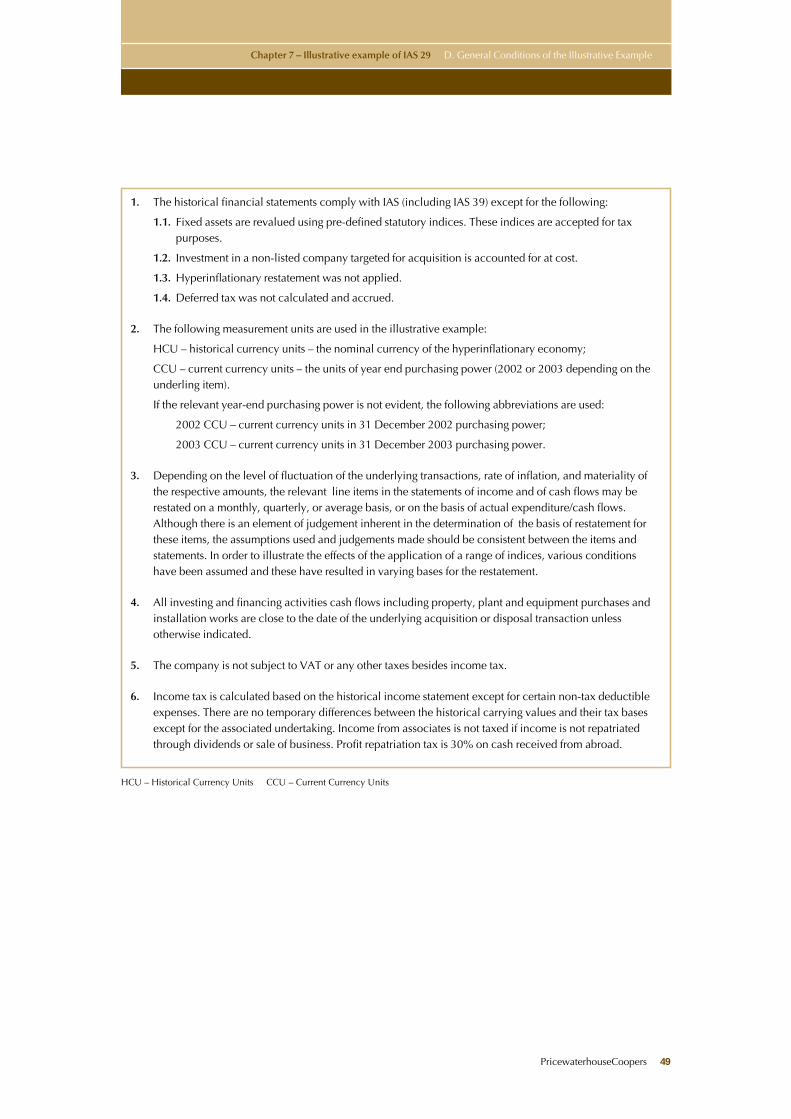
PricewaterhouseCoopers 49
HCU – Historical Currency Units CCU – Current Currency Units
Chapter 7 – Illustrative example of IAS 29 D. General Conditions of the Illustrative Example
1. The historical financial statements comply with IAS (including IAS 39) except for the following:
1.1. Fixed assets are revalued using pre-defined statutory indices. These indices are accepted for taxpurposes.
1.2. Investment in a non-listed company targeted for acquisition is accounted for at cost.
1.3. Hyperinflationary restatement was not applied.
1.4. Deferred tax was not calculated and accrued.
2. The following measurement units are used in the illustrative example:
HCU – historical currency units – the nominal currency of the hyperinflationary economy;
CCU – current currency units – the units of year end purchasing power (2002 or 2003 depending on theunderling item).
If the relevant year-end purchasing power is not evident, the following abbreviations are used:
2002 CCU – current currency units in 31 December 2002 purchasing power;
2003 CCU – current currency units in 31 December 2003 purchasing power.
3. Depending on the level of fluctuation of the underlying transactions, rate of inflation, and materiality ofthe respective amounts, the relevant line items in the statements of income and of cash flows may berestated on a monthly, quarterly, or average basis, or on the basis of actual expenditure/cash flows.Although there is an element of judgement inherent in the determination of the basis of restatement forthese items, the assumptions used and judgements made should be consistent between the items andstatements. In order to illustrate the effects of the application of a range of indices, various conditionshave been assumed and these have resulted in varying bases for the restatement.
4. All investing and financing activities cash flows including property, plant and equipment purchases andinstallation works are close to the date of the underlying acquisition or disposal transaction unlessotherwise indicated.
5. The company is not subject to VAT or any other taxes besides income tax.
6. Income tax is calculated based on the historical income statement except for certain non-tax deductibleexpenses. There are no temporary differences between the historical carrying values and their tax basesexcept for the associated undertaking. Income from associates is not taxed if income is not repatriatedthrough dividends or sale of business. Profit repatriation tax is 30% on cash received from abroad.
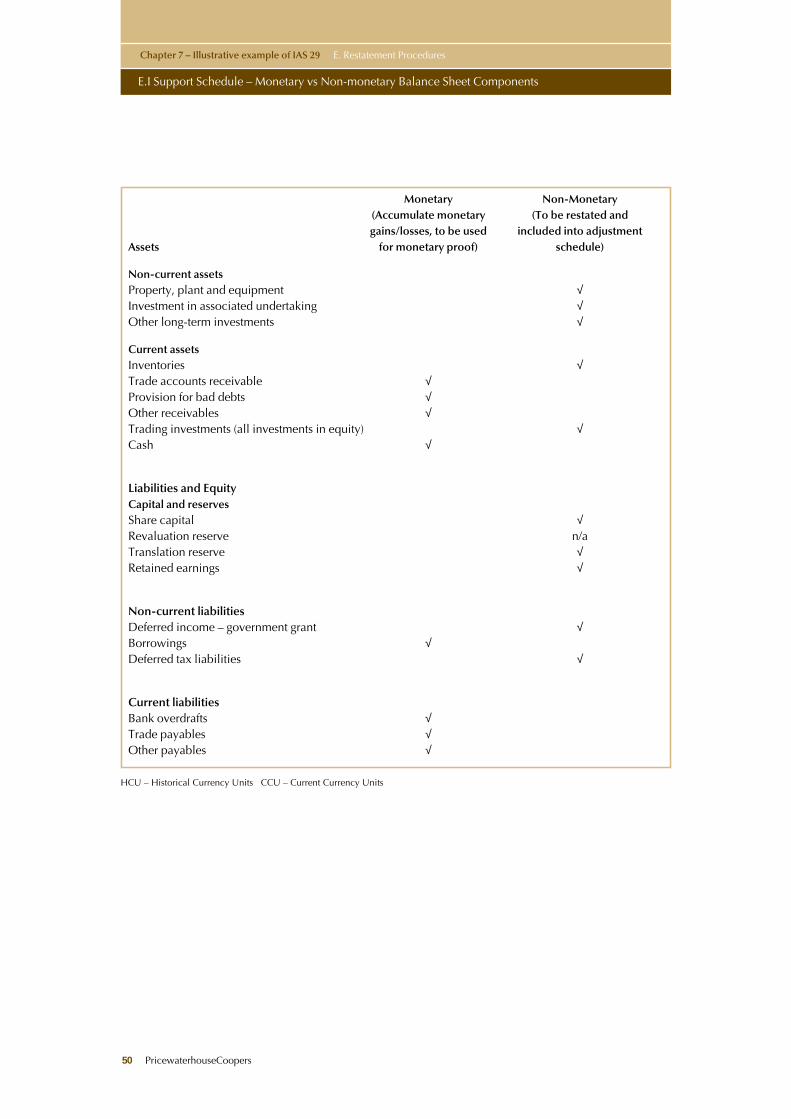
HCU – Historical Currency Units CCU – Current Currency Units
Chapter 7 – Illustrative example of IAS 29 E. Restatement Procedures
E.I Support Schedule – Monetary vs Non-monetary Balance Sheet Components
50 PricewaterhouseCoopers
Monetary Non-Monetary(Accumulate monetary (To be restated andgains/losses, to be used included into adjustment
Assets for monetary proof) schedule)
Non-current assetsProperty, plant and equipment √Investment in associated undertaking √Other long-term investments √
Current assetsInventories √Trade accounts receivable √Provision for bad debts √Other receivables √Trading investments (all investments in equity) √Cash √
Liabilities and EquityCapital and reservesShare capital √Revaluation reserve n/aTranslation reserve √Retained earnings √
Non-current liabilitiesDeferred income – government grant √Borrowings √Deferred tax liabilities √
Current liabilitiesBank overdrafts √Trade payables √Other payables √
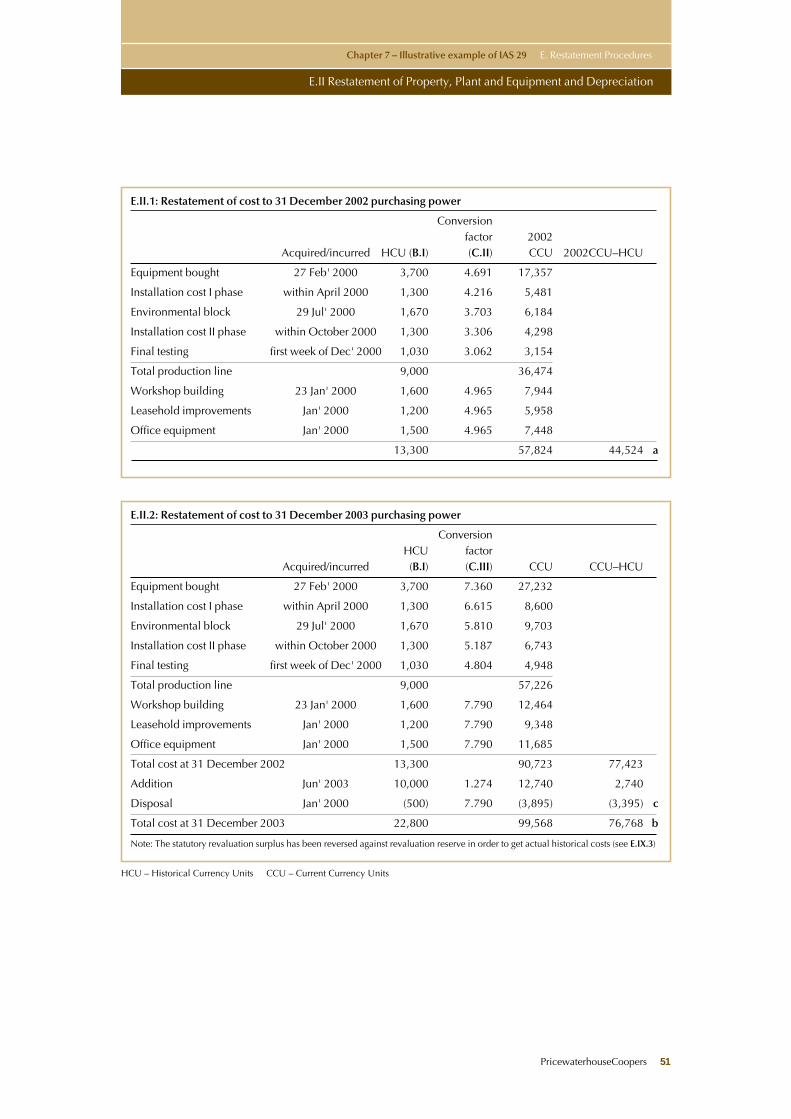
PricewaterhouseCoopers 51
HCU – Historical Currency Units CCU – Current Currency Units
Chapter 7 – Illustrative example of IAS 29 E. Restatement Procedures
E.II Restatement of Property, Plant and Equipment and Depreciation
E.II.1: Restatement of cost to 31 December 2002 purchasing power
Conversionfactor 2002
Acquired/incurred HCU (B.I) (C.II) CCU 2002CCU–HCU
Equipment bought 27 Feb' 2000 3,700 4.691 17,357
Installation cost I phase within April 2000 1,300 4.216 5,481
Environmental block 29 Jul' 2000 1,670 3.703 6,184
Installation cost II phase within October 2000 1,300 3.306 4,298
Final testing first week of Dec' 2000 1,030 3.062 3,154
Total production line 9,000 36,474
Workshop building 23 Jan' 2000 1,600 4.965 7,944
Leasehold improvements Jan' 2000 1,200 4.965 5,958
Office equipment Jan' 2000 1,500 4.965 7,448
13,300 57,824 44,524 a
E.II.2: Restatement of cost to 31 December 2003 purchasing power
ConversionHCU factor
Acquired/incurred (B.I) (C.III) CCU CCU–HCU
Equipment bought 27 Feb' 2000 3,700 7.360 27,232
Installation cost I phase within April 2000 1,300 6.615 8,600
Environmental block 29 Jul' 2000 1,670 5.810 9,703
Installation cost II phase within October 2000 1,300 5.187 6,743
Final testing first week of Dec' 2000 1,030 4.804 4,948
Total production line 9,000 57,226
Workshop building 23 Jan' 2000 1,600 7.790 12,464
Leasehold improvements Jan' 2000 1,200 7.790 9,348
Office equipment Jan' 2000 1,500 7.790 11,685
Total cost at 31 December 2002 13,300 90,723 77,423
Addition Jun' 2003 10,000 1.274 12,740 2,740
Disposal Jan' 2000 (500) 7.790 (3,895) (3,395) c
Total cost at 31 December 2003 22,800 99,568 76,768 b
Note: The statutory revaluation surplus has been reversed against revaluation reserve in order to get actual historical costs (see E.IX.3)
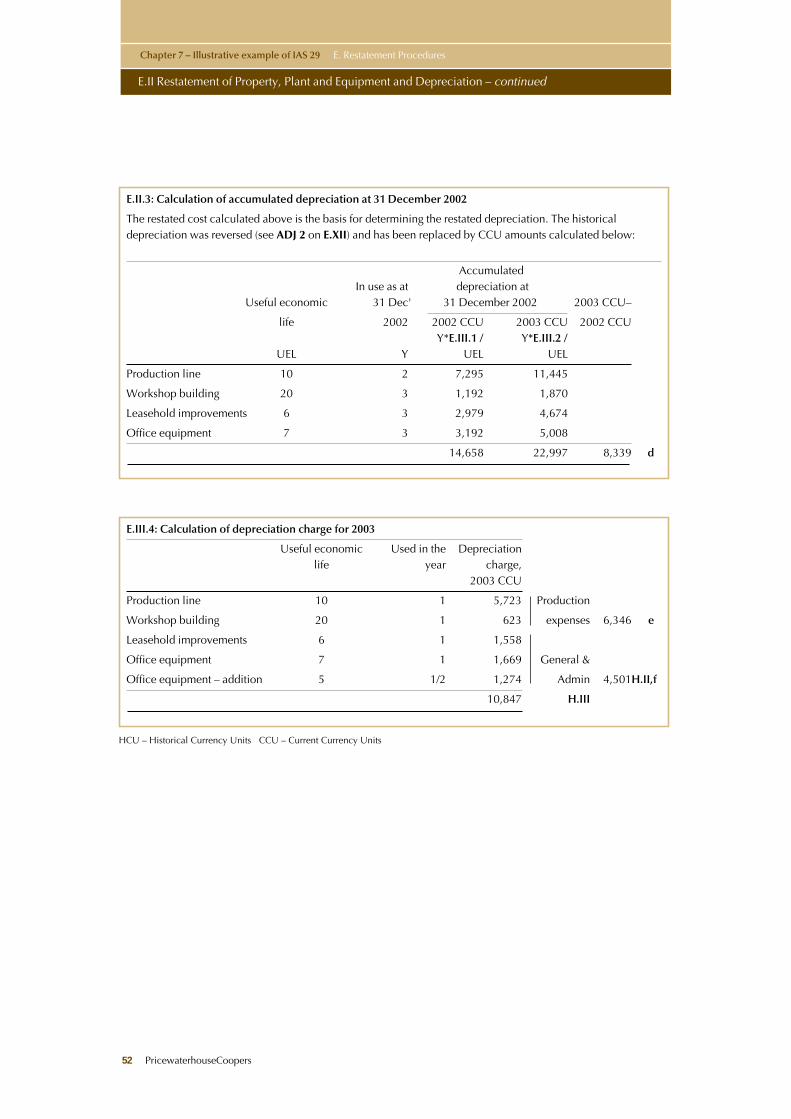
HCU – Historical Currency Units CCU – Current Currency Units
Chapter 7 – Illustrative example of IAS 29 E. Restatement Procedures
E.II Restatement of Property, Plant and Equipment and Depreciation – continued
52 PricewaterhouseCoopers
E.II.3: Calculation of accumulated depreciation at 31 December 2002
The restated cost calculated above is the basis for determining the restated depreciation. The historicaldepreciation was reversed (see ADJ 2 on E.XII) and has been replaced by CCU amounts calculated below:
AccumulatedIn use as at depreciation at
Useful economic 31 Dec' 31 December 2002 2003 CCU–
life 2002 2002 CCU 2003 CCU 2002 CCUY*E.III.1 / Y*E.III.2 /
UEL Y UEL UEL
Production line 10 2 7,295 11,445
Workshop building 20 3 1,192 1,870
Leasehold improvements 6 3 2,979 4,674
Office equipment 7 3 3,192 5,008
14,658 22,997 8,339 d
E.III.4: Calculation of depreciation charge for 2003
Useful economic Used in the Depreciationlife year charge,
2003 CCU
Production line 10 1 5,723 Production
Workshop building 20 1 623 expenses 6,346 e
Leasehold improvements 6 1 1,558
Office equipment 7 1 1,669 General &
Office equipment – addition 5 1/2 1,274 Admin 4,501H.II,f
10,847 H.III
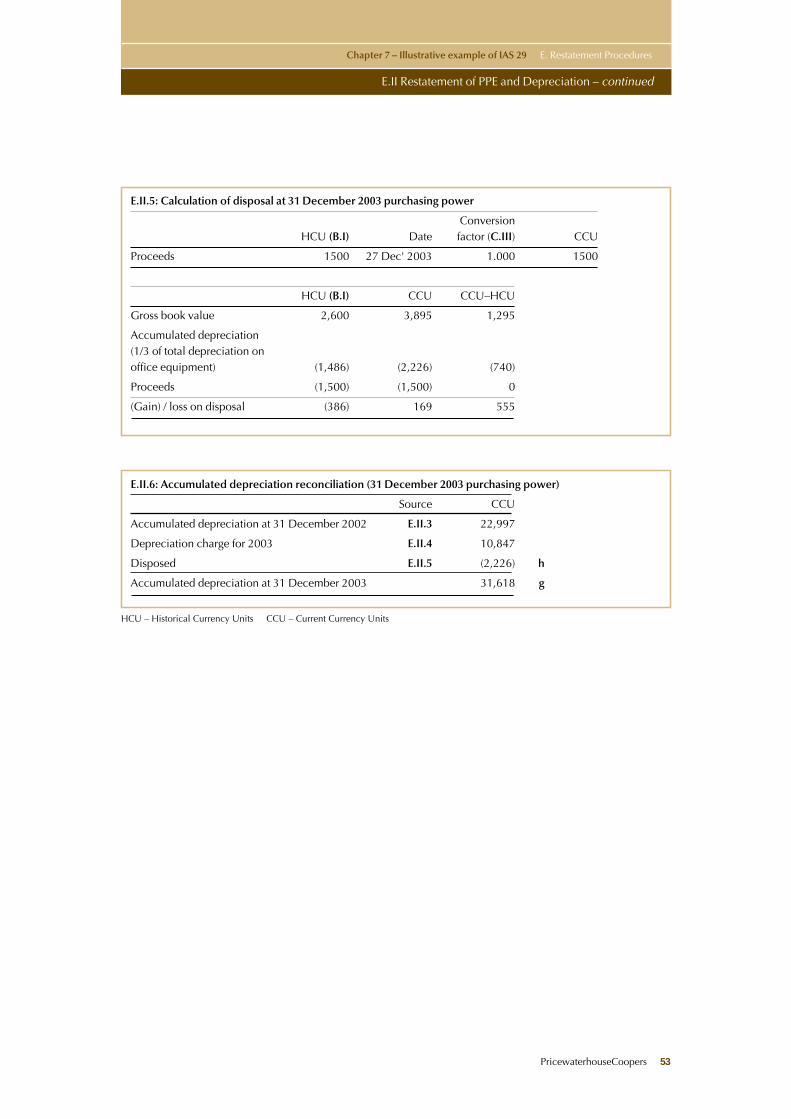
PricewaterhouseCoopers 53
HCU – Historical Currency Units CCU – Current Currency Units
Chapter 7 – Illustrative example of IAS 29 E. Restatement Procedures
E.II Restatement of PPE and Depreciation – continued
E.II.5: Calculation of disposal at 31 December 2003 purchasing power
ConversionHCU (B.I) Date factor (C.III) CCU
Proceeds 1500 27 Dec' 2003 1.000 1500
HCU (B.I) CCU CCU–HCU
Gross book value 2,600 3,895 1,295
Accumulated depreciation (1/3 of total depreciation on office equipment) (1,486) (2,226) (740)
Proceeds (1,500) (1,500) 0
(Gain) / loss on disposal (386) 169 555
E.II.6: Accumulated depreciation reconciliation (31 December 2003 purchasing power)
Source CCU
Accumulated depreciation at 31 December 2002 E.II.3 22,997
Depreciation charge for 2003 E.II.4 10,847
Disposed E.II.5 (2,226) h
Accumulated depreciation at 31 December 2003 31,618 g
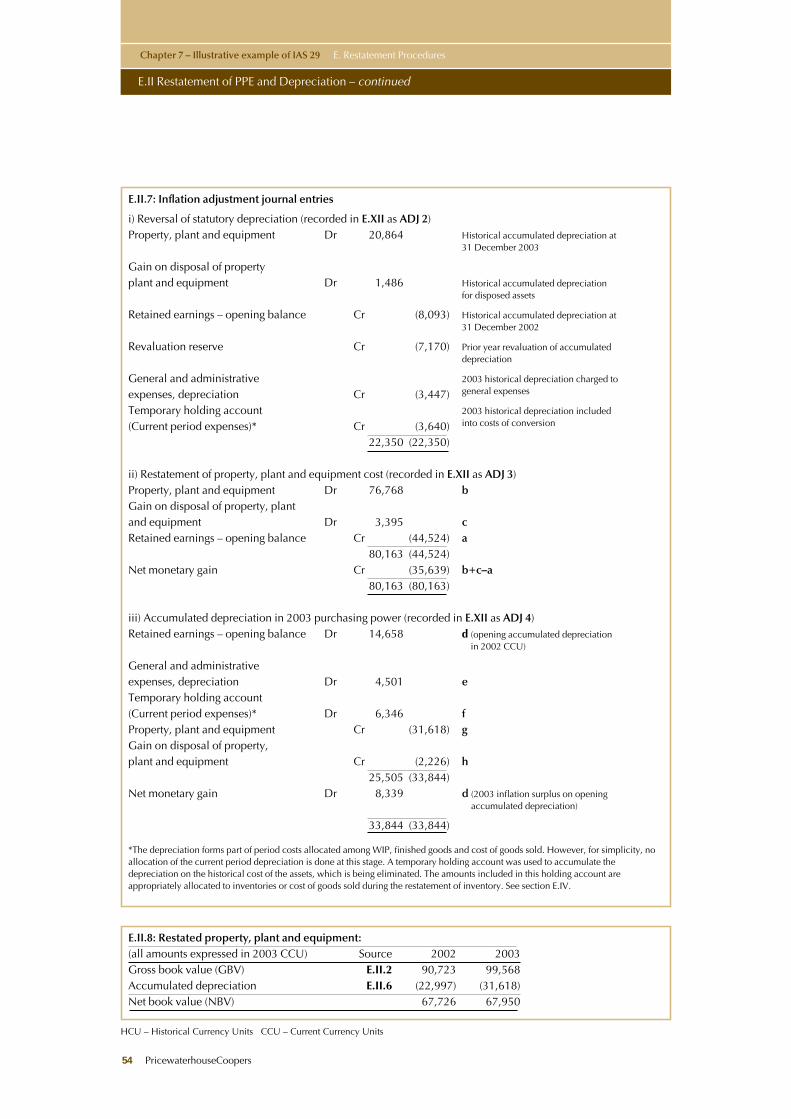
HCU – Historical Currency Units CCU – Current Currency Units
Chapter 7 – Illustrative example of IAS 29 E. Restatement Procedures
E.II Restatement of PPE and Depreciation – continued
54 PricewaterhouseCoopers
E.II.7: Inflation adjustment journal entries
i) Reversal of statutory depreciation (recorded in E.XII as ADJ 2)Property, plant and equipment Dr 20,864 Historical accumulated depreciation at
31 December 2003
Gain on disposal of propertyplant and equipment Dr 1,486 Historical accumulated depreciation
for disposed assets
Retained earnings – opening balance Cr (8,093) Historical accumulated depreciation at 31 December 2002
Revaluation reserve Cr (7,170) Prior year revaluation of accumulated depreciation
General and administrative 2003 historical depreciation charged to
expenses, depreciation Cr (3,447) general expenses
Temporary holding account 2003 historical depreciation included
(Current period expenses)* Cr (3,640) into costs of conversion
22,350 (22,350)
ii) Restatement of property, plant and equipment cost (recorded in E.XII as ADJ 3)Property, plant and equipment Dr 76,768 bGain on disposal of property, plant and equipment Dr 3,395 cRetained earnings – opening balance Cr (44,524) a
80,163 (44,524)Net monetary gain Cr (35,639) b+c–a
80,163 (80,163)
iii) Accumulated depreciation in 2003 purchasing power (recorded in E.XII as ADJ 4)Retained earnings – opening balance Dr 14,658 d (opening accumulated depreciation
in 2002 CCU)
General and administrative expenses, depreciation Dr 4,501 eTemporary holding account (Current period expenses)* Dr 6,346 fProperty, plant and equipment Cr (31,618) gGain on disposal of property, plant and equipment Cr (2,226) h
25,505 (33,844)Net monetary gain Dr 8,339 d (2003 inflation surplus on opening
accumulated depreciation)
33,844 (33,844)
*The depreciation forms part of period costs allocated among WIP, finished goods and cost of goods sold. However, for simplicity, noallocation of the current period depreciation is done at this stage. A temporary holding account was used to accumulate thedepreciation on the historical cost of the assets, which is being eliminated. The amounts included in this holding account areappropriately allocated to inventories or cost of goods sold during the restatement of inventory. See section E.IV.
E.II.8: Restated property, plant and equipment:(all amounts expressed in 2003 CCU) Source 2002 2003Gross book value (GBV) E.II.2 90,723 99,568Accumulated depreciation E.II.6 (22,997) (31,618)Net book value (NBV) 67,726 67,950
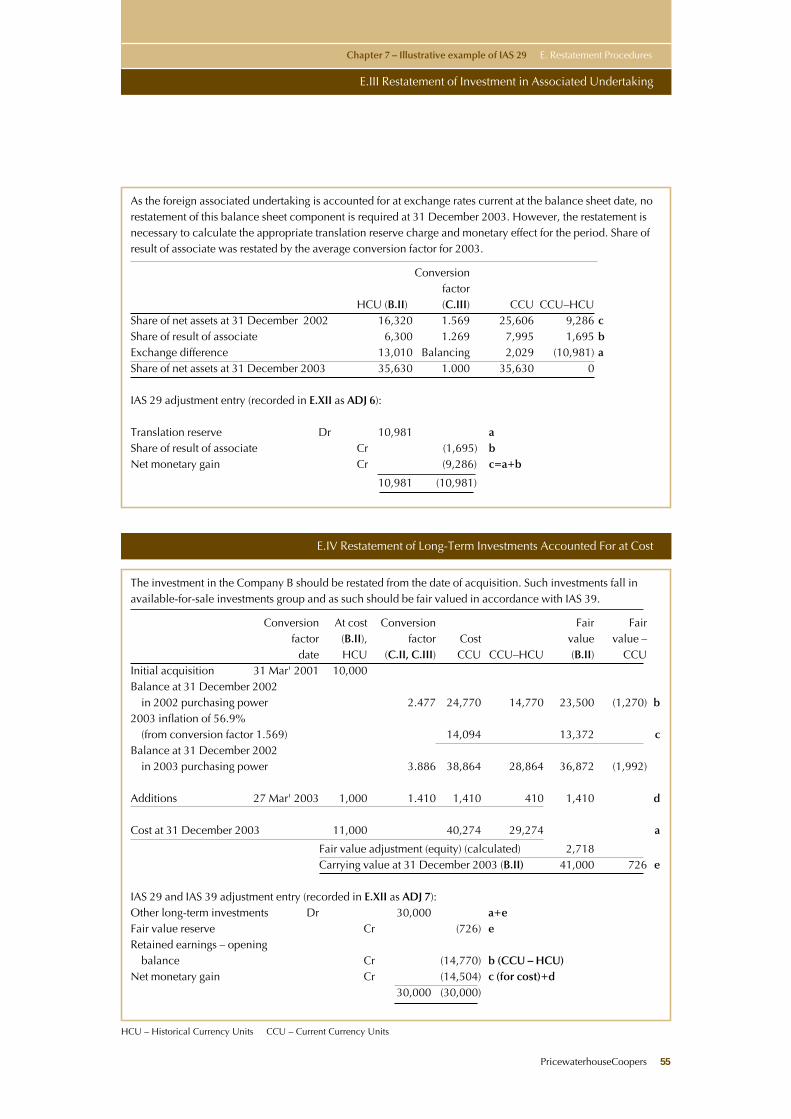
PricewaterhouseCoopers 55
HCU – Historical Currency Units CCU – Current Currency Units
Chapter 7 – Illustrative example of IAS 29 E. Restatement Procedures
E.III Restatement of Investment in Associated Undertaking
E.IV Restatement of Long-Term Investments Accounted For at Cost
As the foreign associated undertaking is accounted for at exchange rates current at the balance sheet date, norestatement of this balance sheet component is required at 31 December 2003. However, the restatement isnecessary to calculate the appropriate translation reserve charge and monetary effect for the period. Share ofresult of associate was restated by the average conversion factor for 2003.
Conversion factor
HCU (B.II) (C.III) CCU CCU–HCUShare of net assets at 31 December 2002 16,320 1.569 25,606 9,286 cShare of result of associate 6,300 1.269 7,995 1,695 bExchange difference 13,010 Balancing 2,029 (10,981) aShare of net assets at 31 December 2003 35,630 1.000 35,630 0
IAS 29 adjustment entry (recorded in E.XII as ADJ 6):
Translation reserve Dr 10,981 aShare of result of associate Cr (1,695) bNet monetary gain Cr (9,286) c=a+b
10,981 (10,981)
The investment in the Company B should be restated from the date of acquisition. Such investments fall inavailable-for-sale investments group and as such should be fair valued in accordance with IAS 39.
Conversion At cost Conversion Fair Fairfactor (B.II), factor Cost value value –
date HCU (C.II, C.III) CCU CCU–HCU (B.II) CCUInitial acquisition 31 Mar' 2001 10,000Balance at 31 December 2002
in 2002 purchasing power 2.477 24,770 14,770 23,500 (1,270) b2003 inflation of 56.9%
(from conversion factor 1.569) 14,094 13,372 cBalance at 31 December 2002
in 2003 purchasing power 3.886 38,864 28,864 36,872 (1,992)
Additions 27 Mar' 2003 1,000 1.410 1,410 410 1,410 d
Cost at 31 December 2003 11,000 40,274 29,274 a
Fair value adjustment (equity) (calculated) 2,718Carrying value at 31 December 2003 (B.II) 41,000 726 e
IAS 29 and IAS 39 adjustment entry (recorded in E.XII as ADJ 7):Other long-term investments Dr 30,000 a+eFair value reserve Cr (726) eRetained earnings – opening
balance Cr (14,770) b (CCU – HCU)Net monetary gain Cr (14,504) c (for cost)+d
30,000 (30,000)
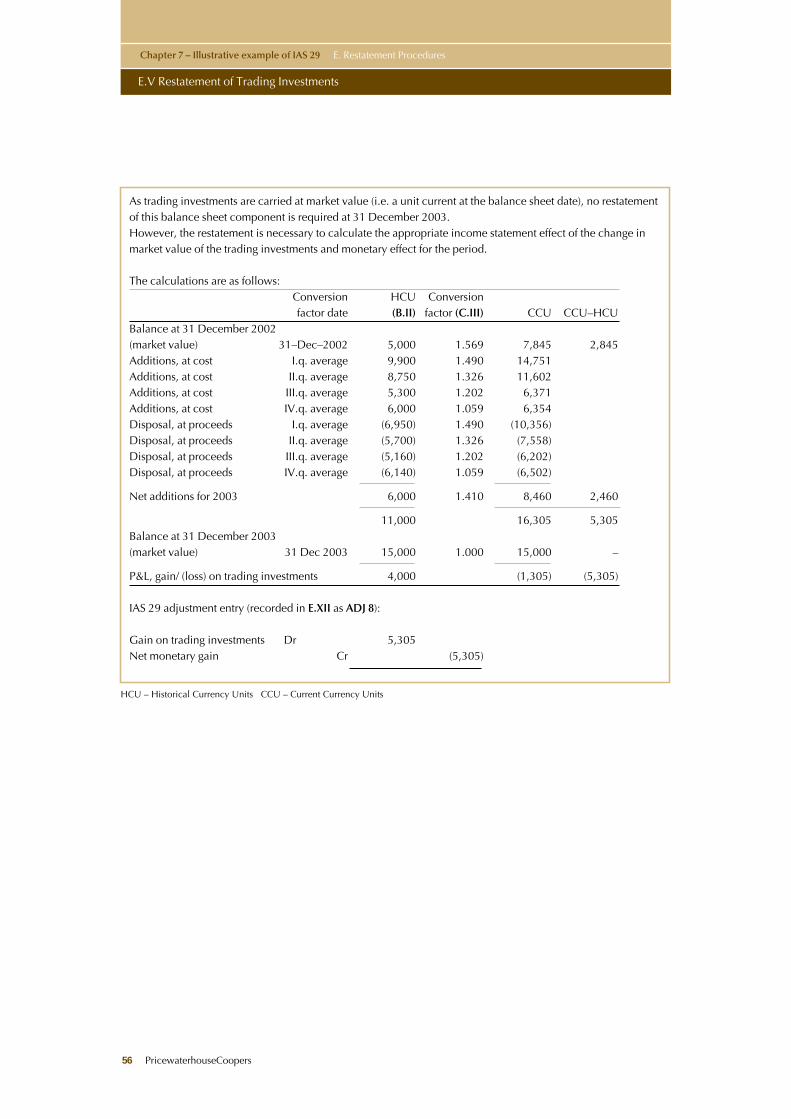
HCU – Historical Currency Units CCU – Current Currency Units
Chapter 7 – Illustrative example of IAS 29 E. Restatement Procedures
E.V Restatement of Trading Investments
56 PricewaterhouseCoopers
As trading investments are carried at market value (i.e. a unit current at the balance sheet date), no restatementof this balance sheet component is required at 31 December 2003.However, the restatement is necessary to calculate the appropriate income statement effect of the change inmarket value of the trading investments and monetary effect for the period.
The calculations are as follows:Conversion HCU Conversion factor date (B.II) factor (C.III) CCU CCU–HCU
Balance at 31 December 2002(market value) 31–Dec–2002 5,000 1.569 7,845 2,845Additions, at cost I.q. average 9,900 1.490 14,751Additions, at cost II.q. average 8,750 1.326 11,602Additions, at cost III.q. average 5,300 1.202 6,371Additions, at cost IV.q. average 6,000 1.059 6,354Disposal, at proceeds I.q. average (6,950) 1.490 (10,356)Disposal, at proceeds II.q. average (5,700) 1.326 (7,558)Disposal, at proceeds III.q. average (5,160) 1.202 (6,202)Disposal, at proceeds IV.q. average (6,140) 1.059 (6,502)
Net additions for 2003 6,000 1.410 8,460 2,460
11,000 16,305 5,305Balance at 31 December 2003 (market value) 31 Dec 2003 15,000 1.000 15,000 –
P&L, gain/ (loss) on trading investments 4,000 (1,305) (5,305)
IAS 29 adjustment entry (recorded in E.XII as ADJ 8):
Gain on trading investments Dr 5,305Net monetary gain Cr (5,305)
PricewaterhouseCoopers 57
HCU – Historical Currency Units CCU – Current Currency Units
Chapter 7 – Illustrative example of IAS 29 E. Restatement Procedures
E.VI Restatement of Inventories and Cost of Goods Sold
E.VI.1: Process of the Restatement of Inventories
The order of restating inventory should follow the production process. The order is necessary to considerthe cumulative effect of holding materials and expenditures throughout the production process.
The restatement may be broken into four stages:
1) Restatement of opening inventories.
The restatement is based on the period of holding the stock or costs incurred (for work in progress (WIP)and goods produced).
1a) Firstly, the opening balances should be restated to the prior year-end purchasing power. That is, allraw materials and component costs of finished goods and WIP should be restated from the date ofacquisition or expenditure to the opening balance sheet date. The difference (inflation effect) relatesto the prior year(s) and, thus, is included in the opening retained earnings.
1b) Secondly, the opening inventories presented in prior year purchasing power should be restated tocurrent year end purchasing power. The resulting difference would be credited to monetary gain forthe current period.
2) Restatement of period additions.
In practice, the restatement of stock additions may require the historical information to be restated on amonthly or quarterly basis, depending on the rate of inflation during the year and timing of expenditures.However, yearly average inflation (i.e. conversion factor of 1.269) has been used in this illustrativeexample. WIP additions throughout the year should be inflated from the date of acquisition orexpenditure, thus a monetary gain is realised by holding those costs in WIP.
3) Restatement of closing inventories.
Restatement of closing stock should be performed in the same manner as the restatement of openinginventories.
4) Calculation of the inventory used in the production process
Stock disposals in terms of current year end purchasing power could be calculated as follows (all amountsshould be expressed in 2003 CCU):
Opening inventory balance
Additions on account for 2003
Less:
Closing inventory balance
Raw materials shipped for conversion or WIP completed or cost of goods sold (depending on type ofinventory) in 2003 CCU.
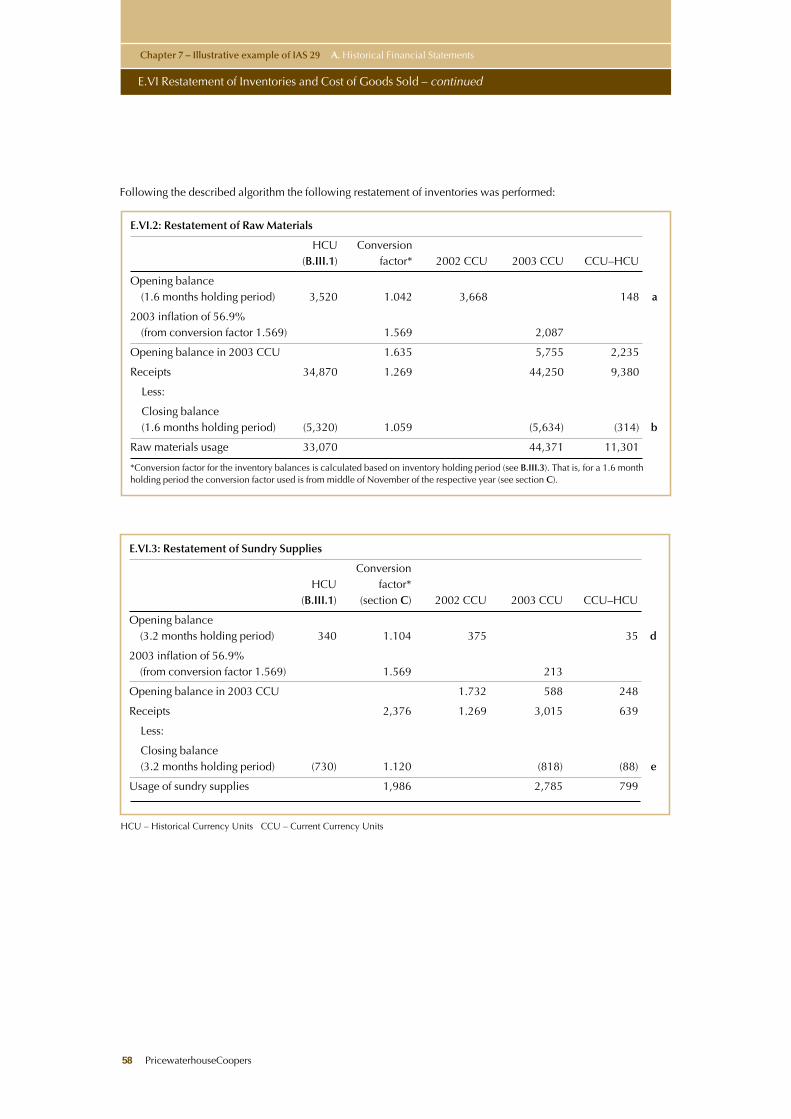
HCU – Historical Currency Units CCU – Current Currency Units
Chapter 7 – Illustrative example of IAS 29 A. Historical Financial Statements
E.VI Restatement of Inventories and Cost of Goods Sold – continued
58 PricewaterhouseCoopers
E.VI.2: Restatement of Raw Materials
HCU Conversion(B.III.1) factor* 2002 CCU 2003 CCU CCU–HCU
Opening balance (1.6 months holding period) 3,520 1.042 3,668 148 a
2003 inflation of 56.9% (from conversion factor 1.569) 1.569 2,087
Opening balance in 2003 CCU 1.635 5,755 2,235
Receipts 34,870 1.269 44,250 9,380
Less:
Closing balance (1.6 months holding period) (5,320) 1.059 (5,634) (314) b
Raw materials usage 33,070 44,371 11,301
*Conversion factor for the inventory balances is calculated based on inventory holding period (see B.III.3). That is, for a 1.6 monthholding period the conversion factor used is from middle of November of the respective year (see section C).
E.VI.3: Restatement of Sundry Supplies
ConversionHCU factor*
(B.III.1) (section C) 2002 CCU 2003 CCU CCU–HCU
Opening balance (3.2 months holding period) 340 1.104 375 35 d
2003 inflation of 56.9% (from conversion factor 1.569) 1.569 213
Opening balance in 2003 CCU 1.732 588 248
Receipts 2,376 1.269 3,015 639
Less:
Closing balance (3.2 months holding period) (730) 1.120 (818) (88) e
Usage of sundry supplies 1,986 2,785 799
Following the described algorithm the following restatement of inventories was performed:
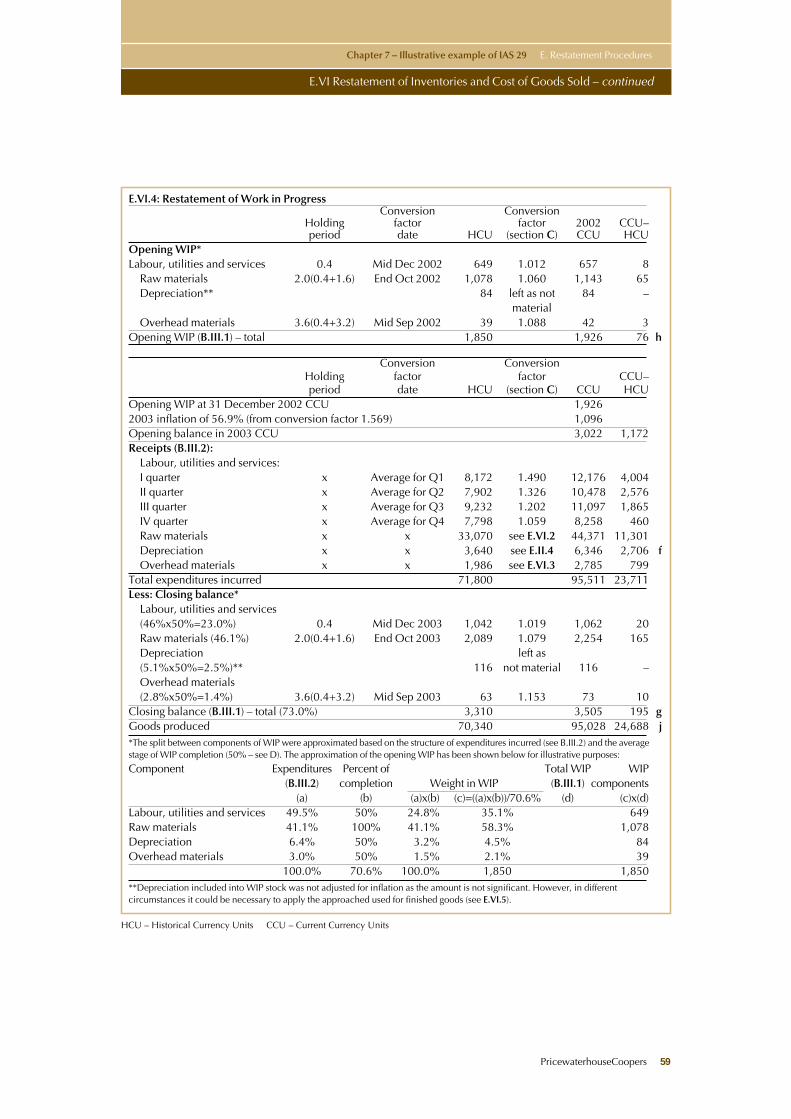
PricewaterhouseCoopers 59
HCU – Historical Currency Units CCU – Current Currency Units
Chapter 7 – Illustrative example of IAS 29 E. Restatement Procedures
E.VI Restatement of Inventories and Cost of Goods Sold – continued
E.VI.4: Restatement of Work in ProgressConversion Conversion
Holding factor factor 2002 CCU–period date HCU (section C) CCU HCU
Opening WIP*Labour, utilities and services 0.4 Mid Dec 2002 649 1.012 657 8
Raw materials 2.0(0.4+1.6) End Oct 2002 1,078 1.060 1,143 65Depreciation** 84 left as not 84 –
materialOverhead materials 3.6(0.4+3.2) Mid Sep 2002 39 1.088 42 3
Opening WIP (B.III.1) – total 1,850 1,926 76 h
Conversion ConversionHolding factor factor CCU–period date HCU (section C) CCU HCU
Opening WIP at 31 December 2002 CCU 1,9262003 inflation of 56.9% (from conversion factor 1.569) 1,096Opening balance in 2003 CCU 3,022 1,172Receipts (B.III.2):
Labour, utilities and services:I quarter x Average for Q1 8,172 1.490 12,176 4,004II quarter x Average for Q2 7,902 1.326 10,478 2,576III quarter x Average for Q3 9,232 1.202 11,097 1,865IV quarter x Average for Q4 7,798 1.059 8,258 460Raw materials x x 33,070 see E.VI.2 44,371 11,301Depreciation x x 3,640 see E.II.4 6,346 2,706 fOverhead materials x x 1,986 see E.VI.3 2,785 799
Total expenditures incurred 71,800 95,511 23,711Less: Closing balance*
Labour, utilities and services(46%x50%=23.0%) 0.4 Mid Dec 2003 1,042 1.019 1,062 20Raw materials (46.1%) 2.0(0.4+1.6) End Oct 2003 2,089 1.079 2,254 165Depreciation left as (5.1%x50%=2.5%)** 116 not material 116 –Overhead materials(2.8%x50%=1.4%) 3.6(0.4+3.2) Mid Sep 2003 63 1.153 73 10
Closing balance (B.III.1) – total (73.0%) 3,310 3,505 195 gGoods produced 70,340 95,028 24,688 j*The split between components of WIP were approximated based on the structure of expenditures incurred (see B.III.2) and the averagestage of WIP completion (50% – see D). The approximation of the opening WIP has been shown below for illustrative purposes:
Component Expenditures Percent of Total WIP WIP(B.III.2) completion Weight in WIP (B.III.1) components
(a) (b) (a)x(b) (c)=((a)x(b))/70.6% (d) (c)x(d)Labour, utilities and services 49.5% 50% 24.8% 35.1% 649Raw materials 41.1% 100% 41.1% 58.3% 1,078Depreciation 6.4% 50% 3.2% 4.5% 84Overhead materials 3.0% 50% 1.5% 2.1% 39
100.0% 70.6% 100.0% 1,850 1,850**Depreciation included into WIP stock was not adjusted for inflation as the amount is not significant. However, in differentcircumstances it could be necessary to apply the approached used for finished goods (see E.VI.5).
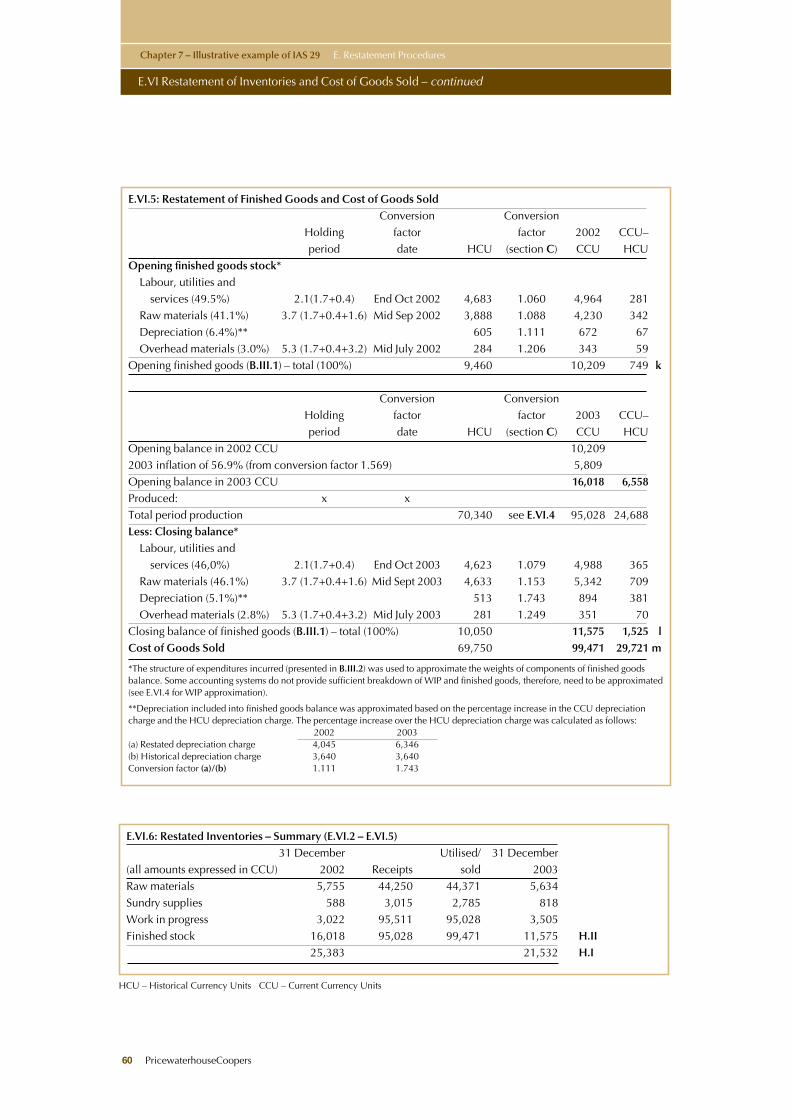
HCU – Historical Currency Units CCU – Current Currency Units
Chapter 7 – Illustrative example of IAS 29 E. Restatement Procedures
E.VI Restatement of Inventories and Cost of Goods Sold – continued
60 PricewaterhouseCoopers
E.VI.5: Restatement of Finished Goods and Cost of Goods SoldConversion Conversion
Holding factor factor 2002 CCU–period date HCU (section C) CCU HCU
Opening finished goods stock*Labour, utilities and
services (49.5%) 2.1(1.7+0.4) End Oct 2002 4,683 1.060 4,964 281Raw materials (41.1%) 3.7 (1.7+0.4+1.6) Mid Sep 2002 3,888 1.088 4,230 342Depreciation (6.4%)** 605 1.111 672 67Overhead materials (3.0%) 5.3 (1.7+0.4+3.2) Mid July 2002 284 1.206 343 59
Opening finished goods (B.III.1) – total (100%) 9,460 10,209 749 k
Conversion ConversionHolding factor factor 2003 CCU–period date HCU (section C) CCU HCU
Opening balance in 2002 CCU 10,2092003 inflation of 56.9% (from conversion factor 1.569) 5,809Opening balance in 2003 CCU 16,018 6,558Produced: x xTotal period production 70,340 see E.VI.4 95,028 24,688Less: Closing balance*
Labour, utilities andservices (46,0%) 2.1(1.7+0.4) End Oct 2003 4,623 1.079 4,988 365
Raw materials (46.1%) 3.7 (1.7+0.4+1.6) Mid Sept 2003 4,633 1.153 5,342 709Depreciation (5.1%)** 513 1.743 894 381Overhead materials (2.8%) 5.3 (1.7+0.4+3.2) Mid July 2003 281 1.249 351 70
Closing balance of finished goods (B.III.1) – total (100%) 10,050 11,575 1,525 lCost of Goods Sold 69,750 99,471 29,721 m
*The structure of expenditures incurred (presented in B.III.2) was used to approximate the weights of components of finished goodsbalance. Some accounting systems do not provide sufficient breakdown of WIP and finished goods, therefore, need to be approximated(see E.VI.4 for WIP approximation).
**Depreciation included into finished goods balance was approximated based on the percentage increase in the CCU depreciationcharge and the HCU depreciation charge. The percentage increase over the HCU depreciation charge was calculated as follows:
2002 2003(a) Restated depreciation charge 4,045 6,346(b) Historical depreciation charge 3,640 3,640Conversion factor (a)/(b) 1.111 1.743
E.VI.6: Restated Inventories – Summary (E.VI.2 – E.VI.5)31 December Utilised/ 31 December
(all amounts expressed in CCU) 2002 Receipts sold 2003Raw materials 5,755 44,250 44,371 5,634Sundry supplies 588 3,015 2,785 818Work in progress 3,022 95,511 95,028 3,505Finished stock 16,018 95,028 99,471 11,575 H.II
25,383 21,532 H.I
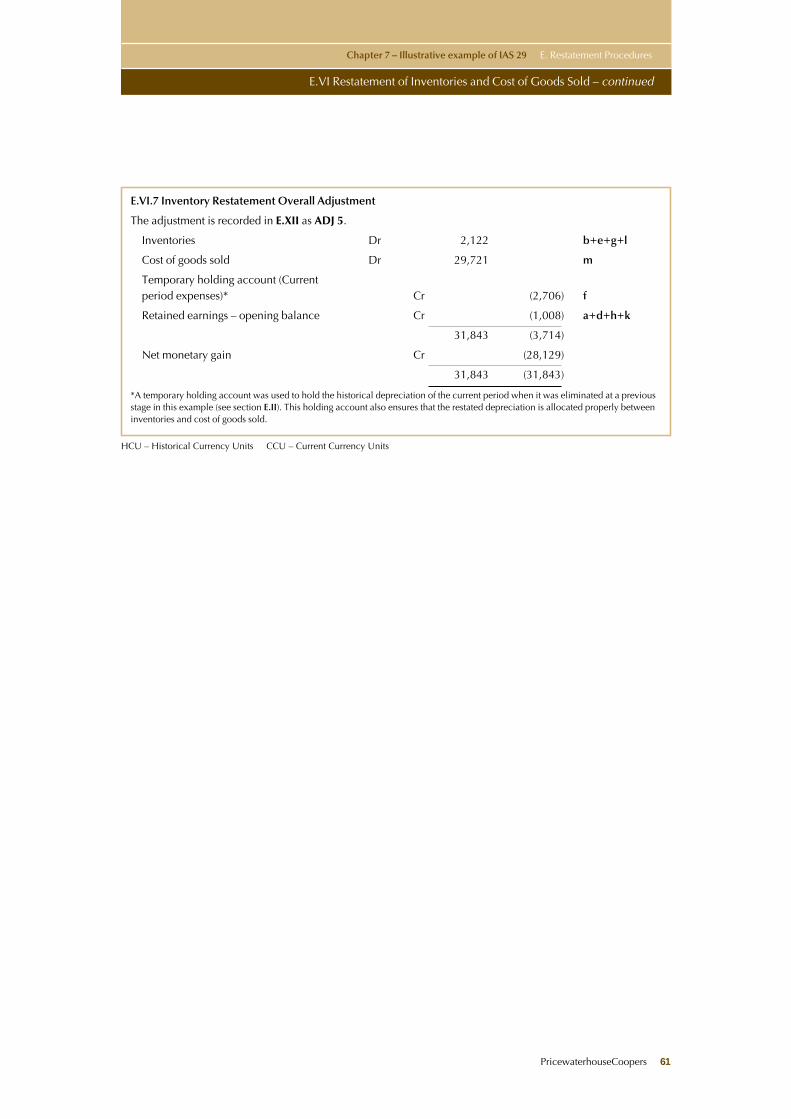
PricewaterhouseCoopers 61
HCU – Historical Currency Units CCU – Current Currency Units
Chapter 7 – Illustrative example of IAS 29 E. Restatement Procedures
E.VI Restatement of Inventories and Cost of Goods Sold – continued
E.VI.7 Inventory Restatement Overall Adjustment
The adjustment is recorded in E.XII as ADJ 5.
Inventories Dr 2,122 b+e+g+l
Cost of goods sold Dr 29,721 m
Temporary holding account (Current period expenses)* Cr (2,706) f
Retained earnings – opening balance Cr (1,008) a+d+h+k
31,843 (3,714)
Net monetary gain Cr (28,129)
31,843 (31,843)
*A temporary holding account was used to hold the historical depreciation of the current period when it was eliminated at a previousstage in this example (see section E.II). This holding account also ensures that the restated depreciation is allocated properly betweeninventories and cost of goods sold.
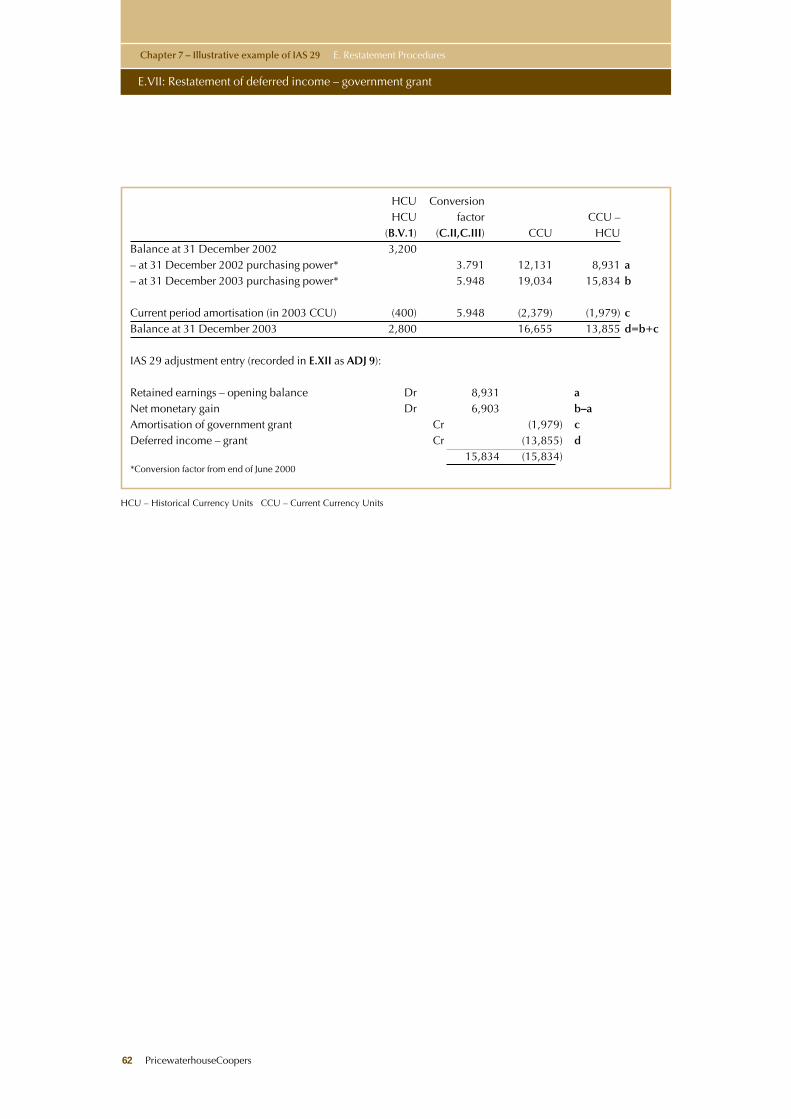
HCU – Historical Currency Units CCU – Current Currency Units
Chapter 7 – Illustrative example of IAS 29 E. Restatement Procedures
E.VII: Restatement of deferred income – government grant
62 PricewaterhouseCoopers
HCU ConversionHCU factor CCU –
(B.V.1) (C.II,C.III) CCU HCUBalance at 31 December 2002 3,200– at 31 December 2002 purchasing power* 3.791 12,131 8,931 a– at 31 December 2003 purchasing power* 5.948 19,034 15,834 b
Current period amortisation (in 2003 CCU) (400) 5.948 (2,379) (1,979) cBalance at 31 December 2003 2,800 16,655 13,855 d=b+c
IAS 29 adjustment entry (recorded in E.XII as ADJ 9):
Retained earnings – opening balance Dr 8,931 aNet monetary gain Dr 6,903 b–aAmortisation of government grant Cr (1,979) cDeferred income – grant Cr (13,855) d
15,834 (15,834)*Conversion factor from end of June 2000
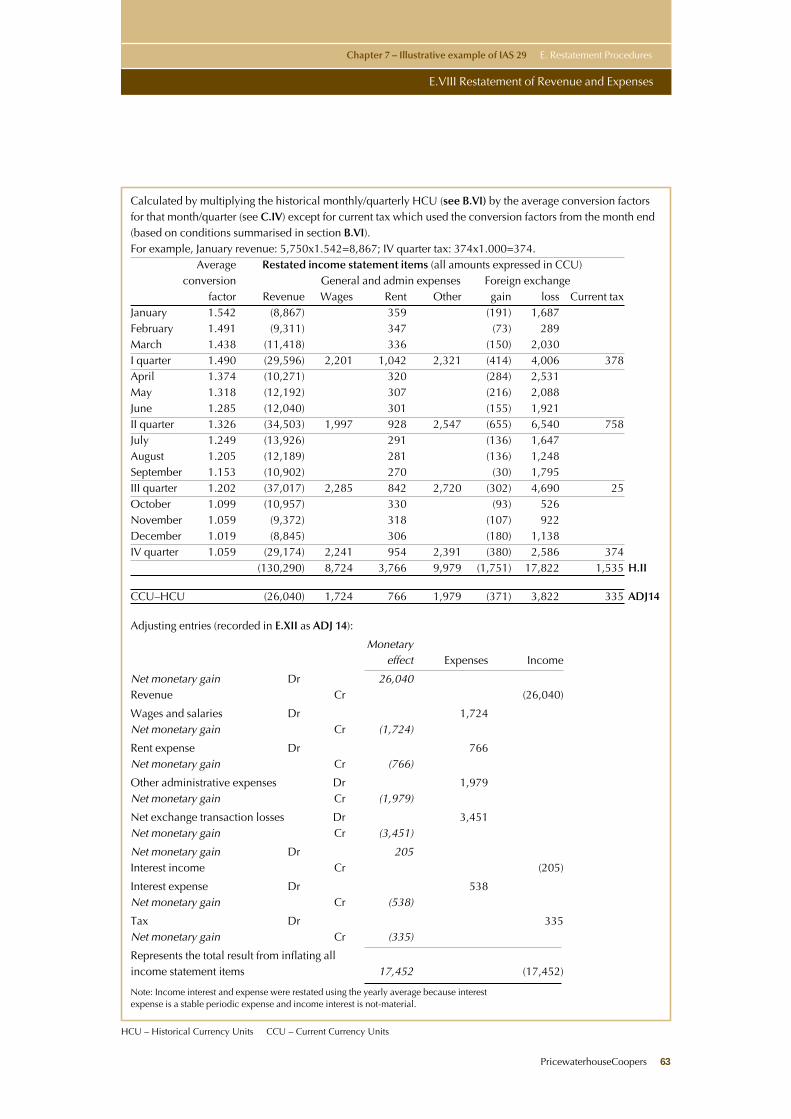
PricewaterhouseCoopers 63
HCU – Historical Currency Units CCU – Current Currency Units
Chapter 7 – Illustrative example of IAS 29 E. Restatement Procedures
E.VIII Restatement of Revenue and Expenses
Calculated by multiplying the historical monthly/quarterly HCU (see B.VI) by the average conversion factorsfor that month/quarter (see C.IV) except for current tax which used the conversion factors from the month end(based on conditions summarised in section B.VI).For example, January revenue: 5,750x1.542=8,867; IV quarter tax: 374x1.000=374.
Average Restated income statement items (all amounts expressed in CCU)conversion General and admin expenses Foreign exchange
factor Revenue Wages Rent Other gain loss Current taxJanuary 1.542 (8,867) 359 (191) 1,687February 1.491 (9,311) 347 (73) 289March 1.438 (11,418) 336 (150) 2,030I quarter 1.490 (29,596) 2,201 1,042 2,321 (414) 4,006 378April 1.374 (10,271) 320 (284) 2,531May 1.318 (12,192) 307 (216) 2,088June 1.285 (12,040) 301 (155) 1,921II quarter 1.326 (34,503) 1,997 928 2,547 (655) 6,540 758July 1.249 (13,926) 291 (136) 1,647August 1.205 (12,189) 281 (136) 1,248September 1.153 (10,902) 270 (30) 1,795III quarter 1.202 (37,017) 2,285 842 2,720 (302) 4,690 25October 1.099 (10,957) 330 (93) 526November 1.059 (9,372) 318 (107) 922December 1.019 (8,845) 306 (180) 1,138IV quarter 1.059 (29,174) 2,241 954 2,391 (380) 2,586 374
(130,290) 8,724 3,766 9,979 (1,751) 17,822 1,535 H.II
CCU–HCU (26,040) 1,724 766 1,979 (371) 3,822 335 ADJ14
Adjusting entries (recorded in E.XII as ADJ 14):
Monetaryeffect Expenses Income
Net monetary gain Dr 26,040Revenue Cr (26,040)
Wages and salaries Dr 1,724Net monetary gain Cr (1,724)
Rent expense Dr 766Net monetary gain Cr (766)
Other administrative expenses Dr 1,979Net monetary gain Cr (1,979)
Net exchange transaction losses Dr 3,451Net monetary gain Cr (3,451)
Net monetary gain Dr 205Interest income Cr (205)
Interest expense Dr 538Net monetary gain Cr (538)
Tax Dr 335Net monetary gain Cr (335)
Represents the total result from inflating all income statement items 17,452 (17,452)
Note: Income interest and expense were restated using the yearly average because interest expense is a stable periodic expense and income interest is not-material.
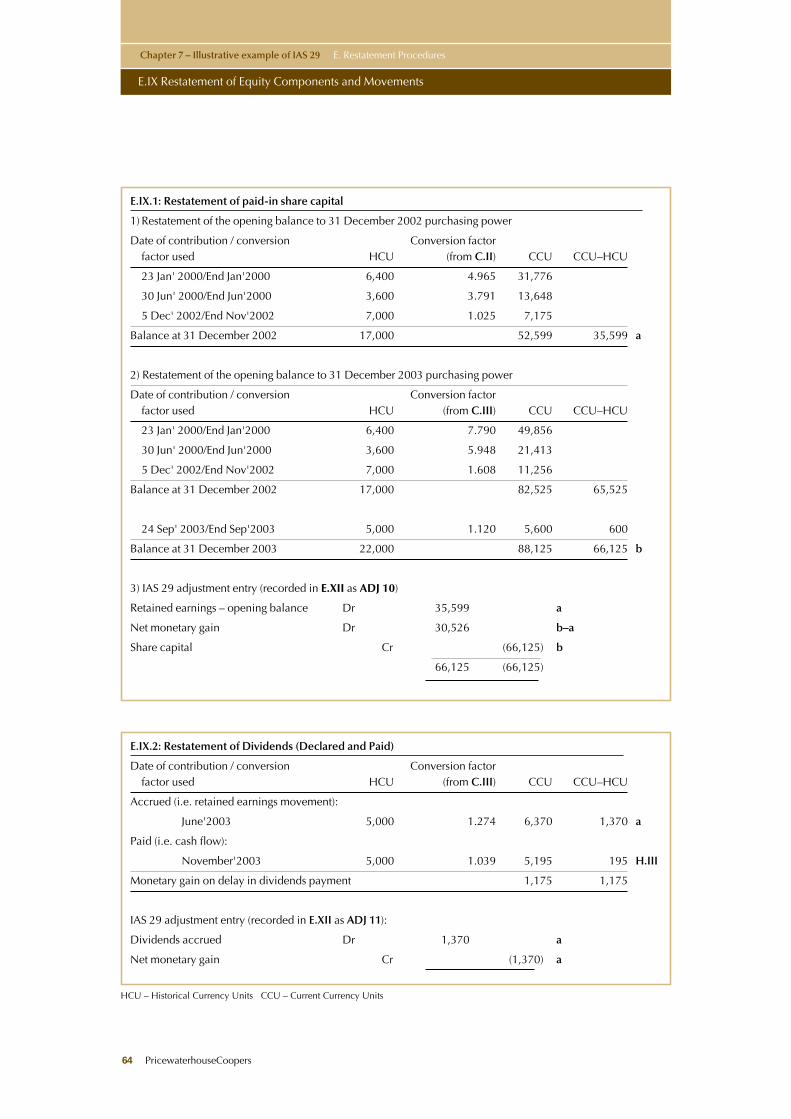
HCU – Historical Currency Units CCU – Current Currency Units
Chapter 7 – Illustrative example of IAS 29 E. Restatement Procedures
E.IX Restatement of Equity Components and Movements
64 PricewaterhouseCoopers
E.IX.1: Restatement of paid-in share capital
1) Restatement of the opening balance to 31 December 2002 purchasing power
Date of contribution / conversion Conversion factorfactor used HCU (from C.II) CCU CCU–HCU
23 Jan' 2000/End Jan'2000 6,400 4.965 31,776
30 Jun' 2000/End Jun'2000 3,600 3.791 13,648
5 Dec' 2002/End Nov'2002 7,000 1.025 7,175
Balance at 31 December 2002 17,000 52,599 35,599 a
2) Restatement of the opening balance to 31 December 2003 purchasing power
Date of contribution / conversion Conversion factorfactor used HCU (from C.III) CCU CCU–HCU
23 Jan' 2000/End Jan'2000 6,400 7.790 49,856
30 Jun' 2000/End Jun'2000 3,600 5.948 21,413
5 Dec' 2002/End Nov'2002 7,000 1.608 11,256
Balance at 31 December 2002 17,000 82,525 65,525
24 Sep' 2003/End Sep'2003 5,000 1.120 5,600 600
Balance at 31 December 2003 22,000 88,125 66,125 b
3) IAS 29 adjustment entry (recorded in E.XII as ADJ 10)
Retained earnings – opening balance Dr 35,599 a
Net monetary gain Dr 30,526 b–a
Share capital Cr (66,125) b
66,125 (66,125)
E.IX.2: Restatement of Dividends (Declared and Paid)
Date of contribution / conversion Conversion factorfactor used HCU (from C.III) CCU CCU–HCU
Accrued (i.e. retained earnings movement):
June'2003 5,000 1.274 6,370 1,370 a
Paid (i.e. cash flow):
November'2003 5,000 1.039 5,195 195 H.III
Monetary gain on delay in dividends payment 1,175 1,175
IAS 29 adjustment entry (recorded in E.XII as ADJ 11):
Dividends accrued Dr 1,370 a
Net monetary gain Cr (1,370) a
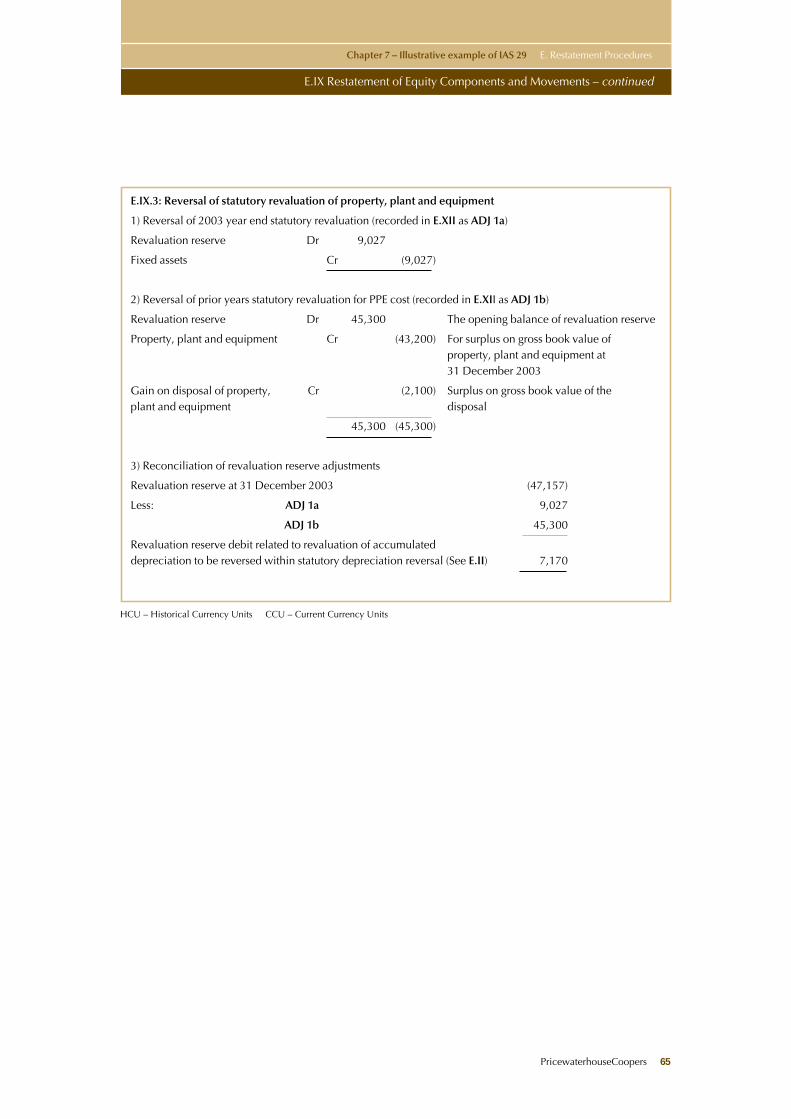
PricewaterhouseCoopers 65
HCU – Historical Currency Units CCU – Current Currency Units
Chapter 7 – Illustrative example of IAS 29 E. Restatement Procedures
E.IX Restatement of Equity Components and Movements – continued
E.IX.3: Reversal of statutory revaluation of property, plant and equipment
1) Reversal of 2003 year end statutory revaluation (recorded in E.XII as ADJ 1a)
Revaluation reserve Dr 9,027
Fixed assets Cr (9,027)
2) Reversal of prior years statutory revaluation for PPE cost (recorded in E.XII as ADJ 1b)
Revaluation reserve Dr 45,300 The opening balance of revaluation reserve
Property, plant and equipment Cr (43,200) For surplus on gross book value of property, plant and equipment at 31 December 2003
Gain on disposal of property, Cr (2,100) Surplus on gross book value of the plant and equipment disposal
45,300 (45,300)
3) Reconciliation of revaluation reserve adjustments
Revaluation reserve at 31 December 2003 (47,157)
Less: ADJ 1a 9,027
ADJ 1b 45,300
Revaluation reserve debit related to revaluation of accumulated depreciation to be reversed within statutory depreciation reversal (See E.II) 7,170
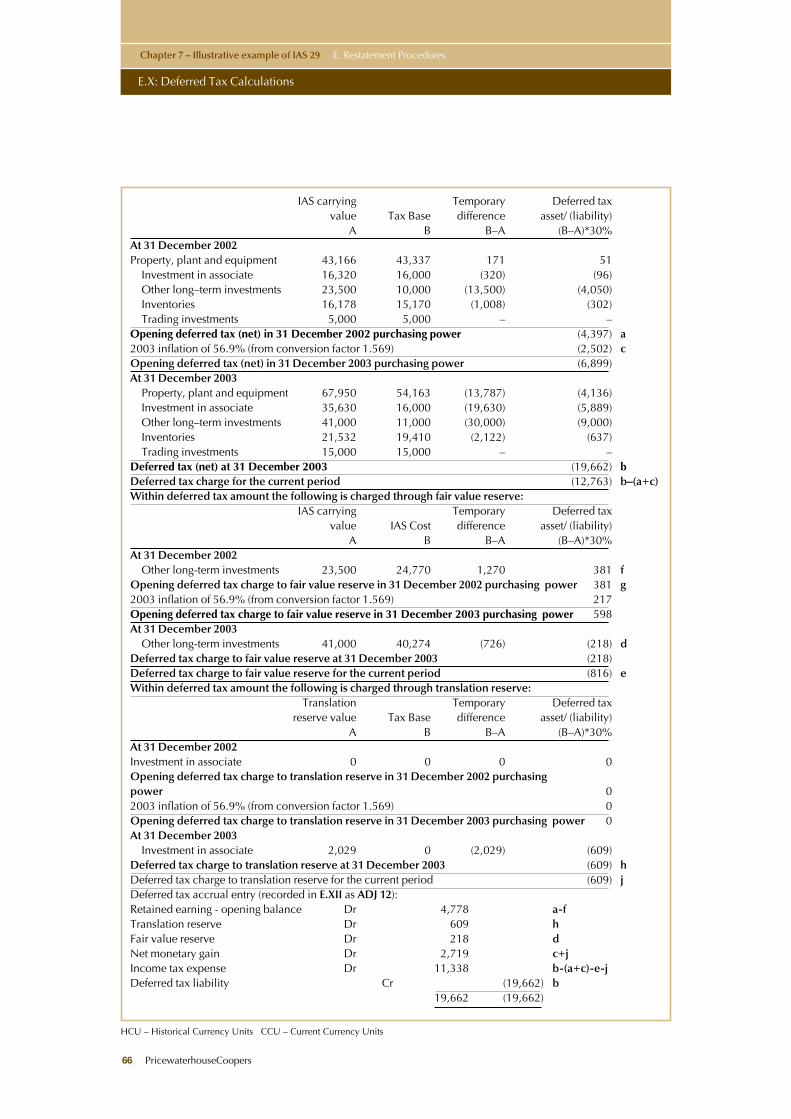
HCU – Historical Currency Units CCU – Current Currency Units
Chapter 7 – Illustrative example of IAS 29 E. Restatement Procedures
E.X: Deferred Tax Calculations
66 PricewaterhouseCoopers
IAS carrying Temporary Deferred taxvalue Tax Base difference asset/ (liability)
A B B–A (B–A)*30%At 31 December 2002Property, plant and equipment 43,166 43,337 171 51
Investment in associate 16,320 16,000 (320) (96)Other long–term investments 23,500 10,000 (13,500) (4,050)Inventories 16,178 15,170 (1,008) (302)Trading investments 5,000 5,000 – –
Opening deferred tax (net) in 31 December 2002 purchasing power (4,397) a2003 inflation of 56.9% (from conversion factor 1.569) (2,502) cOpening deferred tax (net) in 31 December 2003 purchasing power (6,899)At 31 December 2003
Property, plant and equipment 67,950 54,163 (13,787) (4,136)Investment in associate 35,630 16,000 (19,630) (5,889)Other long–term investments 41,000 11,000 (30,000) (9,000)Inventories 21,532 19,410 (2,122) (637)Trading investments 15,000 15,000 – –
Deferred tax (net) at 31 December 2003 (19,662) bDeferred tax charge for the current period (12,763) b–(a+c)Within deferred tax amount the following is charged through fair value reserve:
IAS carrying Temporary Deferred taxvalue IAS Cost difference asset/ (liability)
A B B–A (B–A)*30%At 31 December 2002
Other long-term investments 23,500 24,770 1,270 381 fOpening deferred tax charge to fair value reserve in 31 December 2002 purchasing power 381 g2003 inflation of 56.9% (from conversion factor 1.569) 217Opening deferred tax charge to fair value reserve in 31 December 2003 purchasing power 598At 31 December 2003
Other long-term investments 41,000 40,274 (726) (218) dDeferred tax charge to fair value reserve at 31 December 2003 (218)Deferred tax charge to fair value reserve for the current period (816) eWithin deferred tax amount the following is charged through translation reserve:
Translation Temporary Deferred taxreserve value Tax Base difference asset/ (liability)
A B B–A (B–A)*30%At 31 December 2002Investment in associate 0 0 0 0Opening deferred tax charge to translation reserve in 31 December 2002 purchasing power 02003 inflation of 56.9% (from conversion factor 1.569) 0Opening deferred tax charge to translation reserve in 31 December 2003 purchasing power 0At 31 December 2003
Investment in associate 2,029 0 (2,029) (609)Deferred tax charge to translation reserve at 31 December 2003 (609) hDeferred tax charge to translation reserve for the current period (609) jDeferred tax accrual entry (recorded in E.XII as ADJ 12):Retained earning - opening balance Dr 4,778 a-fTranslation reserve Dr 609 hFair value reserve Dr 218 dNet monetary gain Dr 2,719 c+jIncome tax expense Dr 11,338 b-(a+c)-e-jDeferred tax liability Cr (19,662) b
19,662 (19,662)
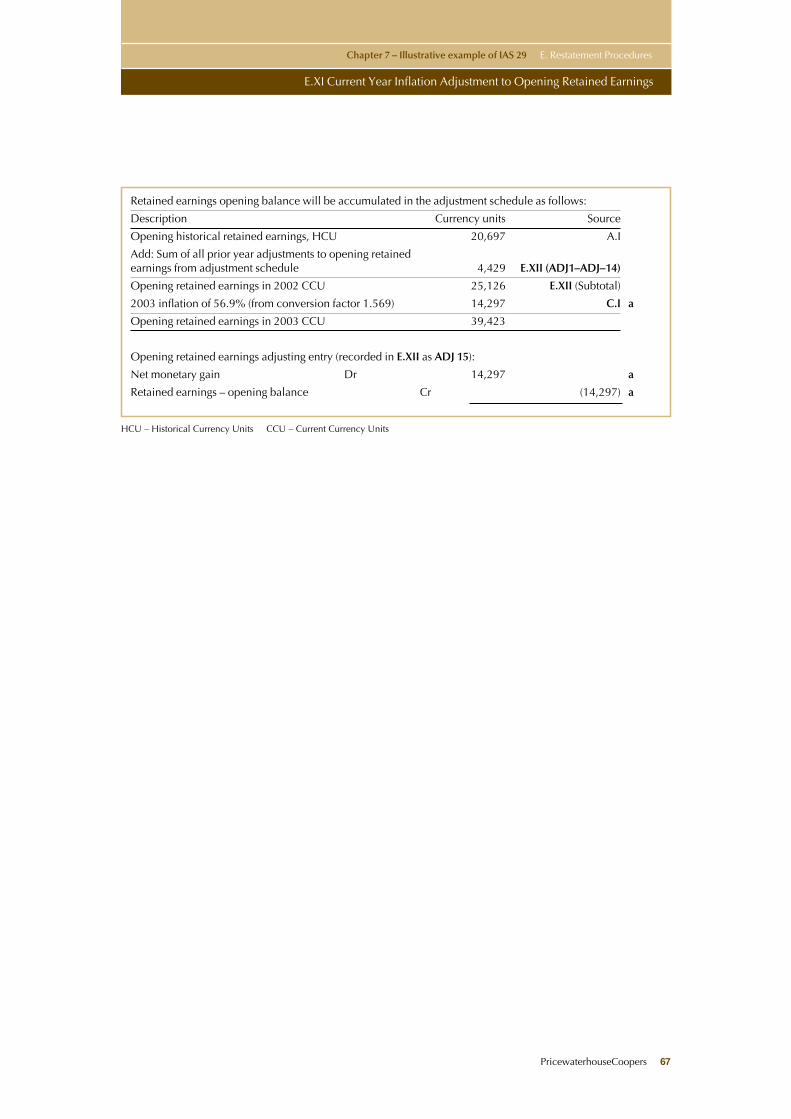
PricewaterhouseCoopers 67
HCU – Historical Currency Units CCU – Current Currency Units
Chapter 7 – Illustrative example of IAS 29 E. Restatement Procedures
E.XI Current Year Inflation Adjustment to Opening Retained Earnings
Retained earnings opening balance will be accumulated in the adjustment schedule as follows:
Description Currency units Source
Opening historical retained earnings, HCU 20,697 A.I
Add: Sum of all prior year adjustments to opening retainedearnings from adjustment schedule 4,429 E.XII (ADJ1–ADJ–14)
Opening retained earnings in 2002 CCU 25,126 E.XII (Subtotal)
2003 inflation of 56.9% (from conversion factor 1.569) 14,297 C.I a
Opening retained earnings in 2003 CCU 39,423
Opening retained earnings adjusting entry (recorded in E.XII as ADJ 15):
Net monetary gain Dr 14,297 a
Retained earnings – opening balance Cr (14,297) a
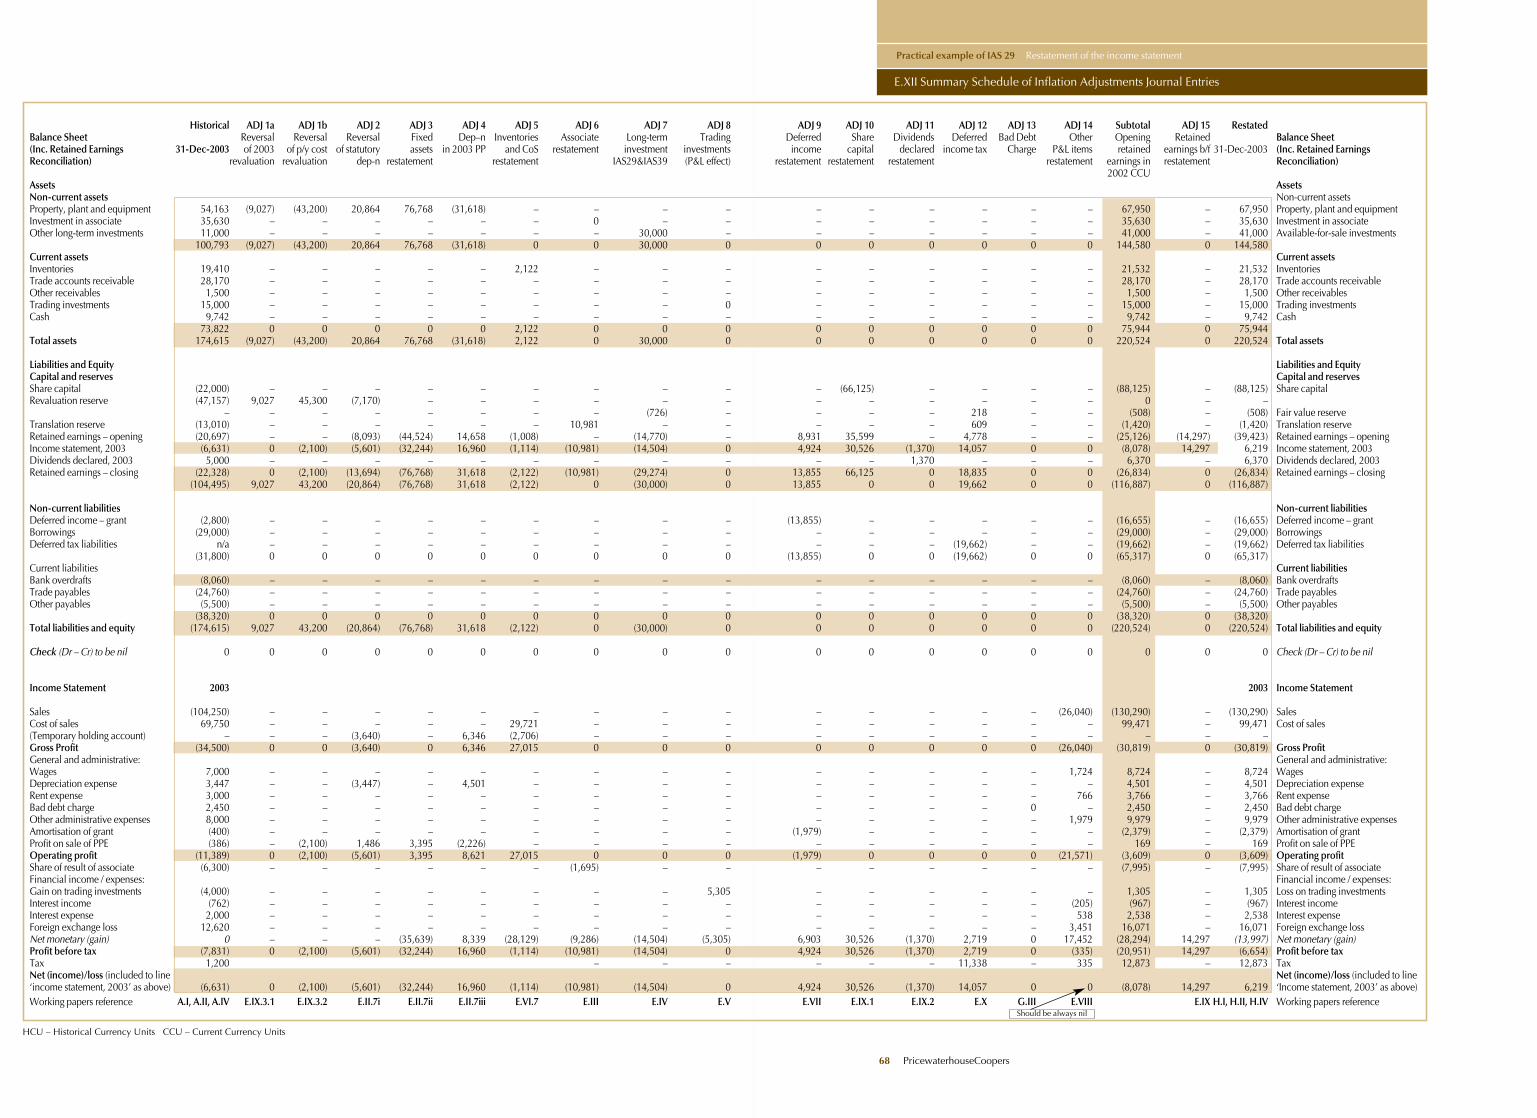
HCU – Historical Currency Units CCU – Current Currency Units
Practical example of IAS 29 Restatement of the income statement
E.XII Summary Schedule of Inflation Adjustments Journal Entries
68 PricewaterhouseCoopers
Historical ADJ 1a ADJ 1b ADJ 2 ADJ 3 ADJ 4 ADJ 5 ADJ 6 ADJ 7 ADJ 8 ADJ 9 ADJ 10 ADJ 11 ADJ 12 ADJ 13 ADJ 14 Subtotal ADJ 15 RestatedBalance Sheet Reversal Reversal Reversal Fixed Dep–n Inventories Associate Long-term Trading Deferred Share Dividends Deferred Bad Debt Other Opening Retained Balance Sheet(Inc. Retained Earnings 31-Dec-2003 of 2003 of p/y cost of statutory assets in 2003 PP and CoS restatement investment investments income capital declared income tax Charge P&L items retained earnings b/f 31-Dec-2003 (Inc. Retained Earnings Reconciliation) revaluation revaluation dep-n restatement restatement IAS29&IAS39 (P&L effect) restatement restatement restatement restatement earnings in restatement Reconciliation)
2002 CCUAssets AssetsNon-current assets Non-current assetsProperty, plant and equipment 54,163 (9,027) (43,200) 20,864 76,768 (31,618) – – – – – – – – – – 67,950 – 67,950 Property, plant and equipmentInvestment in associate 35,630 – – – – – – 0 – – – – – – – – 35,630 – 35,630 Investment in associateOther long-term investments 11,000 – – – – – – – 30,000 – – – – – – – 41,000 – 41,000 Available-for-sale investments
100,793 (9,027) (43,200) 20,864 76,768 (31,618) 0 0 30,000 0 0 0 0 0 0 0 144,580 0 144,580Current assets Current assetsInventories 19,410 – – – – – 2,122 – – – – – – – – – 21,532 – 21,532 InventoriesTrade accounts receivable 28,170 – – – – – – – – – – – – – – – 28,170 – 28,170 Trade accounts receivableOther receivables 1,500 – – – – – – – – – – – – – – – 1,500 – 1,500 Other receivablesTrading investments 15,000 – – – – – – – – 0 – – – – – – 15,000 – 15,000 Trading investmentsCash 9,742 – – – – – – – – – – – – – – – 9,742 – 9,742 Cash
73,822 0 0 0 0 0 2,122 0 0 0 0 0 0 0 0 0 75,944 0 75,944Total assets 174,615 (9,027) (43,200) 20,864 76,768 (31,618) 2,122 0 30,000 0 0 0 0 0 0 0 220,524 0 220,524 Total assets
Liabilities and Equity Liabilities and EquityCapital and reserves Capital and reservesShare capital (22,000) – – – – – – – – – – (66,125) – – – – (88,125) – (88,125) Share capitalRevaluation reserve (47,157) 9,027 45,300 (7,170) – – – – – – – – – – – – 0 – –
– – – – – – – – (726) – – – – 218 – – (508) – (508) Fair value reserveTranslation reserve (13,010) – – – – – – 10,981 – – – – – 609 – – (1,420) – (1,420) Translation reserveRetained earnings – opening (20,697) – – (8,093) (44,524) 14,658 (1,008) – (14,770) – 8,931 35,599 – 4,778 – – (25,126) (14,297) (39,423) Retained earnings – openingIncome statement, 2003 (6,631) 0 (2,100) (5,601) (32,244) 16,960 (1,114) (10,981) (14,504) 0 4,924 30,526 (1,370) 14,057 0 0 (8,078) 14,297 6,219 Income statement, 2003Dividends declared, 2003 5,000 – – – – – – – – – – – 1,370 – – – 6,370 – 6,370 Dividends declared, 2003Retained earnings – closing (22,328) 0 (2,100) (13,694) (76,768) 31,618 (2,122) (10,981) (29,274) 0 13,855 66,125 0 18,835 0 0 (26,834) 0 (26,834) Retained earnings – closing
(104,495) 9,027 43,200 (20,864) (76,768) 31,618 (2,122) 0 (30,000) 0 13,855 0 0 19,662 0 0 (116,887) 0 (116,887)
Non-current liabilities Non-current liabilitiesDeferred income – grant (2,800) – – – – – – – – – (13,855) – – – – – (16,655) – (16,655) Deferred income – grantBorrowings (29,000) – – – – – – – – – – – – – – – (29,000) – (29,000) BorrowingsDeferred tax liabilities n/a – – – – – – – – – – – – (19,662) – – (19,662) – (19,662) Deferred tax liabilities
(31,800) 0 0 0 0 0 0 0 0 0 (13,855) 0 0 (19,662) 0 0 (65,317) 0 (65,317)Current liabilities Current liabilitiesBank overdrafts (8,060) – – – – – – – – – – – – – – – (8,060) – (8,060) Bank overdraftsTrade payables (24,760) – – – – – – – – – – – – – – – (24,760) – (24,760) Trade payablesOther payables (5,500) – – – – – – – – – – – – – – – (5,500) – (5,500) Other payables
(38,320) 0 0 0 0 0 0 0 0 0 0 0 0 0 0 0 (38,320) 0 (38,320)Total liabilities and equity (174,615) 9,027 43,200 (20,864) (76,768) 31,618 (2,122) 0 (30,000) 0 0 0 0 0 0 0 (220,524) 0 (220,524) Total liabilities and equity
Check (Dr – Cr) to be nil 0 0 0 0 0 0 0 0 0 0 0 0 0 0 0 0 0 0 0 Check (Dr – Cr) to be nil
Income Statement 2003 2003 Income Statement
Sales (104,250) – – – – – – – – – – – – – – (26,040) (130,290) – (130,290) SalesCost of sales 69,750 – – – – – 29,721 – – – – – – – – – 99,471 – 99,471 Cost of sales(Temporary holding account) – – – (3,640) – 6,346 (2,706) – – – – – – – – – – – –Gross Profit (34,500) 0 0 (3,640) 0 6,346 27,015 0 0 0 0 0 0 0 0 (26,040) (30,819) 0 (30,819) Gross ProfitGeneral and administrative: General and administrative:Wages 7,000 – – – – – – – – – – – – – – 1,724 8,724 – 8,724 WagesDepreciation expense 3,447 – – (3,447) – 4,501 – – – – – – – – – – 4,501 – 4,501 Depreciation expenseRent expense 3,000 – – – – – – – – – – – – – – 766 3,766 – 3,766 Rent expenseBad debt charge 2,450 – – – – – – – – – – – – – 0 – 2,450 – 2,450 Bad debt chargeOther administrative expenses 8,000 – – – – – – – – – – – – – – 1,979 9,979 – 9,979 Other administrative expensesAmortisation of grant (400) – – – – – – – – – (1,979) – – – – – (2,379) – (2,379) Amortisation of grantProfit on sale of PPE (386) – (2,100) 1,486 3,395 (2,226) – – – – – – – – – – 169 – 169 Profit on sale of PPEOperating profit (11,389) 0 (2,100) (5,601) 3,395 8,621 27,015 0 0 0 (1,979) 0 0 0 0 (21,571) (3,609) 0 (3,609) Operating profitShare of result of associate (6,300) – – – – – – (1,695) – – – – – – – – (7,995) – (7,995) Share of result of associate Financial income / expenses: Financial income / expenses:Gain on trading investments (4,000) – – – – – – – – 5,305 – – – – – – 1,305 – 1,305 Loss on trading investmentsInterest income (762) – – – – – – – – – – – – – – (205) (967) – (967) Interest incomeInterest expense 2,000 – – – – – – – – – – – – – – 538 2,538 – 2,538 Interest expenseForeign exchange loss 12,620 – – – – – – – – – – – – – – 3,451 16,071 – 16,071 Foreign exchange lossNet monetary (gain) 0 – – – (35,639) 8,339 (28,129) (9,286) (14,504) (5,305) 6,903 30,526 (1,370) 2,719 0 17,452 (28,294) 14,297 (13,997) Net monetary (gain)Profit before tax (7,831) 0 (2,100) (5,601) (32,244) 16,960 (1,114) (10,981) (14,504) 0 4,924 30,526 (1,370) 2,719 0 (335) (20,951) 14,297 (6,654) Profit before taxTax 1,200 – – – – – – 11,338 – 335 12,873 – 12,873 TaxNet (income)/loss (included to line Net (income)/loss (included to line‘income statement, 2003’ as above) (6,631) 0 (2,100) (5,601) (32,244) 16,960 (1,114) (10,981) (14,504) 0 4,924 30,526 (1,370) 14,057 0 0 (8,078) 14,297 6,219 ‘Income statement, 2003’ as above)Working papers reference A.I, A.II, A.IV E.IX.3.1 E.IX.3.2 E.II.7i E.II.7ii E.II.7iii E.VI.7 E.III E.IV E.V E.VII E.IX.1 E.IX.2 E.X G.III E.VIII E.IX H.I, H.II, H.IV Working papers reference
Should be always nil
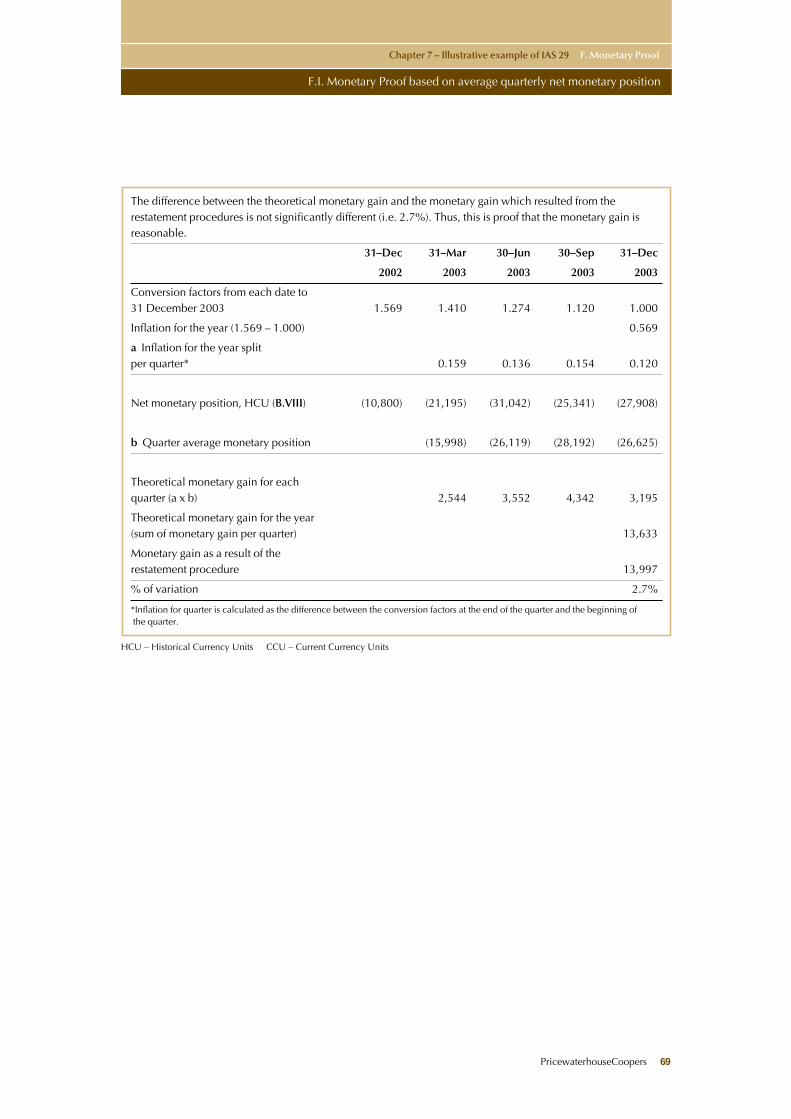
x
HCU – Historical Currency Units CCU – Current Currency Units
PricewaterhouseCoopers 69
Chapter 7 – Illustrative example of IAS 29 F. Monetary Proof
F.I. Monetary Proof based on average quarterly net monetary position
The difference between the theoretical monetary gain and the monetary gain which resulted from therestatement procedures is not significantly different (i.e. 2.7%). Thus, this is proof that the monetary gain isreasonable.
31–Dec 31–Mar 30–Jun 30–Sep 31–Dec
2002 2003 2003 2003 2003
Conversion factors from each date to 31 December 2003 1.569 1.410 1.274 1.120 1.000
Inflation for the year (1.569 – 1.000) 0.569
a Inflation for the year splitper quarter* 0.159 0.136 0.154 0.120
Net monetary position, HCU (B.VIII) (10,800) (21,195) (31,042) (25,341) (27,908)
b Quarter average monetary position (15,998) (26,119) (28,192) (26,625)
Theoretical monetary gain for each quarter (a x b) 2,544 3,552 4,342 3,195
Theoretical monetary gain for the year (sum of monetary gain per quarter) 13,633
Monetary gain as a result of the restatement procedure 13,997
% of variation 2.7%
*Inflation for quarter is calculated as the difference between the conversion factors at the end of the quarter and the beginning ofthe quarter.
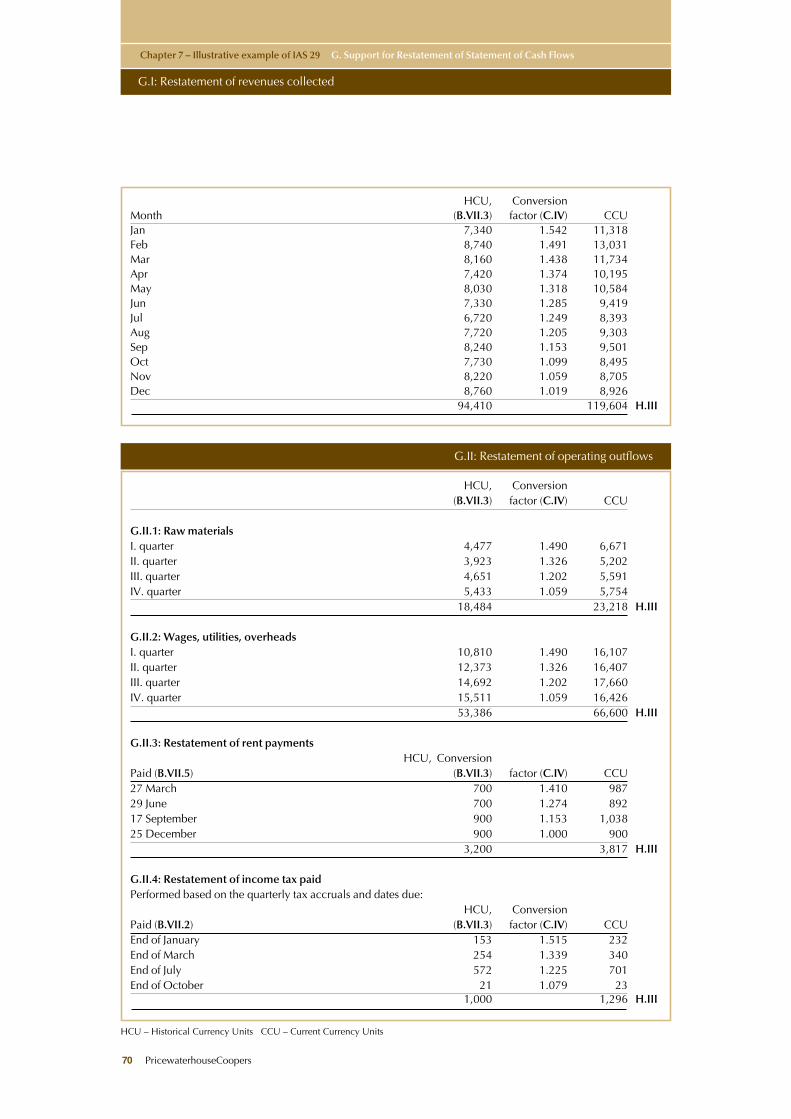
HCU – Historical Currency Units CCU – Current Currency Units
Chapter 7 – Illustrative example of IAS 29 G. Support for Restatement of Statement of Cash Flows
G.I: Restatement of revenues collected
G.II: Restatement of operating outflows
70 PricewaterhouseCoopers
HCU, ConversionMonth (B.VII.3) factor (C.IV) CCUJan 7,340 1.542 11,318Feb 8,740 1.491 13,031Mar 8,160 1.438 11,734Apr 7,420 1.374 10,195May 8,030 1.318 10,584Jun 7,330 1.285 9,419Jul 6,720 1.249 8,393Aug 7,720 1.205 9,303Sep 8,240 1.153 9,501Oct 7,730 1.099 8,495Nov 8,220 1.059 8,705Dec 8,760 1.019 8,926
94,410 119,604 H.III
HCU, Conversion(B.VII.3) factor (C.IV) CCU
G.II.1: Raw materialsI. quarter 4,477 1.490 6,671II. quarter 3,923 1.326 5,202III. quarter 4,651 1.202 5,591IV. quarter 5,433 1.059 5,754
18,484 23,218 H.III
G.II.2: Wages, utilities, overheadsI. quarter 10,810 1.490 16,107II. quarter 12,373 1.326 16,407III. quarter 14,692 1.202 17,660IV. quarter 15,511 1.059 16,426
53,386 66,600 H.III
G.II.3: Restatement of rent paymentsHCU, Conversion
Paid (B.VII.5) (B.VII.3) factor (C.IV) CCU27 March 700 1.410 98729 June 700 1.274 89217 September 900 1.153 1,03825 December 900 1.000 900
3,200 3,817 H.III
G.II.4: Restatement of income tax paidPerformed based on the quarterly tax accruals and dates due:
HCU, ConversionPaid (B.VII.2) (B.VII.3) factor (C.IV) CCUEnd of January 153 1.515 232End of March 254 1.339 340End of July 572 1.225 701End of October 21 1.079 23
1,000 1,296 H.III
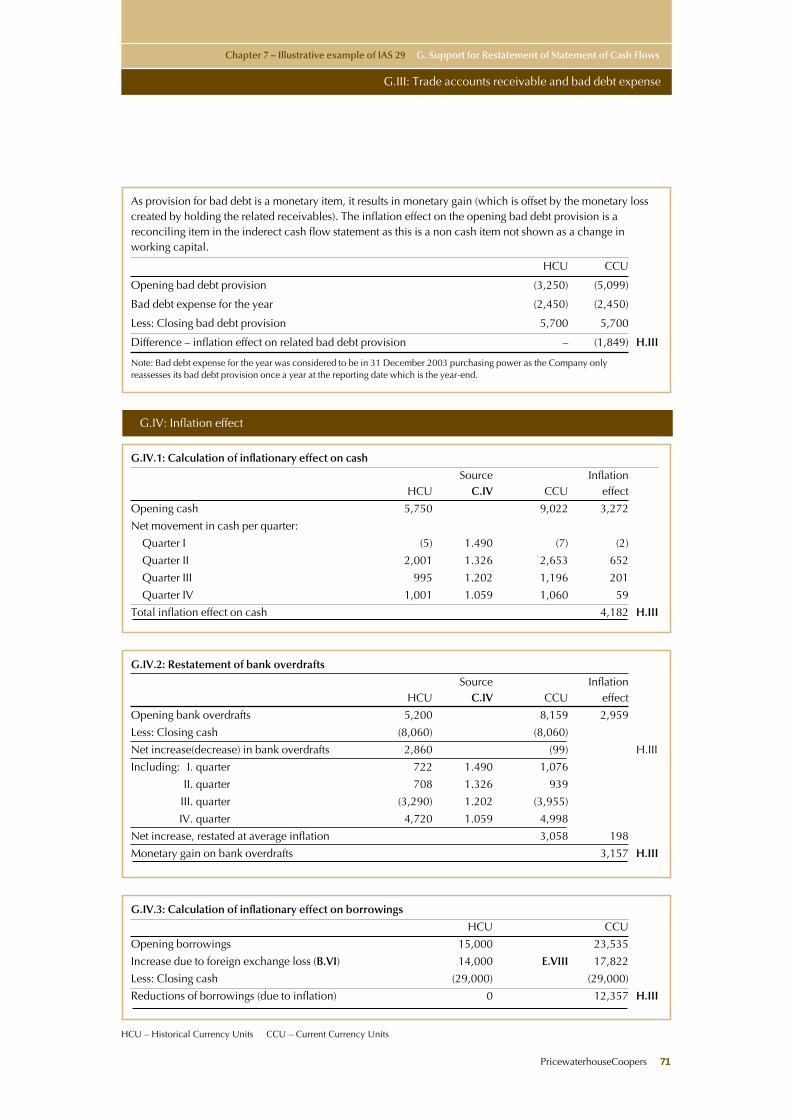
PricewaterhouseCoopers 71
HCU – Historical Currency Units CCU – Current Currency Units
Chapter 7 – Illustrative example of IAS 29 G. Support for Restatement of Statement of Cash Flows
G.III: Trade accounts receivable and bad debt expense
G.IV: Inflation effect
As provision for bad debt is a monetary item, it results in monetary gain (which is offset by the monetary losscreated by holding the related receivables). The inflation effect on the opening bad debt provision is areconciling item in the inderect cash flow statement as this is a non cash item not shown as a change inworking capital.
HCU CCU
Opening bad debt provision (3,250) (5,099)
Bad debt expense for the year (2,450) (2,450)
Less: Closing bad debt provision 5,700 5,700
Difference – inflation effect on related bad debt provision – (1,849) H.III
Note: Bad debt expense for the year was considered to be in 31 December 2003 purchasing power as the Company only reassesses its bad debt provision once a year at the reporting date which is the year-end.
G.IV.1: Calculation of inflationary effect on cash
Source InflationHCU C.IV CCU effect
Opening cash 5,750 9,022 3,272
Net movement in cash per quarter:
Quarter I (5) 1.490 (7) (2)
Quarter II 2,001 1.326 2,653 652
Quarter III 995 1.202 1,196 201
Quarter IV 1,001 1.059 1,060 59
Total inflation effect on cash 4,182 H.III
G.IV.2: Restatement of bank overdrafts
Source InflationHCU C.IV CCU effect
Opening bank overdrafts 5,200 8,159 2,959
Less: Closing cash (8,060) (8,060)
Net increase(decrease) in bank overdrafts 2,860 (99) H.III
Including: I. quarter 722 1.490 1,076
II. quarter 708 1.326 939
III. quarter (3,290) 1.202 (3,955)
IV. quarter 4,720 1.059 4,998
Net increase, restated at average inflation 3,058 198
Monetary gain on bank overdrafts 3,157 H.III
G.IV.3: Calculation of inflationary effect on borrowings
HCU CCU
Opening borrowings 15,000 23,535
Increase due to foreign exchange loss (B.VI) 14,000 E.VIII 17,822
Less: Closing cash (29,000) (29,000)
Reductions of borrowings (due to inflation) 0 12,357 H.III
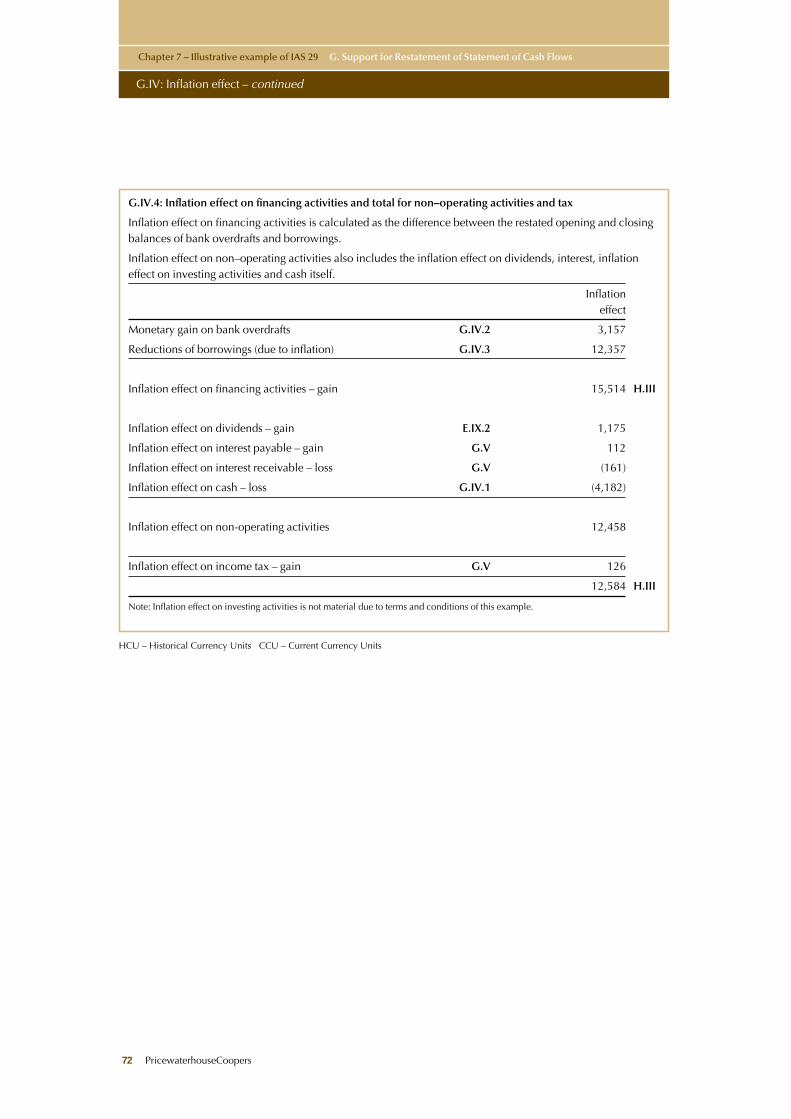
HCU – Historical Currency Units CCU – Current Currency Units
Chapter 7 – Illustrative example of IAS 29 G. Support for Restatement of Statement of Cash Flows
G.IV: Inflation effect – continued
72 PricewaterhouseCoopers
G.IV.4: Inflation effect on financing activities and total for non–operating activities and tax
Inflation effect on financing activities is calculated as the difference between the restated opening and closingbalances of bank overdrafts and borrowings.
Inflation effect on non–operating activities also includes the inflation effect on dividends, interest, inflationeffect on investing activities and cash itself.
Inflationeffect
Monetary gain on bank overdrafts G.IV.2 3,157
Reductions of borrowings (due to inflation) G.IV.3 12,357
Inflation effect on financing activities – gain 15,514 H.III
Inflation effect on dividends – gain E.IX.2 1,175
Inflation effect on interest payable – gain G.V 112
Inflation effect on interest receivable – loss G.V (161)
Inflation effect on cash – loss G.IV.1 (4,182)
Inflation effect on non-operating activities 12,458
Inflation effect on income tax – gain G.V 126
12,584 H.III
Note: Inflation effect on investing activities is not material due to terms and conditions of this example.
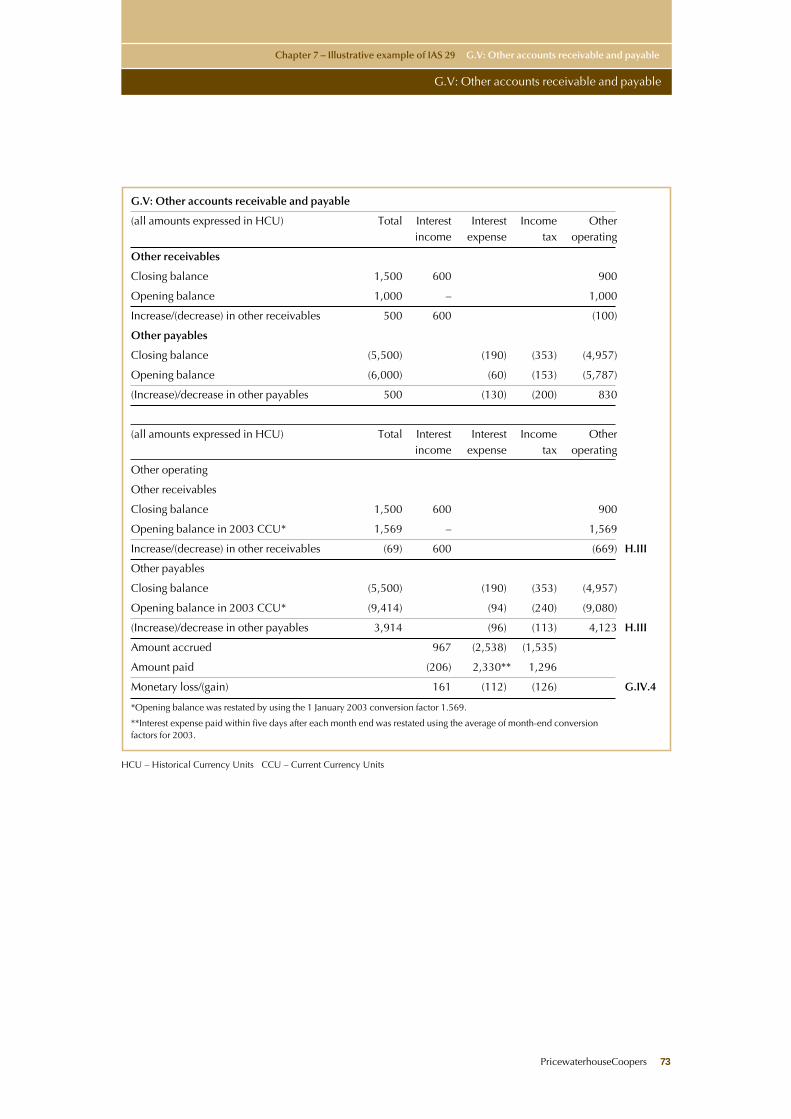
PricewaterhouseCoopers 73
HCU – Historical Currency Units CCU – Current Currency Units
Chapter 7 – Illustrative example of IAS 29 G.V: Other accounts receivable and payable
G.V: Other accounts receivable and payable
G.V: Other accounts receivable and payable
(all amounts expressed in HCU) Total Interest Interest Income Other income expense tax operating
Other receivables
Closing balance 1,500 600 900
Opening balance 1,000 – 1,000
Increase/(decrease) in other receivables 500 600 (100)
Other payables
Closing balance (5,500) (190) (353) (4,957)
Opening balance (6,000) (60) (153) (5,787)
(Increase)/decrease in other payables 500 (130) (200) 830
(all amounts expressed in HCU) Total Interest Interest Income Otherincome expense tax operating
Other operating
Other receivables
Closing balance 1,500 600 900
Opening balance in 2003 CCU* 1,569 – 1,569
Increase/(decrease) in other receivables (69) 600 (669) H.III
Other payables
Closing balance (5,500) (190) (353) (4,957)
Opening balance in 2003 CCU* (9,414) (94) (240) (9,080)
(Increase)/decrease in other payables 3,914 (96) (113) 4,123 H.III
Amount accrued 967 (2,538) (1,535)
Amount paid (206) 2,330** 1,296
Monetary loss/(gain) 161 (112) (126) G.IV.4
*Opening balance was restated by using the 1 January 2003 conversion factor 1.569.
**Interest expense paid within five days after each month end was restated using the average of month-end conversion factors for 2003.
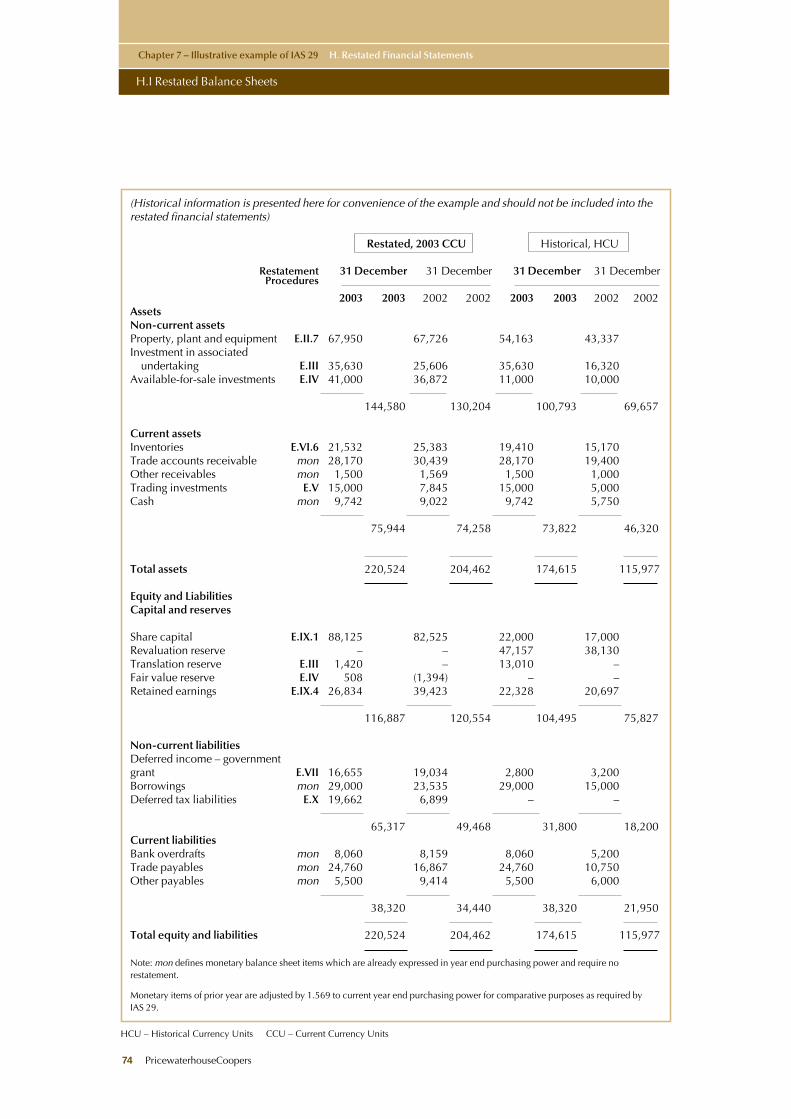
HCU – Historical Currency Units CCU – Current Currency Units
Chapter 7 – Illustrative example of IAS 29 H. Restated Financial Statements
H.I Restated Balance Sheets
74 PricewaterhouseCoopers
(Historical information is presented here for convenience of the example and should not be included into therestated financial statements)
Restated, 2003 CCU Historical, HCU
Restatement 31 December 31 December 31 December 31 DecemberProcedures
2003 2003 2002 2002 2003 2003 2002 2002 AssetsNon-current assetsProperty, plant and equipment E.II.7 67,950 67,726 54,163 43,337Investment in associated
undertaking E.III 35,630 25,606 35,630 16,320Available-for-sale investments E.IV 41,000 36,872 11,000 10,000
144,580 130,204 100,793 69,657
Current assetsInventories E.VI.6 21,532 25,383 19,410 15,170Trade accounts receivable mon 28,170 30,439 28,170 19,400Other receivables mon 1,500 1,569 1,500 1,000Trading investments E.V 15,000 7,845 15,000 5,000Cash mon 9,742 9,022 9,742 5,750
75,944 74,258 73,822 46,320
Total assets 220,524 204,462 174,615 115,977
Equity and LiabilitiesCapital and reserves
Share capital E.IX.1 88,125 82,525 22,000 17,000Revaluation reserve – – 47,157 38,130Translation reserve E.III 1,420 – 13,010 –Fair value reserve E.IV 508 (1,394) – –Retained earnings E.IX.4 26,834 39,423 22,328 20,697
116,887 120,554 104,495 75,827
Non-current liabilitiesDeferred income – government grant E.VII 16,655 19,034 2,800 3,200Borrowings mon 29,000 23,535 29,000 15,000Deferred tax liabilities E.X 19,662 6,899 – –
65,317 49,468 31,800 18,200 Current liabilitiesBank overdrafts mon 8,060 8,159 8,060 5,200Trade payables mon 24,760 16,867 24,760 10,750Other payables mon 5,500 9,414 5,500 6,000
38,320 34,440 38,320 21,950
Total equity and liabilities 220,524 204,462 174,615 115,977
Note: mon defines monetary balance sheet items which are already expressed in year end purchasing power and require norestatement.
Monetary items of prior year are adjusted by 1.569 to current year end purchasing power for comparative purposes as required byIAS 29.
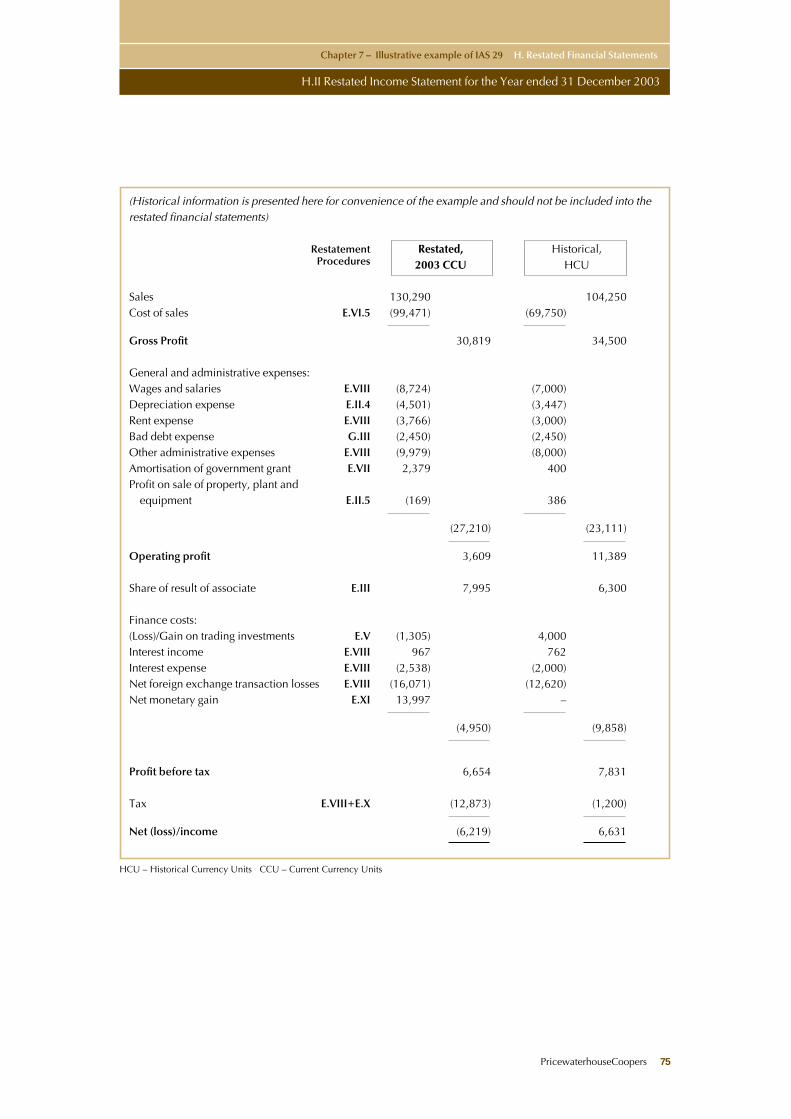
PricewaterhouseCoopers 75
HCU – Historical Currency Units CCU – Current Currency Units
Chapter 7 – Illustrative example of IAS 29 H. Restated Financial Statements
H.II Restated Income Statement for the Year ended 31 December 2003
(Historical information is presented here for convenience of the example and should not be included into therestated financial statements)
Restatement Restated, Historical,Procedures 2003 CCU HCU
Sales 130,290 104,250Cost of sales E.VI.5 (99,471) (69,750)
Gross Profit 30,819 34,500
General and administrative expenses:Wages and salaries E.VIII (8,724) (7,000)Depreciation expense E.II.4 (4,501) (3,447)Rent expense E.VIII (3,766) (3,000)Bad debt expense G.III (2,450) (2,450)Other administrative expenses E.VIII (9,979) (8,000)Amortisation of government grant E.VII 2,379 400Profit on sale of property, plant and
equipment E.II.5 (169) 386
(27,210) (23,111)
Operating profit 3,609 11,389
Share of result of associate E.III 7,995 6,300
Finance costs:(Loss)/Gain on trading investments E.V (1,305) 4,000Interest income E.VIII 967 762Interest expense E.VIII (2,538) (2,000)Net foreign exchange transaction losses E.VIII (16,071) (12,620)Net monetary gain E.XI 13,997 –
(4,950) (9,858)
Profit before tax 6,654 7,831
Tax E.VIII+E.X (12,873) (1,200)
Net (loss)/income (6,219) 6,631
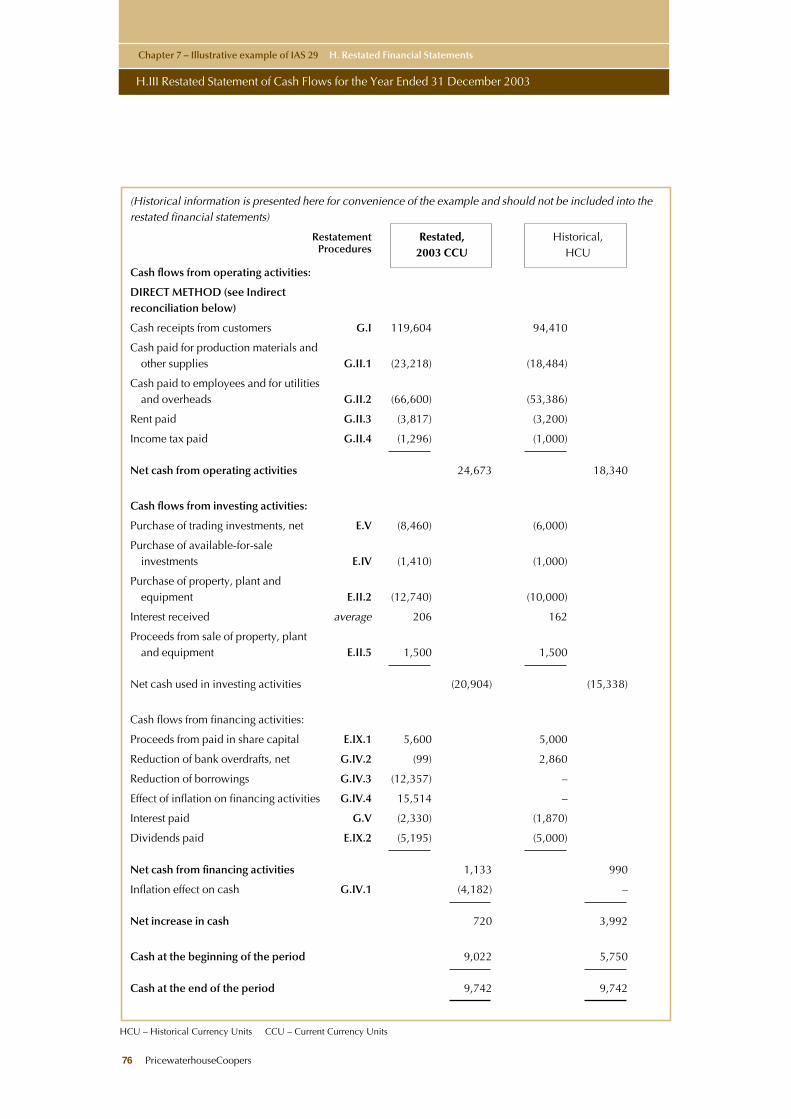
HCU – Historical Currency Units CCU – Current Currency Units
Chapter 7 – Illustrative example of IAS 29 H. Restated Financial Statements
H.III Restated Statement of Cash Flows for the Year Ended 31 December 2003
(Historical information is presented here for convenience of the example and should not be included into therestated financial statements)
Restatement Restated, Historical,Procedures 2003 CCU HCU
Cash flows from operating activities:
DIRECT METHOD (see Indirect reconciliation below)
Cash receipts from customers G.I 119,604 94,410
Cash paid for production materials and other supplies G.II.1 (23,218) (18,484)
Cash paid to employees and for utilitiesand overheads G.II.2 (66,600) (53,386)
Rent paid G.II.3 (3,817) (3,200)
Income tax paid G.II.4 (1,296) (1,000)
Net cash from operating activities 24,673 18,340
Cash flows from investing activities:
Purchase of trading investments, net E.V (8,460) (6,000)
Purchase of available-for-sale investments E.IV (1,410) (1,000)
Purchase of property, plant and equipment E.II.2 (12,740) (10,000)
Interest received average 206 162
Proceeds from sale of property, plant and equipment E.II.5 1,500 1,500
Net cash used in investing activities (20,904) (15,338)
Cash flows from financing activities:
Proceeds from paid in share capital E.IX.1 5,600 5,000
Reduction of bank overdrafts, net G.IV.2 (99) 2,860
Reduction of borrowings G.IV.3 (12,357) –
Effect of inflation on financing activities G.IV.4 15,514 –
Interest paid G.V (2,330) (1,870)
Dividends paid E.IX.2 (5,195) (5,000)
Net cash from financing activities 1,133 990
Inflation effect on cash G.IV.1 (4,182) –
Net increase in cash 720 3,992
Cash at the beginning of the period 9,022 5,750
Cash at the end of the period 9,742 9,742
76 PricewaterhouseCoopers
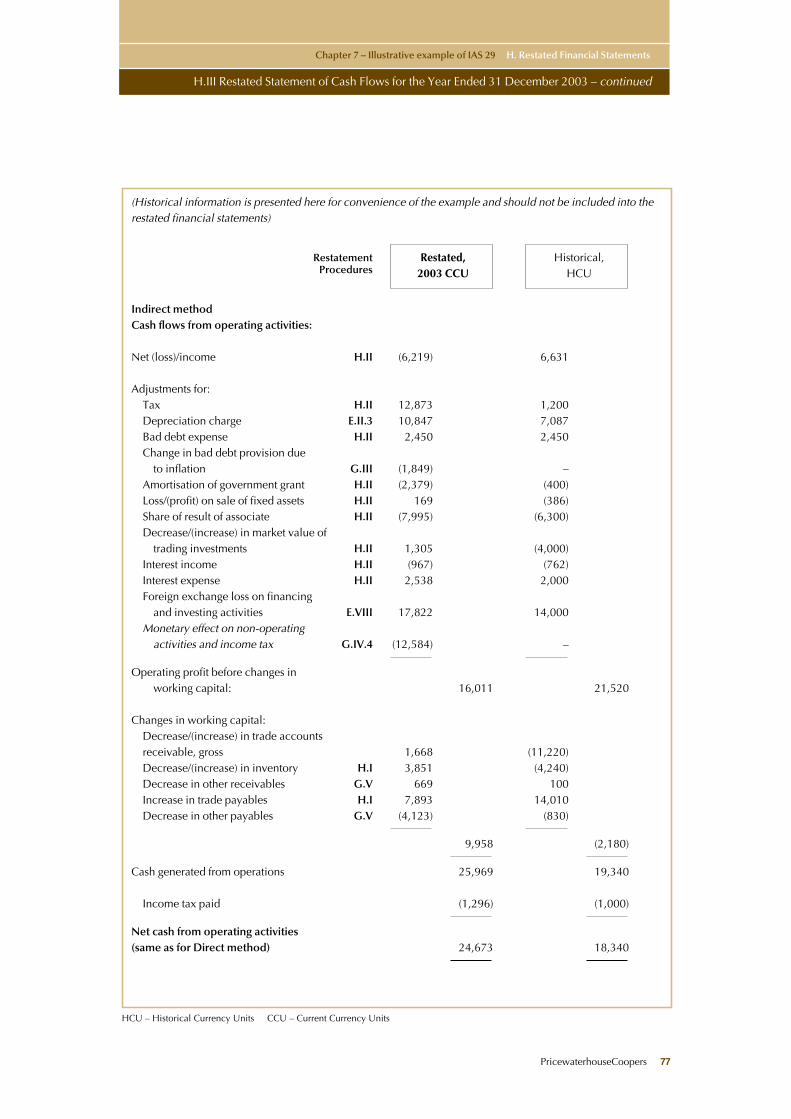
PricewaterhouseCoopers 77
HCU – Historical Currency Units CCU – Current Currency Units
Chapter 7 – Illustrative example of IAS 29 H. Restated Financial Statements
H.III Restated Statement of Cash Flows for the Year Ended 31 December 2003 – continued
(Historical information is presented here for convenience of the example and should not be included into therestated financial statements)
Restatement Restated, Historical,Procedures 2003 CCU HCU
Indirect methodCash flows from operating activities:
Net (loss)/income H.II (6,219) 6,631
Adjustments for:Tax H.II 12,873 1,200Depreciation charge E.II.3 10,847 7,087Bad debt expense H.II 2,450 2,450Change in bad debt provision due
to inflation G.III (1,849) –Amortisation of government grant H.II (2,379) (400)Loss/(profit) on sale of fixed assets H.II 169 (386)Share of result of associate H.II (7,995) (6,300)Decrease/(increase) in market value of
trading investments H.II 1,305 (4,000)Interest income H.II (967) (762)Interest expense H.II 2,538 2,000Foreign exchange loss on financing
and investing activities E.VIII 17,822 14,000Monetary effect on non-operating
activities and income tax G.IV.4 (12,584) –
Operating profit before changes in working capital: 16,011 21,520
Changes in working capital:Decrease/(increase) in trade accounts receivable, gross 1,668 (11,220)Decrease/(increase) in inventory H.I 3,851 (4,240)Decrease in other receivables G.V 669 100Increase in trade payables H.I 7,893 14,010Decrease in other payables G.V (4,123) (830)
9,958 (2,180)
Cash generated from operations 25,969 19,340
Income tax paid (1,296) (1,000)
Net cash from operating activities (same as for Direct method) 24,673 18,340
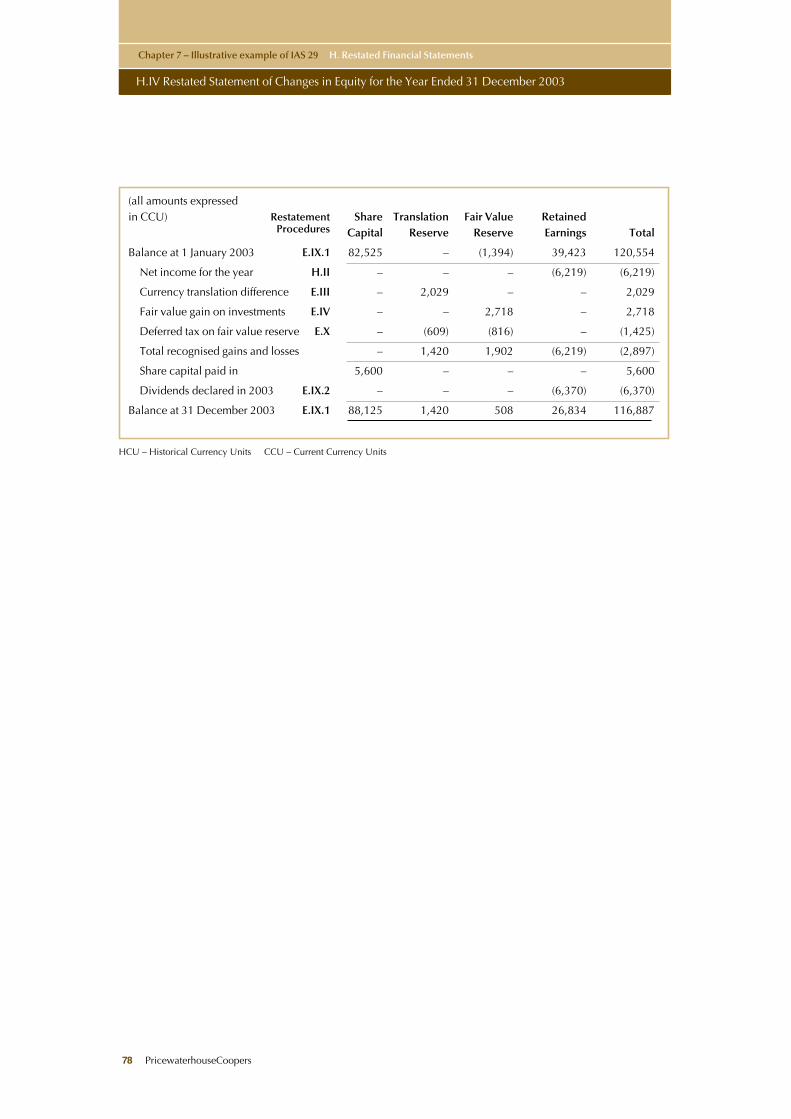
x
78 PricewaterhouseCoopers
HCU – Historical Currency Units CCU – Current Currency Units
Chapter 7 – Illustrative example of IAS 29 H. Restated Financial Statements
H.IV Restated Statement of Changes in Equity for the Year Ended 31 December 2003
(all amounts expressed in CCU) Restatement Share Translation Fair Value Retained
Procedures Capital Reserve Reserve Earnings Total
Balance at 1 January 2003 E.IX.1 82,525 – (1,394) 39,423 120,554
Net income for the year H.II – – – (6,219) (6,219)
Currency translation difference E.III – 2,029 – – 2,029
Fair value gain on investments E.IV – – 2,718 – 2,718
Deferred tax on fair value reserve E.X – (609) (816) – (1,425)
Total recognised gains and losses – 1,420 1,902 (6,219) (2,897)
Share capital paid in 5,600 – – – 5,600
Dividends declared in 2003 E.IX.2 – – – (6,370) (6,370)
Balance at 31 December 2003 E.IX.1 88,125 1,420 508 26,834 116,887

PricewaterhouseCoopers 79

80 PricewaterhouseCoopers


Copyright © 2000 PricewaterhouseCoopers. All rights reserved. PricewaterhouseCoopers is authorised by the Institute of CharteredAccountants in England and Wales to carry on investment business. Designed by the studio 11114.